Headlines
|
|
The S&P 500's volatility has plunged as the index holds modest gains:
The S&P 500 has rallied less than 5% over the past 90 days, but its 20-day historical volatility has plunged more than 50% and is at a 52-week low. That smacks of irrational exuberance, but similar behavior since 1928 has preceded mostly higher stock markets from two to twelve months later.
|
Smart / Dumb Money Confidence
|
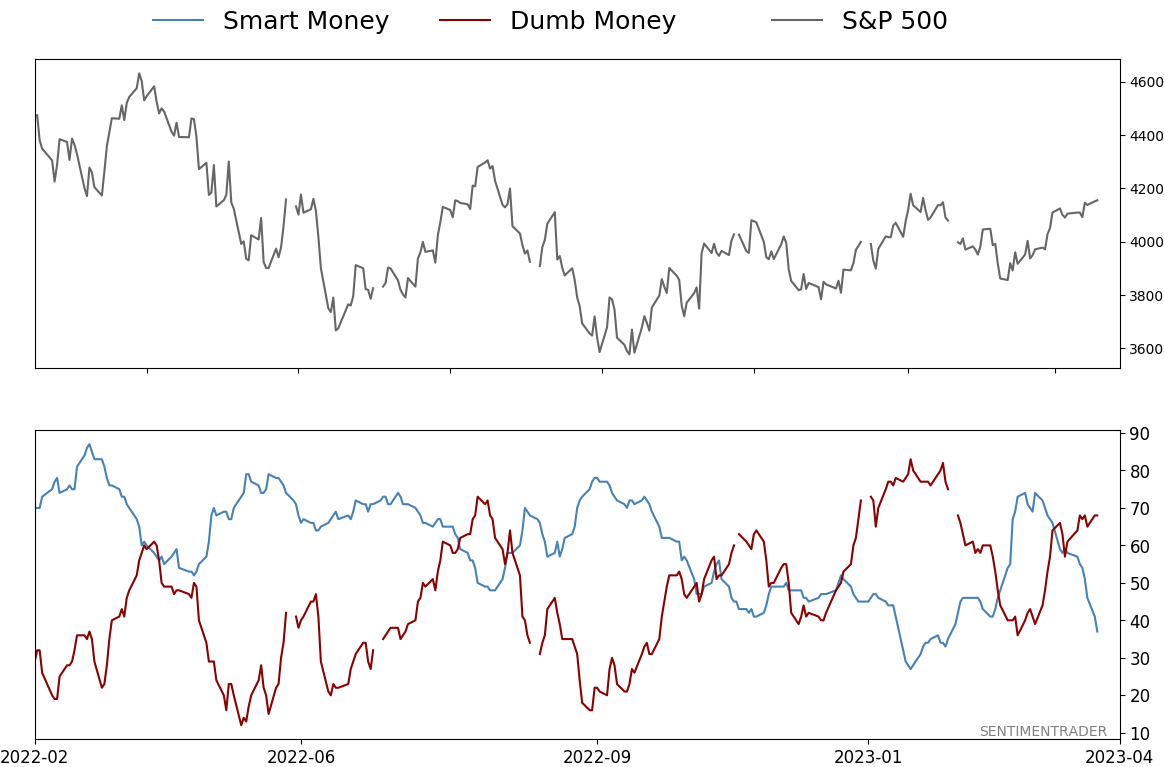
Smart Money Confidence: 37%
Dumb Money Confidence: 68%
|
|
Risk Levels
Stocks Short-Term
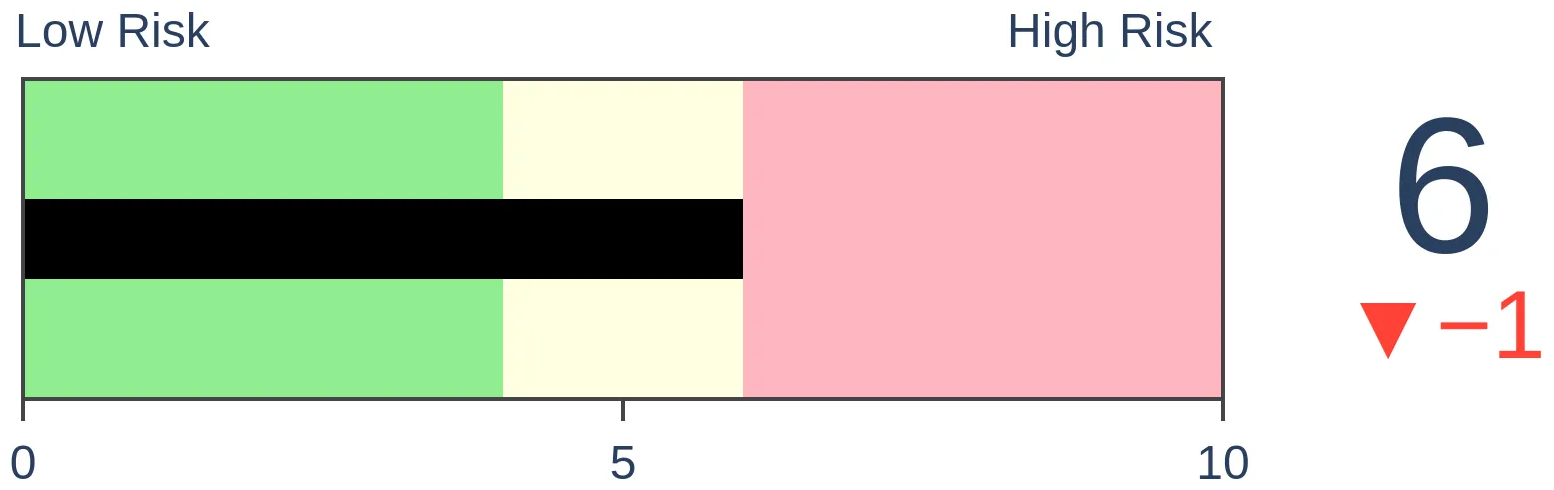
|
Stocks Medium-Term
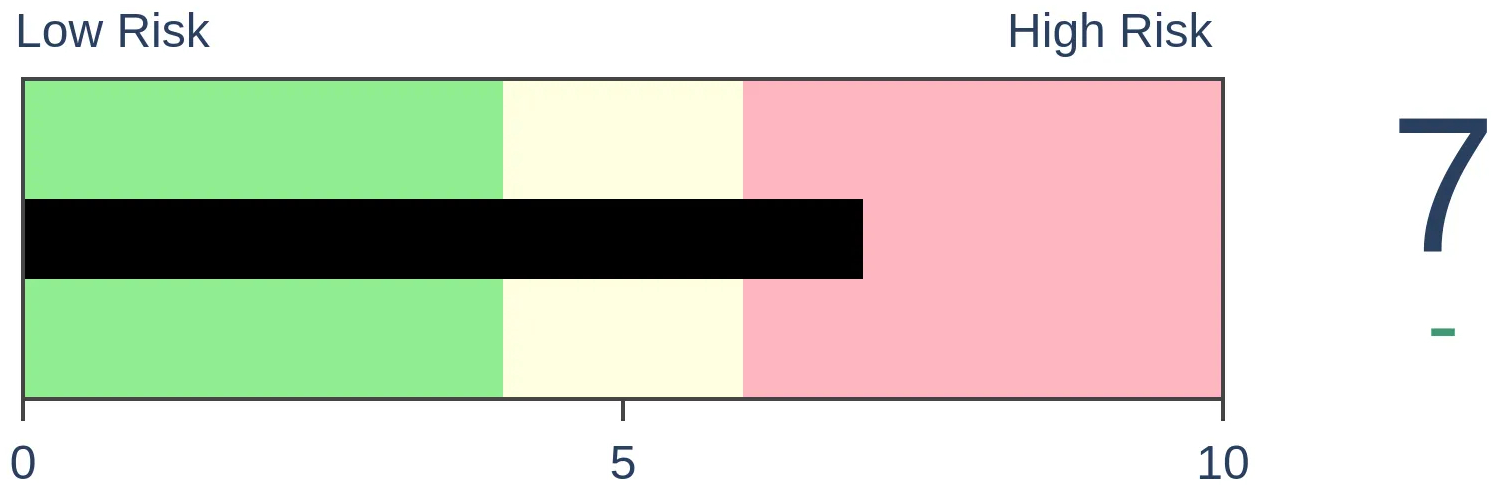
|
|
Bonds
|
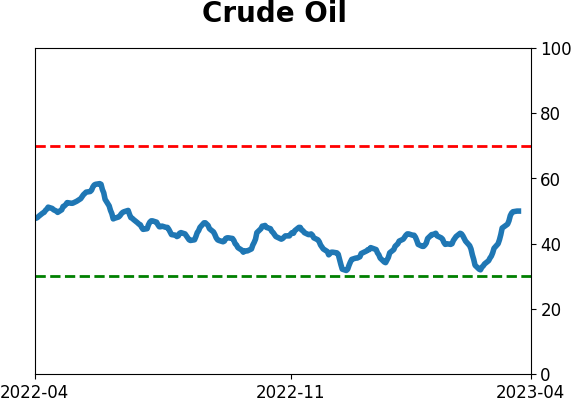
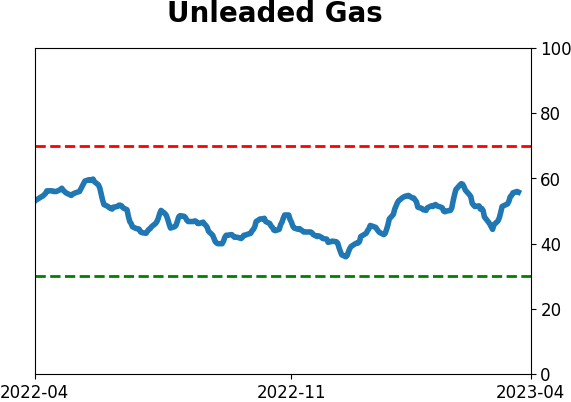
Crude Oil

|
|
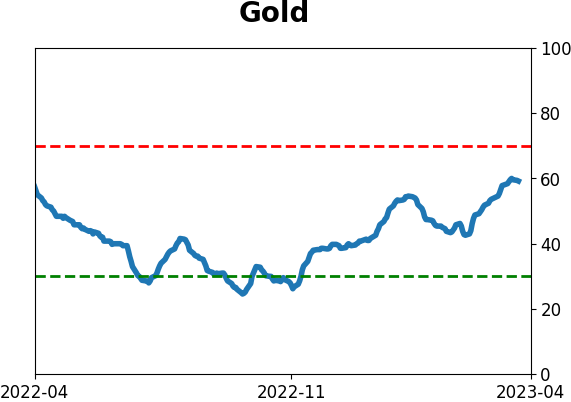
Gold
|
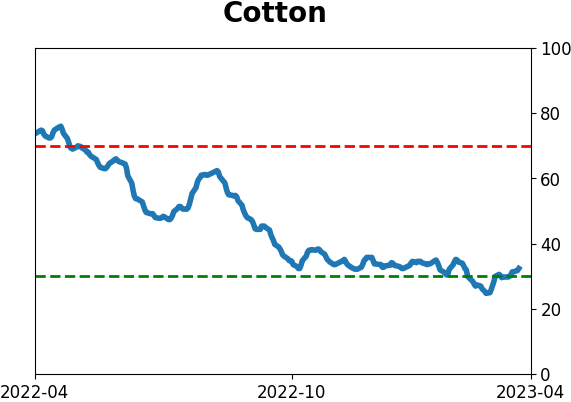
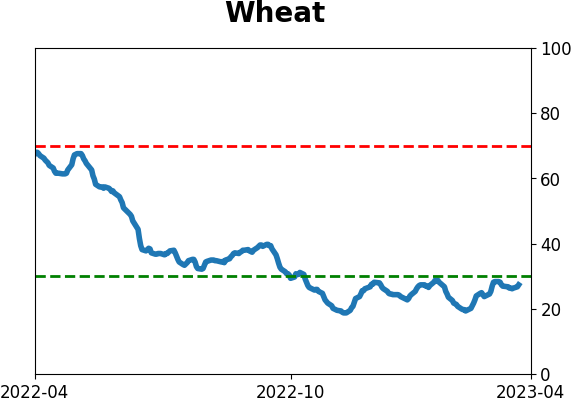
Agriculture

|
|
Research
By Jason Goepfert
BOTTOM LINE
The S&P 500 has rallied less than 5% over the past 90 days, but its 20-day historical volatility has plunged more than 50% and is at a 52-week low. That smacks of irrational exuberance, but similar behavior since 1928 has preceded mostly higher stock markets from two to twelve months later.
FORECAST / TIMEFRAME
None
|
Key points:
- Over the past 90 days, the S&P 500 has rallied modestly while volatility has plunged
- The S&P's 20-day historical volatility has dropped by more than half and to a 52-week low
- Similar behavior preceded mostly higher stocks from two months and beyond
With a calming market, volatility plunges
Stocks have been holding steady, with the S&P 500 in a modest uptrending range since December. What's remarkable is the drastic decline in volatility, which has dropped by more than half.
Over the past 90 sessions, the S&P's historical 20-day volatility, as calculated by Bloomberg, declined from nearly 28% to a little over 12%, a decline of 55%, and it set a new 52-week low. During that same period, the S&P 500 rose only 3.6%. Since 1928, under similar declines in volatility, the S&P has rallied an average of +6.8%.

A drop in volatility, either historical or implied, usually triggers an anxiety alert for contrarian investors: irrational exuberance and all that. And when a plunge in volatility comes during a mostly range-bound market, the anxiety ratchets up even more.
Drastic drops in volatility are mostly a positive long-term sign
To see if contrarian concerns may be justified, the table below shows whenever the S&P rallied less than 5% over the past 90 days. However, its historical volatility declined by over half, setting a 52-week low.
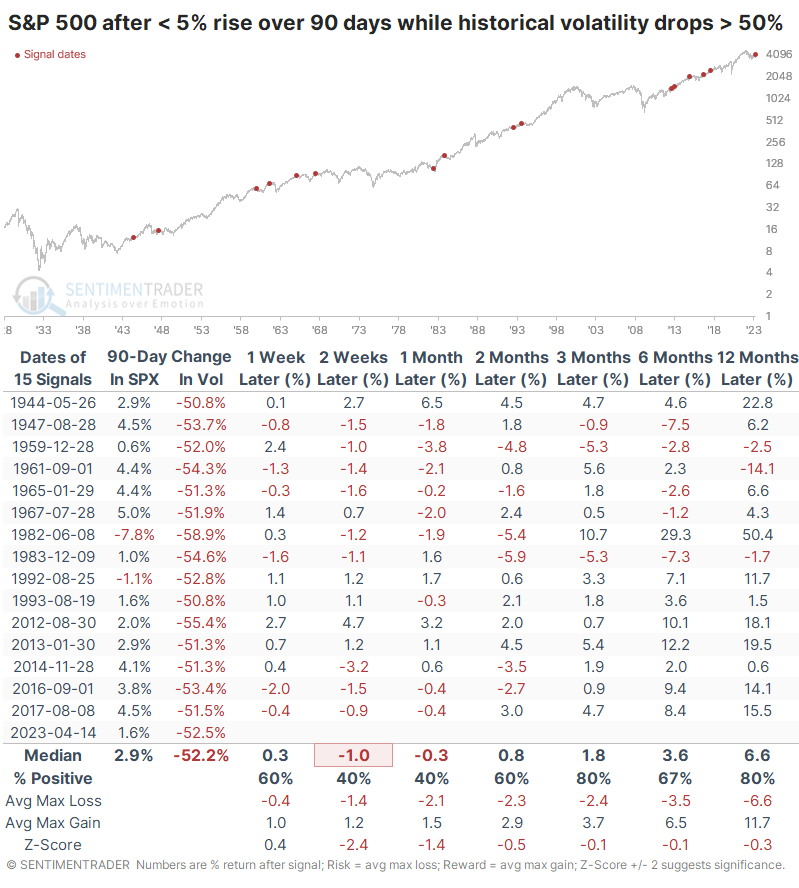
Short-term forward returns weren't so hot, and the S&P underperformed a random return over almost all time frames. Even so, significant losses were minimal or nonexistent, and over the next three and twelve months, there were only 3 losses out of 15 signals.
Most signals were triggered when the S&P traded at or near a 52-week high. The current signal is one of only three (August 1947 and June 1982) when it was more than 5% from its high, lessening the probability that this is a sign of irrational exuberance and raising the chances that it's simply some relief from what had been a brutal bear market in many financial assets.
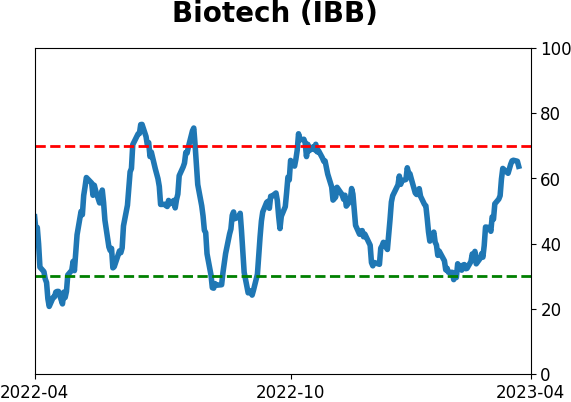
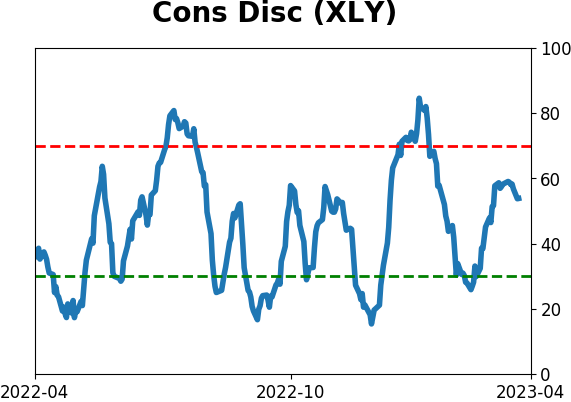
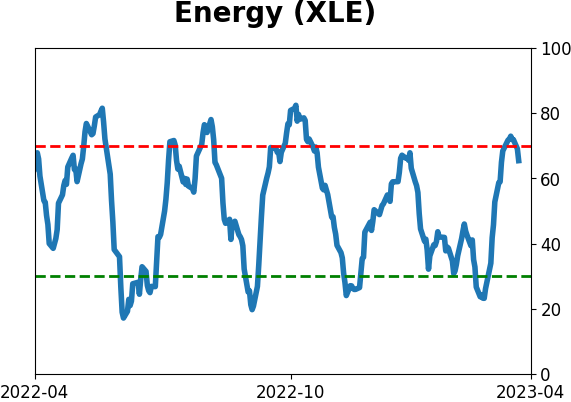
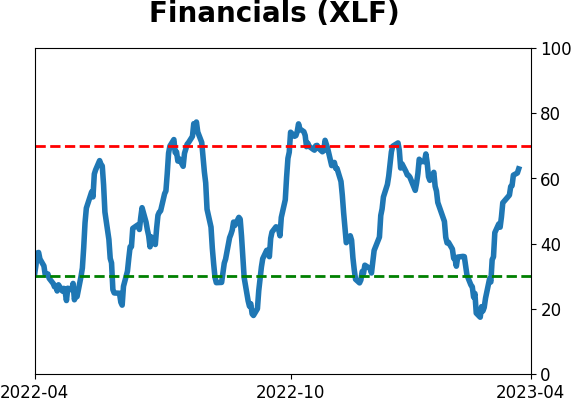
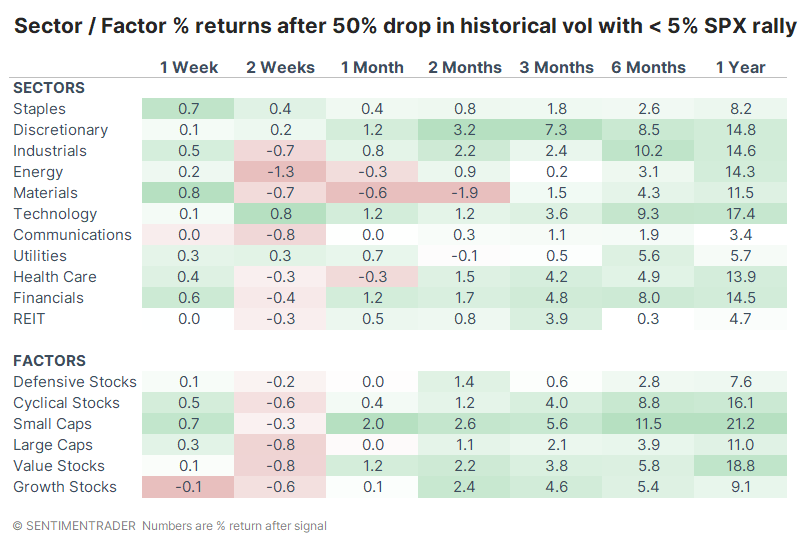
Among sectors and factors, Technology, Discretionary, and Financial stocks enjoyed some of the largest returns following these signals. That's consistent with a renewed sense of risk-taking during lower-volatility environments.
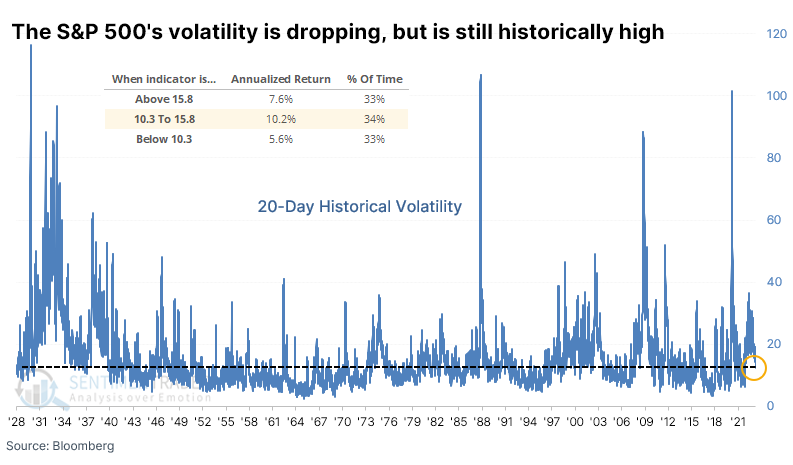
While the drop in historical volatility looks dramatic on the one-year chart shown above, the current level is still above the long-term average. The S&P's 20-day historical volatility has spent about a third of its time between 10.3 and 15.8, and these middle levels are where it showed the best returns, +10.2% annualized.
When volatility goes below the lower threshold, returns suffer because it often coincides with actual complacency and buoyant markets. When it gets above the upper threshold, returns get highly variable because higher volatility almost always means declining stocks until the point when volatility explodes and markets bottom.
What the research tells us...
Over the past month, stock indexes have swung less than any other point over the past year. That's a welcome relief to most investors, but contrarian traders get anxious that it suggests complacency. But the swings are still more significant than the long-term average, and sudden and dramatic drops in volatility have not been a consistent warning sign other than maybe in the short-term. Longer-term, a drop in volatility, even when stock market gains might not justify them, are mostly a positive sign.
Indicators at Extremes
Phase Table
Ranks
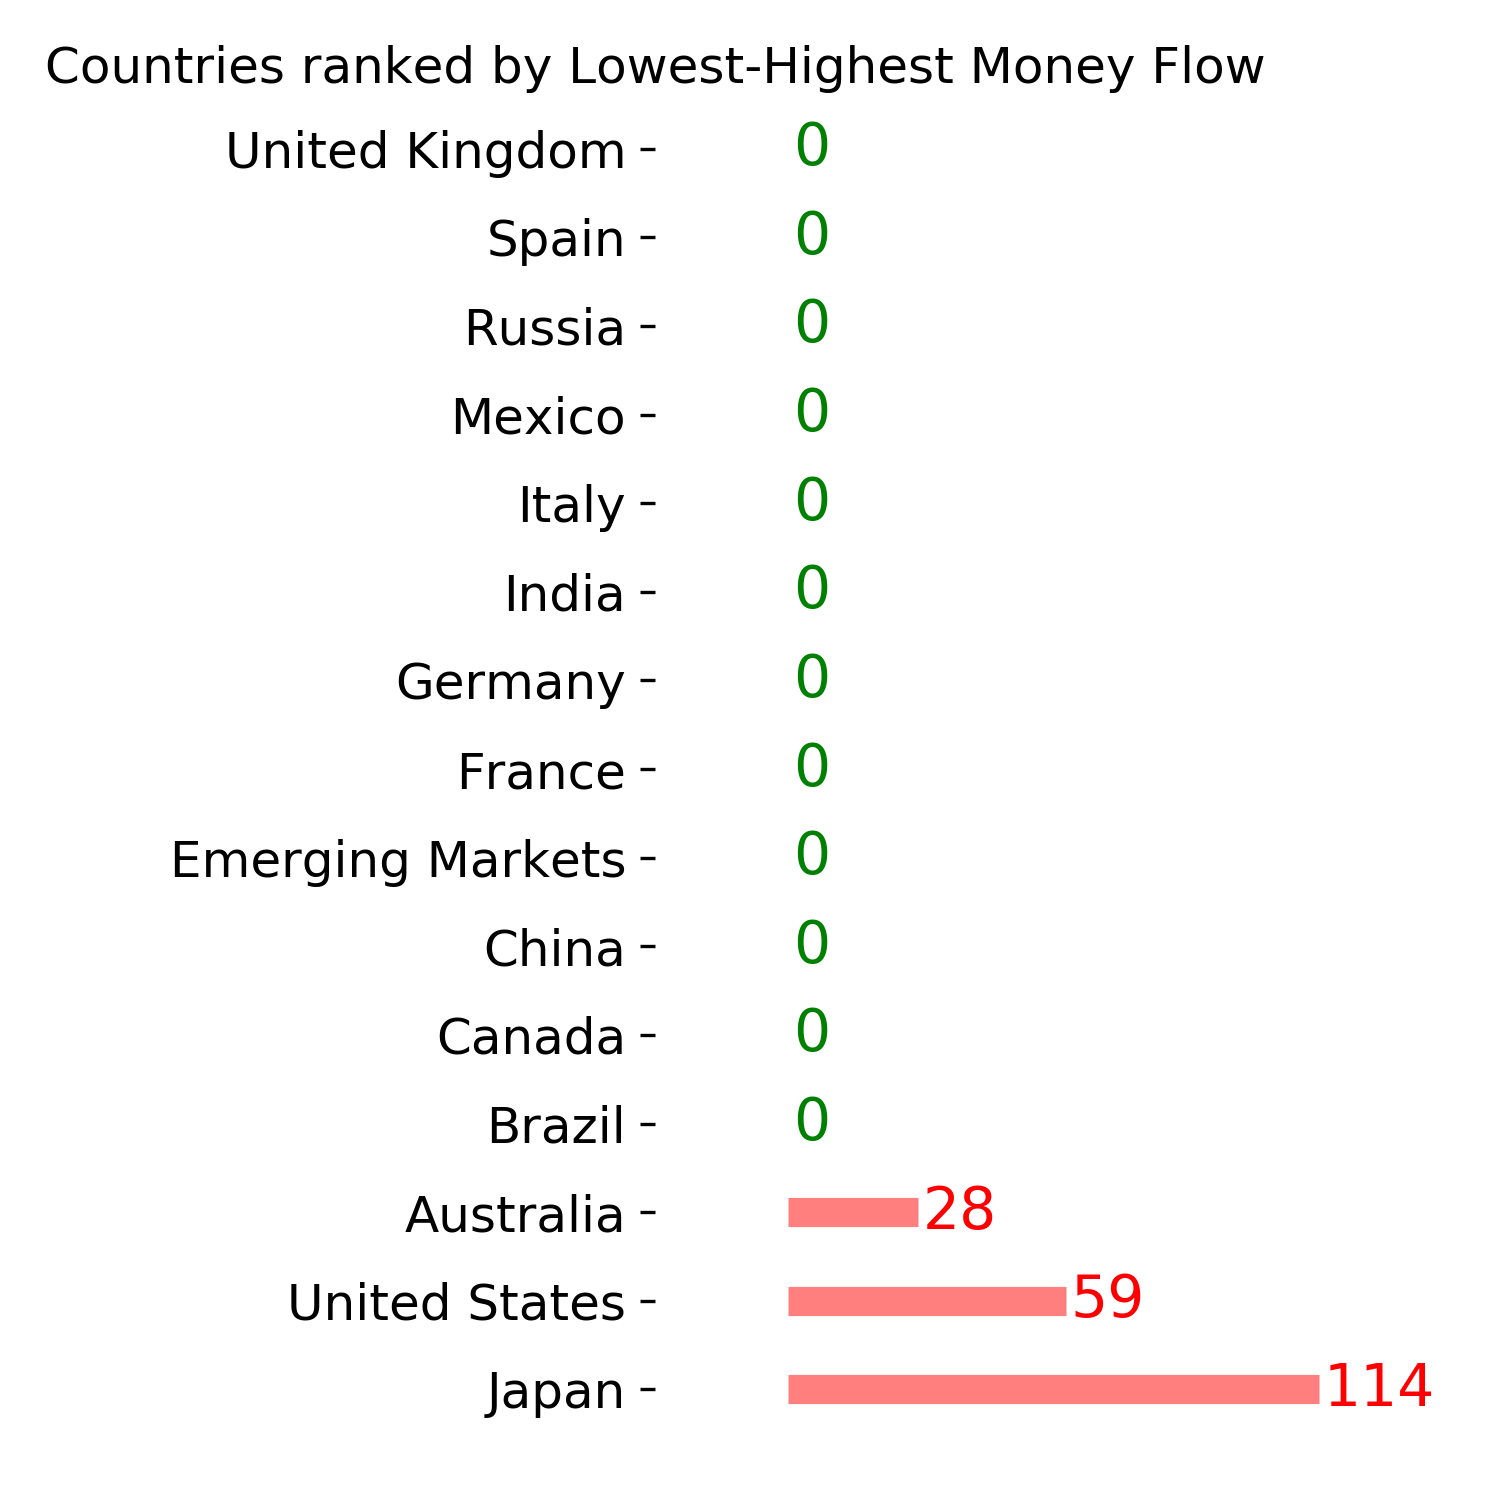
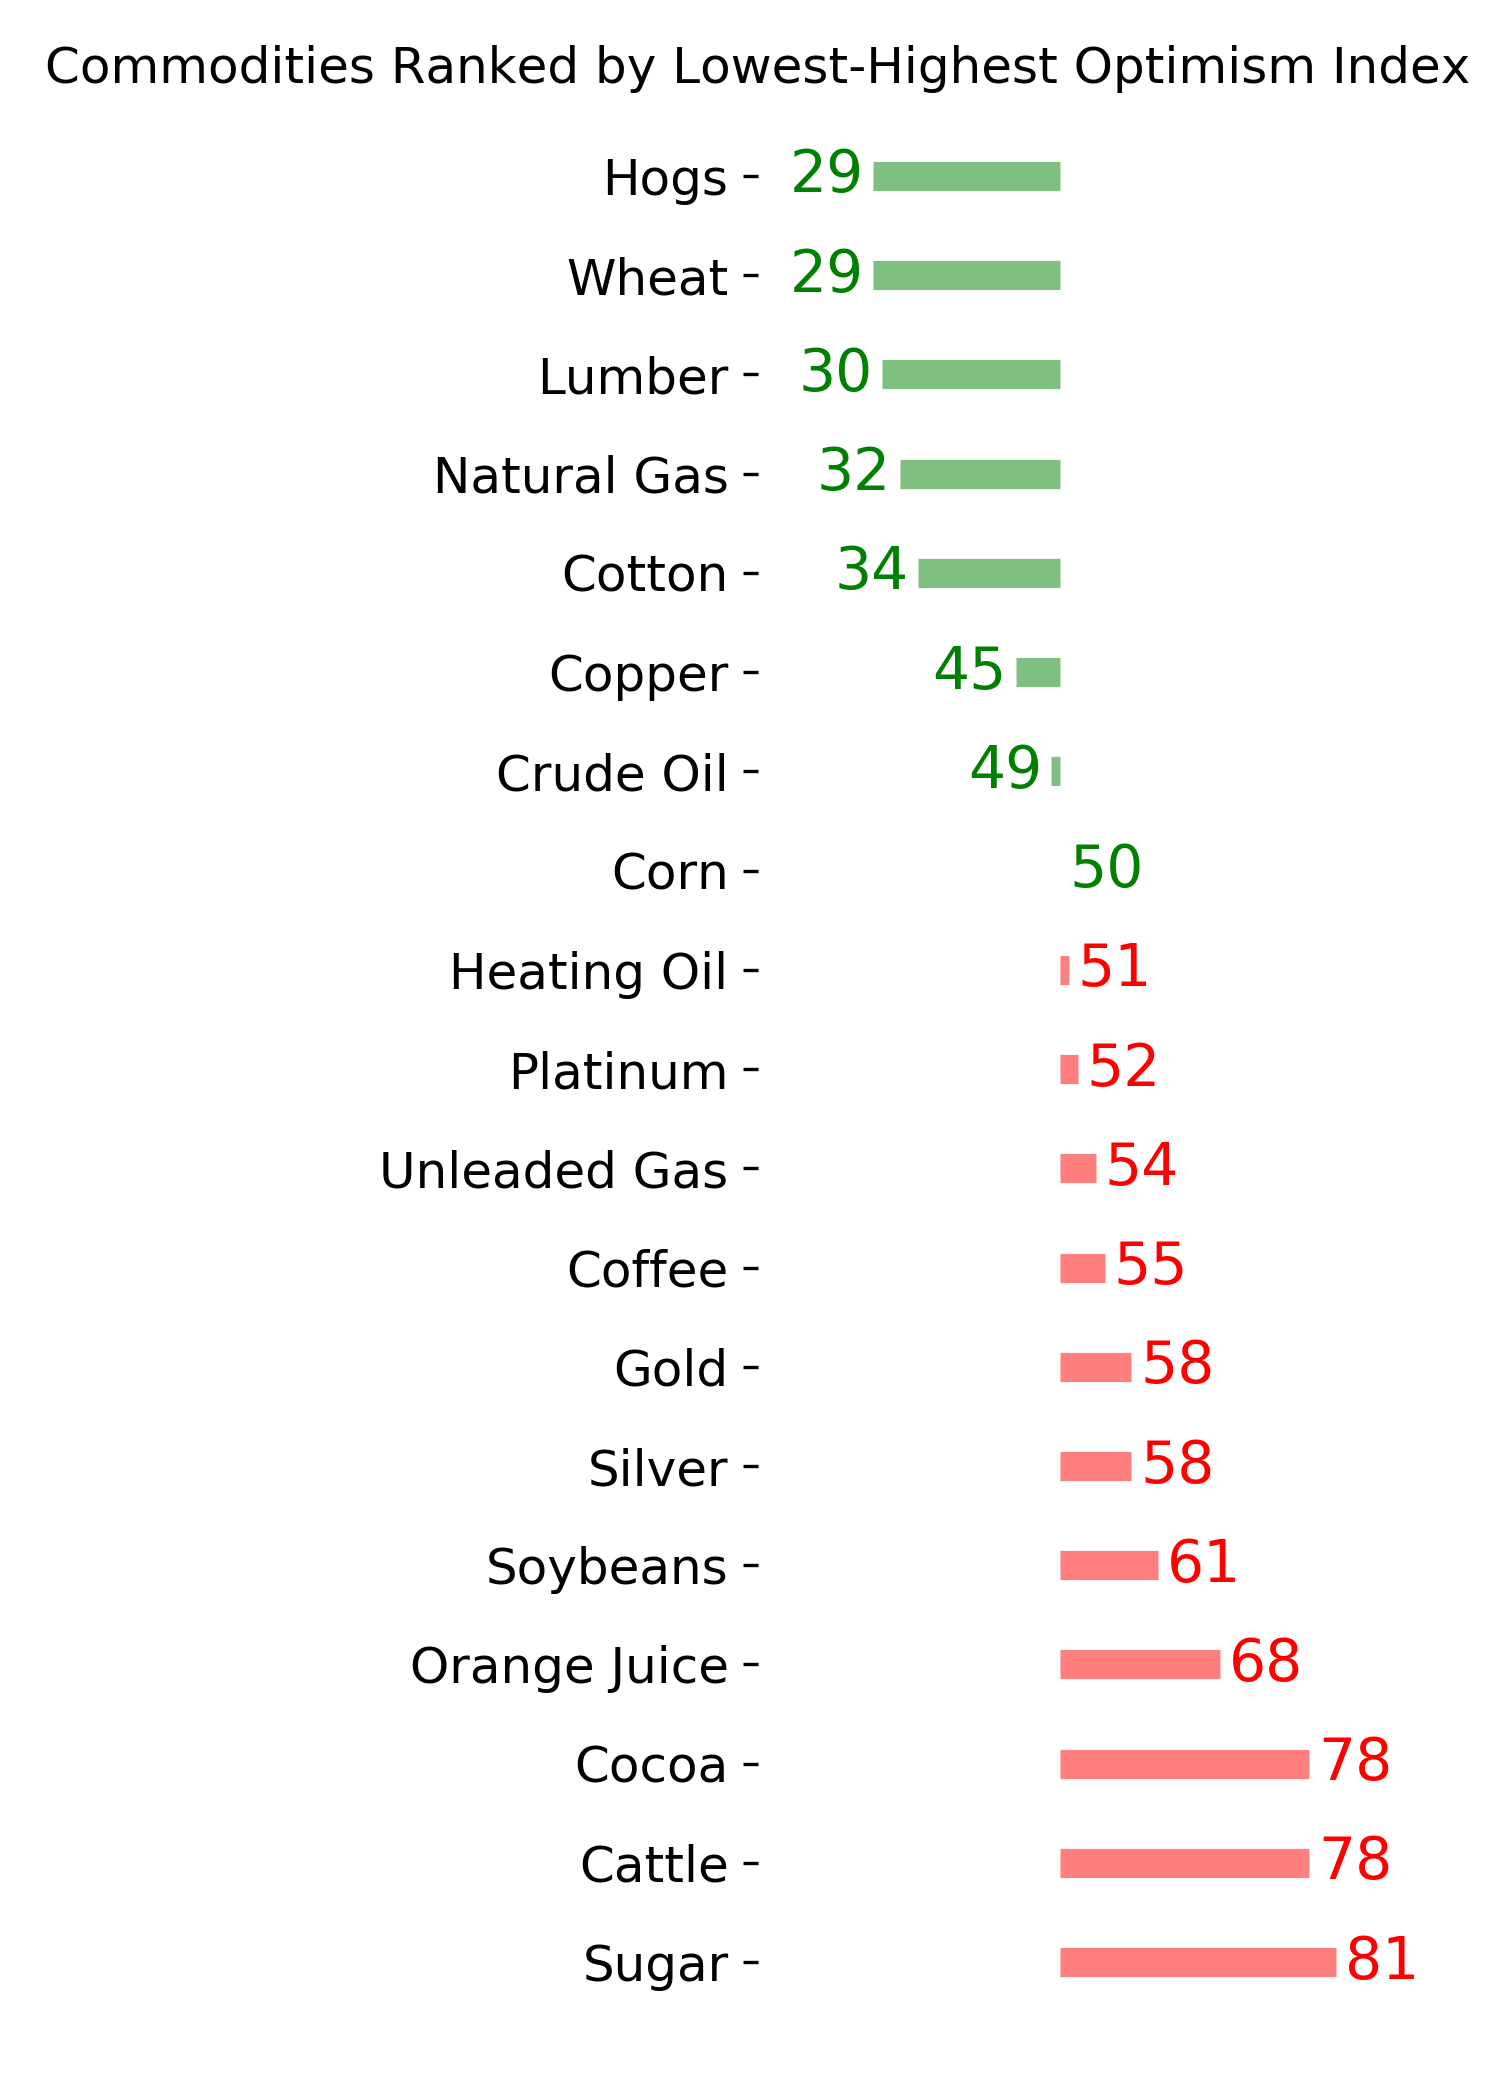
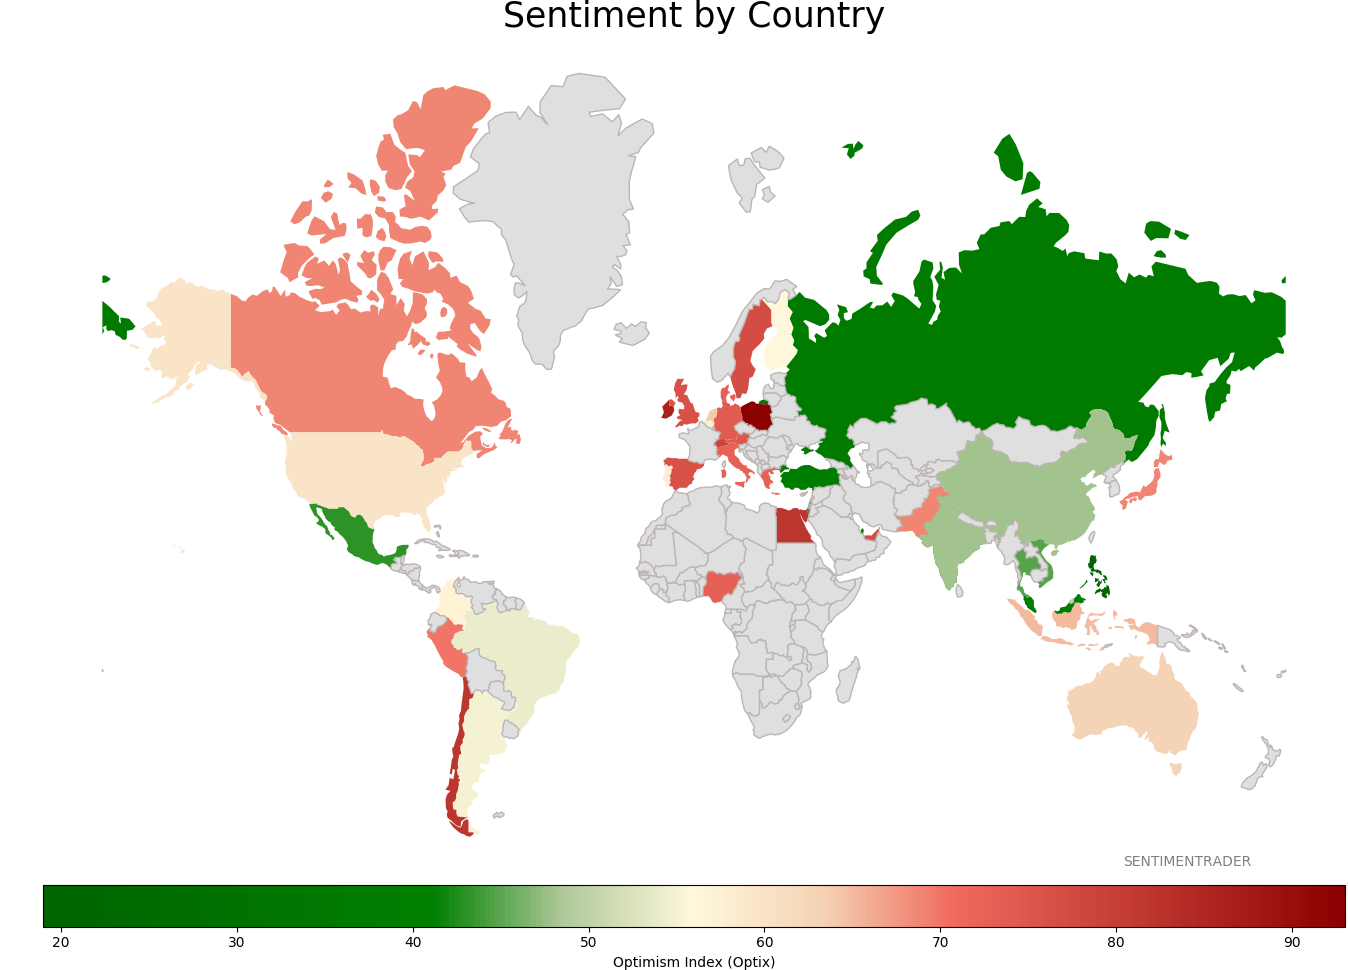
Sentiment Around The World
Optimism Index Thumbnails
|
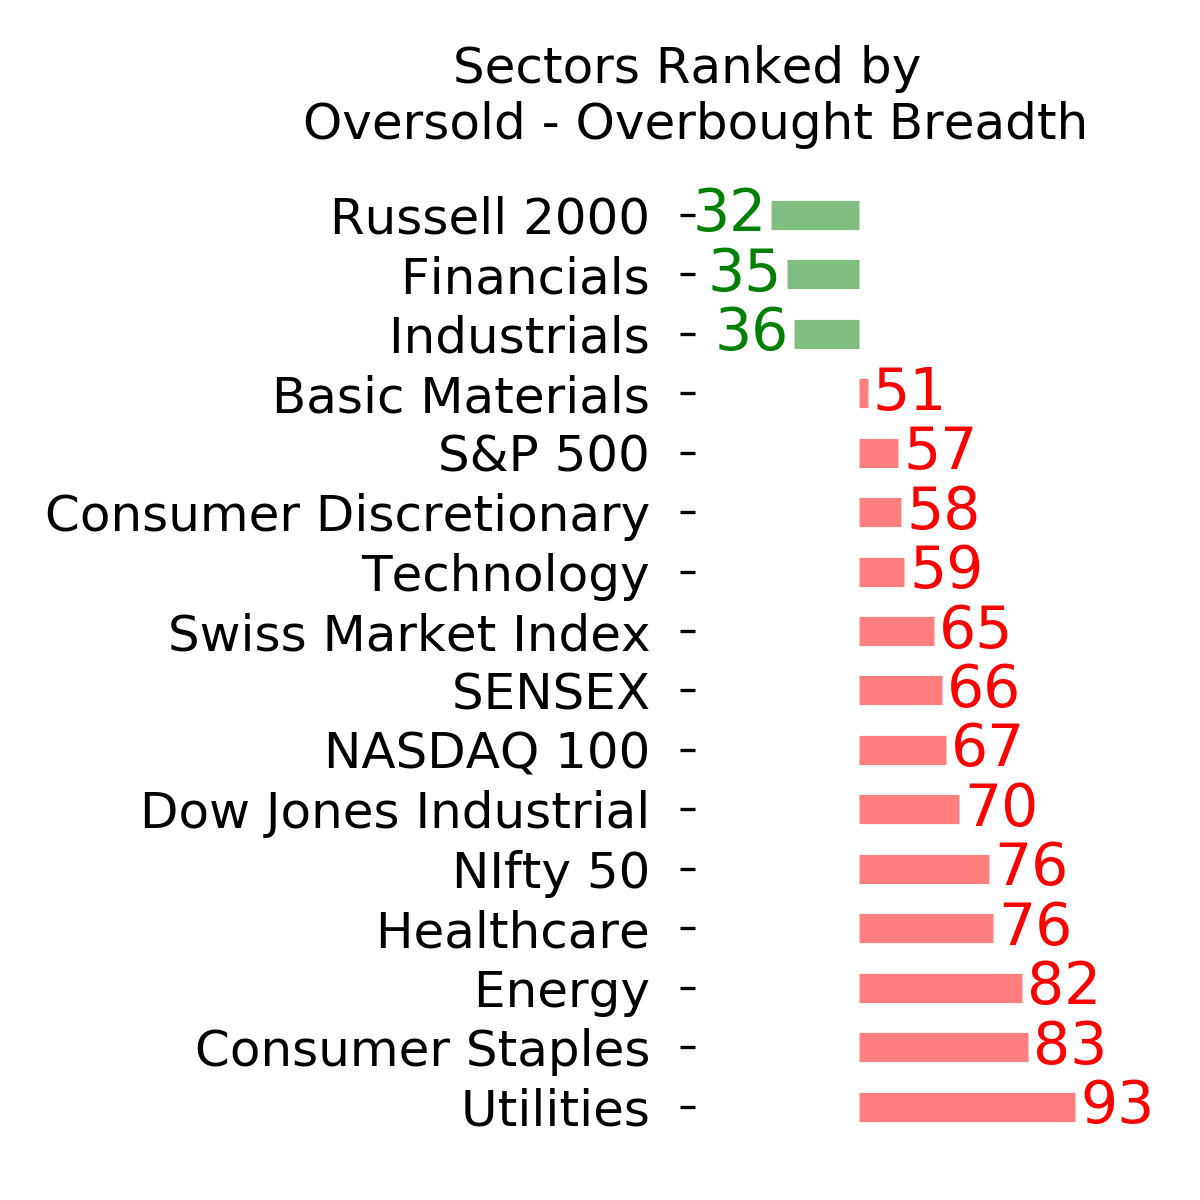
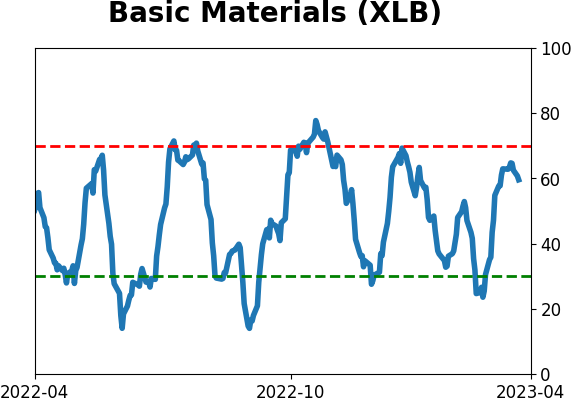
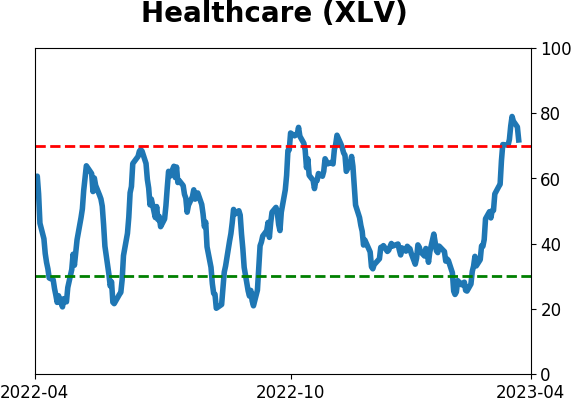
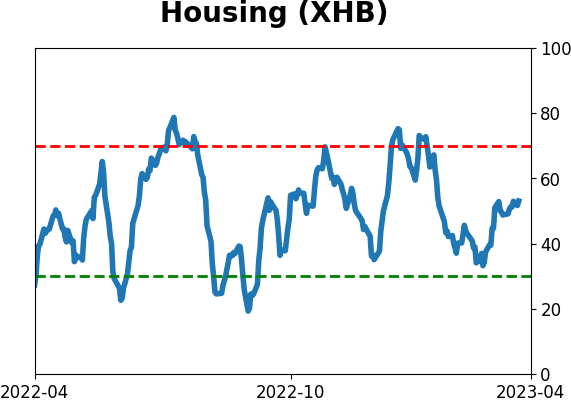
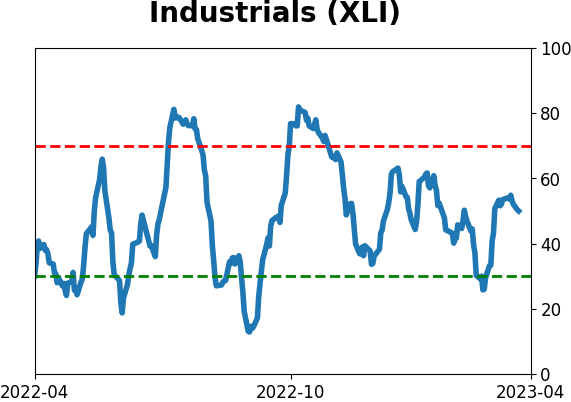
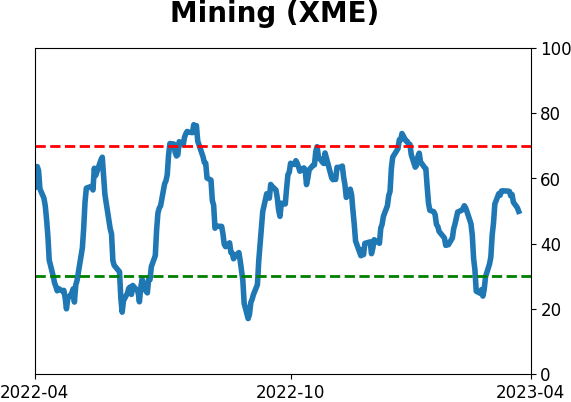
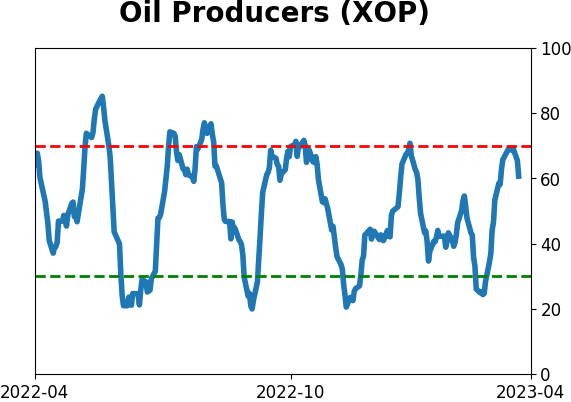
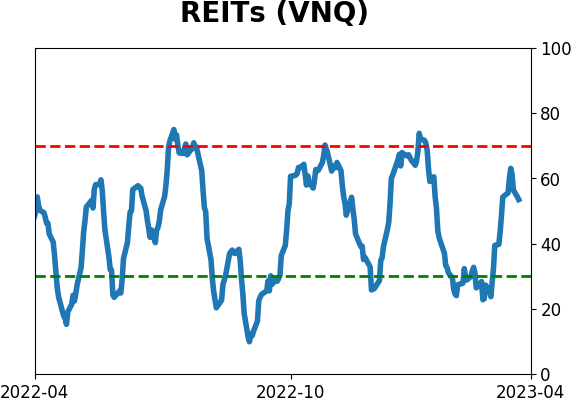
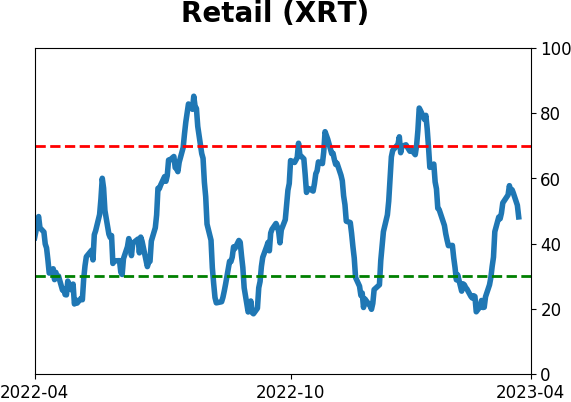
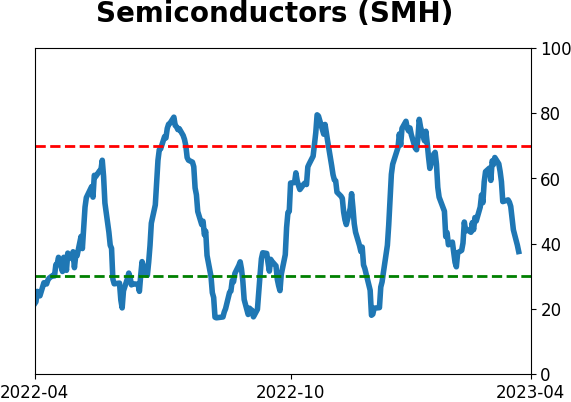
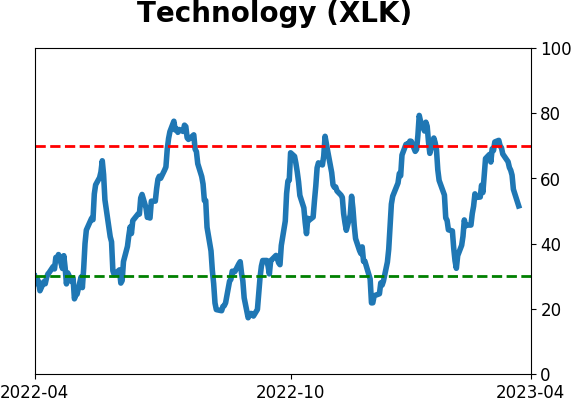
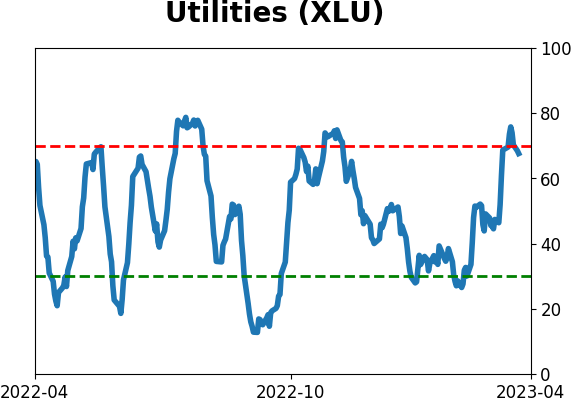
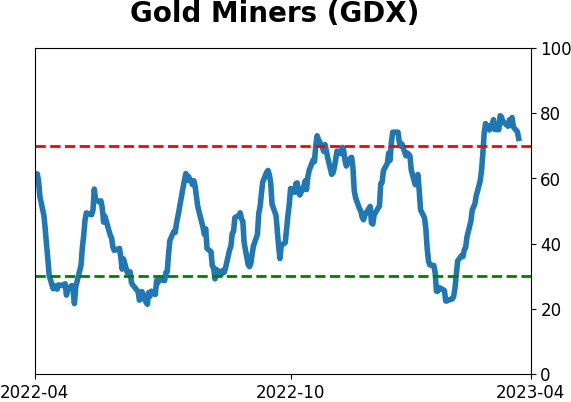
Sector ETF's - 10-Day Moving Average
|
|
|
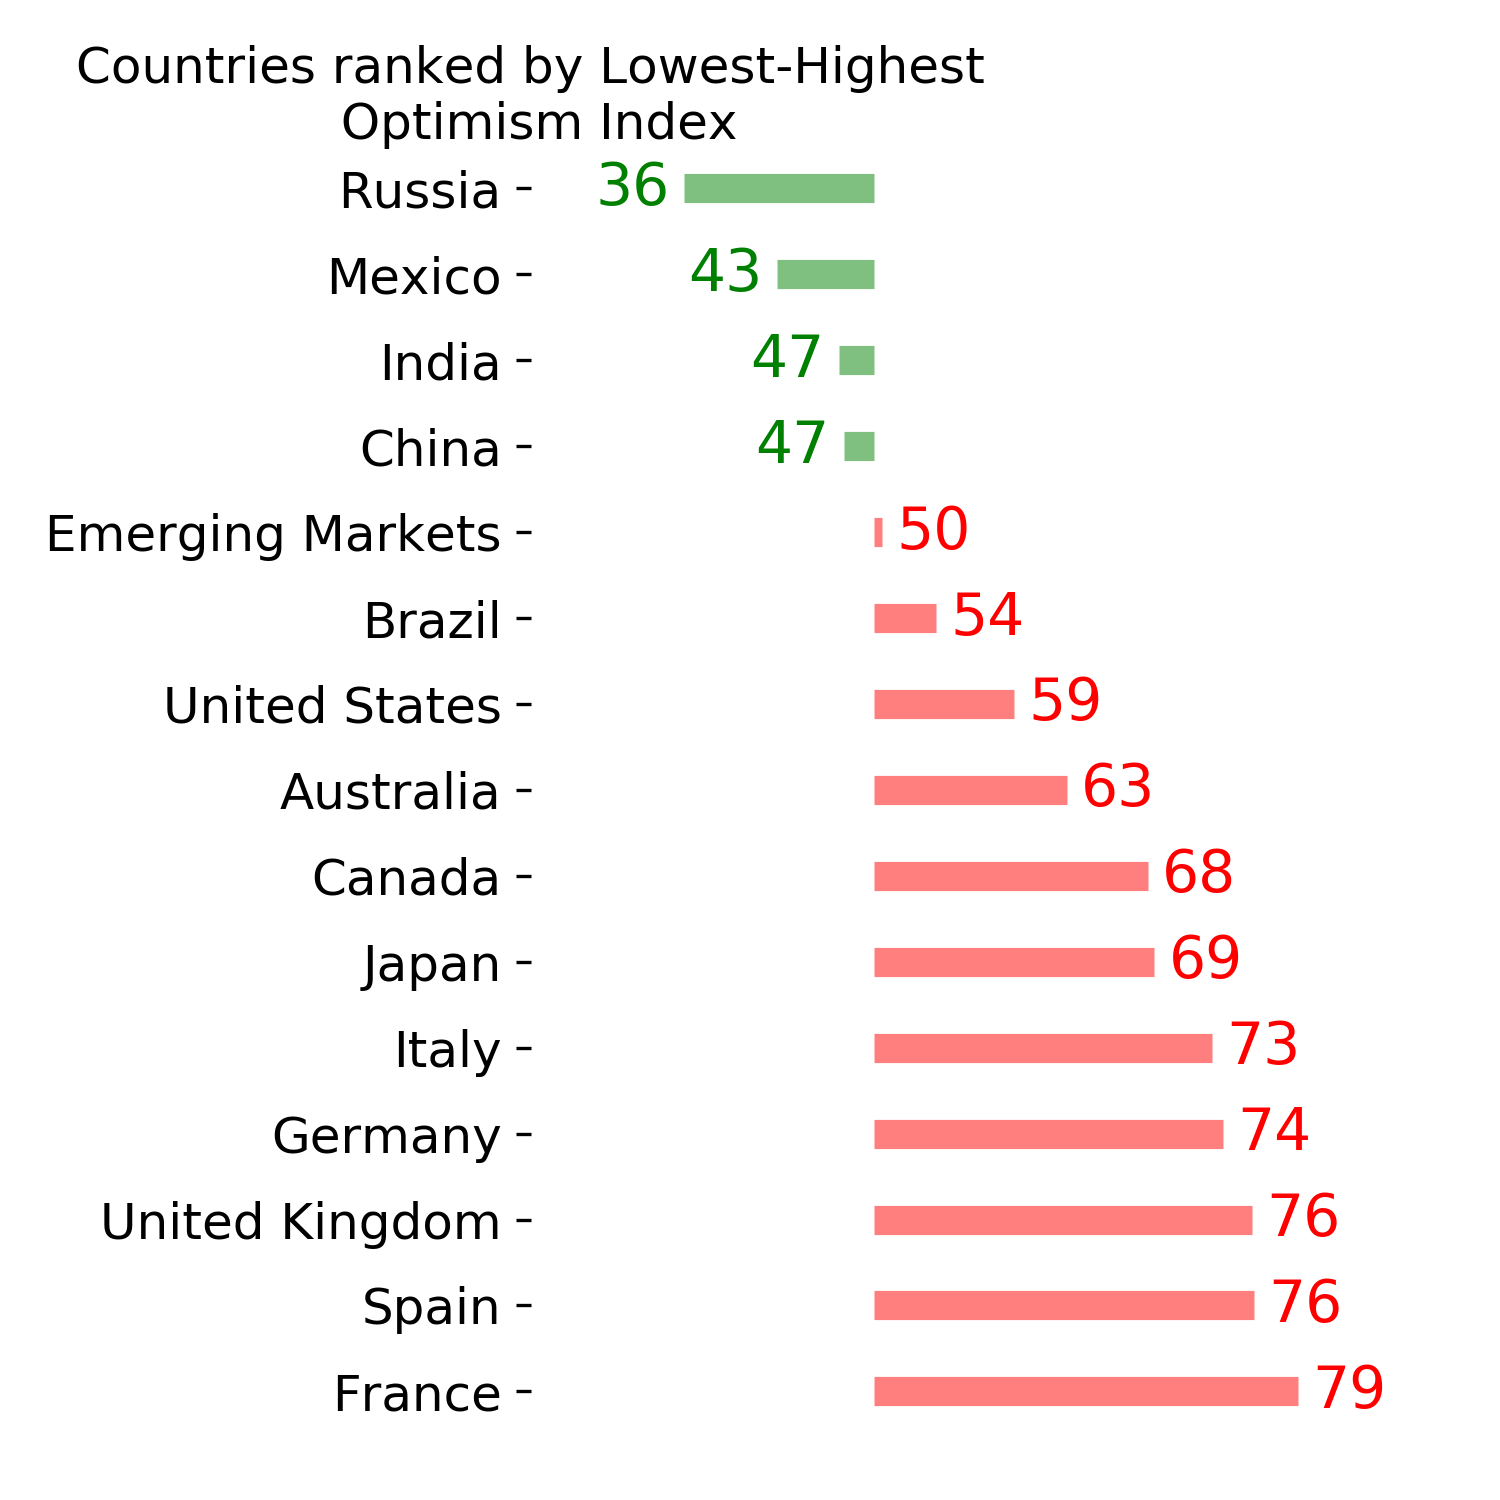
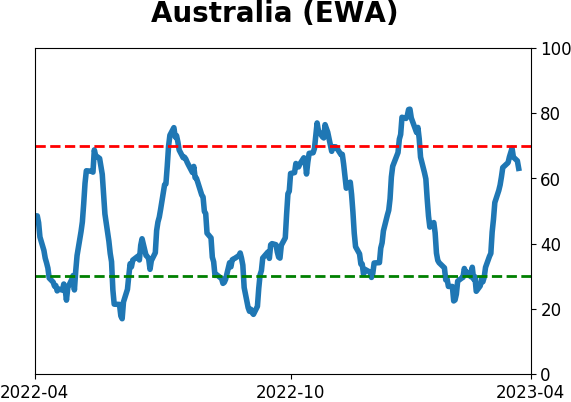
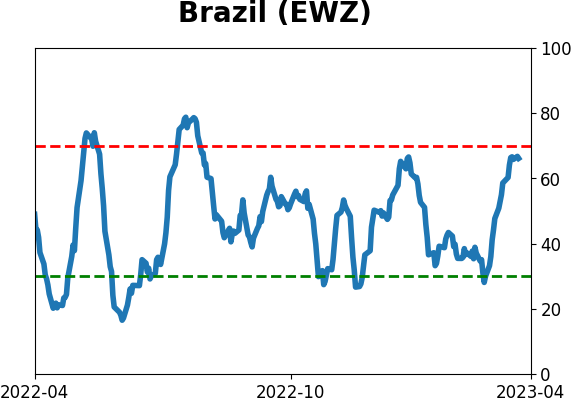
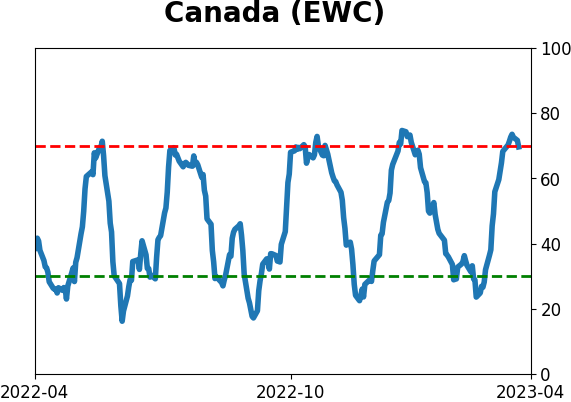
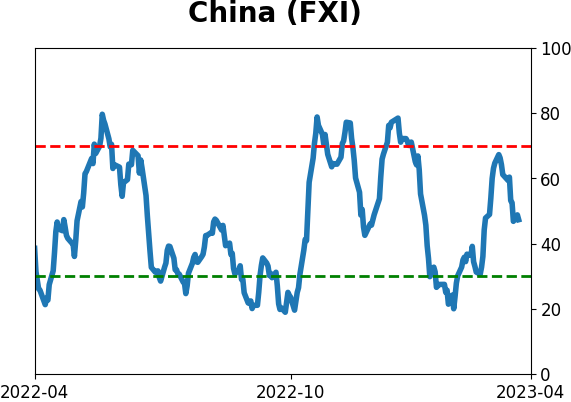
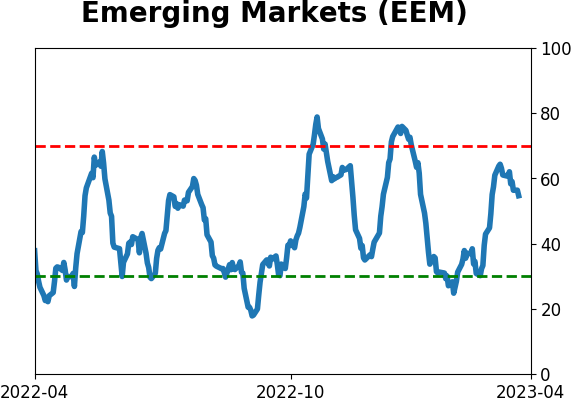
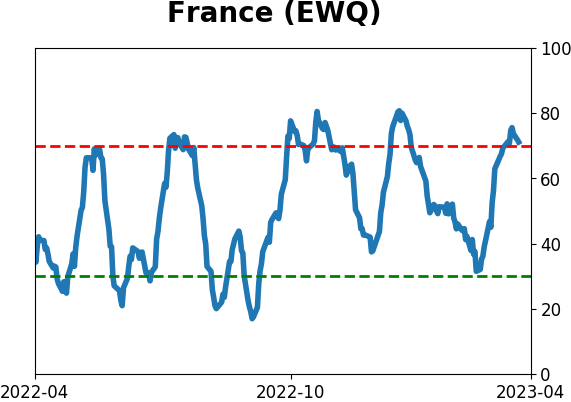
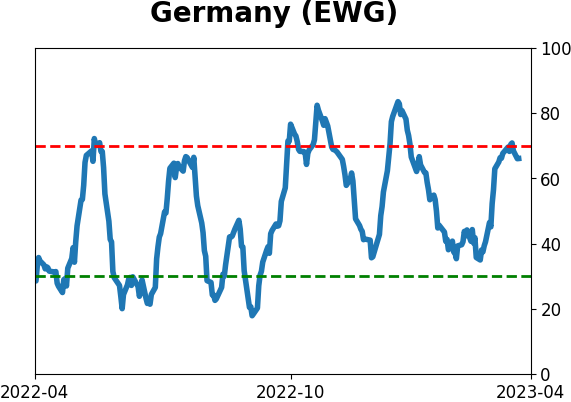
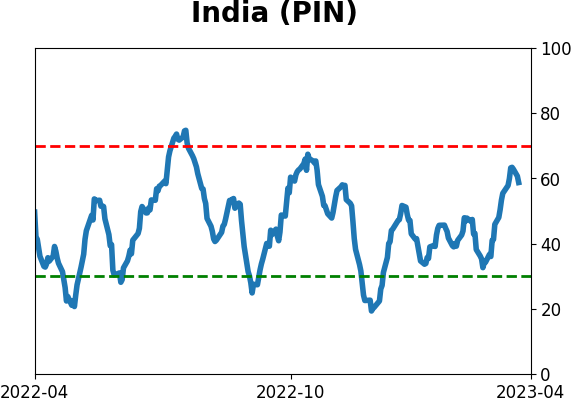
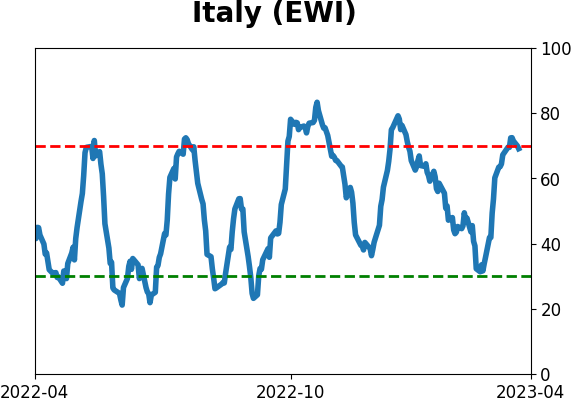
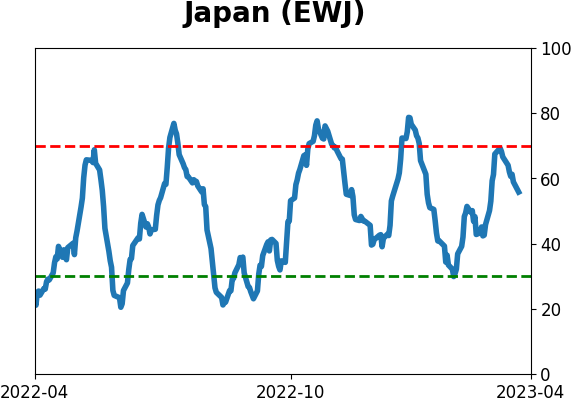
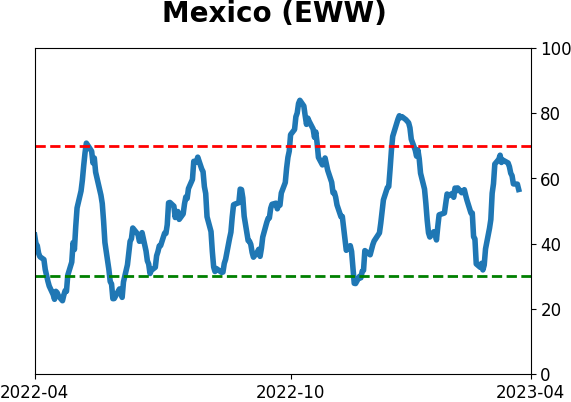
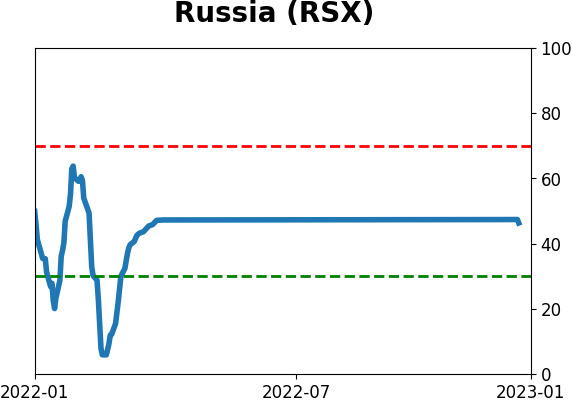
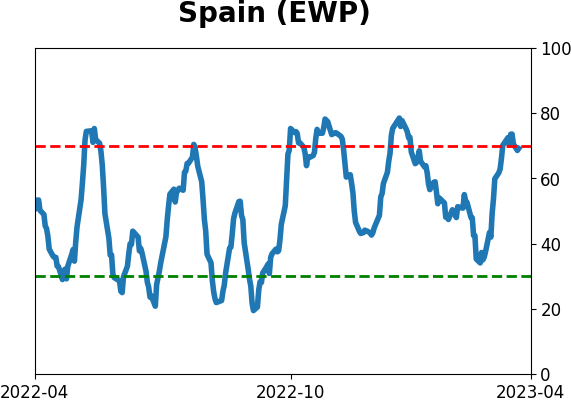
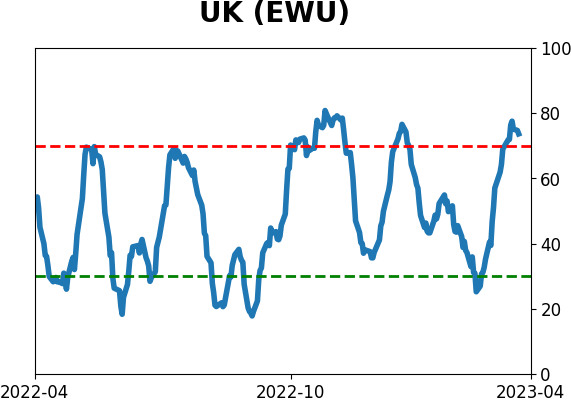
Country ETF's - 10-Day Moving Average
|
|
|
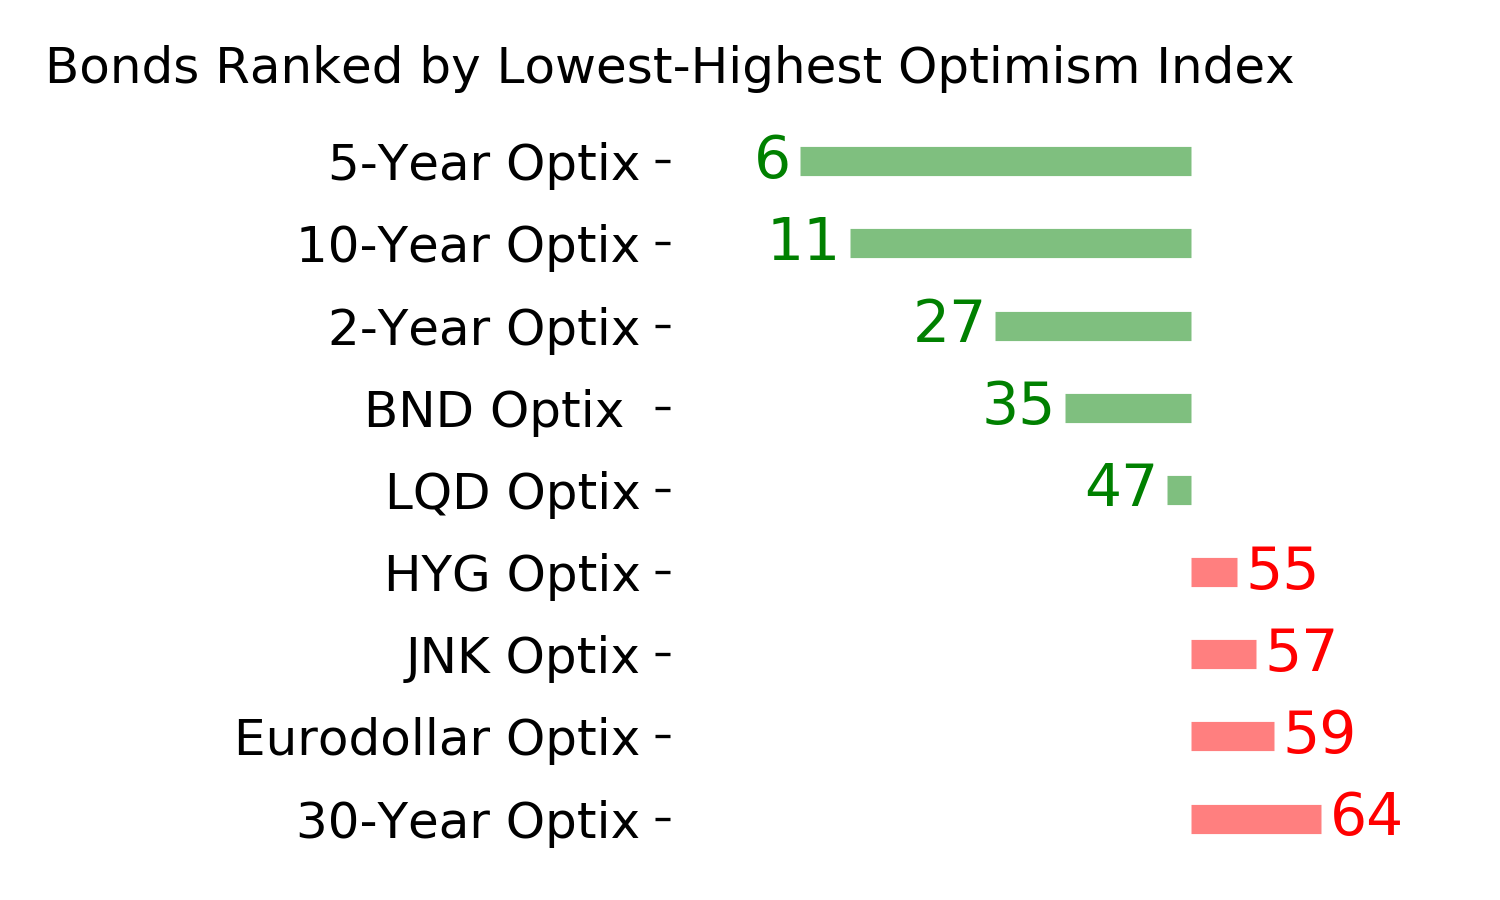
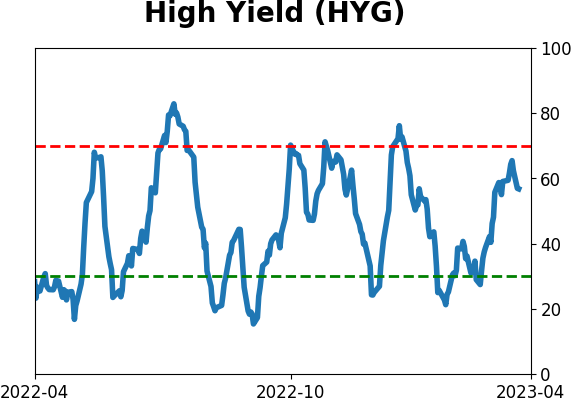
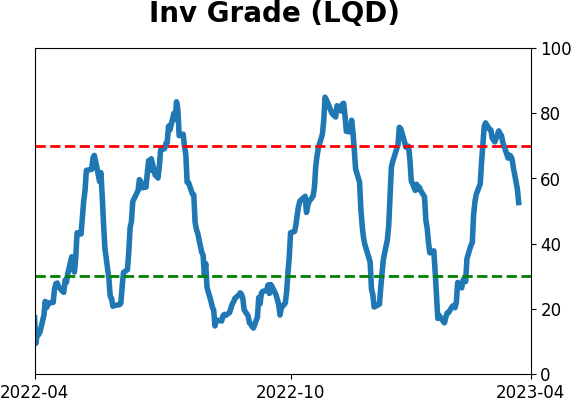
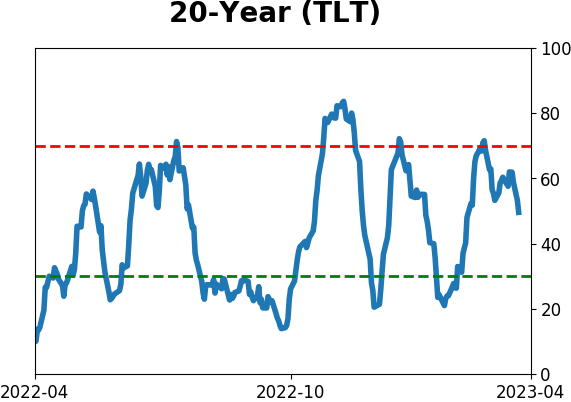
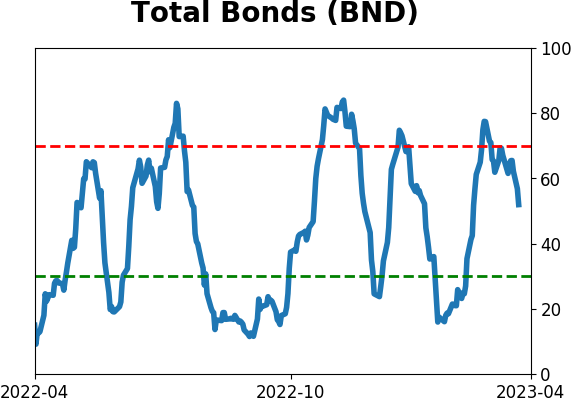
Bond ETF's - 10-Day Moving Average
|
|
|
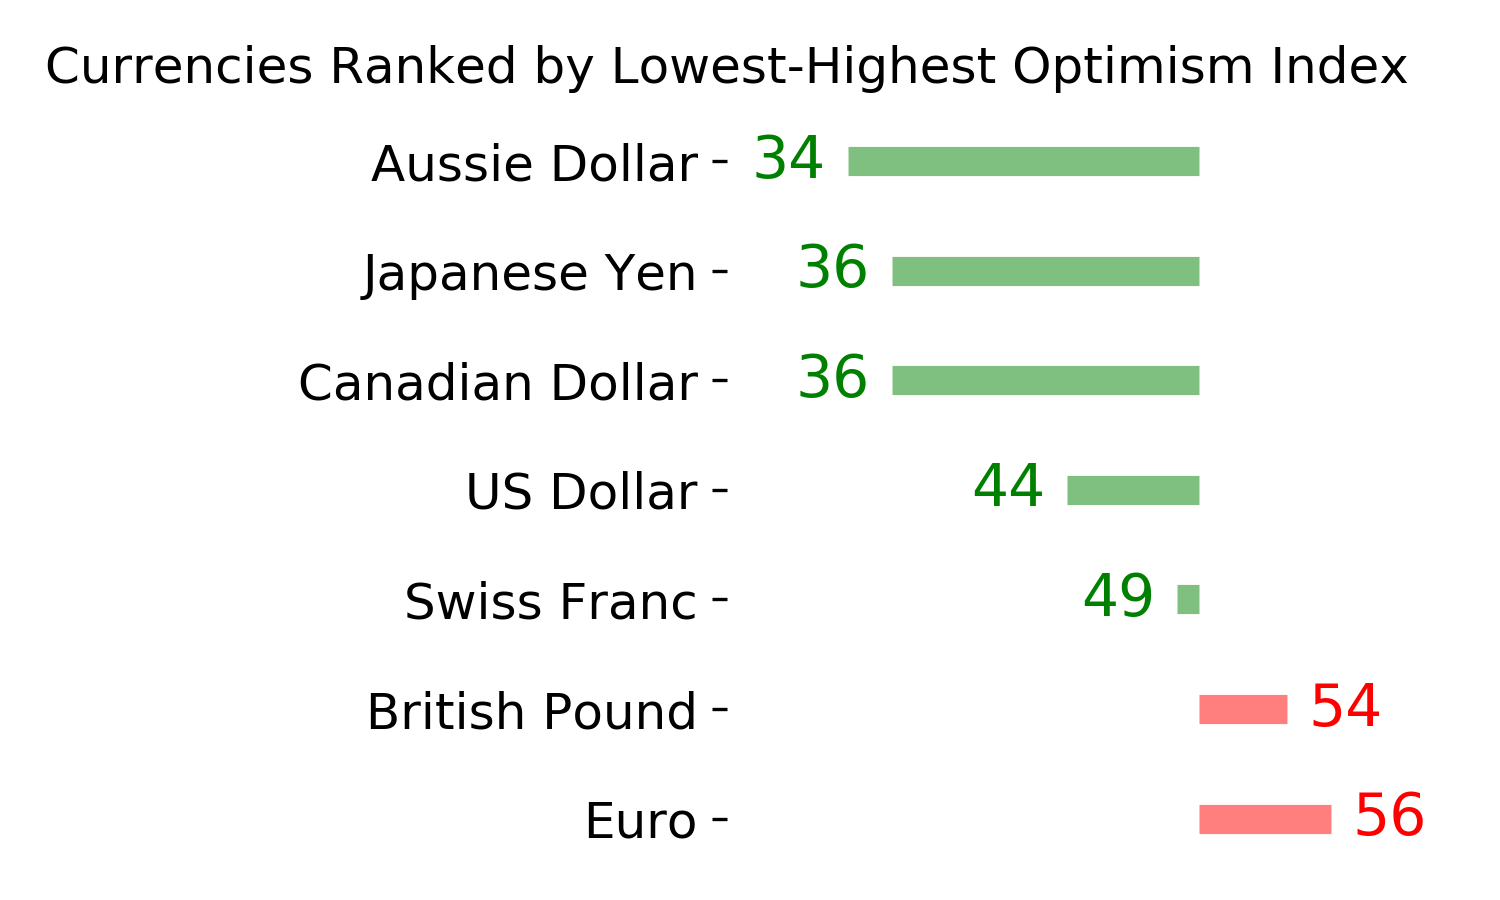
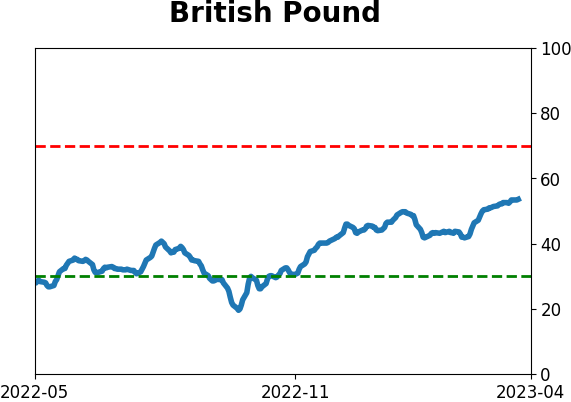
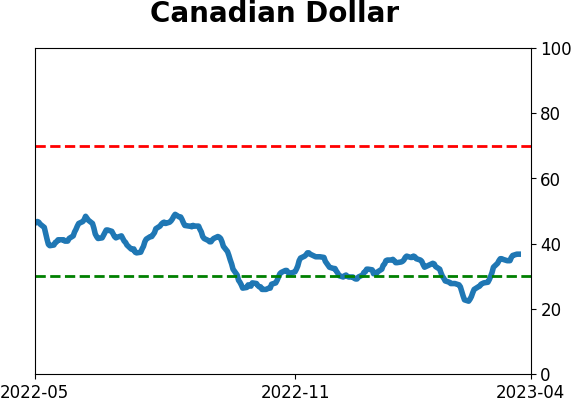
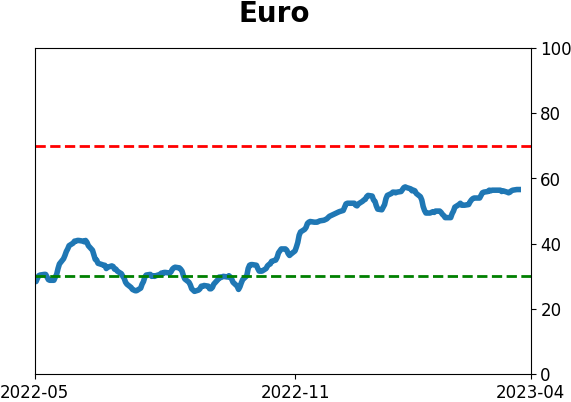
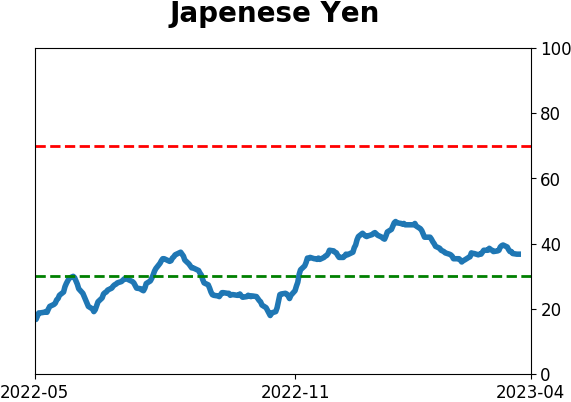
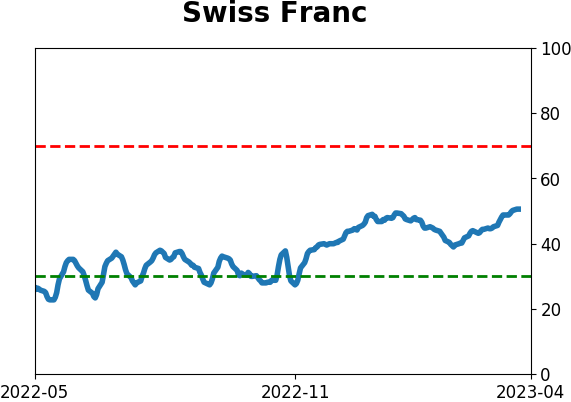
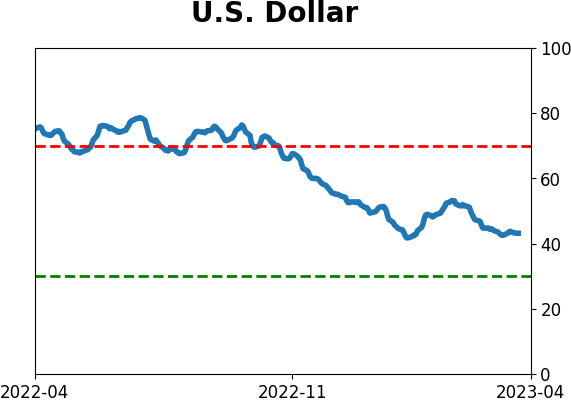
Currency ETF's - 5-Day Moving Average
|
|
|
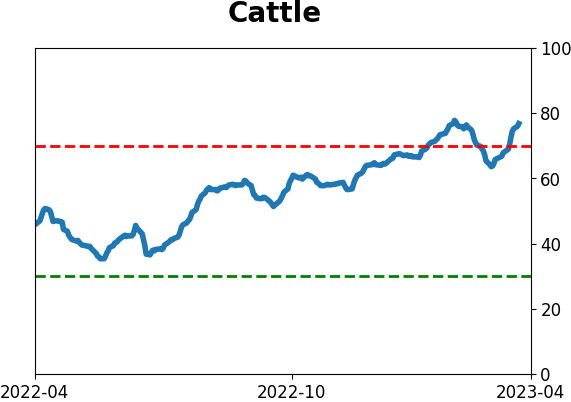
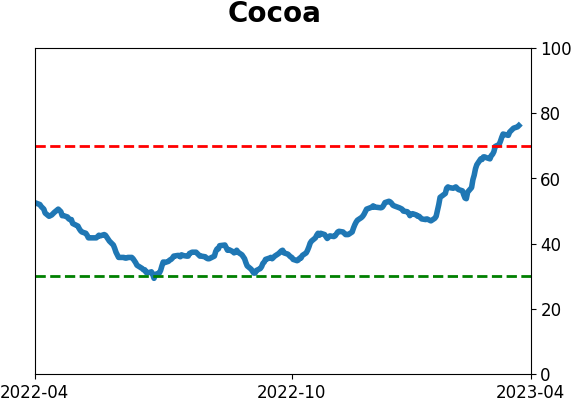
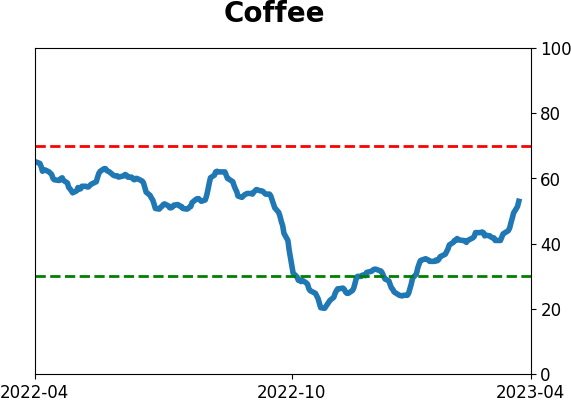
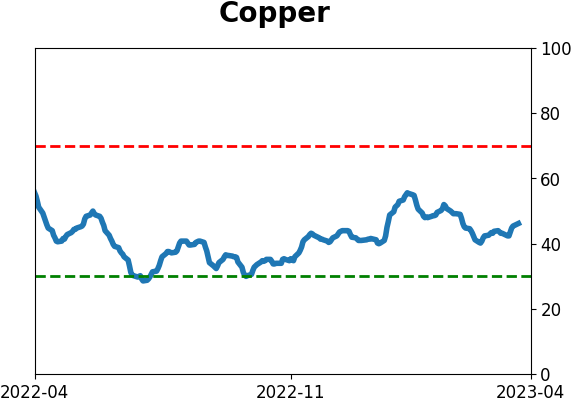
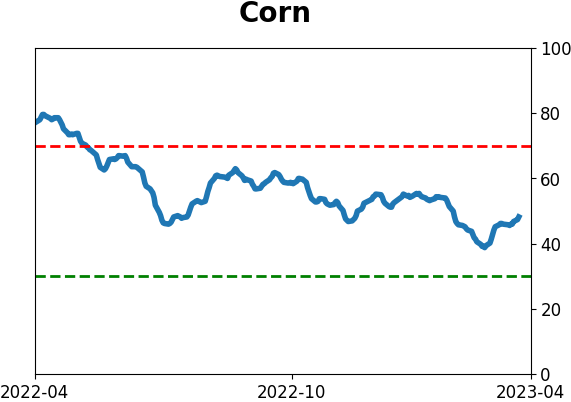
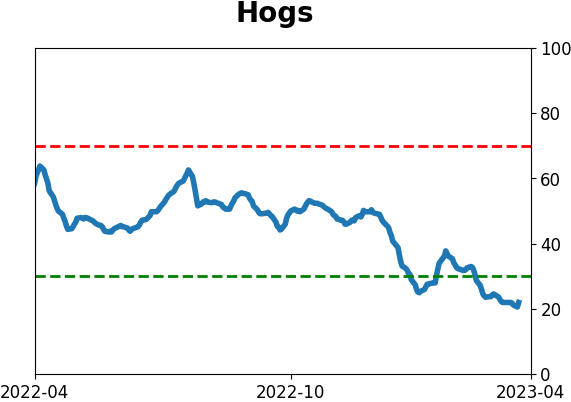
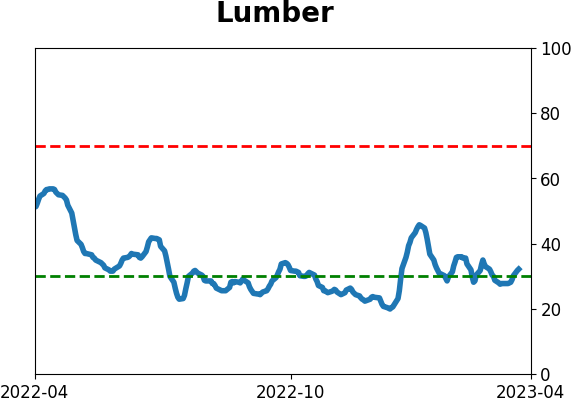
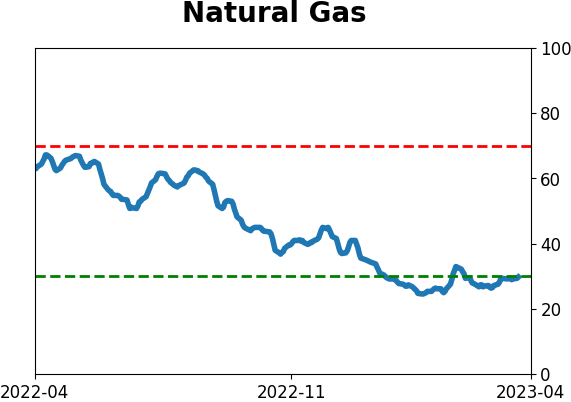
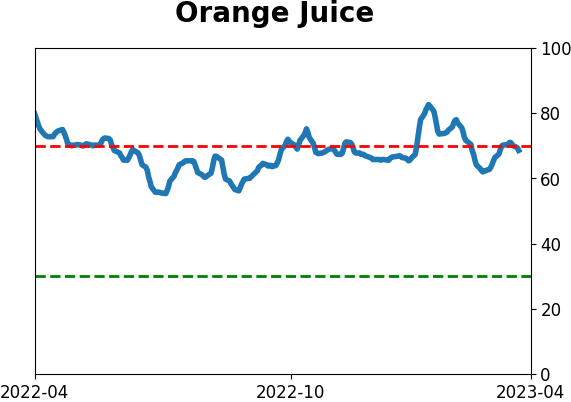
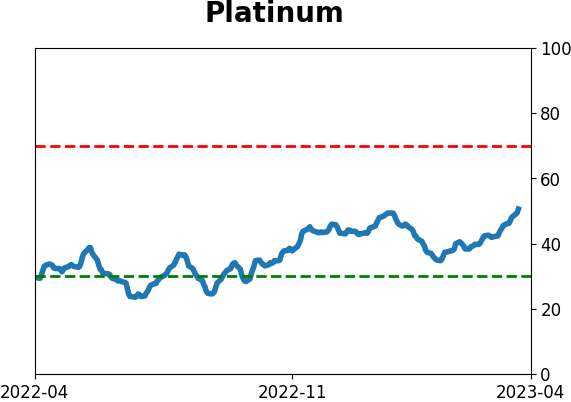
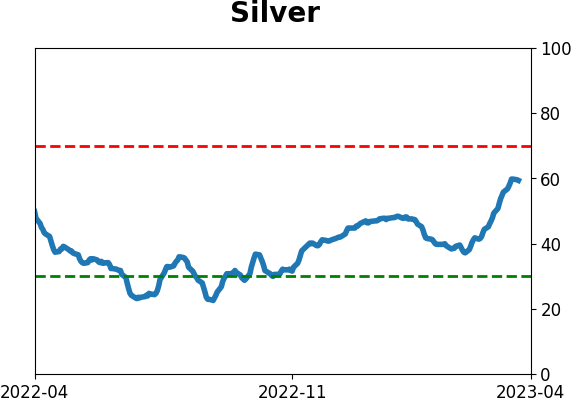
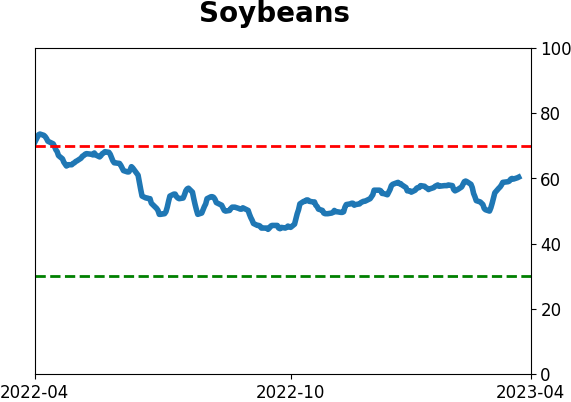
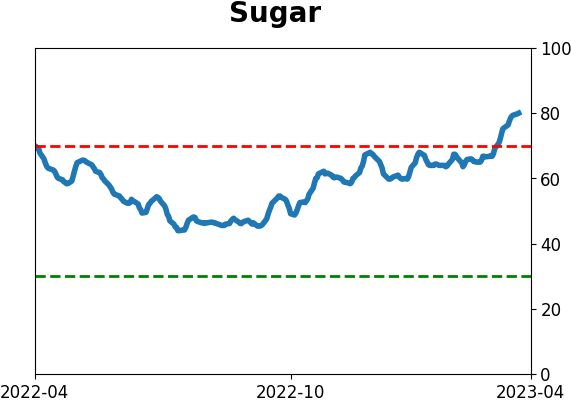
Commodity ETF's - 5-Day Moving Average
|
|