Headlines
|
|
The first signs of a crack within the S&P 500:
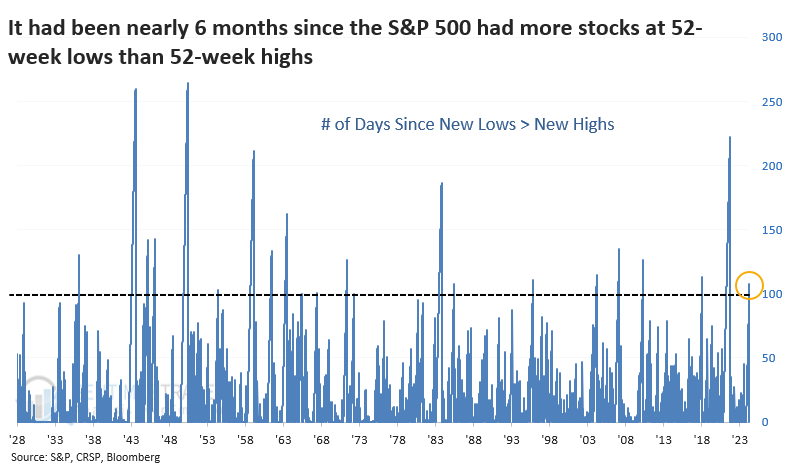
More stocks in the S&P 500 fell to a 52-week low than rose to a 52-week high in the S&P 500 last week. It was only one day, but it was enough to end a streak of nearly 6 months of positive internal momentum. The ends of other long streaks tended to see some shorter-term weakness in the index, but long-term strength.
|
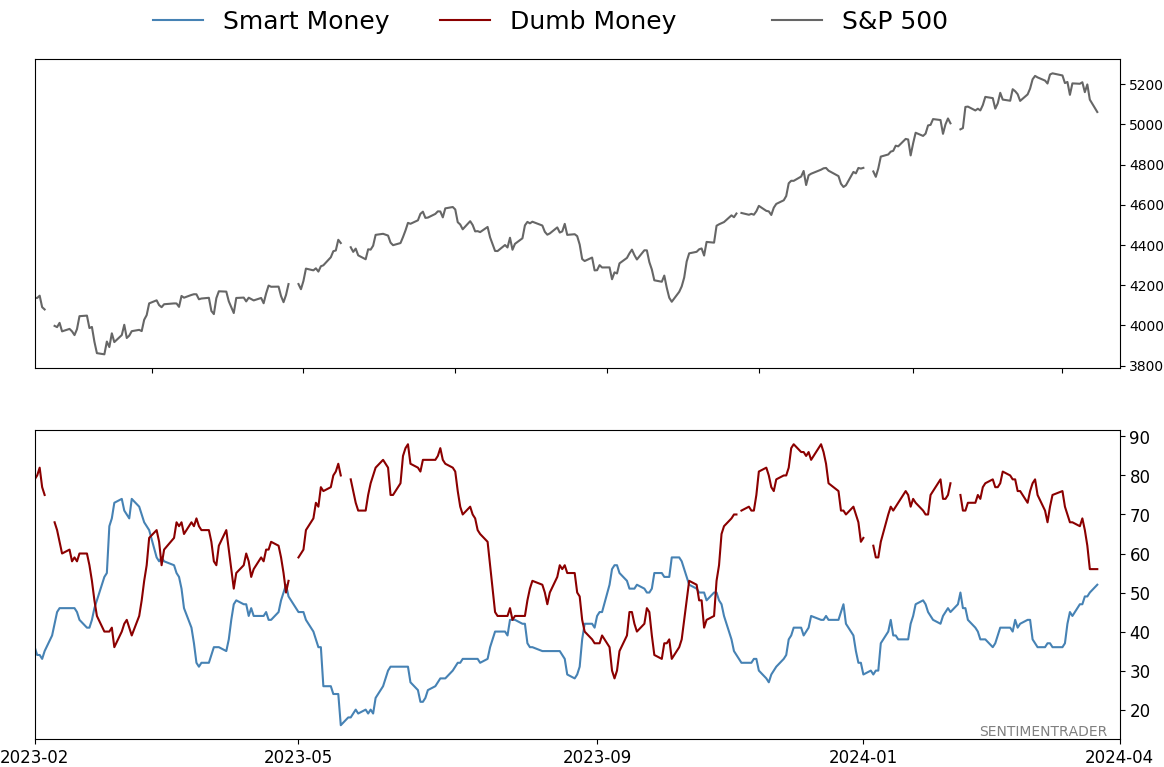
Smart / Dumb Money Confidence
|
Smart Money Confidence: 52%
Dumb Money Confidence: 56%
|
|
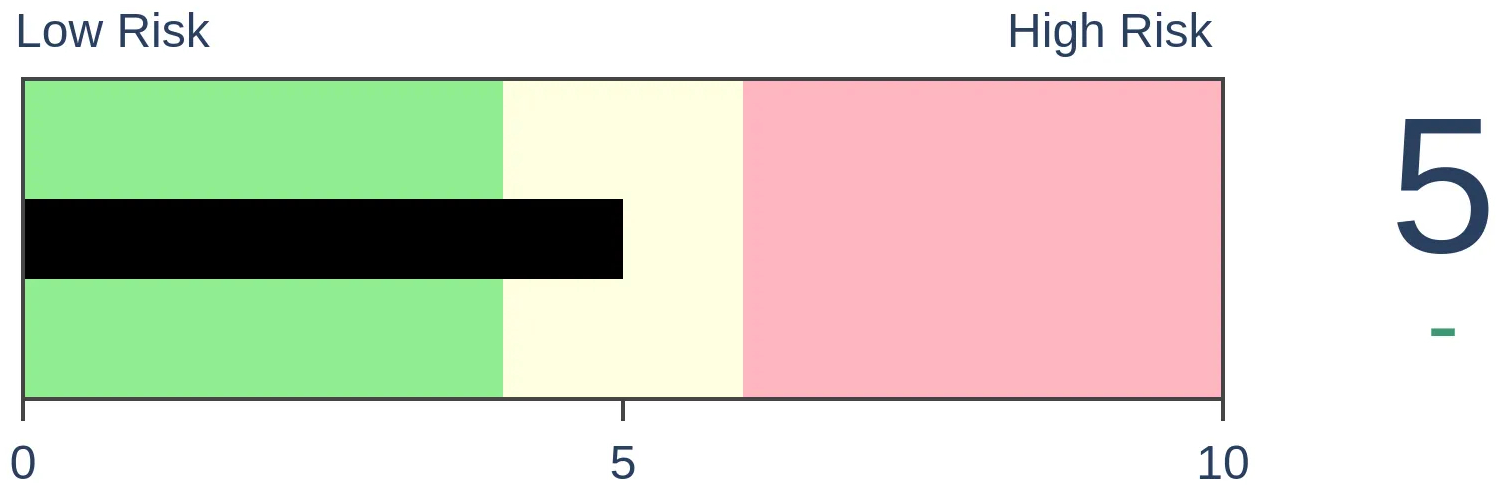
Risk Levels
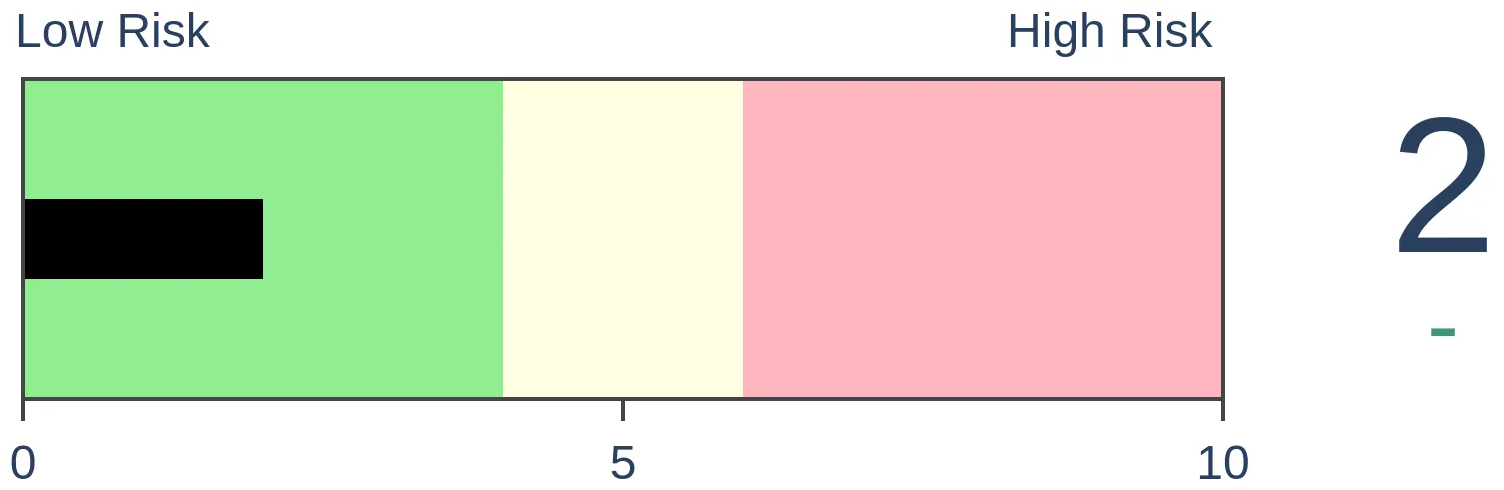
Stocks Short-Term

|
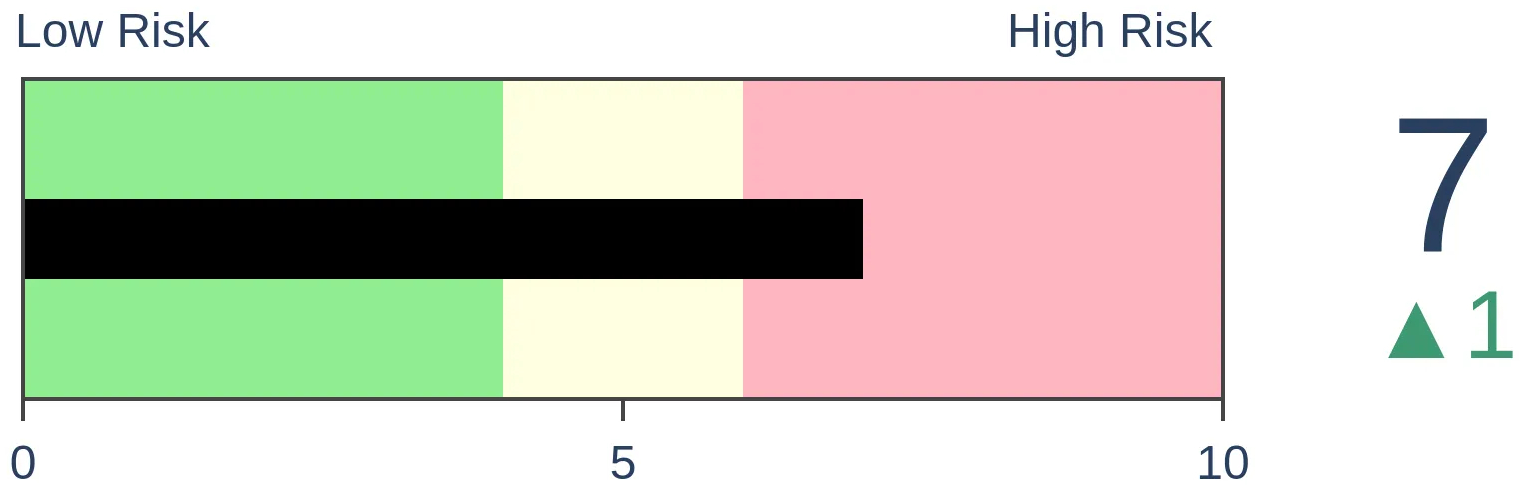
Stocks Medium-Term
|
|
Bonds
|
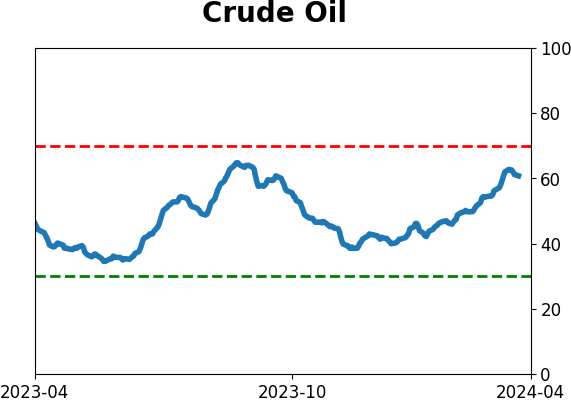
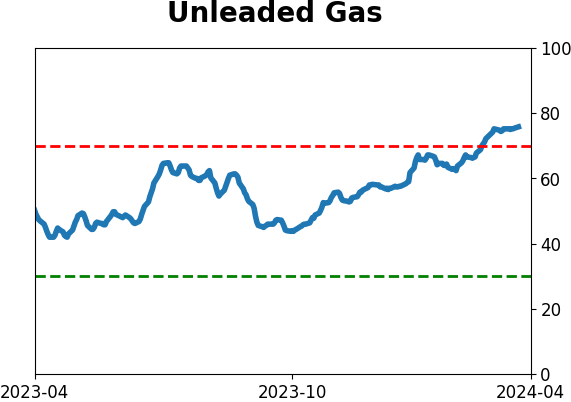
Crude Oil

|
|
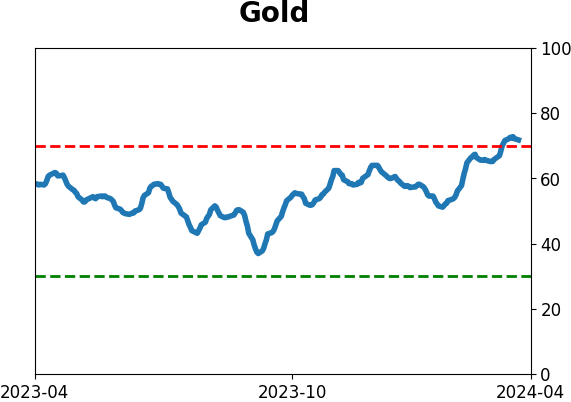
Gold
|
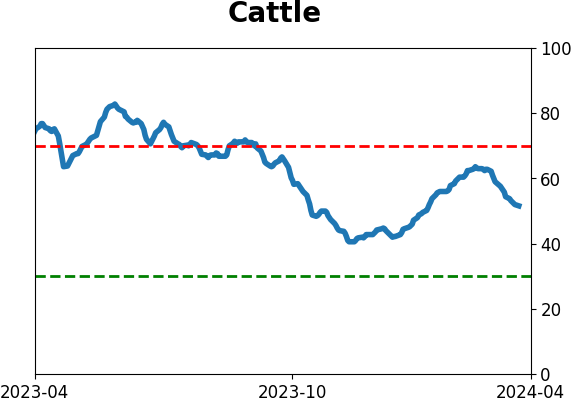
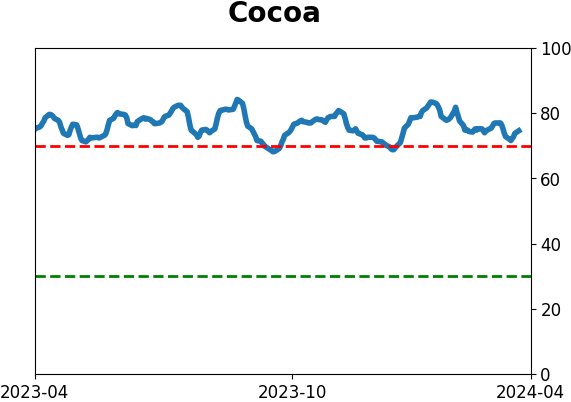
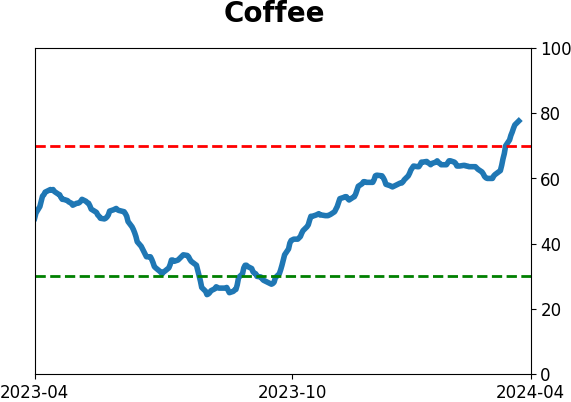
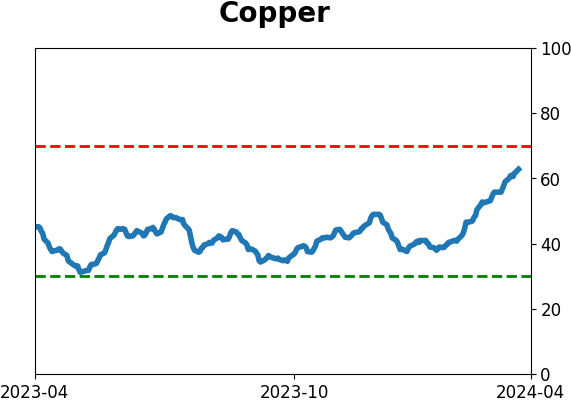
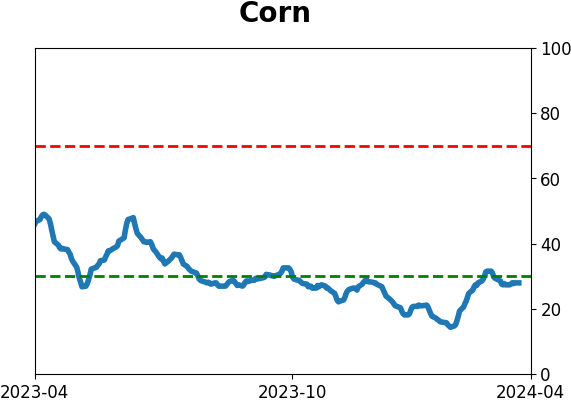
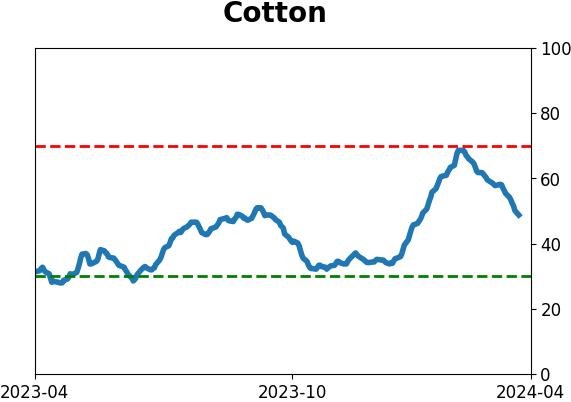
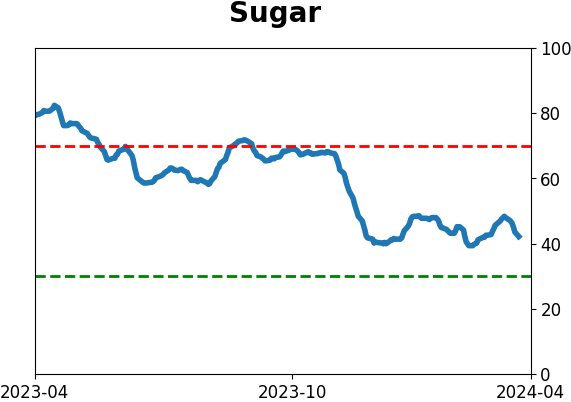
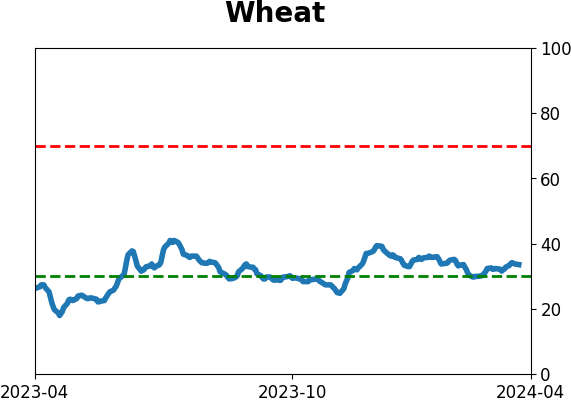
Agriculture

|
|
Research
By Jason Goepfert
BOTTOM LINE
More stocks in the S&P 500 fell to a 52-week low than rose to a 52-week high in the S&P 500 last week. It was only one day, but it was enough to end a streak of nearly 6 months of positive internal momentum. The ends of other long streaks tended to see some shorter-term weakness in the index, but long-term strength.
FORECAST / TIMEFRAME
None
|
Key points:
- For the first time in nearly 6 months, more stocks fell to a 52-week low than rose to a 52-week high in the S&P 500
- That ended one of the longest streaks of positive participation since 1928
- The ends of other long streaks showed a strong tendency to attract long-term investors
Finally, more new lows than highs
Toward the end of last month, there was finally a touch of underlying weakness among stocks in the S&P 500. Well, not weakness, per se, but less strength.
For the first time in months, fewer stocks pushed to new highs as the index climbed. The divergence wasn't nearly as bad as in the Nasdaq, but it was the first sign of waning participation. By Wednesday, more stocks were falling to 52-week lows than rising to 52-week highs, which is never a good sign.
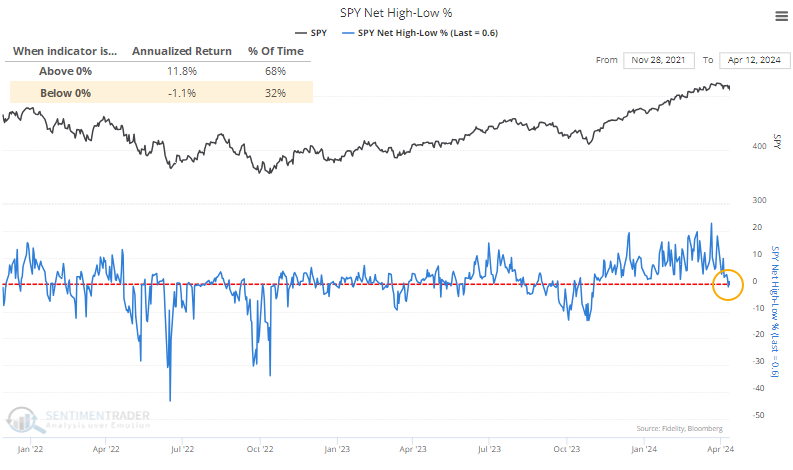
Surprisingly, the net percentage has bumped back into positive, but just barely. This is something to watch; the S&P's annualized return when this figure is positive was +11.8%. When there were more lows than highs, that return craters to -1.1%.
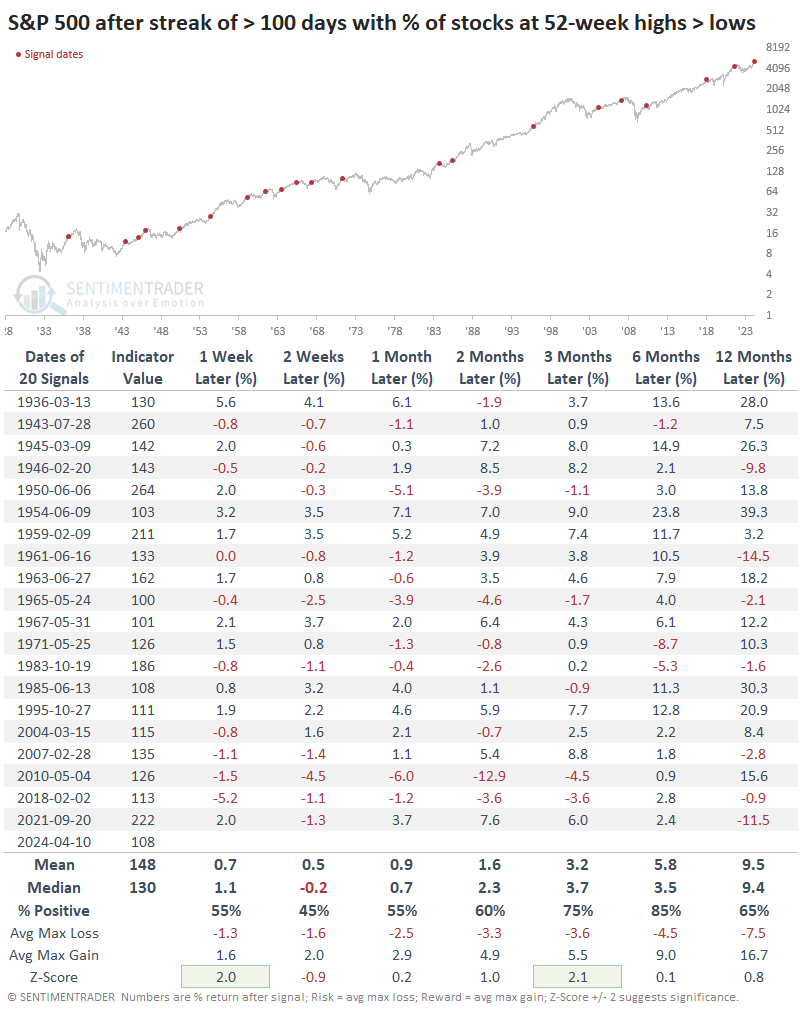
The drop in stocks hitting new highs and rise in one hitting new lows ended the 17th-longest streak of net positive readings since 1928.
Few corrections after long streaks
The table below shows how the S&P performed after ending a streak of going at least 100 sessions with more stocks at new highs than new lows. Over the next couple of weeks, the end of internal momentum weighed on the index, with a negative median return and less than even probability of rising.
But as we've seen so often in various studies, exhibits of prolonged momentum have a strong habit of inducing long-term investors once that momentum wobbles. Six months after these streaks ended, the S&P suffered only 3 losses out of 20 precedents. All three losses were relatively minor and essentially the lows for months afterward.
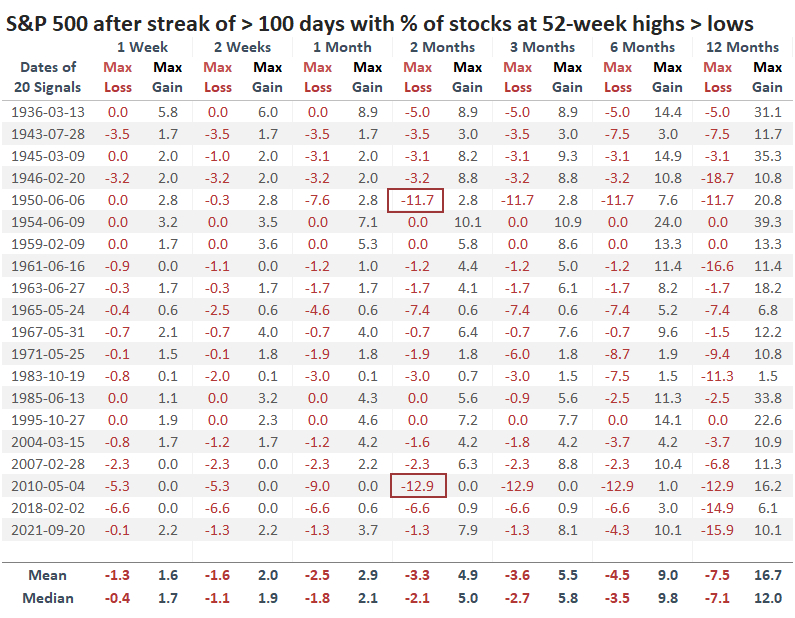
A table of maximum gains and losses across time frames shows us that only two instances preceded further losses of -10% or more within the next six months. Both of those, in 1950 and 2010, sold off heavily within the first month of the signal and reached their maximum drawdowns within the first two months. After that, they rebounded strongly.
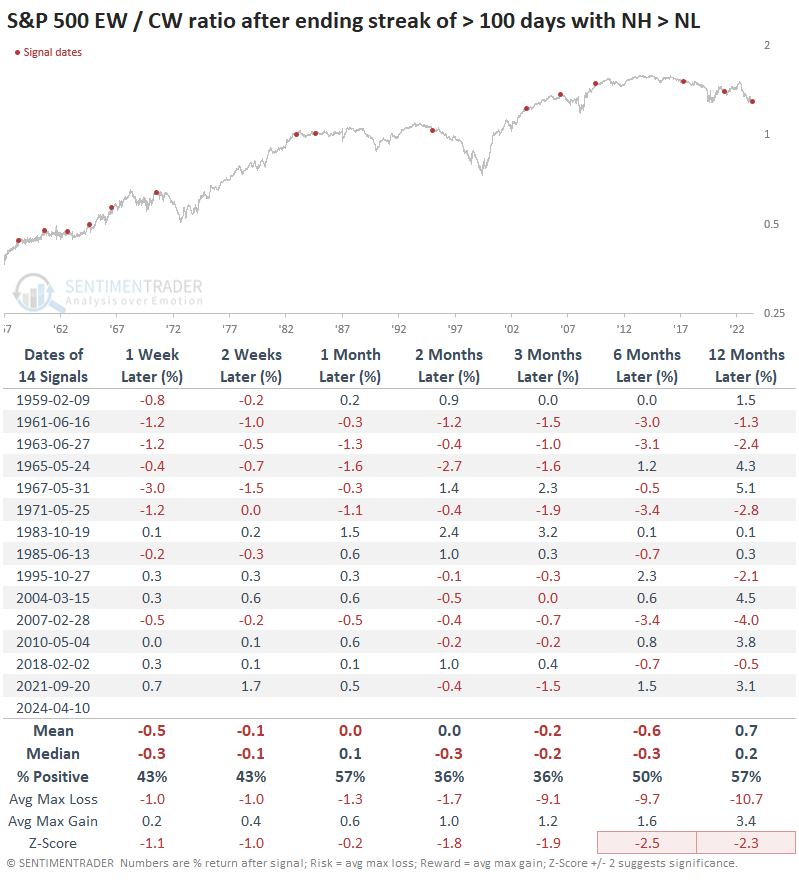
The average stock
The average stock in the S&P 500 has been underperforming the index, at least when looking at the performance of the equal-weight S&P index versus its much more commonly cited capitalization-weight brother.
While there are few precedents, when the relationship between the two versions of the index became as stretched as earlier this year, the equal-weight version has tended to underperform. However, now that we're seeing signs of stress within the index, that tendency for a relative rebound becomes more suspect.
Below, we can see returns in the ratio between the equal-weight S&P and the cap-weight S&P after new 52-week lows started to dominate. Across all time frames, the ratio underperformed any random time and showed a strong tendency to decline over the next two to three months. Most of these were triggered after rallies in the equal-weight index, which is definitely not the case now, so it may be less reliable as a signal.
What the research tells us...
There have been precious few signs of weakness in the S&P 500 for nearly six months. Across all the different ways we look at the index, it has really done nothing "wrong" since the October 2023 bottom. There are only nascent displays of internal weakness now showing up, none of which are particularly concerning just yet - mostly, it looks like a normal breath after a historical stampede of positive momentum.
With an index of stocks like the S&P 500, the most benchmarked in the world, initial signs of weakness after remarkable momentum runs have a strong tendency to attract long-term investors. There are very few examples of persistent momentum immediately leading to corrections or even deep pullbacks. Usually, any further drawdown is limited to -5% or even less, with few exceptions.
Indicators at Extremes
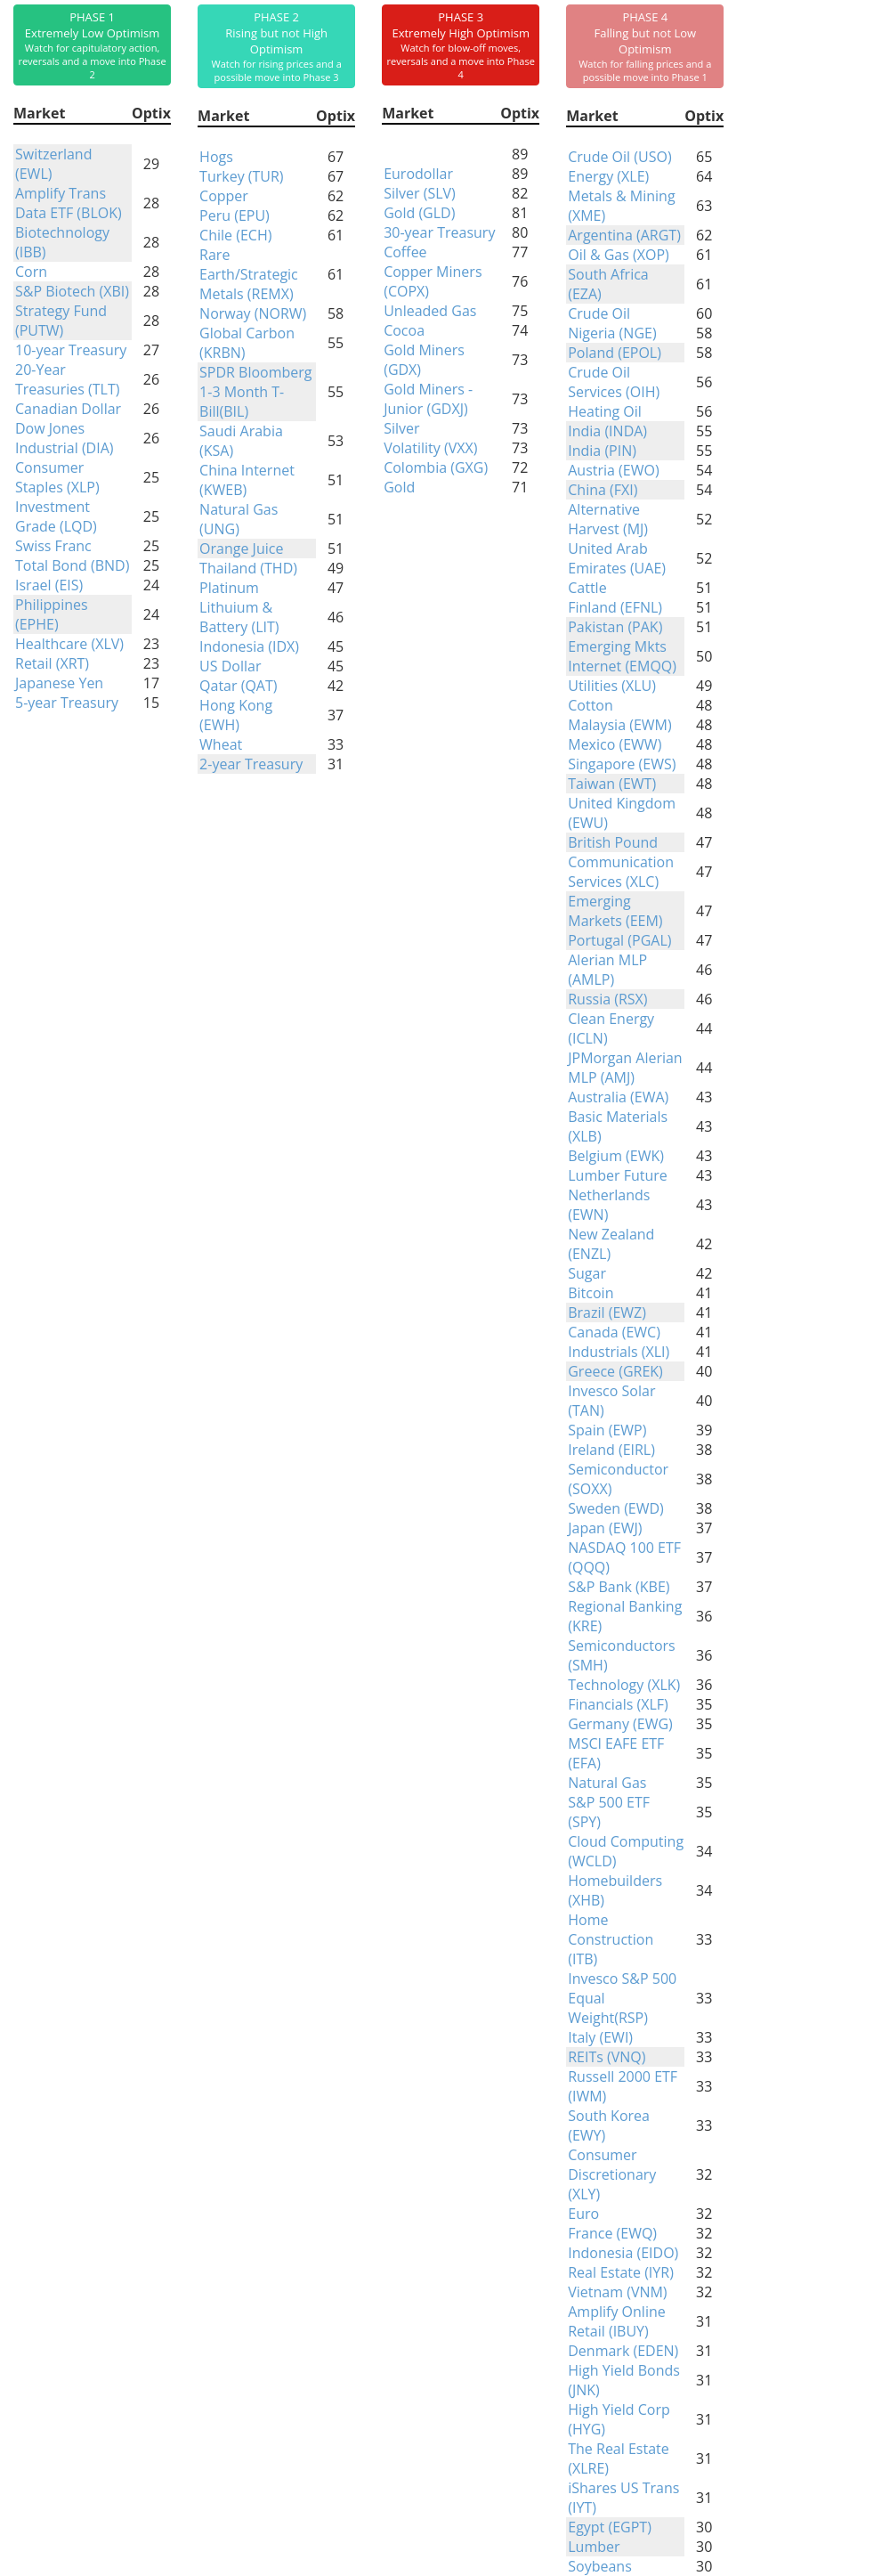
Phase Table
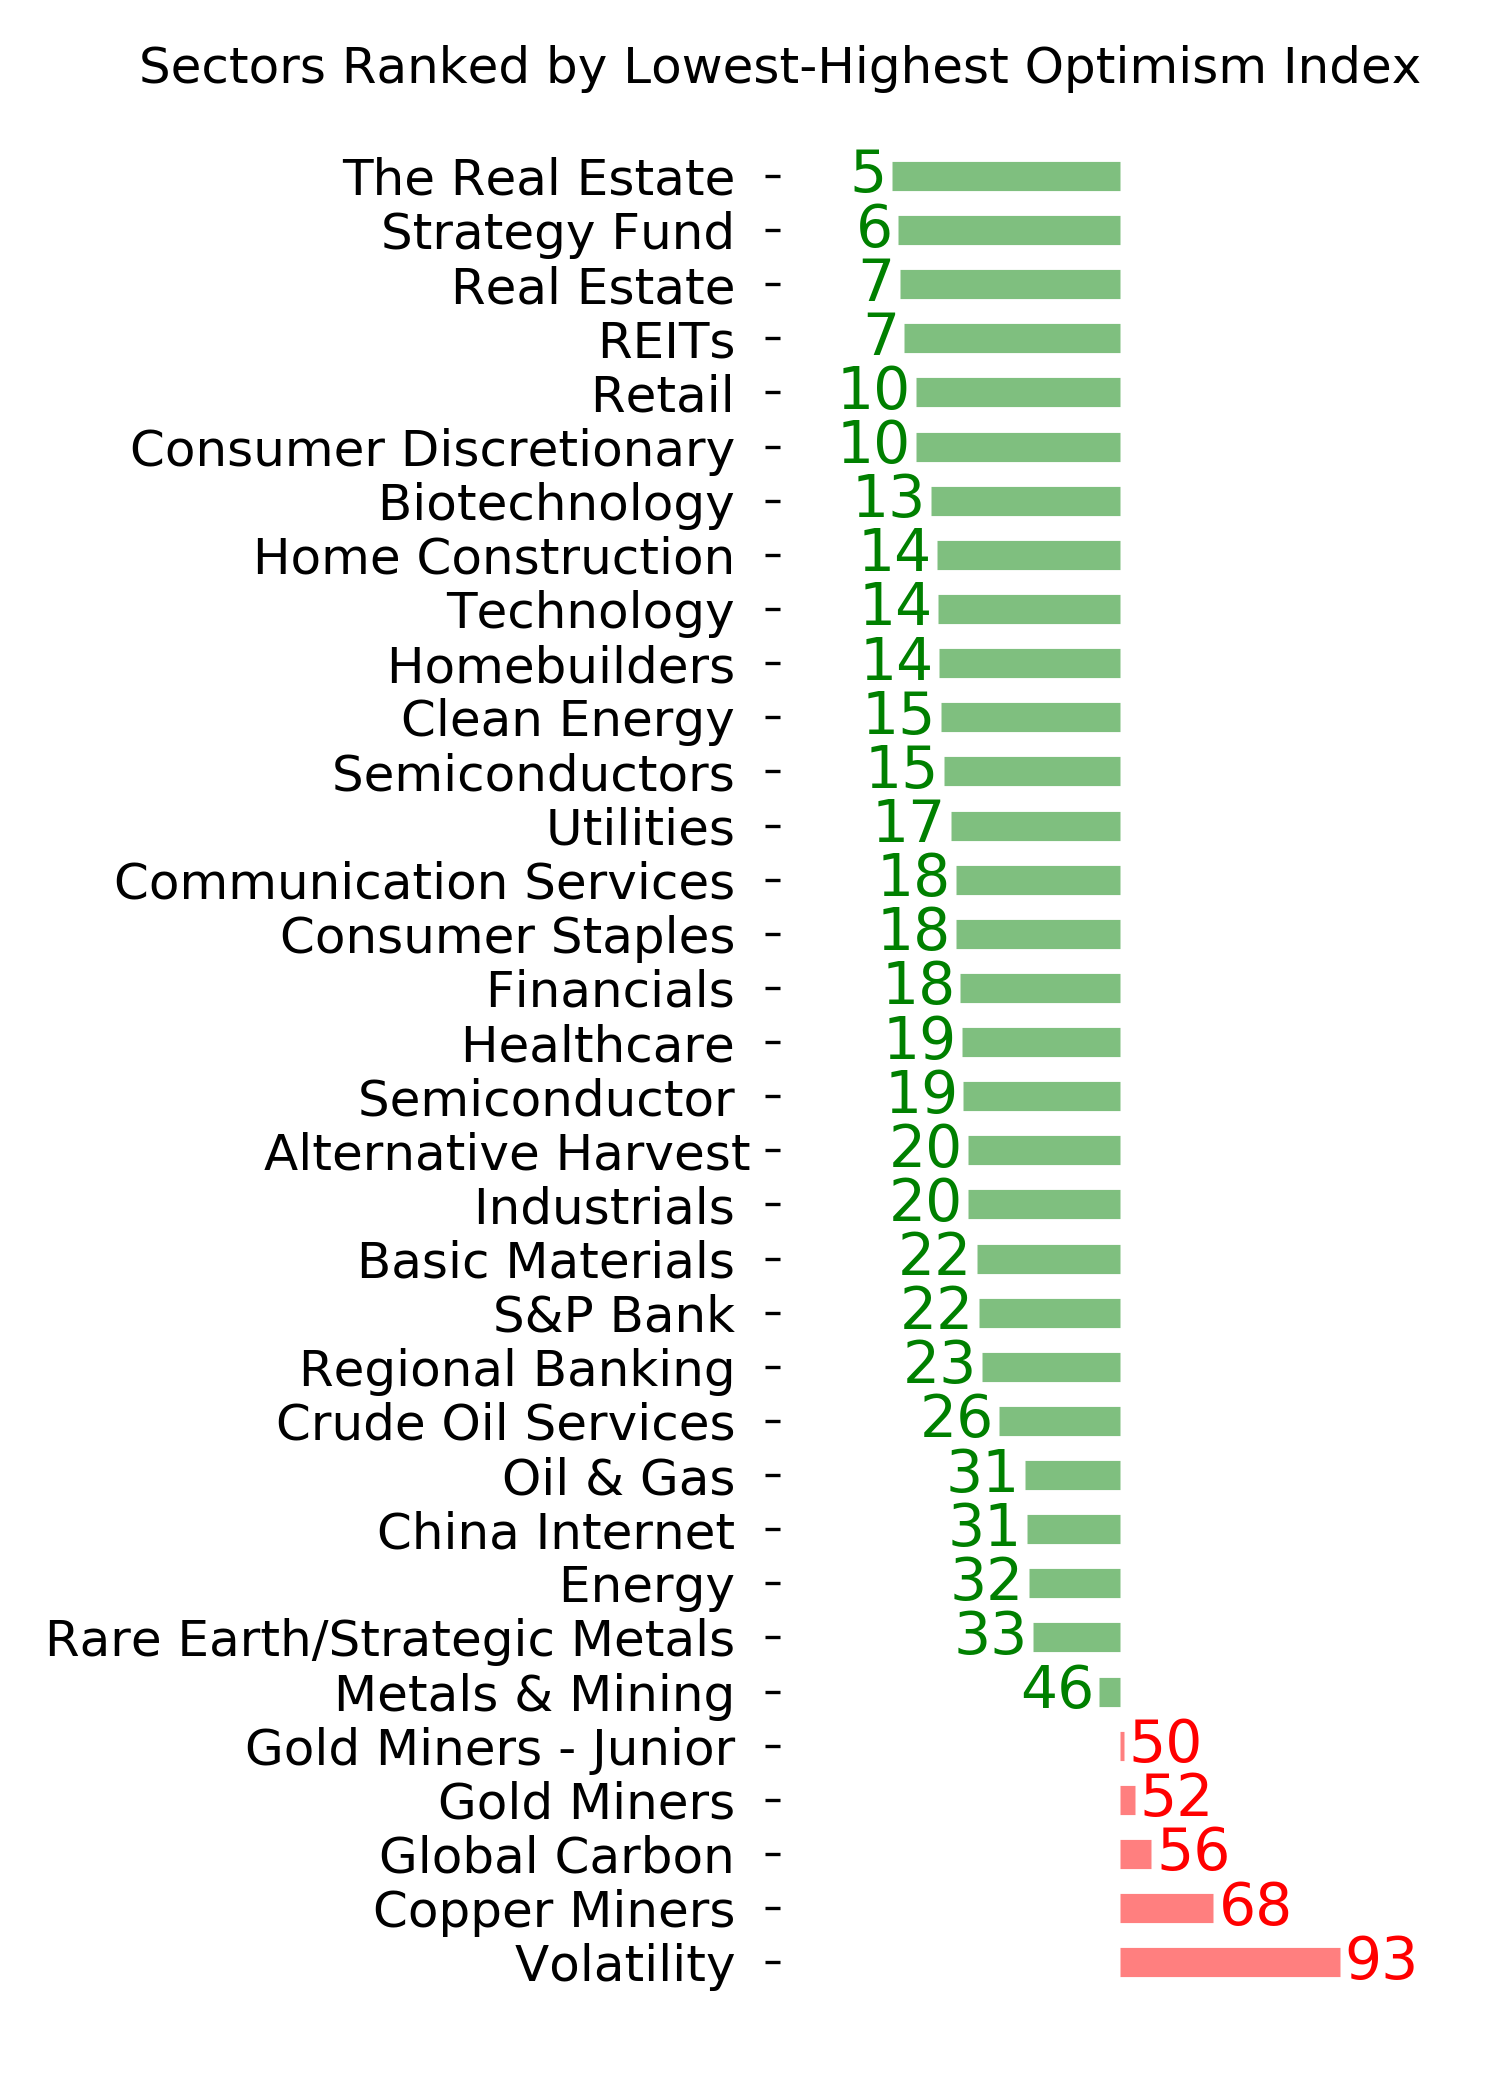
Ranks
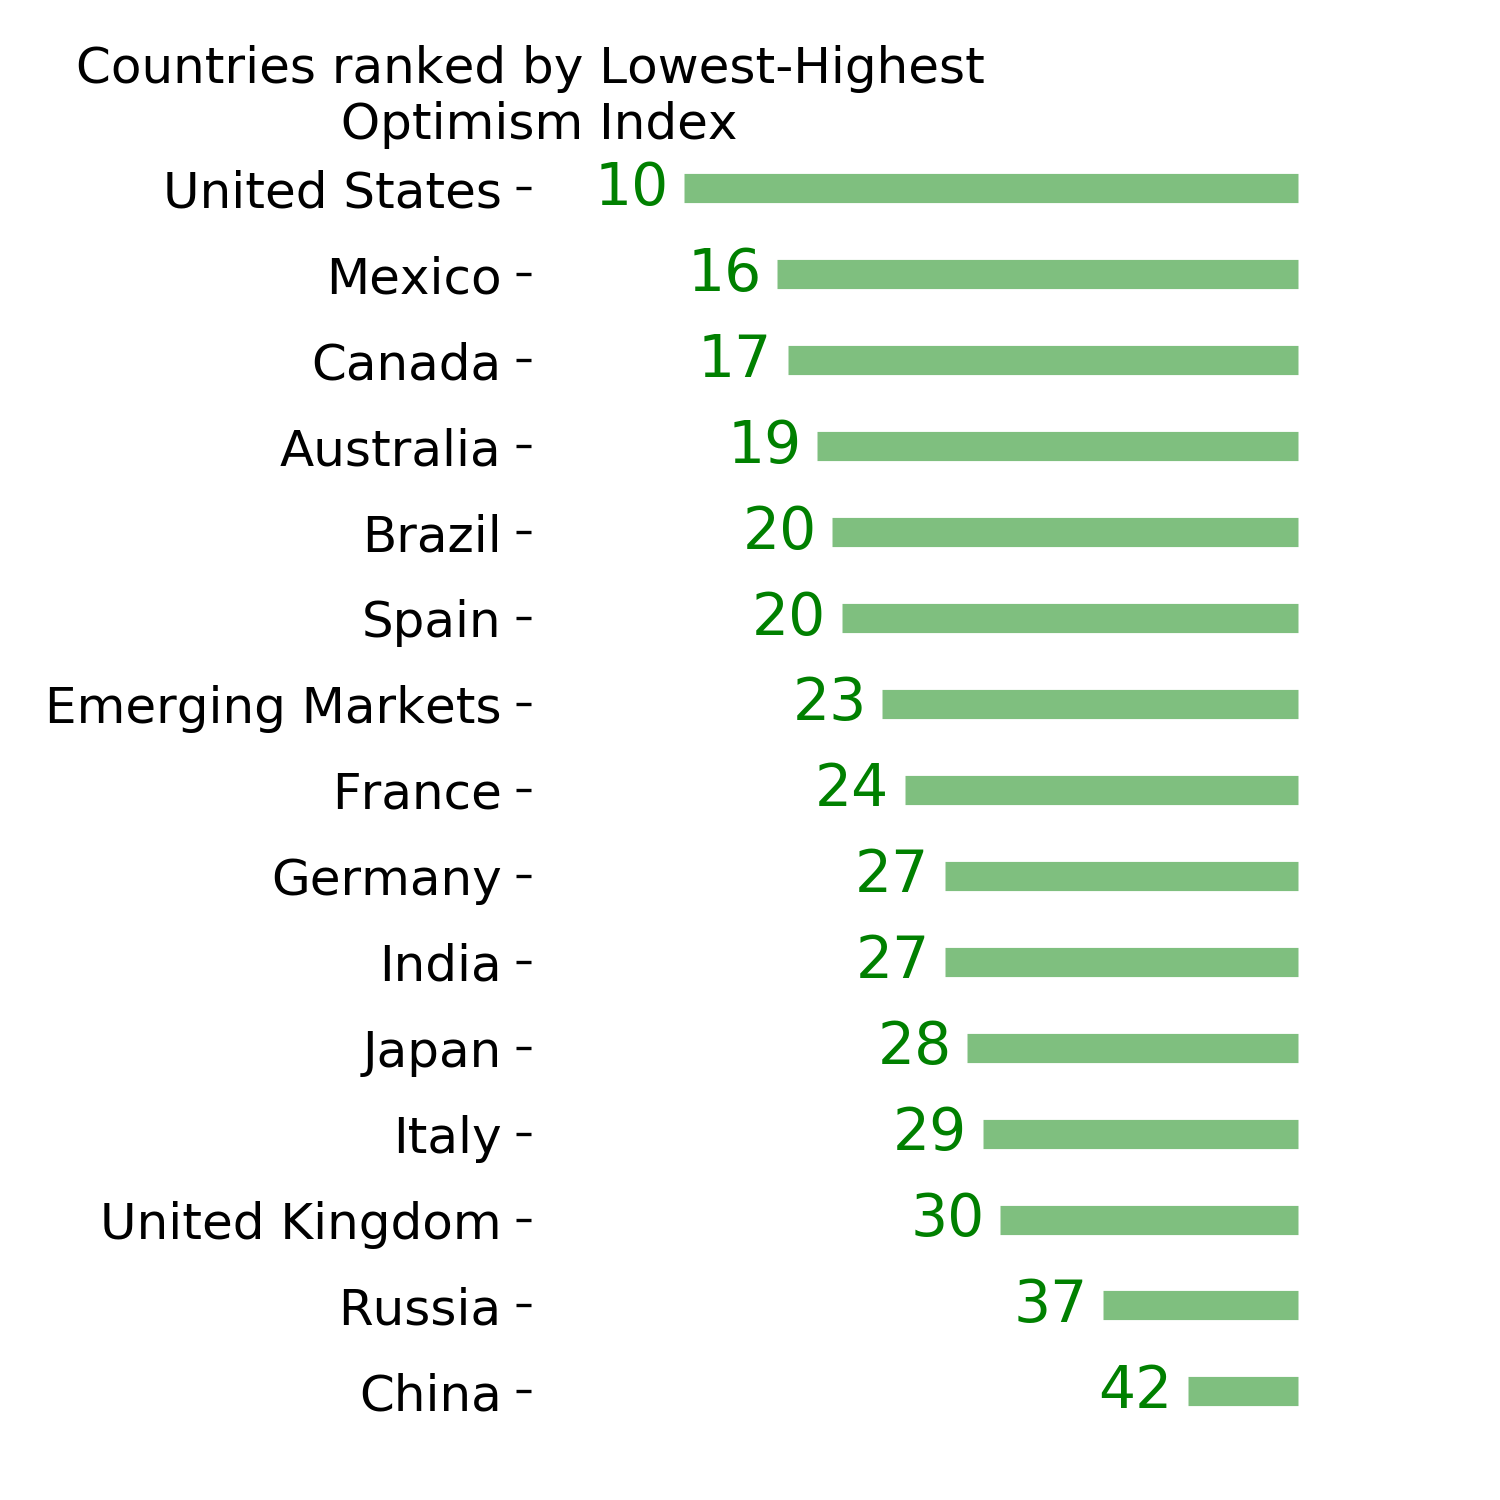
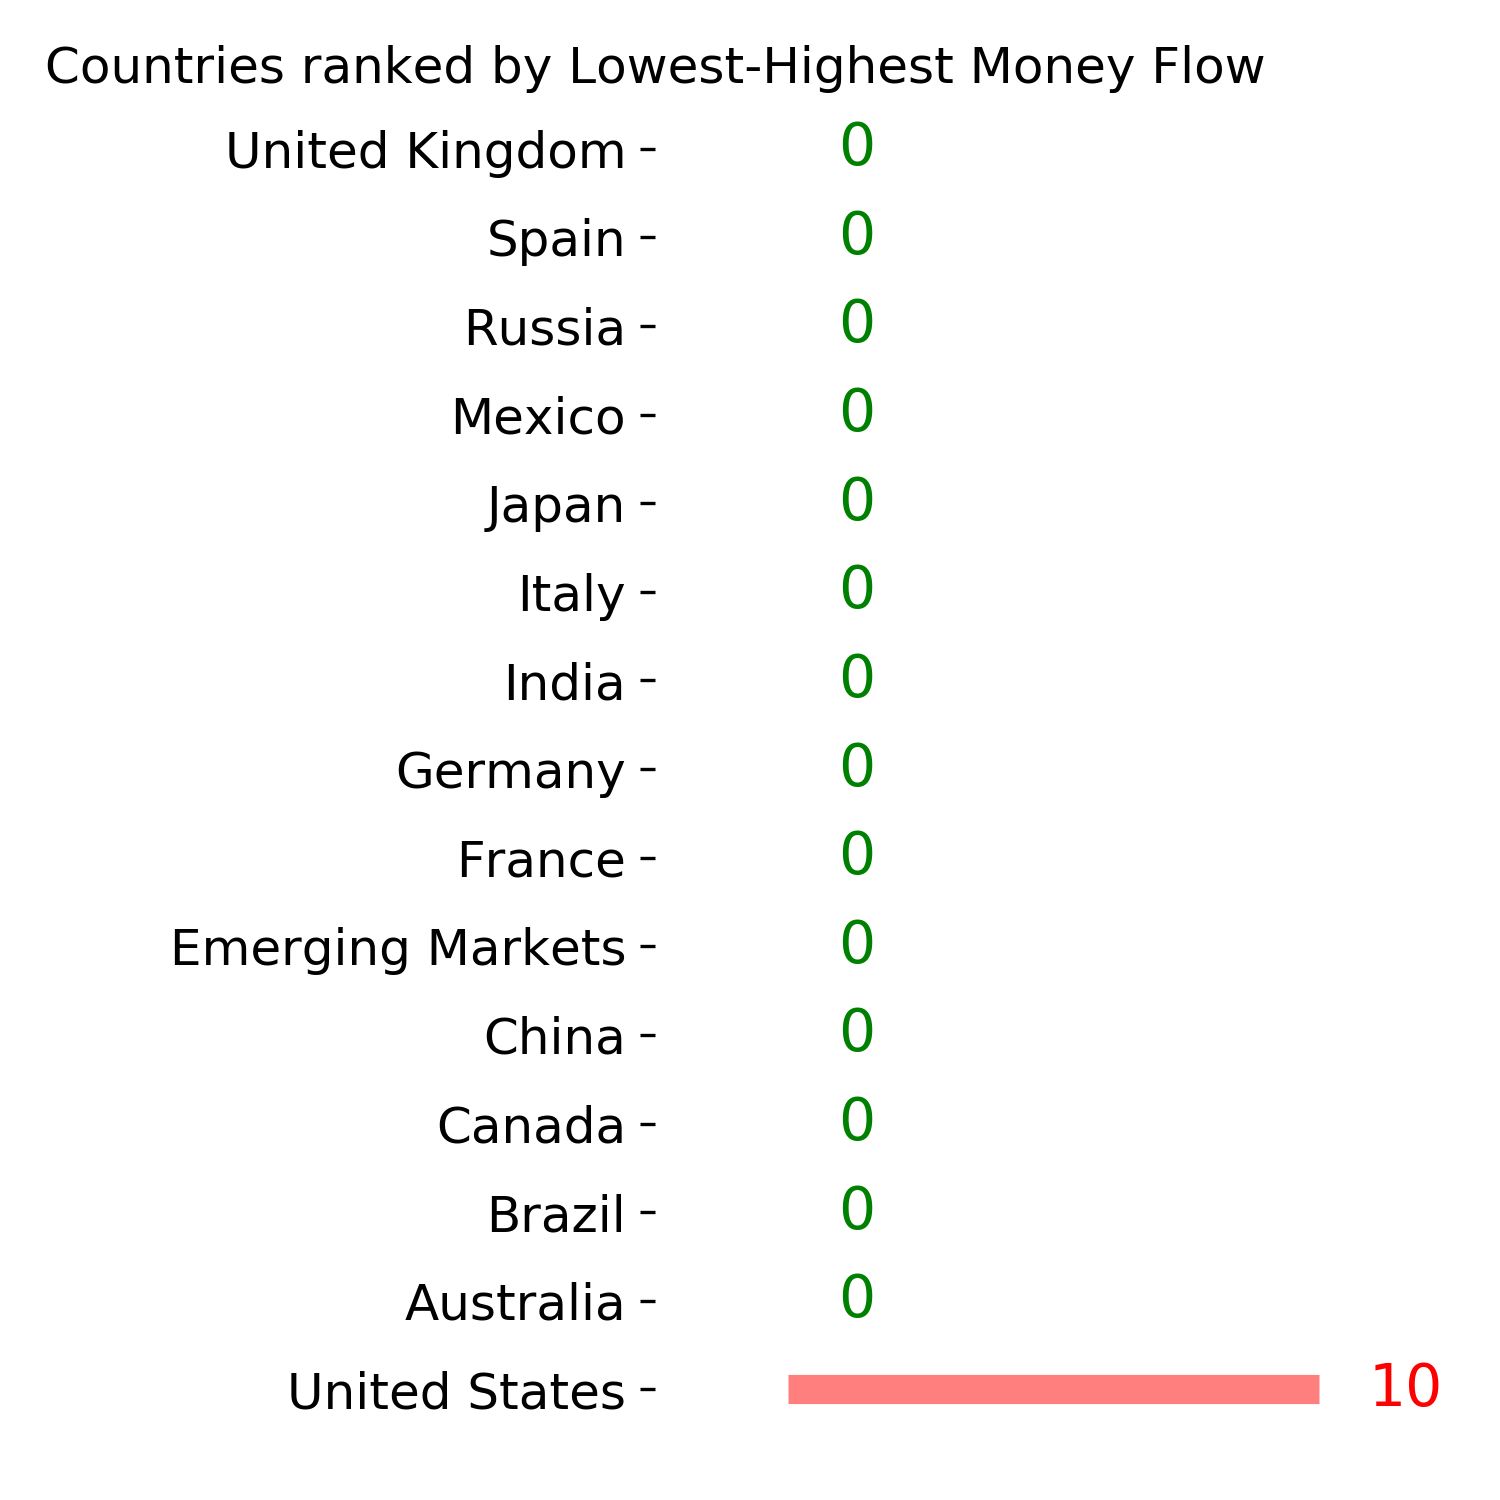
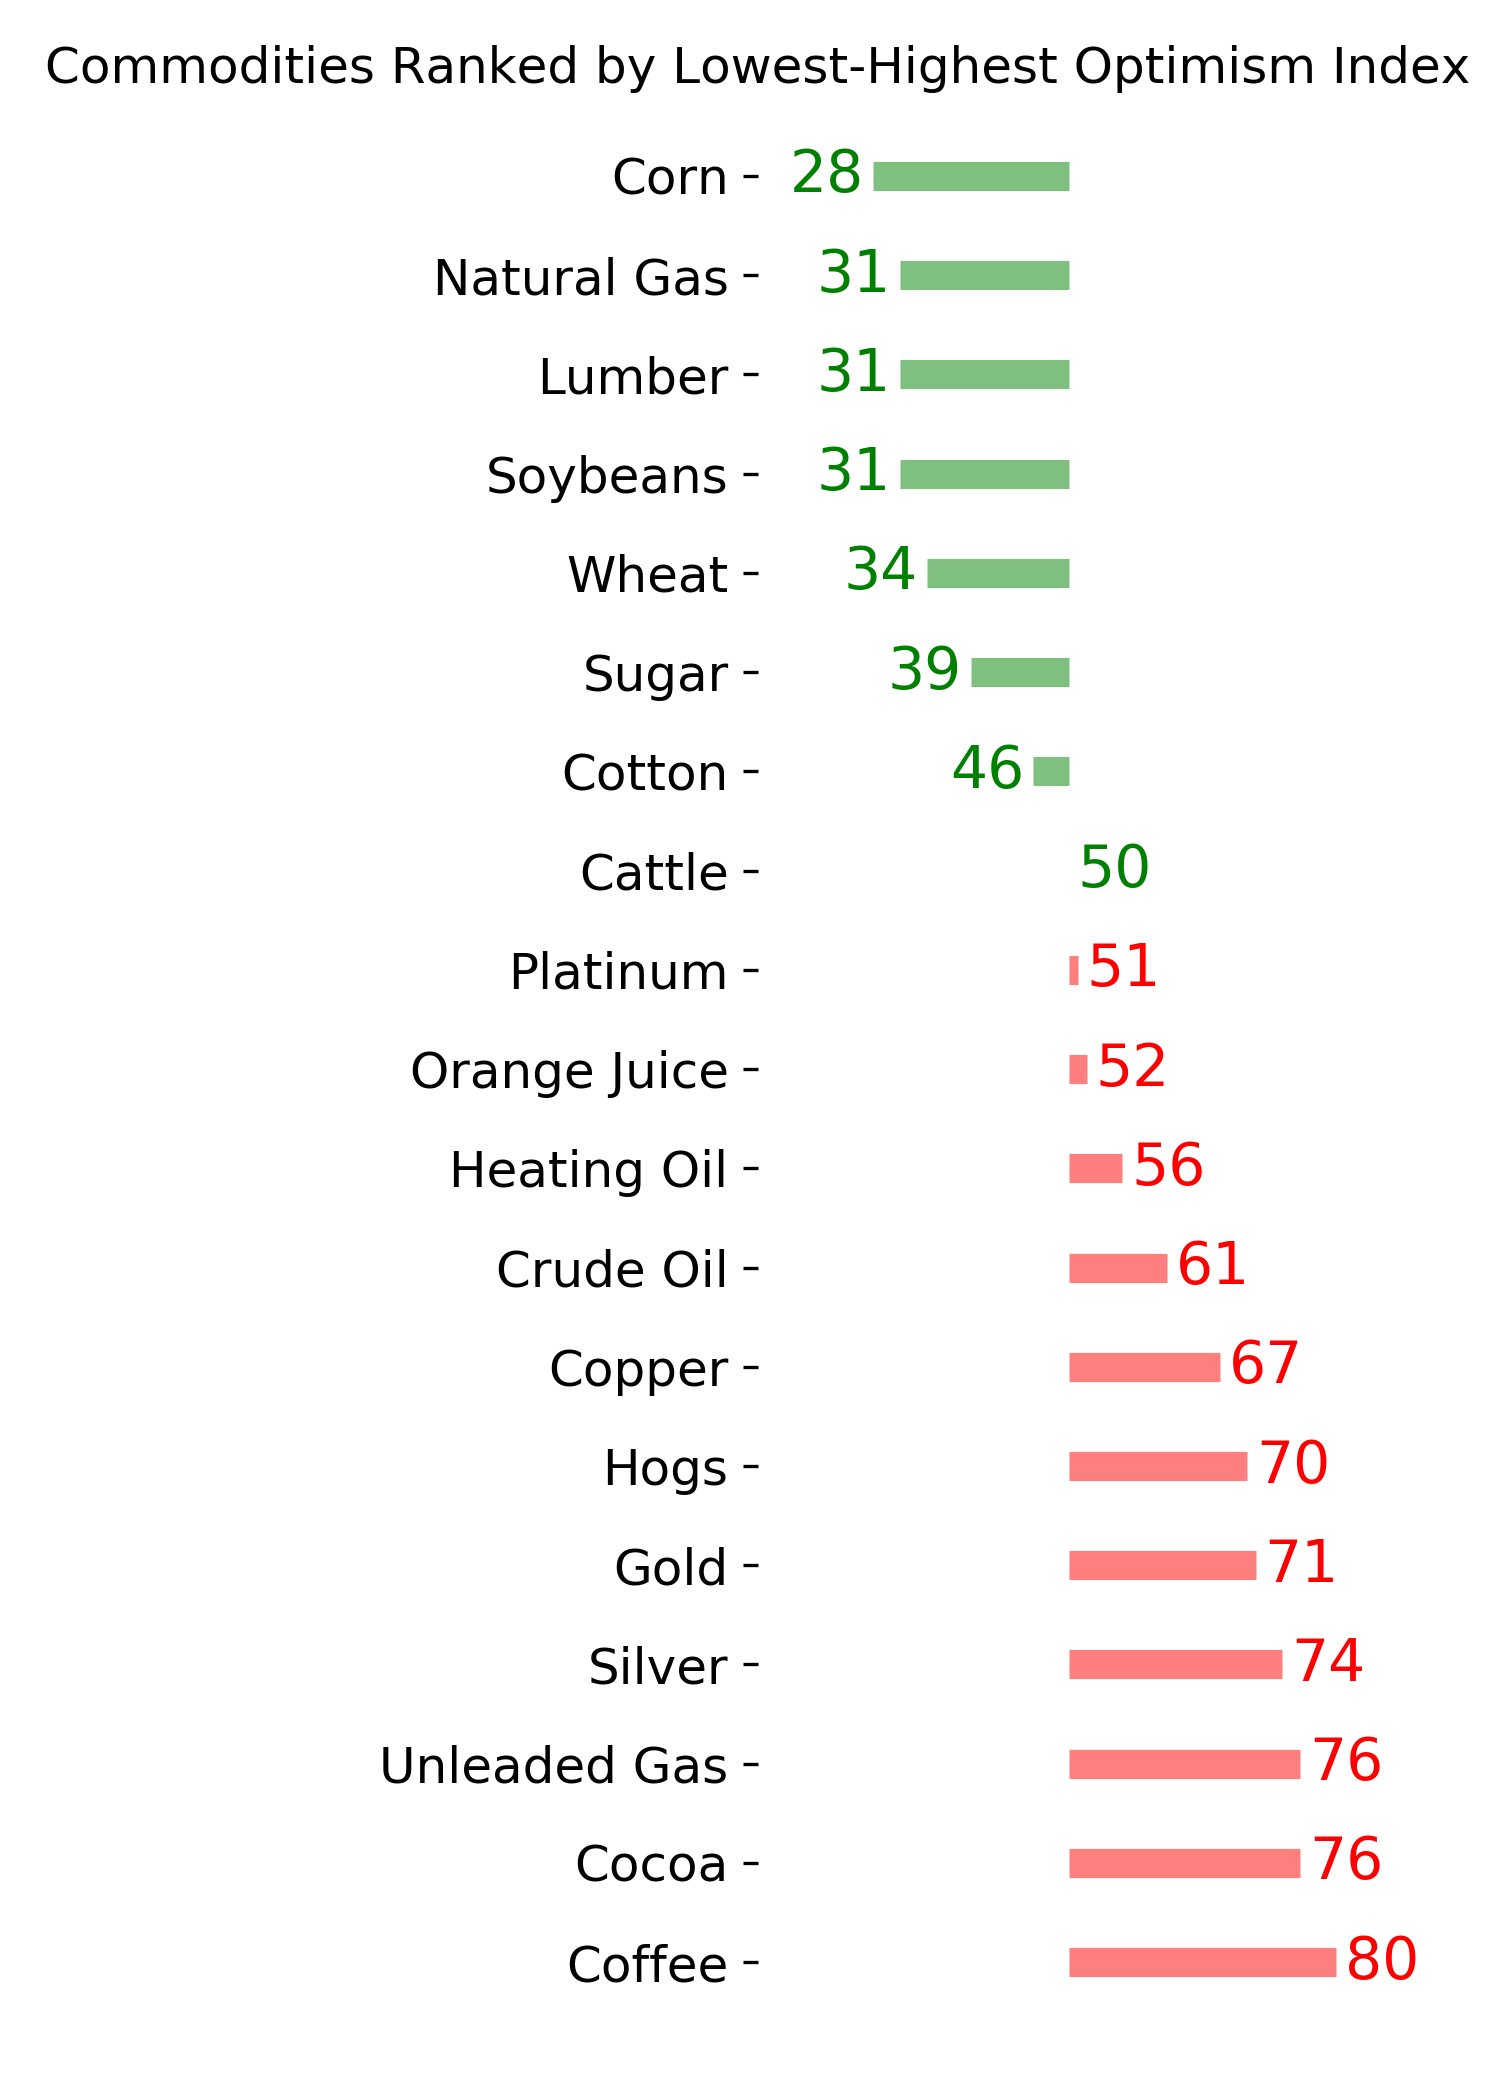
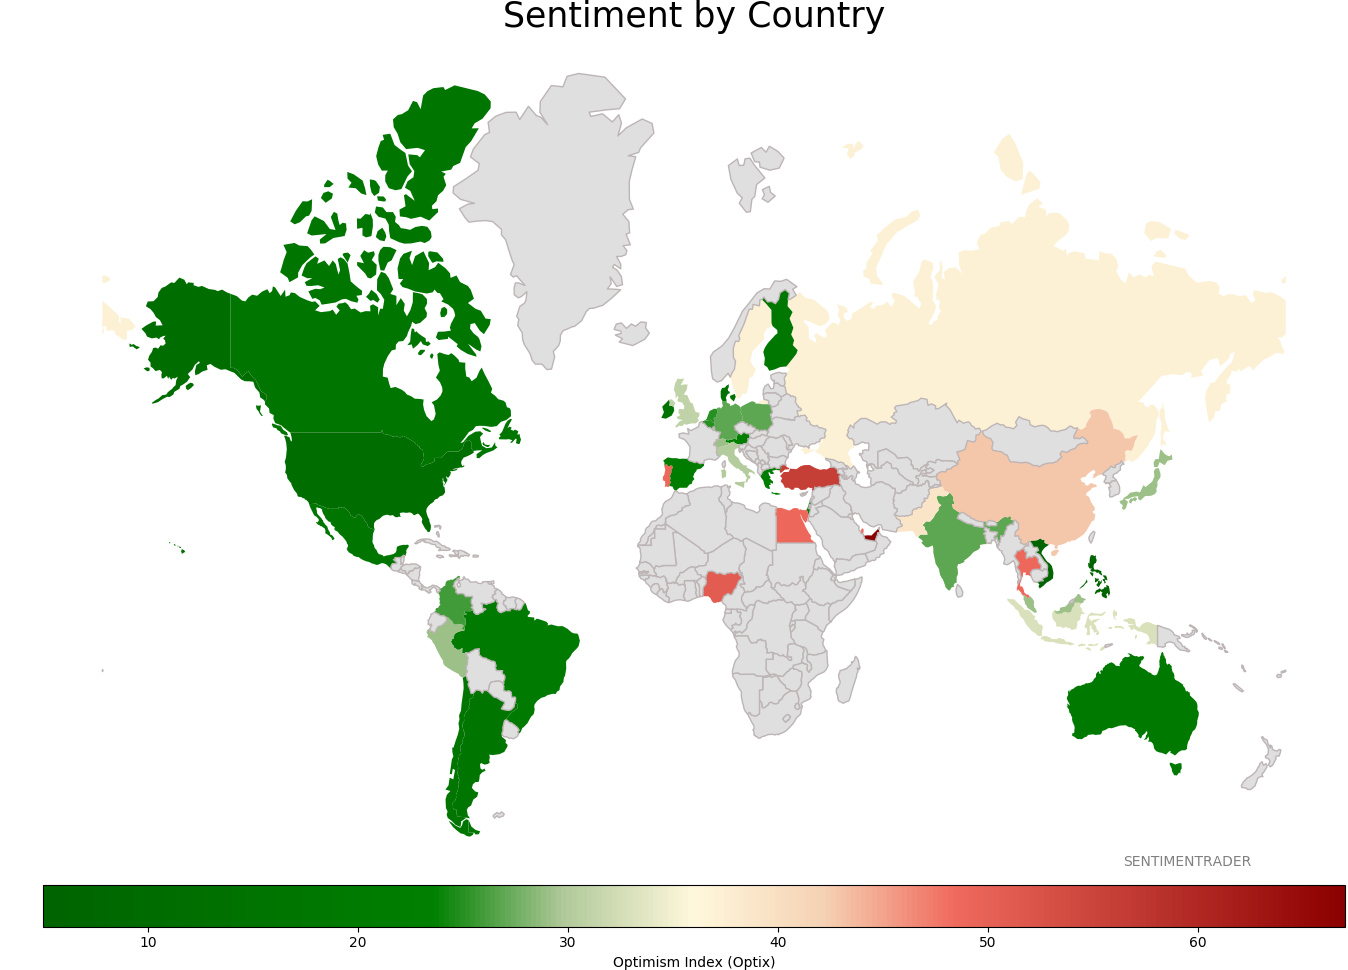
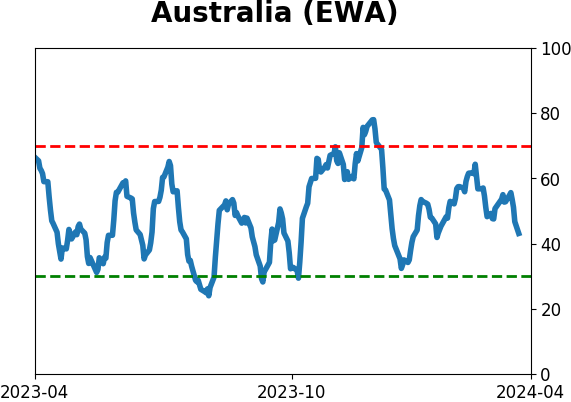
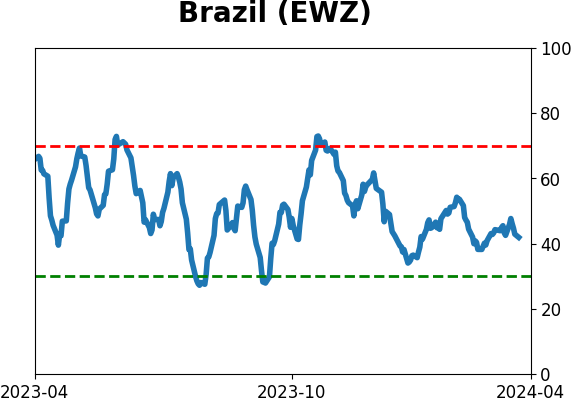
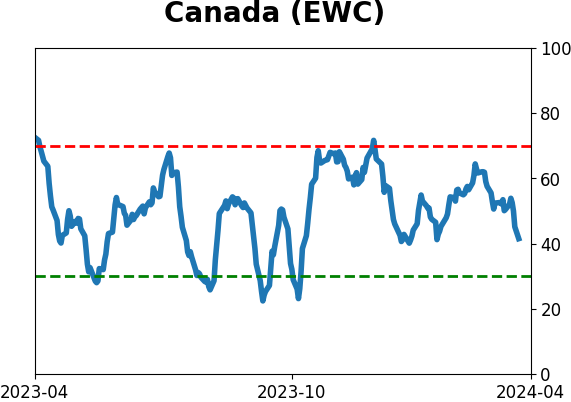
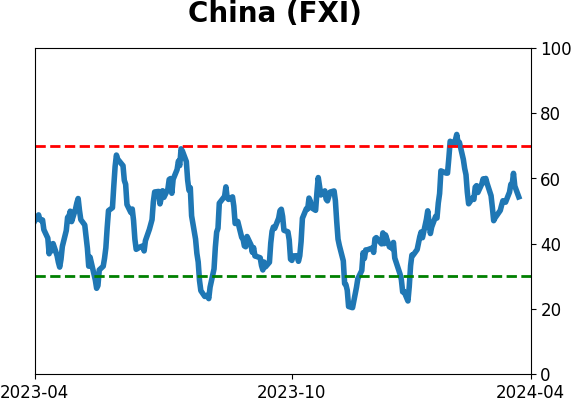
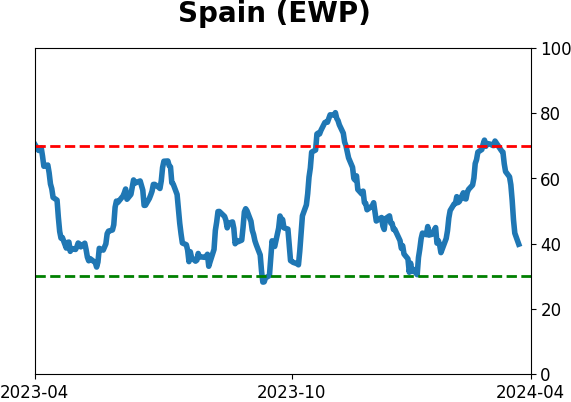
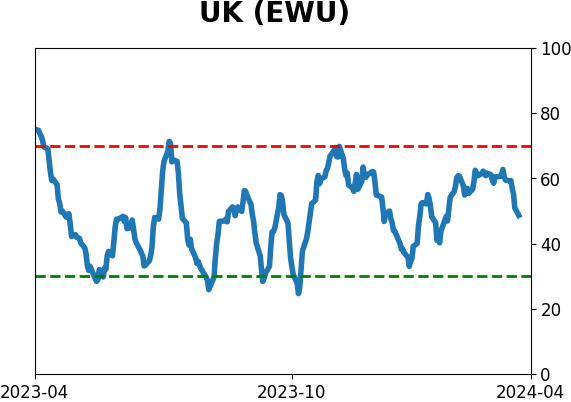
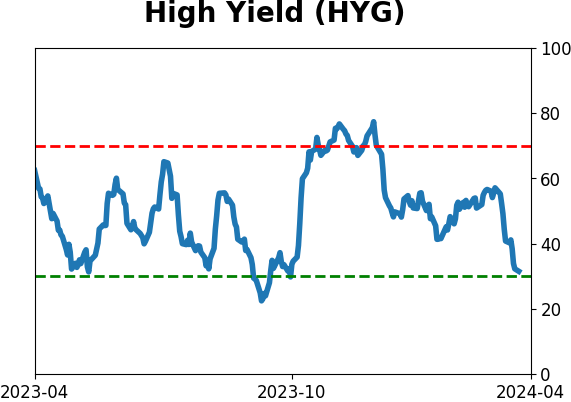
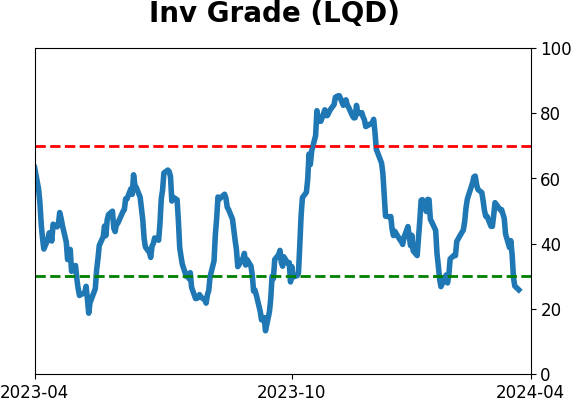
Sentiment Around The World
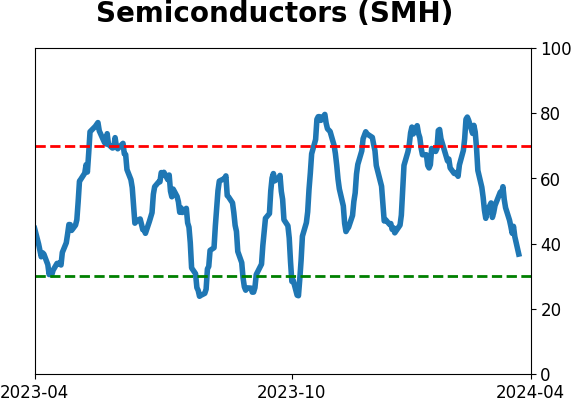
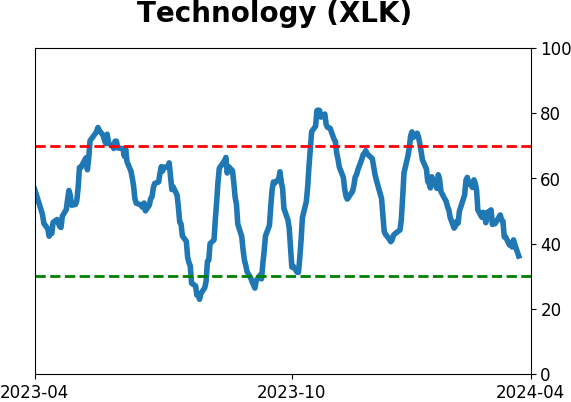
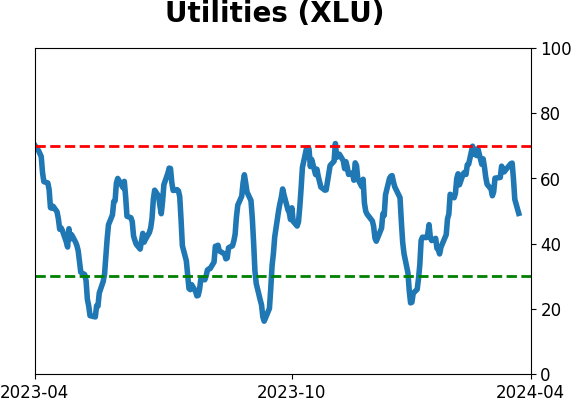
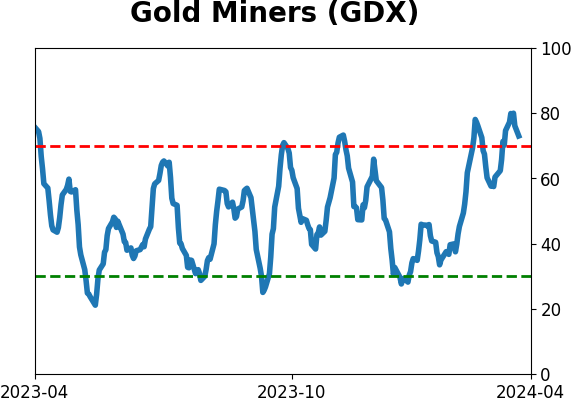
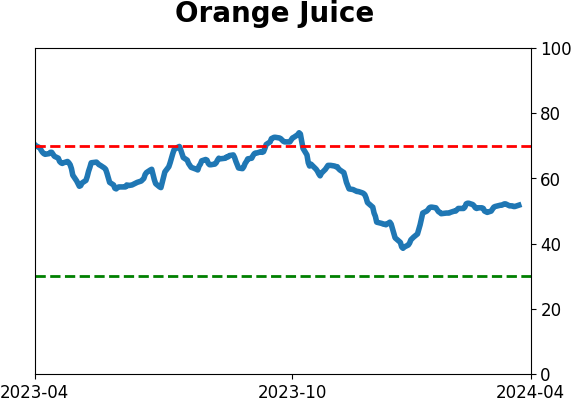
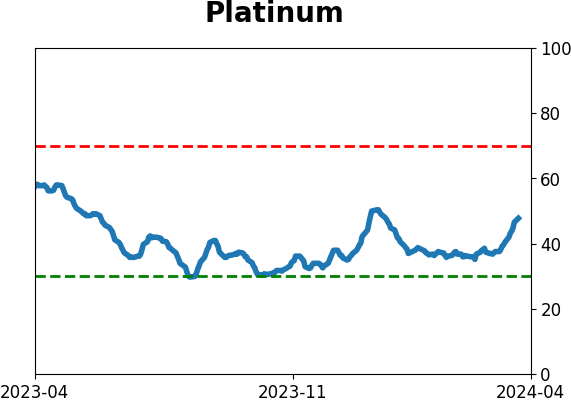
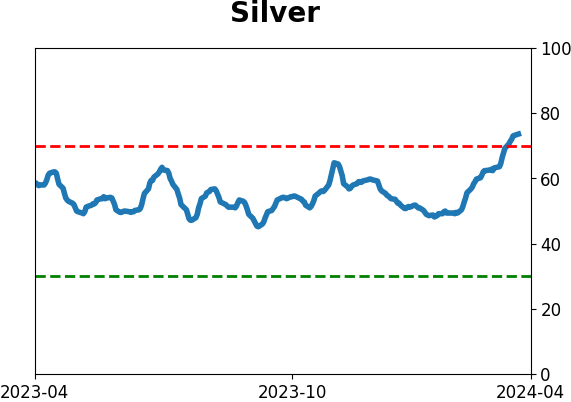
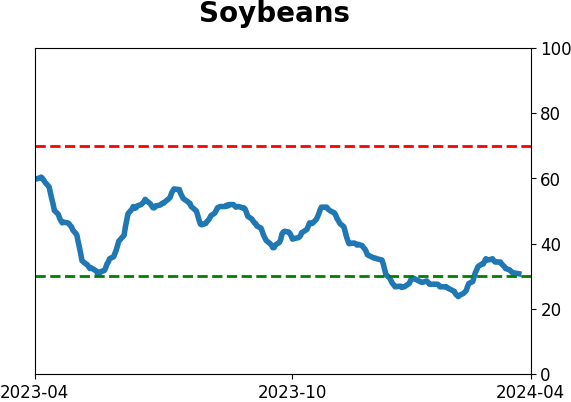
Optimism Index Thumbnails
|
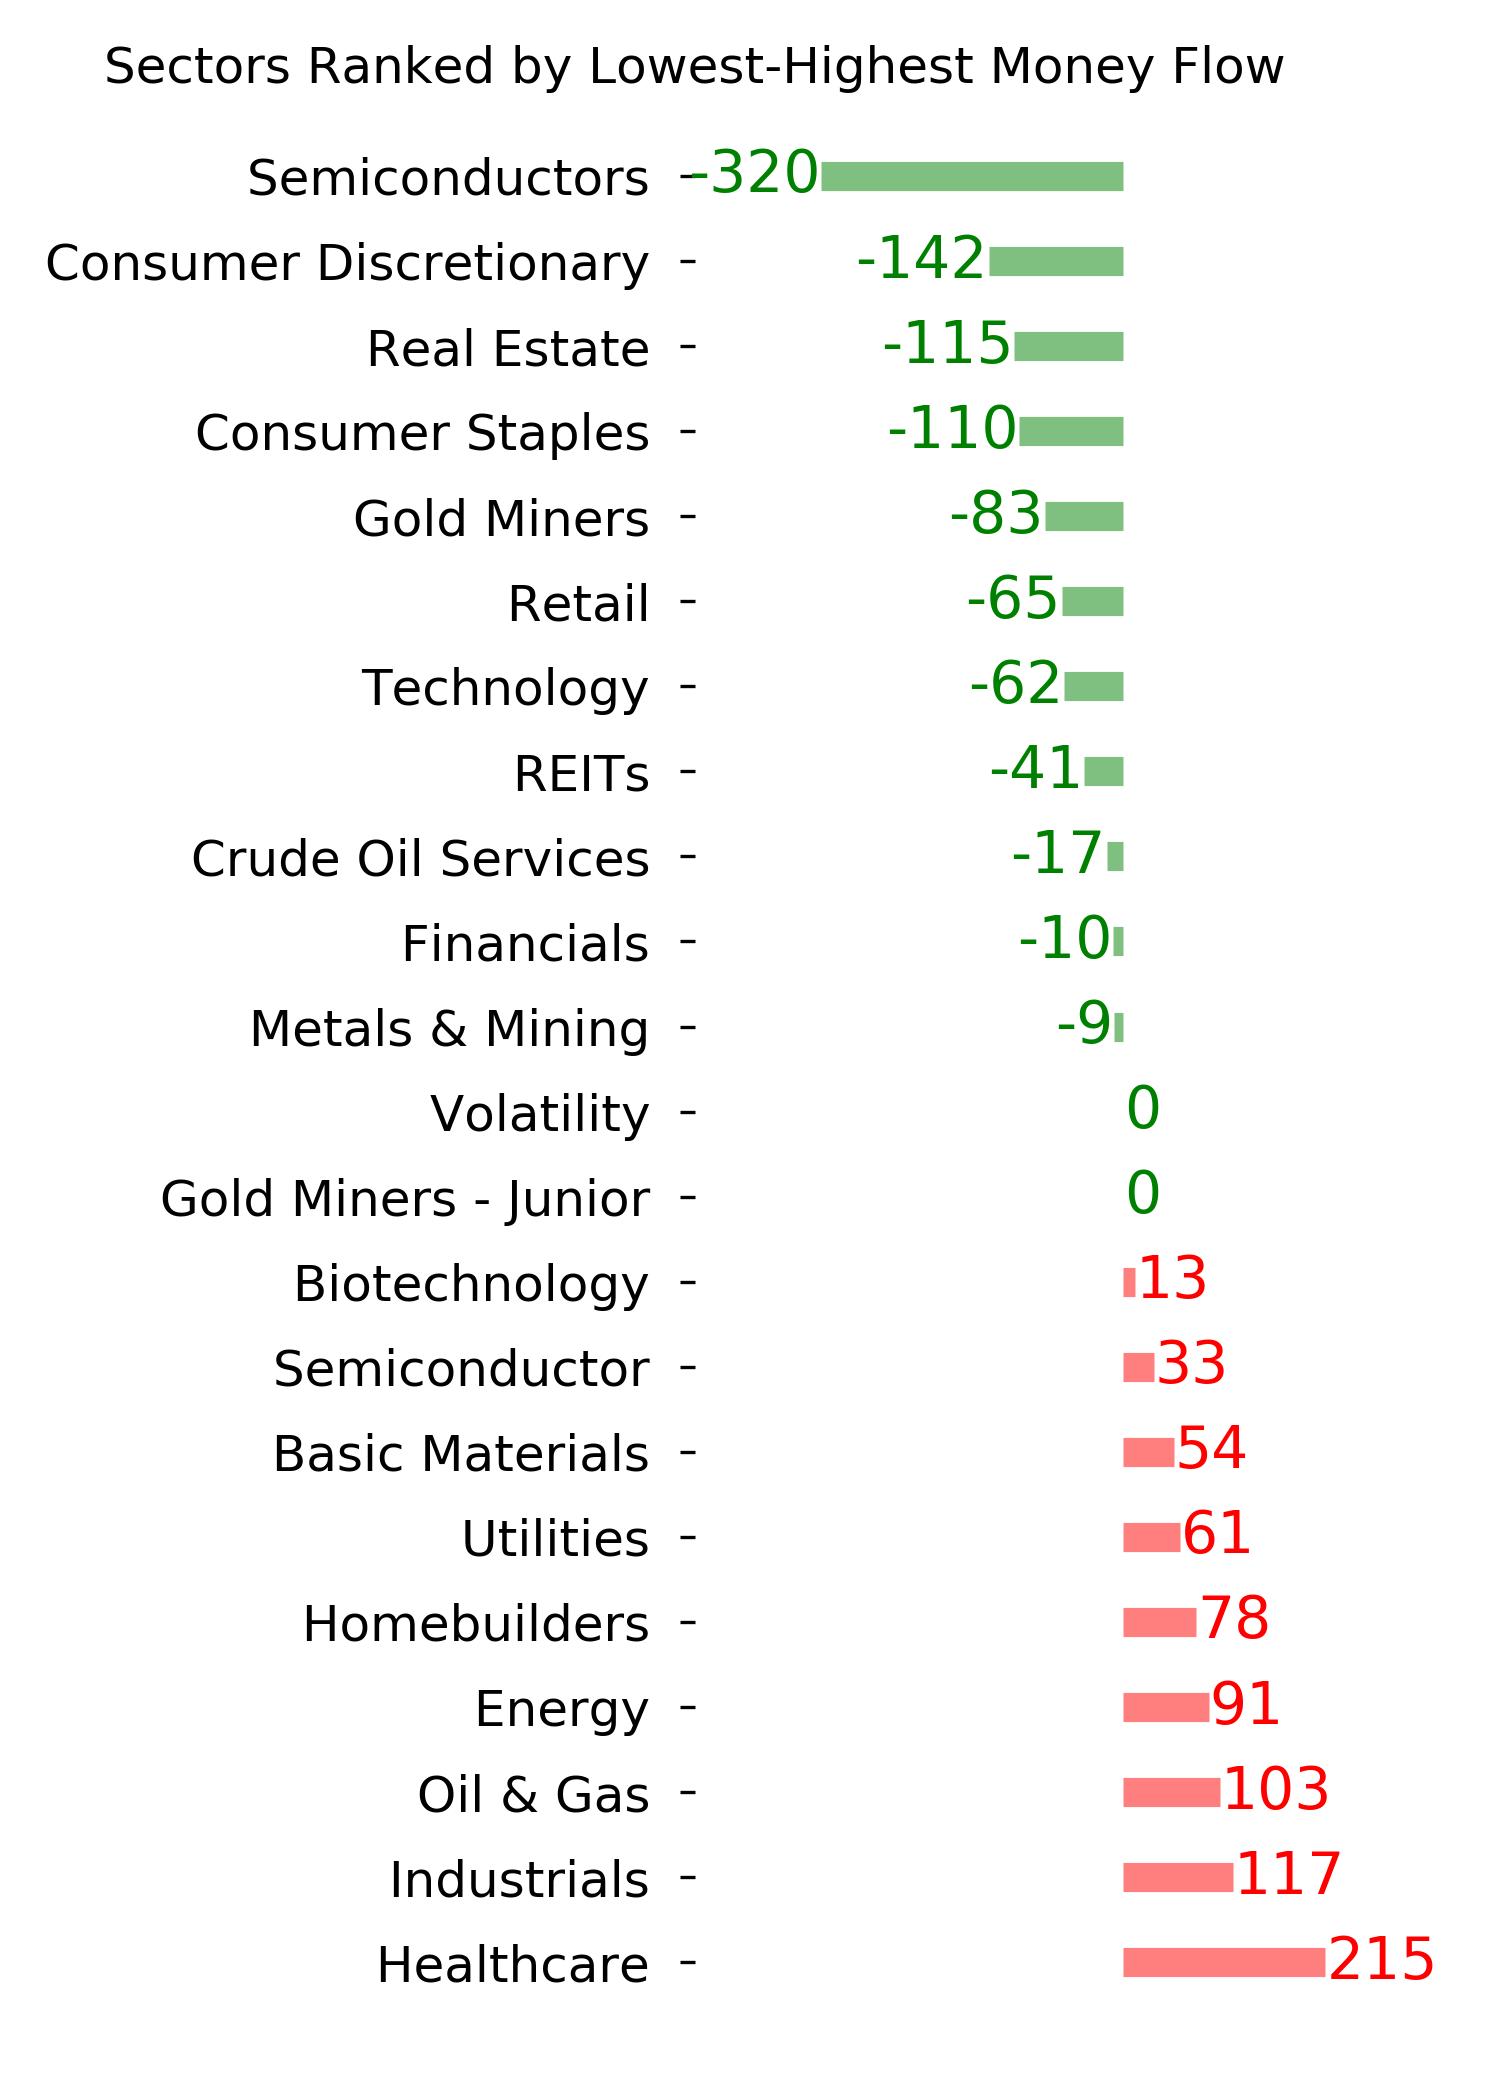
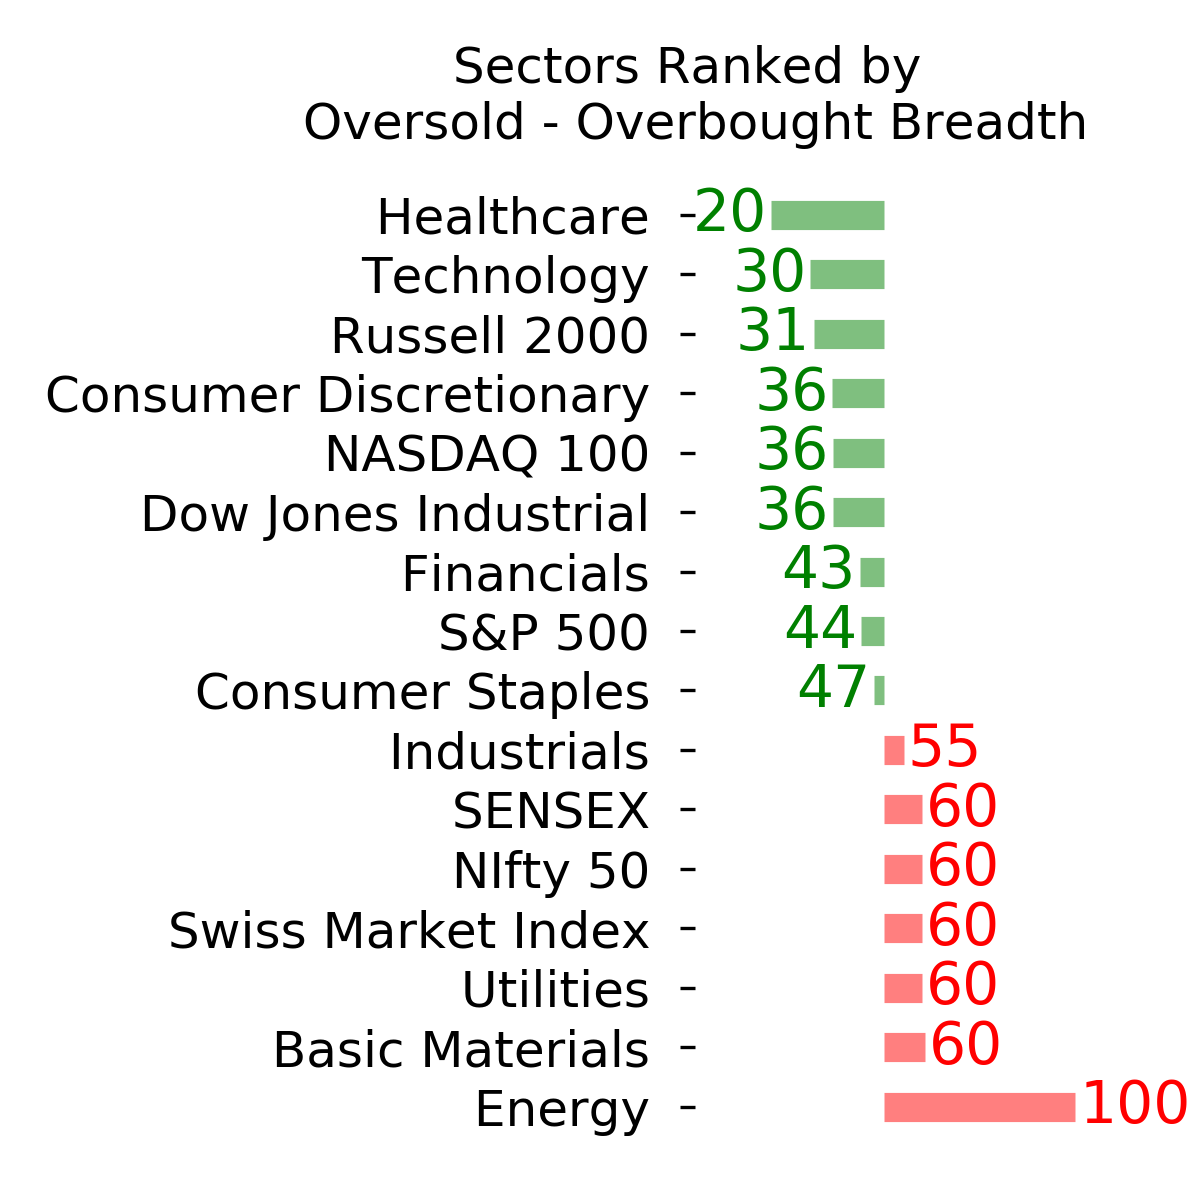
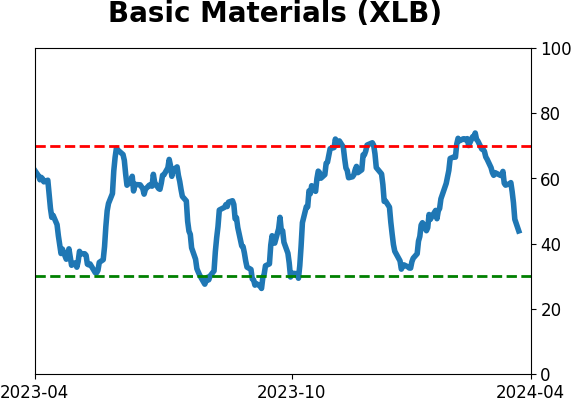
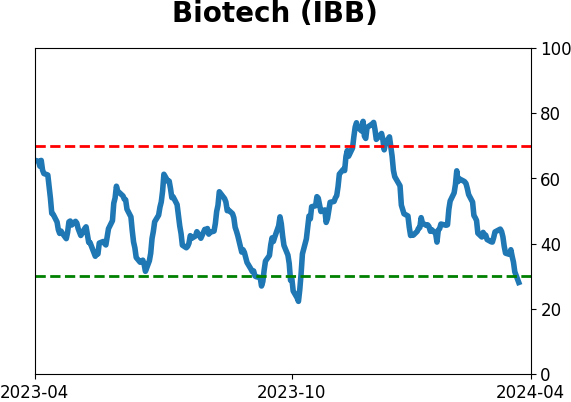
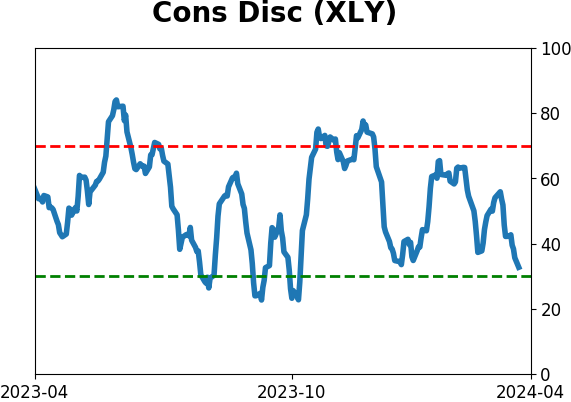
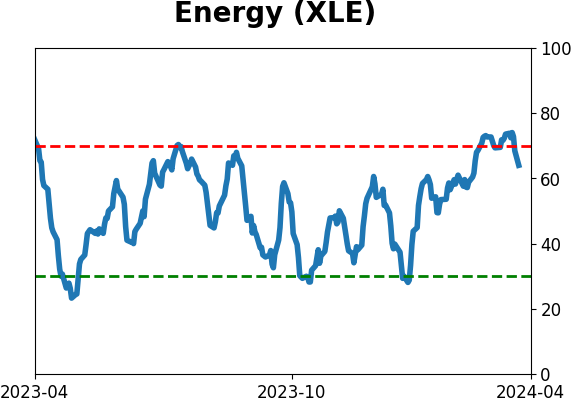
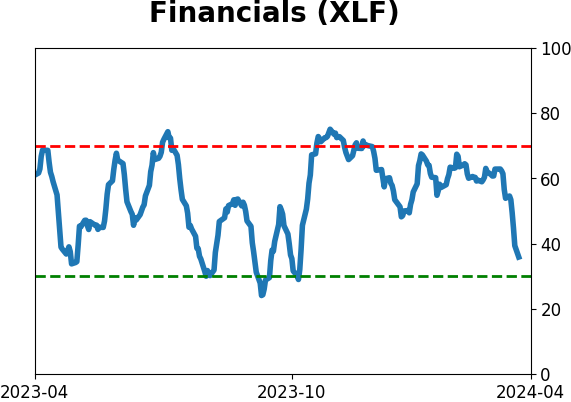
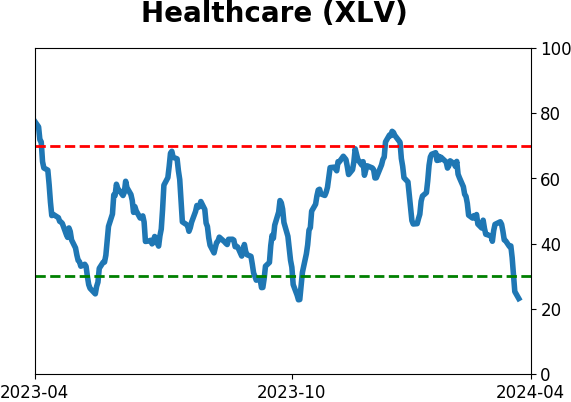
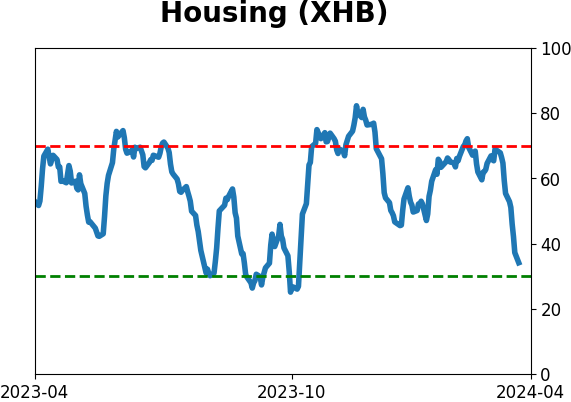
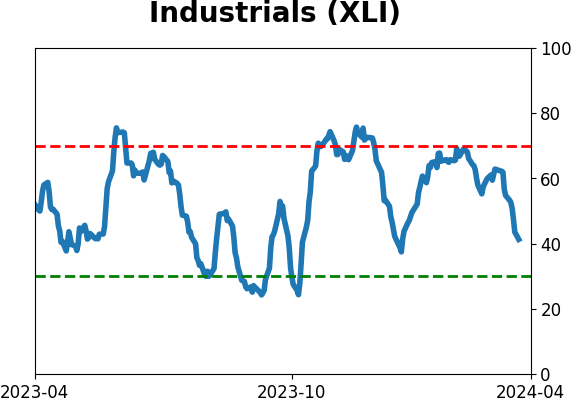
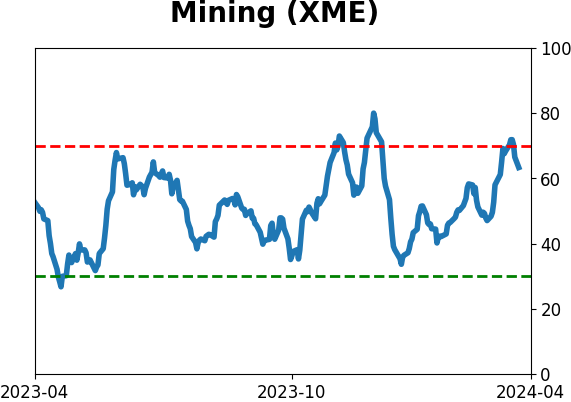
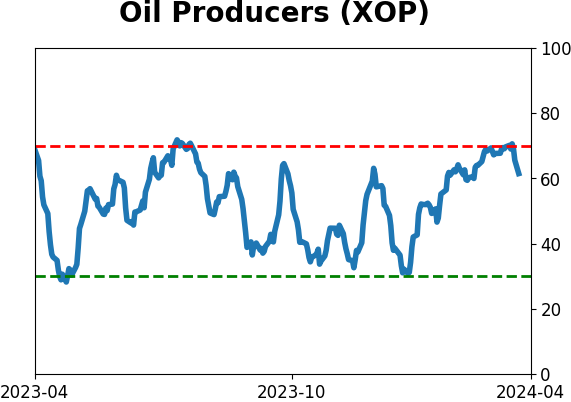
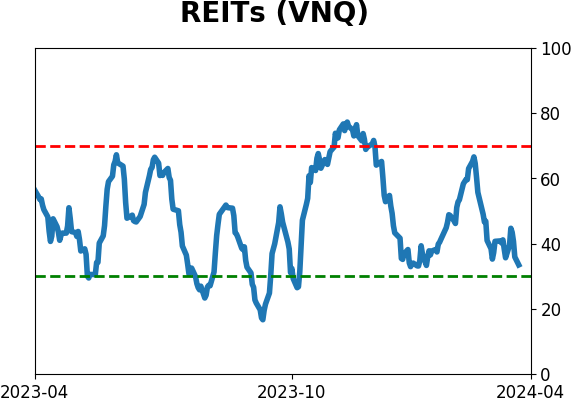
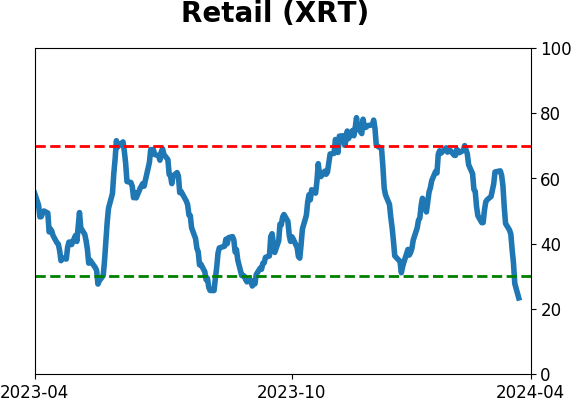
Sector ETF's - 10-Day Moving Average
|
|
|
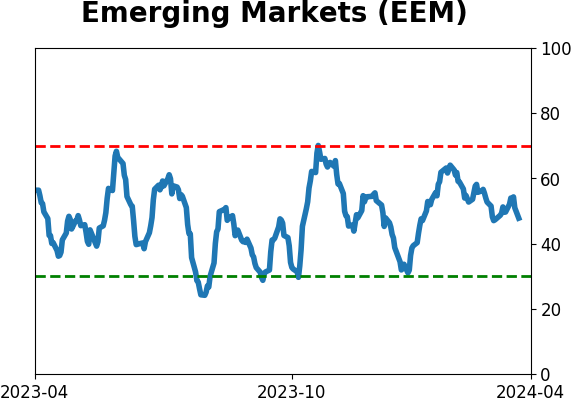
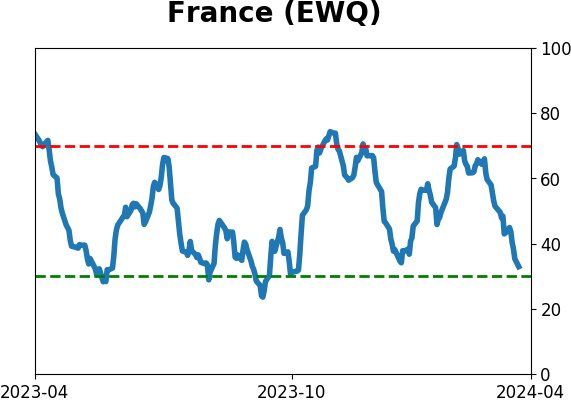
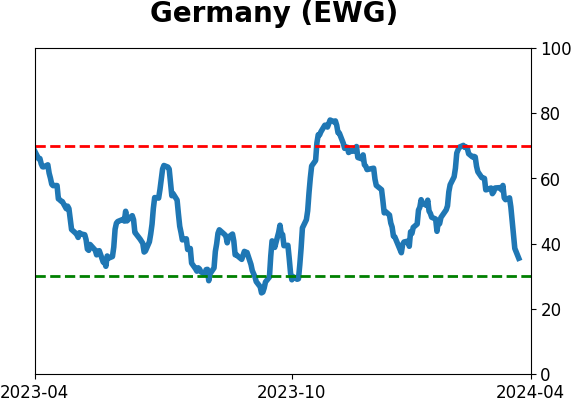
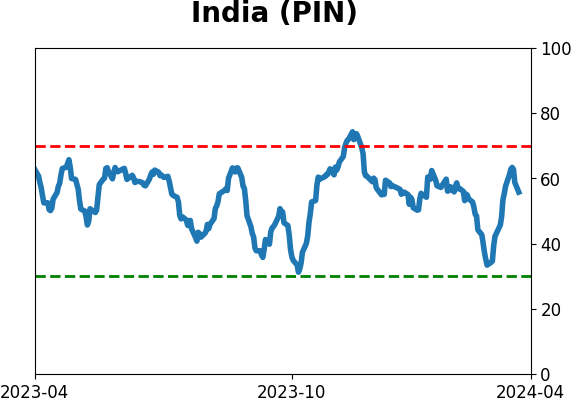
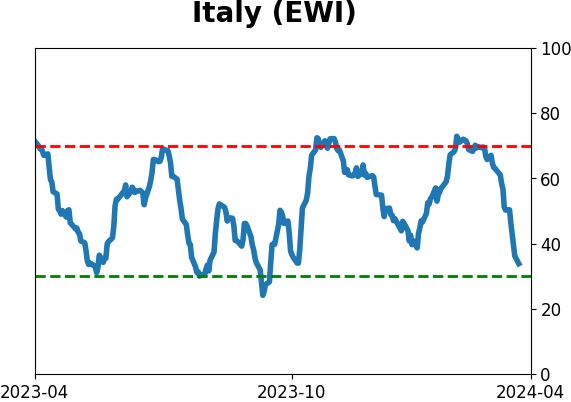
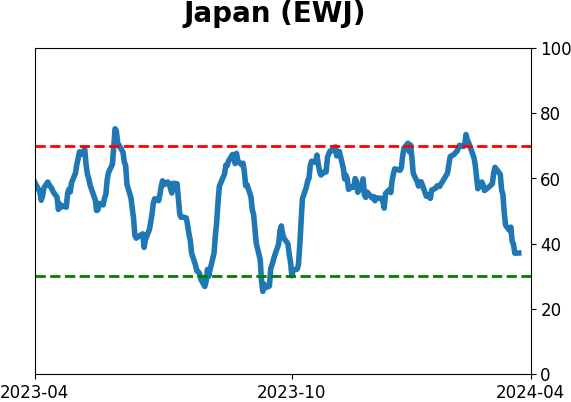
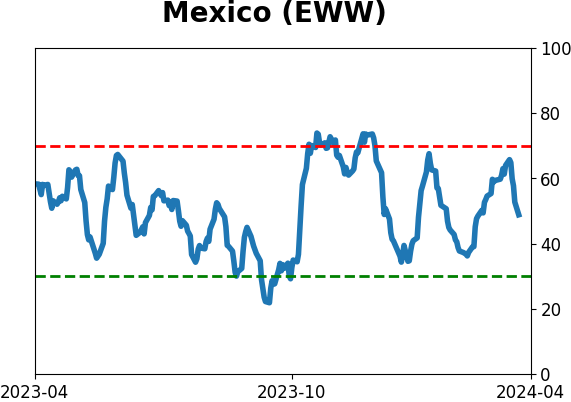
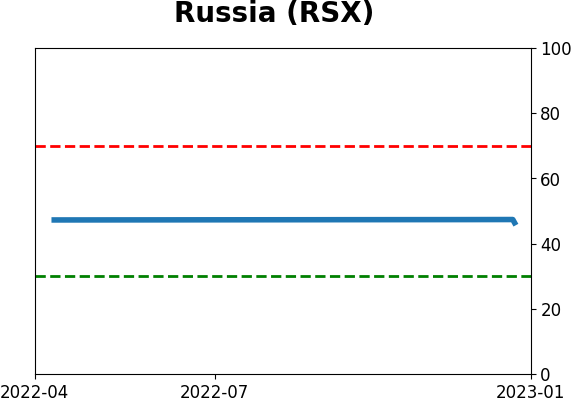
Country ETF's - 10-Day Moving Average
|
|
|
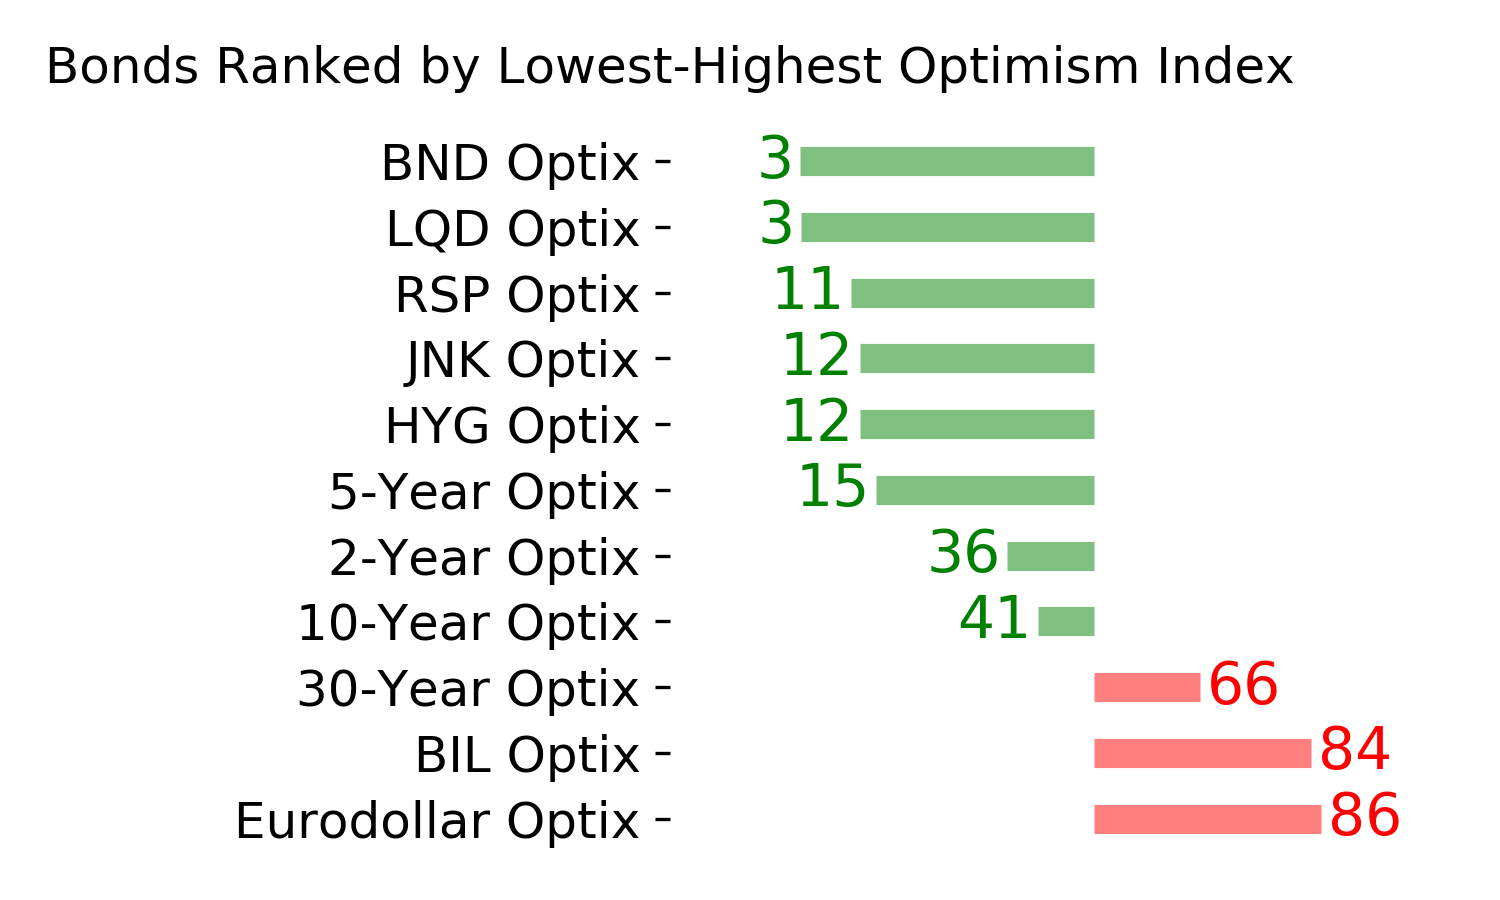
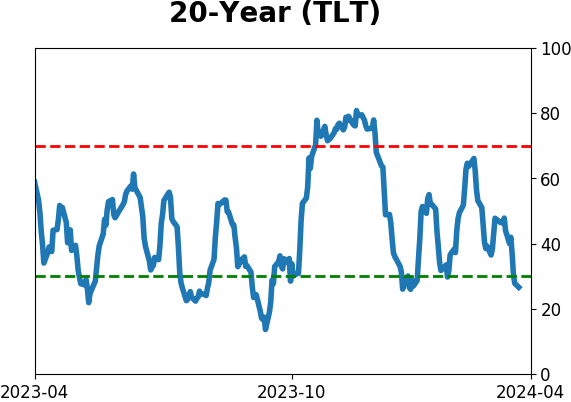
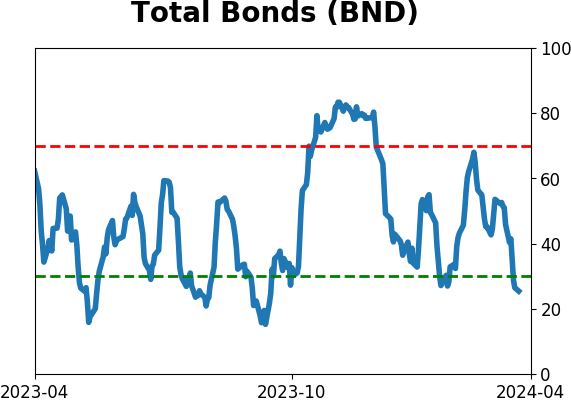
Bond ETF's - 10-Day Moving Average
|
|
|
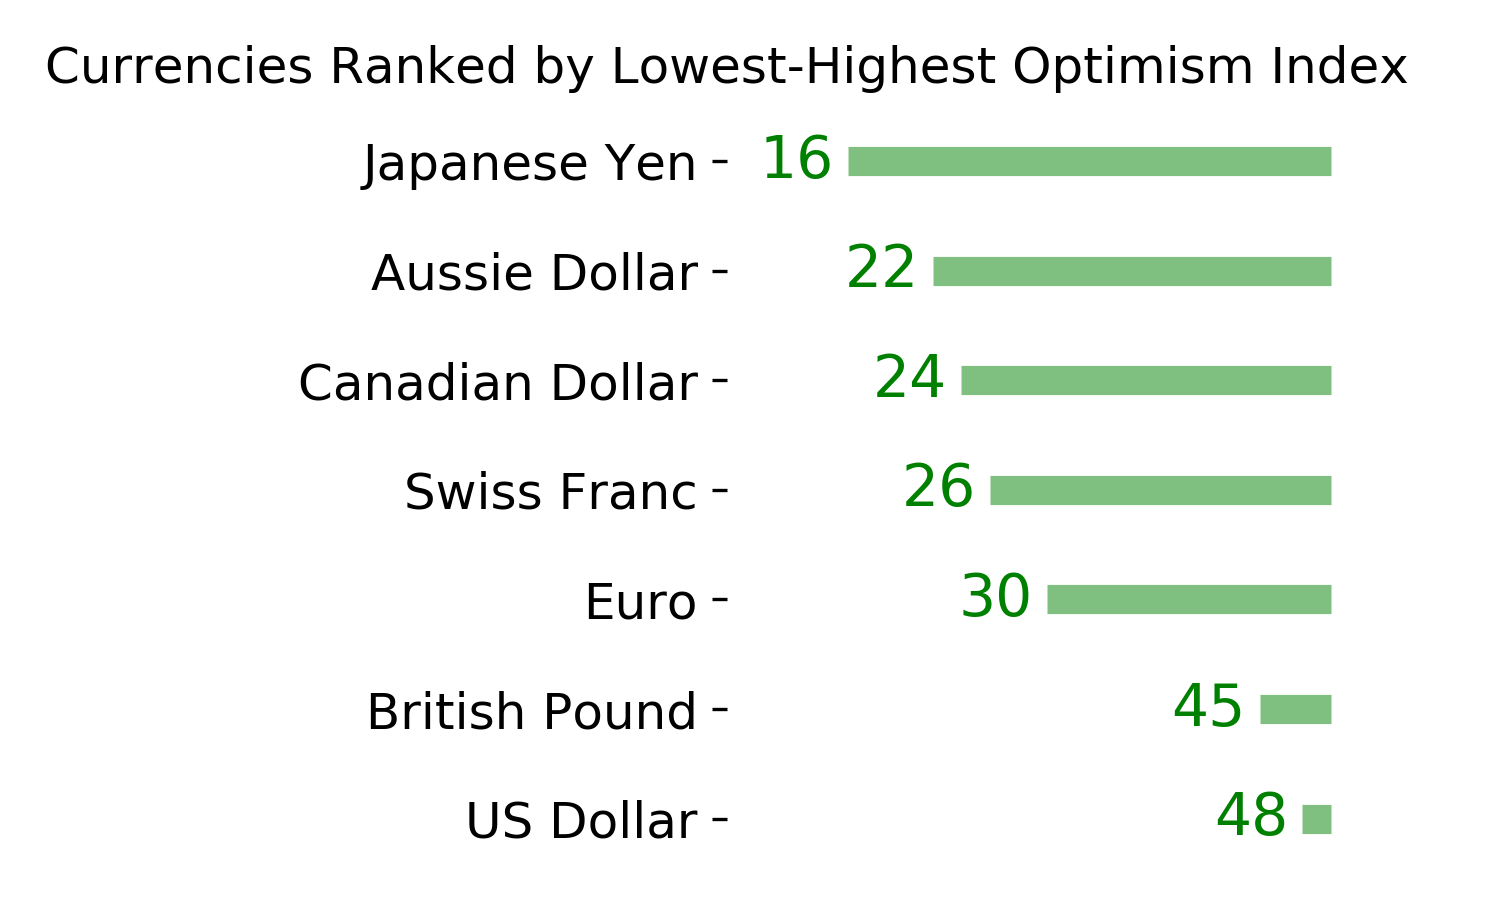
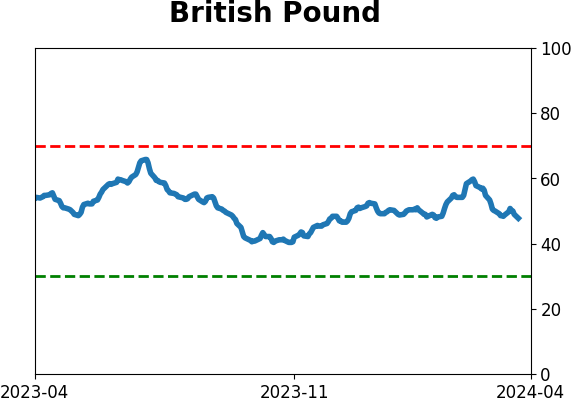
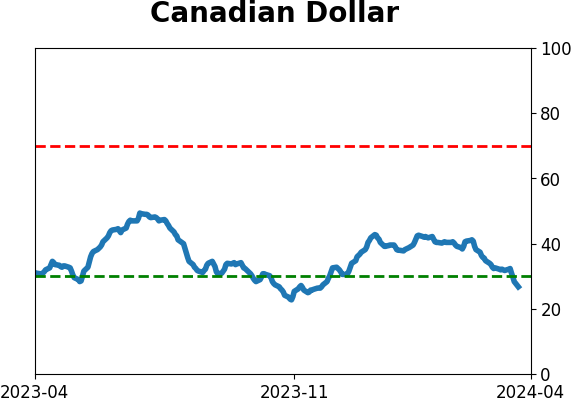
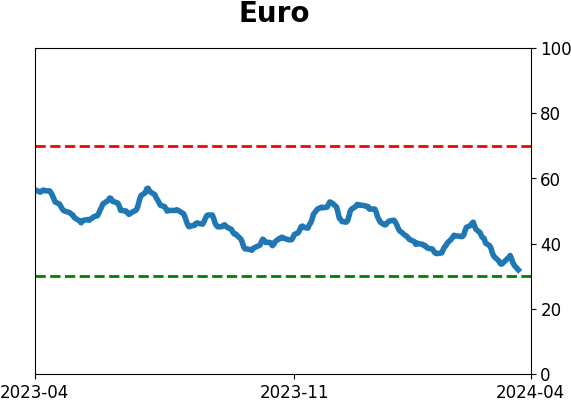
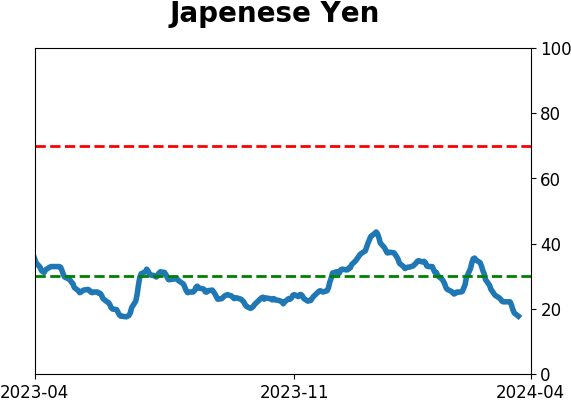
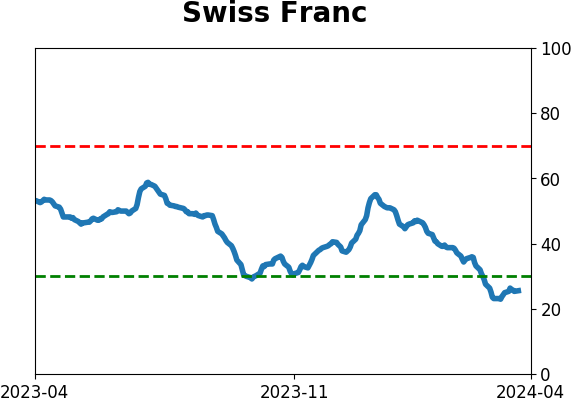
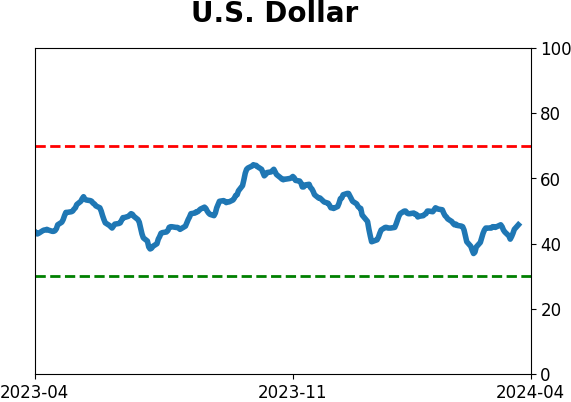
Currency ETF's - 5-Day Moving Average
|
|
|
Commodity ETF's - 5-Day Moving Average
|
|