Daily Report : TradingEdge Weekly for Apr 14 - Late buying interest, few Tech bear markets, recovering sectors

| View/Print a PDF version of this Report |
Headlines
|
TradingEdge Weekly for Apr 14 - Late buying interest, few Tech bear markets, recovering sectors: This week, we saw that traders have been eager to buy before the close, thanks in part to Big Tech. Few Nasdaq 100 stocks are now in bear markets or corrections. Few Industrial stocks, on the other hand, have been able to outperform the S&P, while European stocks are progressing nicely. There are some seasonal headwinds now for silver, while gold mining stocks are recovering. |
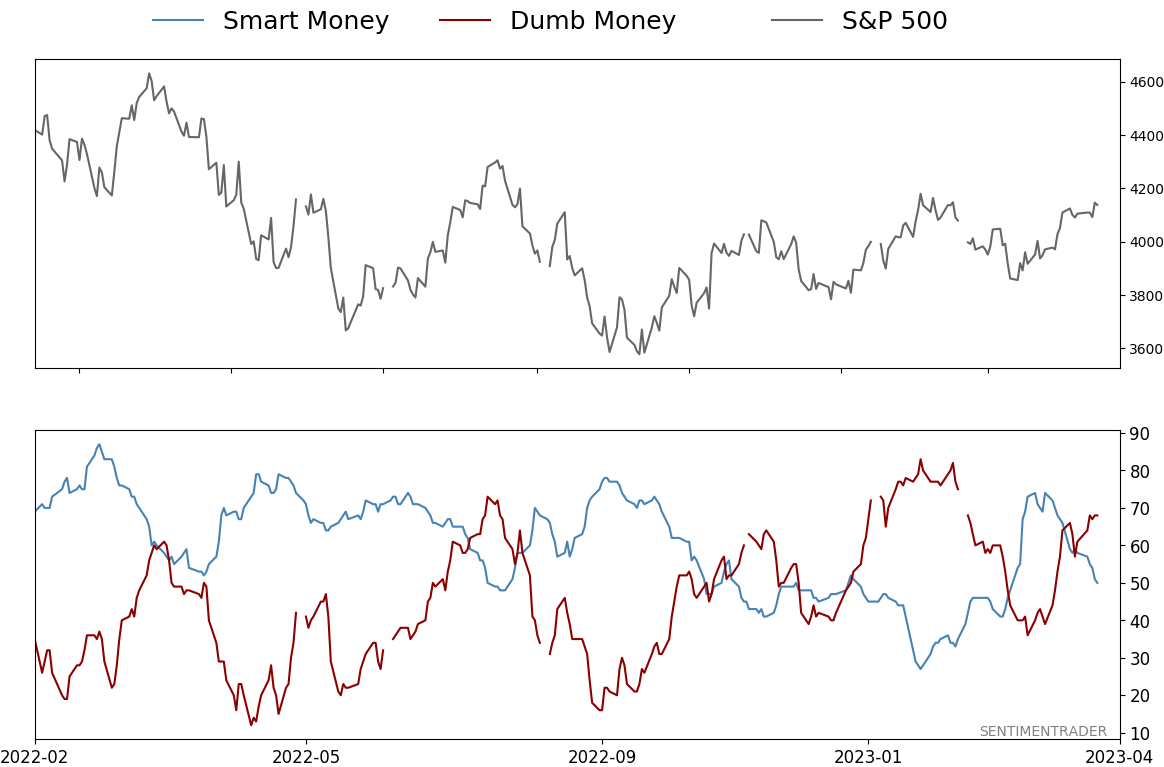
Smart / Dumb Money Confidence
|
|
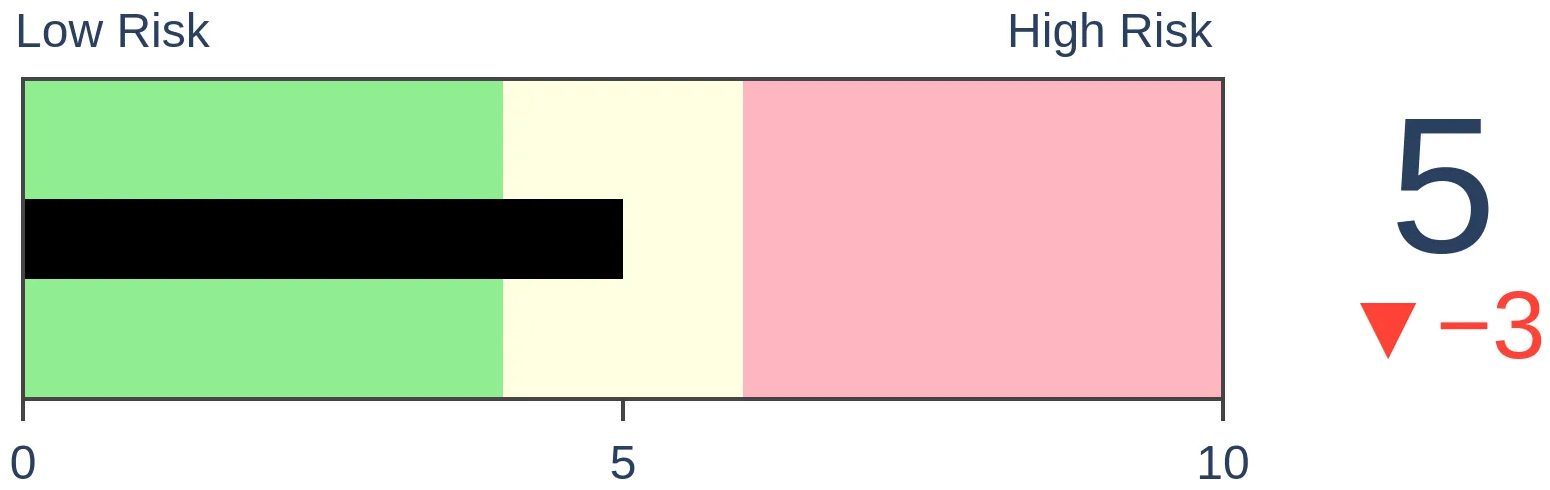
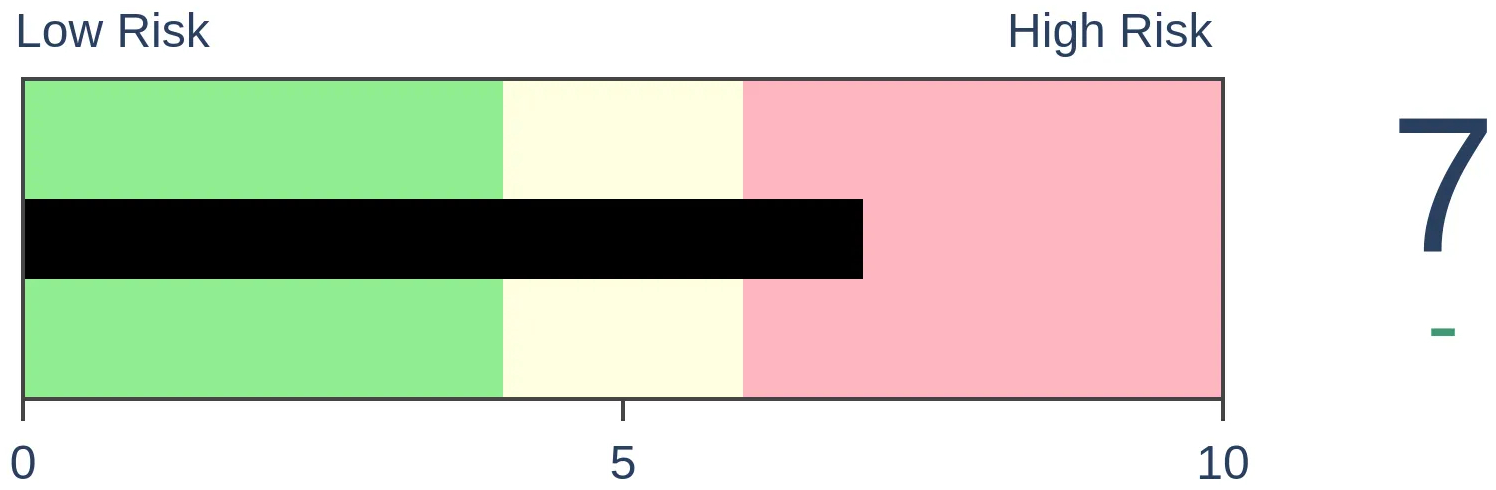
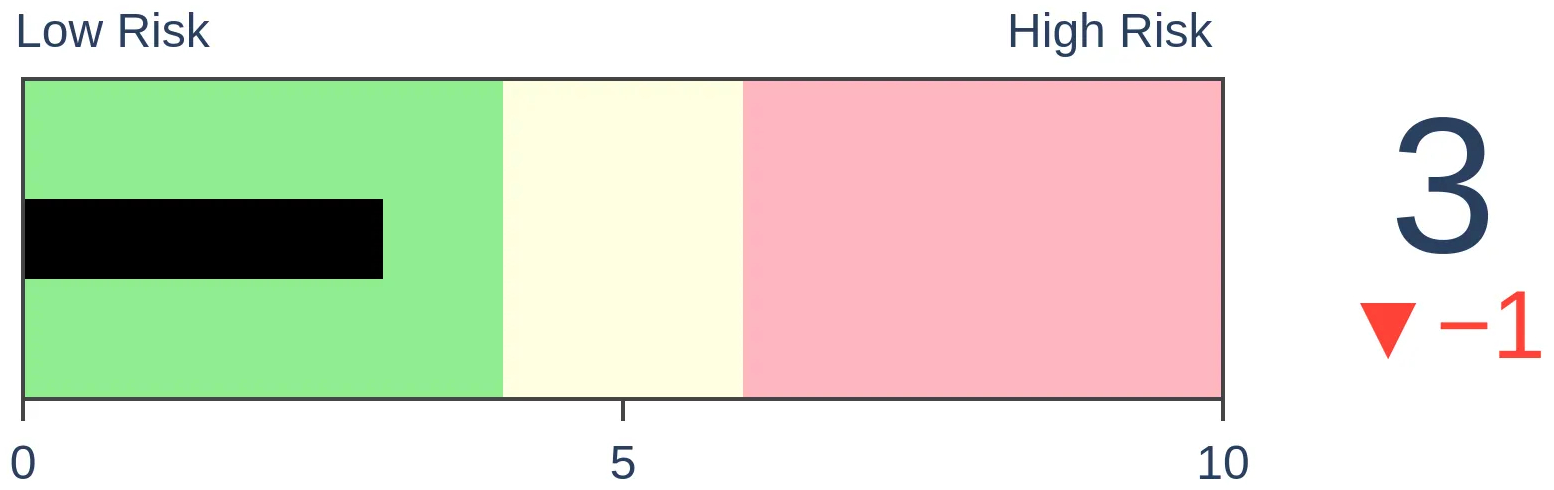
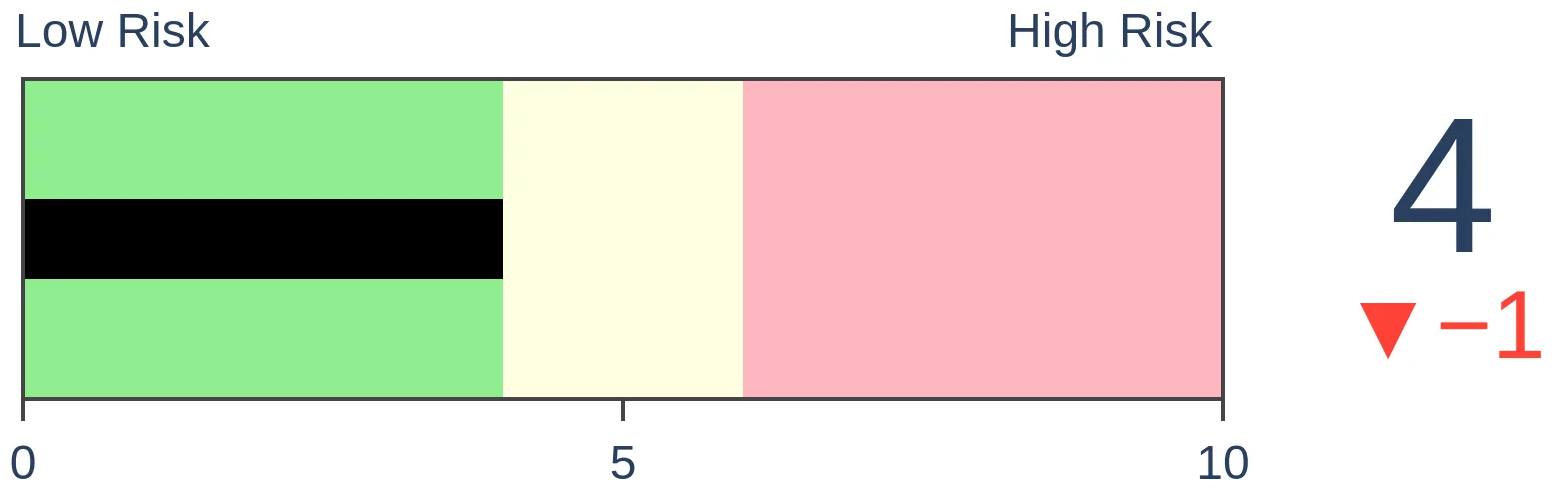
Risk Levels
|
|

|
Research
TradingEdge Weekly for Apr 14 - Late buying interest, few Tech bear markets, recovering sectorsBy Jason GoepfertBOTTOM LINEThis week, we saw that traders have been eager to buy before the close, thanks in part to Big Tech. Few Nasdaq 100 stocks are now in bear markets or corrections. Few Industrial stocks, on the other hand, have been able to outperform the S&P, while European stocks are progressing nicely. There are some seasonal headwinds now for silver, while gold mining stocks are recovering. FORECAST / TIMEFRAME |
Key points:
- Traders have been eager to buy before the close, with the Last Hour Indicator rising many days in a row
- Part of the buying has been thanks to Big Tech, and few Nasdaq 100 stocks are now in bear markets or corrections
- Combining the Panic/Euphoria and Short-Term Risk models into a single signal
- The recovery in European markets is progressing nicely
- More and more U.S. sectors are seeing long-term trend recoveries
- Few Industrial sector stocks are outperforming the S&P 500
- A couple of seasonal headwinds for silver
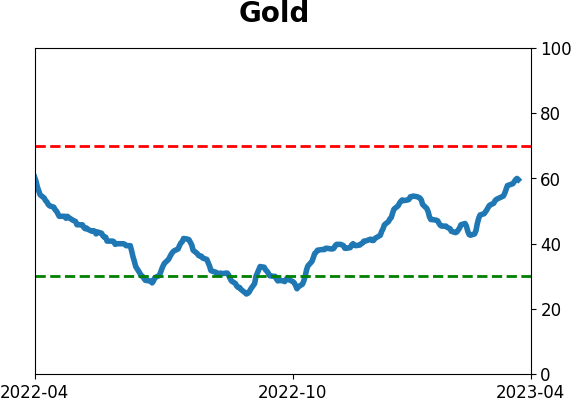
- Gold mining stocks have been on a tear, with 80% now in solid uptrends
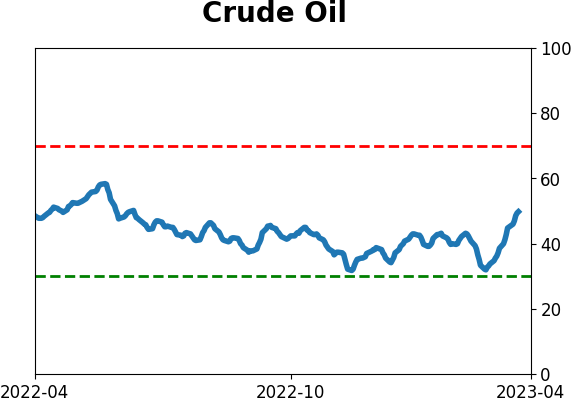
- Crude oil cycled from a 2-month low to a 2-month high in under a month
- Updating a couple of options plays
Buying before the close
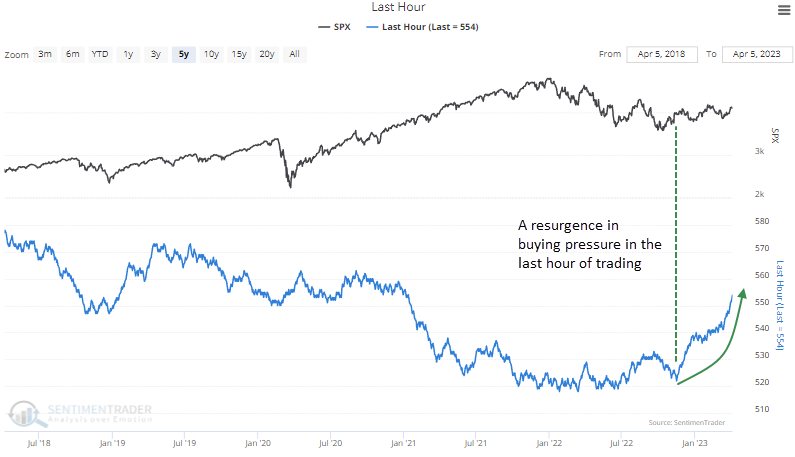
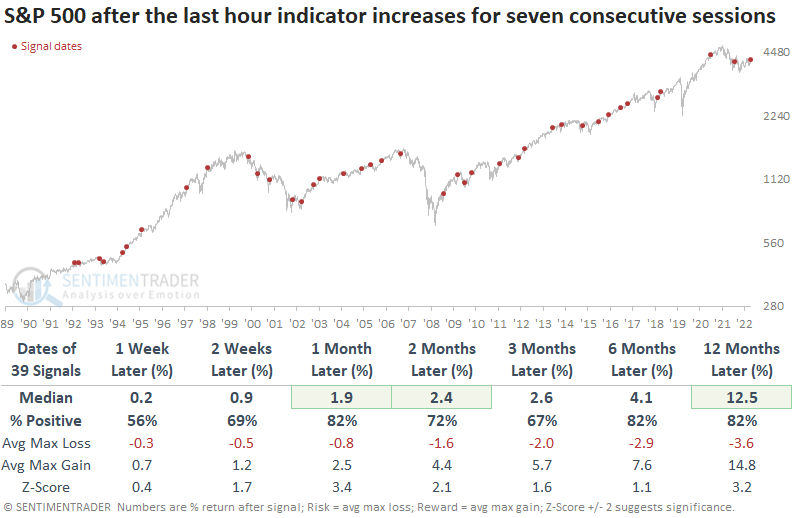
Traders have been trying to get a jump on the next trading day. Dean noted that the last-hour indicator increased for seven consecutive sessions, and after similar periods of late-day buying pressure, the S&P 500 showed a consistent upward bias.
The indicator, a cumulative advance-decline line for the last hour of trading, measures whether buyers or sellers dominate the most critical time frame of the day. The buying pressure accelerated last week when the last hour of trading recorded seven consecutive higher closes.
Consistent buying pressure in the last hour of trading is typically a characteristic of bull markets as investors seek to avoid the overnight upward drift in stocks. When the last-hour indicator increases for seven consecutive sessions, a month later, the index was higher 82% of the time and recorded 17 consecutive profitable signals between 2006 and 2019.
The late-day buying is, in part, due to renewed interest in Big Tech
Thanks to a renewed interest in large technology stocks, the Nasdaq 100 has recovered more than 22% from its December low. Much of that has been driven by the largest stocks, but not all of it.
The percentage of stocks in the Nasdaq 100 that are in bear market territory, down 20% or more from their 52-week high, recently plunged below 24%. That's the lowest since January 2022 and is a stark change from last year when nearly 80% of companies were in bear markets.
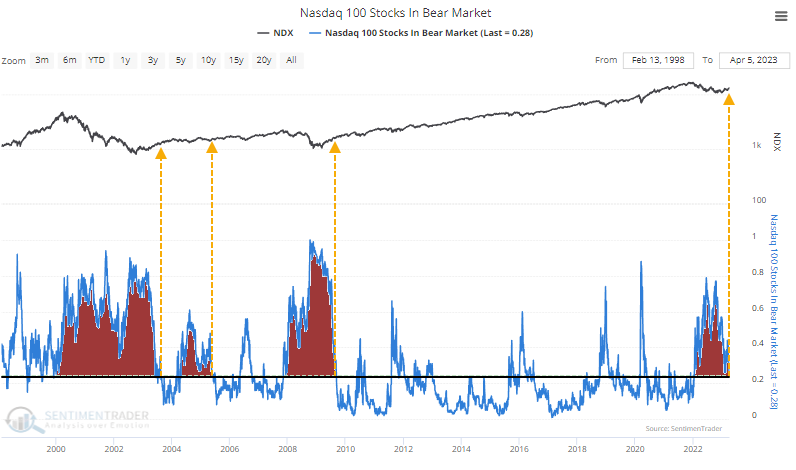
Likewise, the percentage in correction territory, down 10% or more, has slid below 59%. These recoveries ended some of the longest streaks with many struggling stocks over the past 23 years.
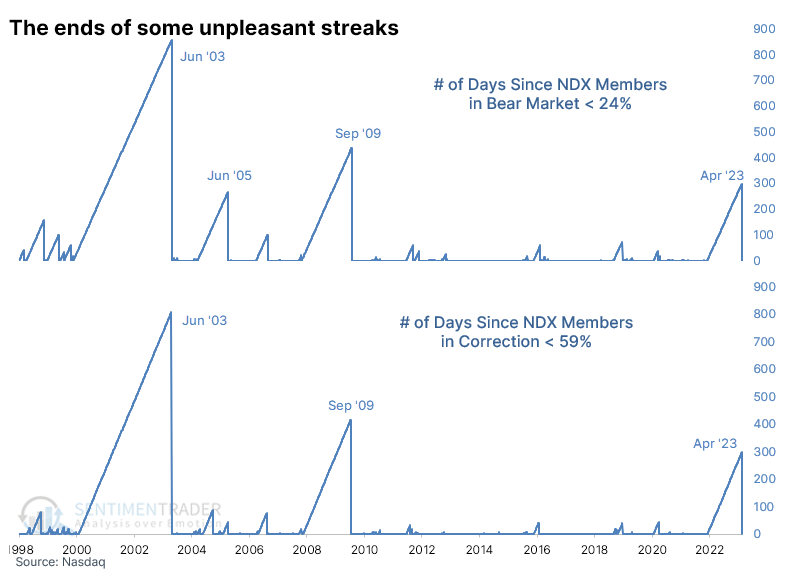
We can use a slightly different data source that recreates Nasdaq 100 data from the early 1970s to understand what this might have looked like in prior decades. Using that and the Nasdaq Composite index for return calculations, the ends of long streaks with so many stocks in bear markets preceded pristine returns. Losses were rare to nonexistent across time frames, risk was exceptionally low, and forward returns were impressive.
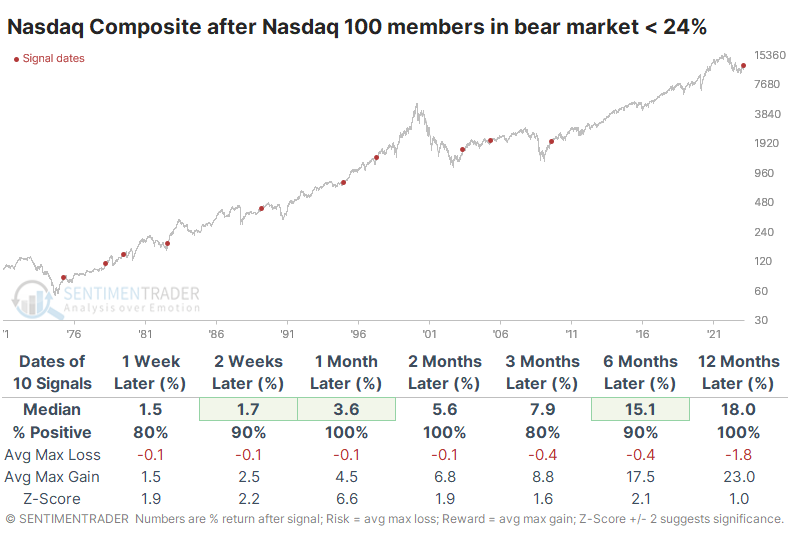
It was an excellent sign for the S&P 500 as well. That index showed less consistency in the short-term, but medium- to long-term returns were exceptional.
A combination of other positive signs
Jay showed that the Panic/Euphoria Model has given multiple favorable signals in the past nine months and our Short-Term Risk Levels indicator also touched a bullish threshold. Often, we can find value by combining two or more indicators.
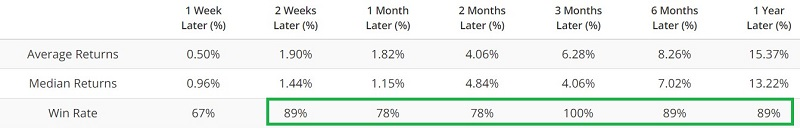
The chart below displays all days when the Panic/Euphoria model crossed from below to above -0.168, and the table summarizes S&P 500 performance following these signals.
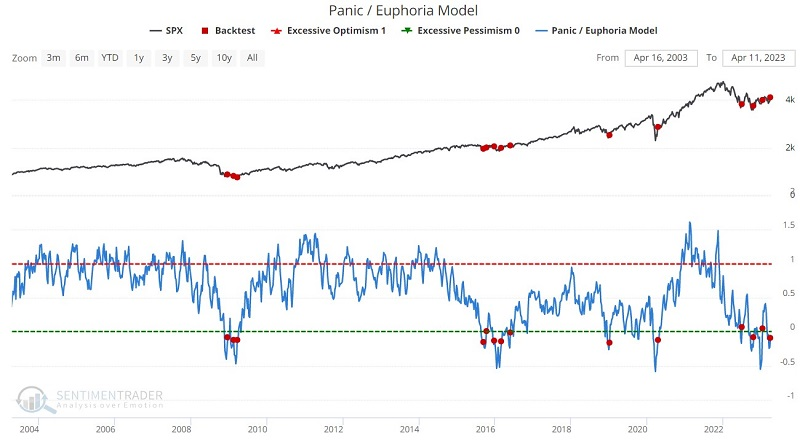
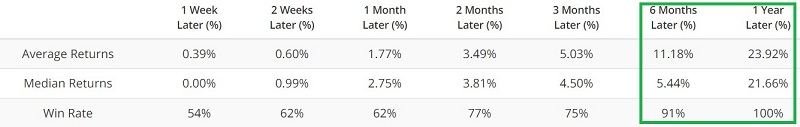
Any individual signal may be early, but in the last 20 years, each cross above -0.168 was followed by a higher S&P 500 Index twelve months later.
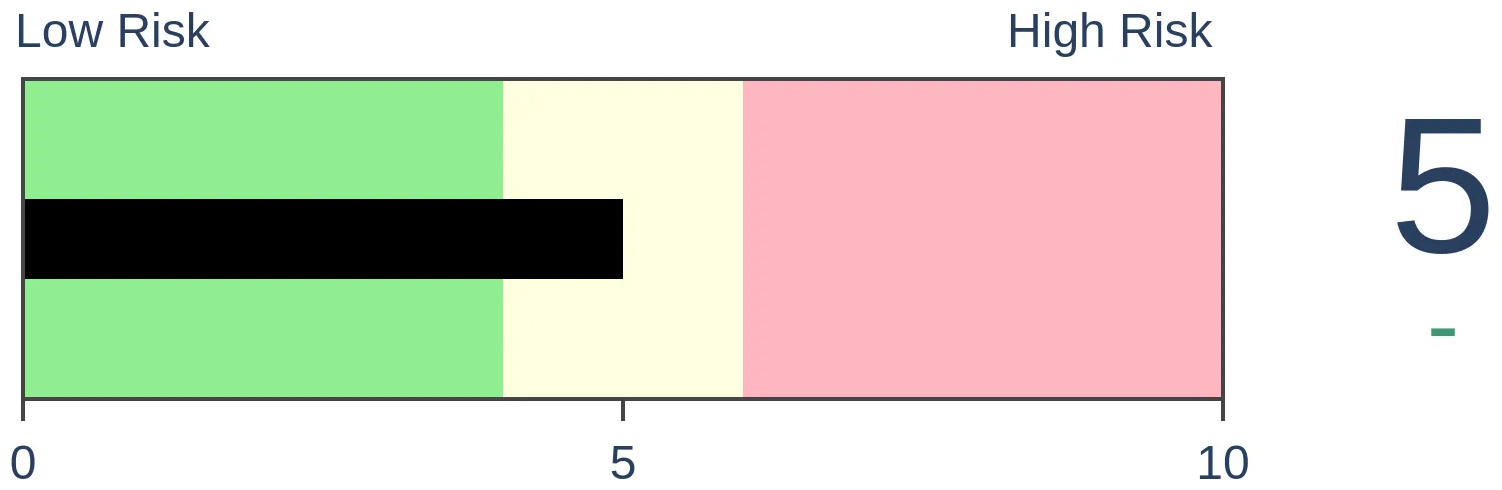
Likewise, our Short-Term Risk Levels indicator showed a reading of 9. The good news is that the S&P 500 stood higher twelve months after a signal 95% of the time. The bad news is that the signals in April and May of 2008 were followed by the devastating bear market decline in late 2008 and early 2009.
For the following test, we will assume that a trader holds the S&P 500 Index only when both of the indicators above have flashed a favorable signal anytime within the past twelve months. The chart below displays the growth of $1 invested in the S&P 500 when this is the case.
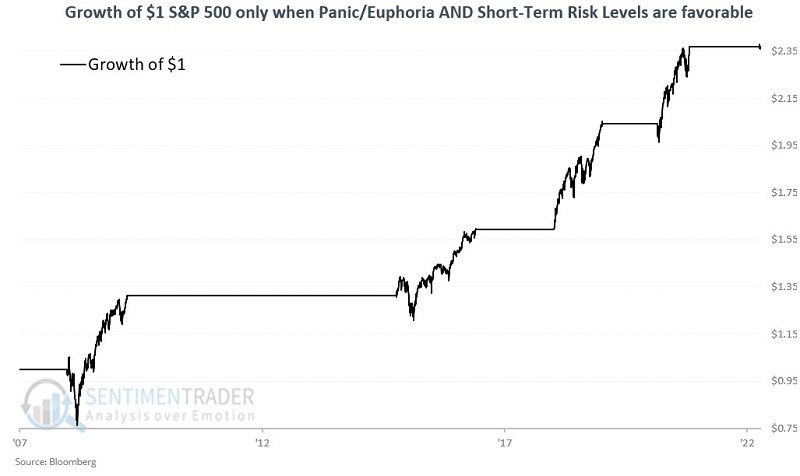
This is an admittedly small sample size, so we should be careful about trying to draw any conclusions. Still, the four previous favorable periods - which typically lasted for just under 14 months - have demonstrated very positive reward-to-risk results.
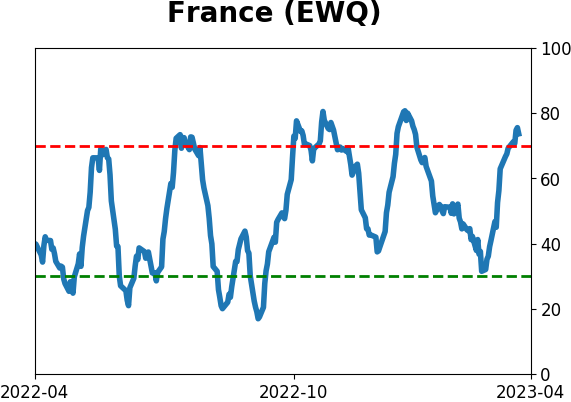
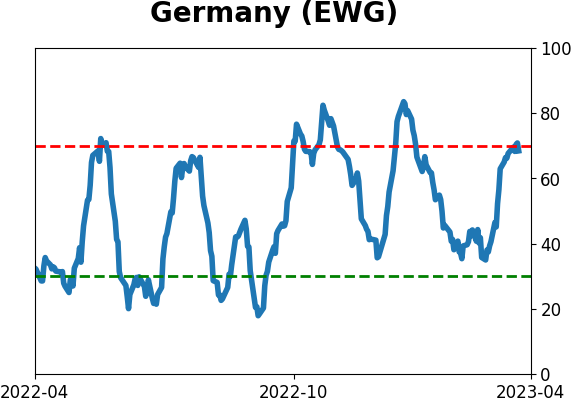
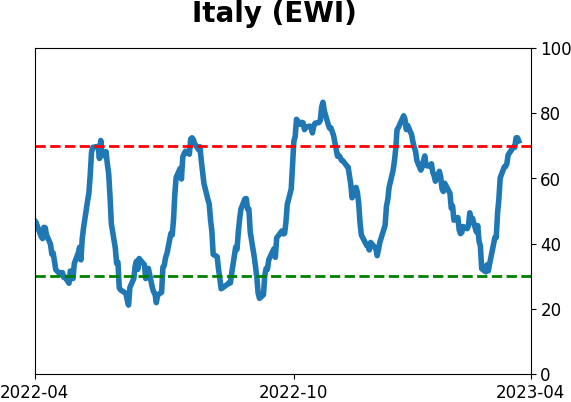
Europe's recovery is moving along nicely
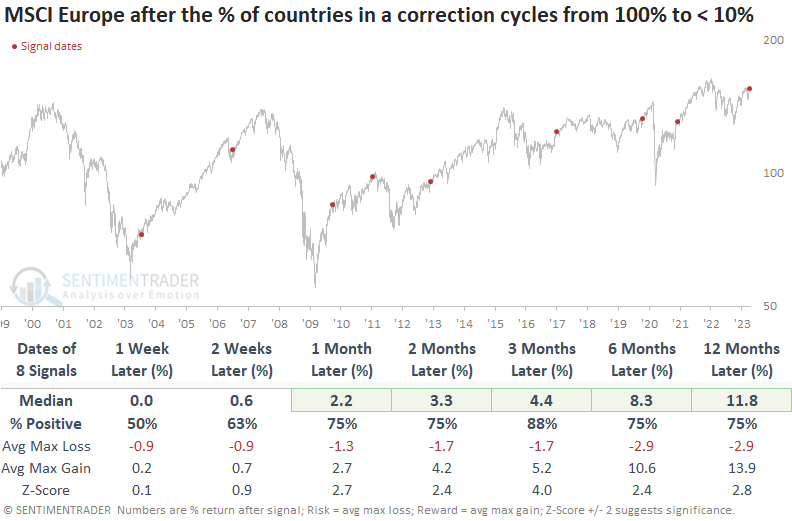
Dean showed that the percentage of European countries in a correction cycled from 100% to < 10%. After similar reversals, the MSCI Europe Index was higher 88% of the time over the next three months.
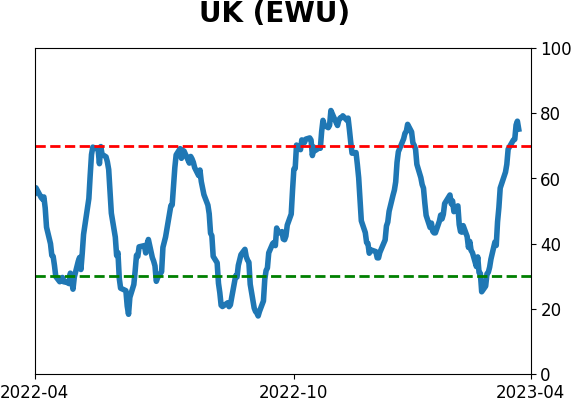
As of the close on Wednesday, the MSCI Europe Index showed a YTD gain of 13% in USD terms, outpacing all other global regions and the 7% gain in the S&P 500. As European indexes recaptured higher and higher price levels, the percentage of European countries in a correction (> 10% from a 252-day high) cycled from 100% to less than 10%, triggering a bullish signal for the region.
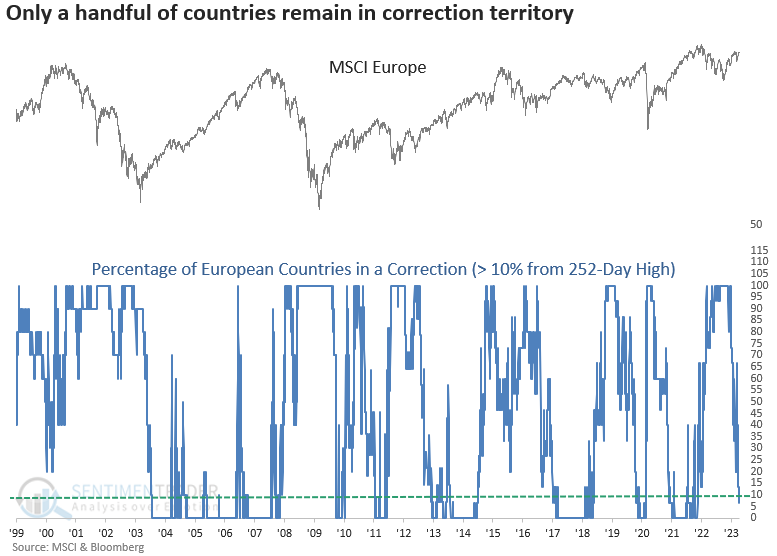
When the percentage of European countries in correction territory cycles from 100% to less than 10%, the MSCI Europe Index tends to trend higher across all time frames. In every case, the signal showed a gain at some point in the first three months. And drawdowns over that same horizon were benign.
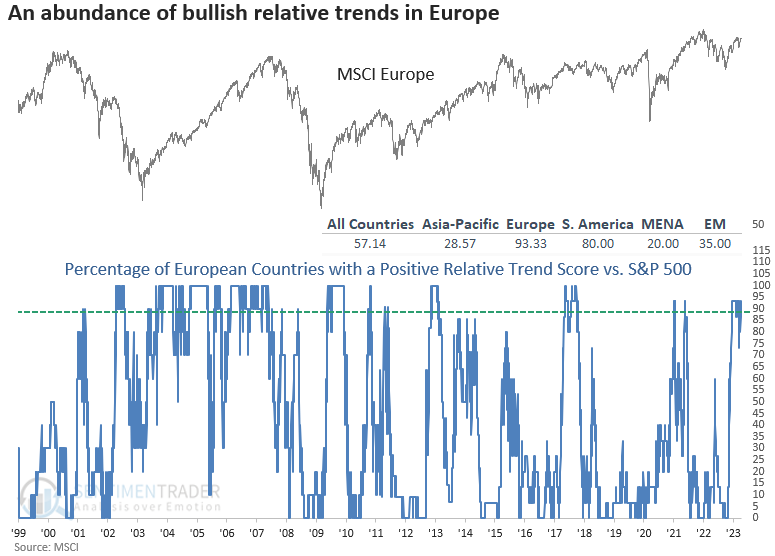
European ETFs dominate the list of countries with perfect absolute and relative trend scores. And most of those countries are registering new relative highs in the last week. Europe has over 93% of its countries with a positive score versus the S&P 500.
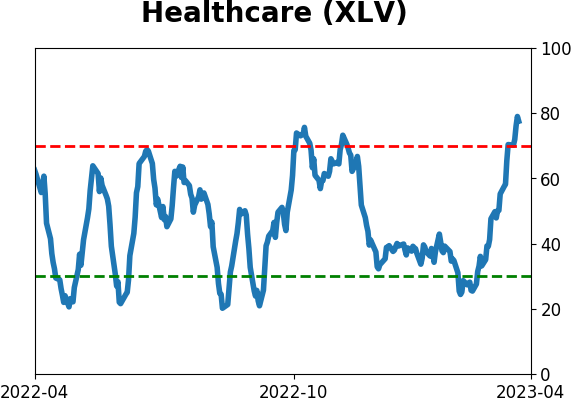
More sectors are showing long-term recoveries
Jay suggested that some indicators typically occur before the market turns, while others are most useful as confirmation that a turn has already taken place. The percentage of sectors with rising long-term trends just gave such a confirmation signal.
Typically, a rising 200-day moving average confirms that a given security or sector is in an established rising trend. When looking at sectors, this indicator can be used in two ways:
- When the 50-period average rises above 40%, it (typically) suggests that a new uptrend has been established following a previous market decline
- When the 50-period average rises above 70%, it (typically) confirms that a bull market is in force
The chart below displays a red dot when the 50-day moving average of the Major Sector % Rising 200-Day indicator crossed above 40%.
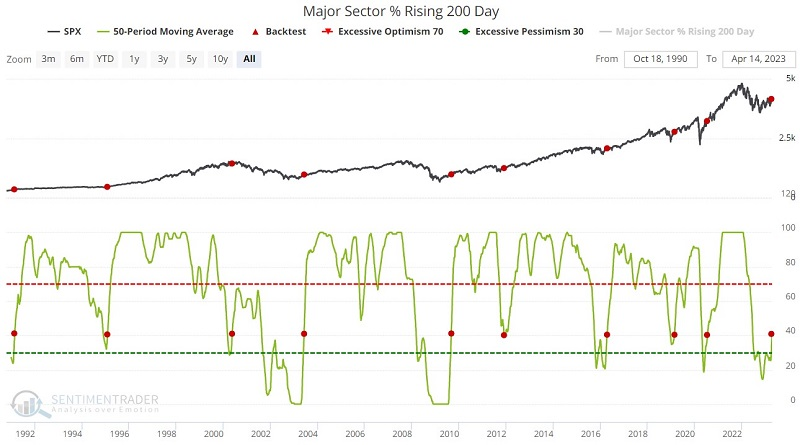
Like most indicators, this one is not infallible. A significant bear market followed the May 2000 signal. Nevertheless, all other signals saw the S&P 500 higher six and twelve months later. And even the May 2000 signal showed a gain three months after the signal.
Jay also looked at performance once this figure reached 70%, which would further the case that a long-term recovery is in progress.
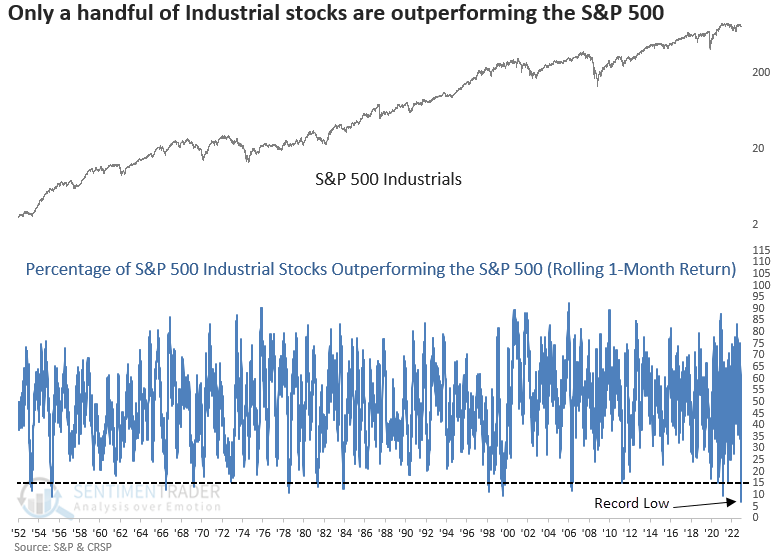
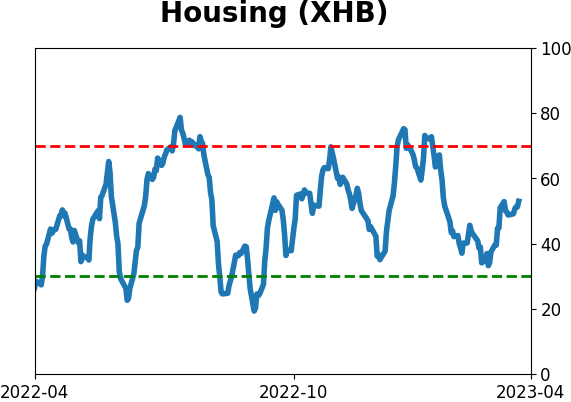
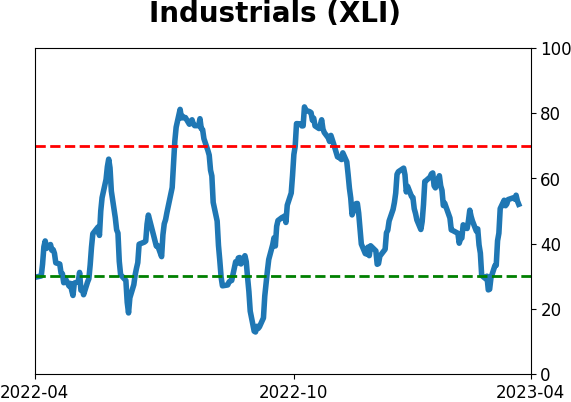
Few Industrial stocks are doing better than the S&P
Fewer than 7% of S&P 500 Industrial sector stocks outperformed the S&P 500 over a rolling 1-month period. Dean showed that after similar performance trends, the Industrials sector struggled over the next three months.
With so few Industrial stocks outperforming the S&P 500, it's easy to extrapolate an ominous message about the stock market. As always, a signal-driven approach helps us to filter the facts from the narrative-driven noise.
When few Industrial sector stocks outperformed the S&P 500 Index over a 1-month period, the Industrials sector tends to struggle over the next three months. In all but one case, the group showed a negative return at some point over that time frame.
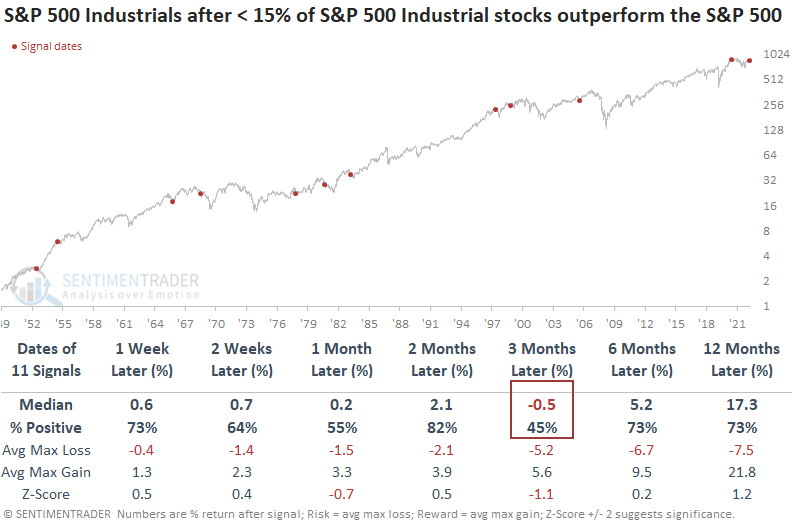
While the Industrials sector struggled, the signal did not impact the broad market. The S&P 500 had a consistent upward bias over the next three months. So, investors rotated to other groups.
Interestingly, on a go-forward basis, growth-oriented Technology stocks outperformed other sectors while value/cyclical-oriented industries like Autos, Banks, and Transportation underperformed.
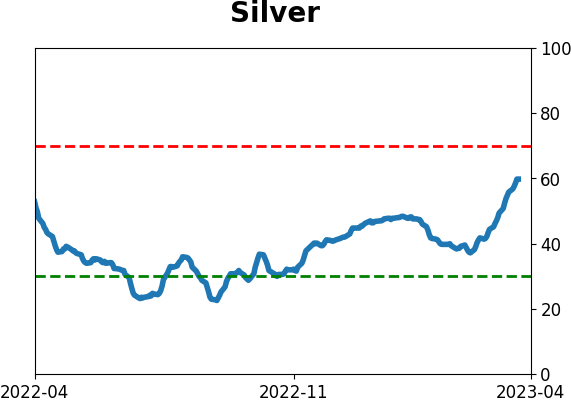
Seasonal headwinds for silver
Silver has rallied almost 50% since bottoming in September 2022. But if silver fails to rally, Jay suggested two seasonal factors could bring traders a most unpleasant surprise.
It is potentially helpful to note that silver is about to enter its most unfavorable time of year. This period extends from the close of Trading Day of Year (TDY) #73 through TDY #128. For 2023, this period runs from the close on 2023-04-13 through 2023-06-29. The chart below displays the hypothetical cumulative loss achieved by holding a long position in silver futures only during this period every year starting in 1970.
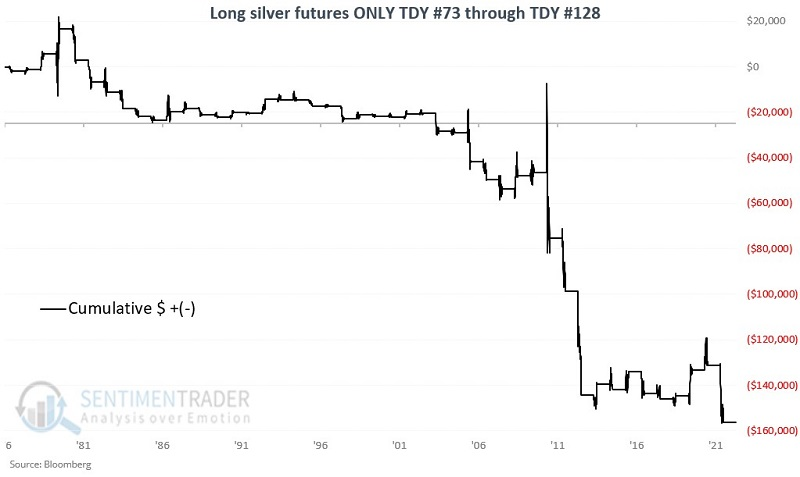
During these windows, silver gained only 37% of the time, with an average loss nearly twice as large as the average gain, and was twice as likely to suffer a $5,000 loss per contract than a $5,000 gain.
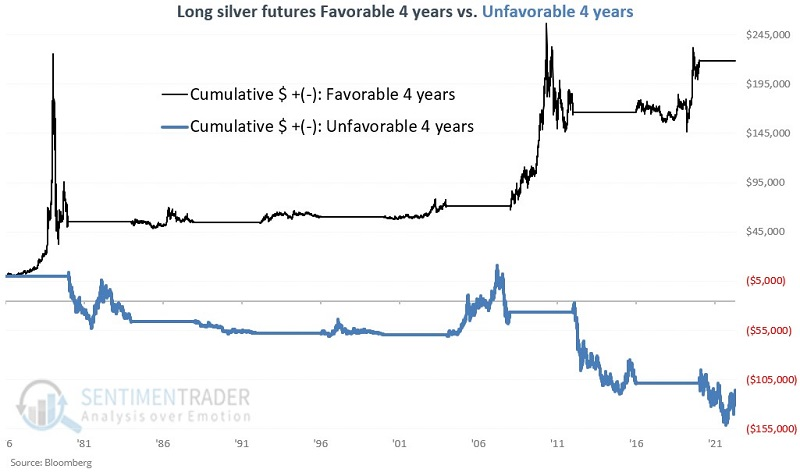
In another seasonal twist, silver has historically shown a broad tendency to perform better during the first half of an eight-year cycle than during the second half. We will label 1977 as Year 1 and 1984 as Year 8 of the first cycle. For testing purposes, we will label Years 1 through 4 as favorable and Years 5 through 8 as unfavorable. This cycle is presently "unfavorable" and will remain so through 2024-12-31.
The chart below displays the cumulative hypothetical $ gain or loss achieved by holding a long position in silver futures only during each four-year favorable period (black line) versus each four-year unfavorable period (blue line).
Now let's look at how the TDY 73 through TDY 128 annual period performs during the unfavorable years of the eight-year cycle.
The chart below displays the cumulative hypothetical gain from holding long silver futures during the TDY #73 through TDY #128 period within the unfavorable years in the eight-year cycle (1981-1984, 1989-1992, 1997-2000, 2005-2008, 2013-2016, 2021-2024)
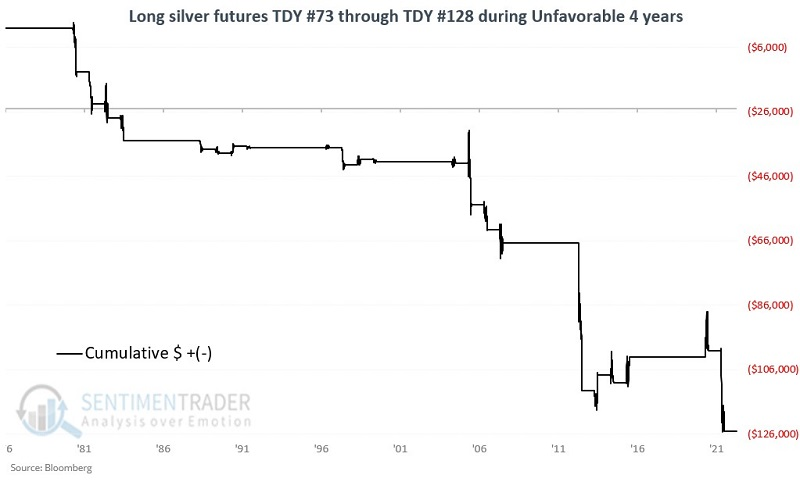
Using this combination of seasonal factors, silver rallied only 23% of the time and suffered an average loss well beyond twice as large as the average gain. It lost more than $5,000 per contract during eight of these windows while rallying more than $5,000 only once.
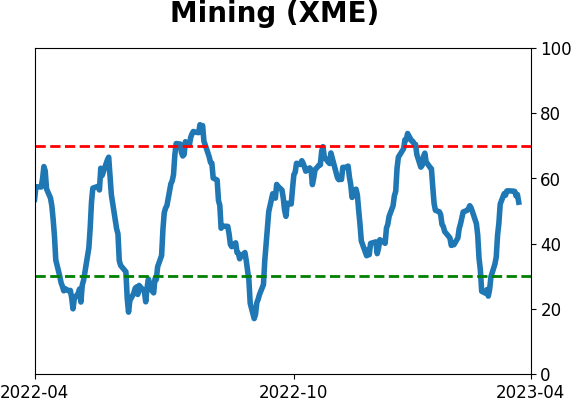
Gold miners have been doing very well
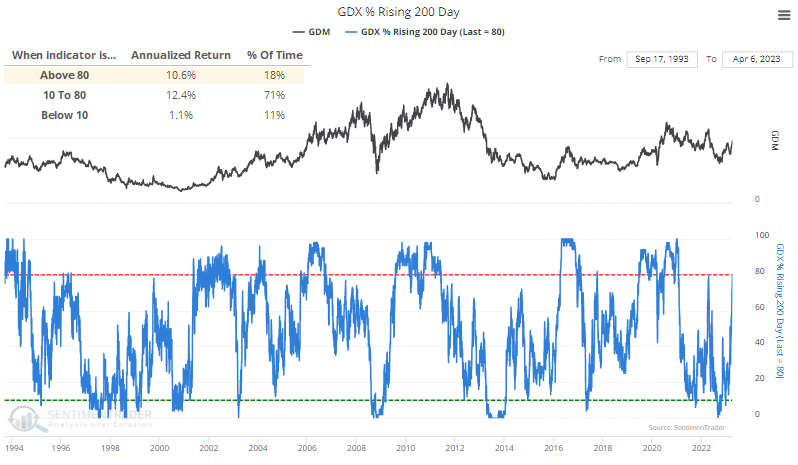
Mining stocks bottomed last fall along with the broader market, so the recovery has been long-lasting. It's been enough to prompt a positive turn in the 200-day moving averages for 80% of gold miners. That's even more than the big rally in the spring of 2022, which proved to be a false dawn.
Gold miners have a long history of booms and busts. When few of the stocks have a rising 200-day moving average, gold miners sported an annualized return barely above zero. But when more than 80% of stocks had a rising average, that annualized return jumped to double-digits.
The positive return when more than 80% of stocks were in solid uptrends was mostly thanks to a couple of episodes of runaway upside. When the signals first occurred after a period of losses, it was much more of a struggle for the sector.
The table below shows forward returns in the Gold Bugs after fewer than 10% of gold mining stocks had a rising 200-day average, then more than 80% did. These are the first indications of widespread recovery from severely depressed conditions. Unfortunately for investors in these stocks, the recoveries showed a solid tendency to peter out quickly.
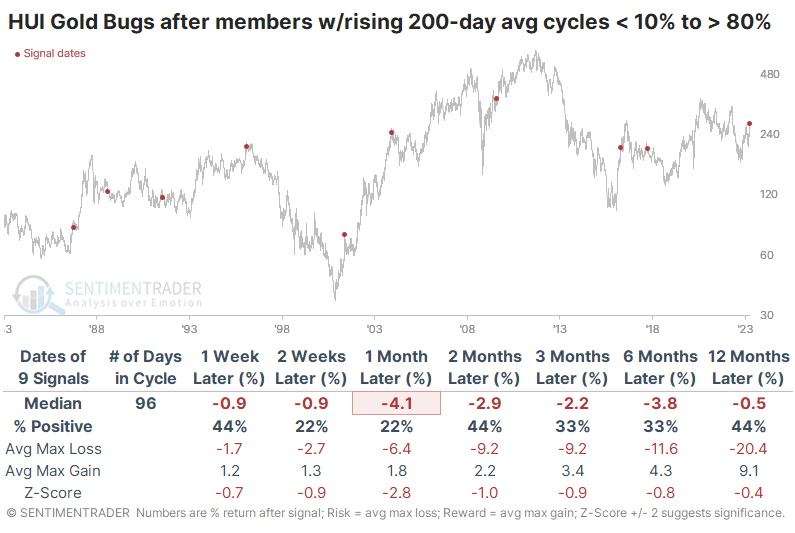
The table of maximum gains and losses over each time frame shows that the two best signals, in 1986 and 2009, also showed the most gains and minor losses in the first week after the signal. Overall, only two signals showed double-digit gains at any point within the next three months, while four signals showed larger than double-digit losses.
A crude oil reversal signal
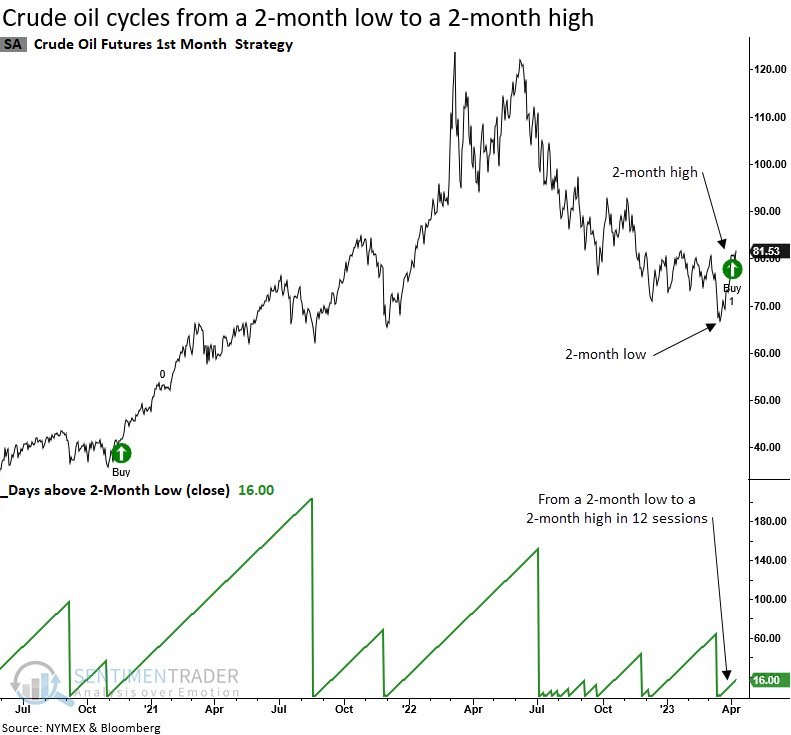
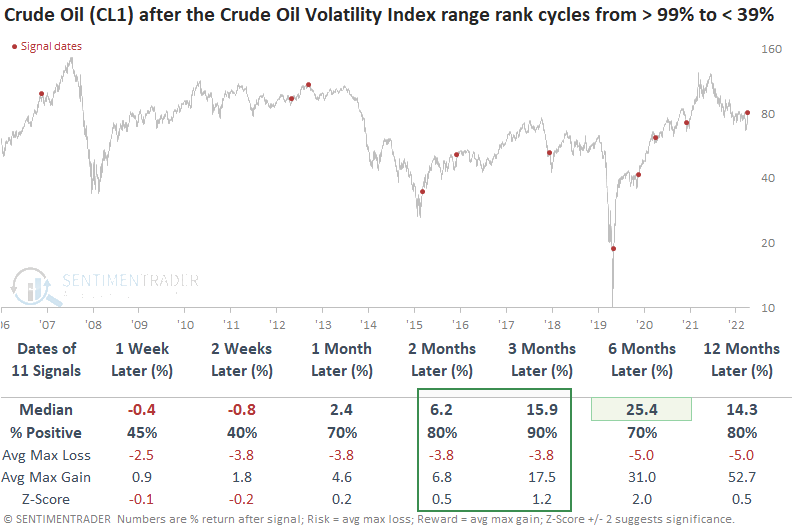
Dean highlighted the rally in crude oil, which cycled from a 2-month low to a 2-month high in only 12 trading sessions. After similar reversals, the commodity showed strong results over the next two months. Also, the Volatility Index for crude oil reversed from the upper end to the lower end of its recent range.
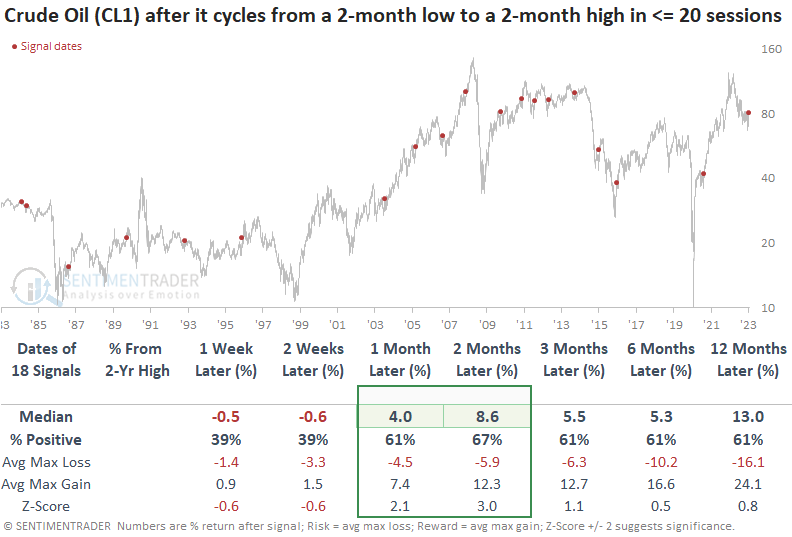
For only the 19th time since 1984, crude oil futures (CL1) reversed from a 2-month low to a 2-month high in fewer than 20 trading sessions. The previous signal in November 2020 led to a substantial rally.
When oil cycles from a 2-month low to a 2-month high in 20 sessions or fewer, the commodity tends to consolidate the gains over the next few weeks. After the brief pause, the one and two-month time horizons show excellent returns, win rates, and z-scores. Results look even more favorable when a signal occurs with crude oil down more than 30% from a 2-year high, which is the case now.
The Crude Oil Volatility Index (OVX), equivalent to the CBOE's Volatility Index (VIX) for the S&P 500, surged higher and subsequently reversed lower, triggering a buy signal for crude oil. After the 84-day range rank increases above a reset level of 99%, the system generates a buy signal when the indicator falls below 39%, and oil exhibits positive price momentum.
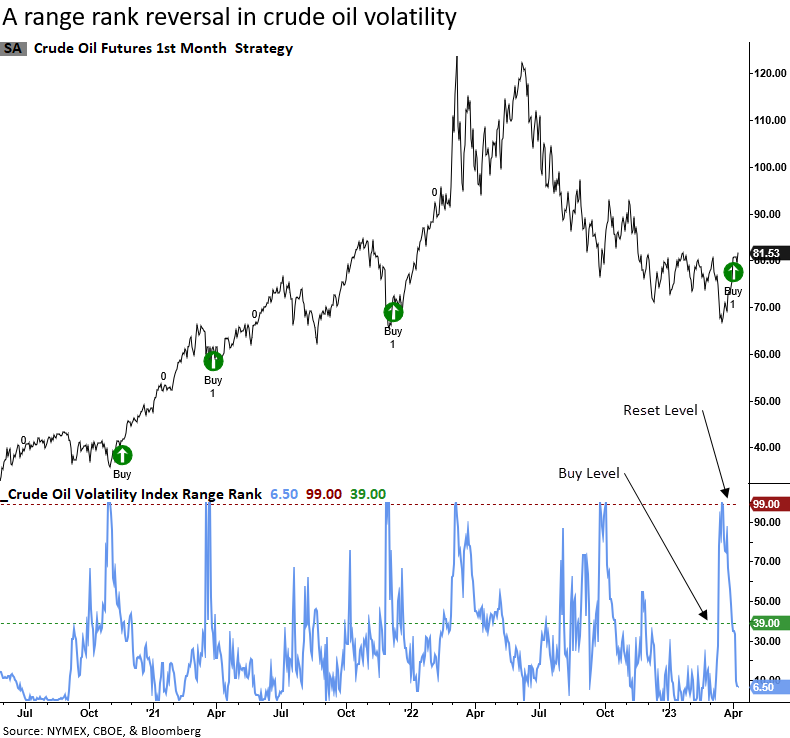
Like the price reversal signal, crude oil pauses for a few weeks after the volatility range rank alert. Once the pause ends, oil takes off with excellent results in the two and three-month windows.
The reversal in the Crude Oil Volatility Index had very little if any, impact on stocks. We must remember the volatility series has a limited history and that most of the study period occurred in a bull market for stocks.
Updating a couple of options plays
Jay previously discussed two potential ways to play a bullish seasonal trend in natural gas; that bullish trend has not materialized at all. He also discussed one way to play the recent sell-off in the real estate sector.
The chart below displays the annual seasonal trend for natural gas futures (blue line) and the actual price action for 2023 (red line).
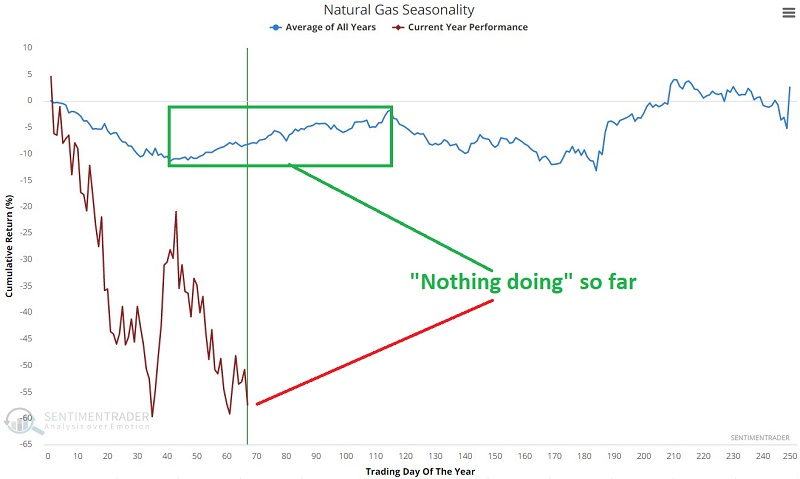
As you can see in the chart above, in 2023, natural gas has been a bust. This market remains seriously oversold and (theoretically) still due for a bounce.
Previously, Jay detailed two potential bullish plays in natural gas using options. The bad news is that both positions are firmly underwater. The good news - such as it is - is that losses are small in terms of dollar amounts (assuming the trade was sized correctly - i.e., no more than 1 to 2% of trading capital). These were highlighted as highly speculative bets on a reversal in natural gas.
The first involved buying a call option on Swan Energy (SWN) as a proxy for natural gas. The second involved a bull call spread on the United States Natural Gas (UNG) ETF. The current status of this position appears below.
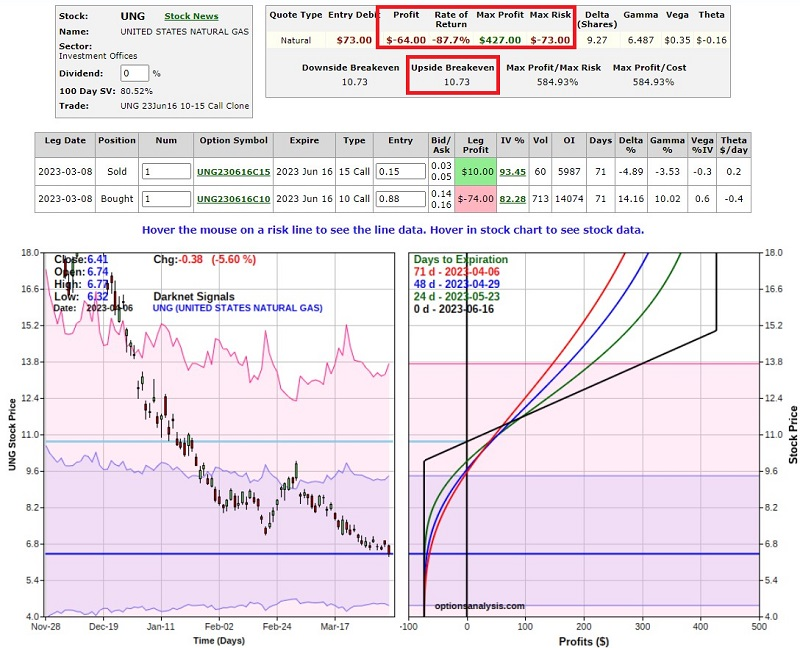
The initial cost - and maximum risk - was $73 for a 1-lot. So, a trader with a $25K account, risking 1% of trading capital, might have bought a 3-lot. This trade is presently a bust. It is down -$64 on a 1-lot (-88%), UNG is trading at $6.41 a share, and the breakeven price on this trade is very far away at $10.73 a share. With 71 days left until expiration and most of the premium already lost, there may not be much point in selling. A trader unwilling to risk any more on this situation can just "let it ride" and hope for a bounce.
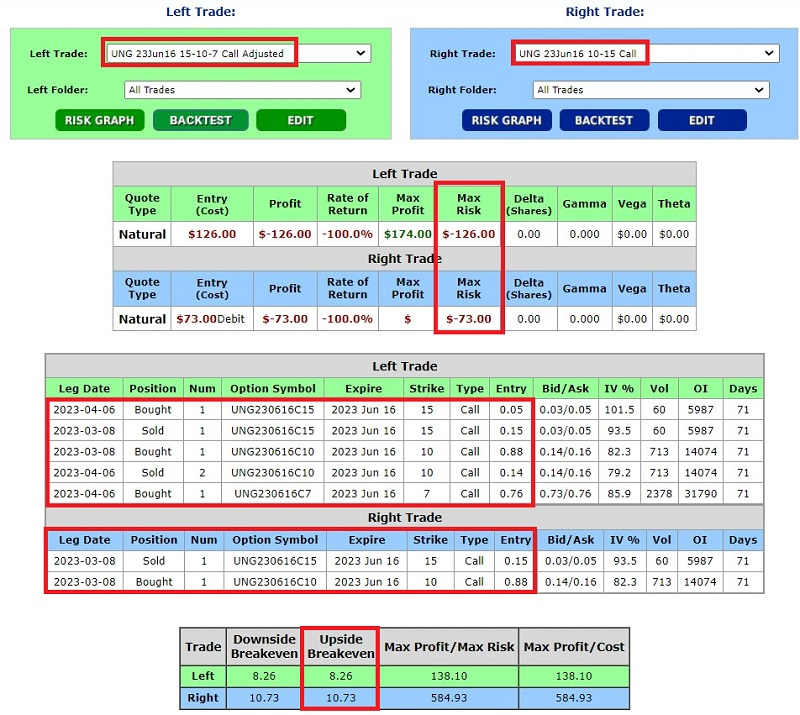
Another alternative - for a trader willing to risk more - a trade adjustment may improve the odds somewhat. This example adjustment involves:
- Buying 1 UNG June16 2023 7 call @ $0.76
- Selling 2 UNG June 16 2023 10 calls @ $0.14
- Buying 1 UNG June 16 2023 15 calls @ $0.05
Essentially, this involves exiting the long 10 and short 15 strike price bull call spread and "rolling down" to the long 7 and short 10 strike price bull call spread. The particulars for the new, adjusted position compared to the original position appear below. The new 7-10 strike price spread is the "Left Trade" below; the original 10-15 strike price spread is the "Right Trade" below.
Jay also updated a short put idea in the real estate sector, which has worked very well. He outlines some ways a trader holding this position could adjust it to realize the profit or hold it further.
About TradingEdge Weekly...
The goal of TradingEdge Weekly is to summarize some of the research published to SentimenTrader over the past week. Sometimes there is a lot to digest, and this summary highlights the highest conviction or most compelling ideas we discussed. This is NOT the published research; rather, it pulls out some of the most relevant parts. It includes links to the published research for convenience, and if you don't subscribe to those products, it will present the options for access.
Indicators at Extremes
|
|
|
|
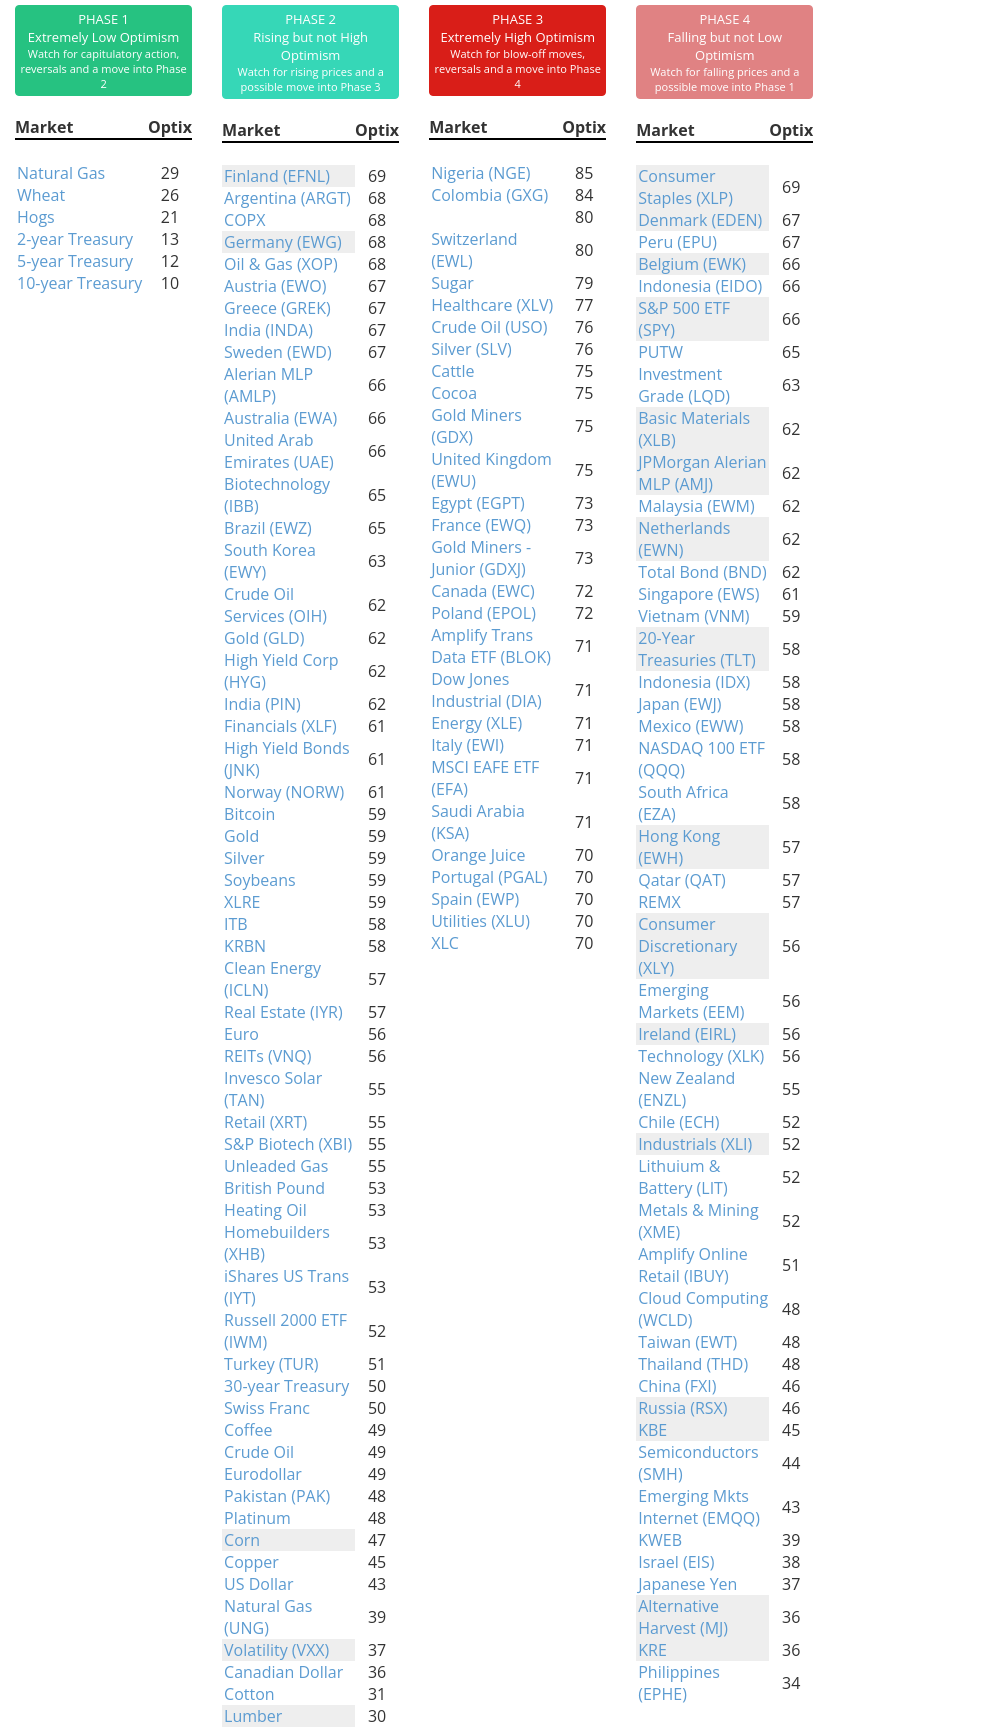
Phase Table
|
|
|
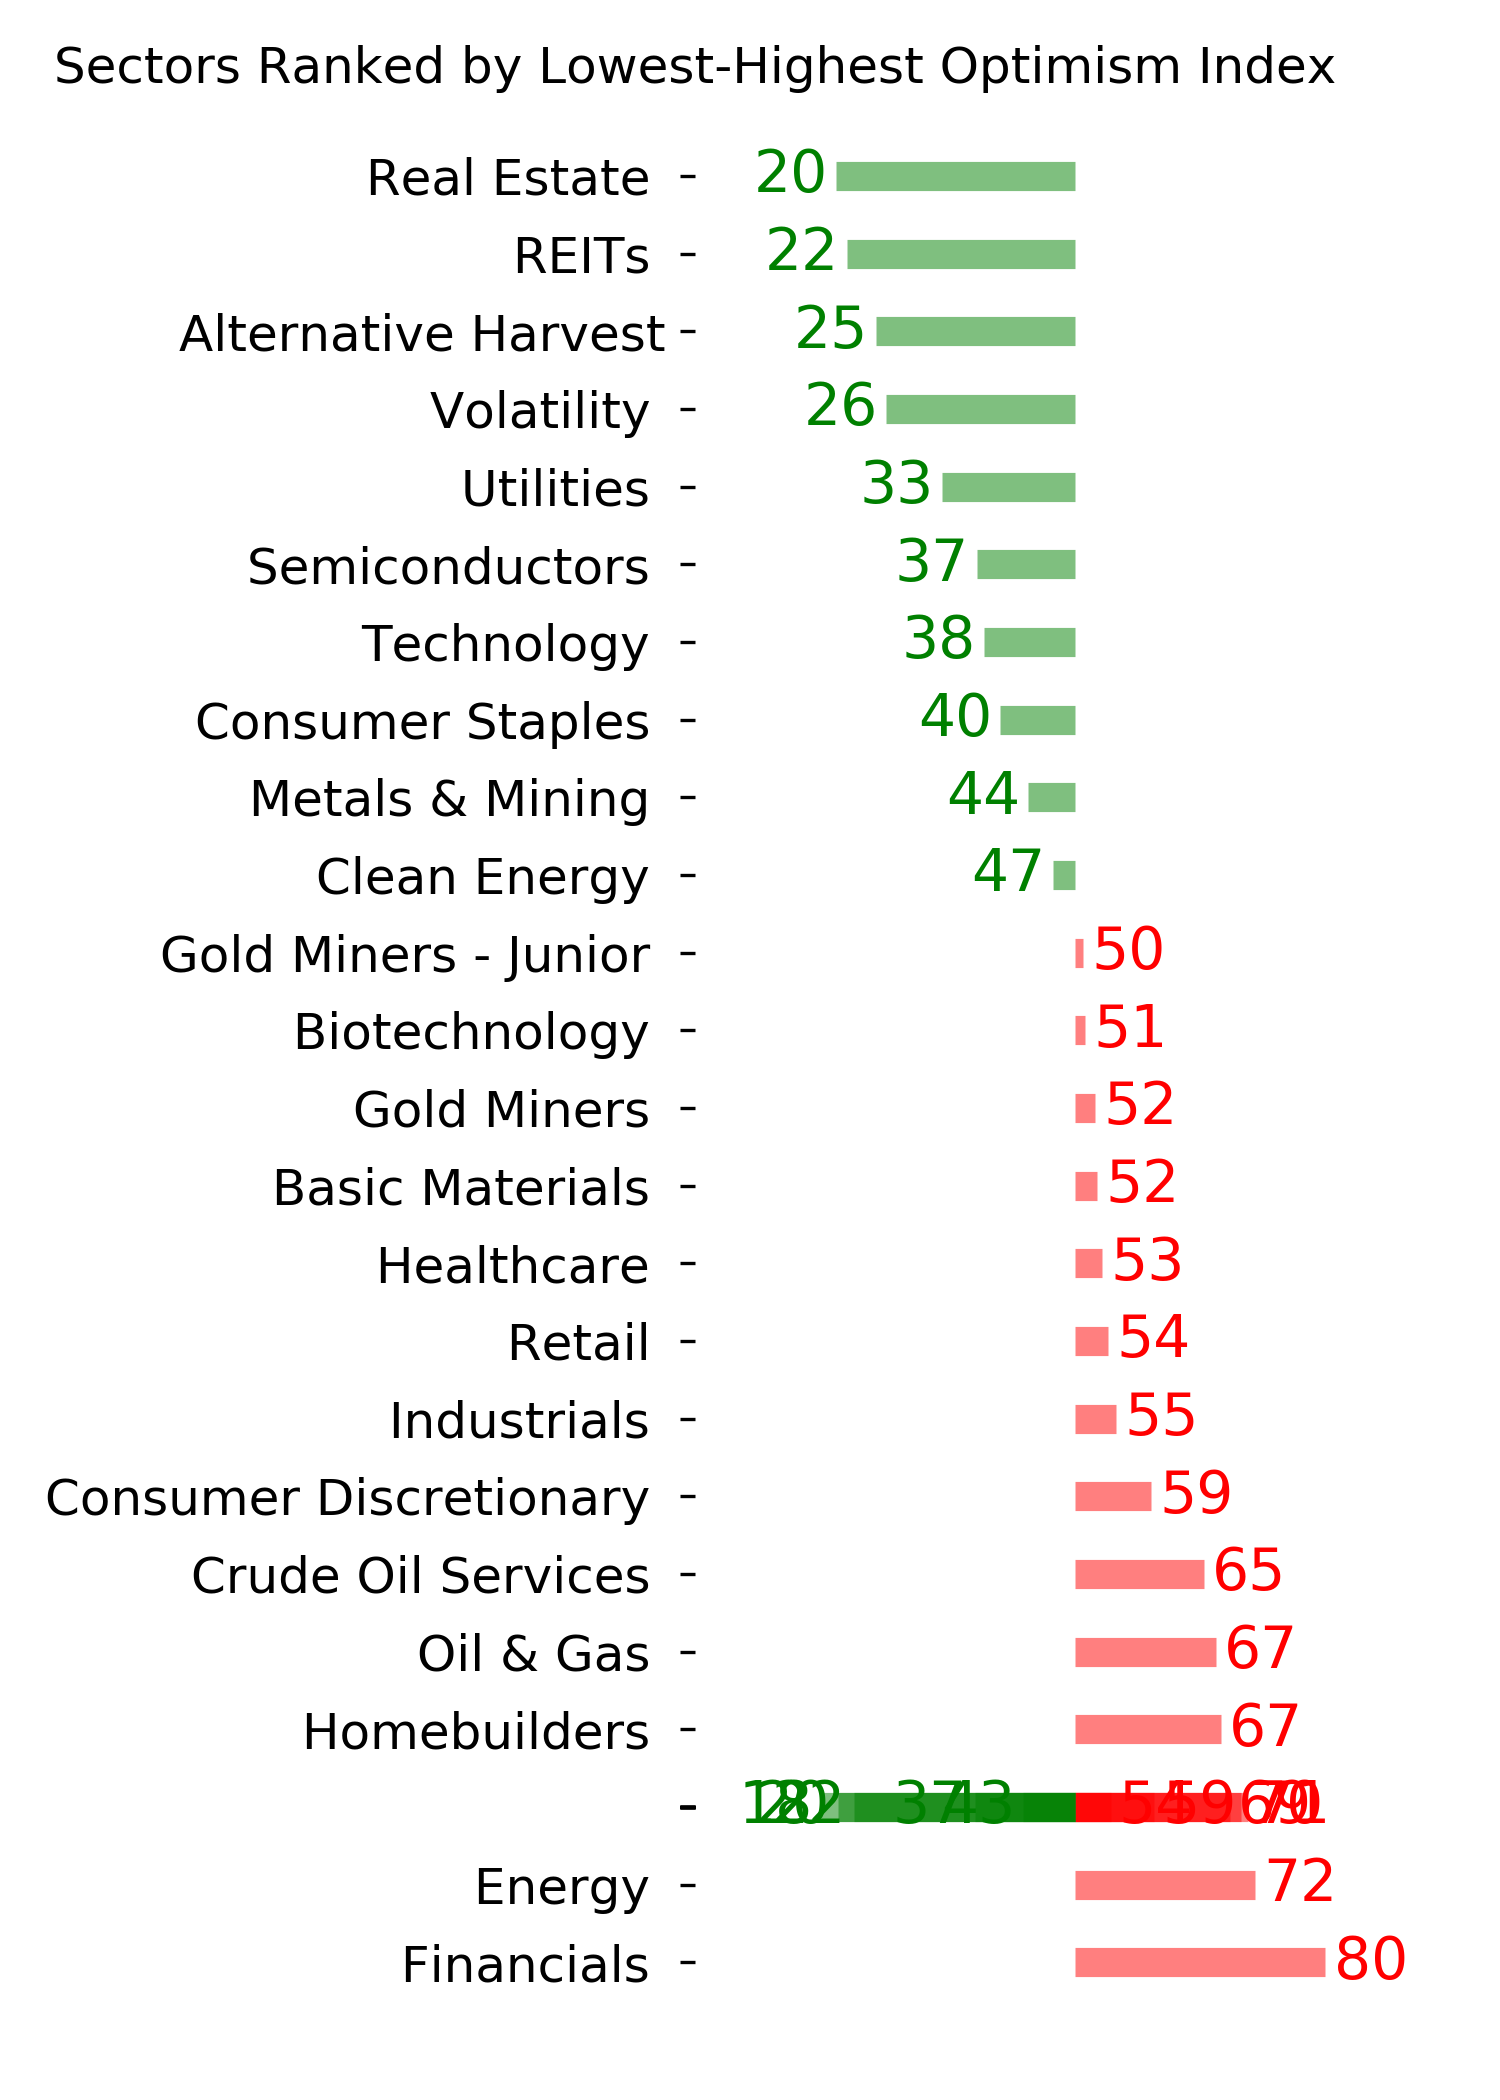
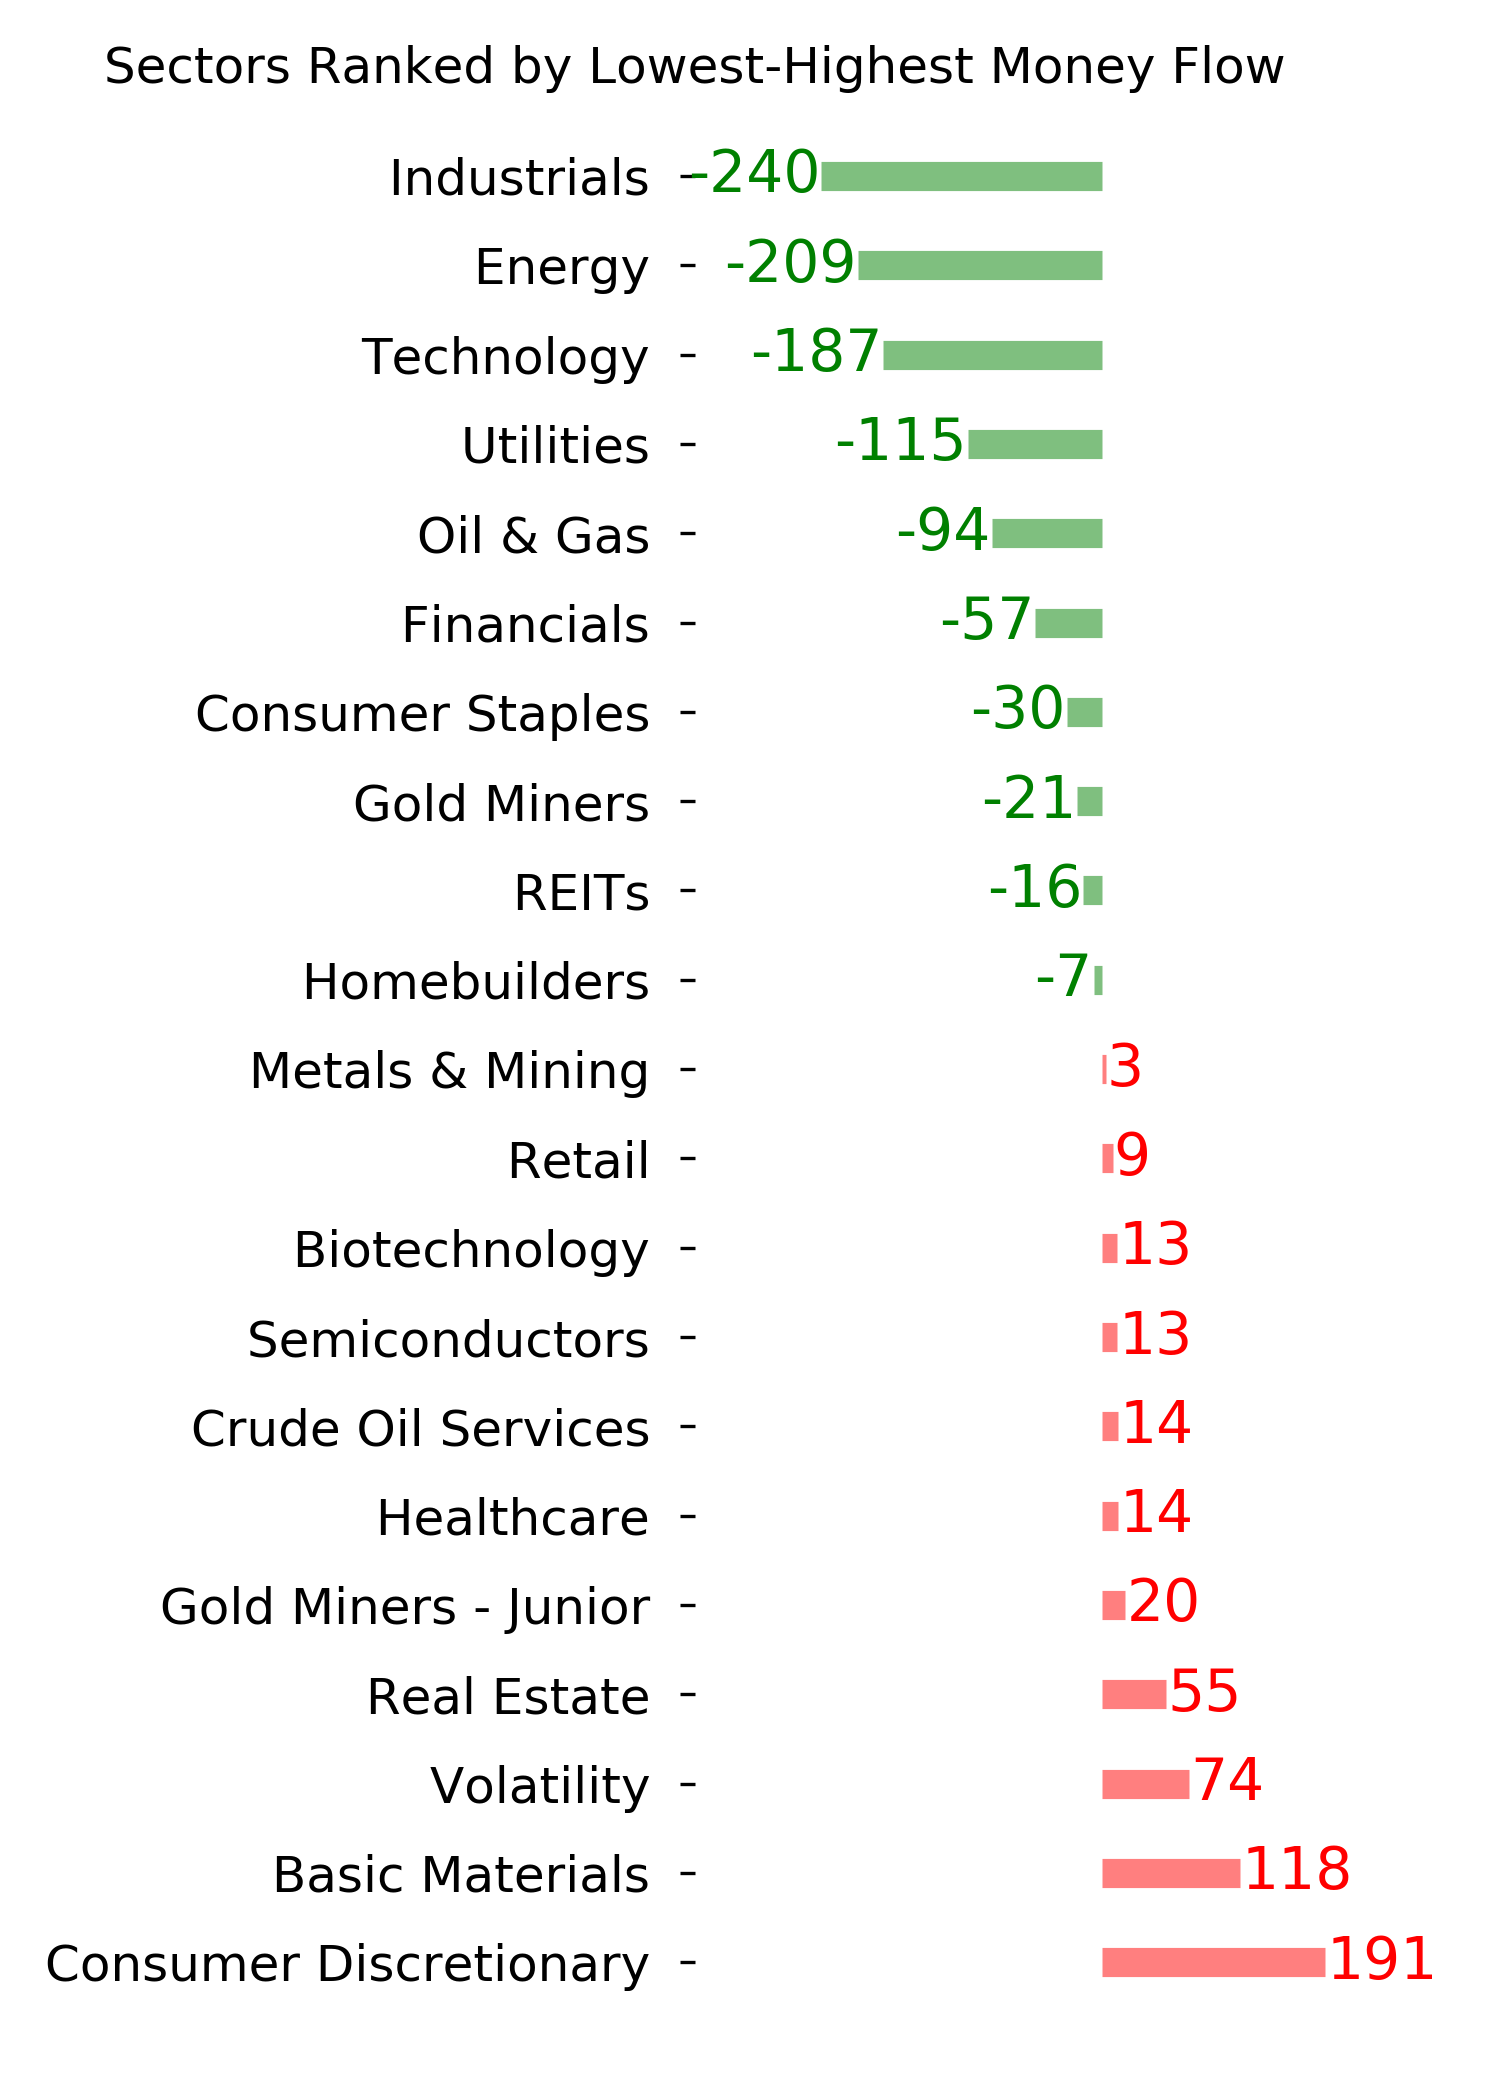
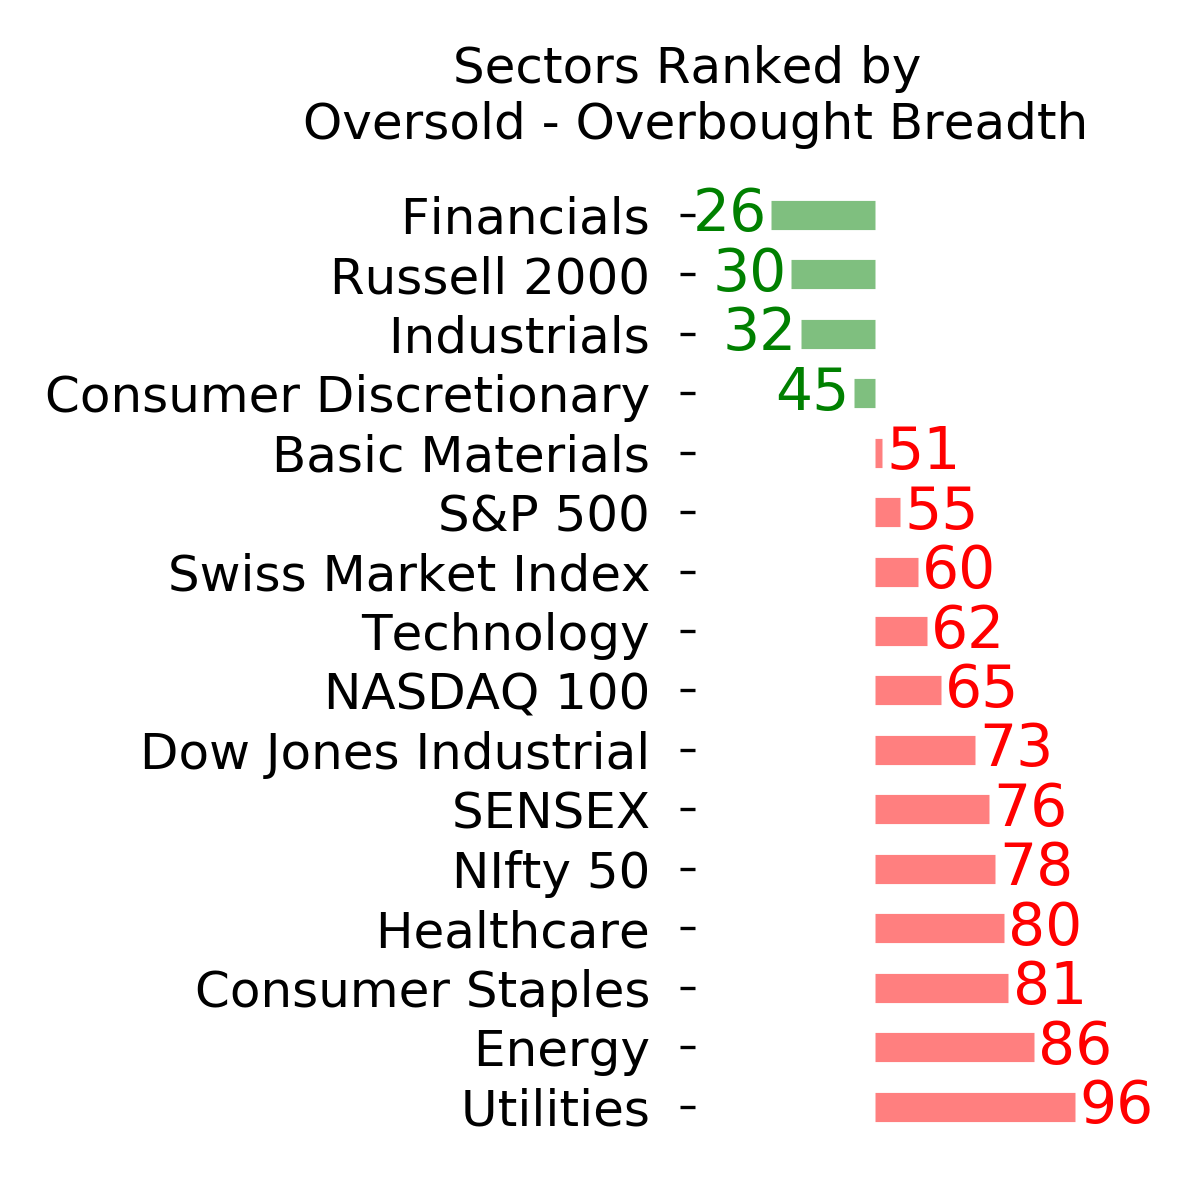
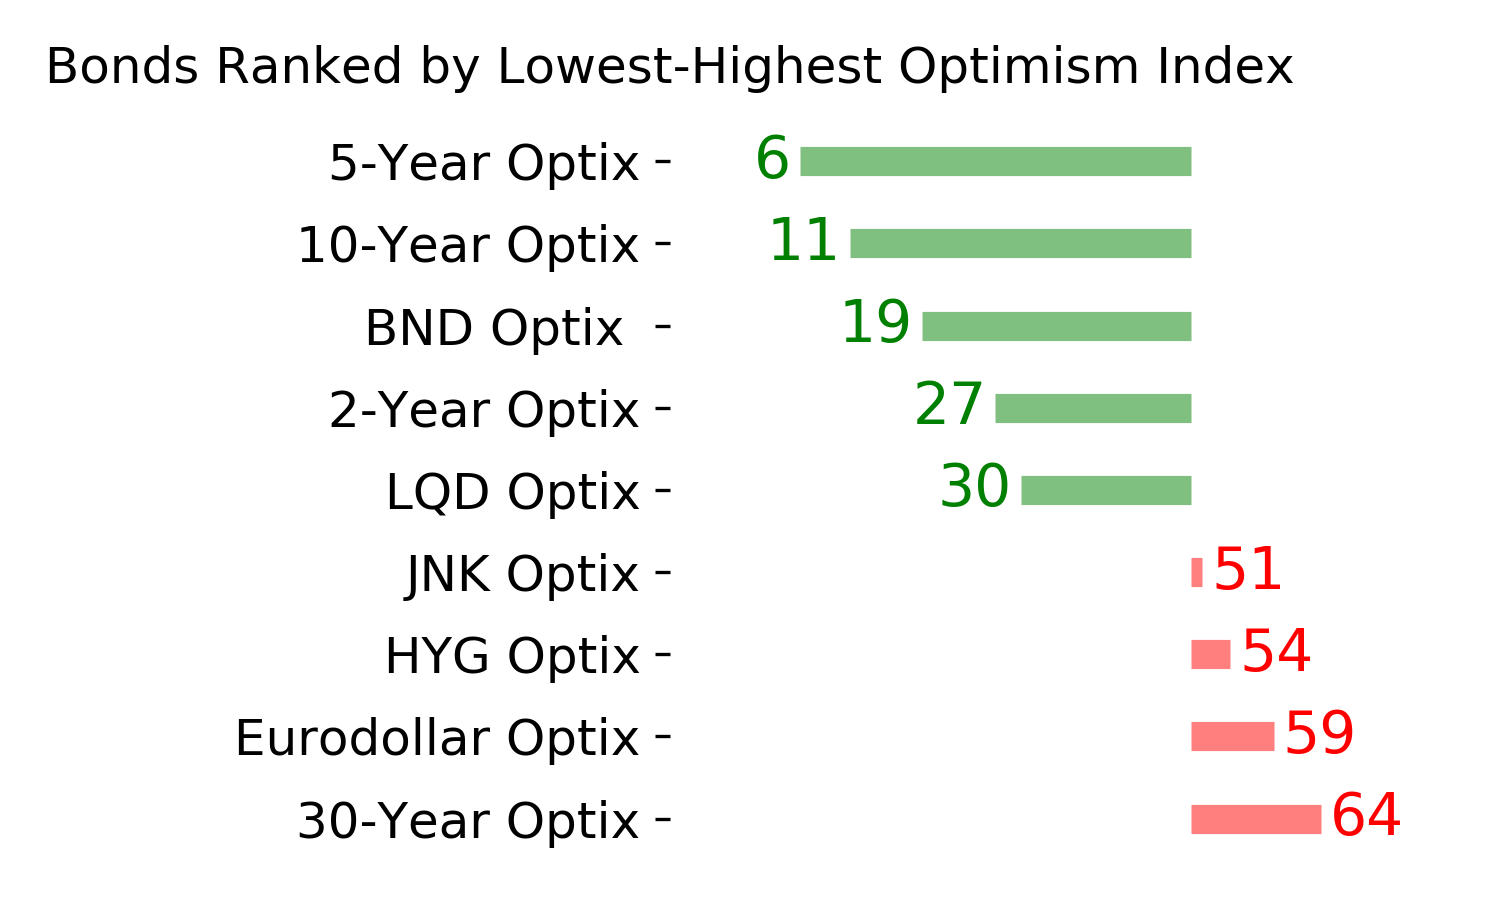
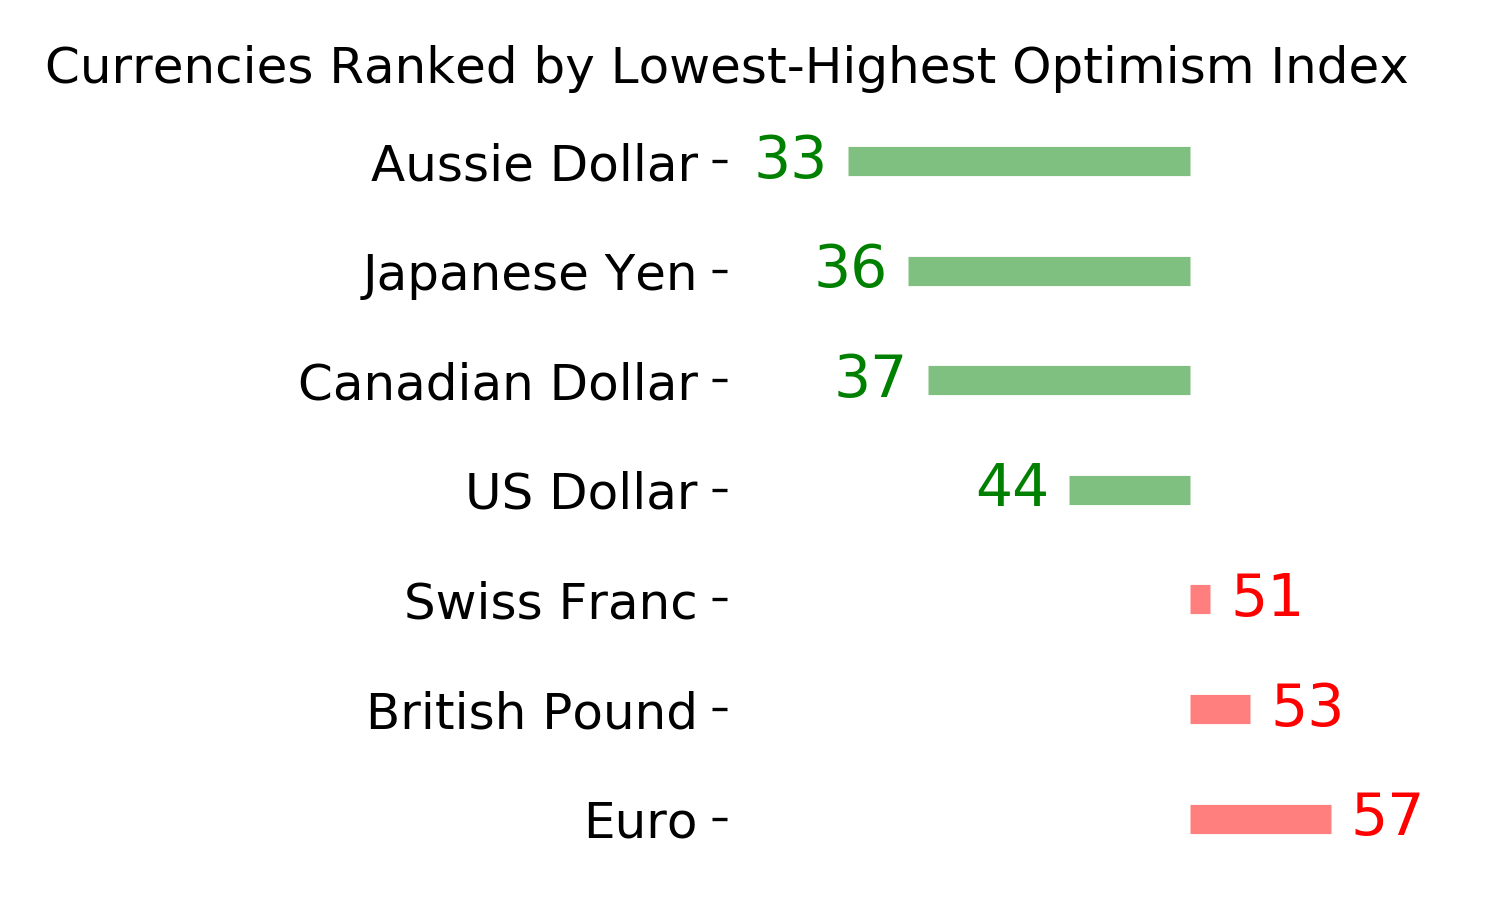
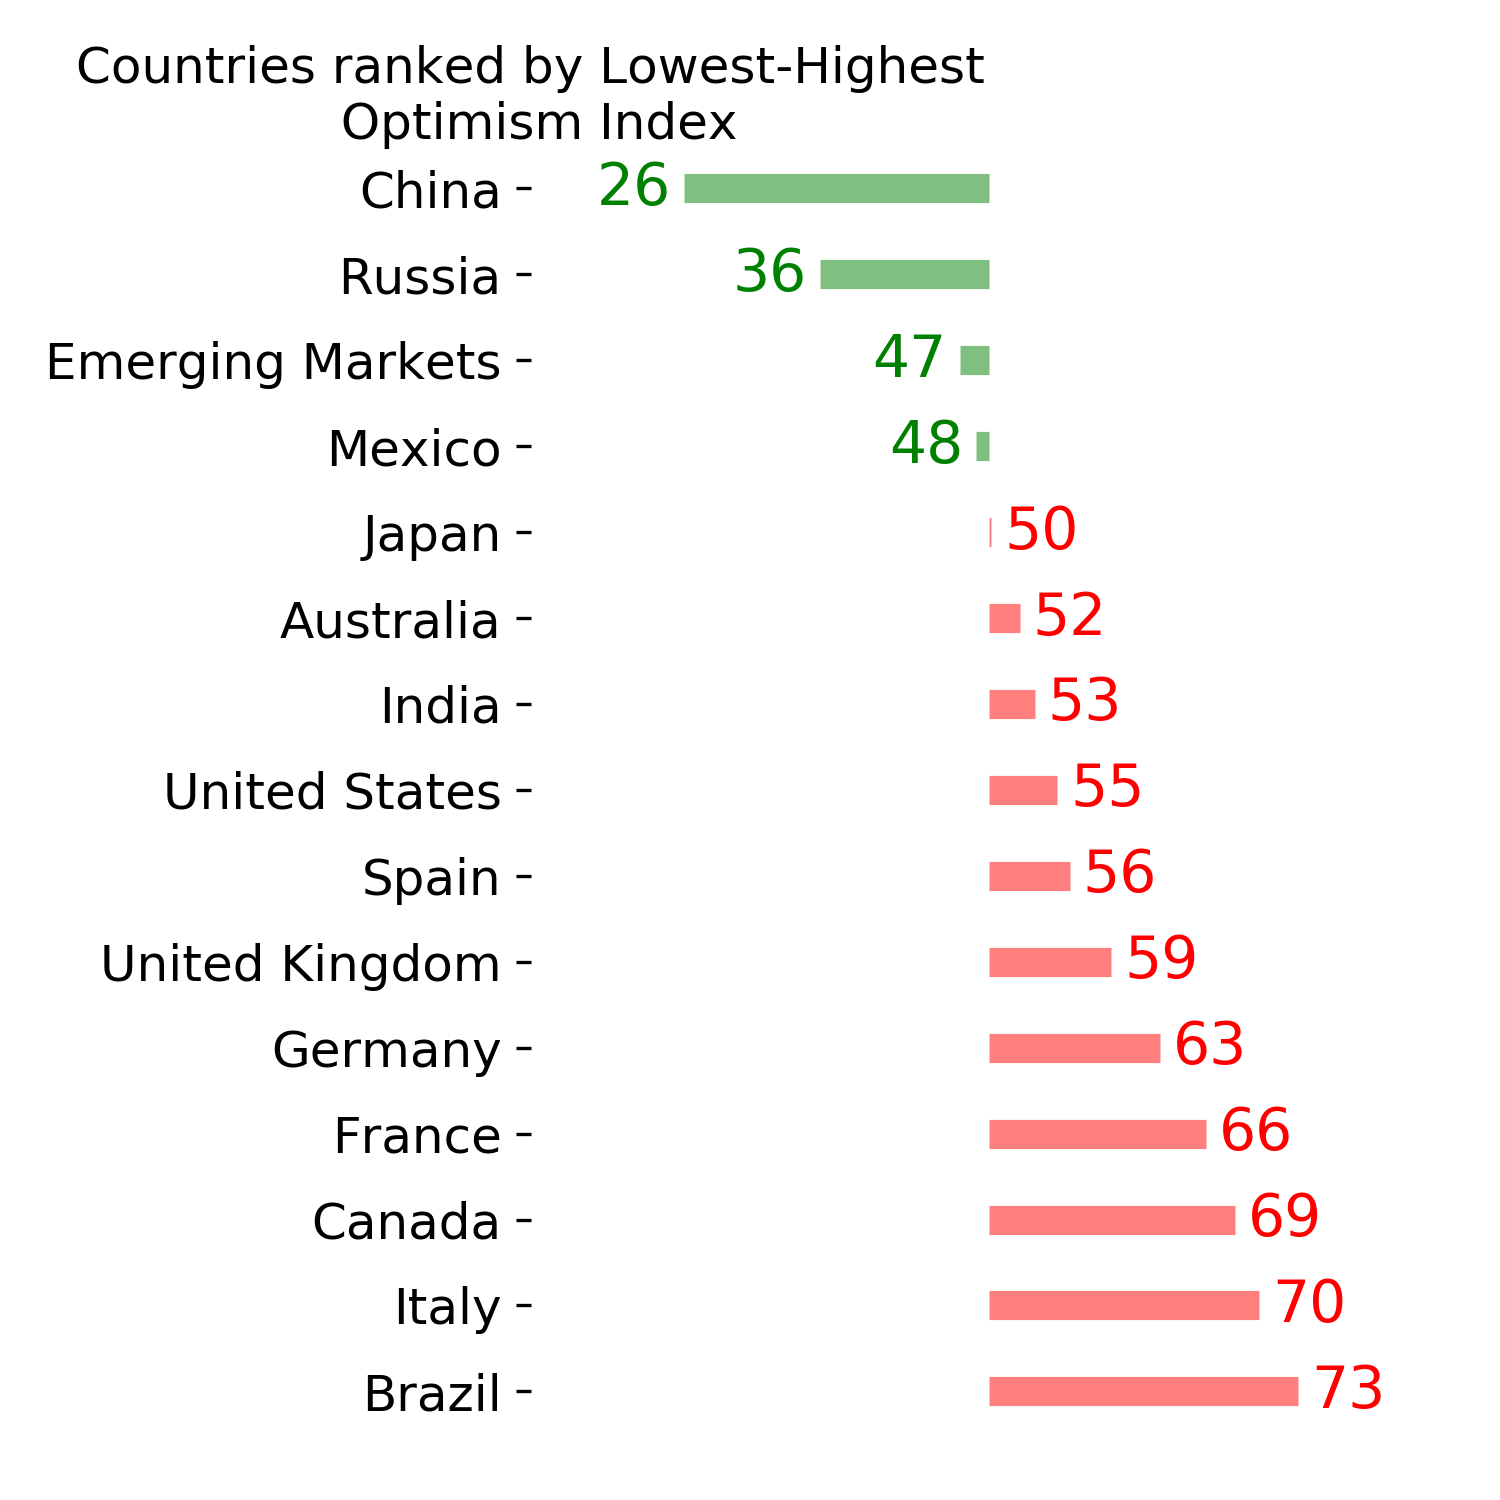
Ranks
|
|
|
|
|
|
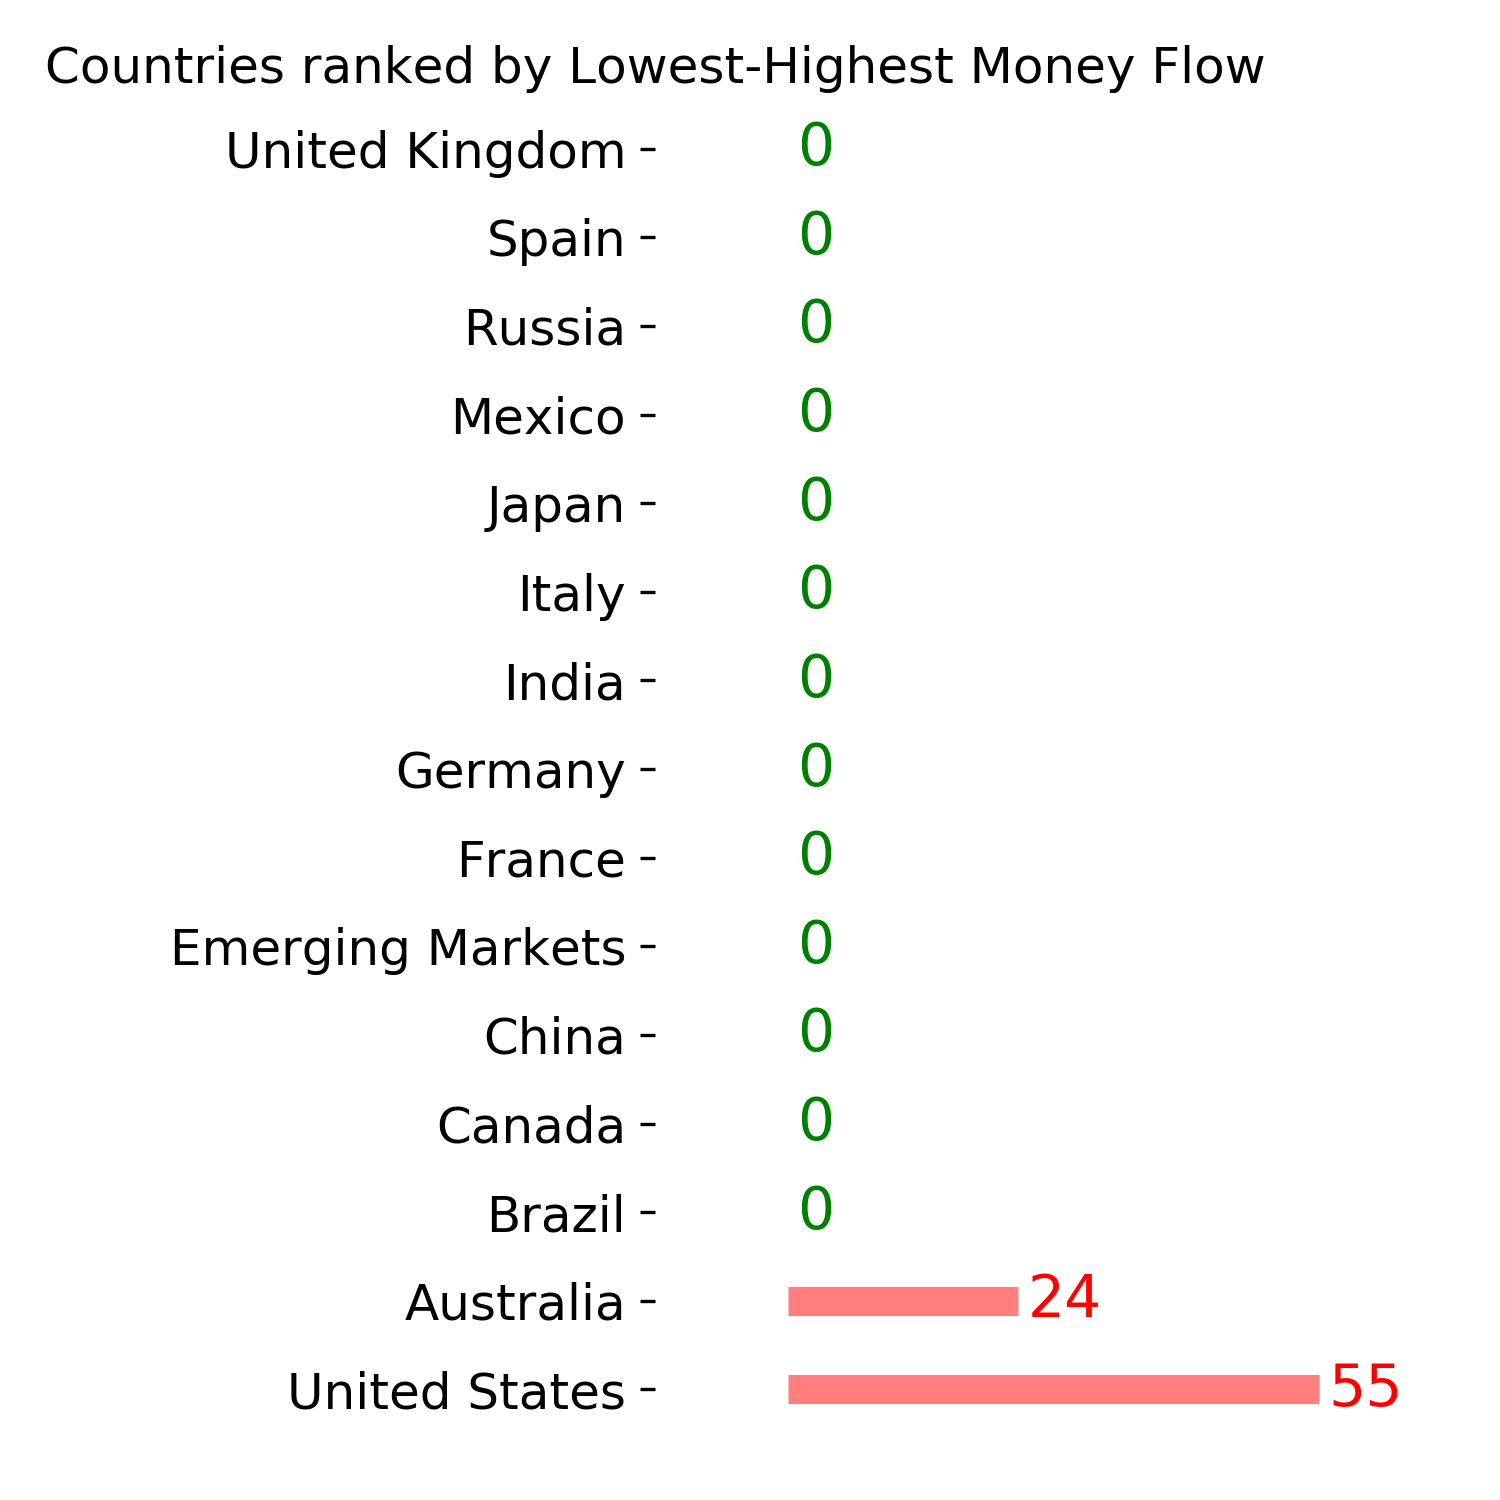
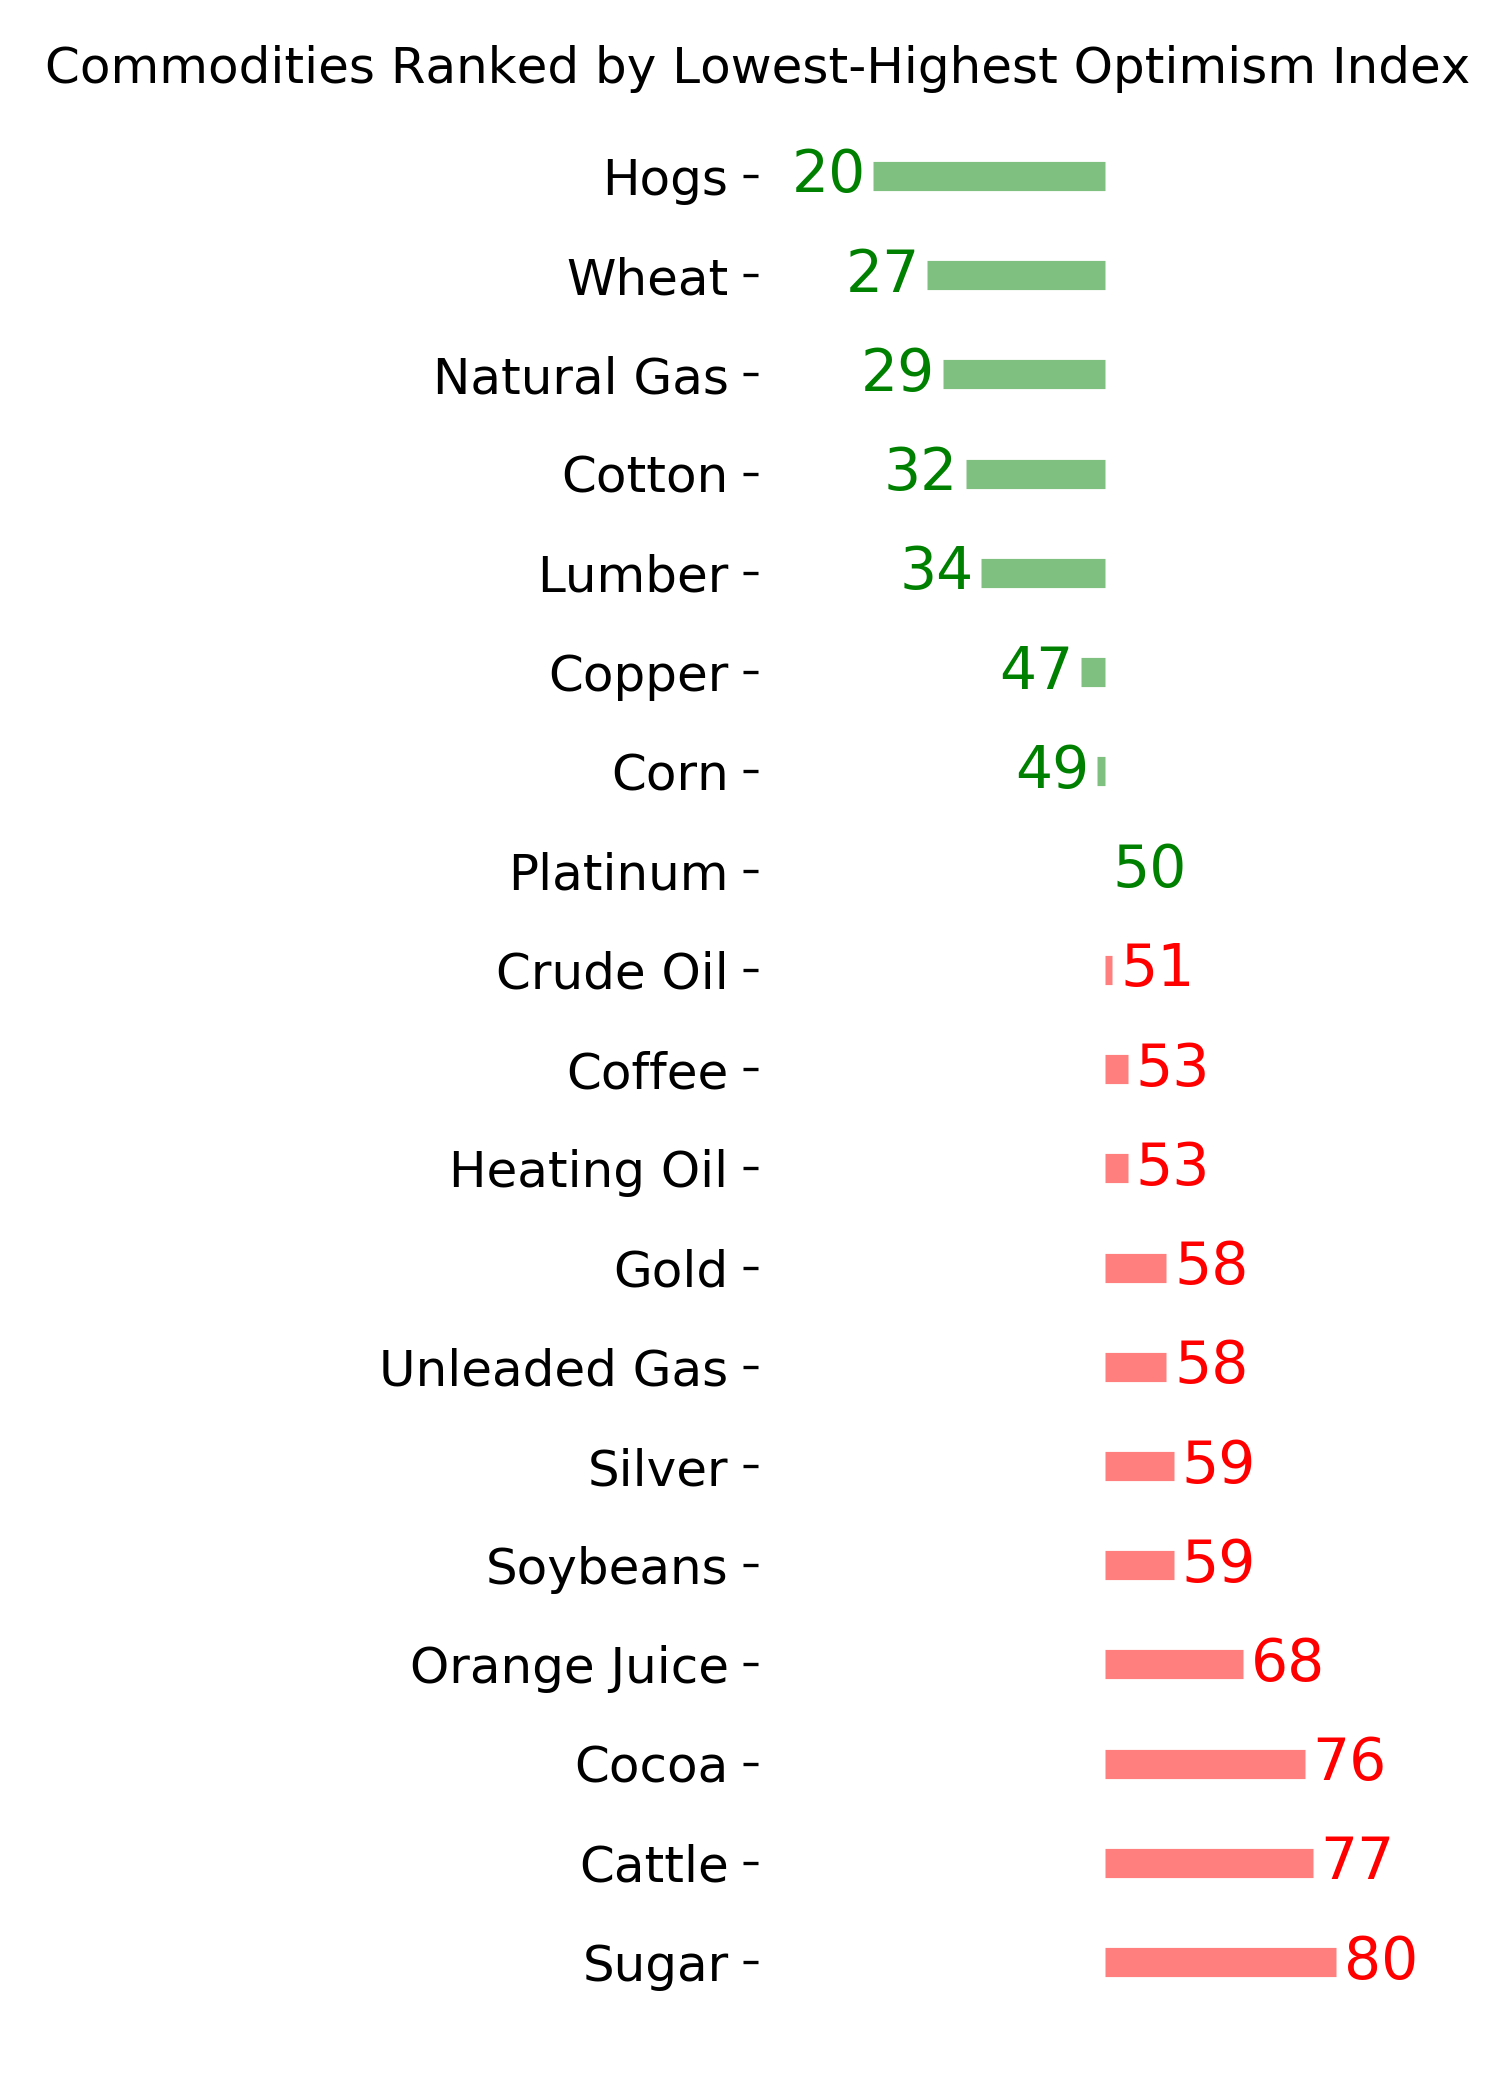
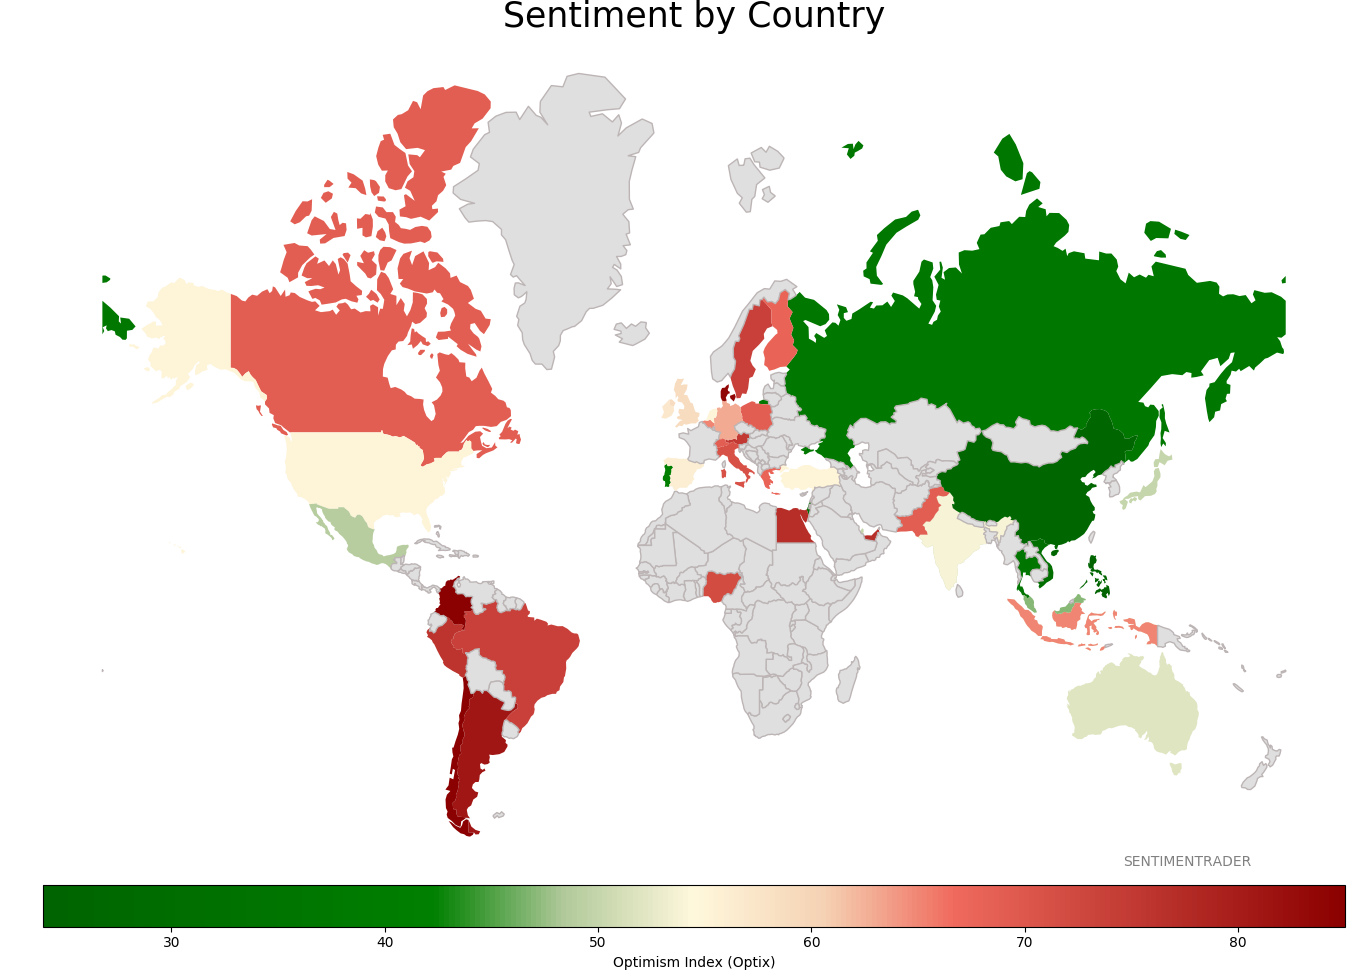
Sentiment Around The World
|
|
|
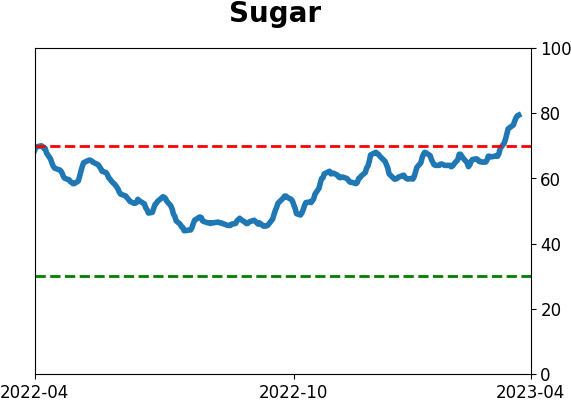
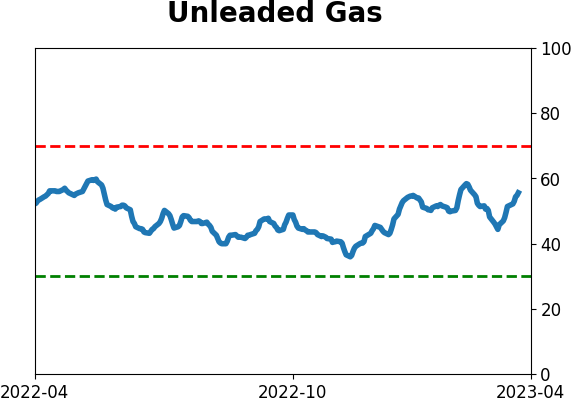
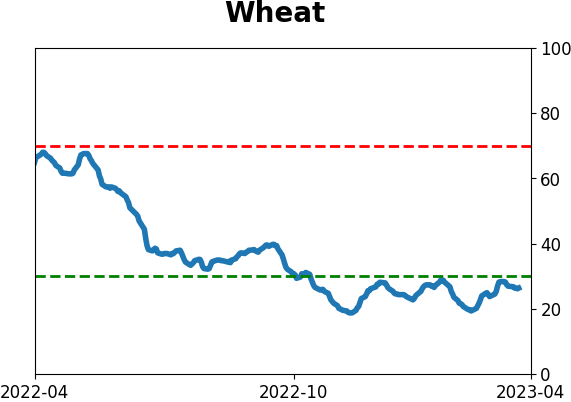
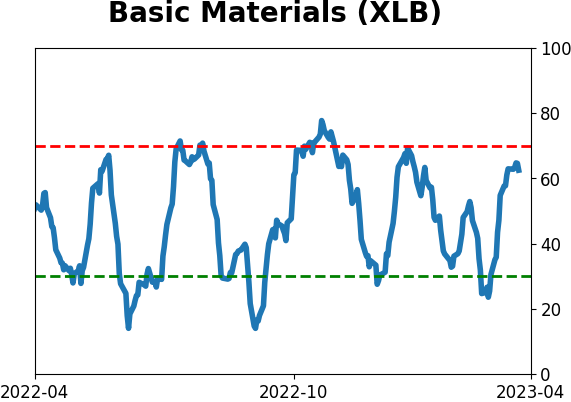
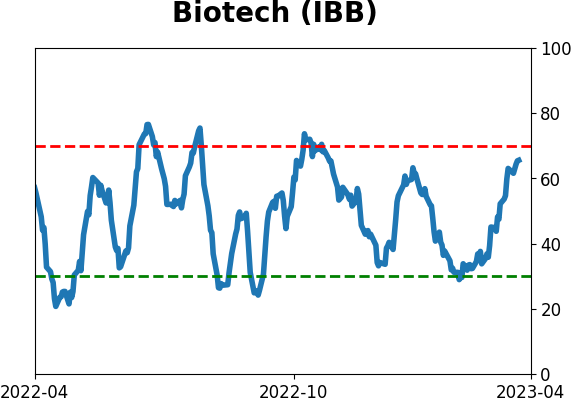
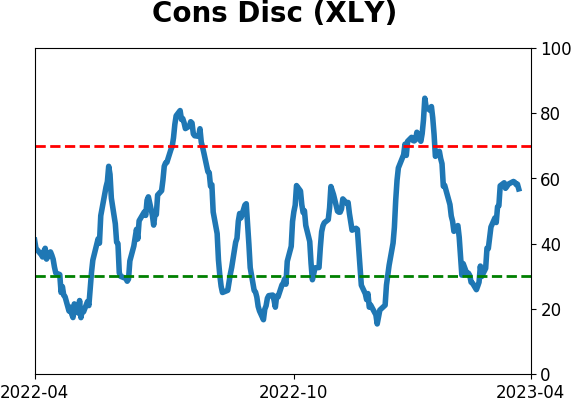
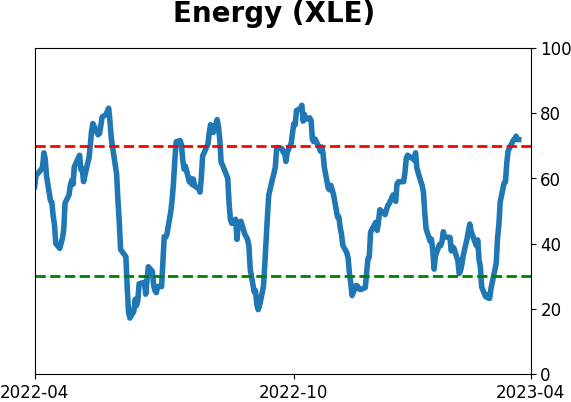
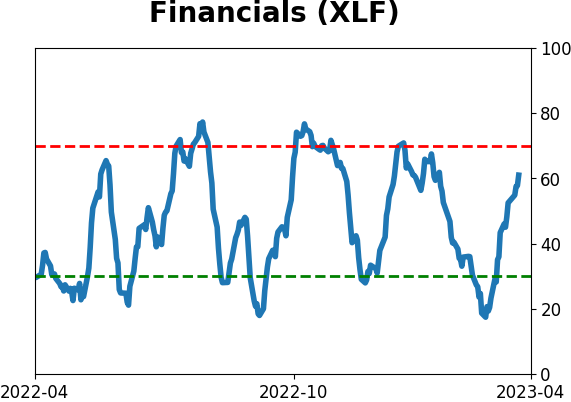
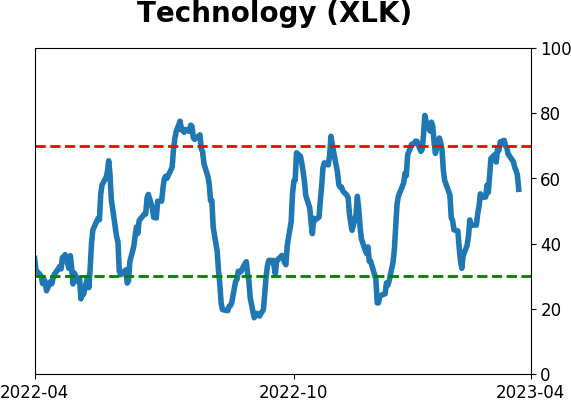
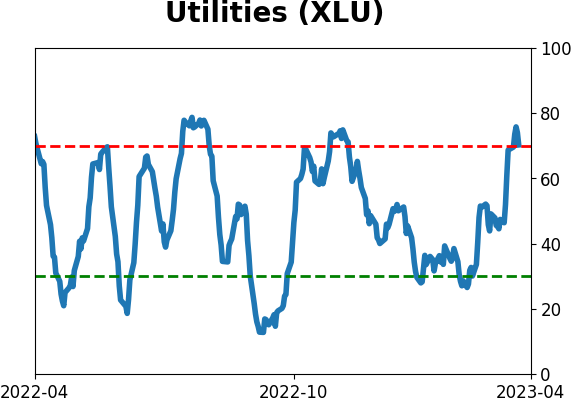
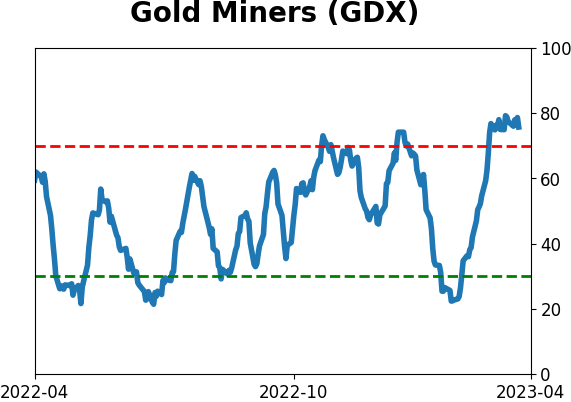
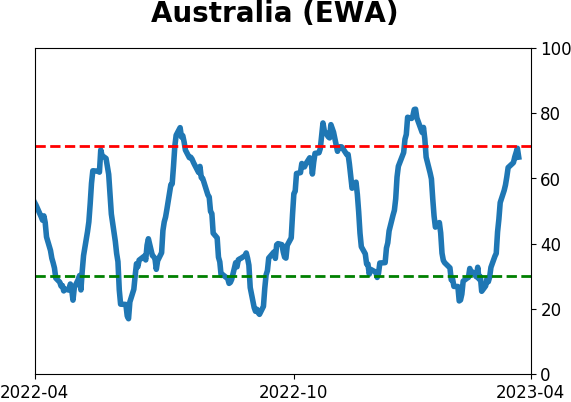
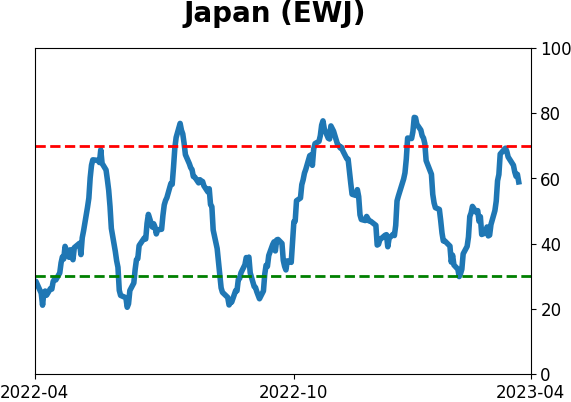
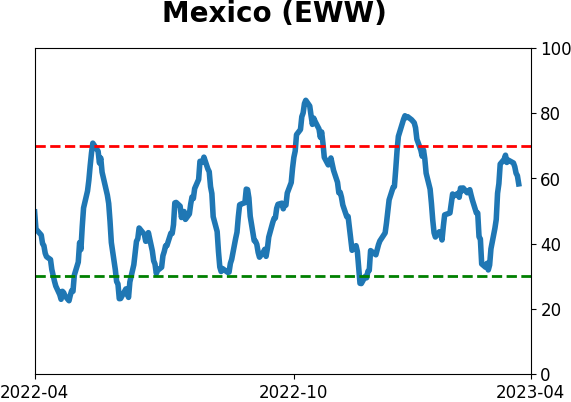
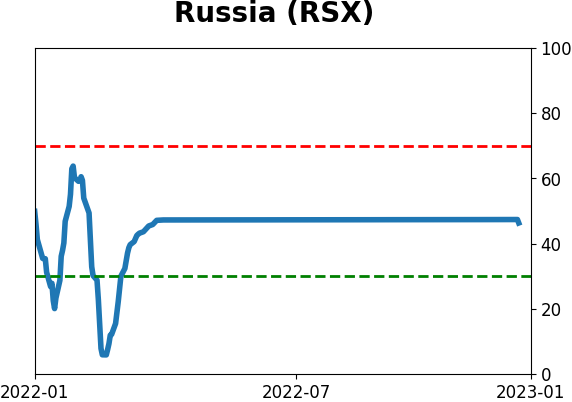
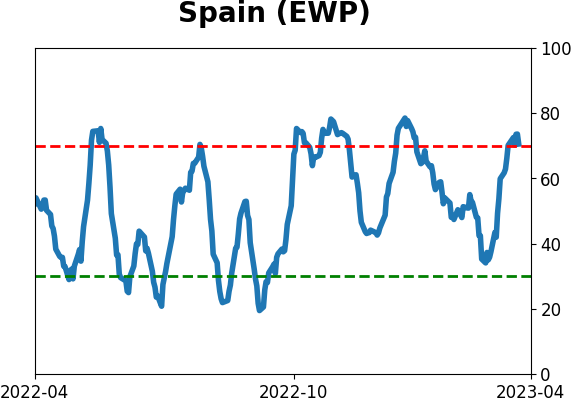
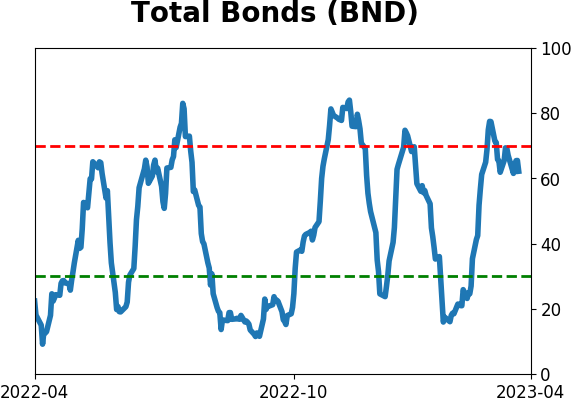
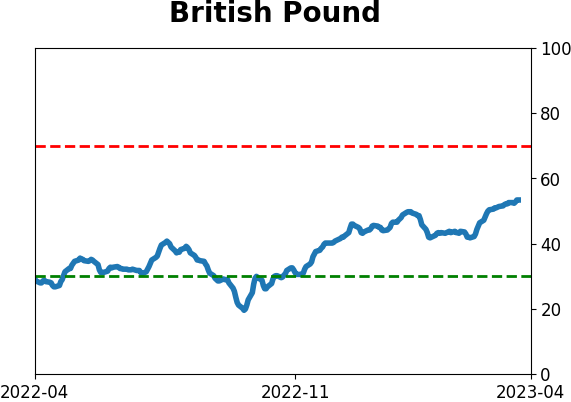
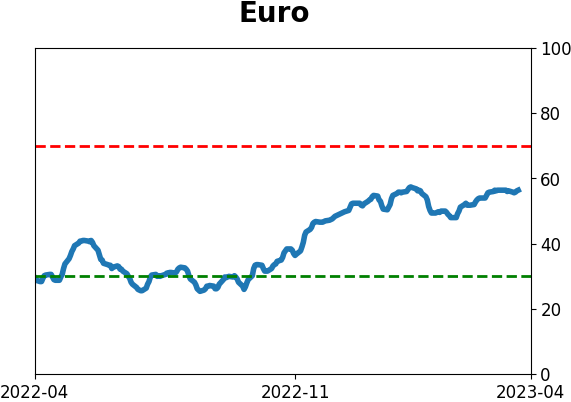
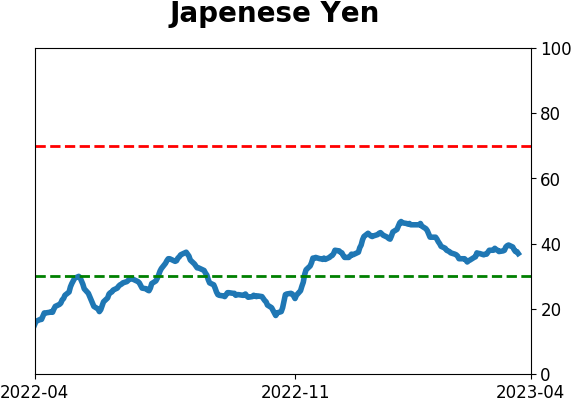
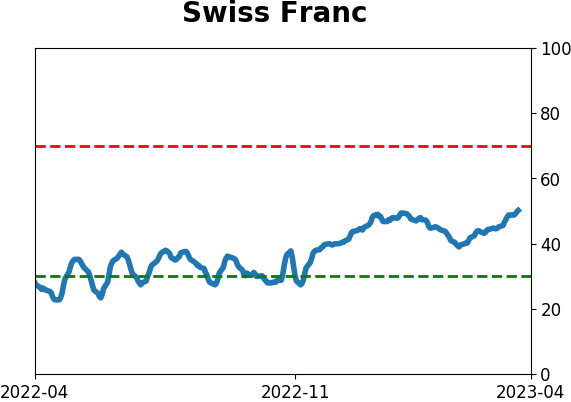
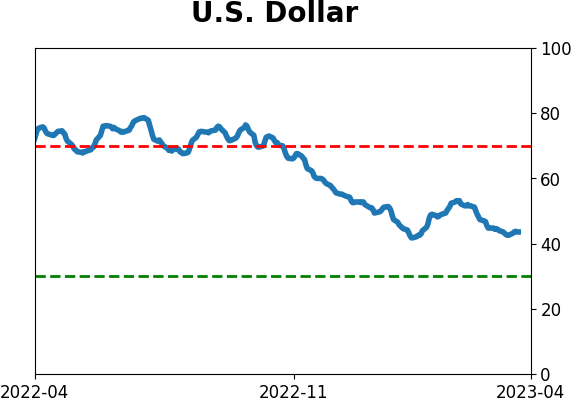
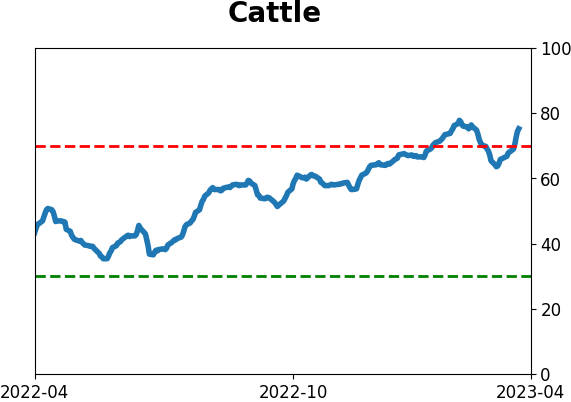
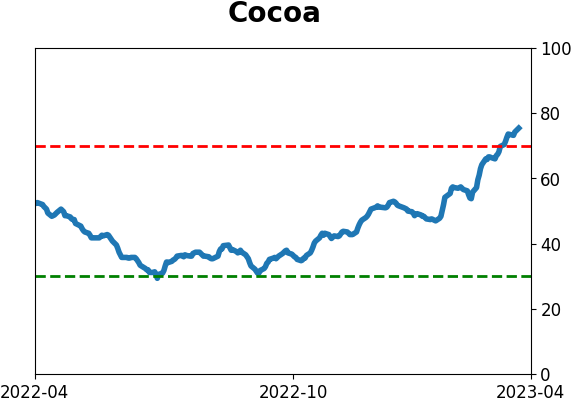
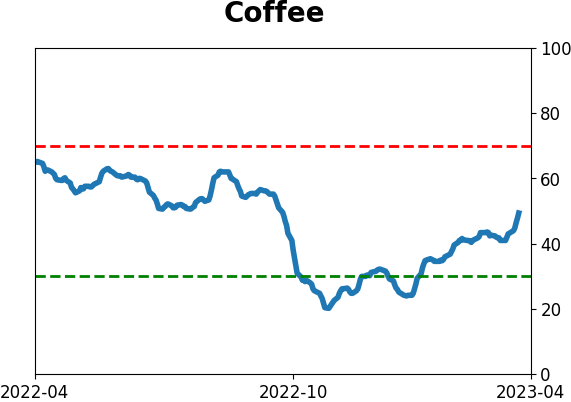
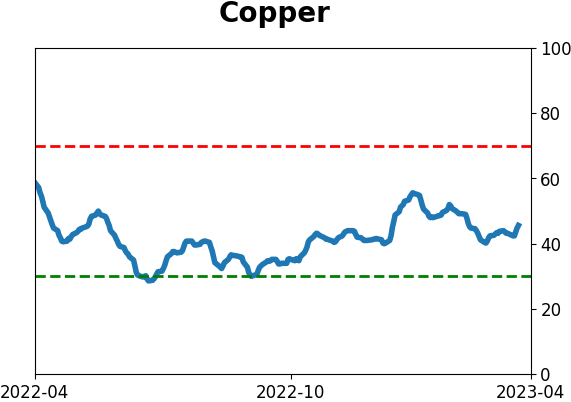
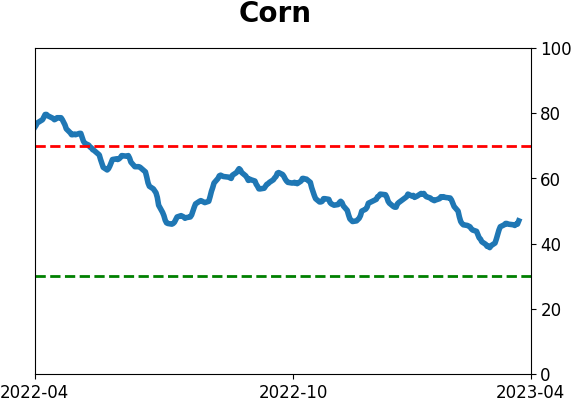
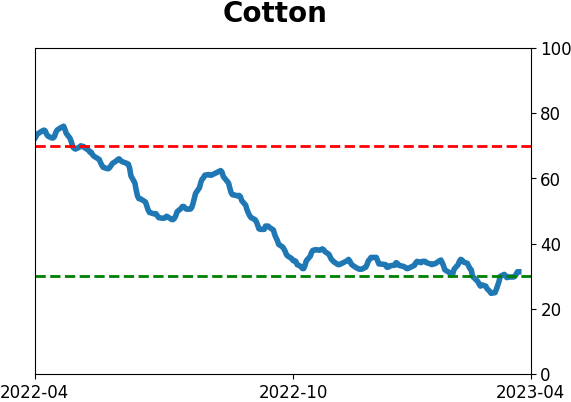
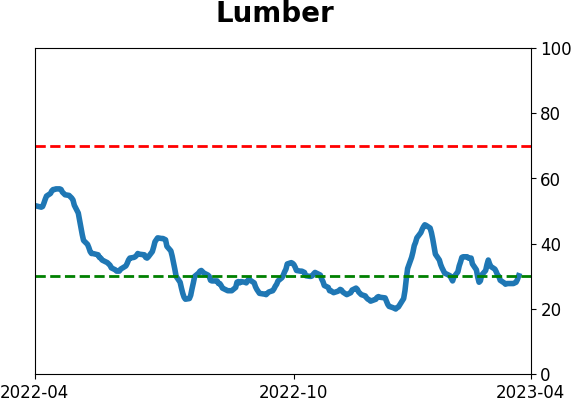
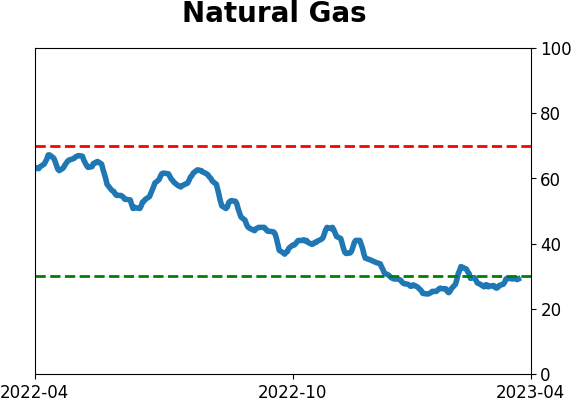
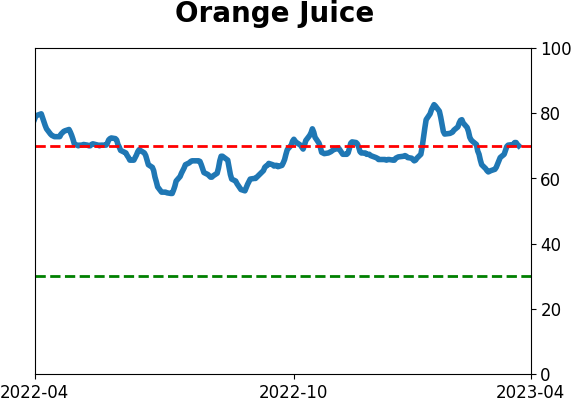
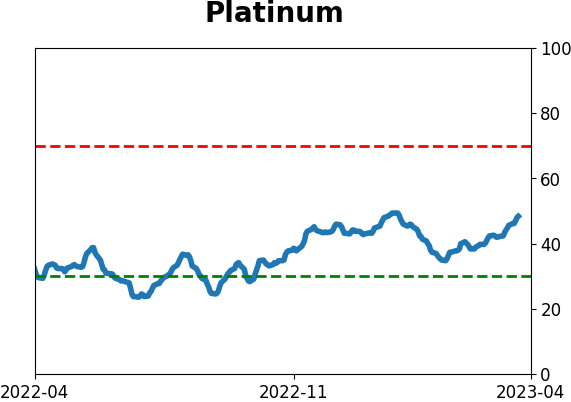
Optimism Index Thumbnails
|
|
|
|
|
|
|
|
|
|
|
|
|
|

|
|
|
|
|
|
|