Headlines
|
|
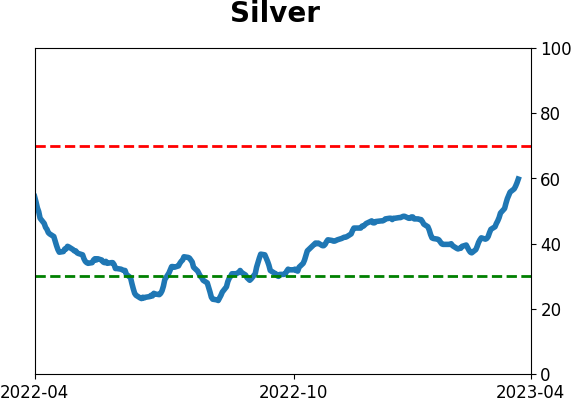
Its time to keep an eye on silver:
Silver has rallied sharply since bottoming in September 2022. With gold threatening to make new all-time highs, many pundits expect silver to continue to rally. However, seasonality suggests that any downside surprises could be swift and severe if silver fails to follow through in the weeks ahead.
|
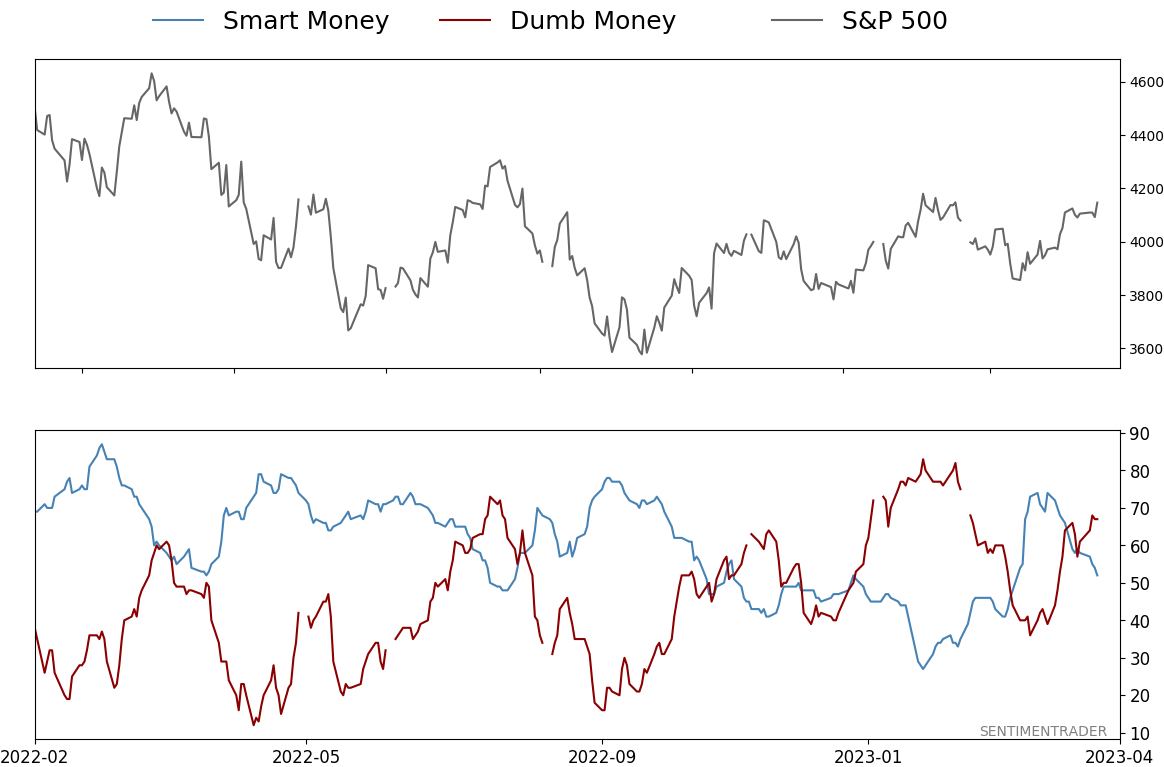
Smart / Dumb Money Confidence
|
Smart Money Confidence: 52%
Dumb Money Confidence: 67%
|
|
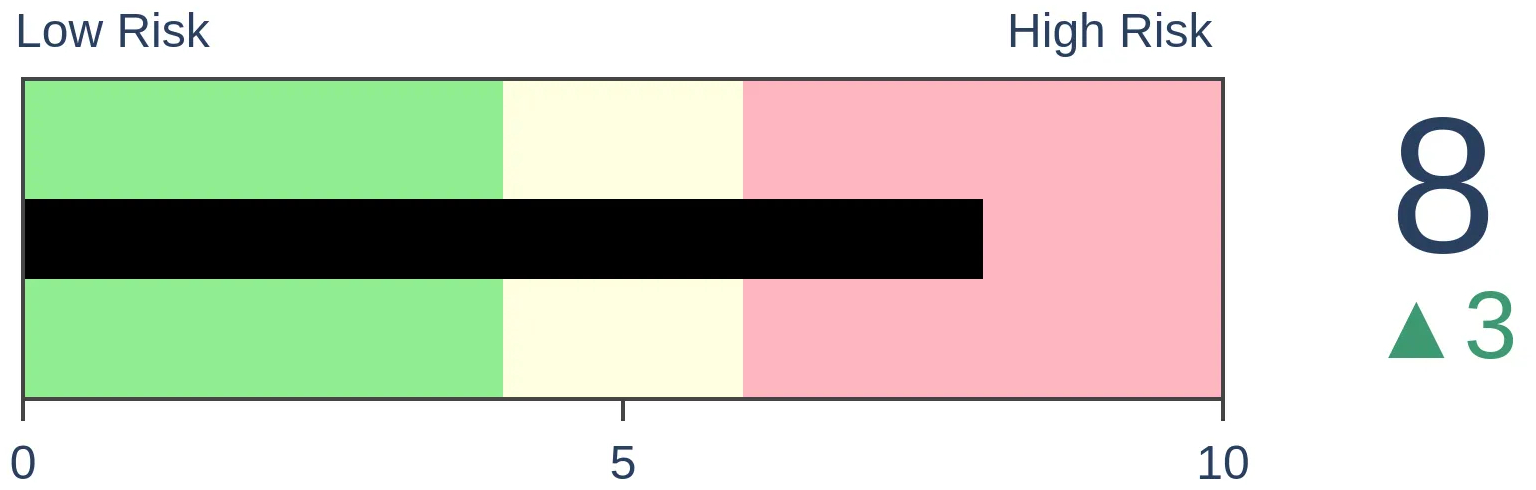
Risk Levels
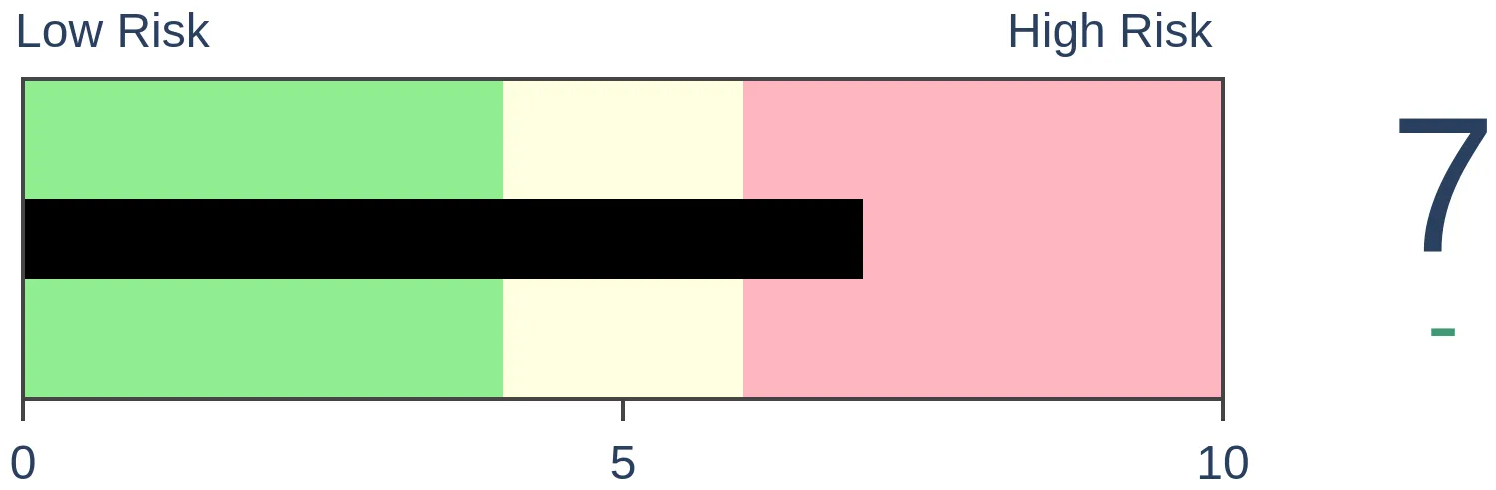
Stocks Short-Term
|
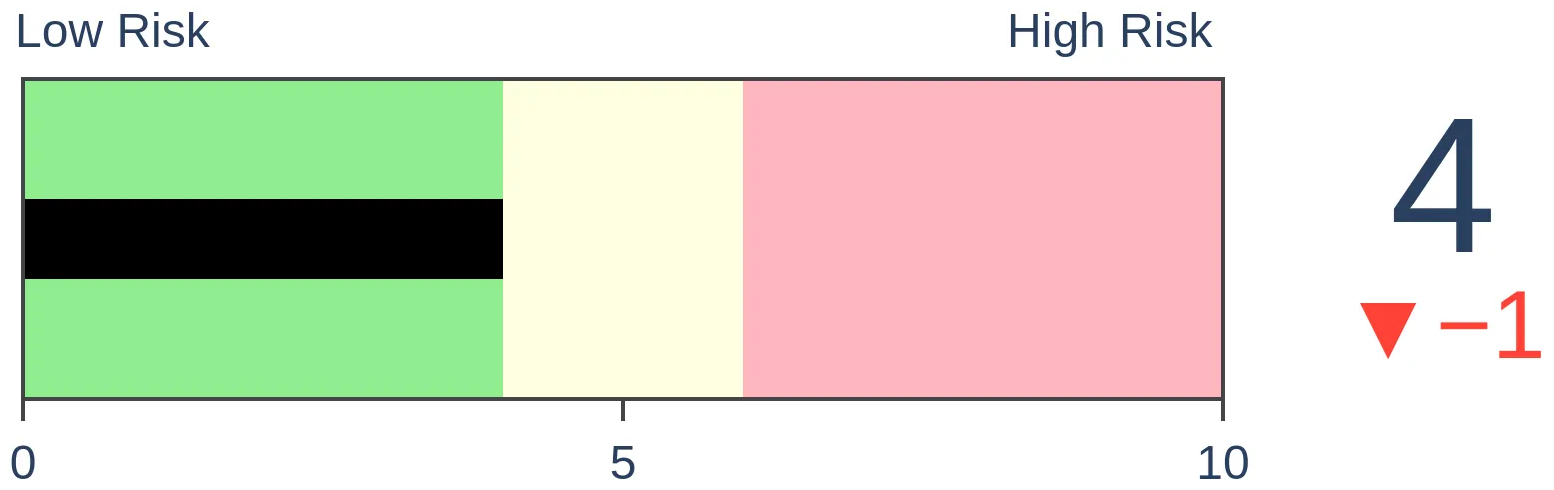
Stocks Medium-Term
|
|
Bonds
|
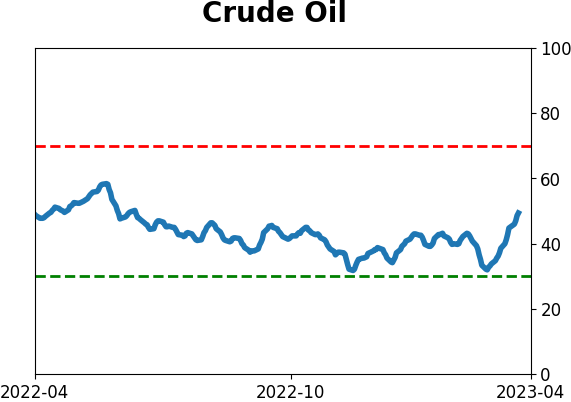
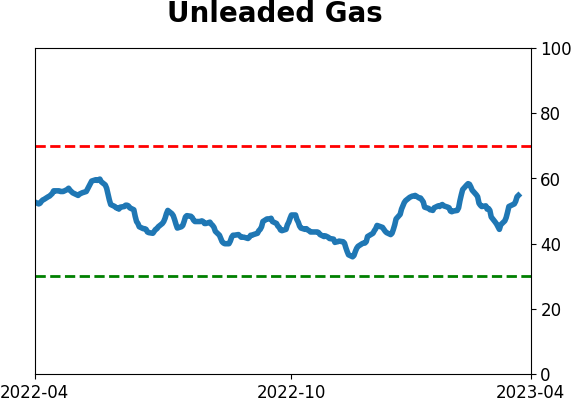
Crude Oil
|
|
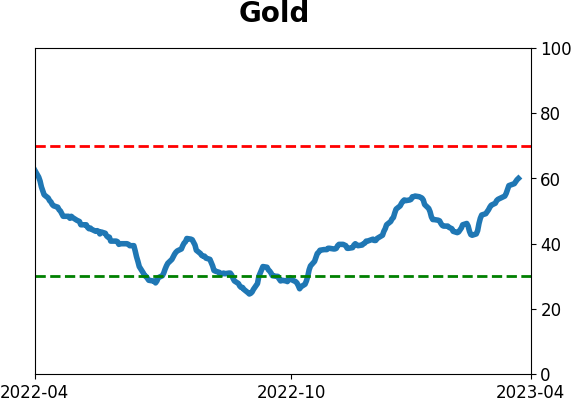
Gold

|
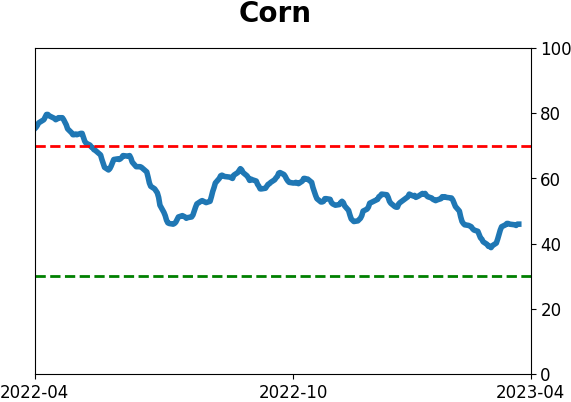
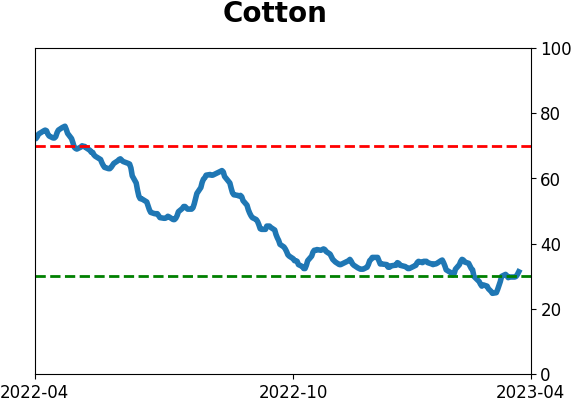
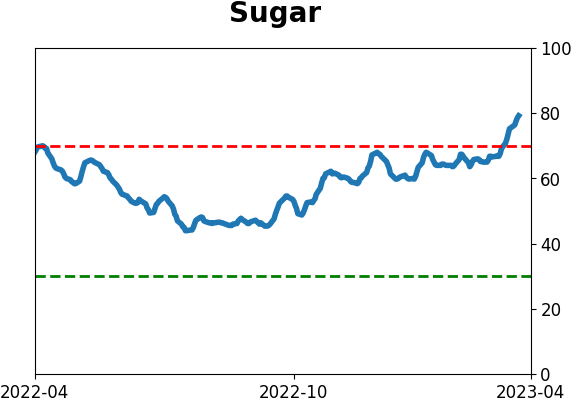
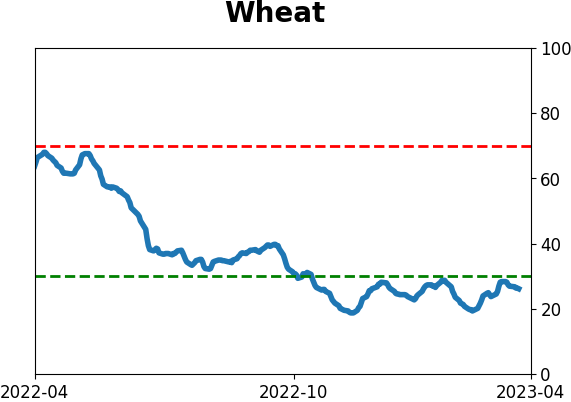
Agriculture

|
|
Research
By Jay Kaeppel
BOTTOM LINE
Silver has rallied sharply since bottoming in September 2022. With gold threatening to make new all-time highs, many pundits expect silver to continue to rally. However, seasonality suggests that any downside surprises could be swift and severe if silver fails to follow through in the weeks ahead.
FORECAST / TIMEFRAME
None
|
Key points
- Silver has rallied almost 50% since bottoming in September 2022
- As strength often begets strength, this precious metal may be poised for an upside breakout
- But if silver fails to rally, two seasonal factors could bring traders an unpleasant surprise
Silver price action remains favorable
The weekly chart below (courtesy of StockCharts.com) displays the price action of silver and the recent rally off of the September 2022 lows.
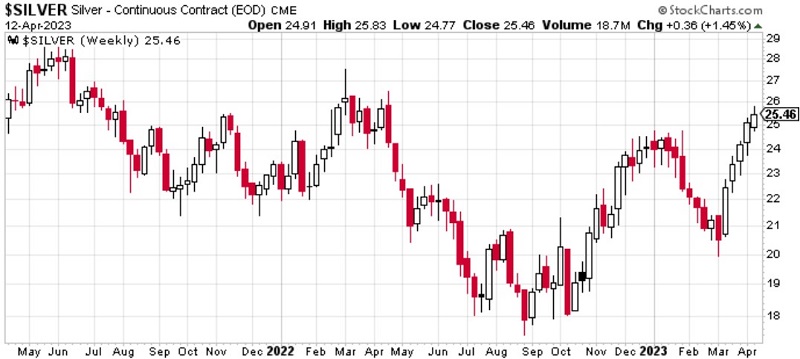
Many pundits suggest that precious metals are poised for an upside breakout and a historic rally. We have no "prediction" regarding which way silver goes from here. The critical thing to focus on is to monitor price action closely. As long as the rally continues, playing the short side of the silver market is dangerous ("The trend is your friend"). That said, if price does falter, history suggests the potential for a very ugly surprise. Let's take a closer look at that history.
A closer look at silver annual seasonality
The chart below displays the annual seasonal trend for seasonal futures. As always, it is essential to understand that this chart presents the average of what has occurred in the past and is not some roadmap of what will happen this year.
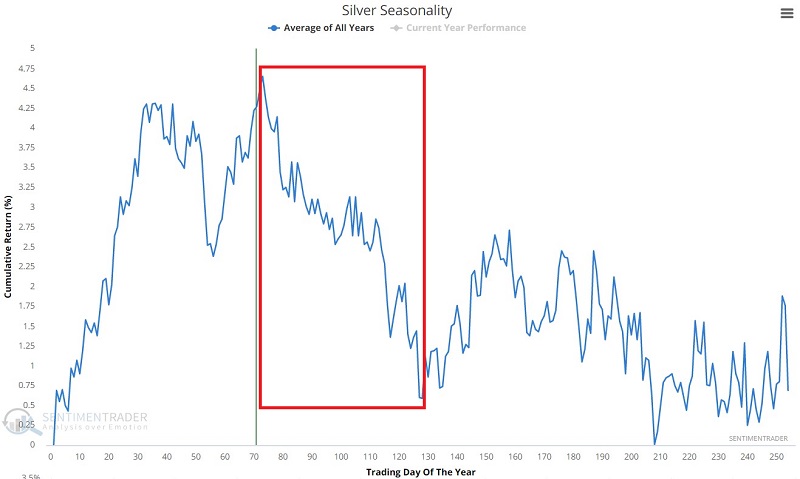
With that caveat in mind, it is potentially helpful to note that silver is about to enter its most unfavorable time of year. This period extends from the close of Trading Day of Year (TDY) #73 through TDY #128. For 2023, this period runs from the close on 2023-04-13 through 2023-06-29.
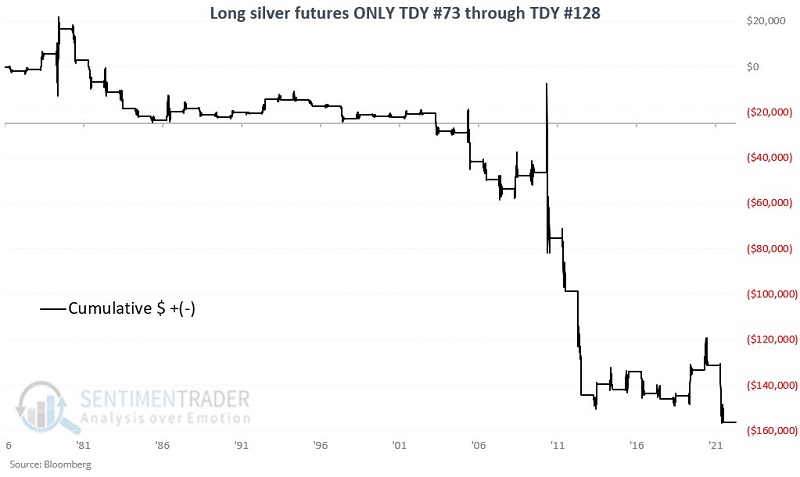
The chart below displays the hypothetical cumulative $ +(-) achieved by holding a long position in silver futures only during this period, every year starting in 1970.
The table below summarizes performance.
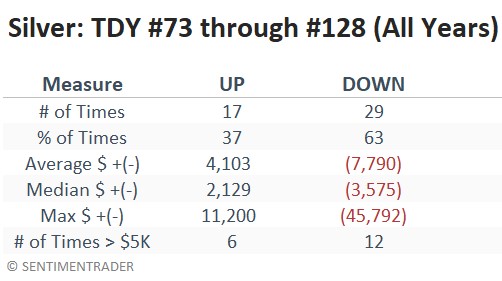
While the tendency is unfavorable, it is essential to remember that year-to-year results can vary greatly. As long as the price of silver remains in an uptrend, traders should be cautious about shorting this volatile market based solely on seasonality. An opportunity may arise if price action turns down and aligns with the unfavorable seasonal trend.
Silver seasonality - the eight-year cycle
Silver has historically shown a broad tendency to perform better during the first half of an eight-year cycle than during the second half. We will label 1977 as Year 1 and 1984 as Year 8 of the first cycle. This cycle should not be considered a trading system but merely a broad overarching tendency.
For testing purposes, we will label Years 1 through 4 as favorable and Years 5 through 8 as unfavorable. This cycle then repeats every eight years, with a new favorable period beginning in January of 1977, 1985, 1993, 2001, 2009, 2017, and 2025 in the future. For the record, this cycle is presently "unfavorable" and will remain so through 2024-12-31.
The chart below displays the cumulative hypothetical $ gain or loss achieved by holding a long position in silver futures only during each four-year favorable period (black line) versus each unfavorable period (blue line).
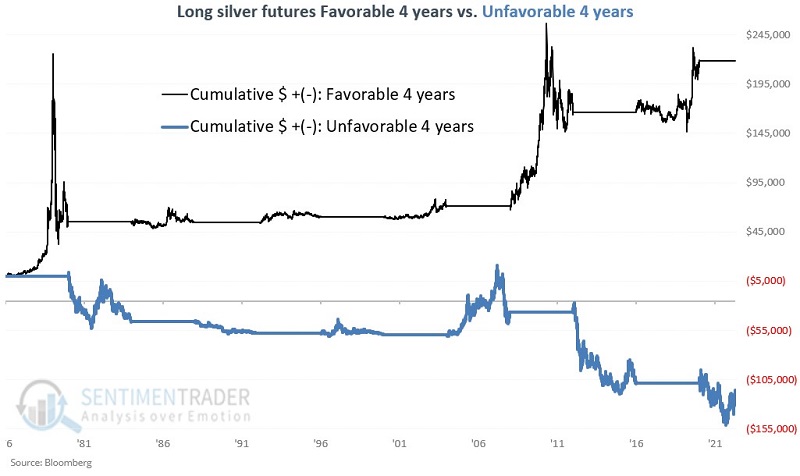
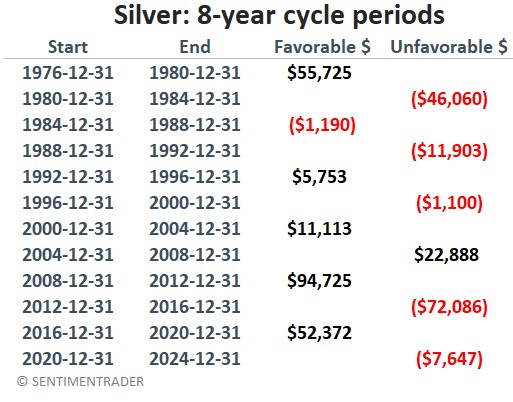
There is no guarantee that silver will rise during a favorable four-year period or decline during an unfavorable four-year period. Still, since 1976 the favorable period has shown a gain 4 of 5 times, and the unfavorable period has shown a decline 4 of 5 times. The hypothetical cumulative returns from 12/31/1976 through March 2023 are:
- Favorable four-year period = +$218,498
- Unfavorable four-year period = (-$115,908)
The table below displays the cycle-by-cycle results of holding a long position in silver futures.
Combining the eight-year cycle with the annual seasonal trend
Now let's look at how the TDY 73 through TDY 128 annual period performs during the favorable and unfavorable years of the eight-year cycle.
The chart below displays the cumulative hypothetical gain from holding long silver futures during the TDY #73 through TDY #128 period within the favorable years in the eight-year cycle (1977-1980, 1985-1988, 1993-1996, 2001-2004, 2009-2012, 2017-2020). The cumulative loss is -$31,196.
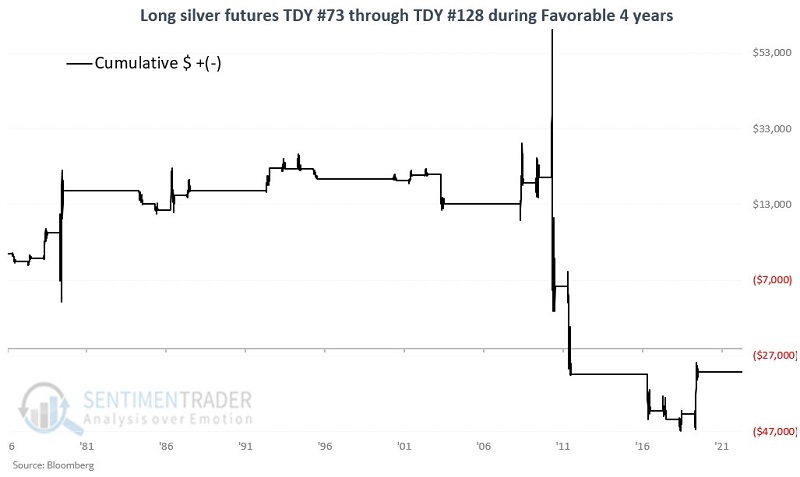
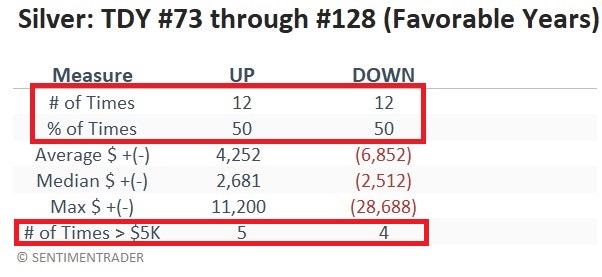
The table below summarizes performance.
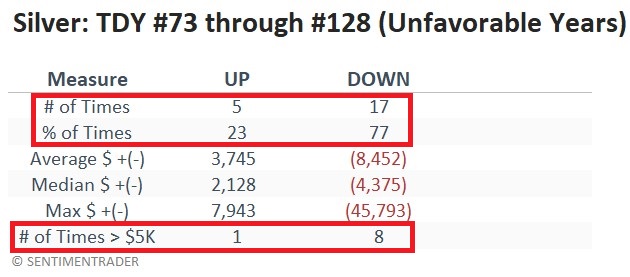
2023 is considered unfavorable in the context of the eight-year cycle. The period from 2023-04-13 through 2023 -06-29 is deemed unfavorable in the context of the annual seasonal trend. The chart below displays the cumulative hypothetical $ +(-) from holding long silver futures during the TDY #73 through TDY #128 period within the unfavorable years in the eight-year cycle (1981-1984, 1989-1992, 1997-2000, 2005-2008, 2013-2016, 2021-2024). The cumulative loss is -$124,964.
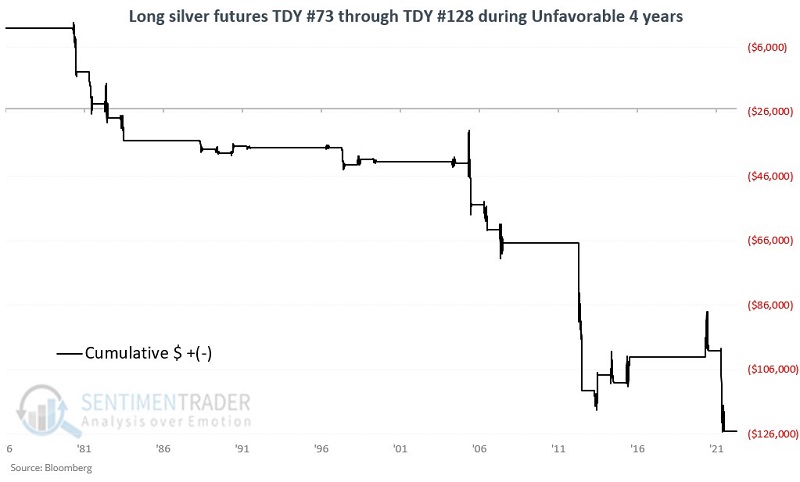
The table below summarizes performance.
What the research tells us…
There are fundamental and technical factors in play that could easily propel silver futures higher in the weeks and months ahead. With silver presently in a power uptrend, jumping in on the short side is extremely dangerous. Nevertheless, suppose silver begins to falter in the weeks ahead - given that we will be in the unfavorable portion of the year within the unfavorable part of the eight-year cycle. In that case, traders should be alert to the possibility that silver could surprise everyone to the downside. Do not consider this a "prediction"; consider it simply an "alert" to help you be prepared if the consensus proves wrong.
Indicators at Extremes
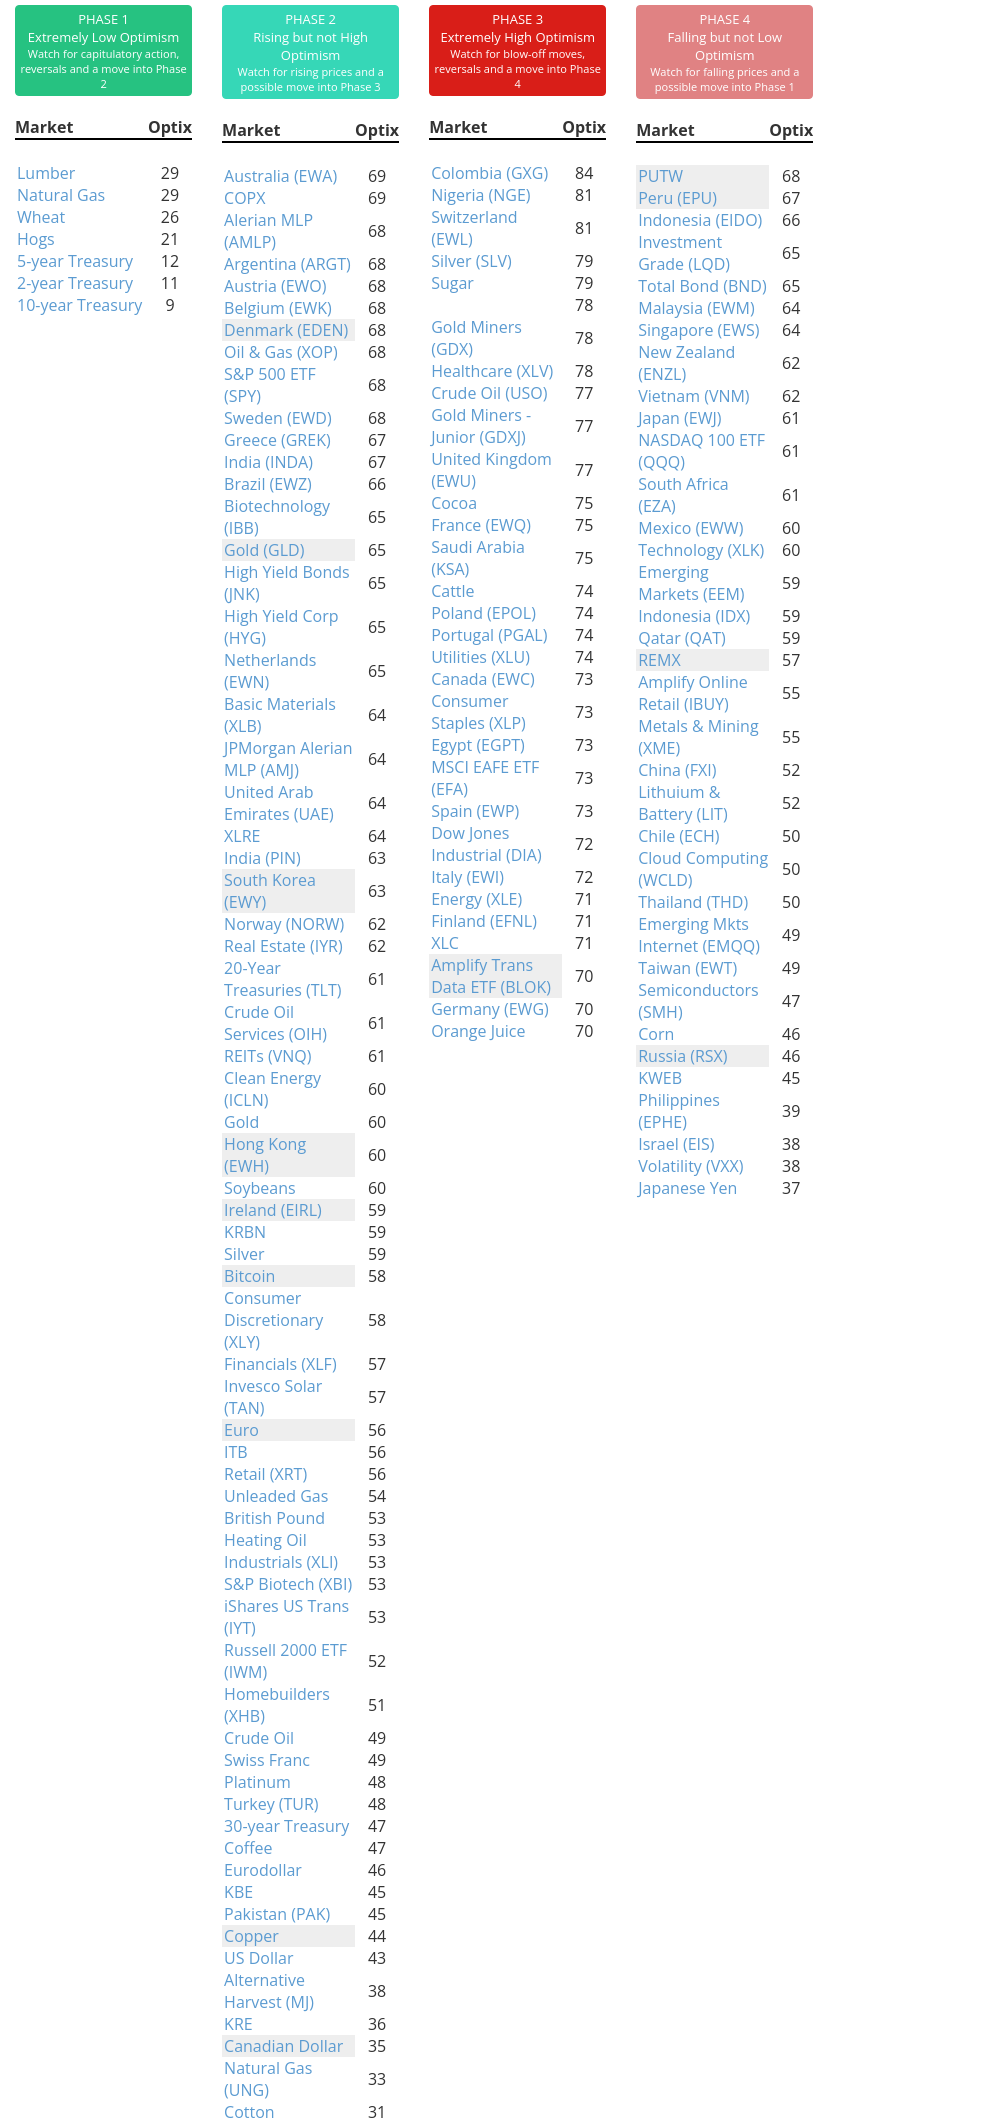
Phase Table
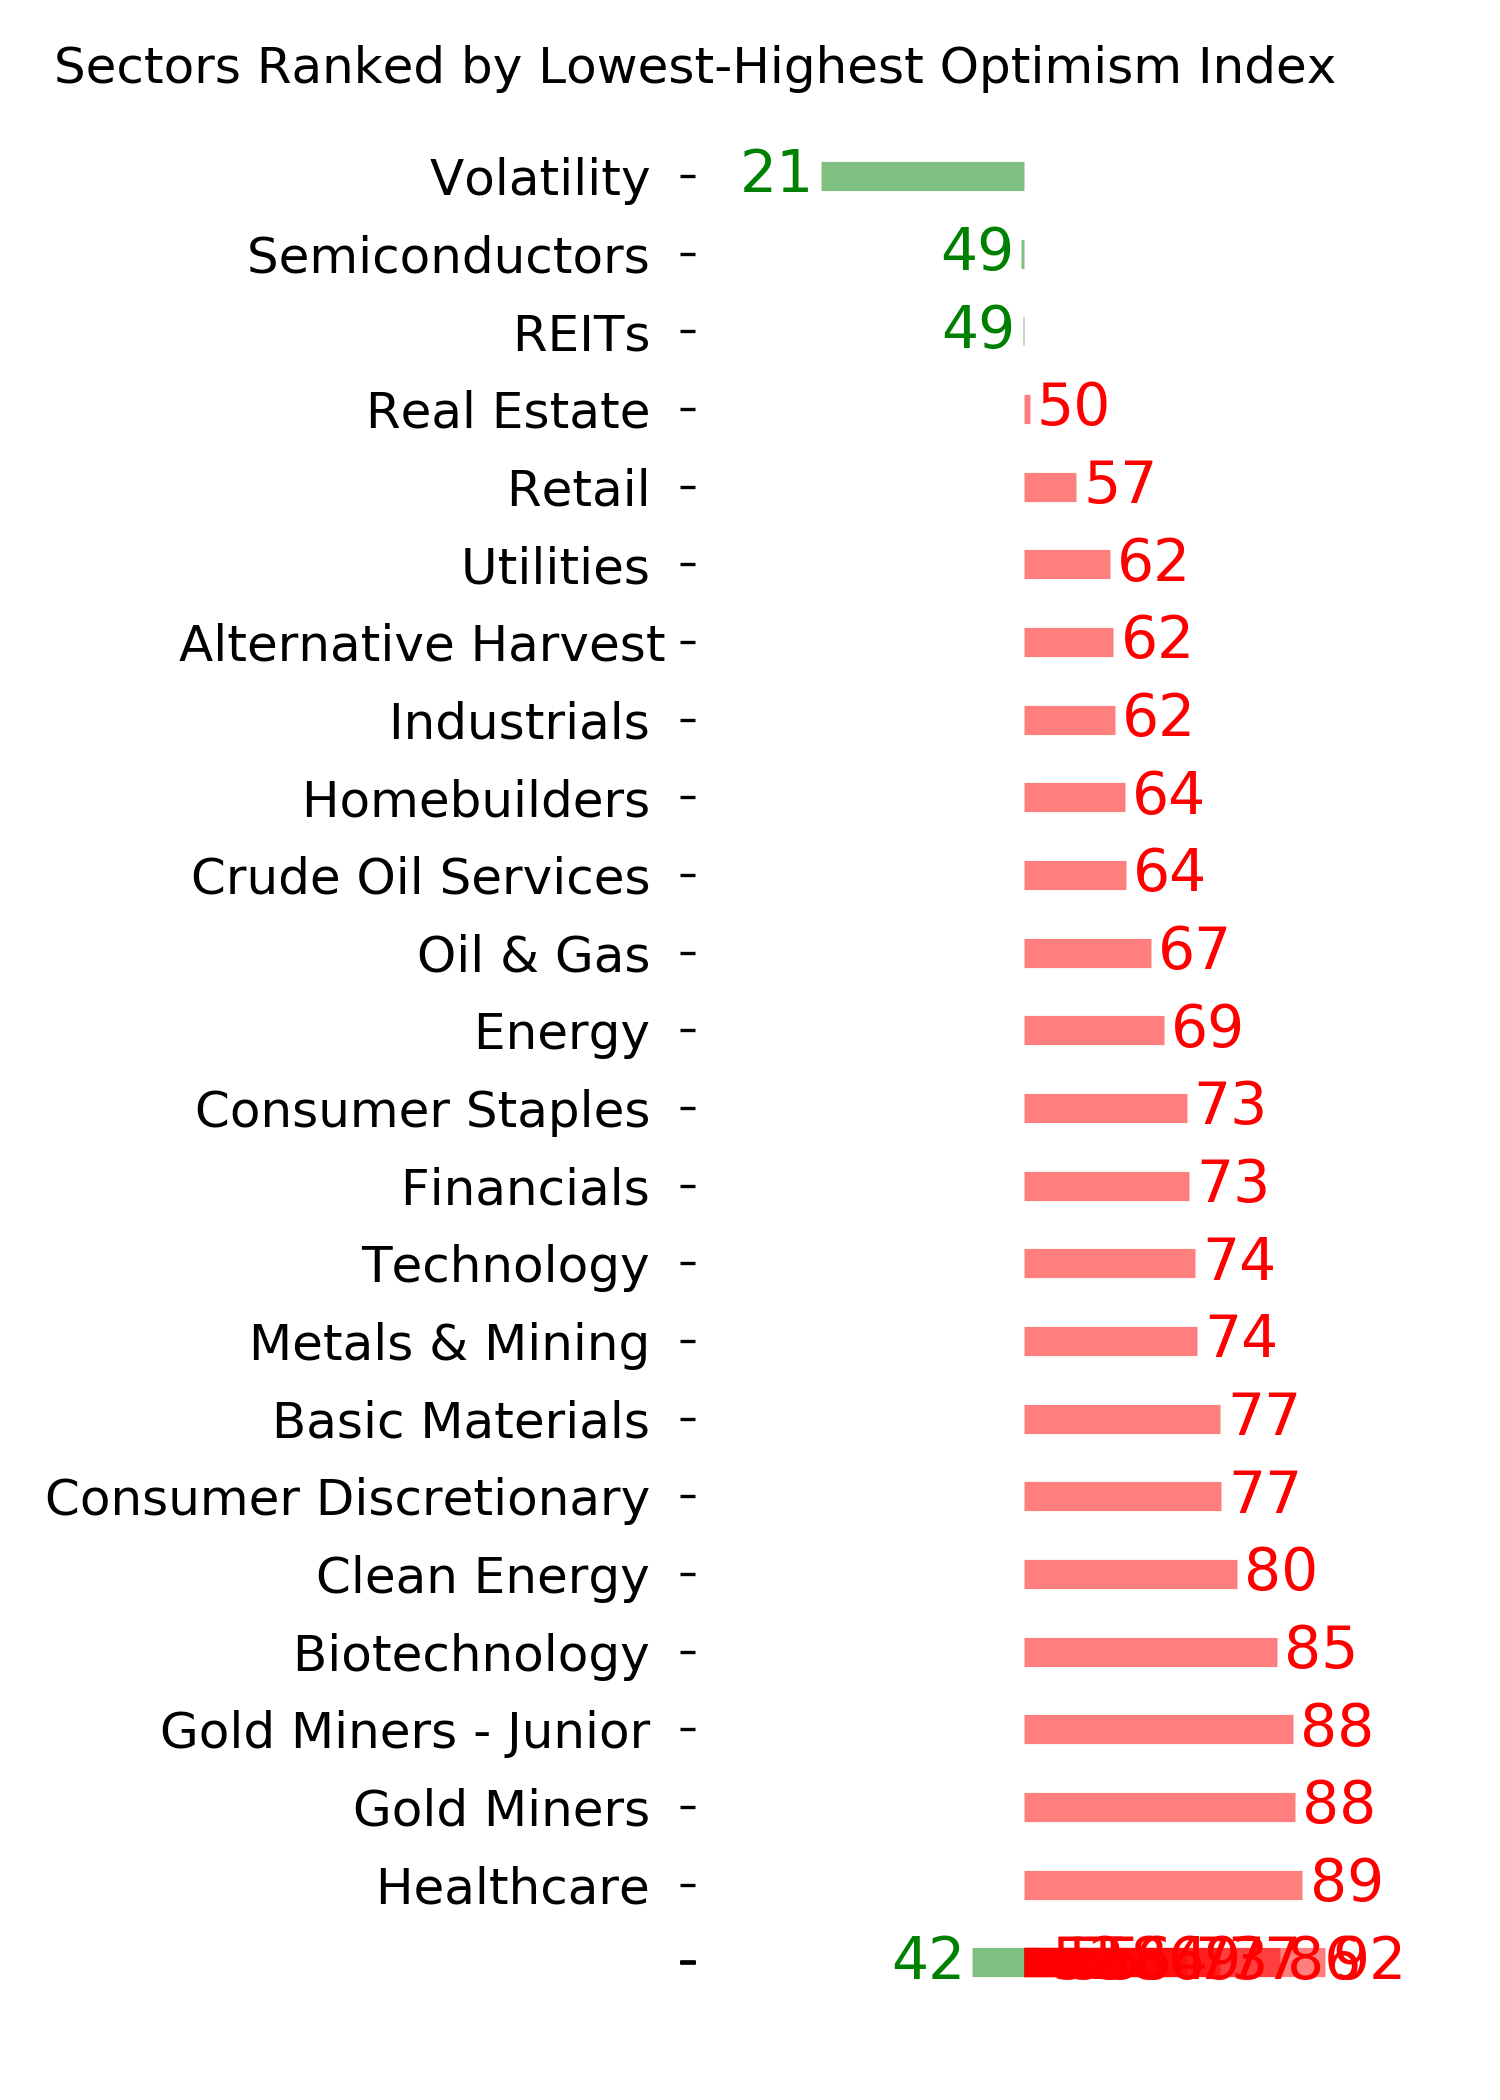
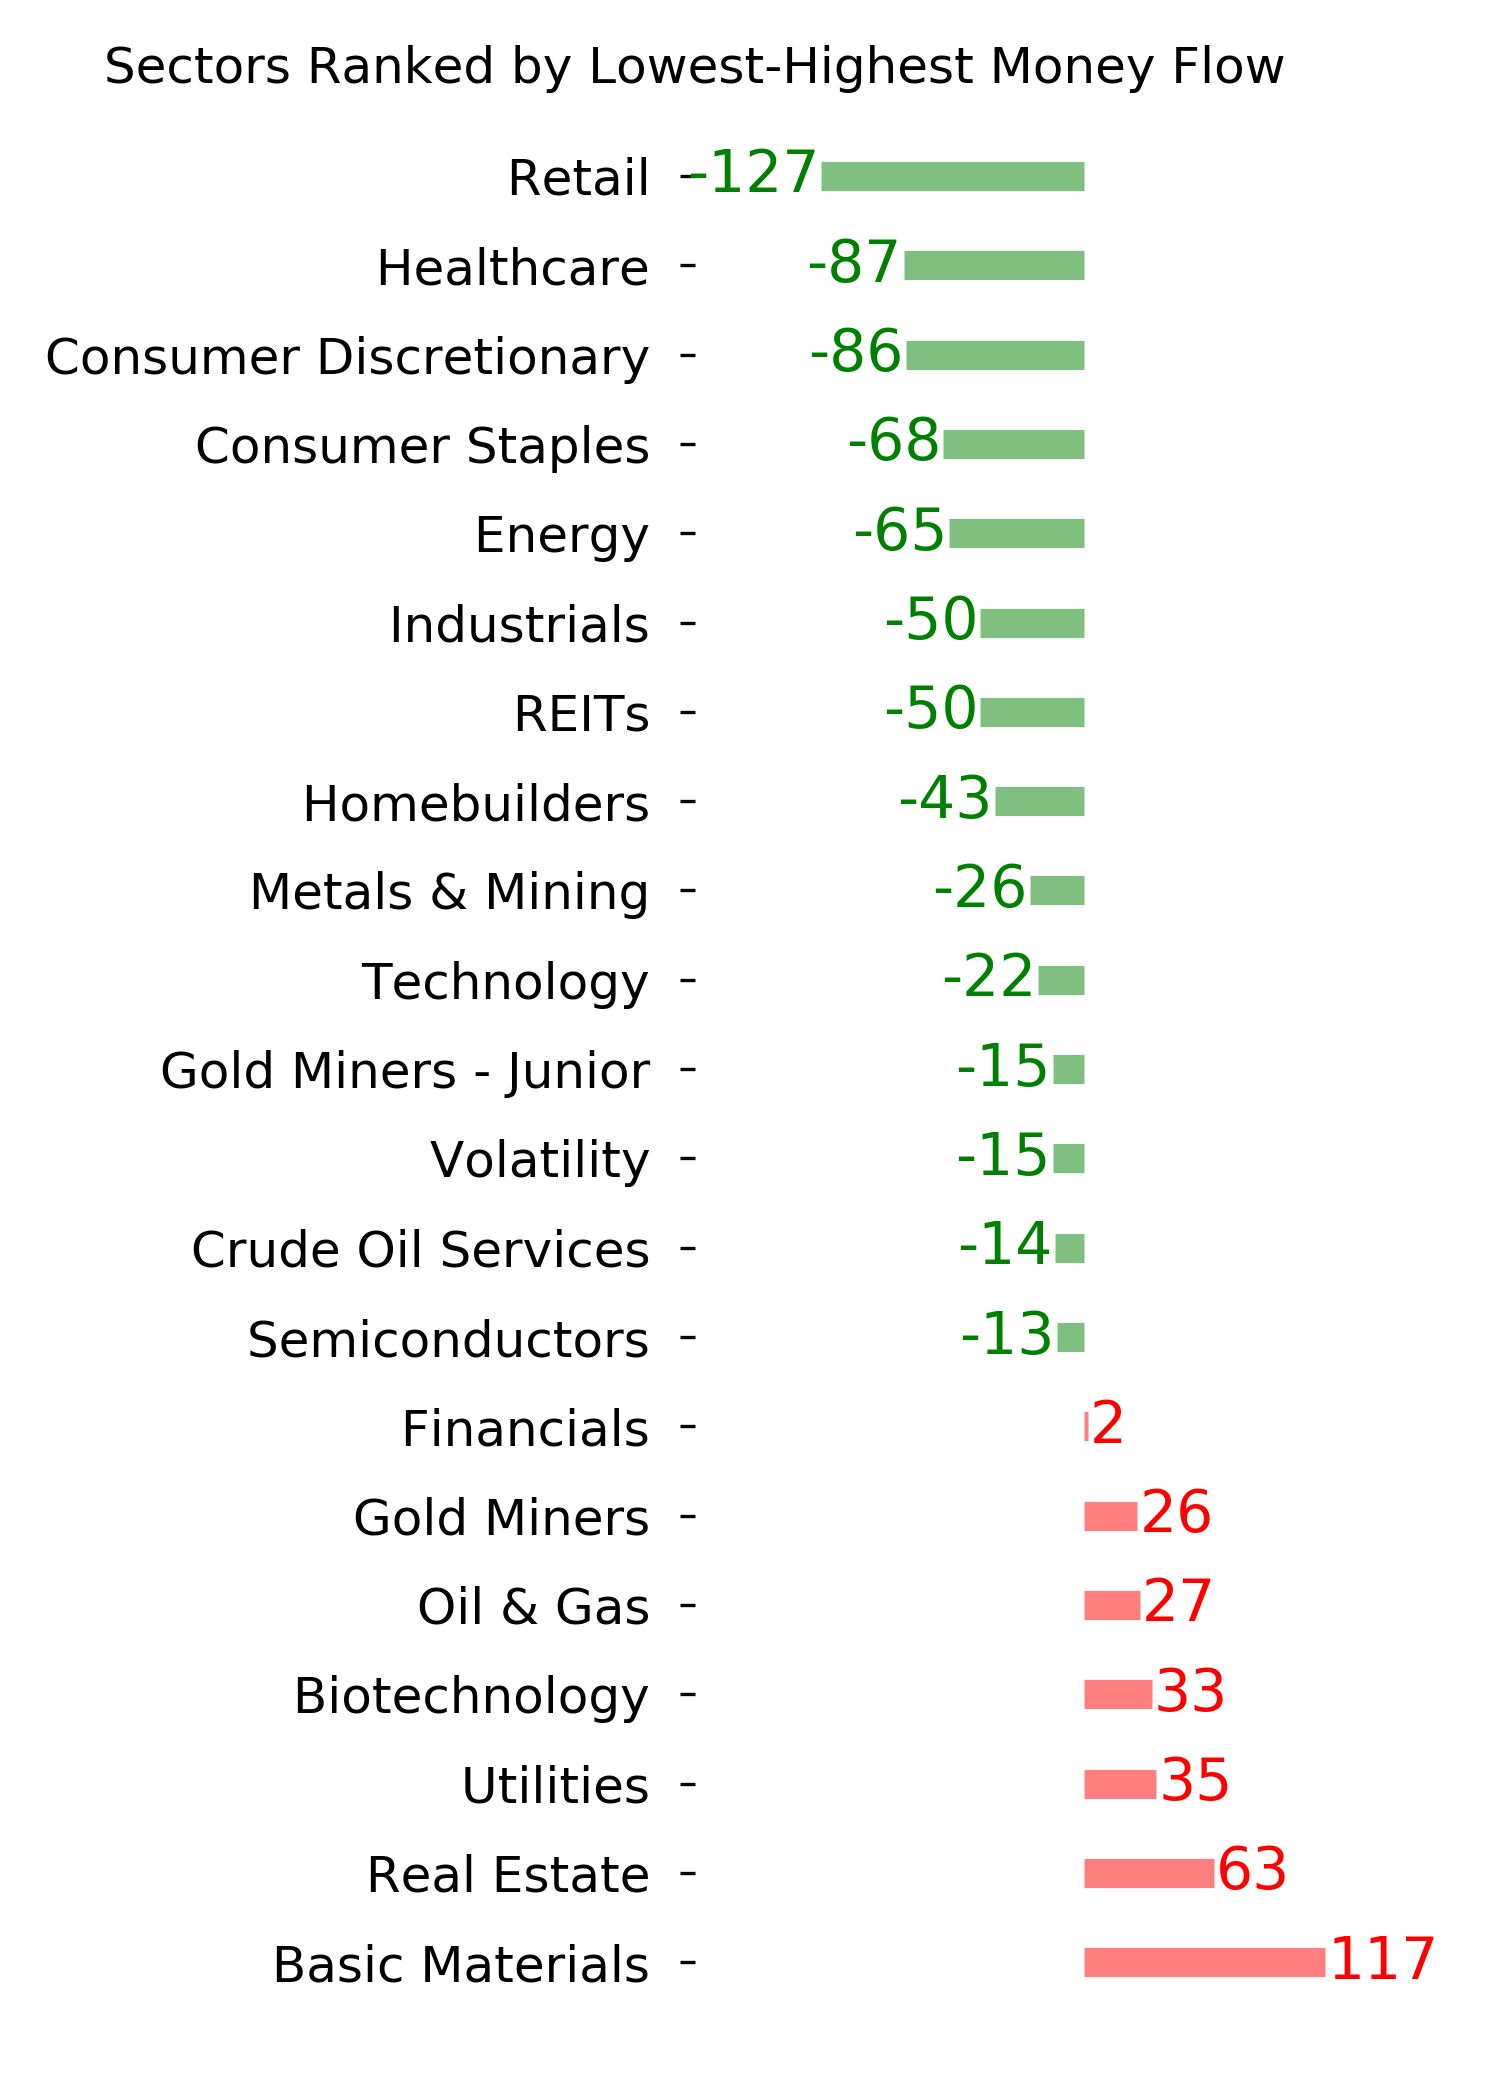
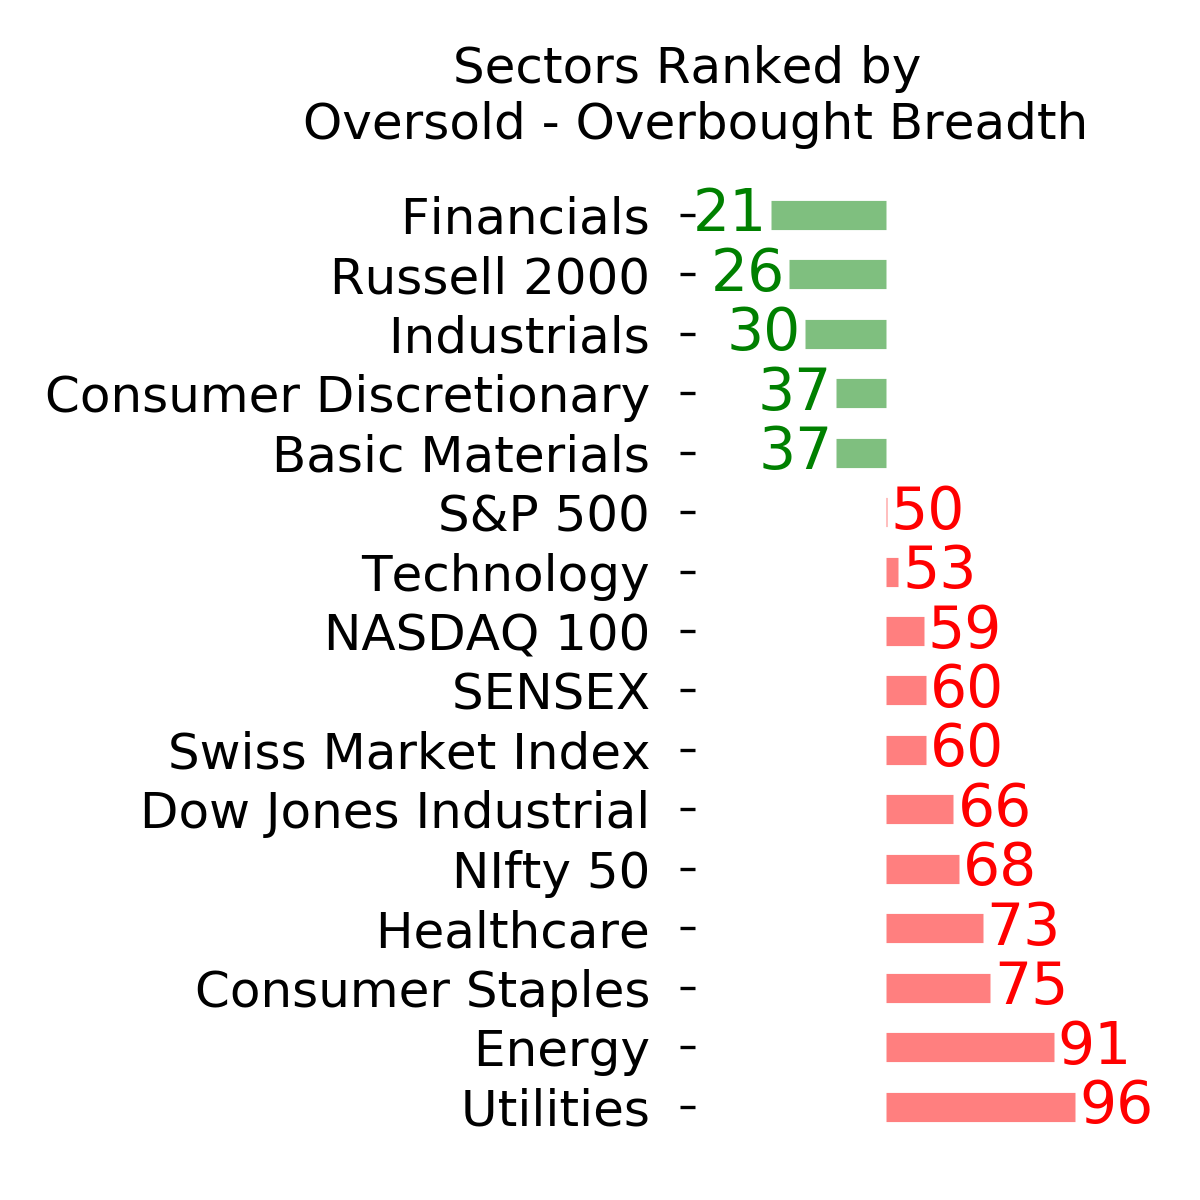
Ranks
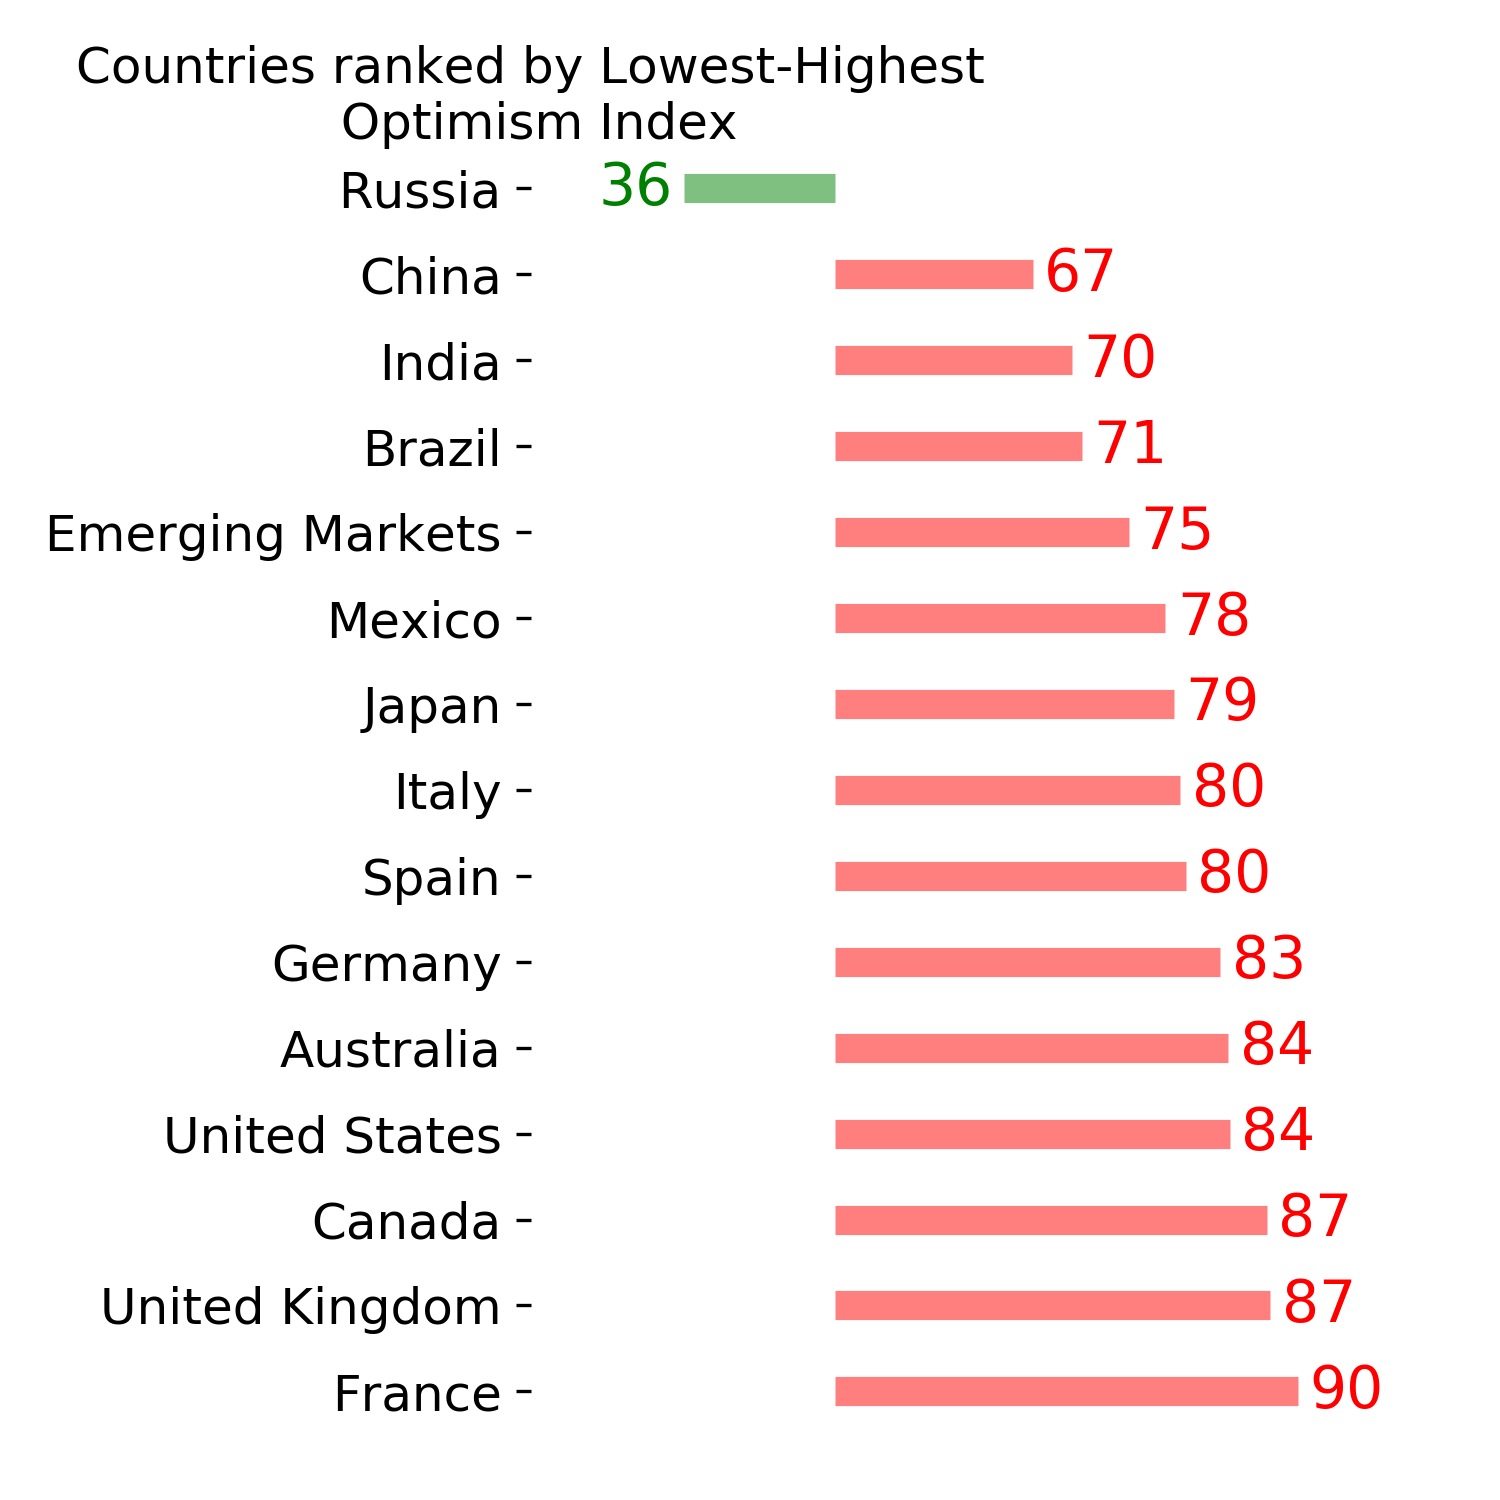
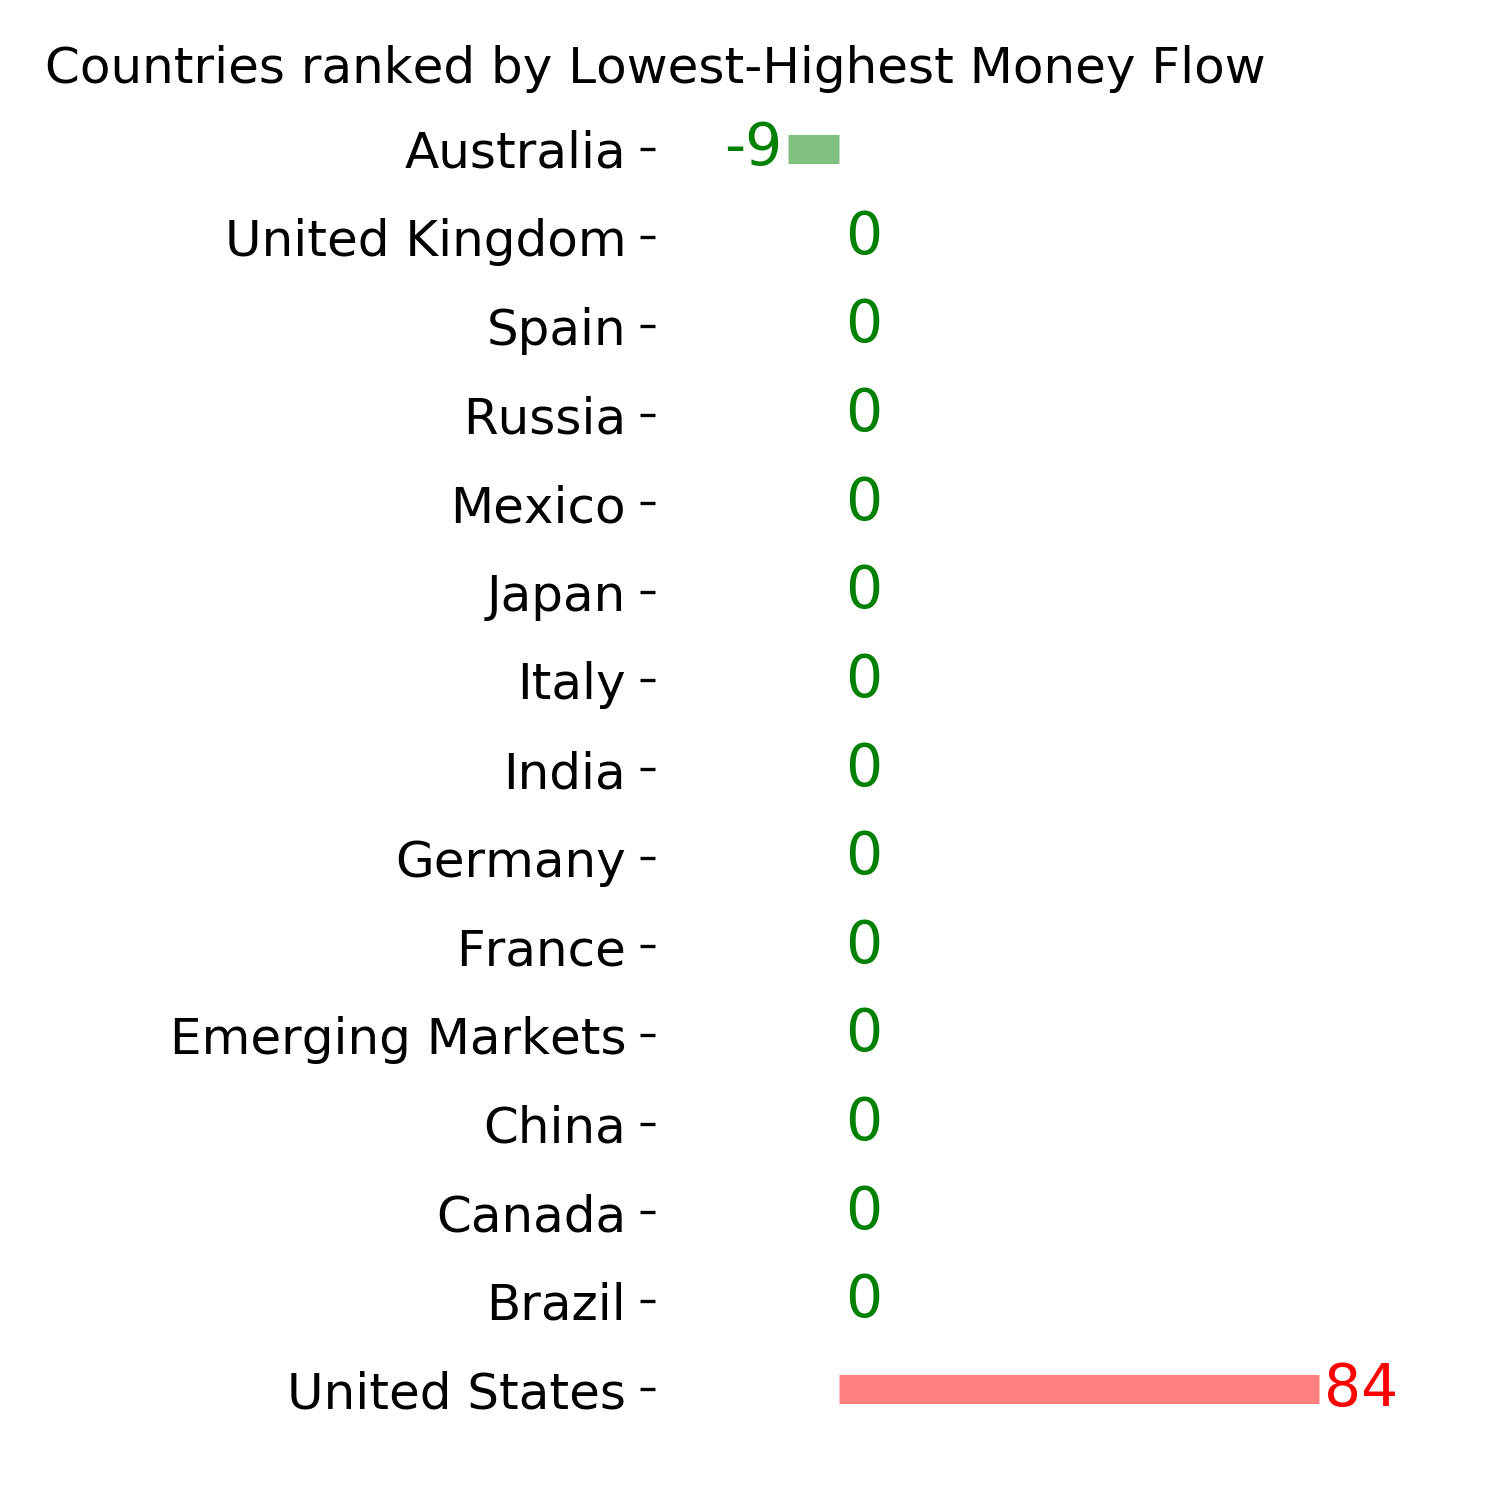
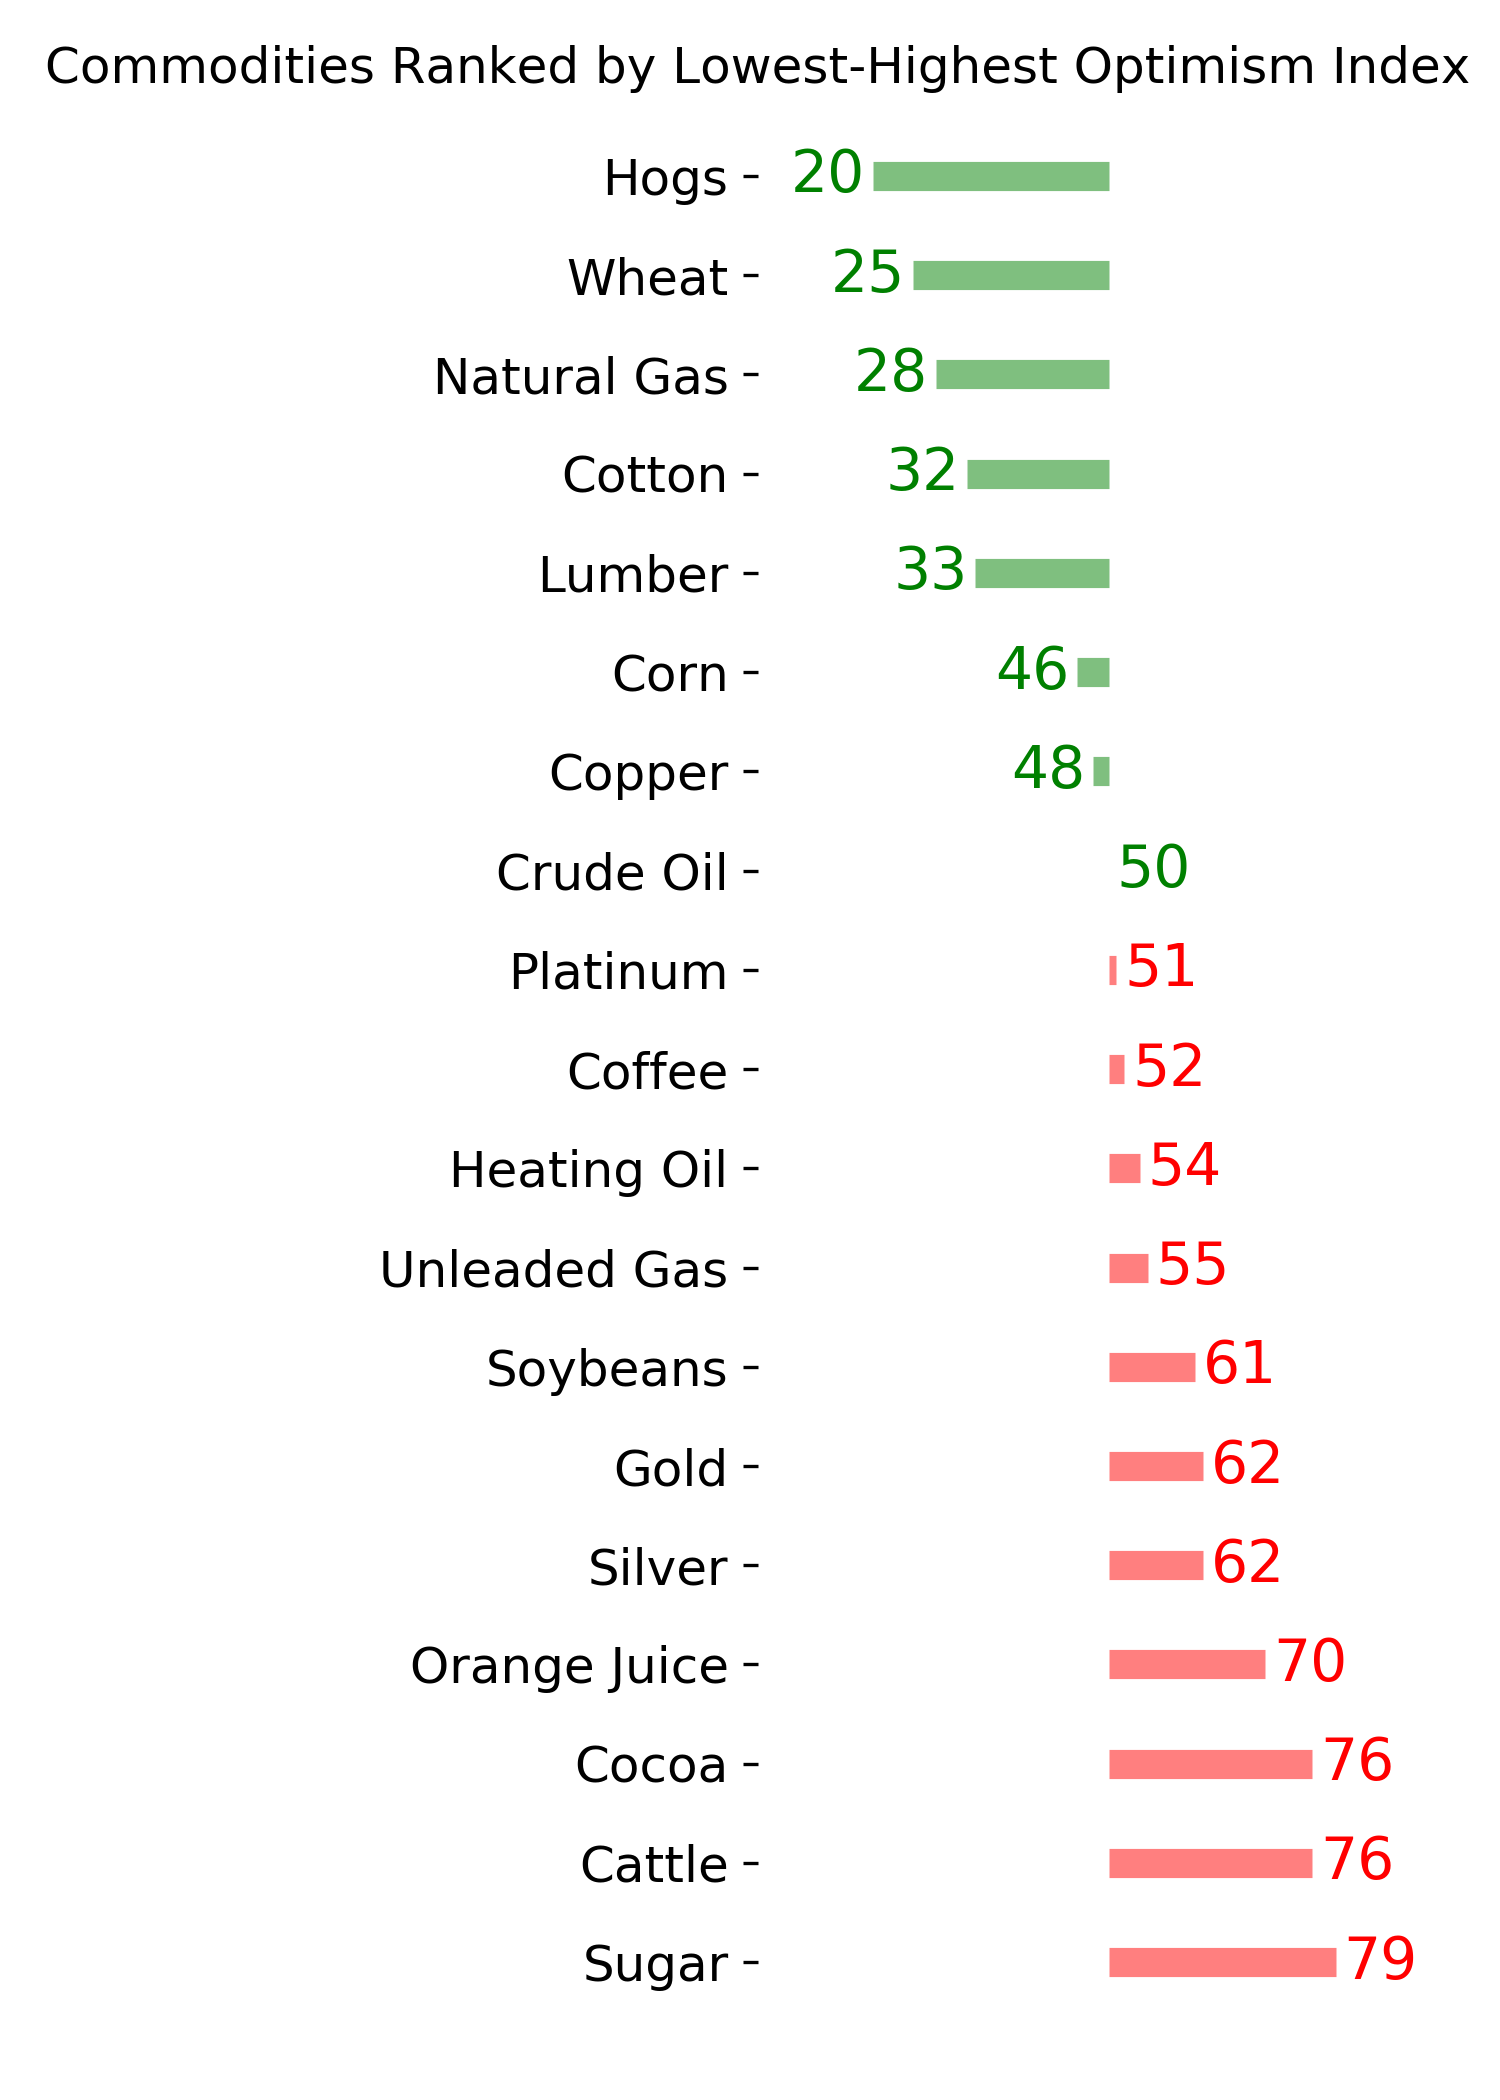
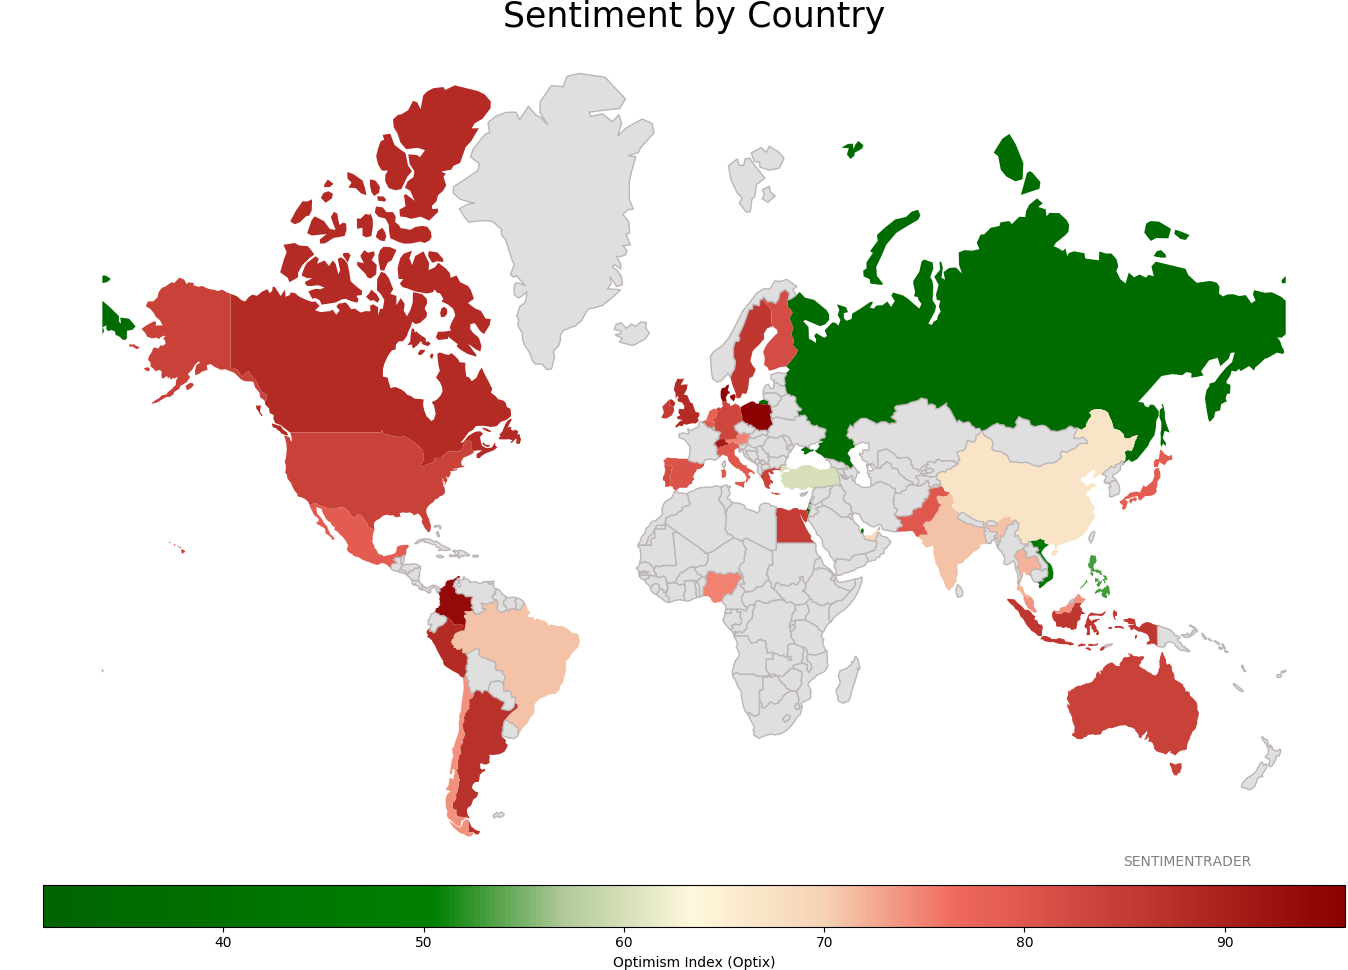
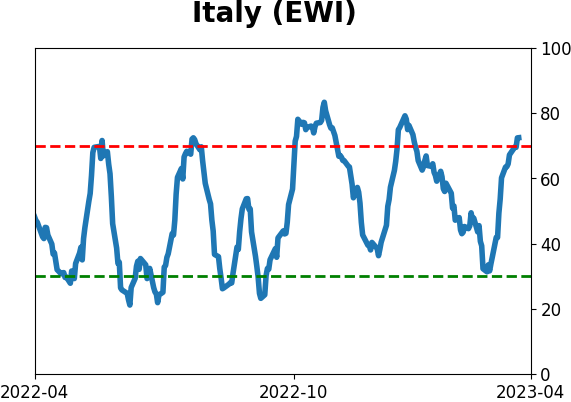
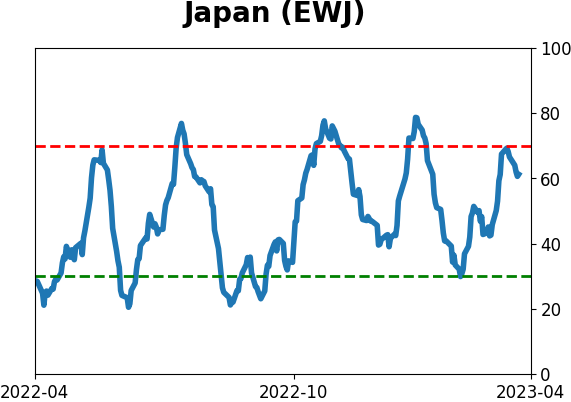
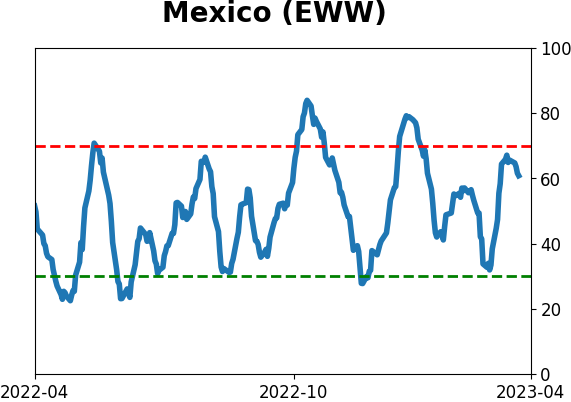
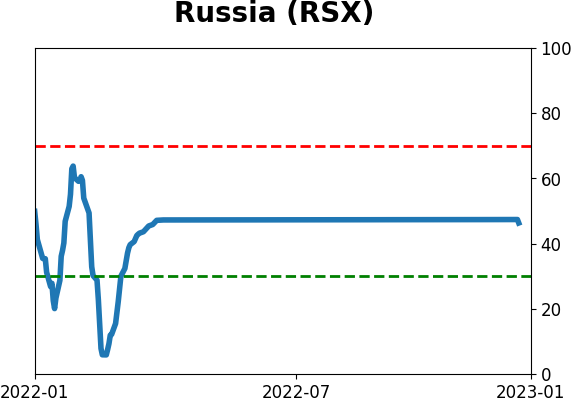
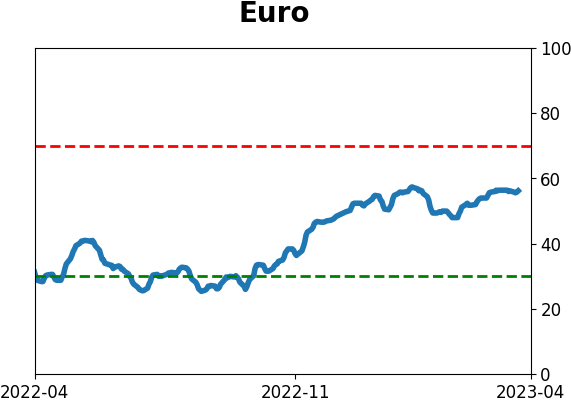
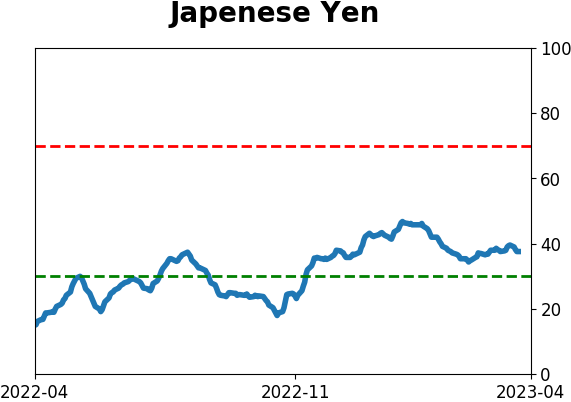
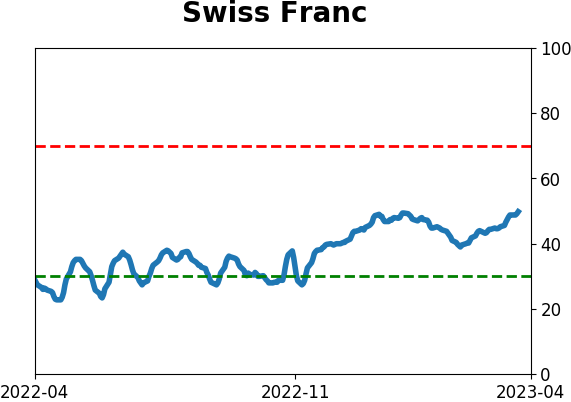
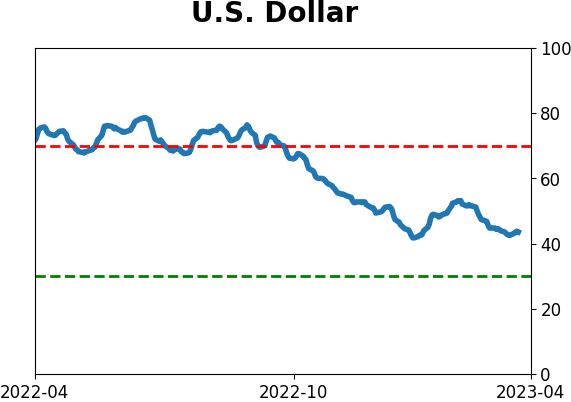
Sentiment Around The World
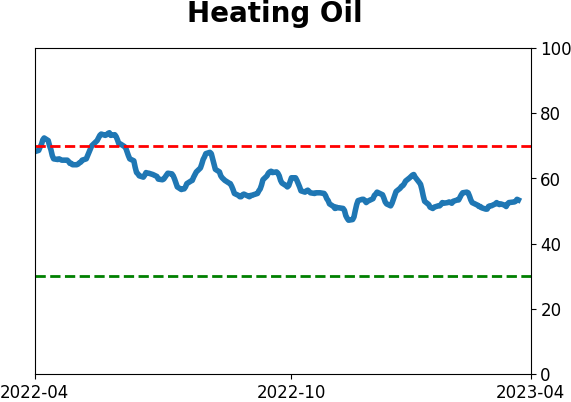
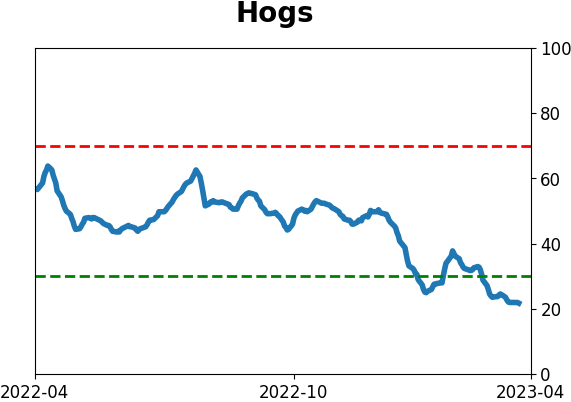
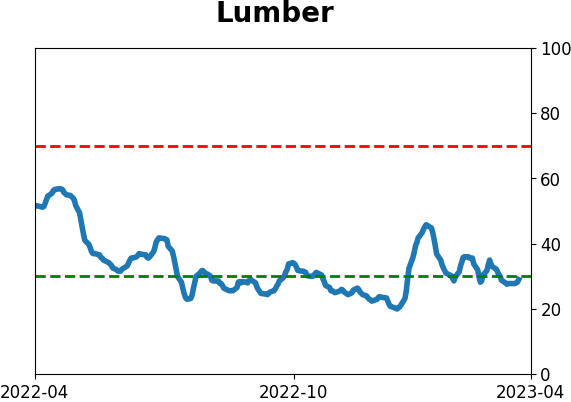
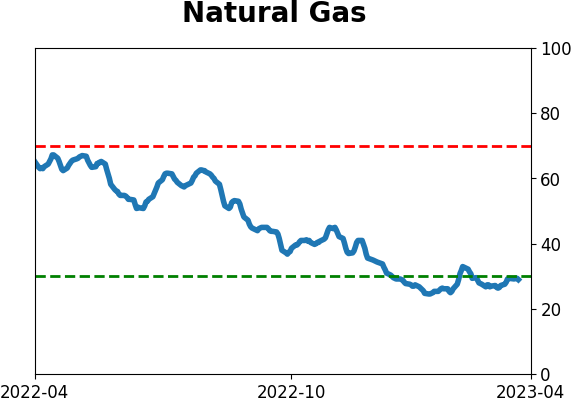
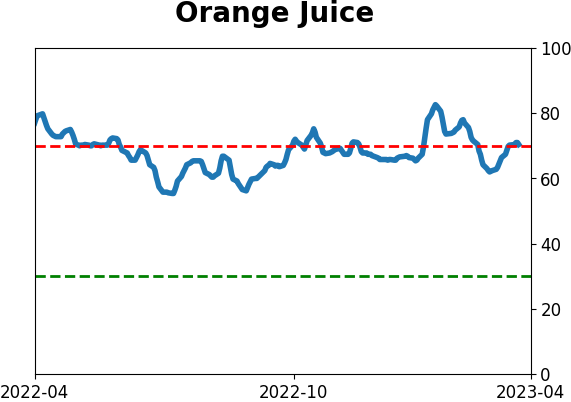
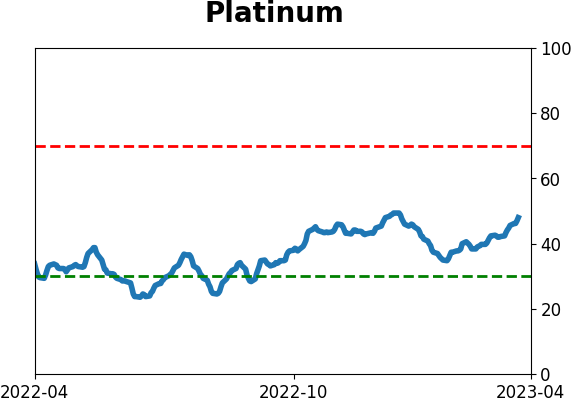
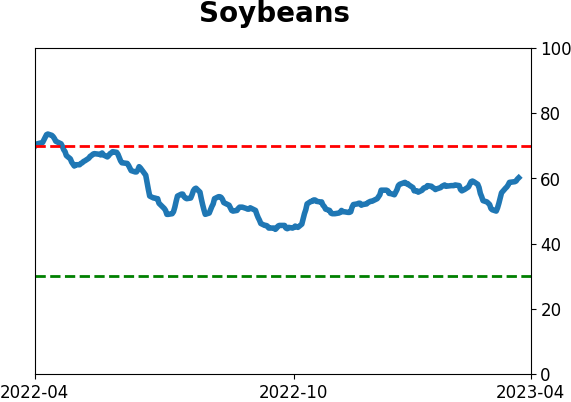
Optimism Index Thumbnails
|
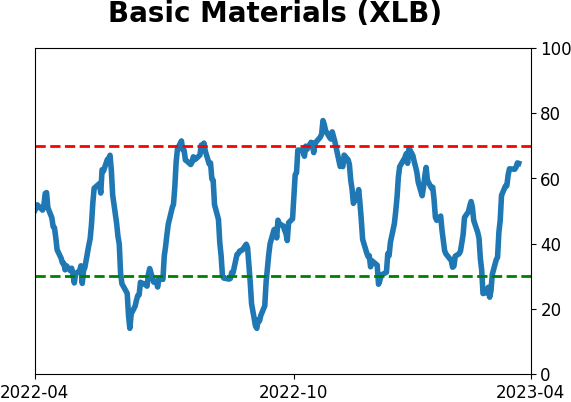
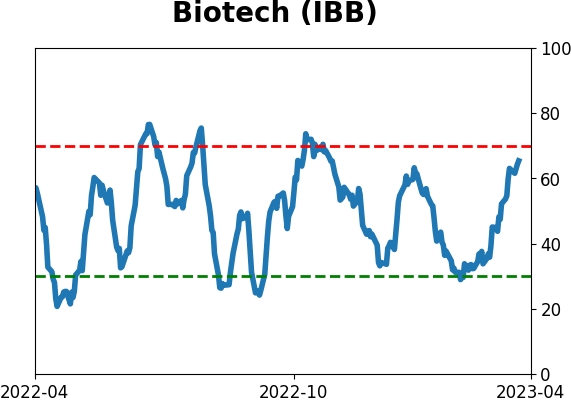
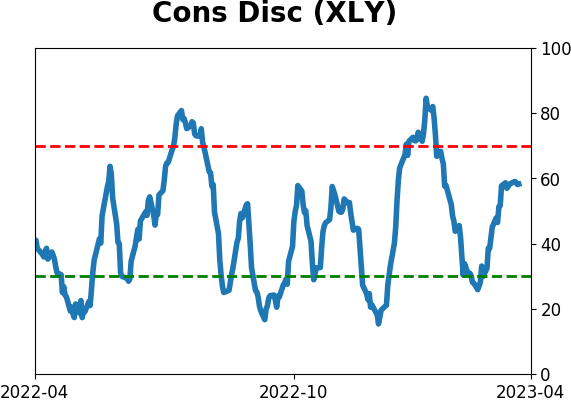
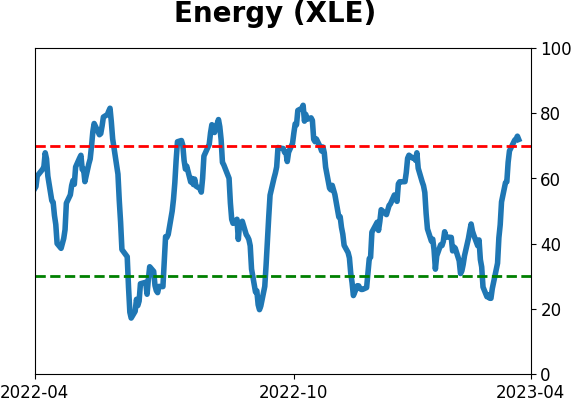
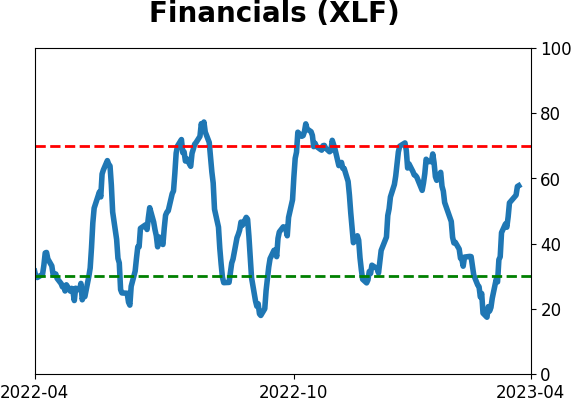
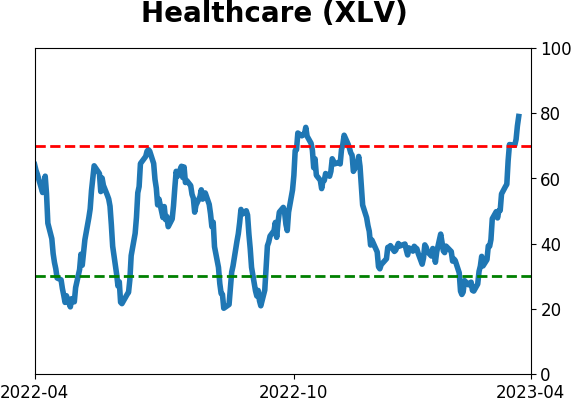
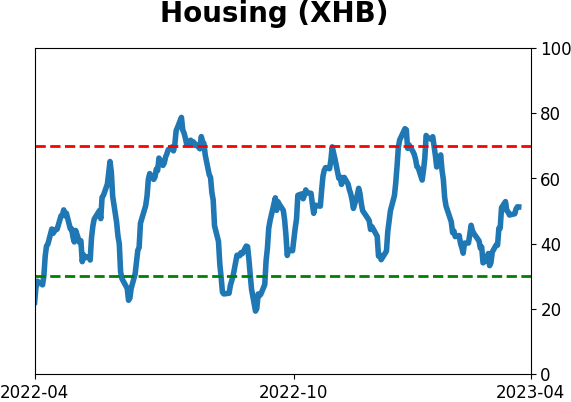
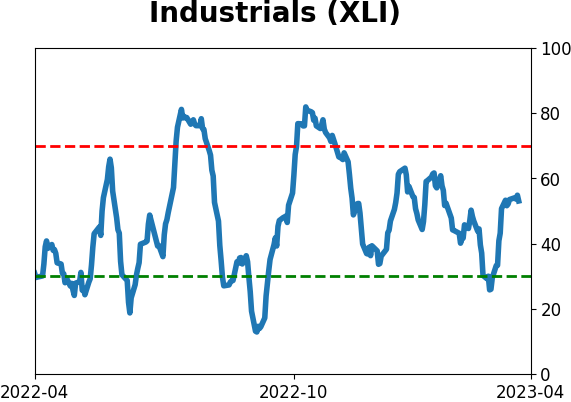
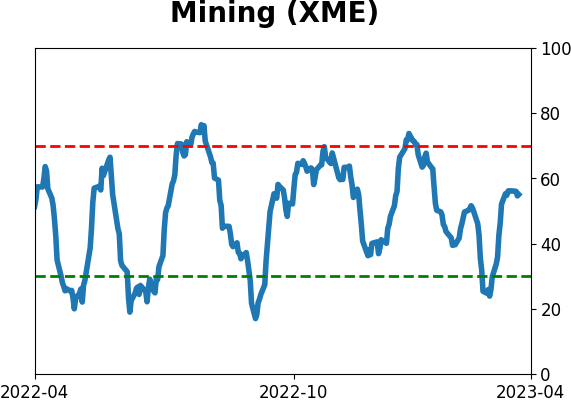
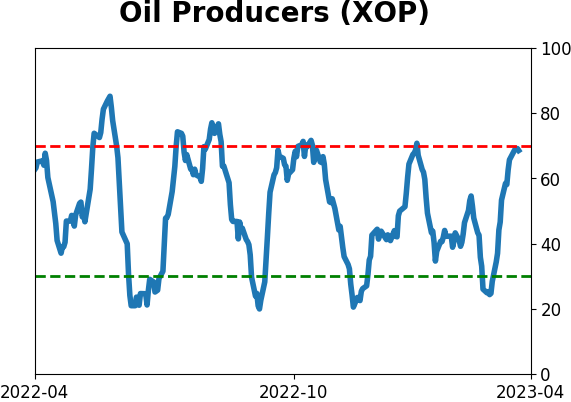
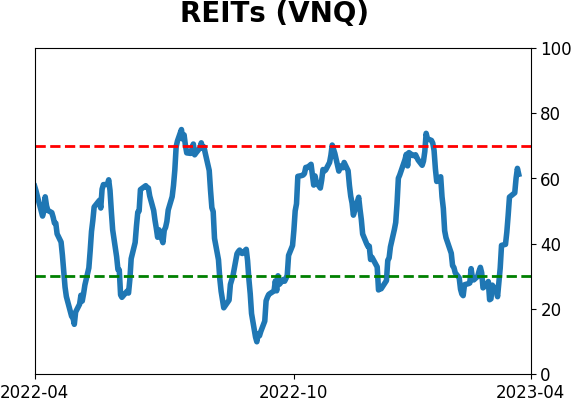
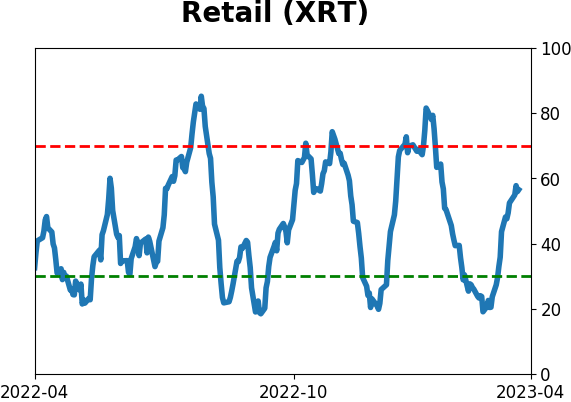
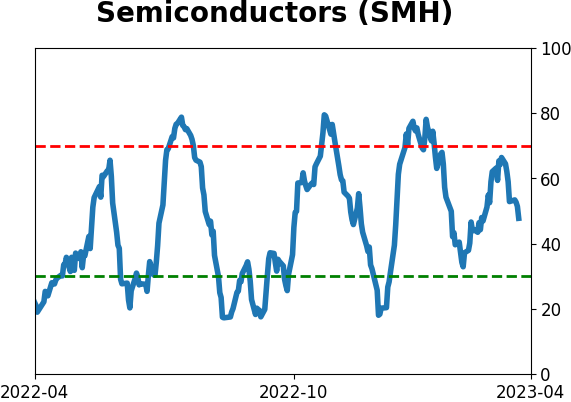
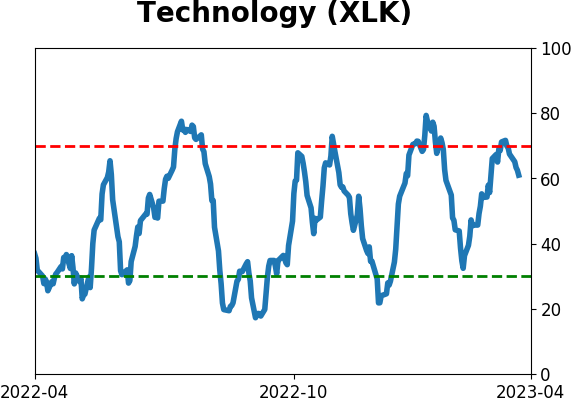
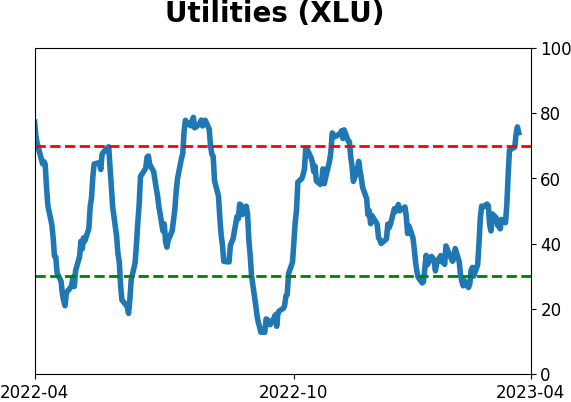
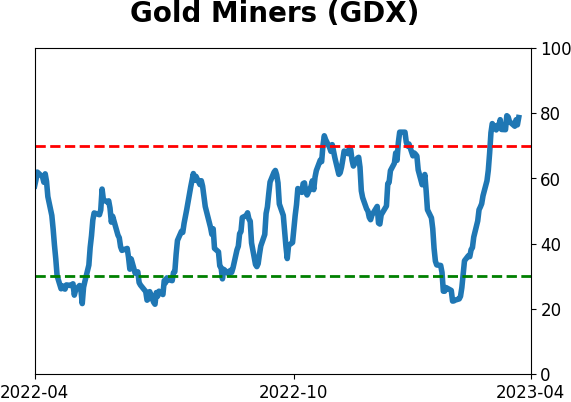
Sector ETF's - 10-Day Moving Average
|
|
|
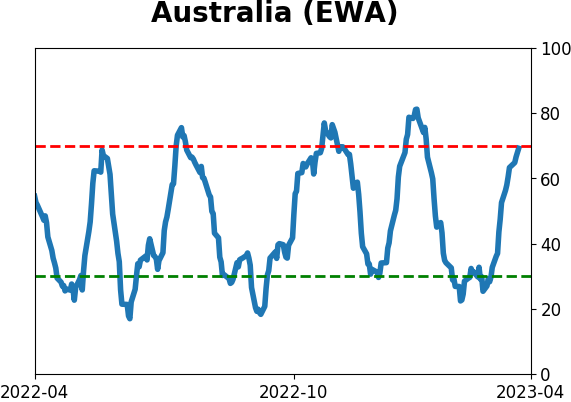
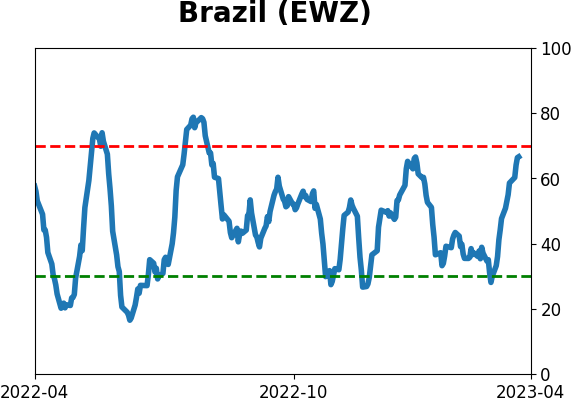
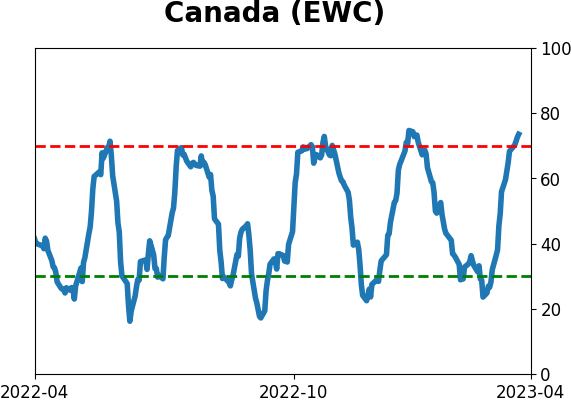
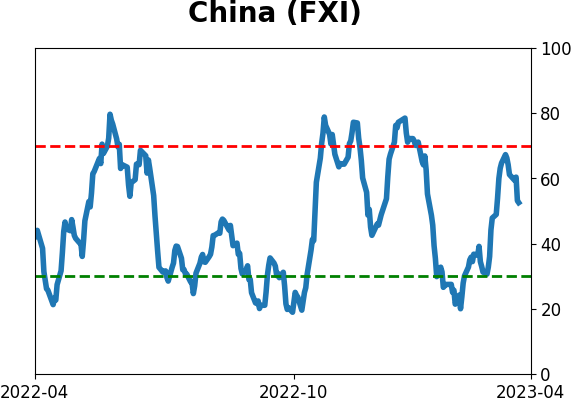
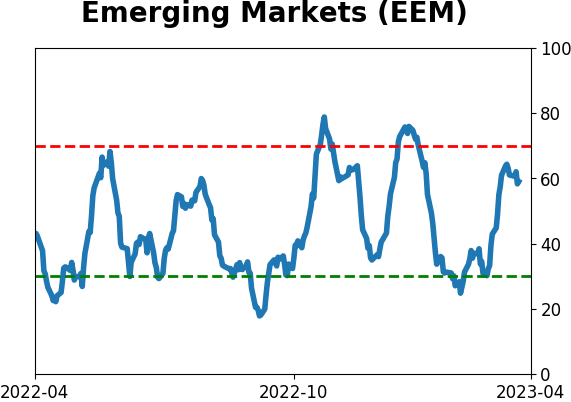
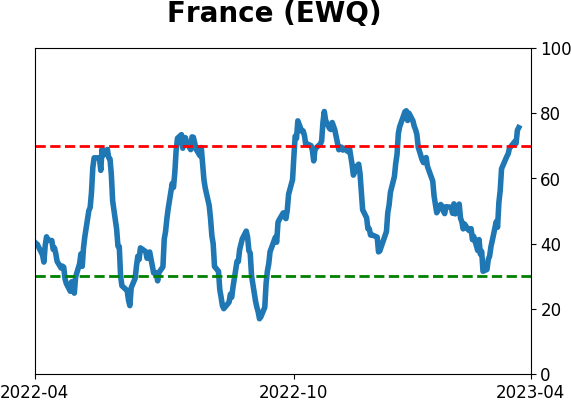
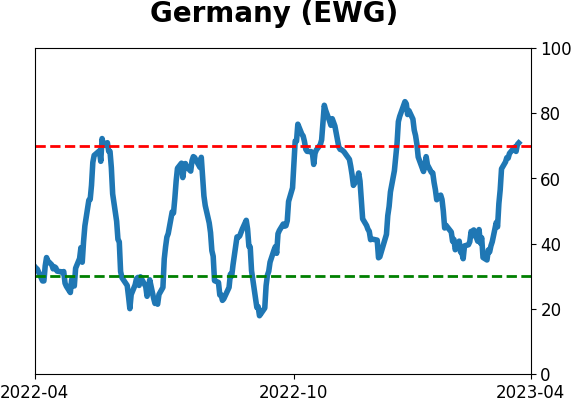
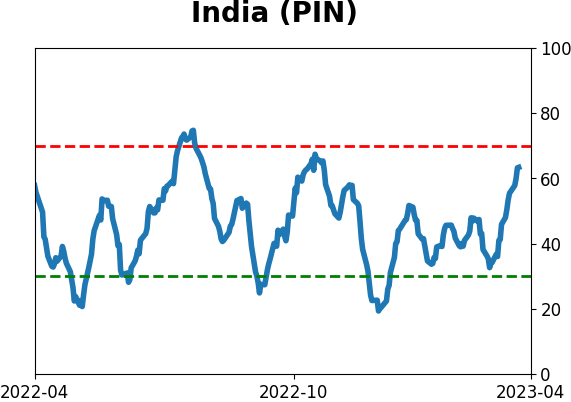
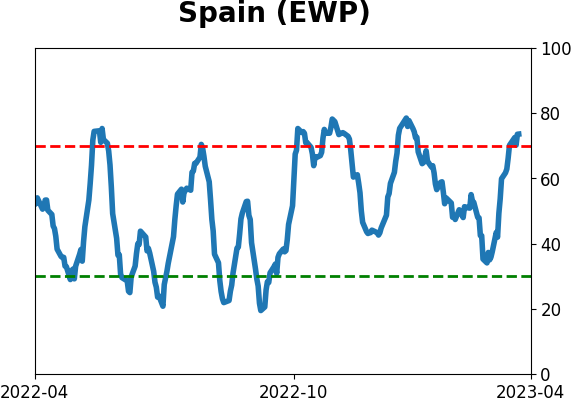
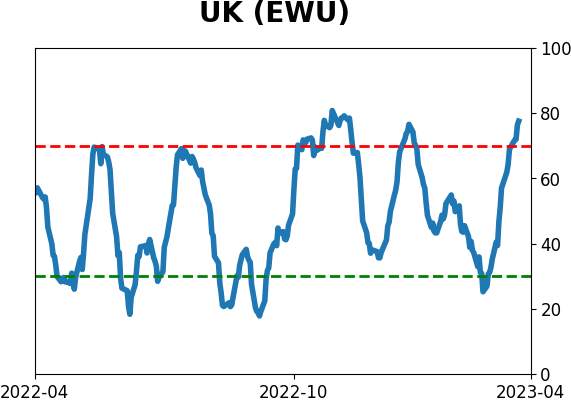
Country ETF's - 10-Day Moving Average
|
|
|
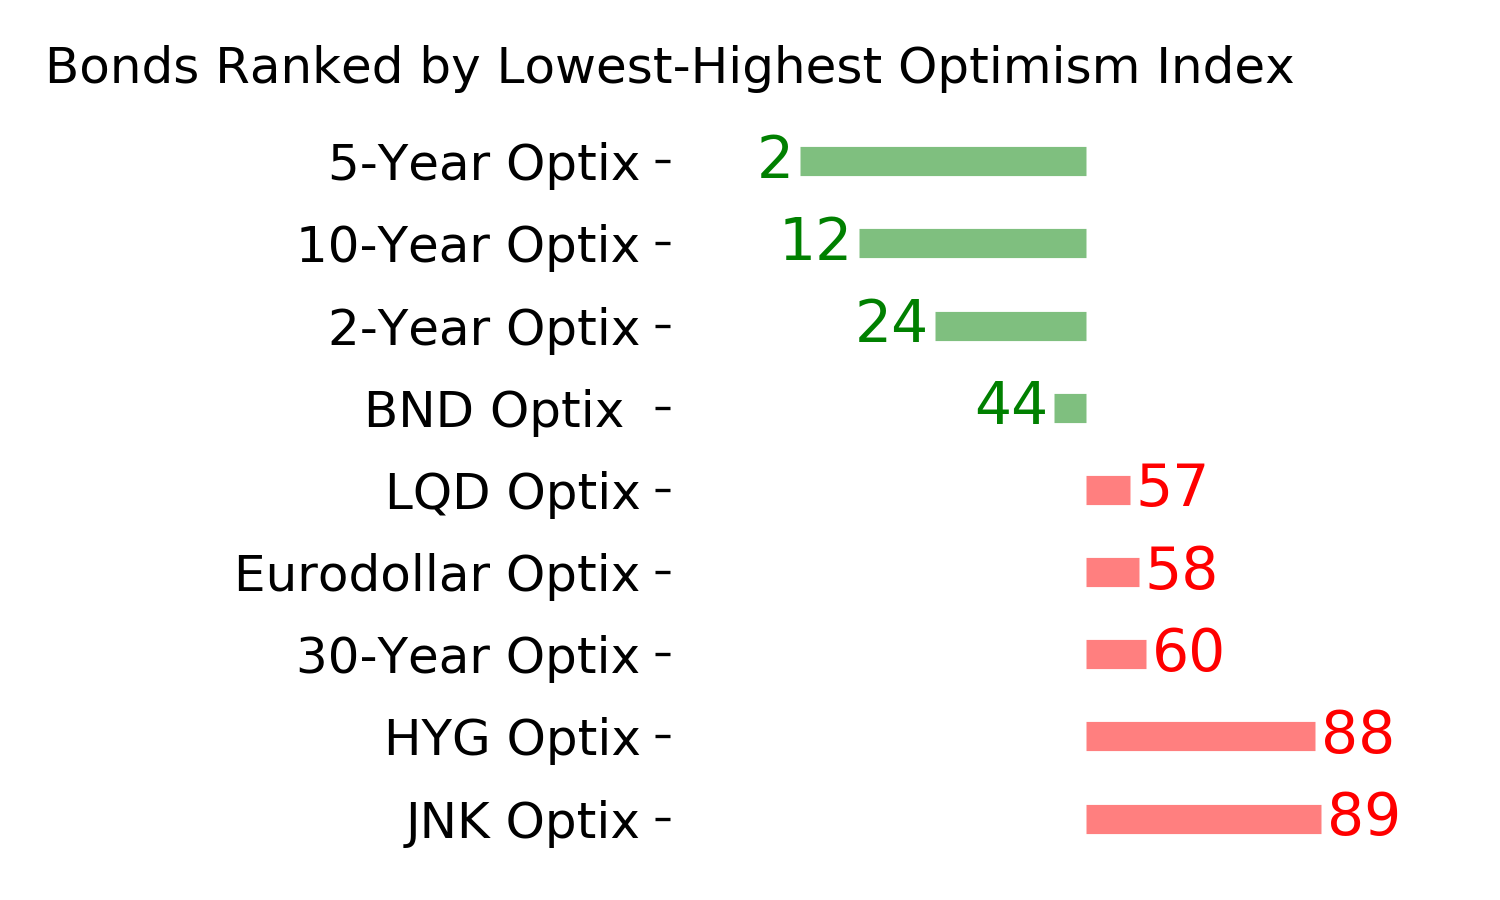
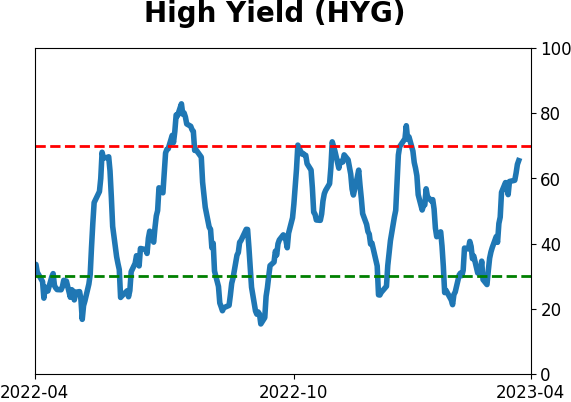
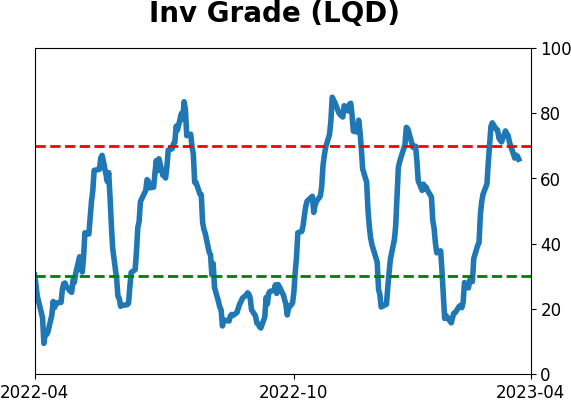
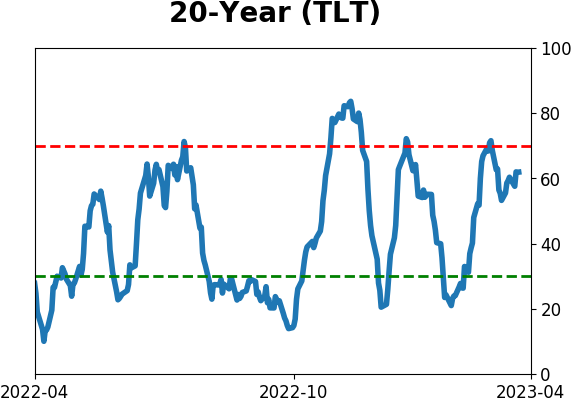
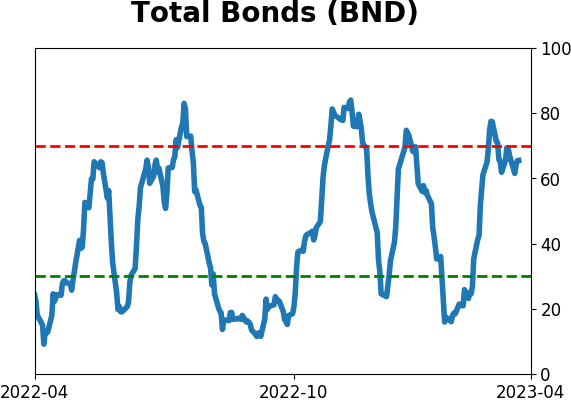
Bond ETF's - 10-Day Moving Average
|
|
|
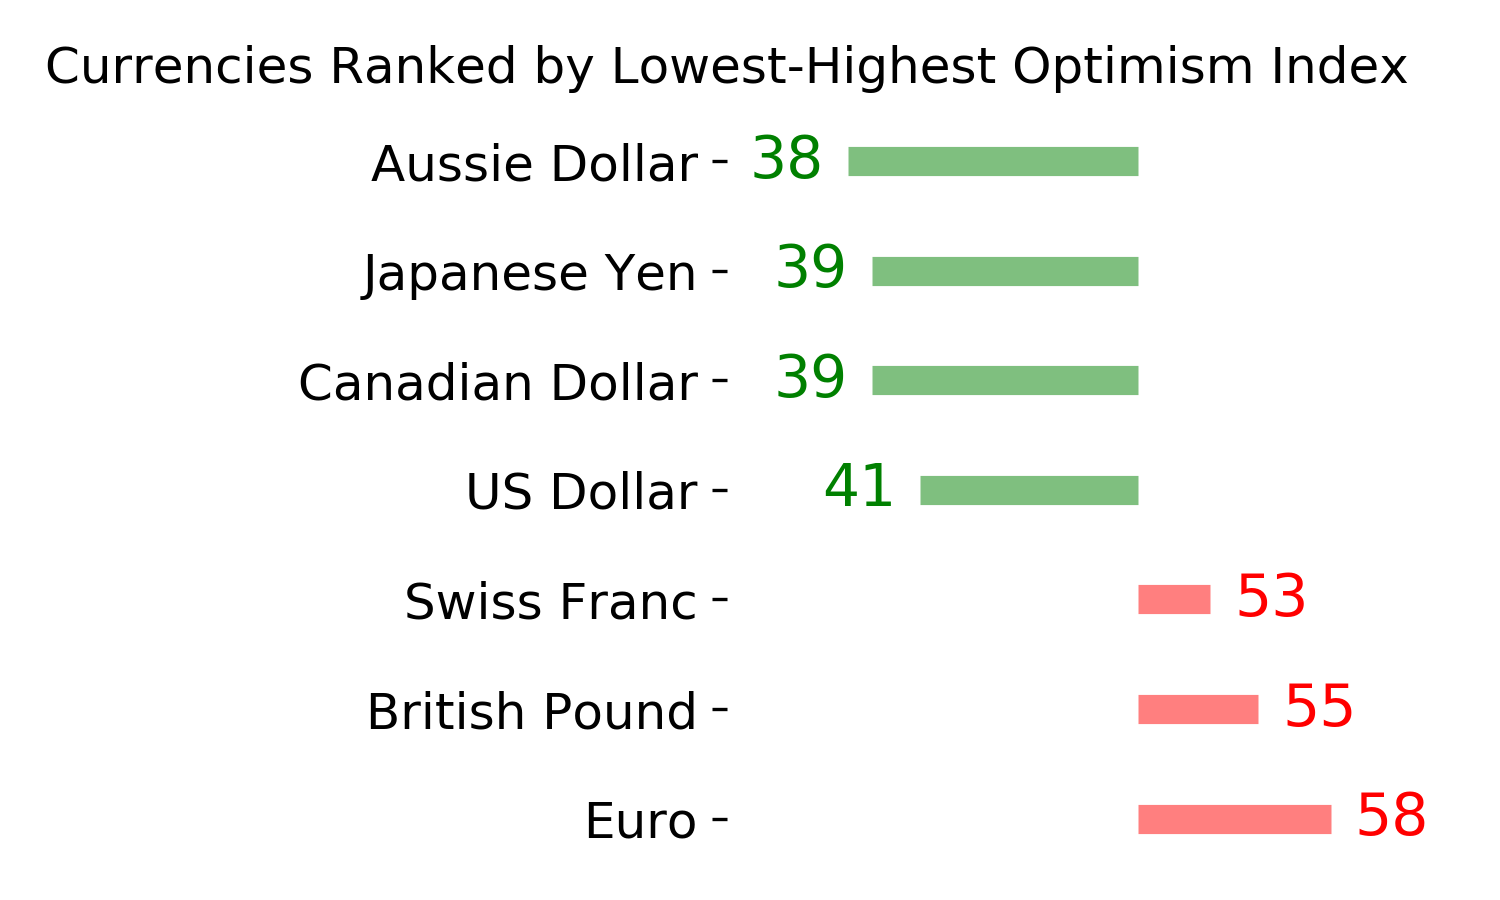
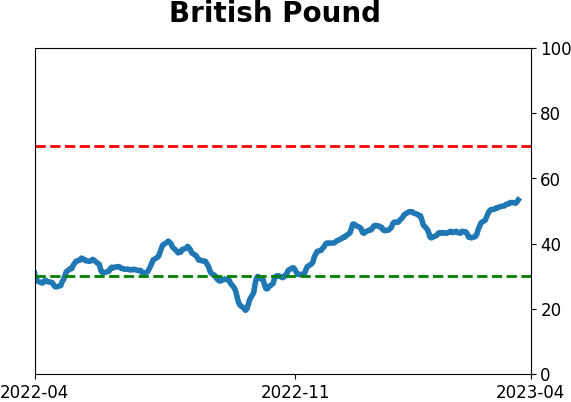
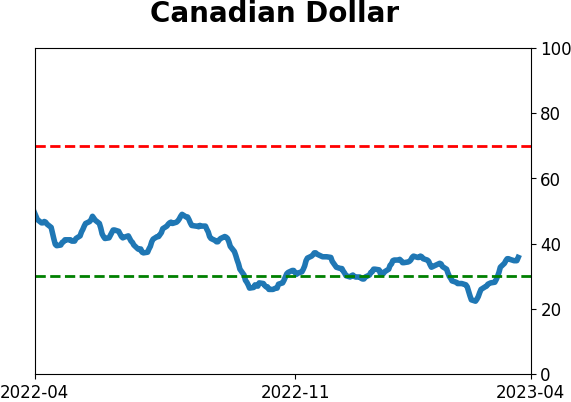
Currency ETF's - 5-Day Moving Average
|
|
|
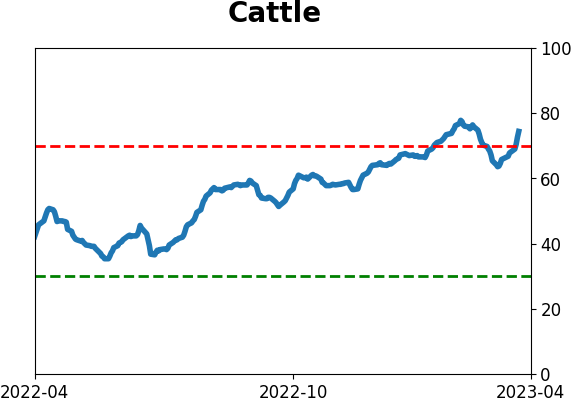
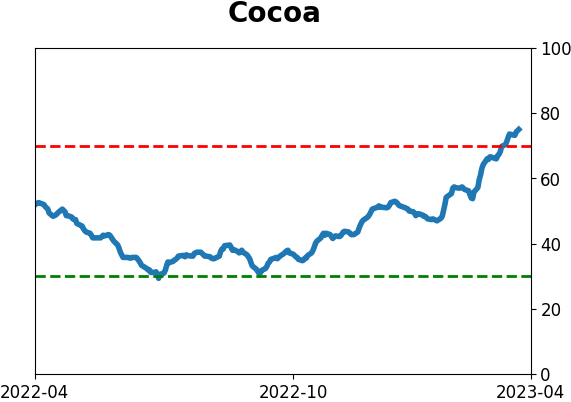
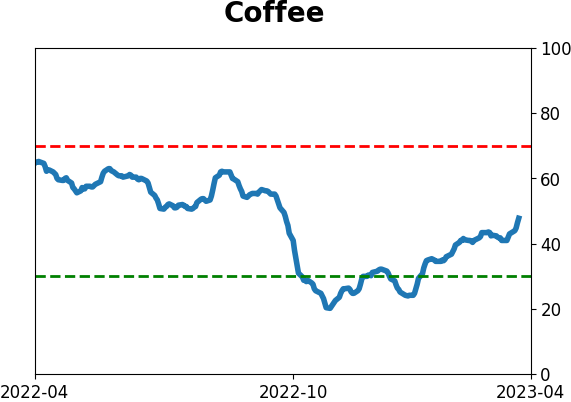
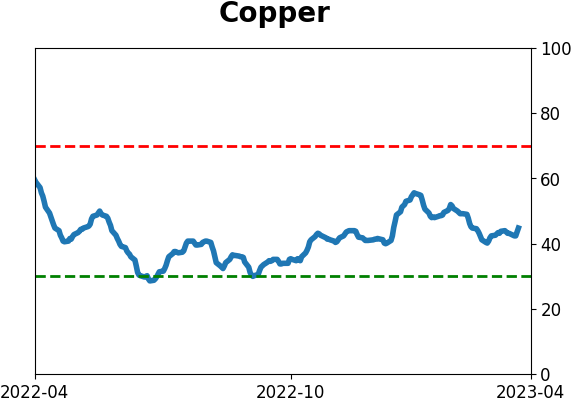
Commodity ETF's - 5-Day Moving Average
|
|