Headlines
|
|
Almost all gold miners have turned the corner:
Last fall, virtually all gold mining stocks were in sustained downtrends. Now, at least 80% of the stocks have a rising 200-day moving average, the most in over a year. After similar cycles, investors in these stocks tended to abandon them, raising the risk of losses.
|
Smart / Dumb Money Confidence
|
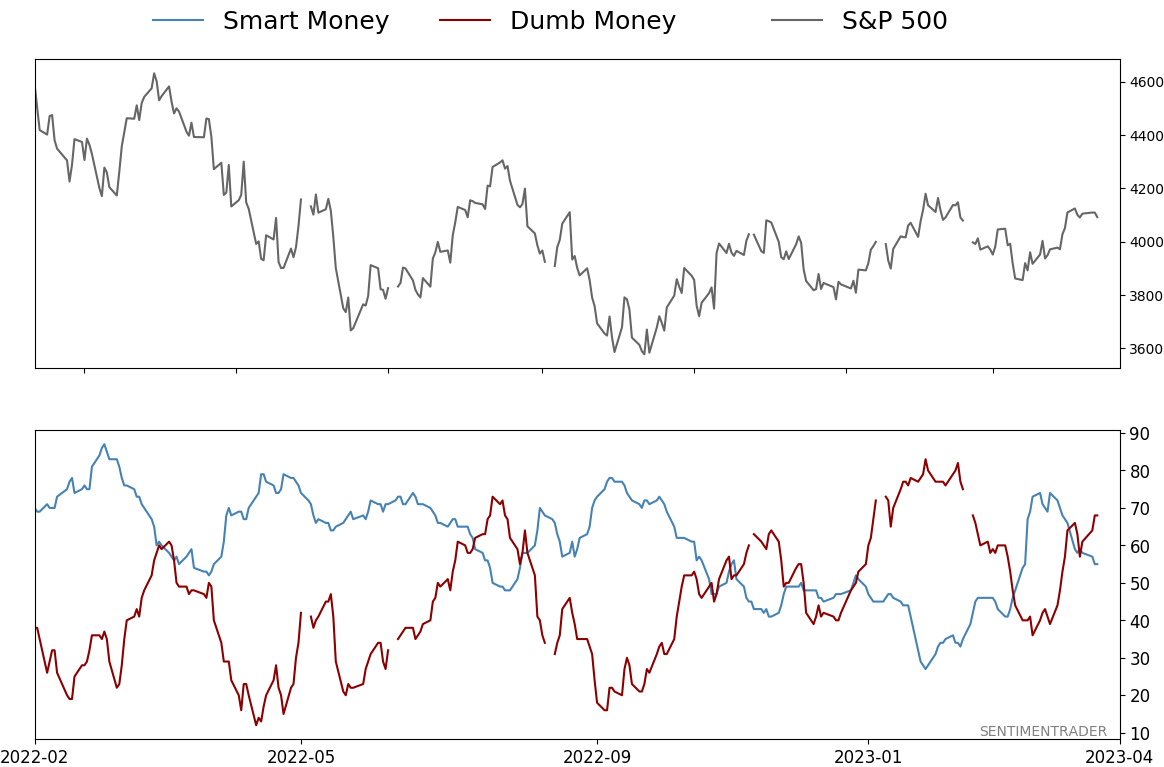
Smart Money Confidence: 55%
Dumb Money Confidence: 68%
|
|
Risk Levels
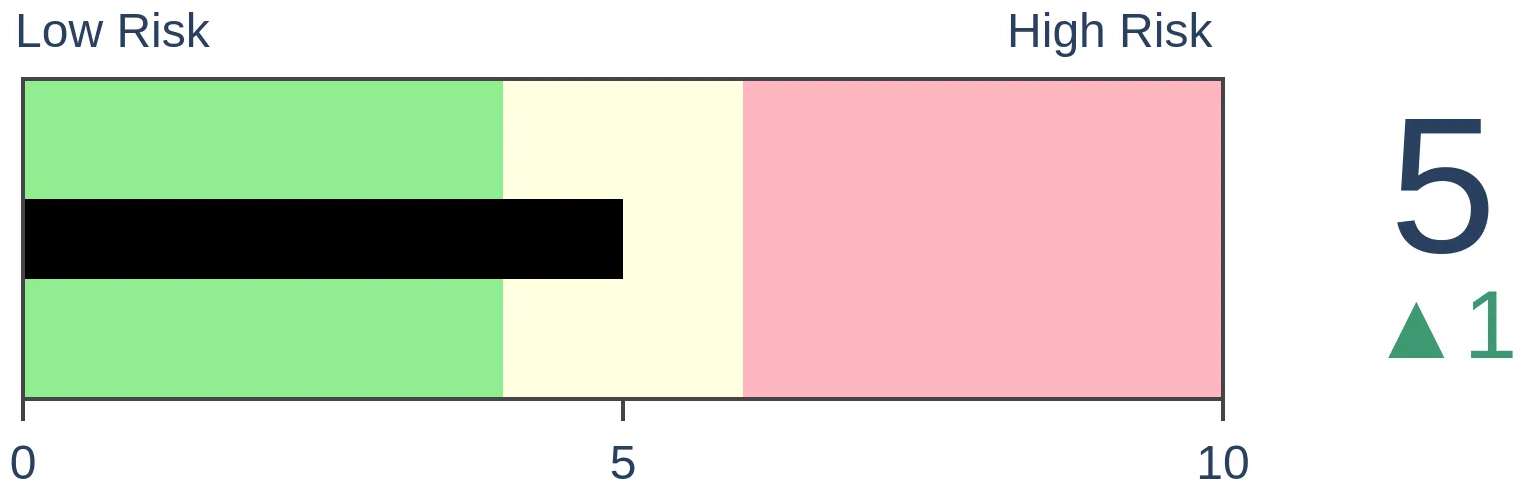
Stocks Short-Term
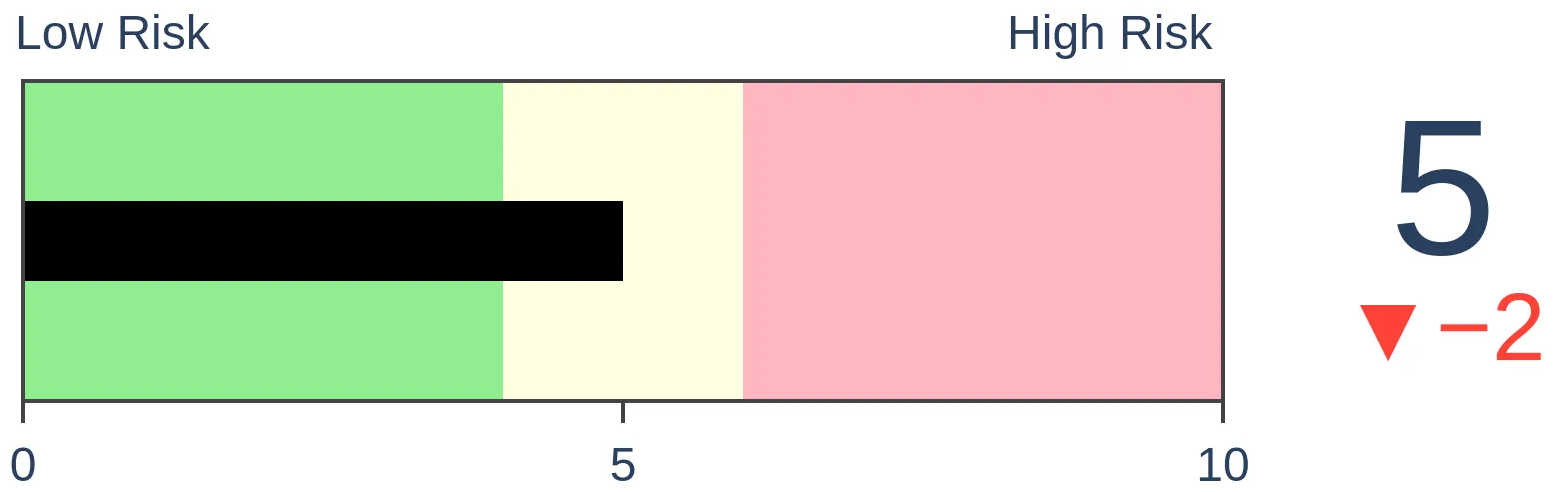
|
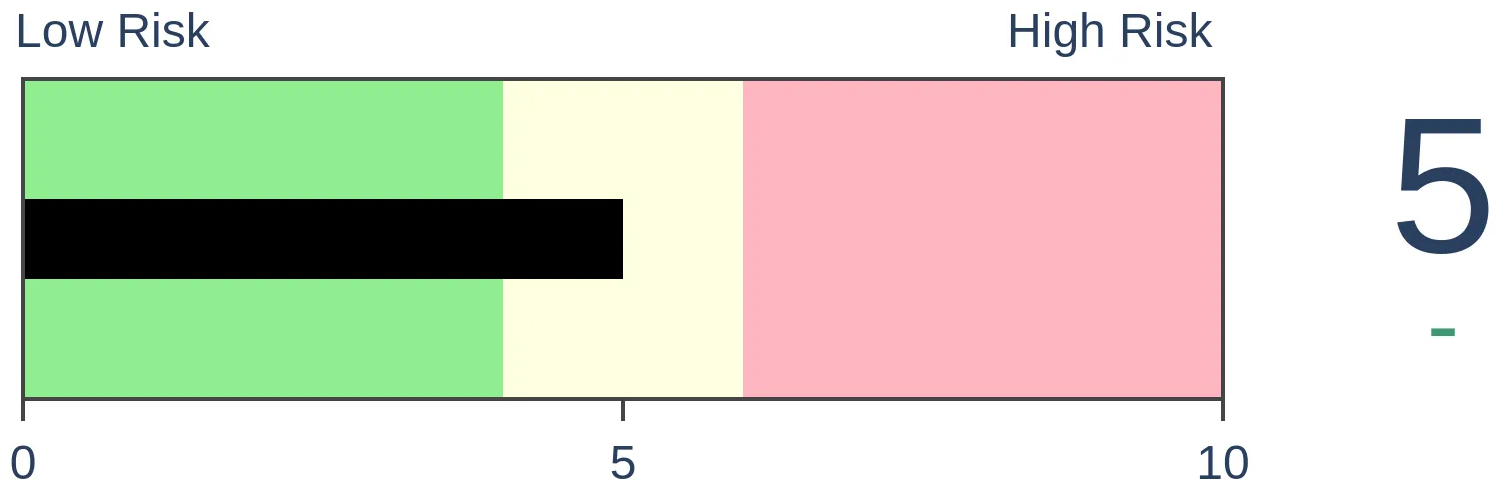
Stocks Medium-Term
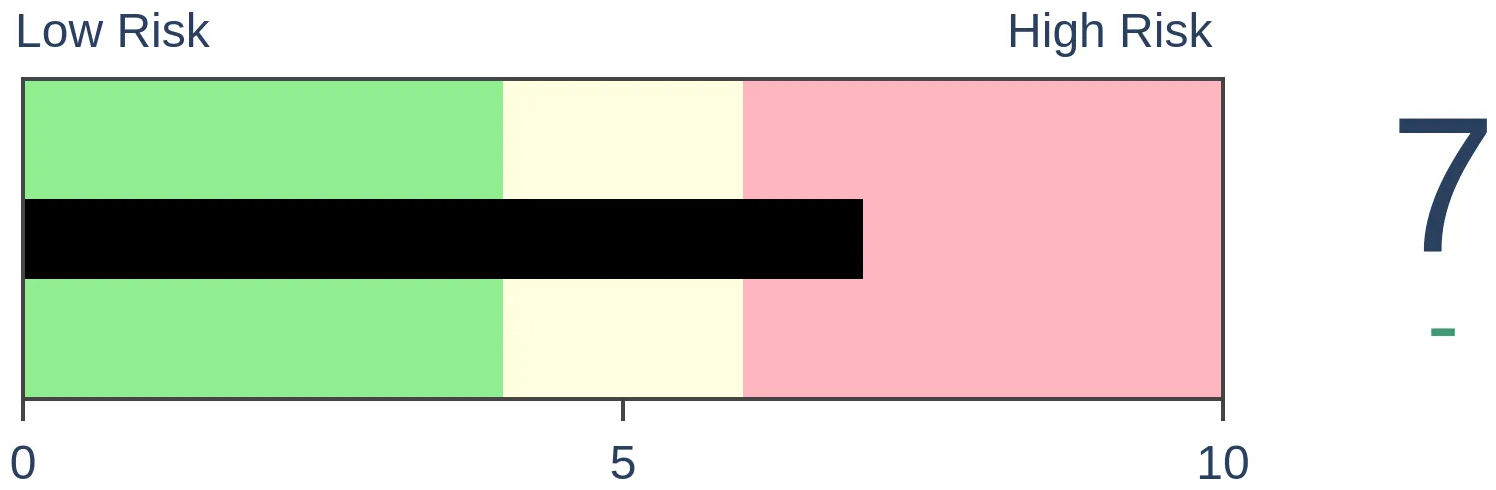
|
|
Bonds

|
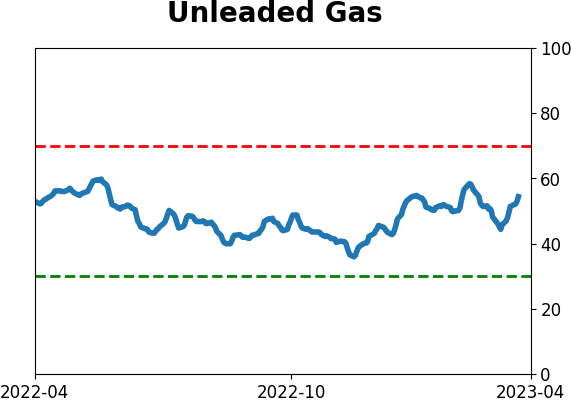
Crude Oil

|
|
Gold
|
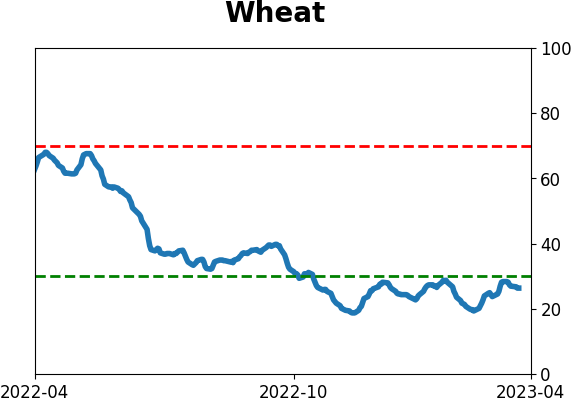
Agriculture
|
|
Research
By Jason Goepfert
BOTTOM LINE
Last fall, virtually all gold mining stocks were in sustained downtrends. Now, at least 80% of the stocks have a rising 200-day moving average, the most in over a year. After similar cycles, investors in these stocks tended to abandon them, raising the risk of losses.
FORECAST / TIMEFRAME
None
|
Key points:
- The percentage of gold mining stocks with a rising 200-day moving average has surged to 80%
- This comes on the heels of fewer than 10% of the stocks having solid uptrends last fall
- Similar cycles showed the difficulty of counting on sustained positive momentum in this sector
Most gold miners are in solid uptrends
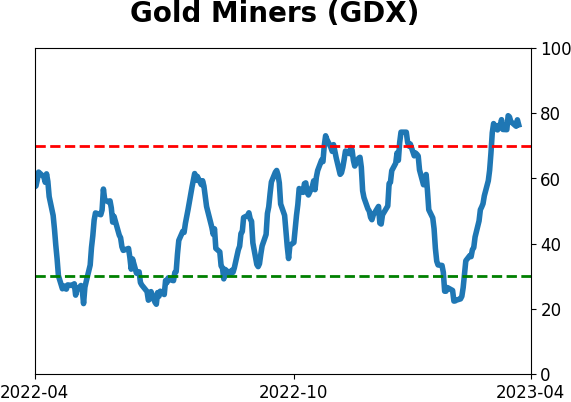
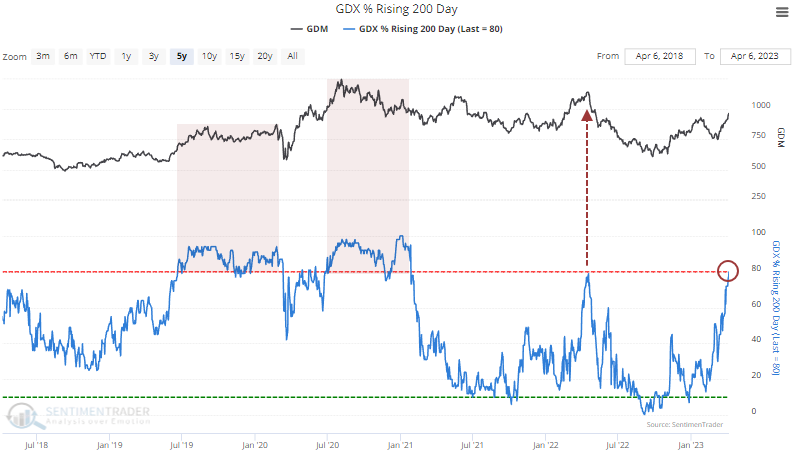
One of the best performers of any asset in recent weeks has been gold. And while there is not a perfect correlation to the metal, the companies that mine the shiny stuff tend to move more or less in lockstep with the price of their primary product. As a result, gold mining stocks have jumped to their highest prices in over a year.
Mining stocks bottomed last fall along with the broader market, so the recovery has been long-lasting. It's been enough to prompt a positive turn in the 200-day moving averages for 80% of gold miners. That's even more than the big rally in the spring of 2022, which proved to be a false dawn for these investors.
Gold miners have a long history of booms and busts. When few of the stocks have a rising 200-day moving average, gold miners sported an annualized return barely above zero. But when more than 80% of stocks had a rising average, that annualized return jumped to double-digits.
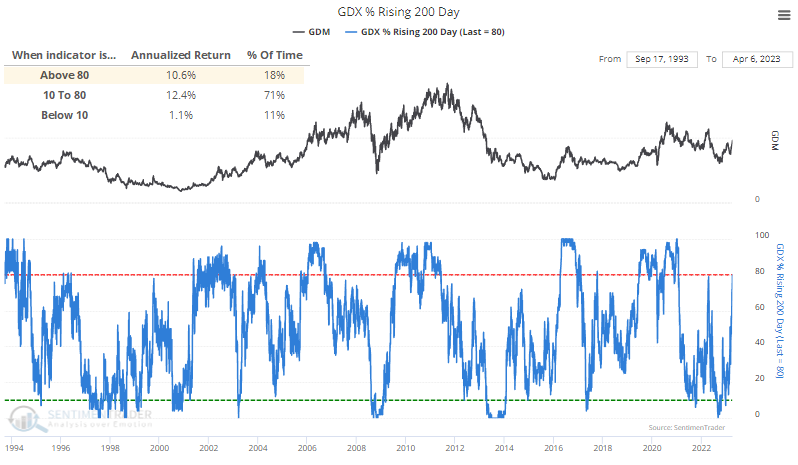
The positive return when more than 80% of stocks were in solid uptrends was mostly thanks to a couple of episodes of runaway upside. When the signals first occurred after a period of losses, it was much more of a struggle for the sector.
When miners turn the corner, near-term risks rise
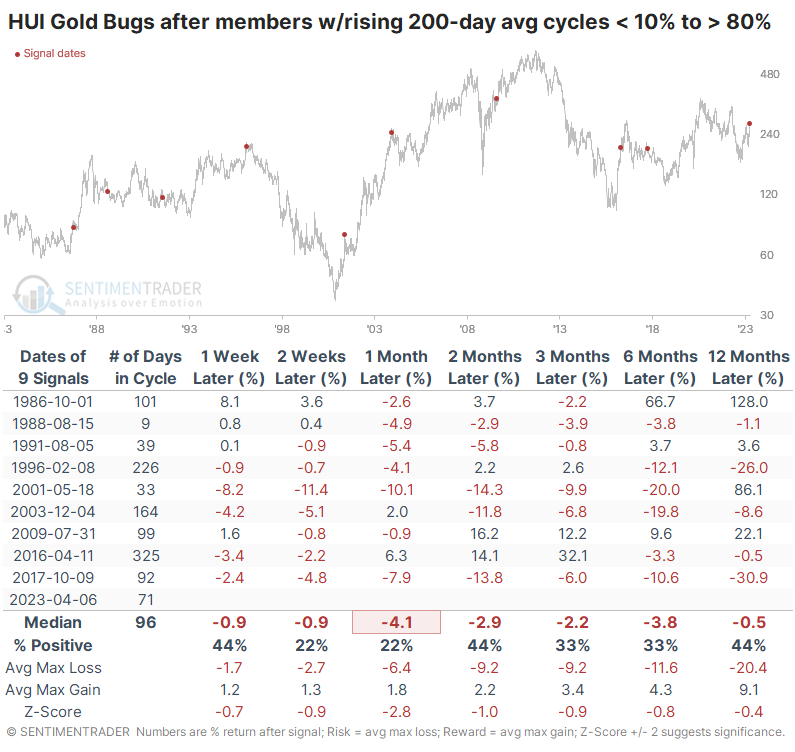
The table below shows forward returns in the Gold Bugs after fewer than 10% of gold mining stocks had a rising 200-day average, then more than 80% did. These are the first indications of widespread recovery from severely depressed conditions. Unfortunately for investors in these stocks, the recoveries showed a solid tendency to peter out quickly.
Over the next month, the index added to its gains only 22% of the time. Even six months later, only two signals showed a positive return, though they were significant and sustained. They were also among the few signals that showed positive short-term returns, suggesting that if investors continue to buy the sector in the coming days and weeks, it may alleviate some of the negative connotations.
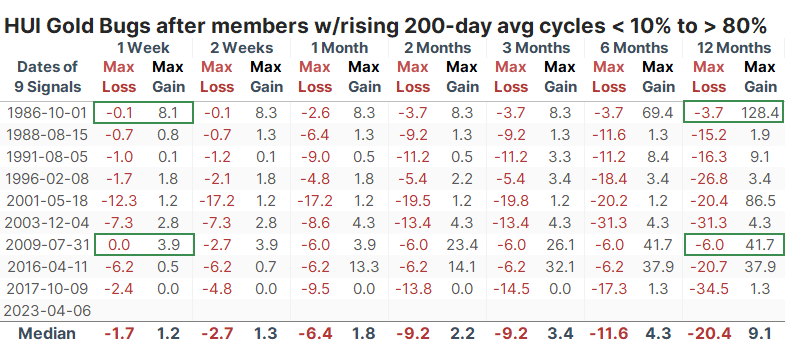
The table of maximum gains and losses over each time frame shows that the two best signals, in 1986 and 2009, also showed the most gains and minor losses in the first week after the signal. Overall, only two signals showed double-digit gains at any point within the next three months, while four signals showed larger than double-digit losses.
What the research tells us...
If gold has transitioned to one of its rare safe haven bull markets that defies all indicators, gold mining stocks should be able to hitch along for the ride. The stocks tend to have great difficulty holding extreme upside momentum, though, signs of which are becoming more abundant. While the sample size is too small to have high confidence, it will usher in more positive precedents if the sector can continue to hold its gains in the coming days and weeks. The initial signs are positive, but it's been tough to rely on these investors to follow through for long.
Indicators at Extremes
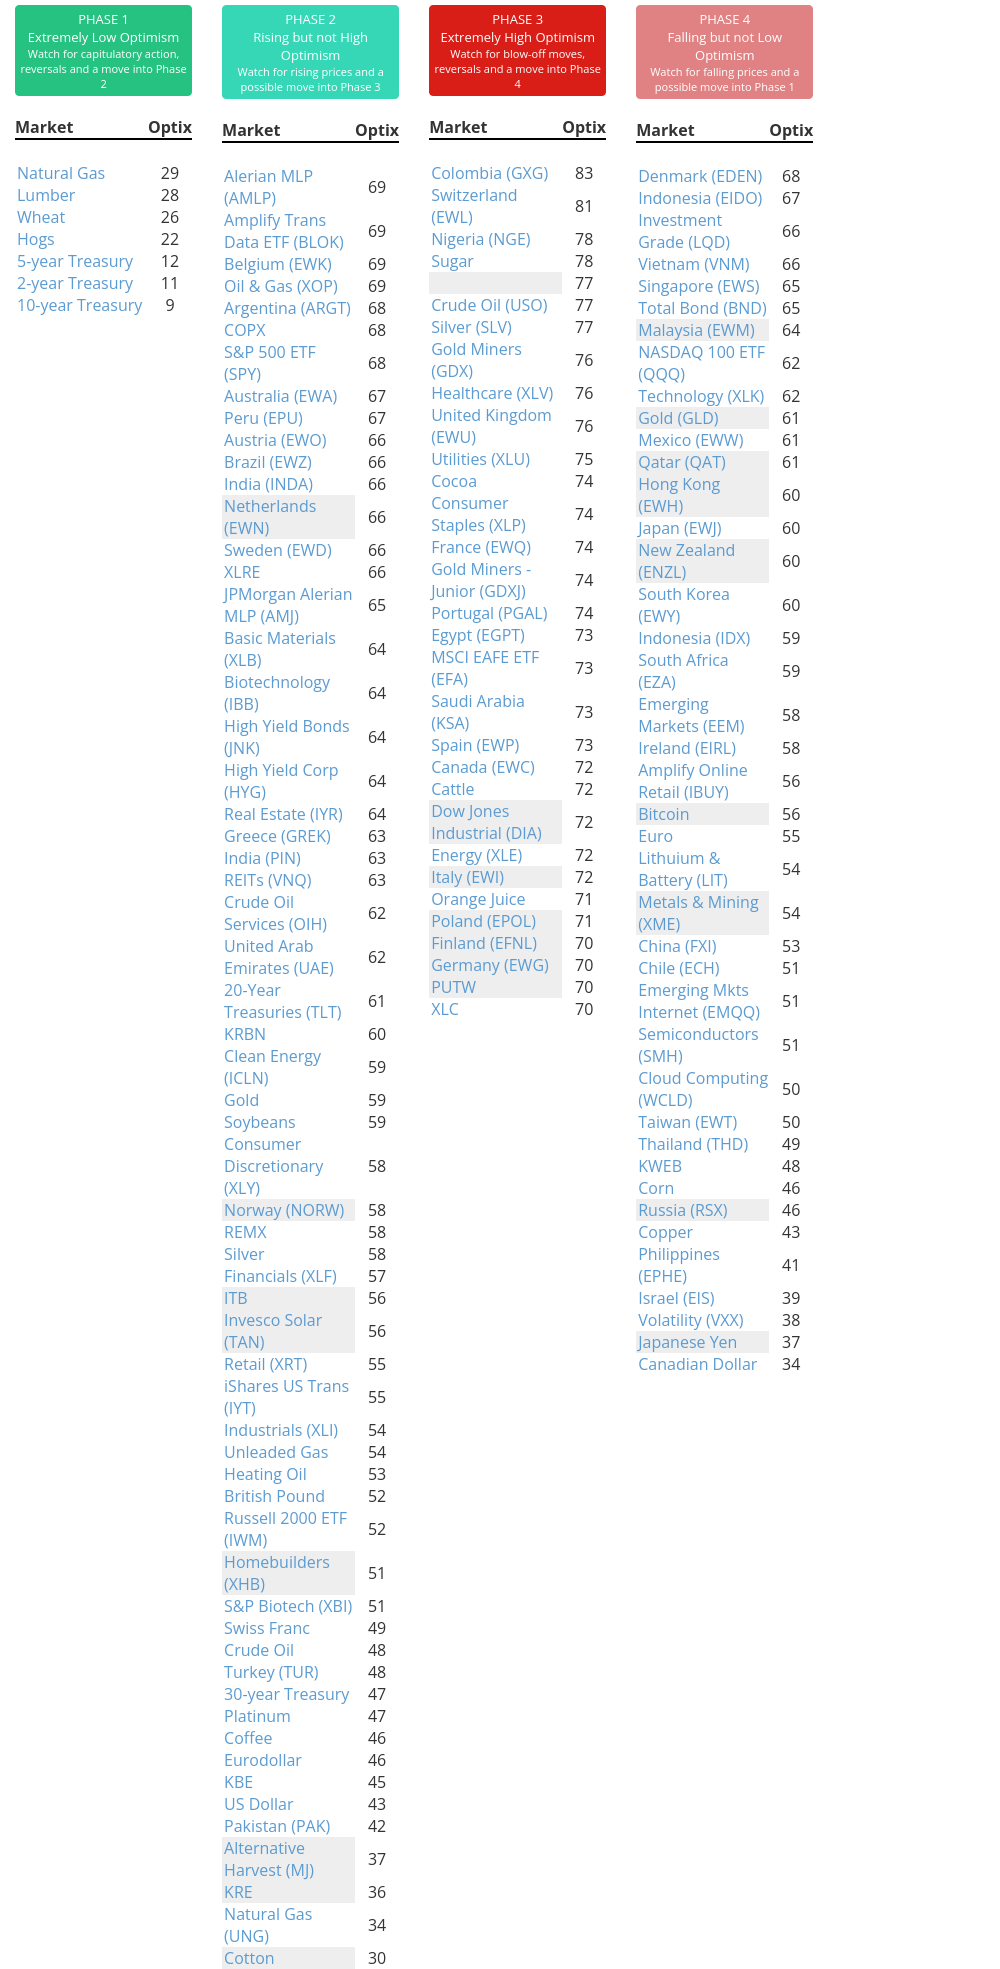
Phase Table
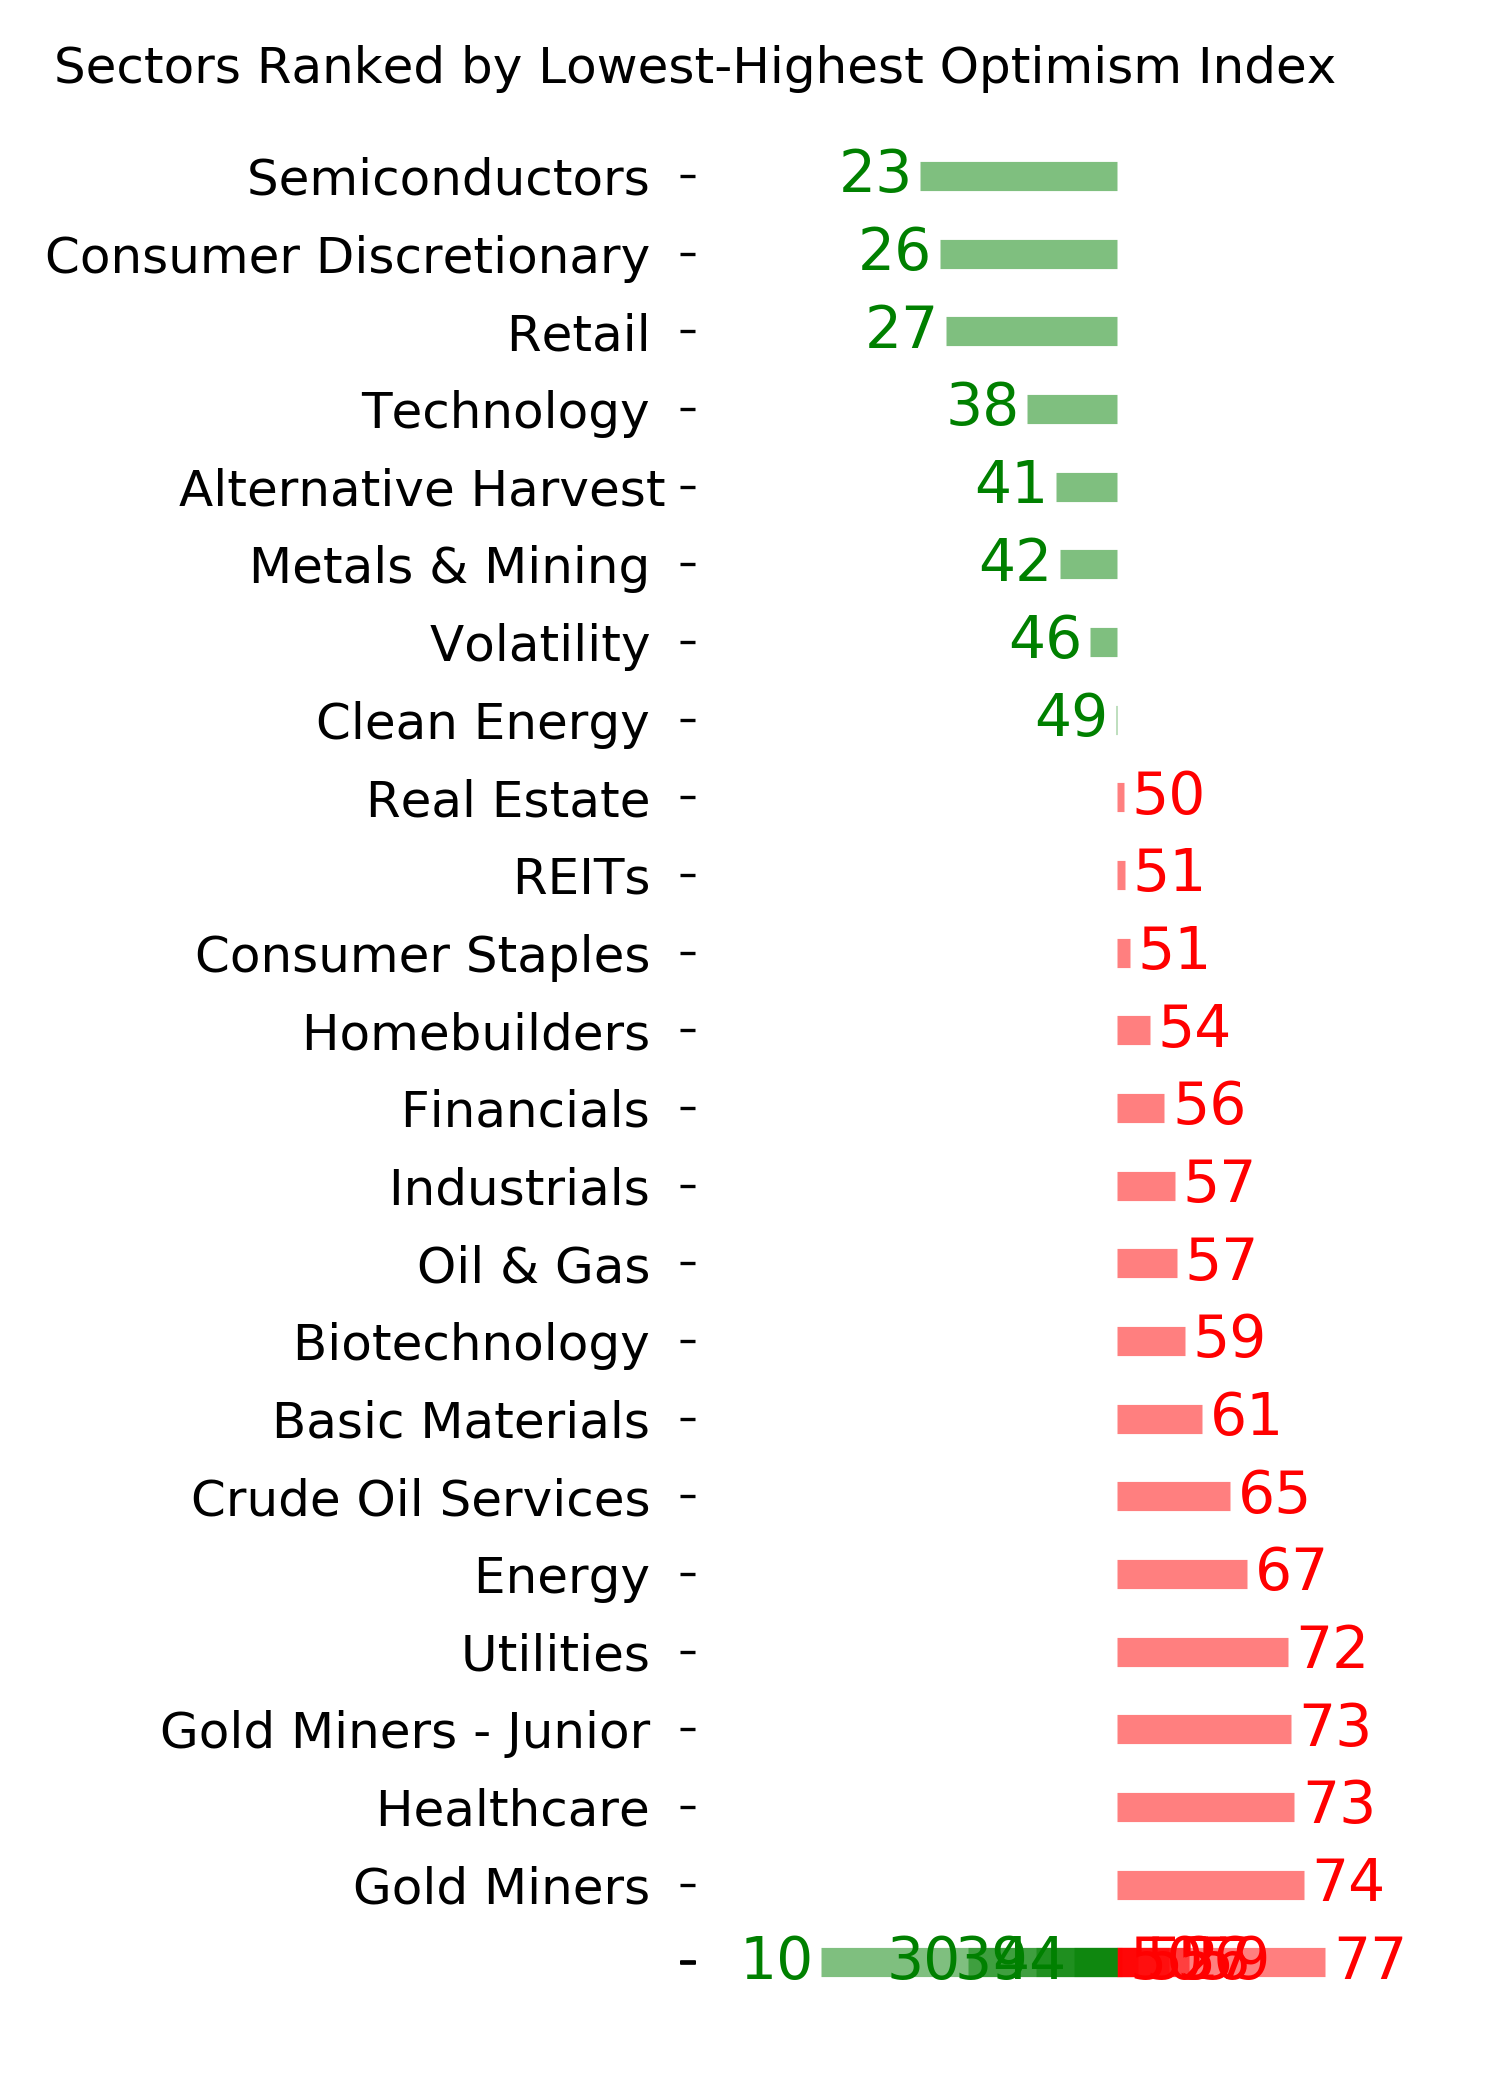
Ranks
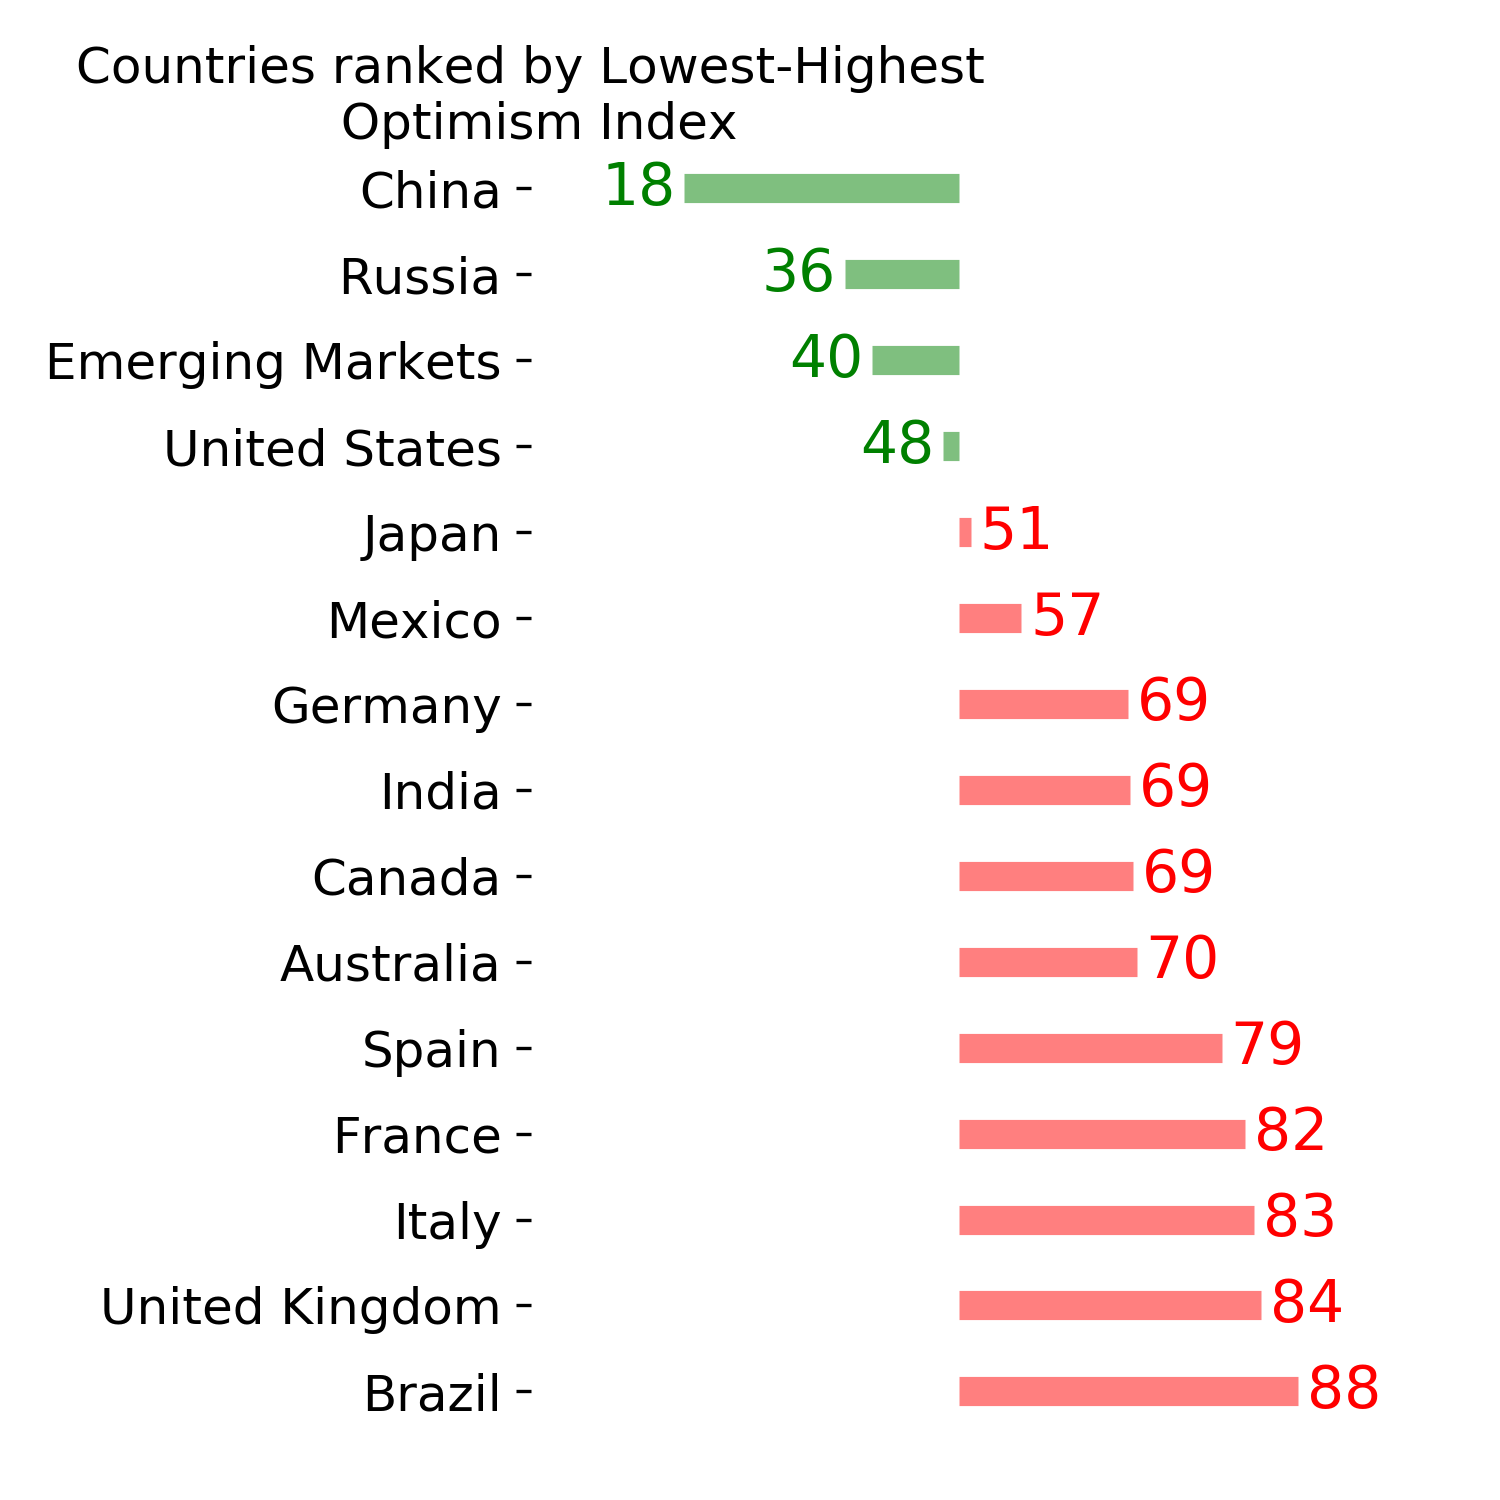
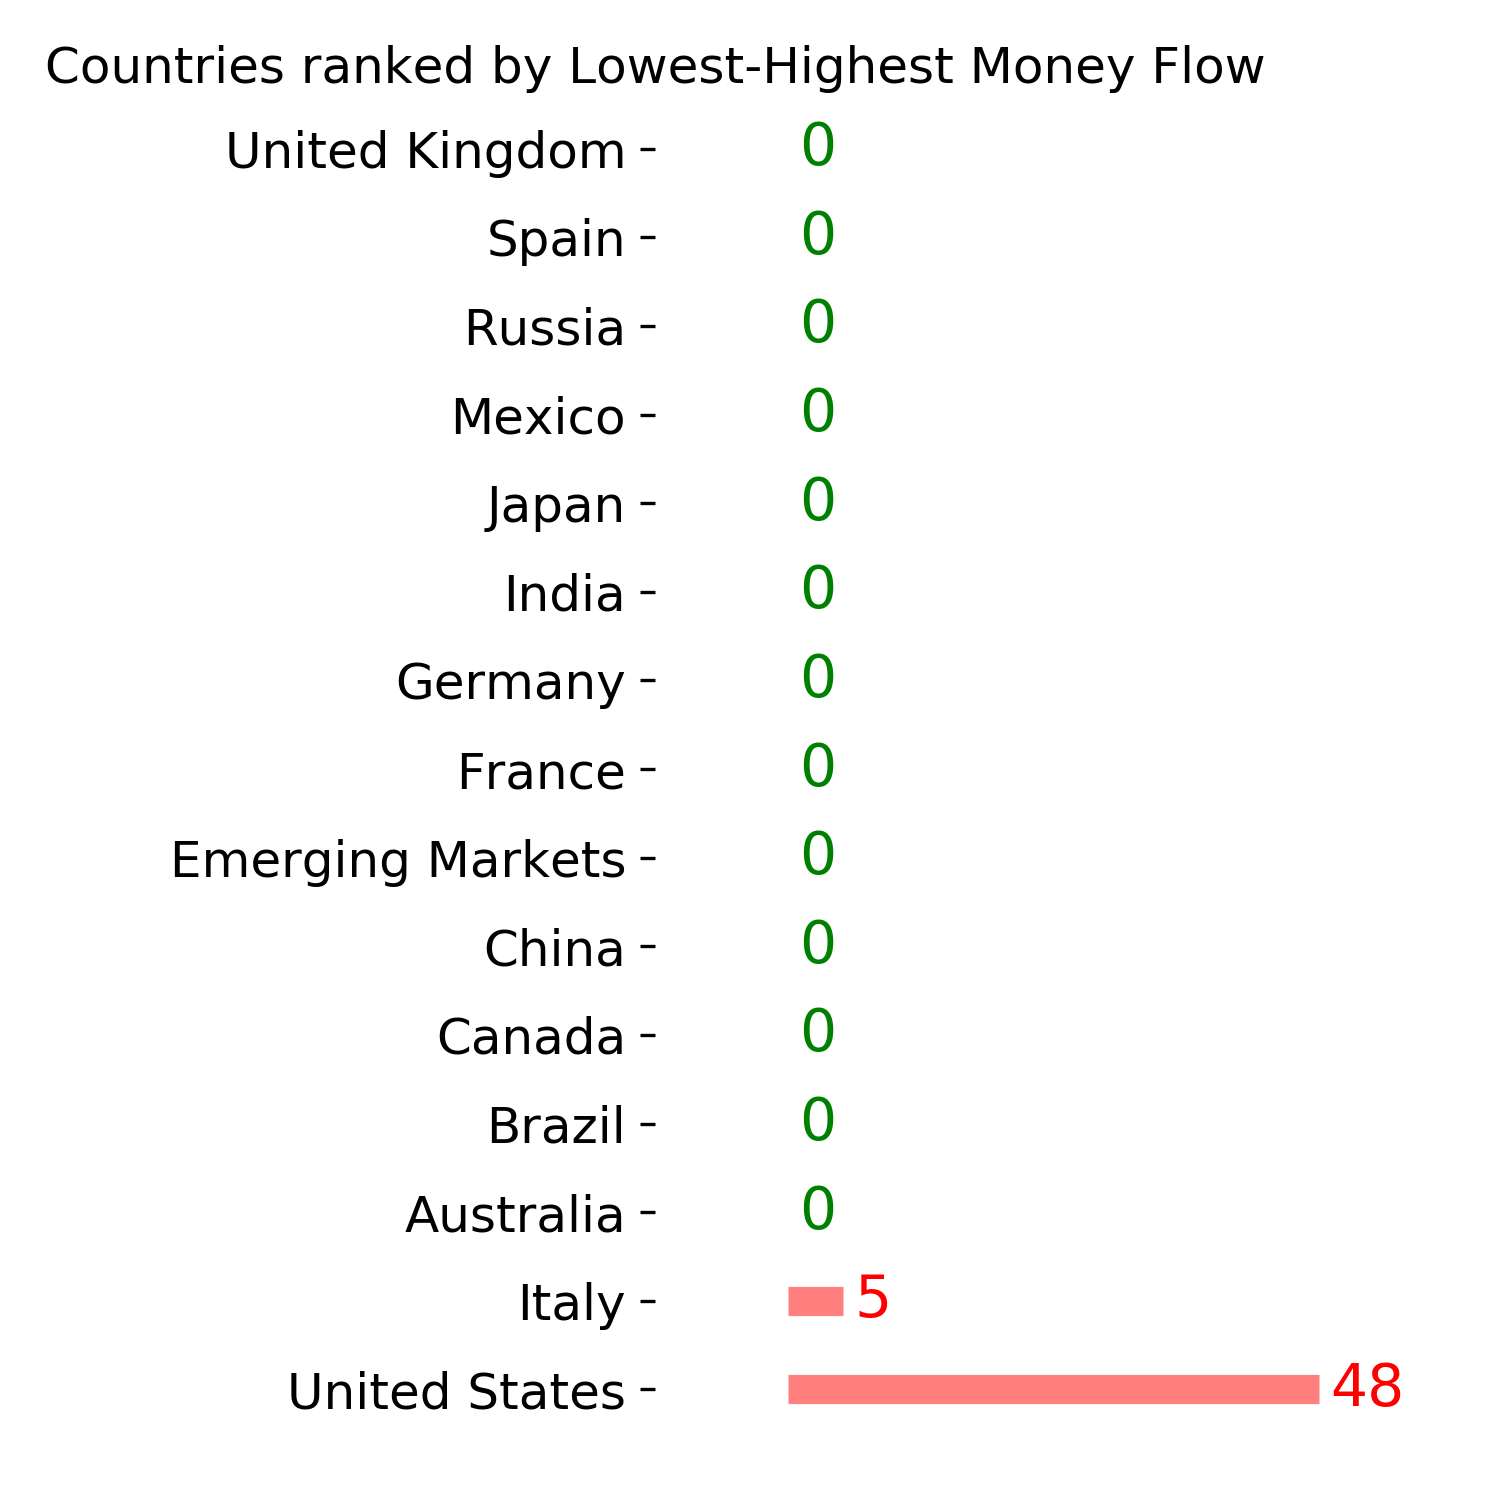
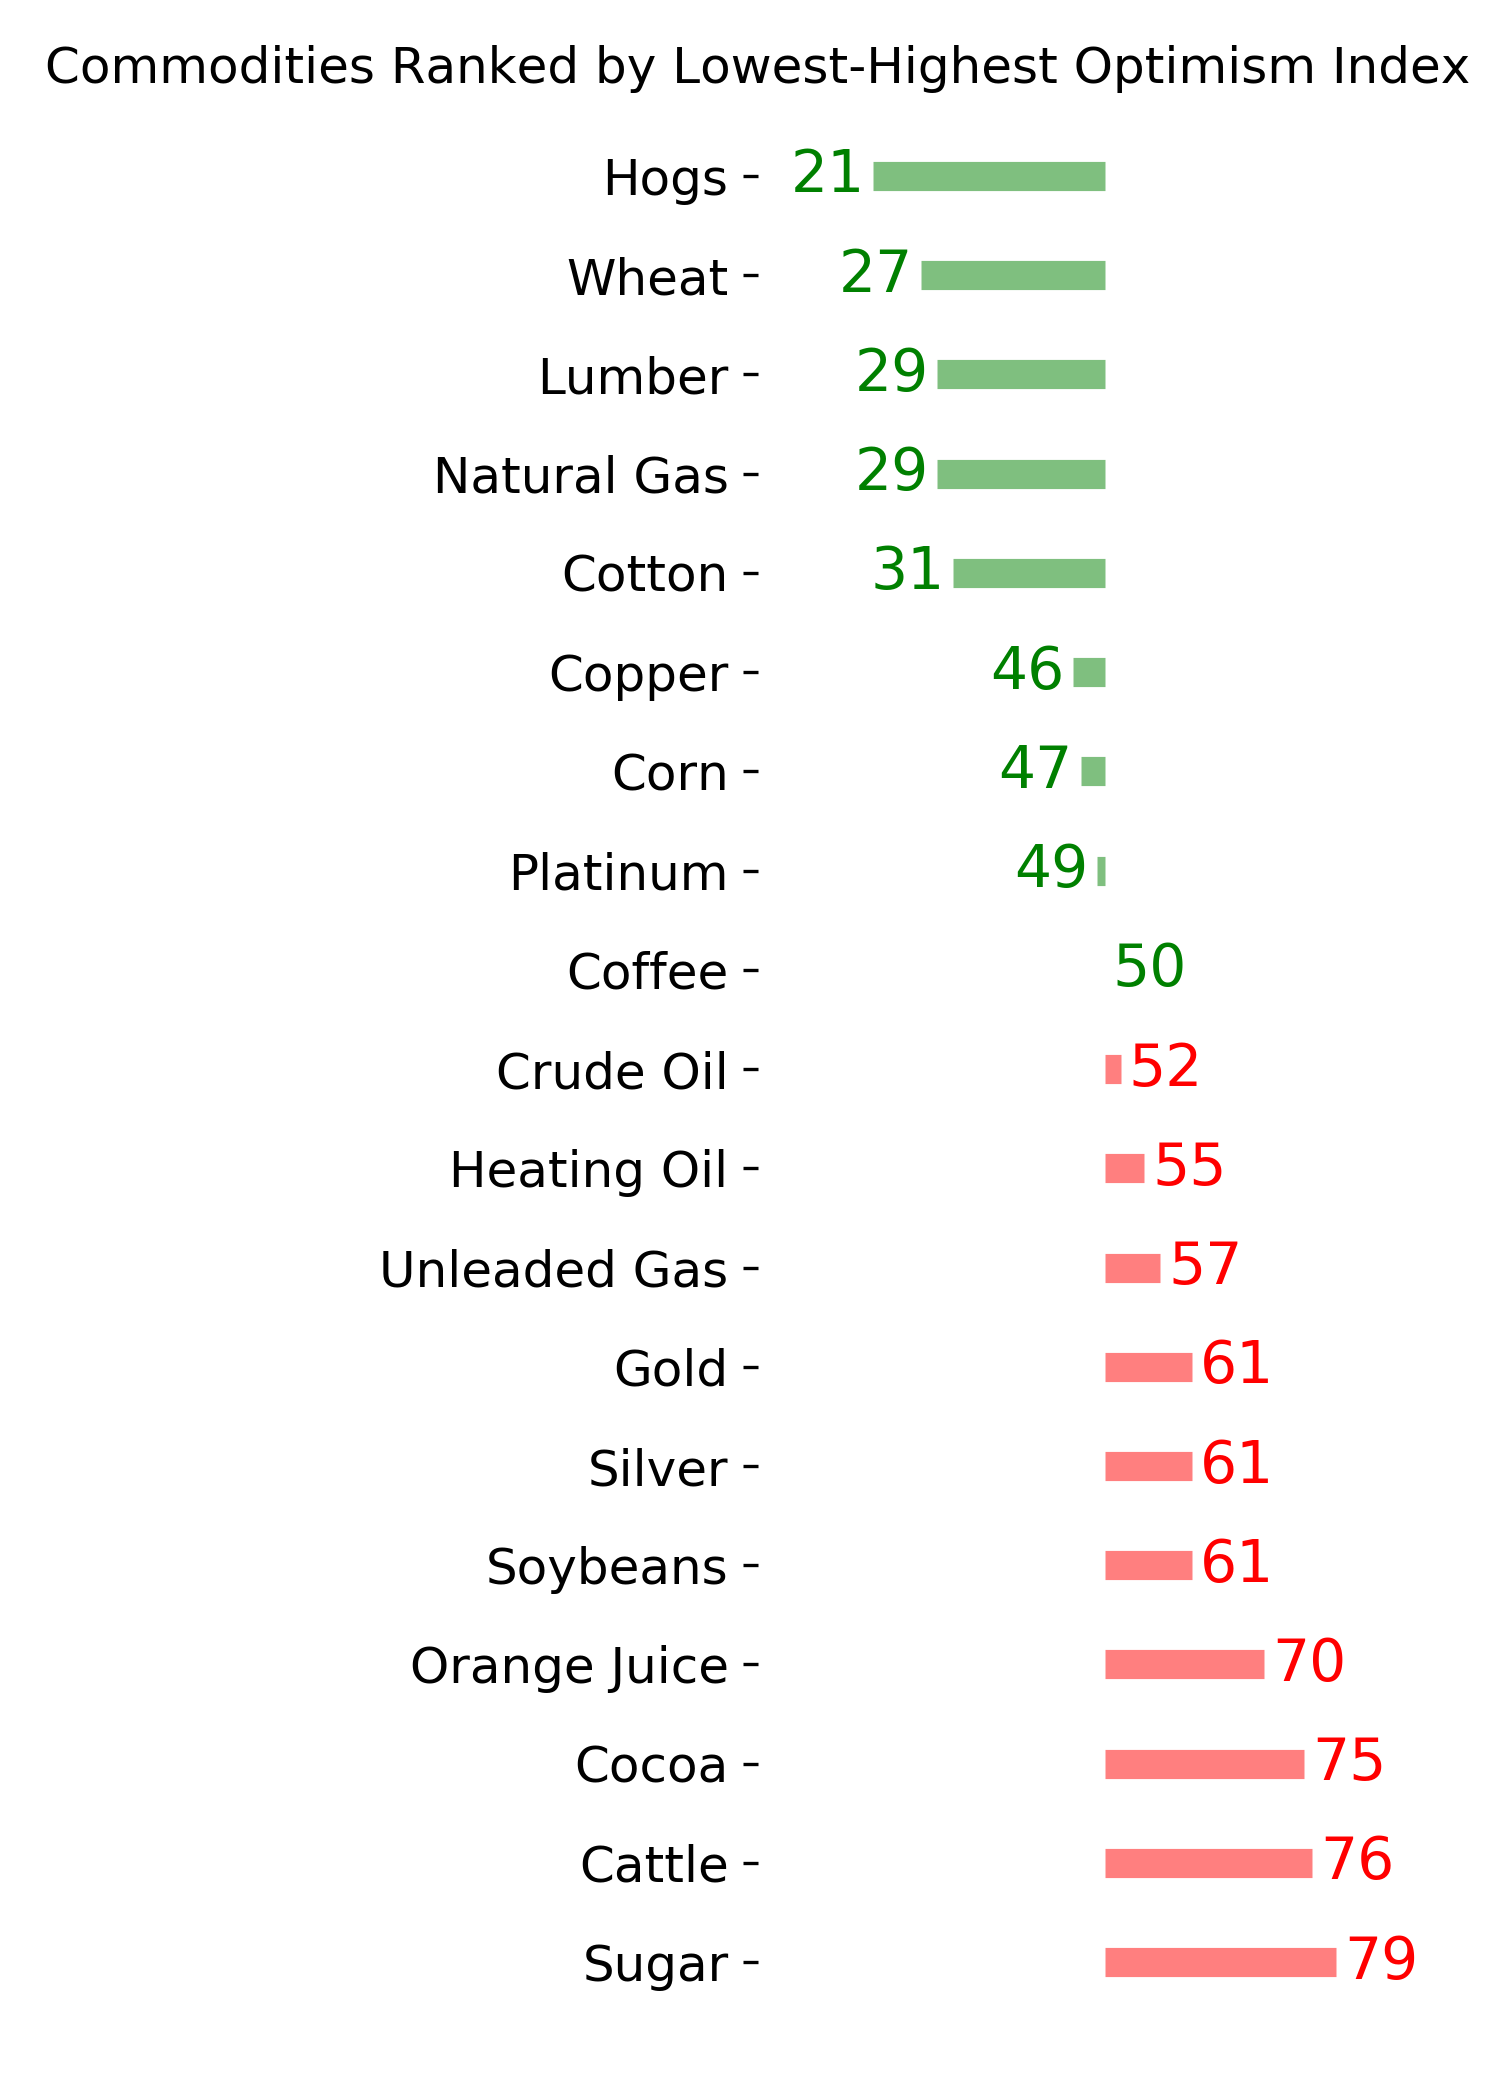
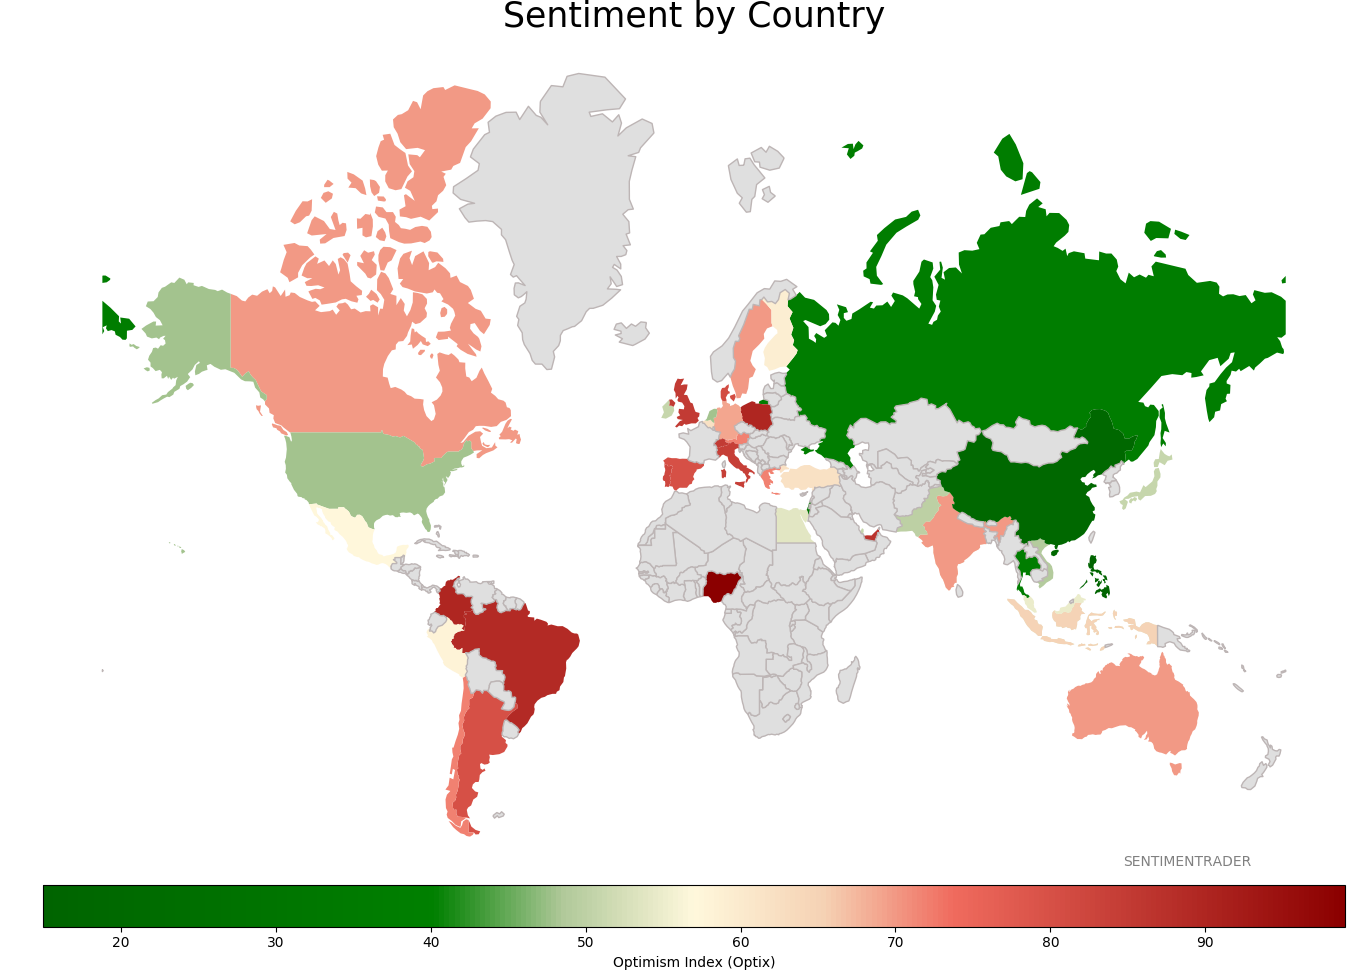
Sentiment Around The World
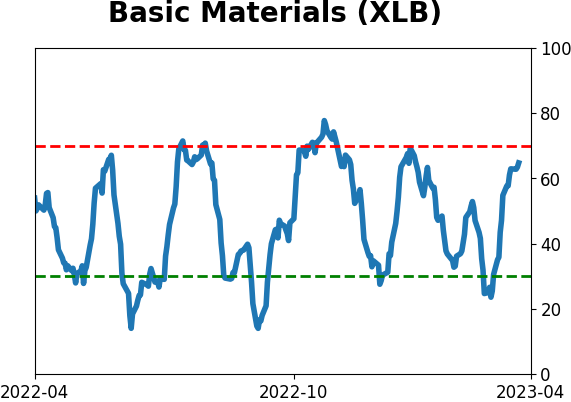
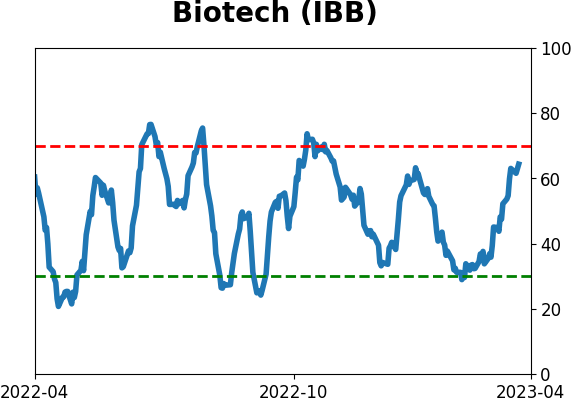
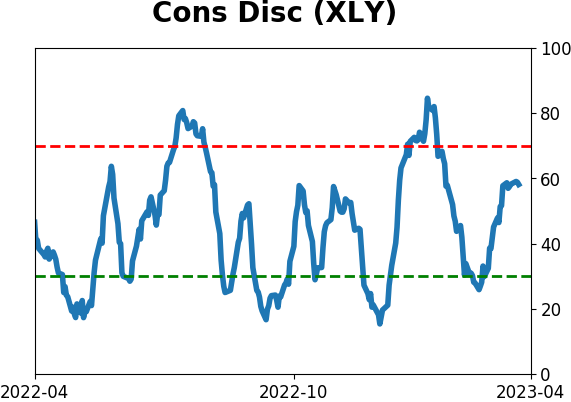
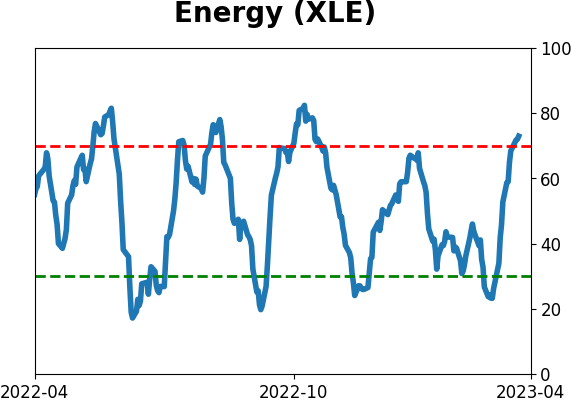
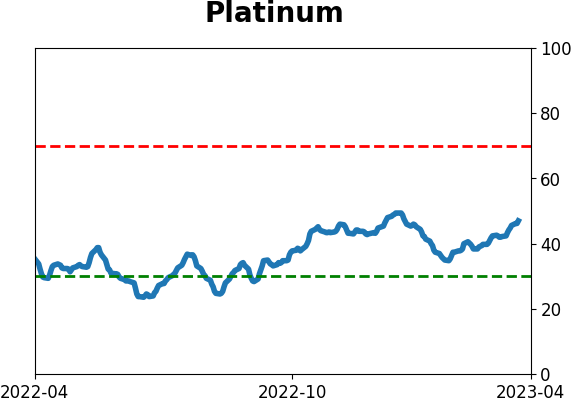
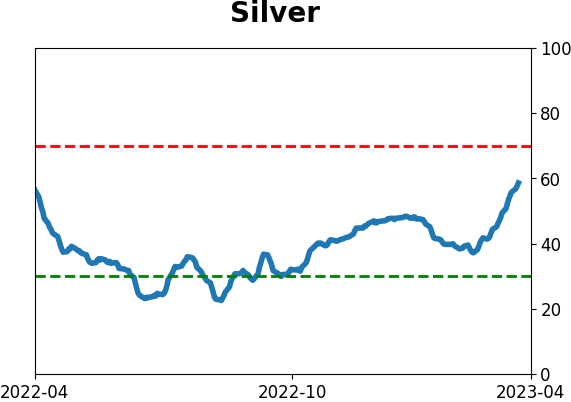
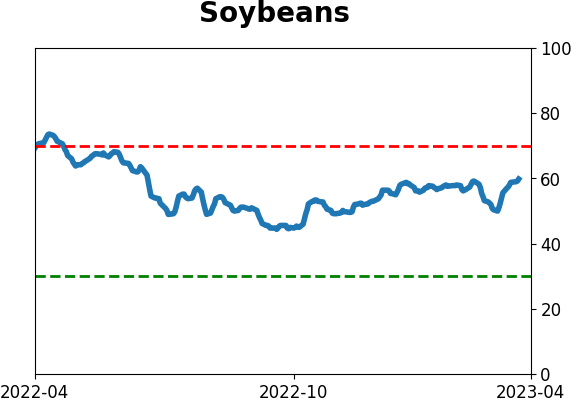
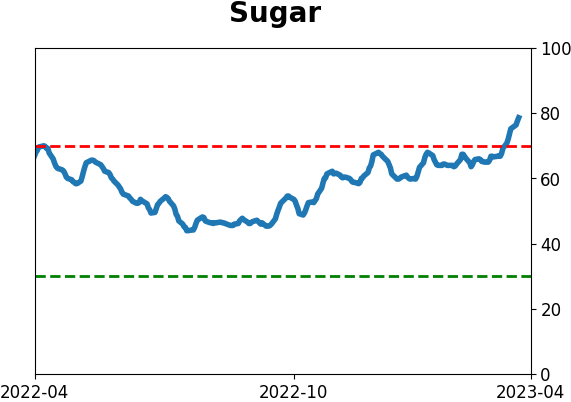
Optimism Index Thumbnails
|
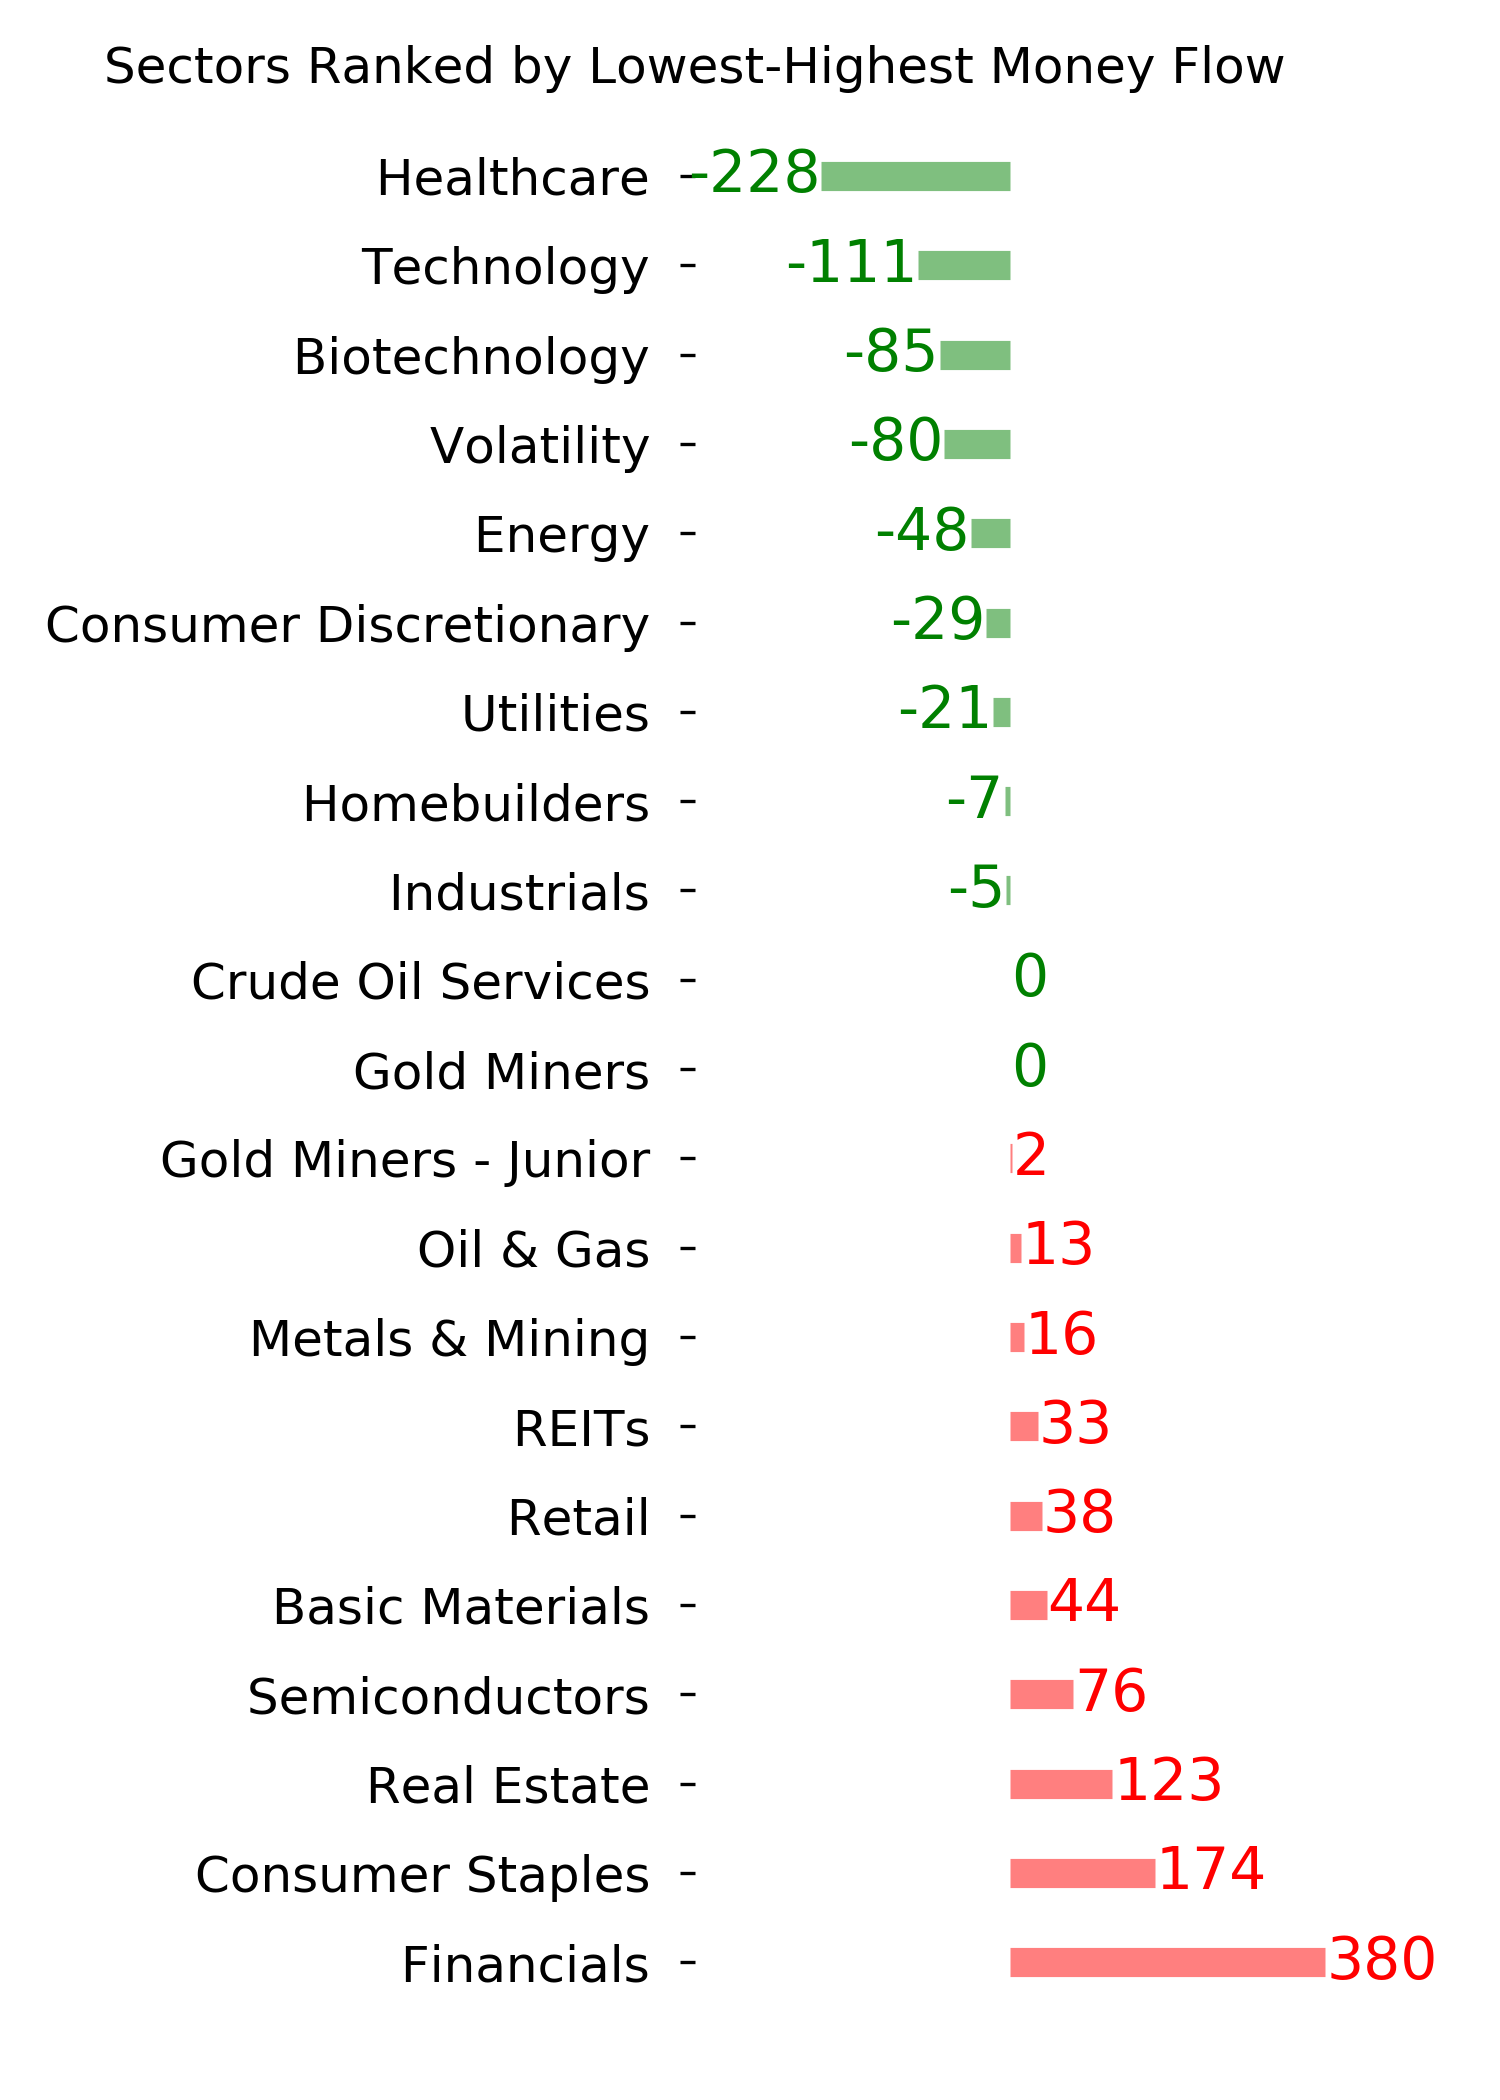
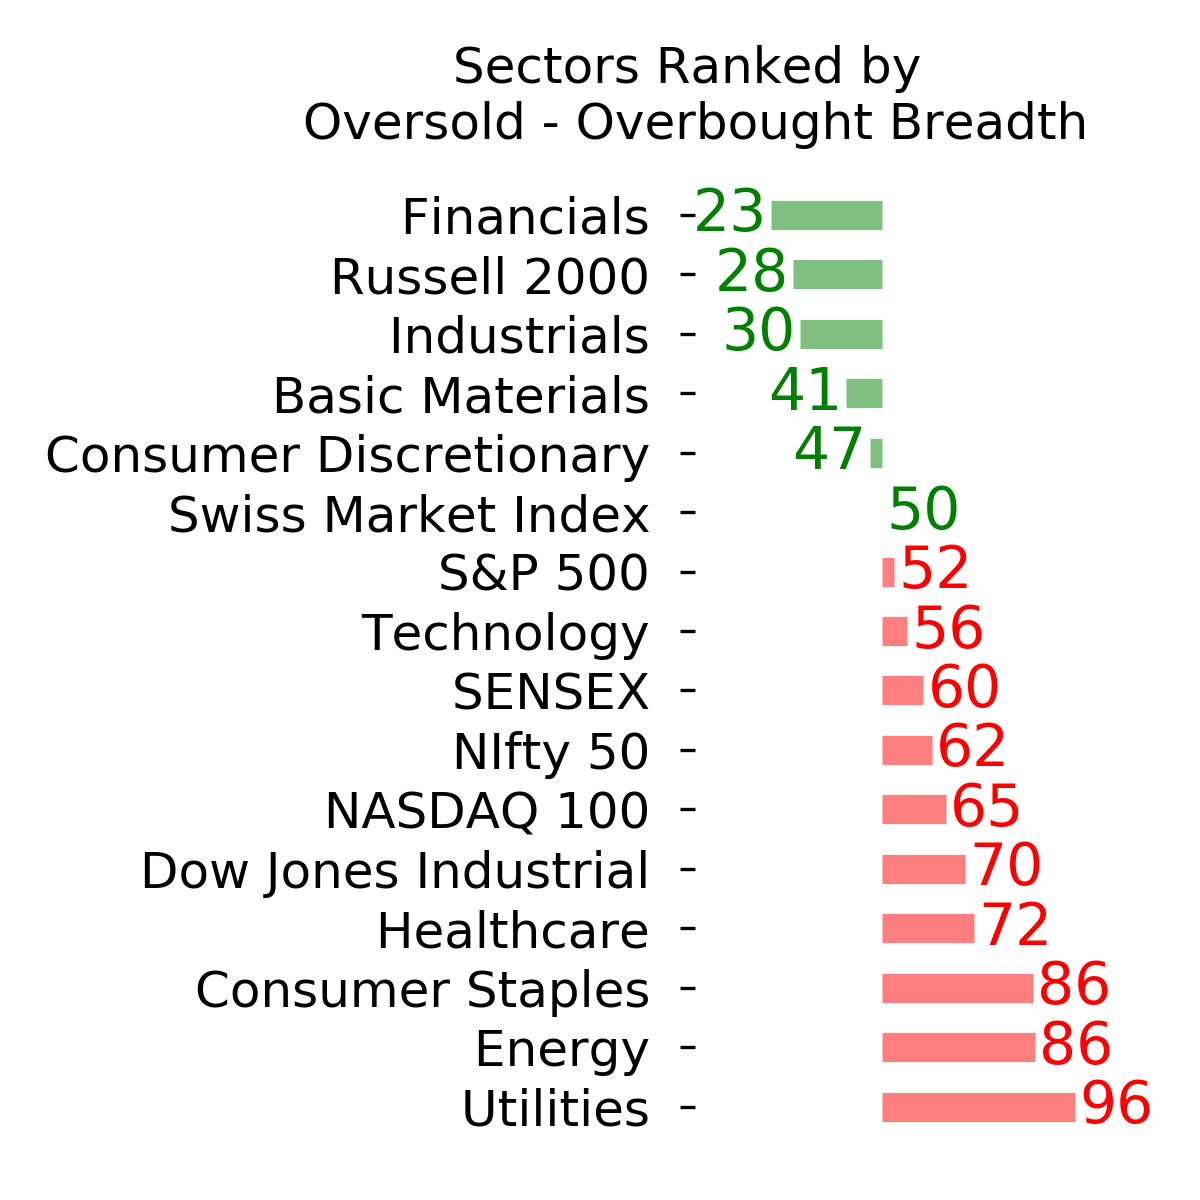
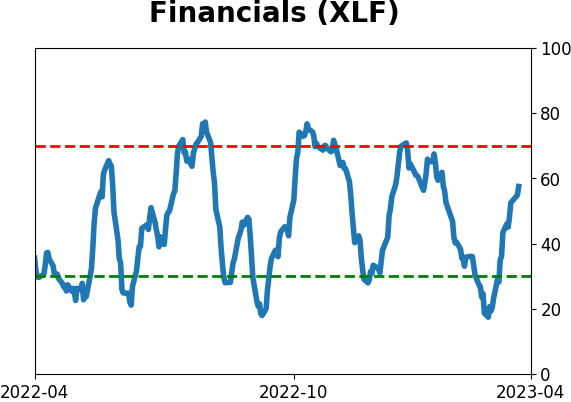
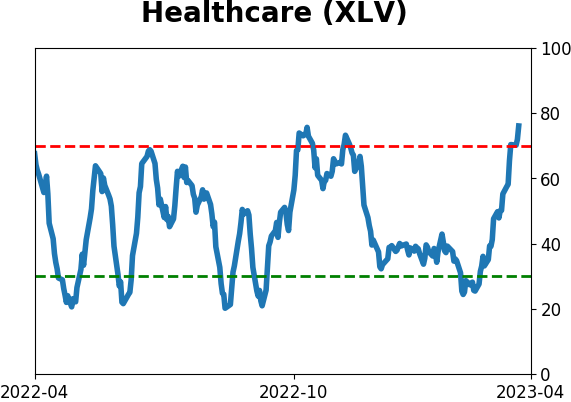
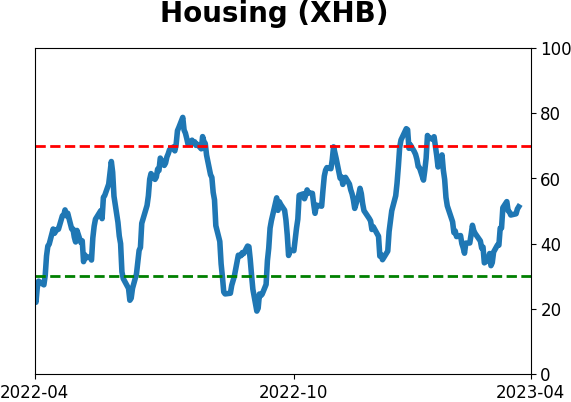
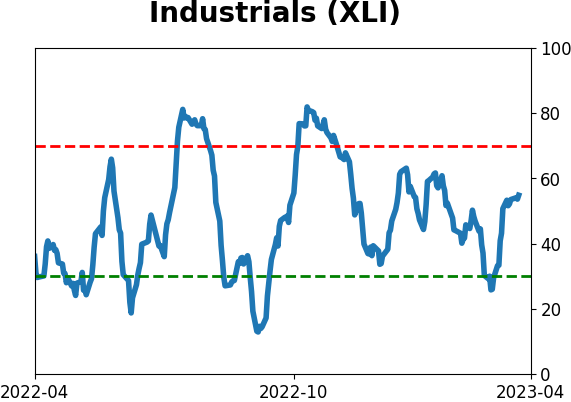
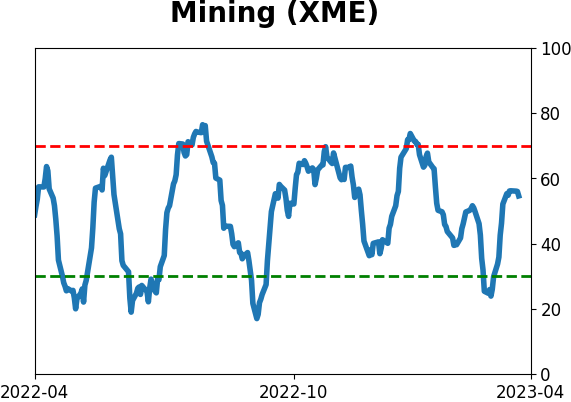
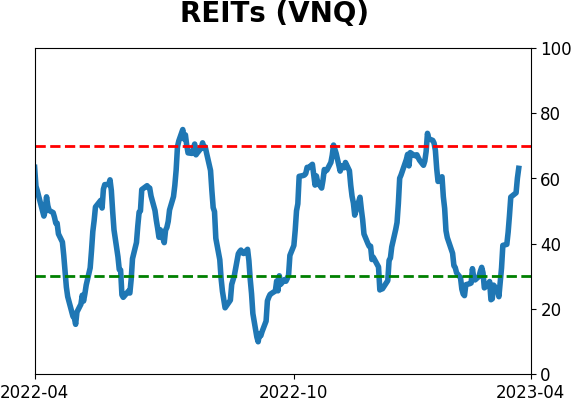
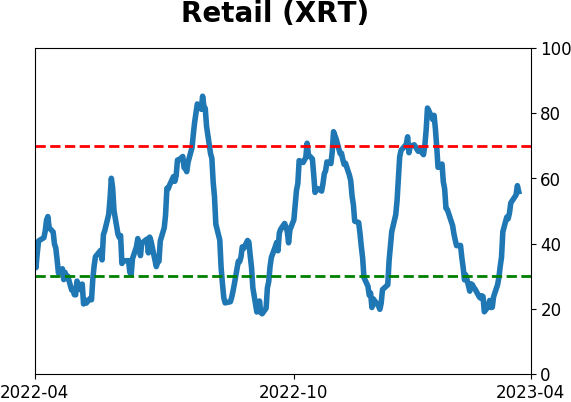
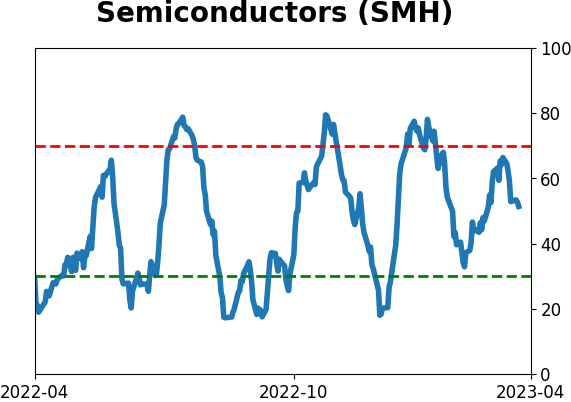
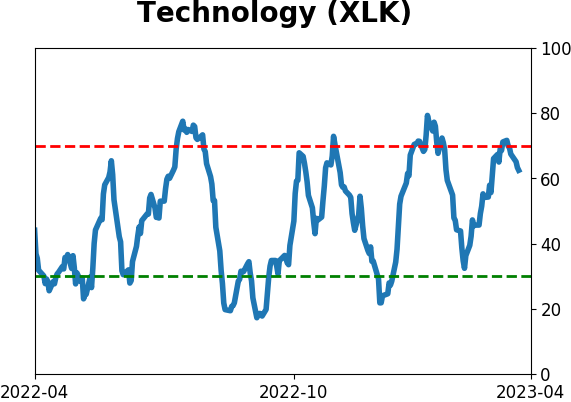
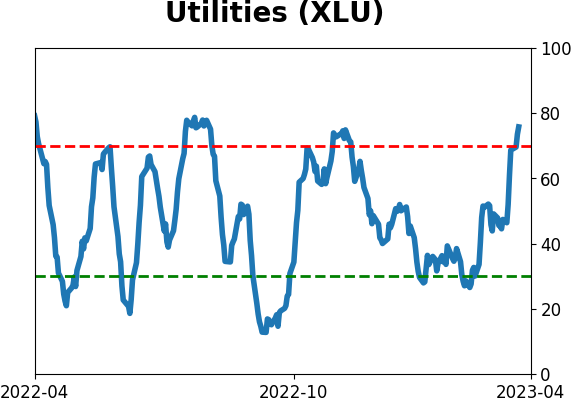
Sector ETF's - 10-Day Moving Average
|
|
|
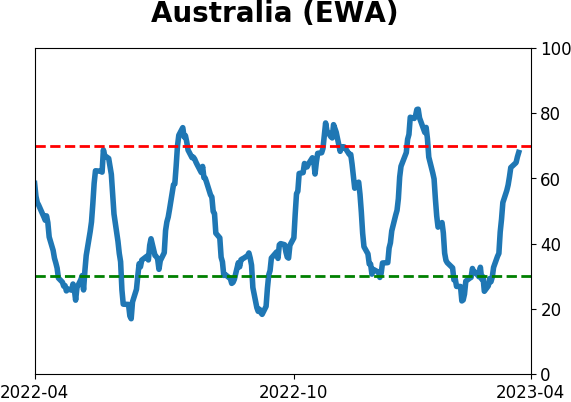
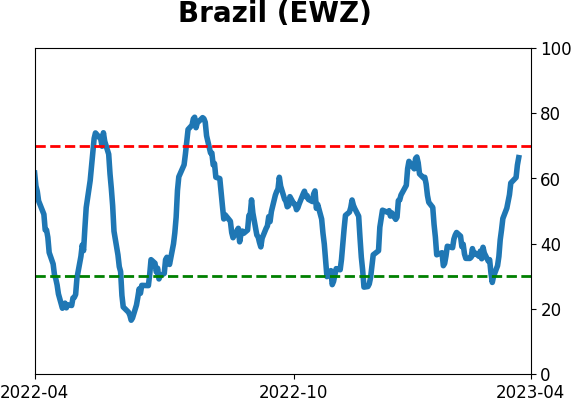
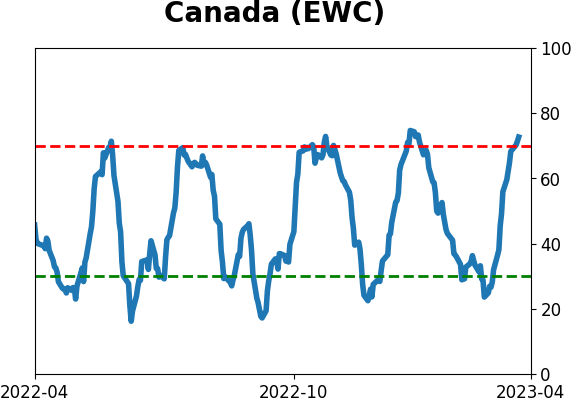
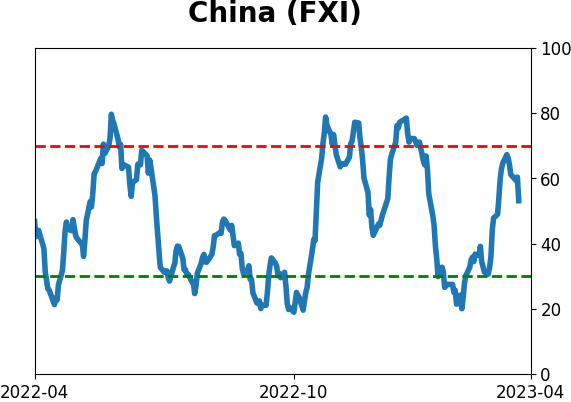
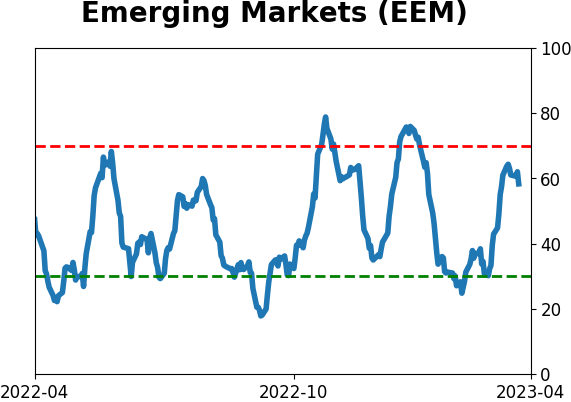
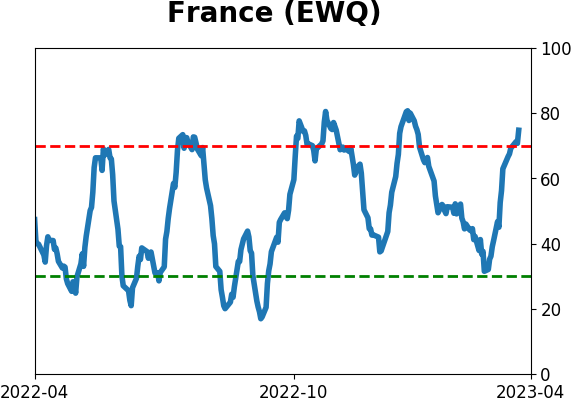
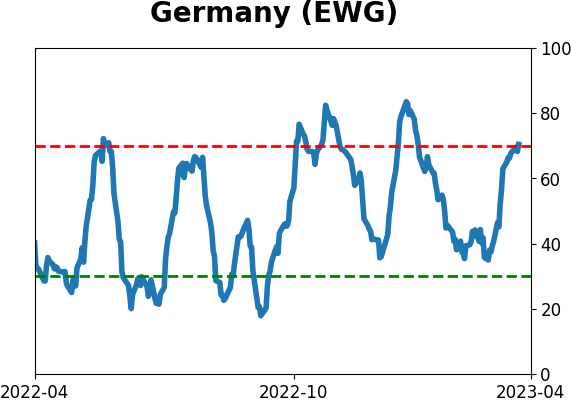
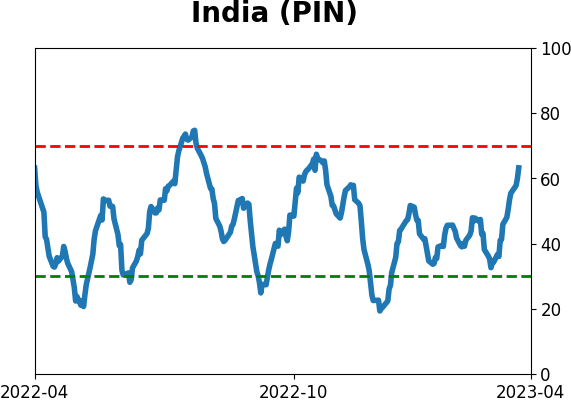
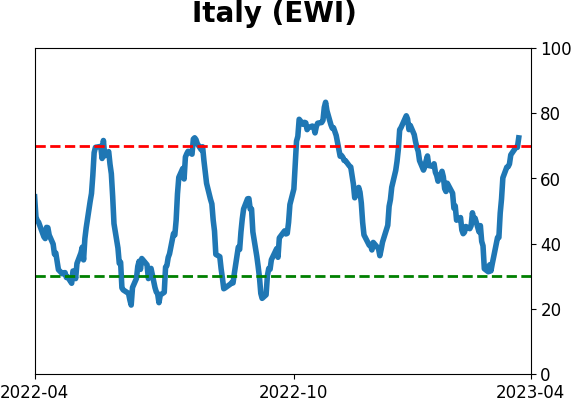
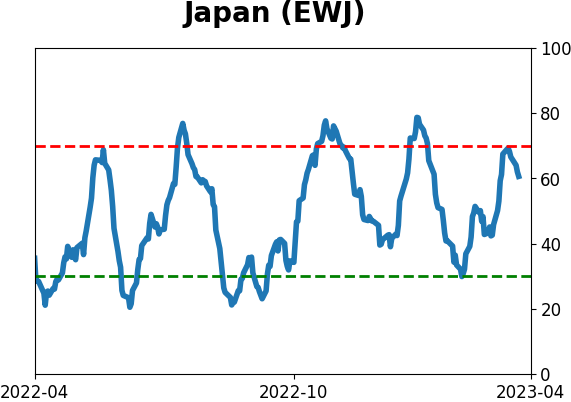
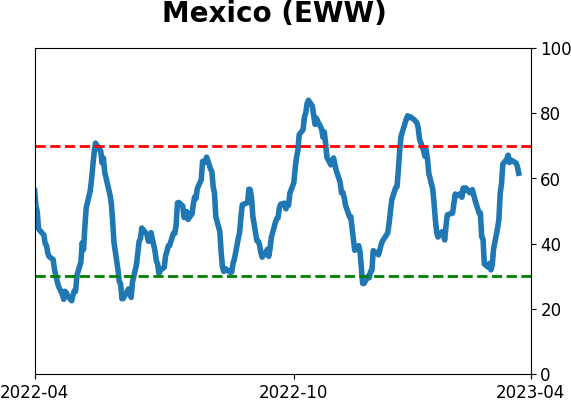
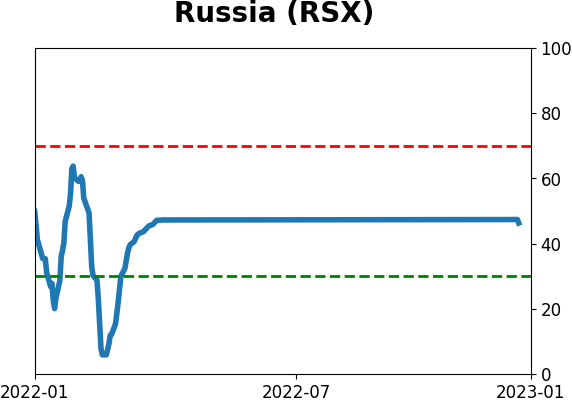
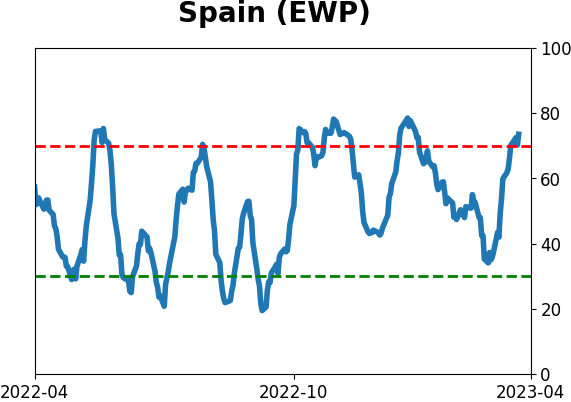
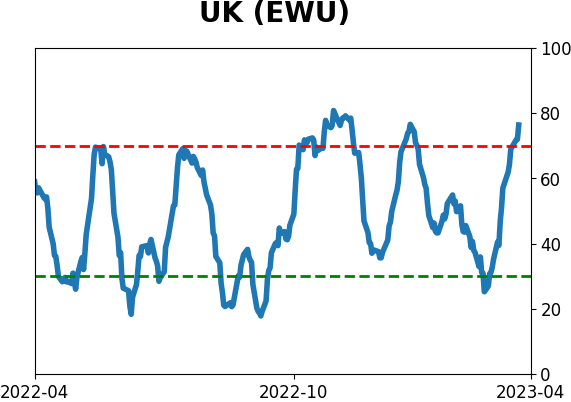
Country ETF's - 10-Day Moving Average
|
|
|
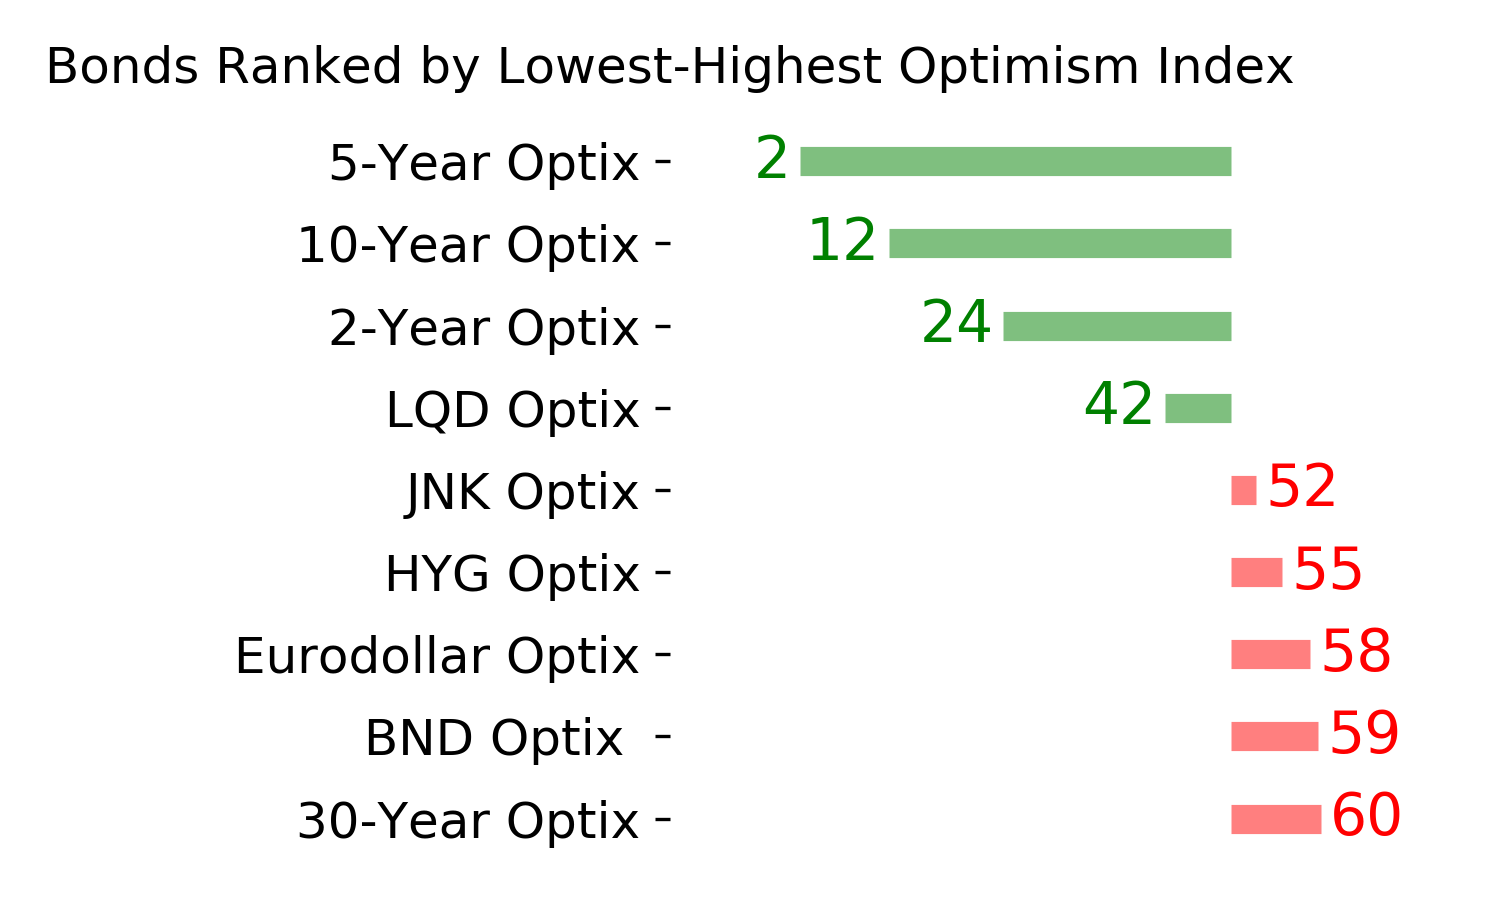
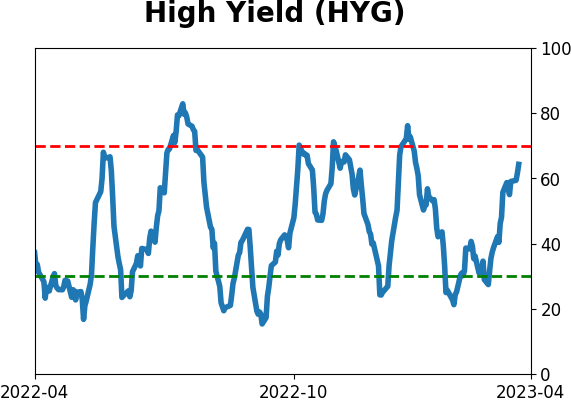
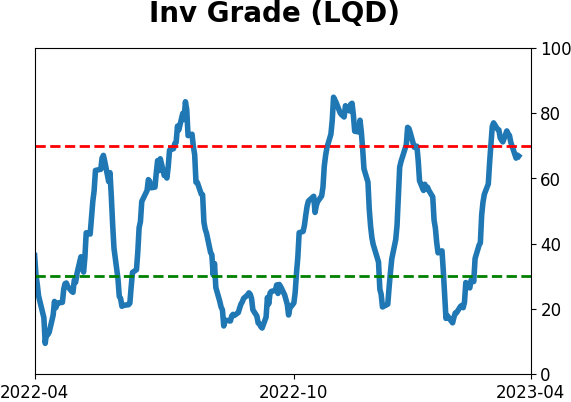
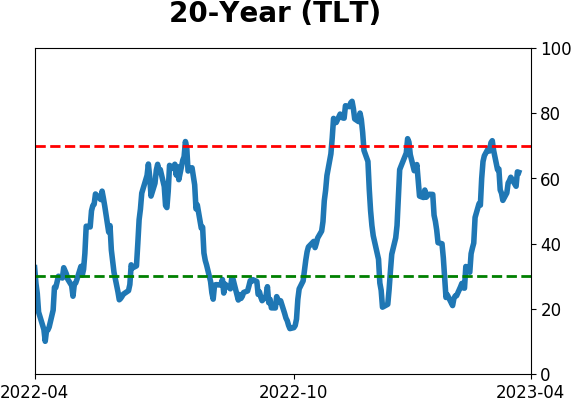
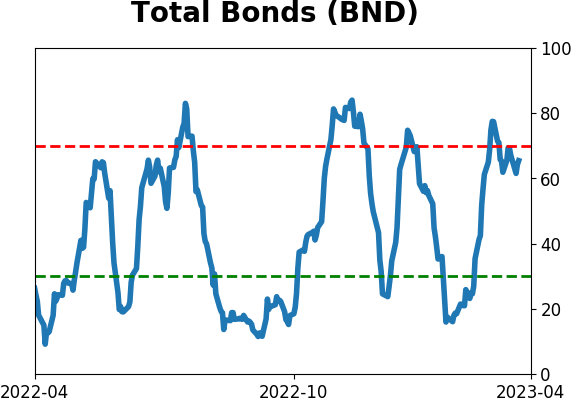
Bond ETF's - 10-Day Moving Average
|
|
|
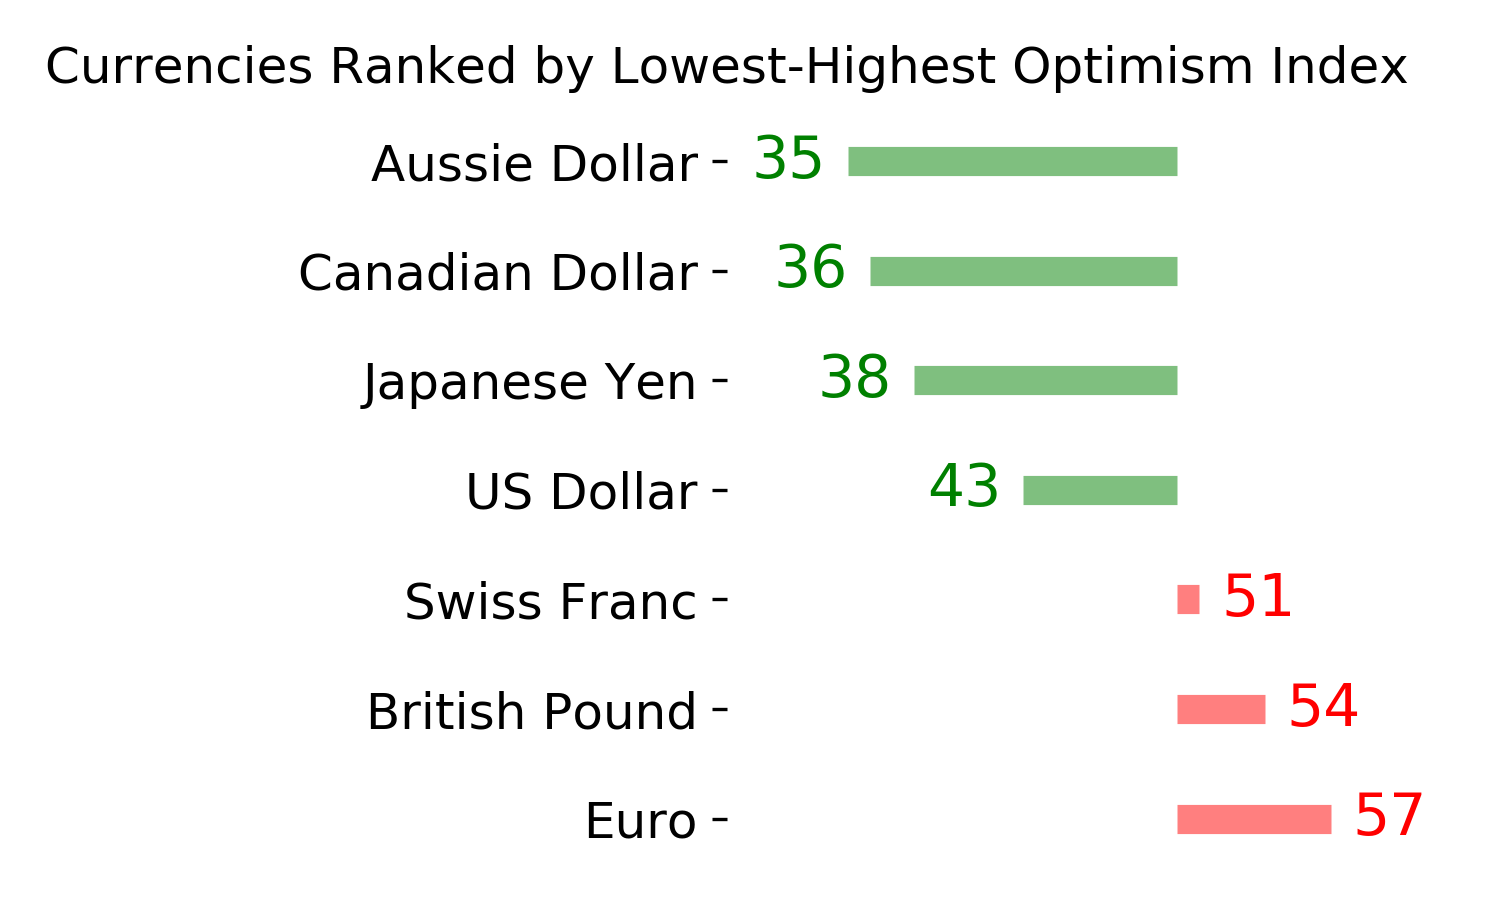
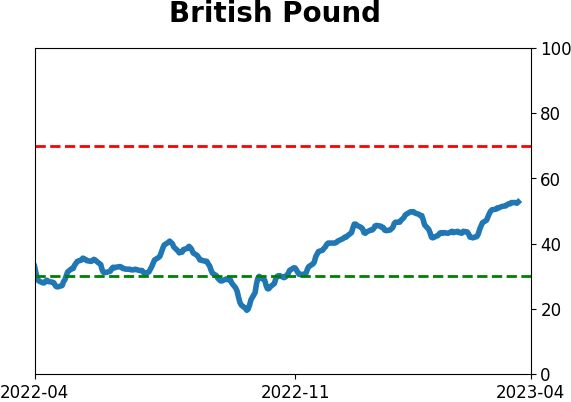
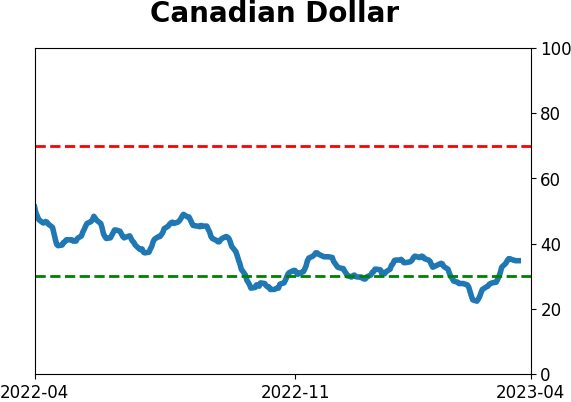
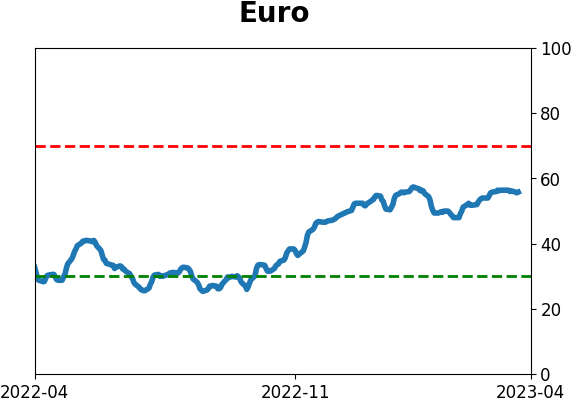
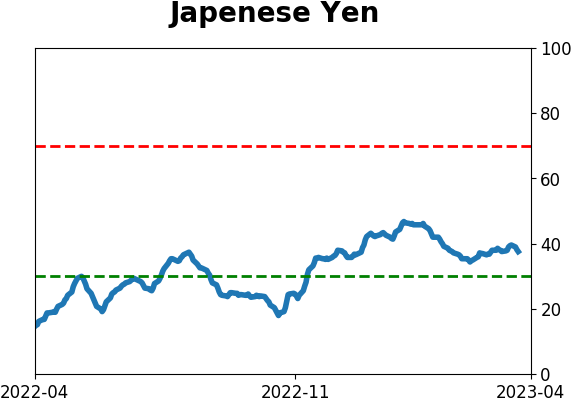
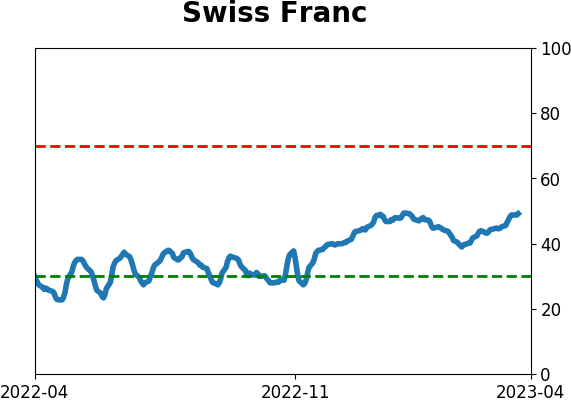
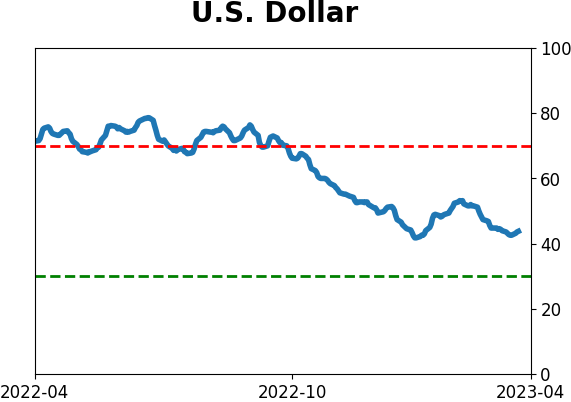
Currency ETF's - 5-Day Moving Average
|
|
|
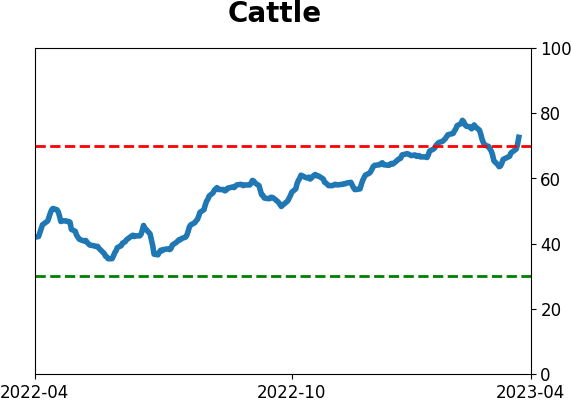
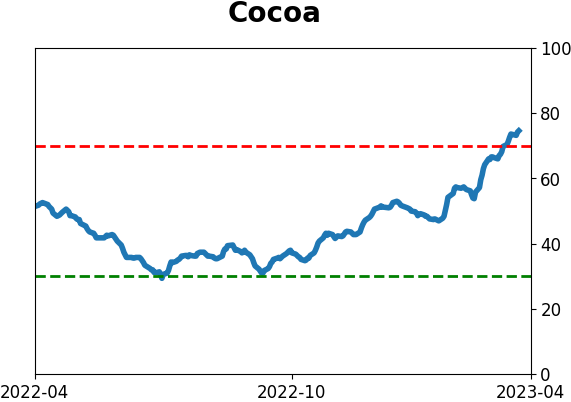
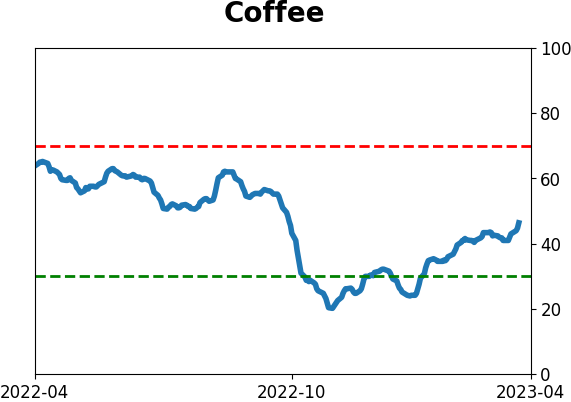
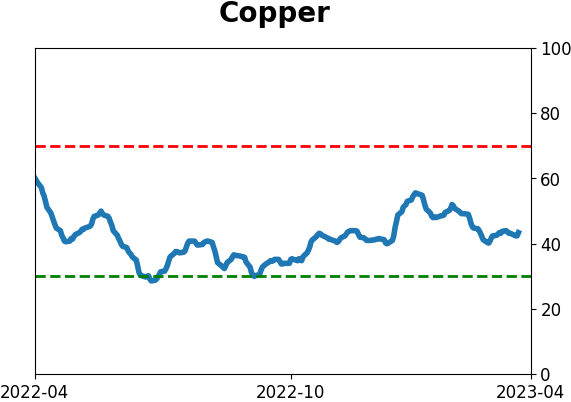
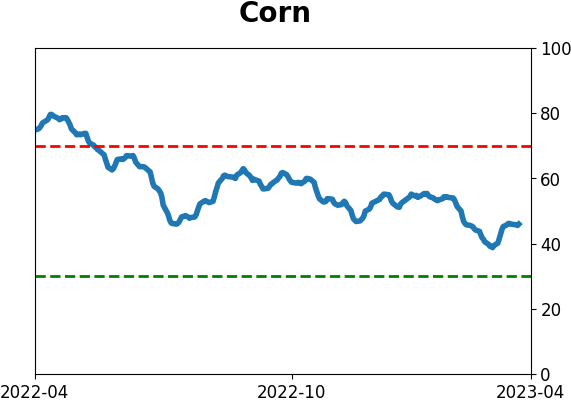
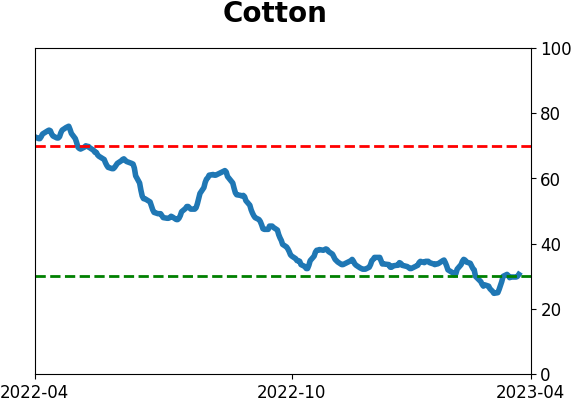
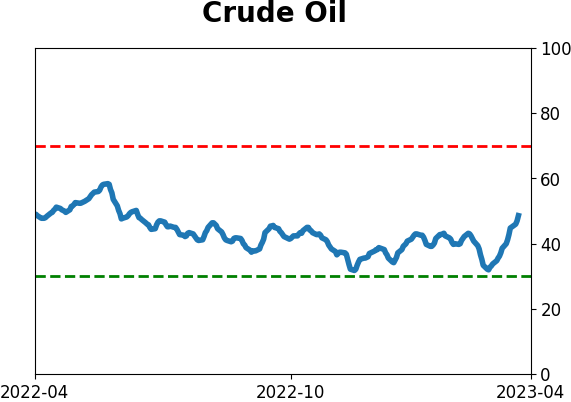
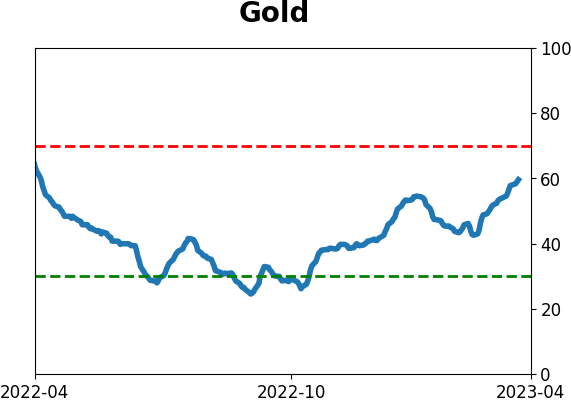
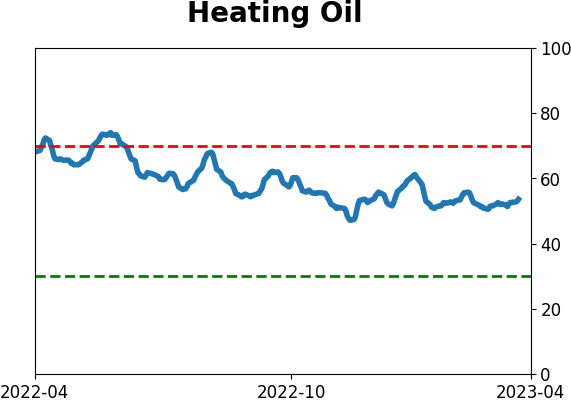
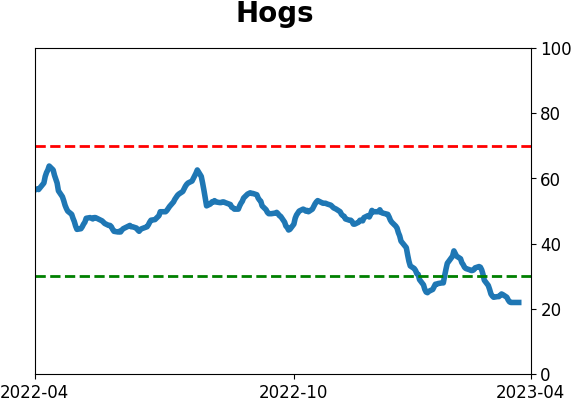
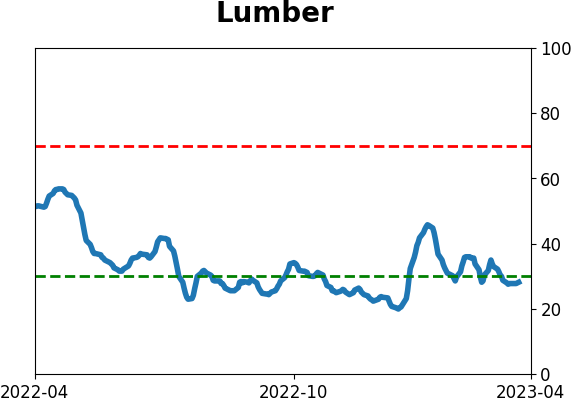
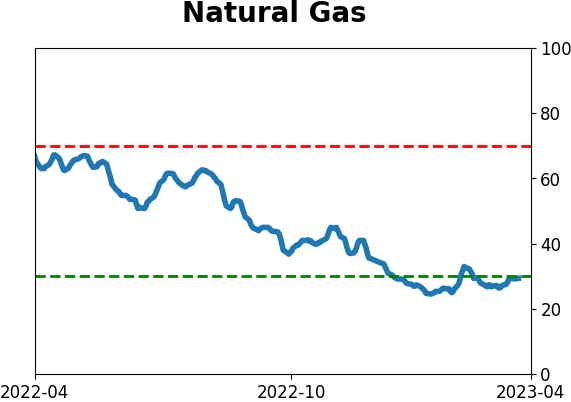
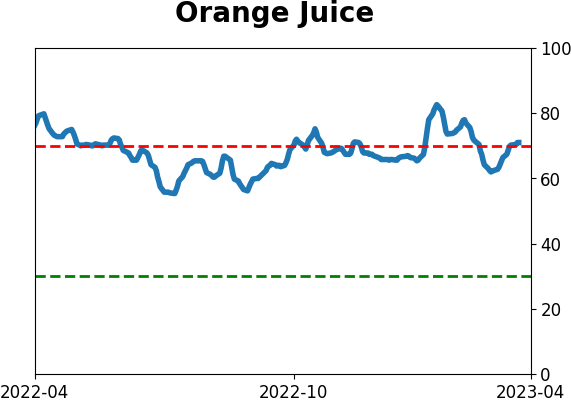
Commodity ETF's - 5-Day Moving Average
|
|