Headlines
|
| Interest rate cycles I have known and loved - Part III: In Part III of this series, we use the JK Bond Cycle Thermometer to create a long-term investment model for treasury bonds. |
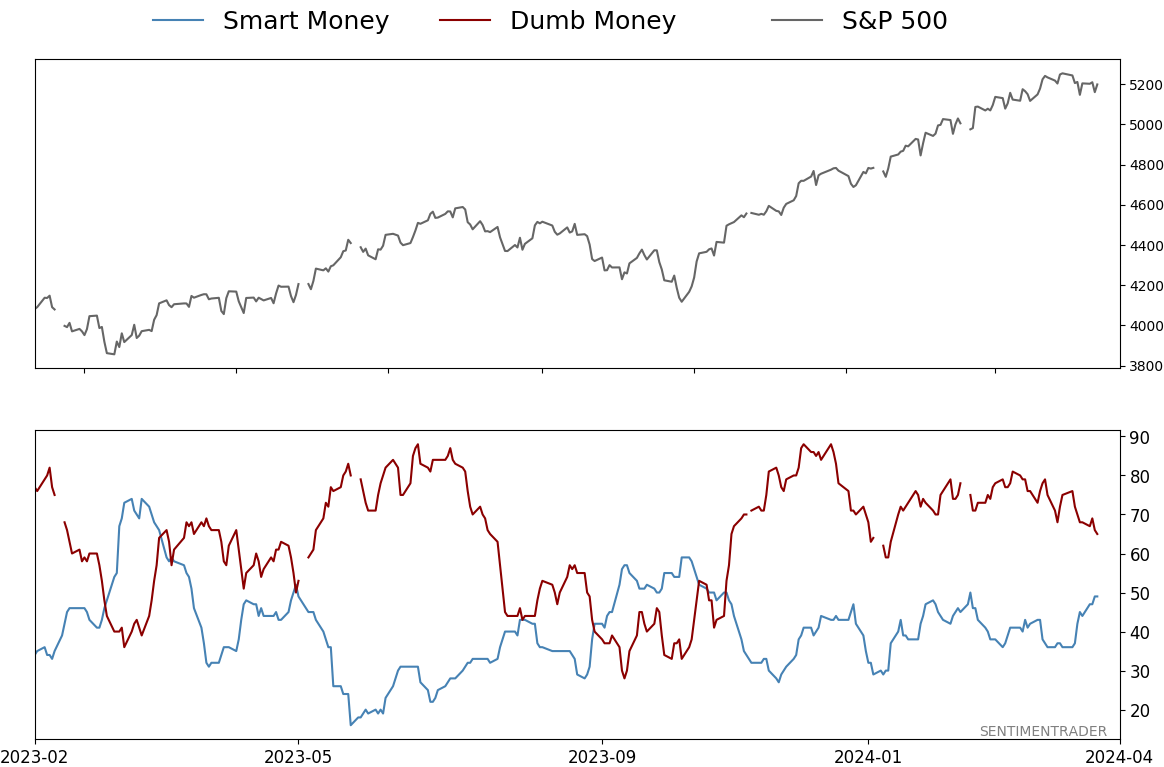
Smart / Dumb Money Confidence
Smart Money Confidence: 49% Dumb Money Confidence: 65% |
|
Risk Levels
Stocks Short-Term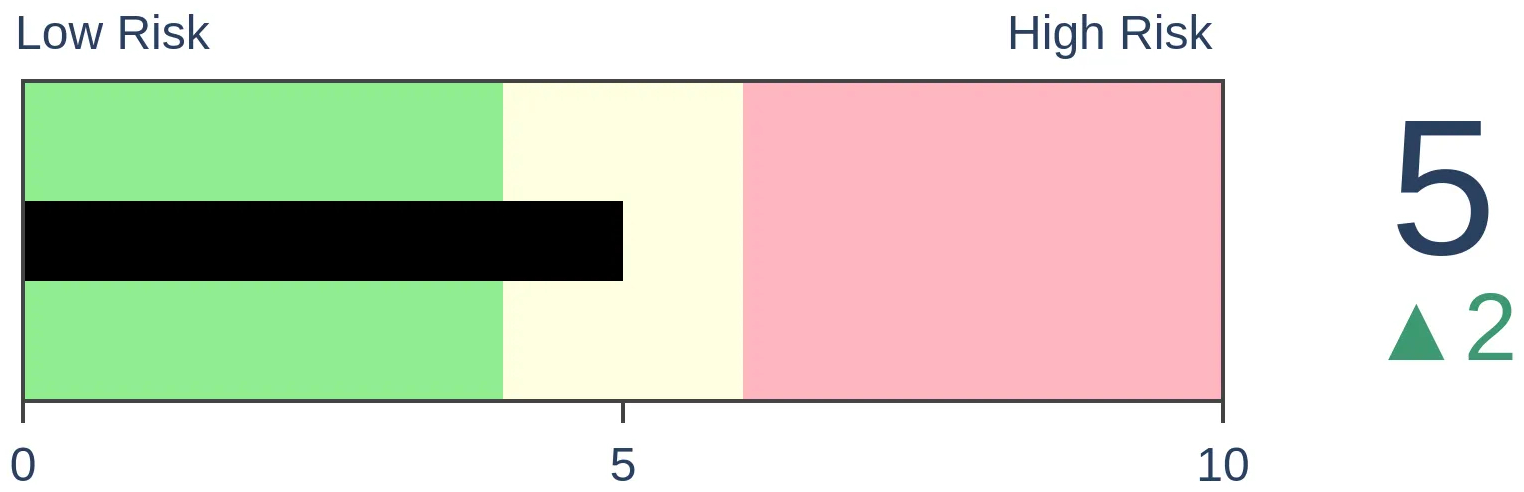 |
Stocks Medium-Term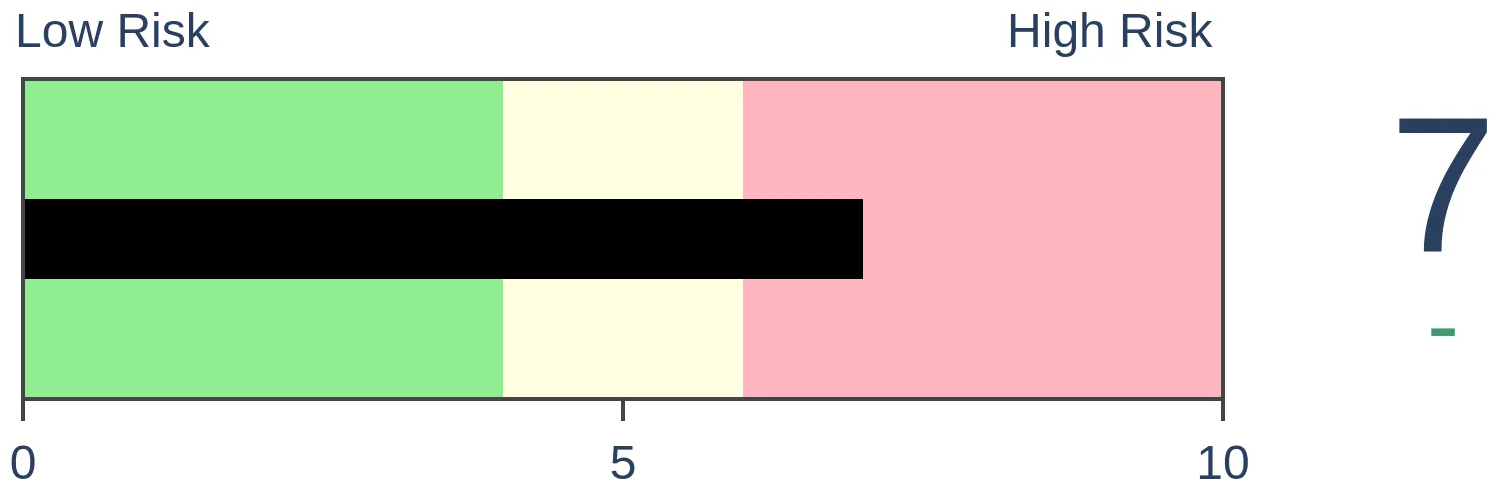 |
|
Bonds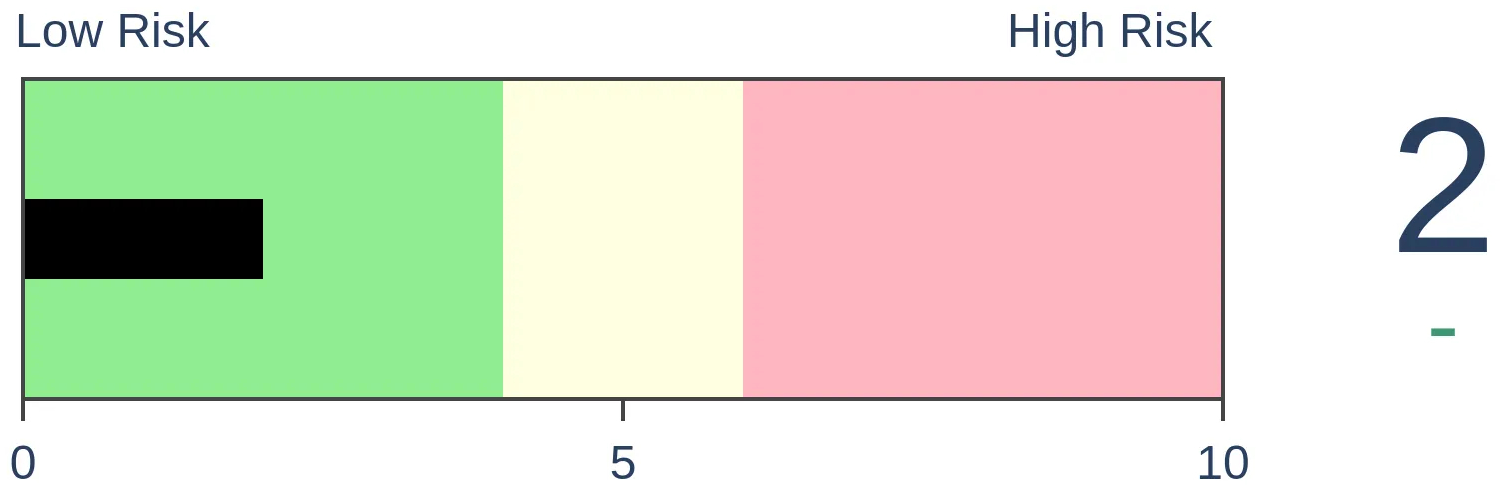 |
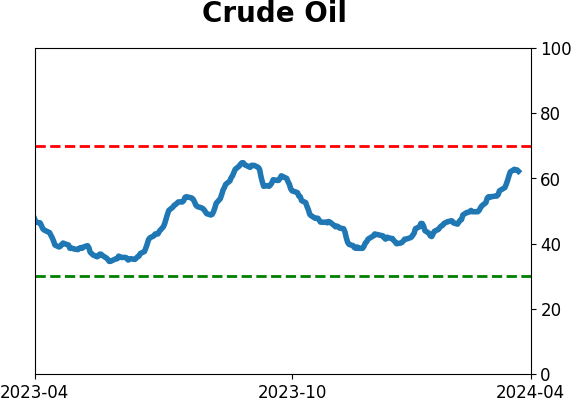
Crude Oil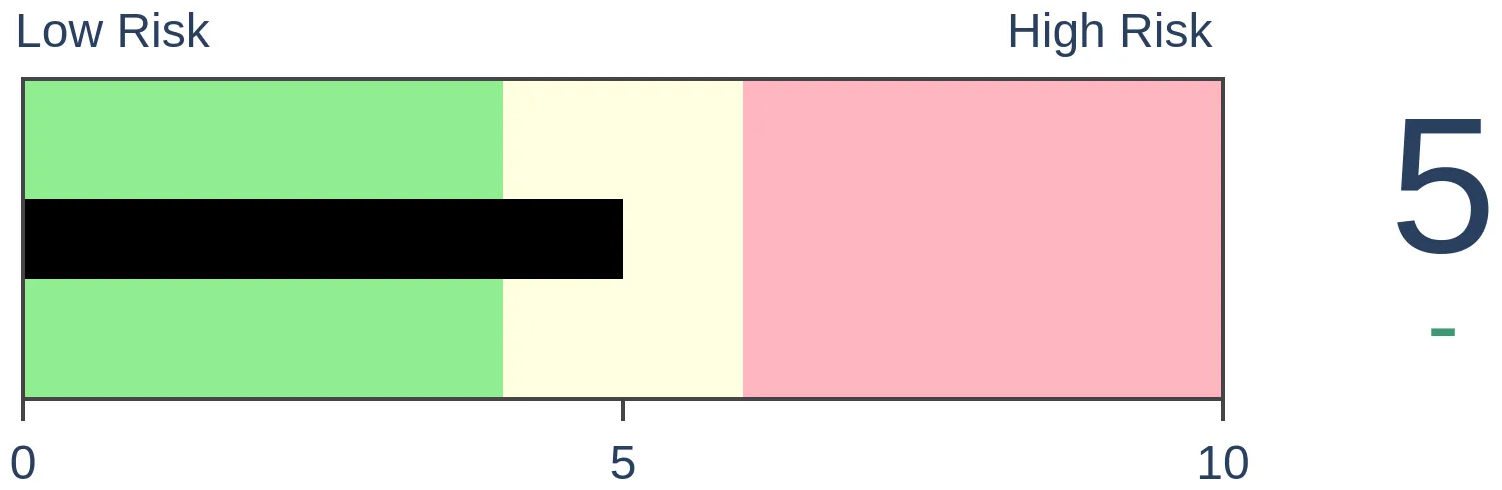 |
|
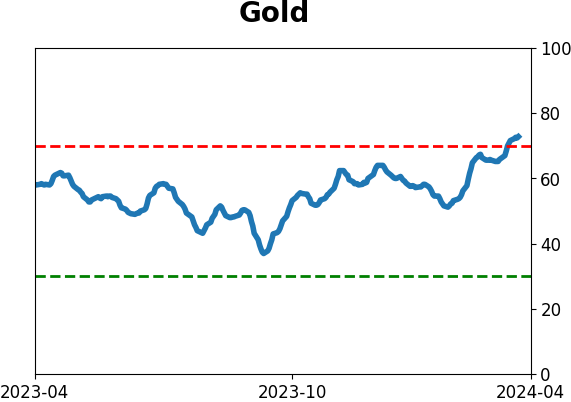
Gold |
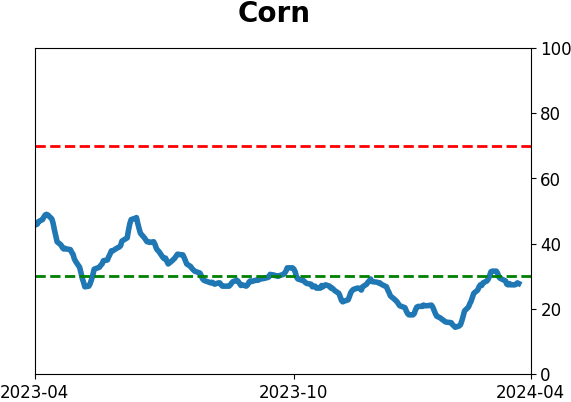
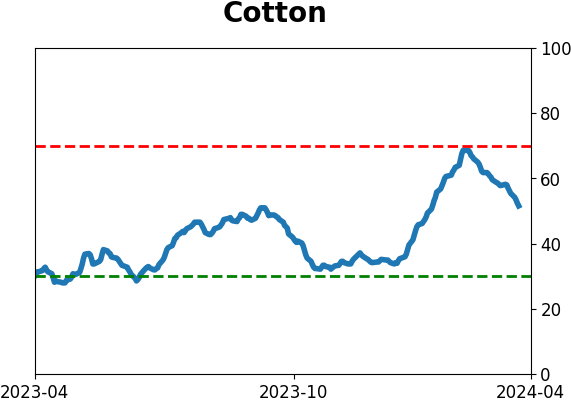
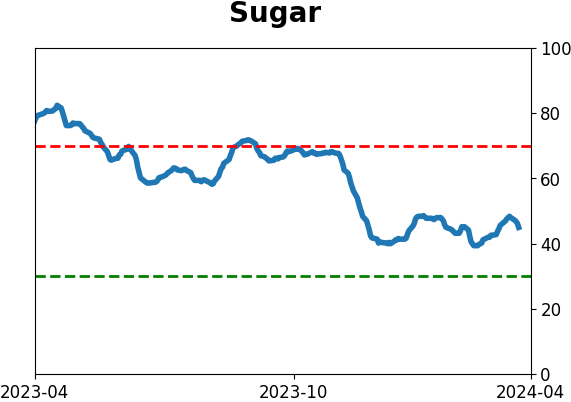
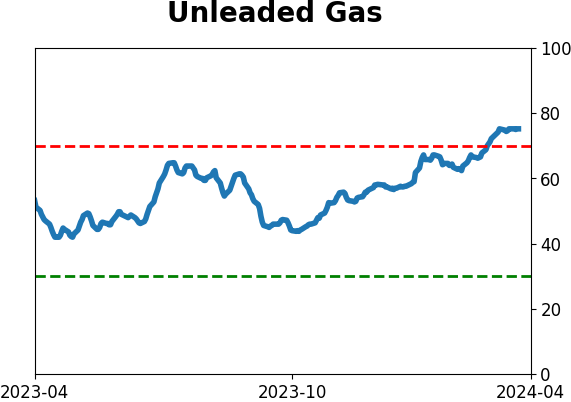
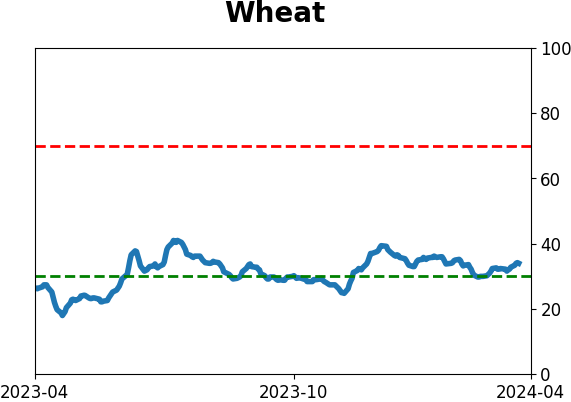
Agriculture |
|
Research
By Jay KaeppelBOTTOM LINE
In Part III of this series, we use the JK Bond Cycle Thermometer to create a long-term investment model for treasury bonds.
FORECAST / TIMEFRAME
None |
Key points
- Part I highlighted the long-term cyclical nature of interest rate movements
- Part II highlighted The JK Bond Cycle Thermometer, which combines various bond cycles with a trend-following component to objectively designate the trend in rates to be bullish or bearish for bonds
- In Part III, we introduce the JK Bond Cycle Model, which compares changes in interest rates since 1900 to changes in 30-year treasury bond futures prices since 1977.
A Review of Part I and Part II
In Part I, we highlighted three cyclical factors and one trend-following factor that seem to play a role in the bond market.
In Part II, we introduced the JK Bond Cycle Thermometer, which combines these factors to generate a monthly reading of 0 to +4. We also highlighted the cumulative performance of 10-year treasury yields (which move inversely to bond prices) based on various Thermometer readings.
In Part III, we will create a simple long-term bond trading model and highlight performance versus 10-year treasury yields since 1900 and versus 30-year treasury bond futures since 1977.
Turning the JK Bond Cycle Thermometer into the JK Bond Cycle Model
In Part II, we found that 10-year treasury yields (i.e., interest rates) tended to decline when the Thermometer read +4 or +3 and to rise when it read 0 or +1. Unfortunately, readings of +2 were an extremely mixed bag- neither definitively bullish nor bearish for bonds.
One of the model's goals is to avoid excessive trading whenever possible (as most investors tend to hold bond positions for long periods rather than trading in and out). So, the JK Bond Cycle Model uses the following rules:
- Buy bonds when the JK Bond Cycle Thermometer rises to +3 or higher (the JK Bond Cycle Model turns bullish and is set equal to 1)
- Sell bonds when the JK Bond Cycle Thermometer falls to +1 or lower (the JK Bond Cycle Model turns bearish and is set equal to 0)
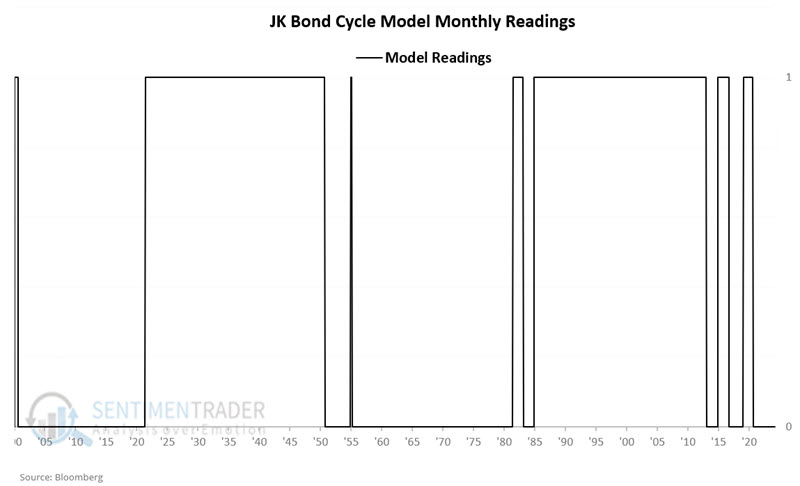
The chart below displays the status of the JK Bond Cycle Model since 1900. A model reading of 1 is bullish for bonds, and a reading of 0 is bearish for bonds.
A review of yield changes based on the JK Bond Cycle Model
As in Part I and Part II, we first will track cumulative results by tracking changes in the yield on 10-year treasury notes using month-end data starting in 1900. Remember, declining yields are bullish for bond investors, and rising yields are bearish. Then, we will look at actual changes in bond prices using t-bond futures price data starting in 1977.
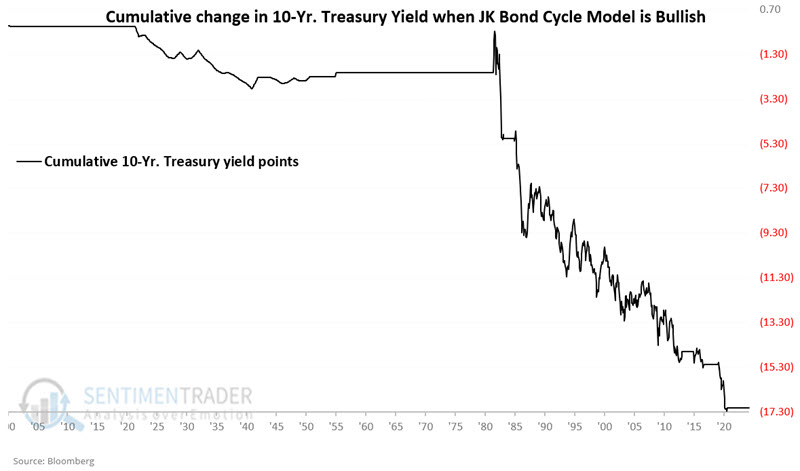
The chart below displays the cumulative change for 10-year treasury yields when the JK Bond Cycle Model is bullish (i.e., it hit +3 or +4 and has yet to drop back to +1 or lower).
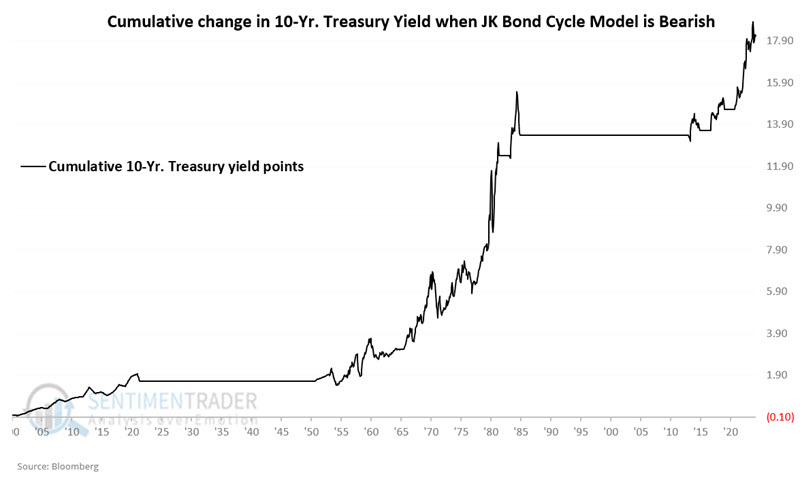
The chart below displays the cumulative change for 10-year treasury yields when the JK Bond Cycle Model is on a bearish signal (i.e., it hit +1 or 0 and has yet to rise back to +3 or higher).
Moving on to 30-year bond futures
Up until now, everything has been measured in changes in yield points. Part of this is because actual bond price data is historically spotty and difficult to obtain. 30-year treasury bond futures started trading in 1977. So, we will next look at hypothetical returns from holding a long position in t-bond futures if the JK Bond Cycle Model is bullish or bearish. This is a useful test since 30-year treasury bonds are backed by the full faith and credit of the U.S. government and are thus considered to have no credit risk. As a result, they are essentially a pure play on interest rate changes. T-bond futures started trading in 1977, and each one-point movement in the contract's price is worth $1,000 in contract value.
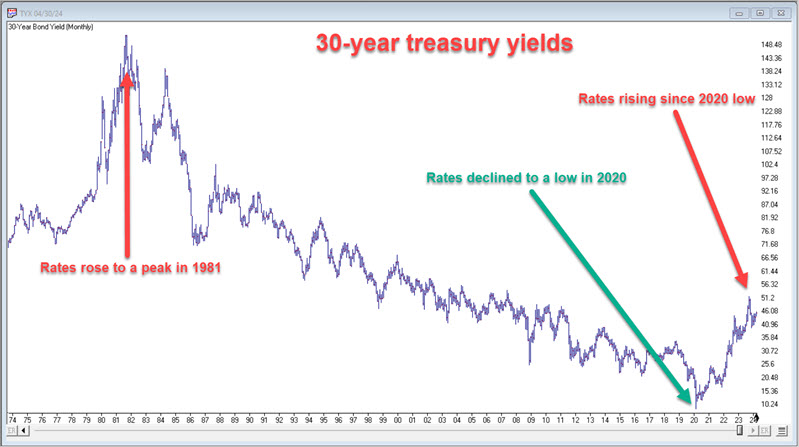
The charts below clearly illustrate the inverse relationship between interest rates and bond prices. The first chart below (courtesy of AIQ TradingExpert) displays the changes in 30-year T-bond yields since the mid-1970s. The yield peaked in 1981, then declined for roughly 39 years to a low in 2020. Rates have been on a rising trend ever since.
The second chart below displays t-bond futures contract price movements since 1977. Note that bond prices declined sharply as interest rates soared into the early 1980s. From there, bond prices worked their way higher as rates fell from a peak above 15% in 1981 to a low under 1% in 2020. Since the low in interest rates in early 2020 - and the subsequent rise from below 1% to back above 4% - long-term treasury bond prices have fallen hard.
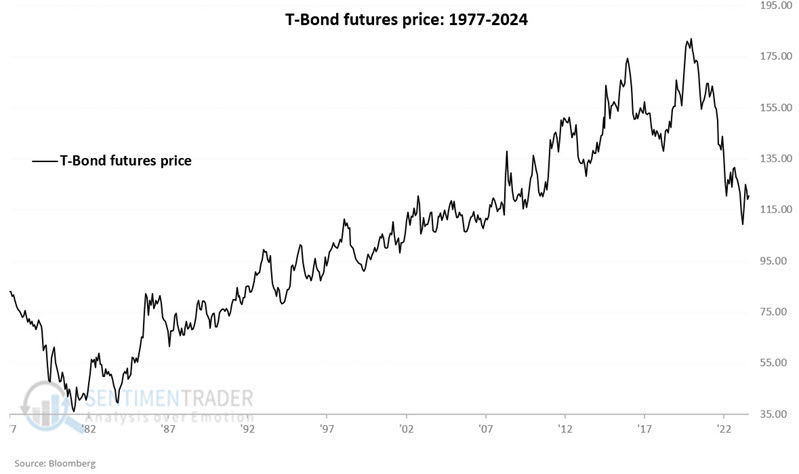
NOTE: In November 1999, the contract price was lowered by 20.00 points to reflect a change from an 8% yield contract to a 6% yielding contract. Since we are using raw point changes (and not percentage changes), we subtract 20 points from the month-end price for t-bond futures before that time to account for the change).
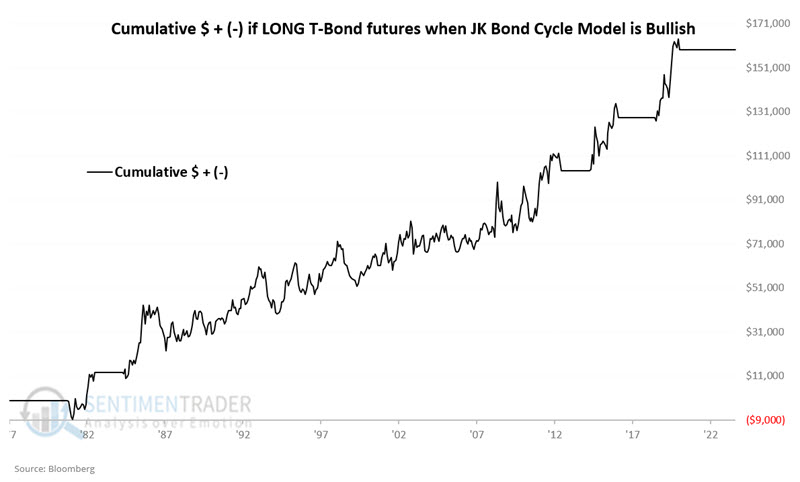
The chart below displays the hypothetical cumulative $ +(-) for holding a long position in t-bond futures only when the JK Bond Cycle Model is bullish (i.e., it hit +3 or +4 and has yet to drop back to +1 or lower).
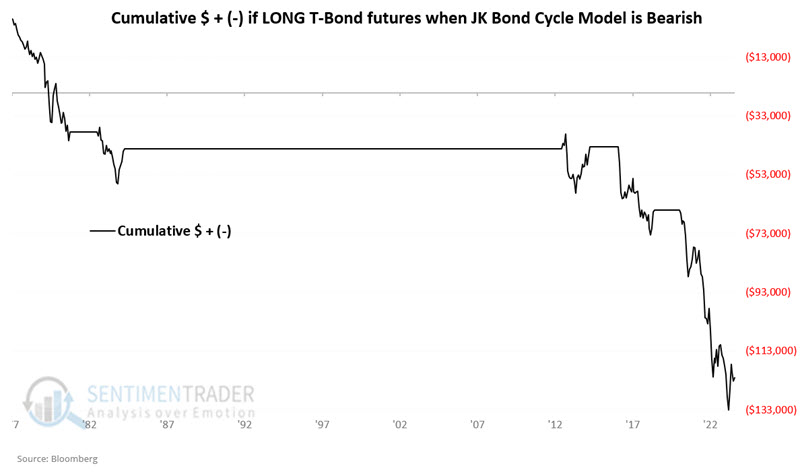
The chart below displays the hypothetical cumulative $ +(-) for holding a long position in t-bond futures only when the JK Bond Cycle Model is bearish (i.e., it hit +1 or 0 and has yet to rise back to +3 or higher).
What the research tells us…
The JK Bond Cycle Thermometer and Model rely heavily on cycles to inform when to be bullish or bearish on bonds. As pointed out in the earlier pieces, there is no guarantee that any cycle or seasonal pattern will hold up as it has in the past. As a result, it requires a "leap of faith" to rely upon them as part of an investing strategy. So, each investor must decide how much weight - if any - to put on this strategy.
Still, given the historically cyclical nature of interest rates displayed in the chart below and the results highlighted in Parts I, II, and III, there is definite food for thought.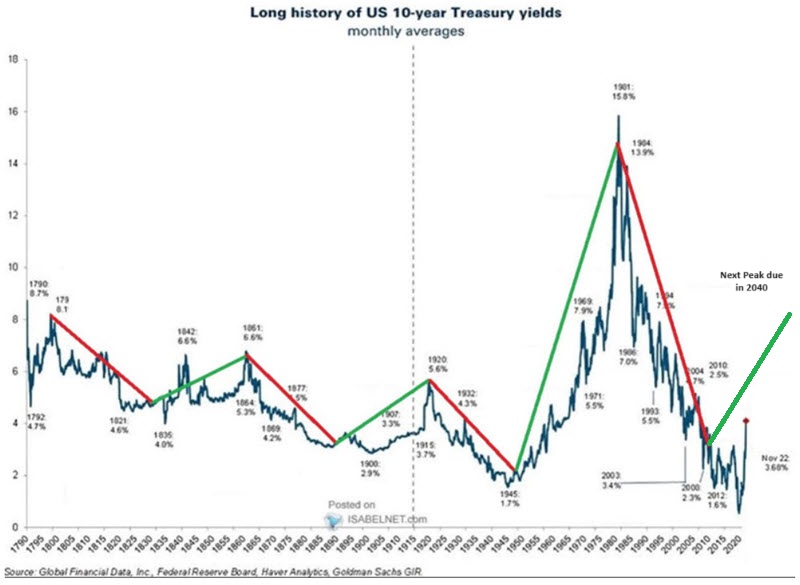
Indicators at Extremes
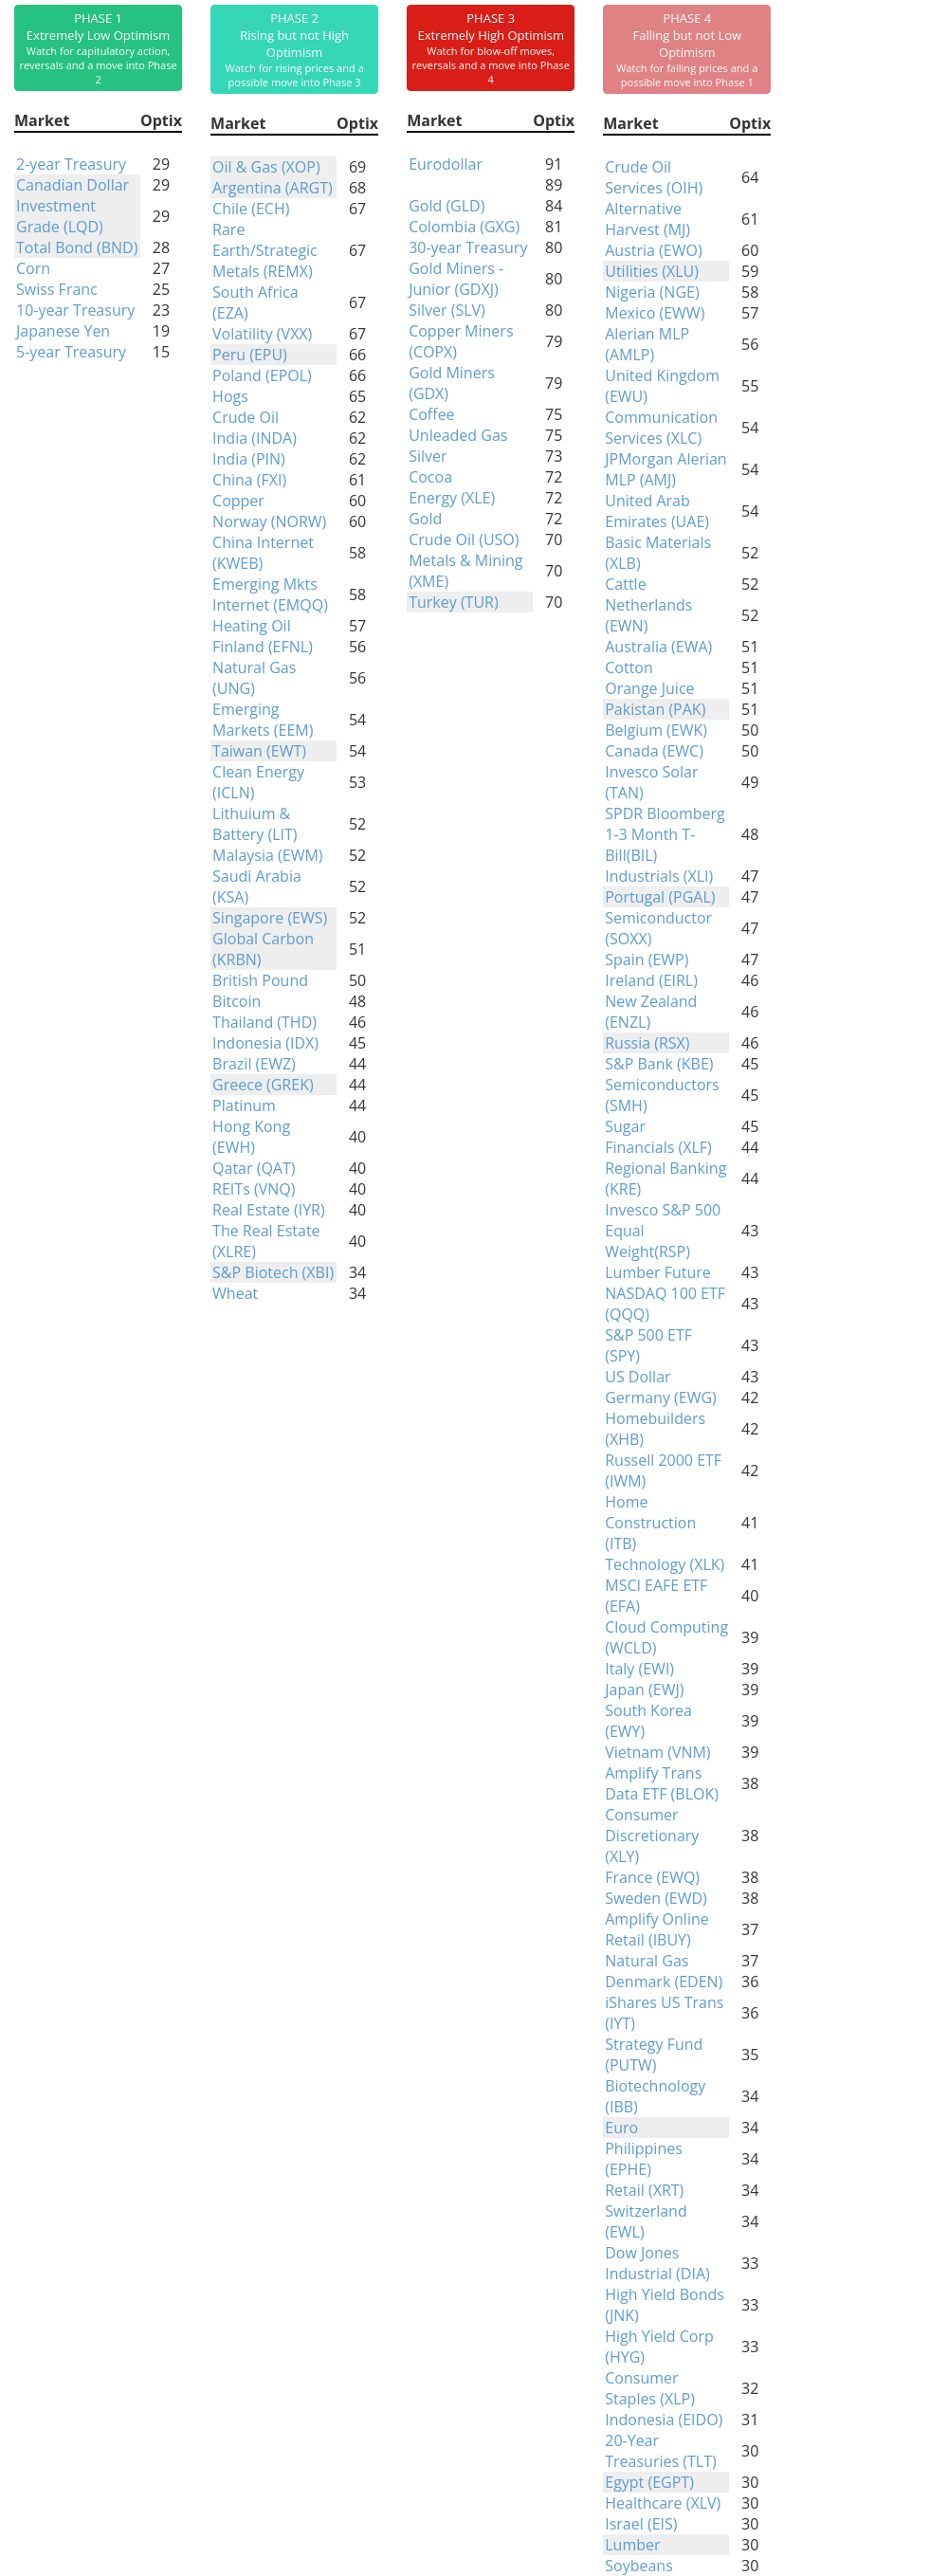
Phase Table
Ranks
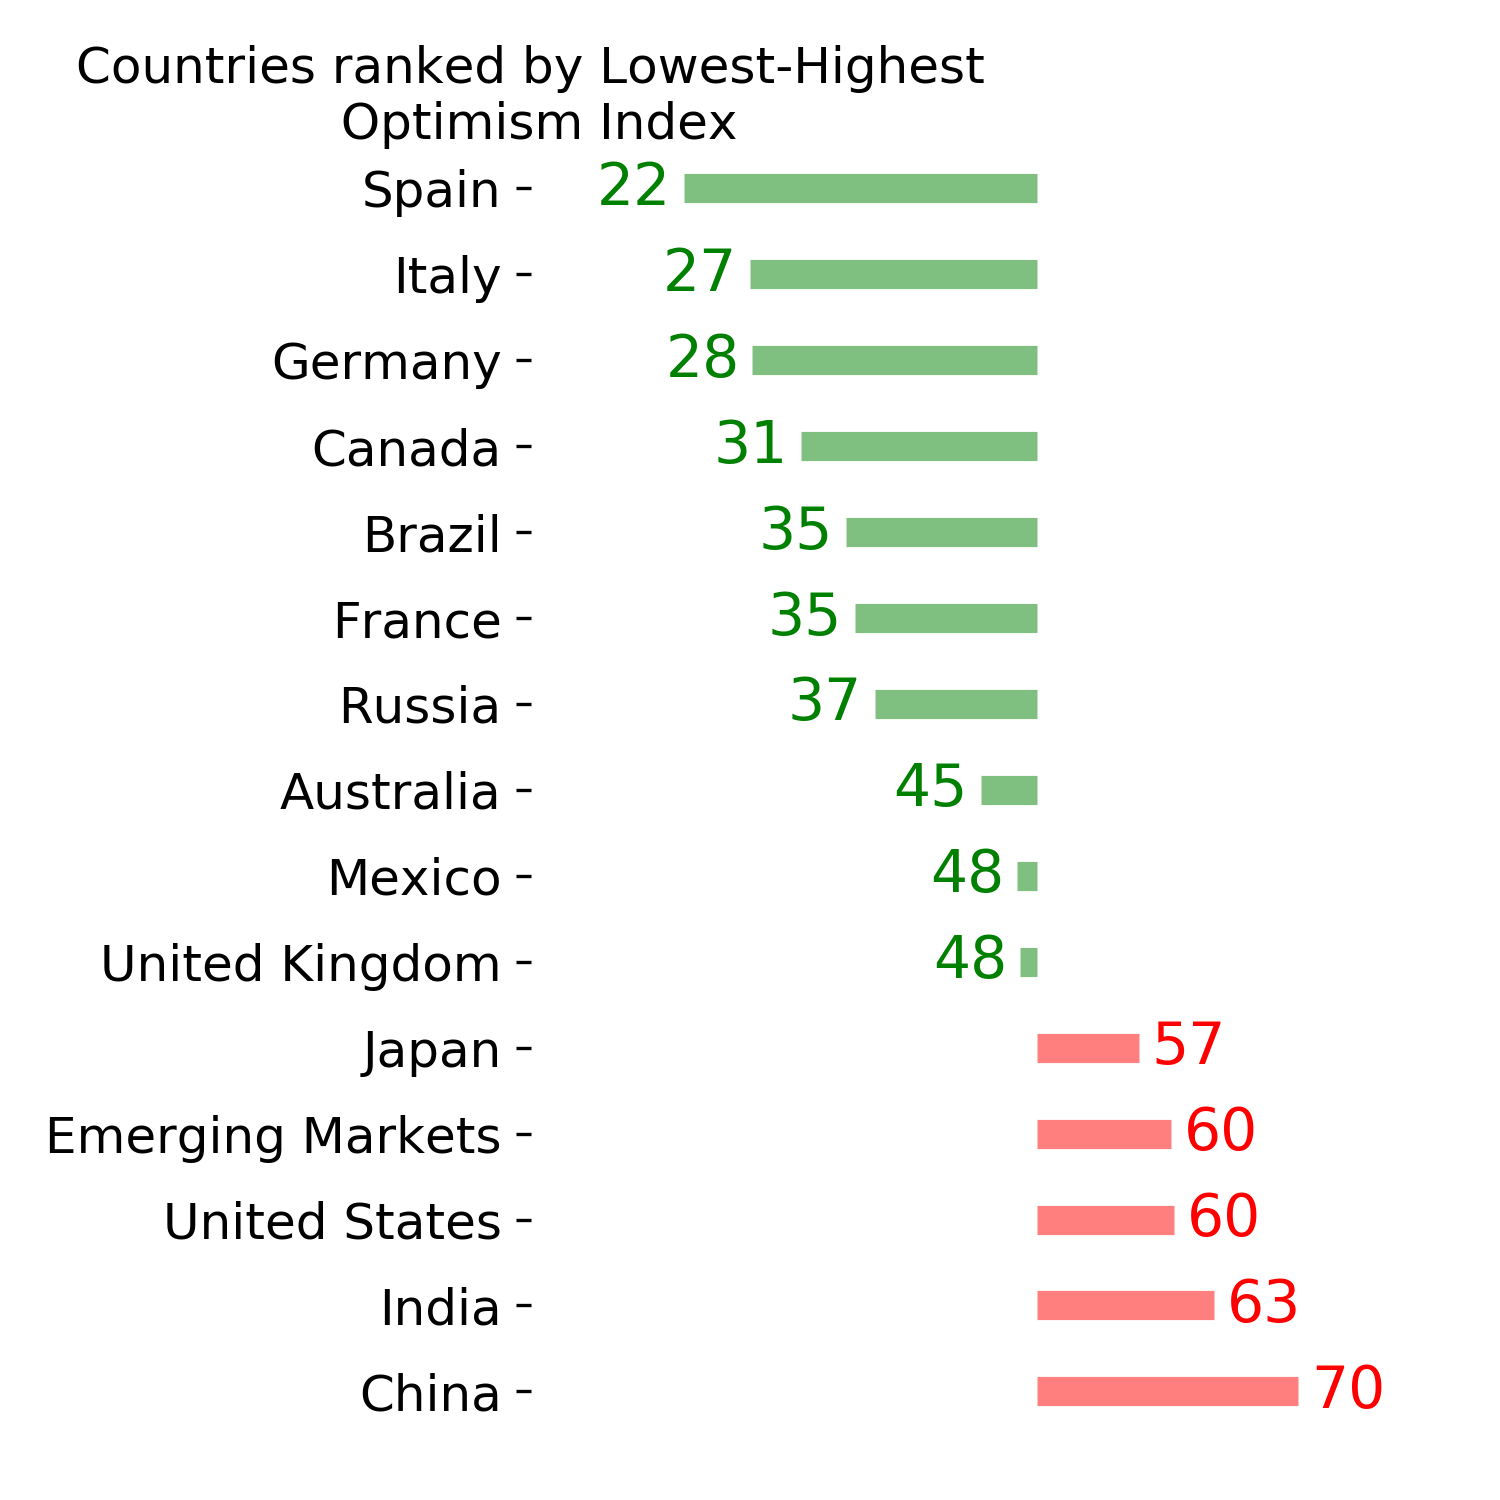
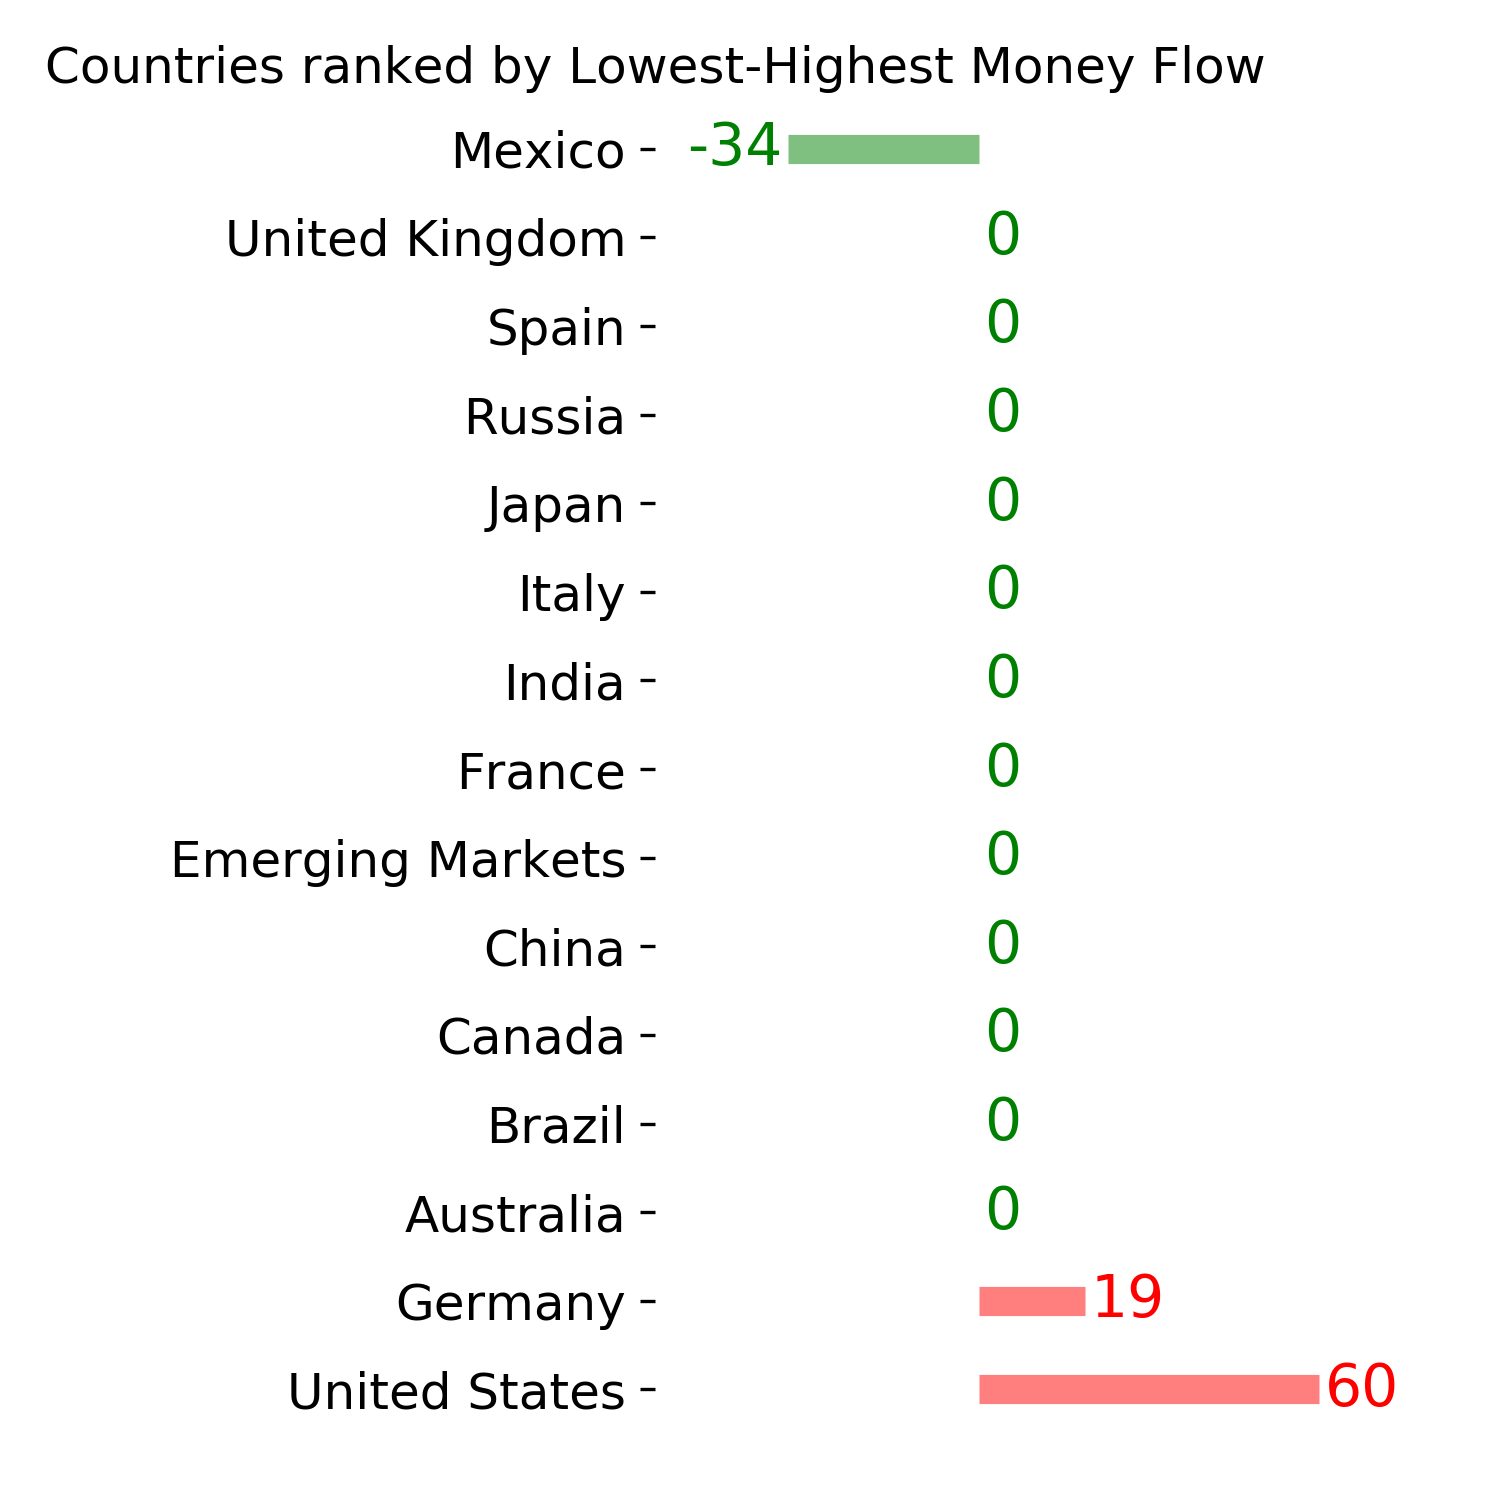
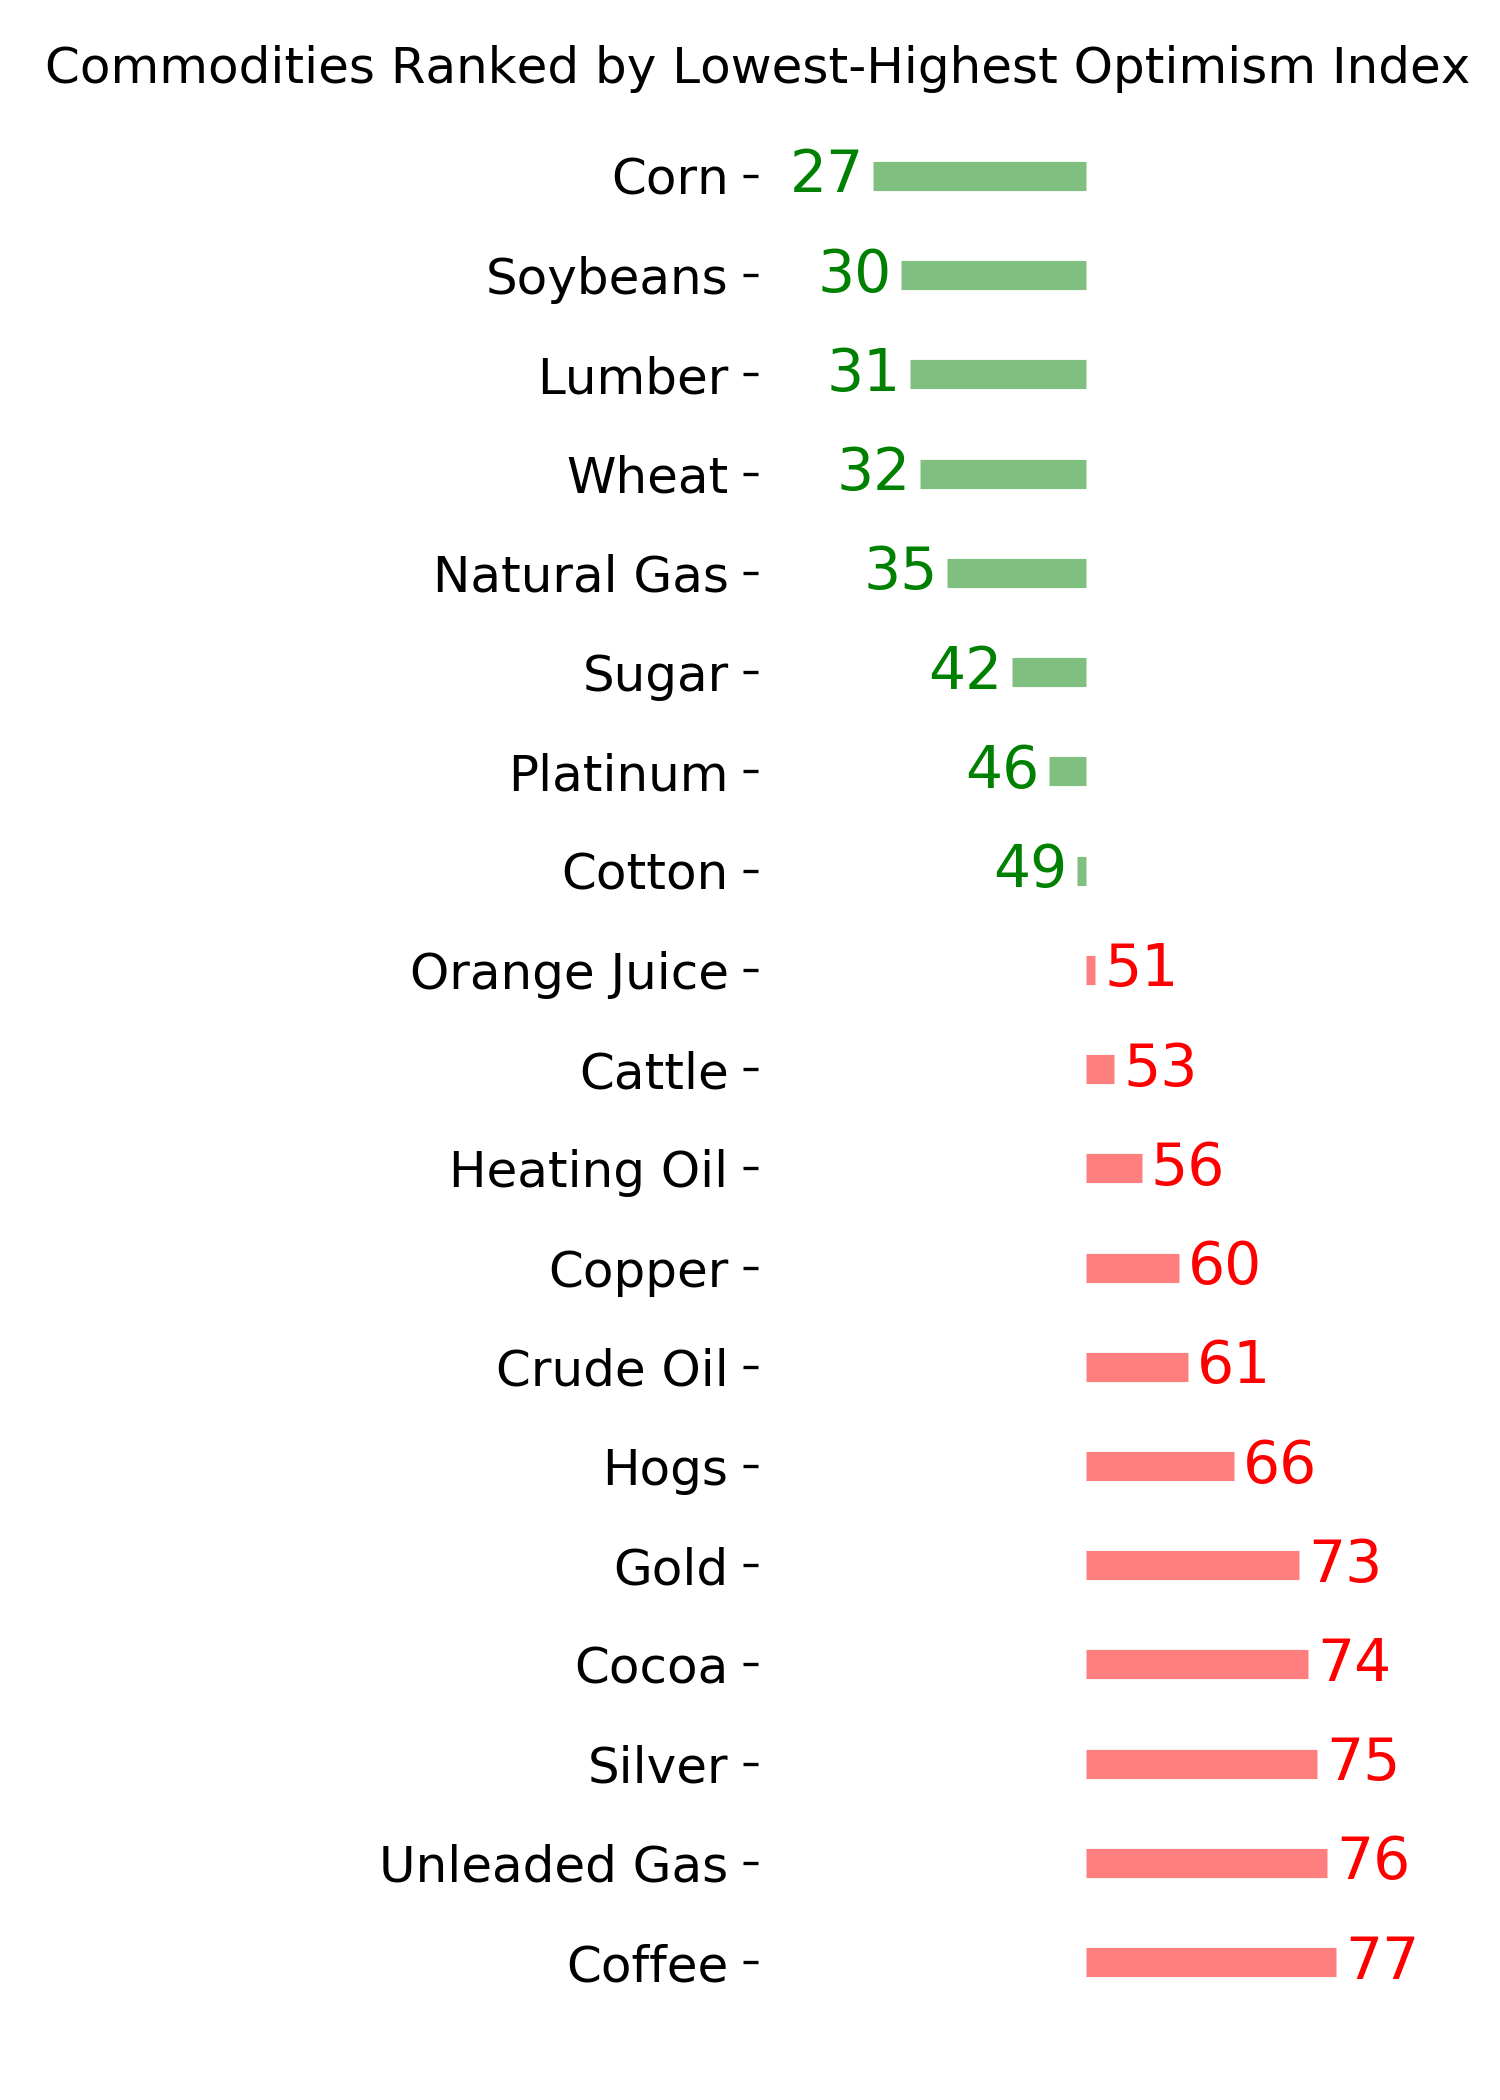
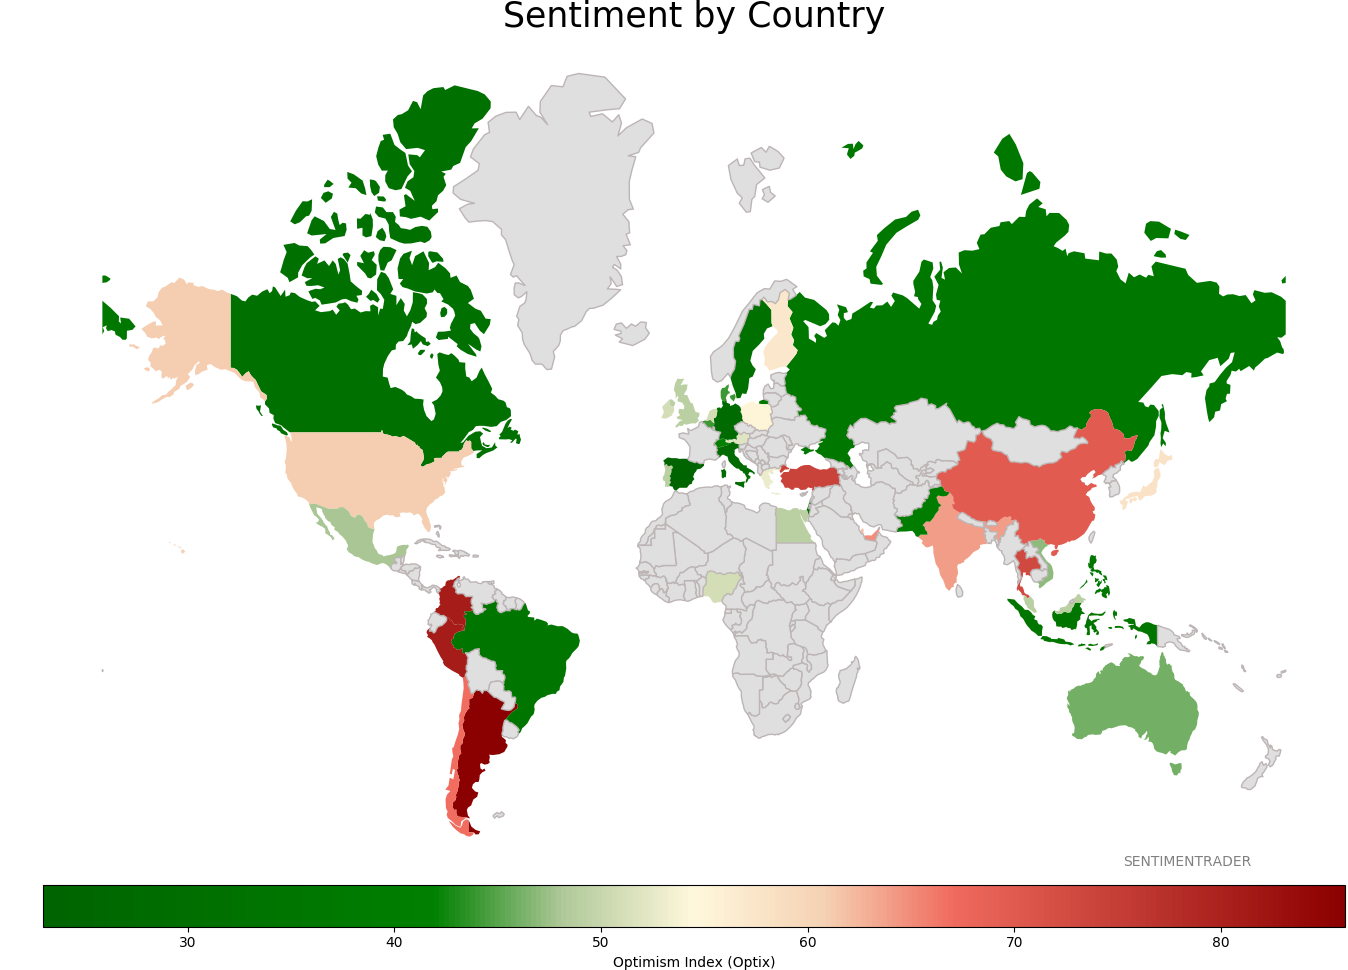
Sentiment Around The World
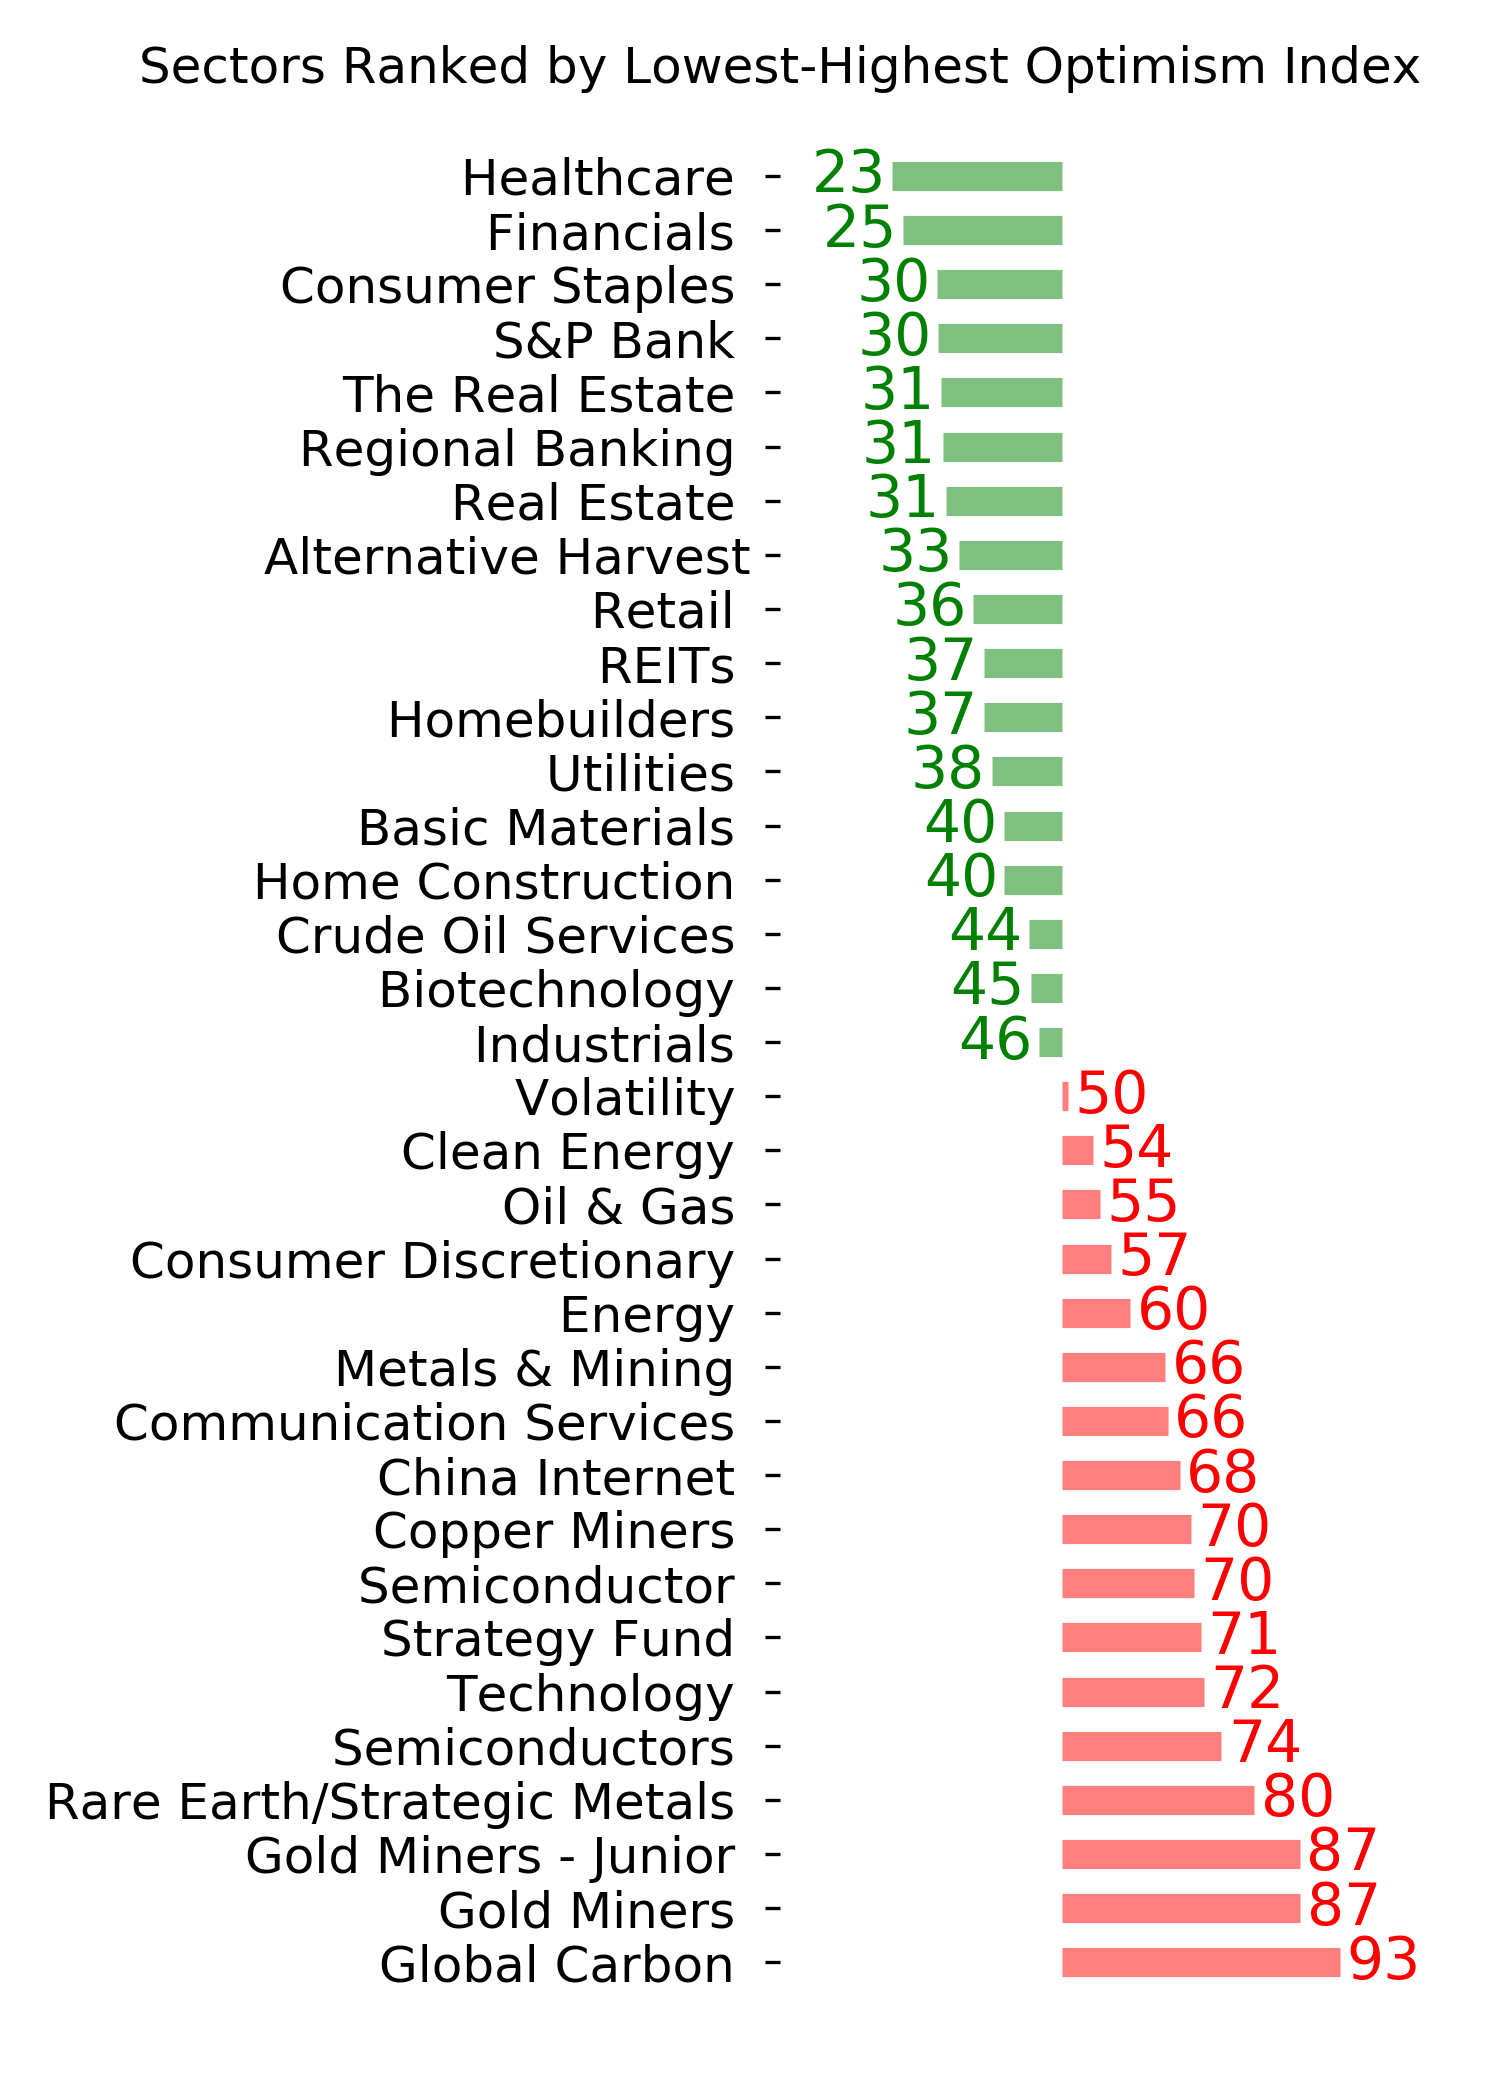
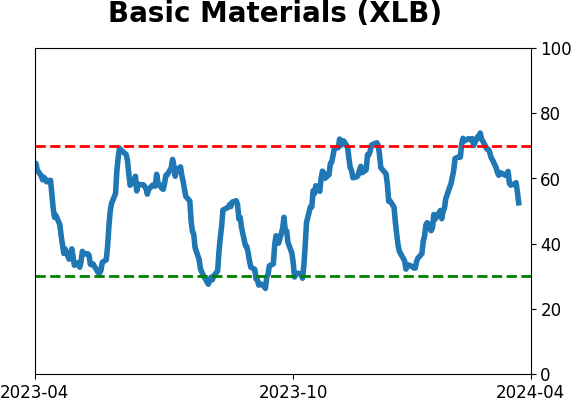
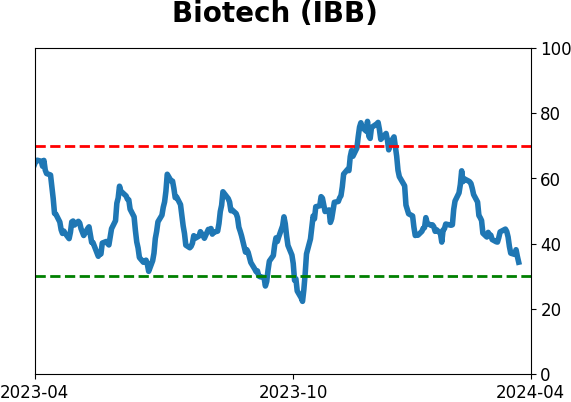
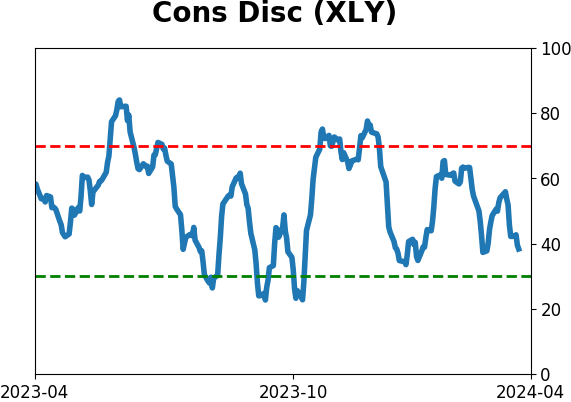
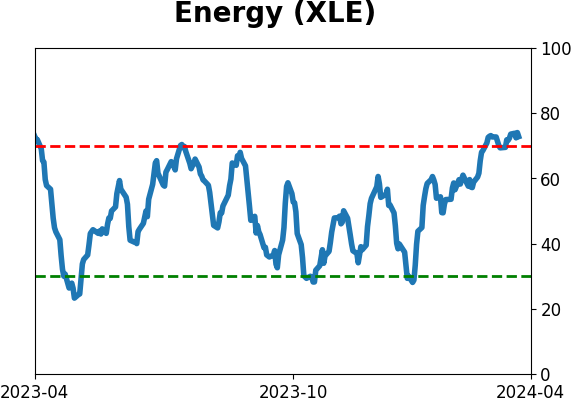
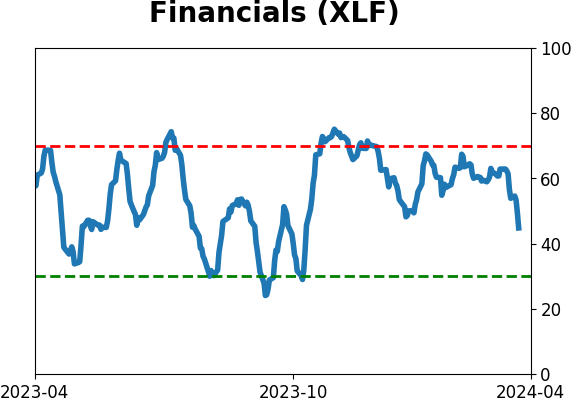
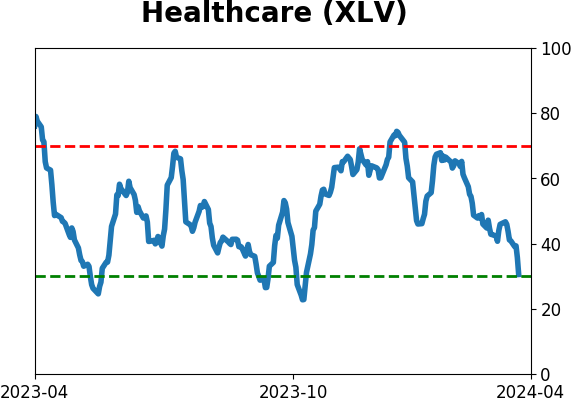
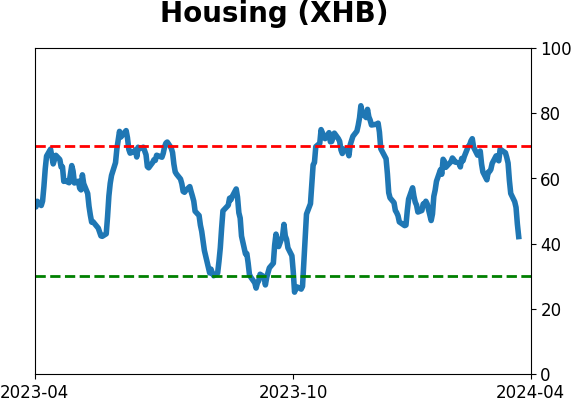
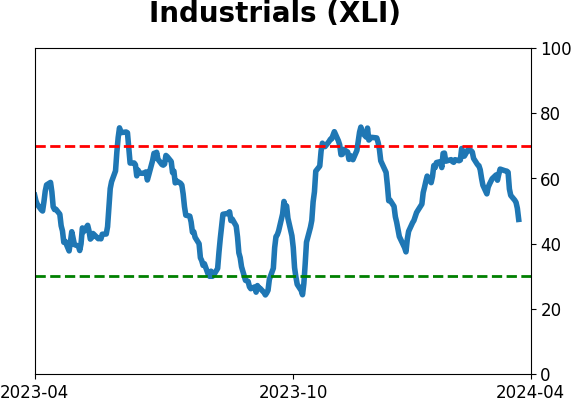
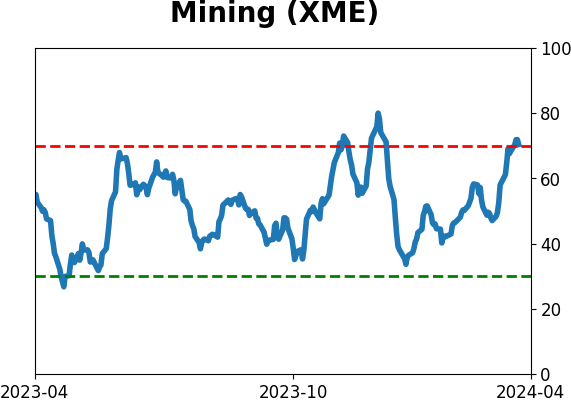
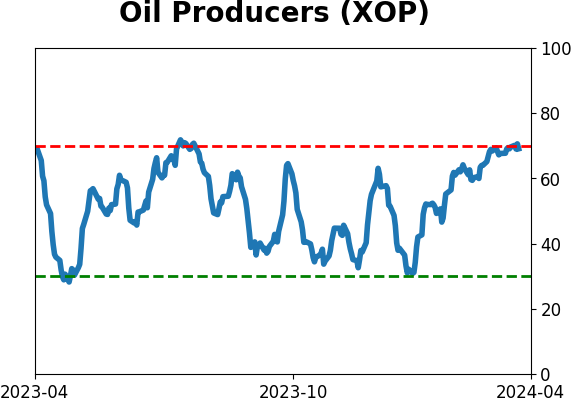
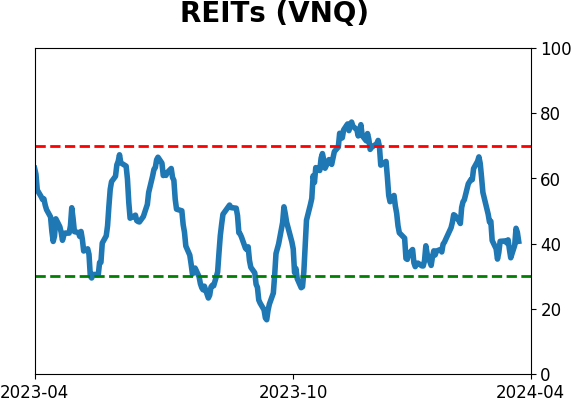
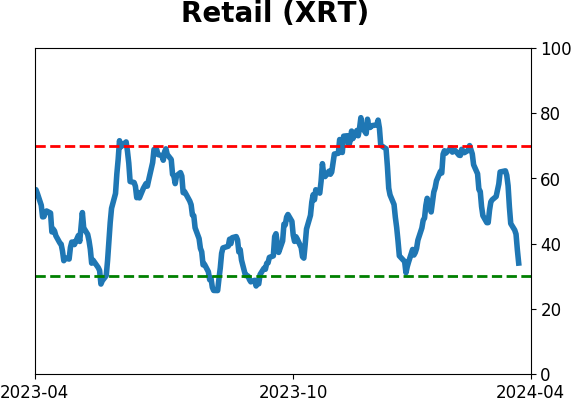
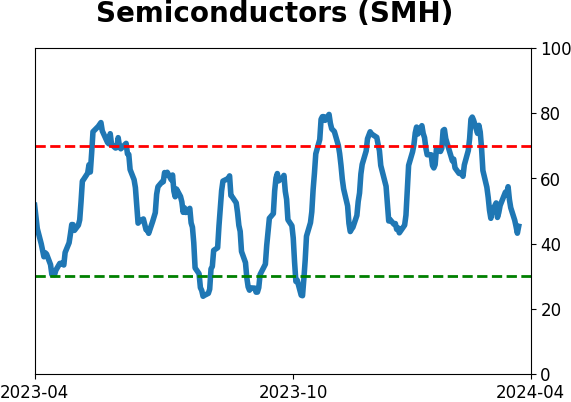
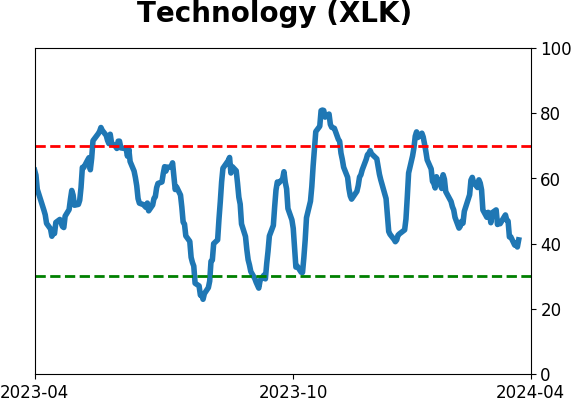
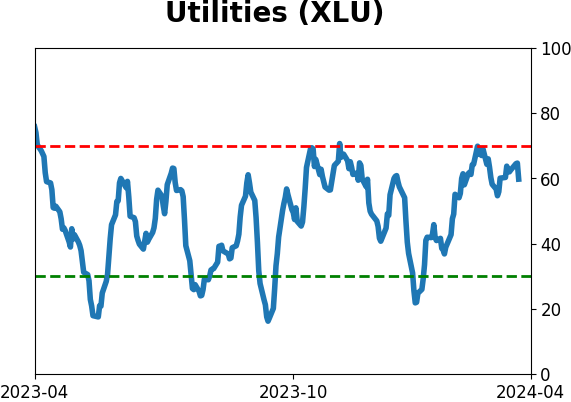
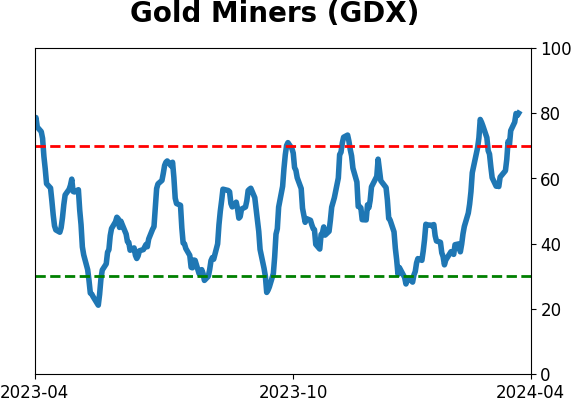
Optimism Index Thumbnails
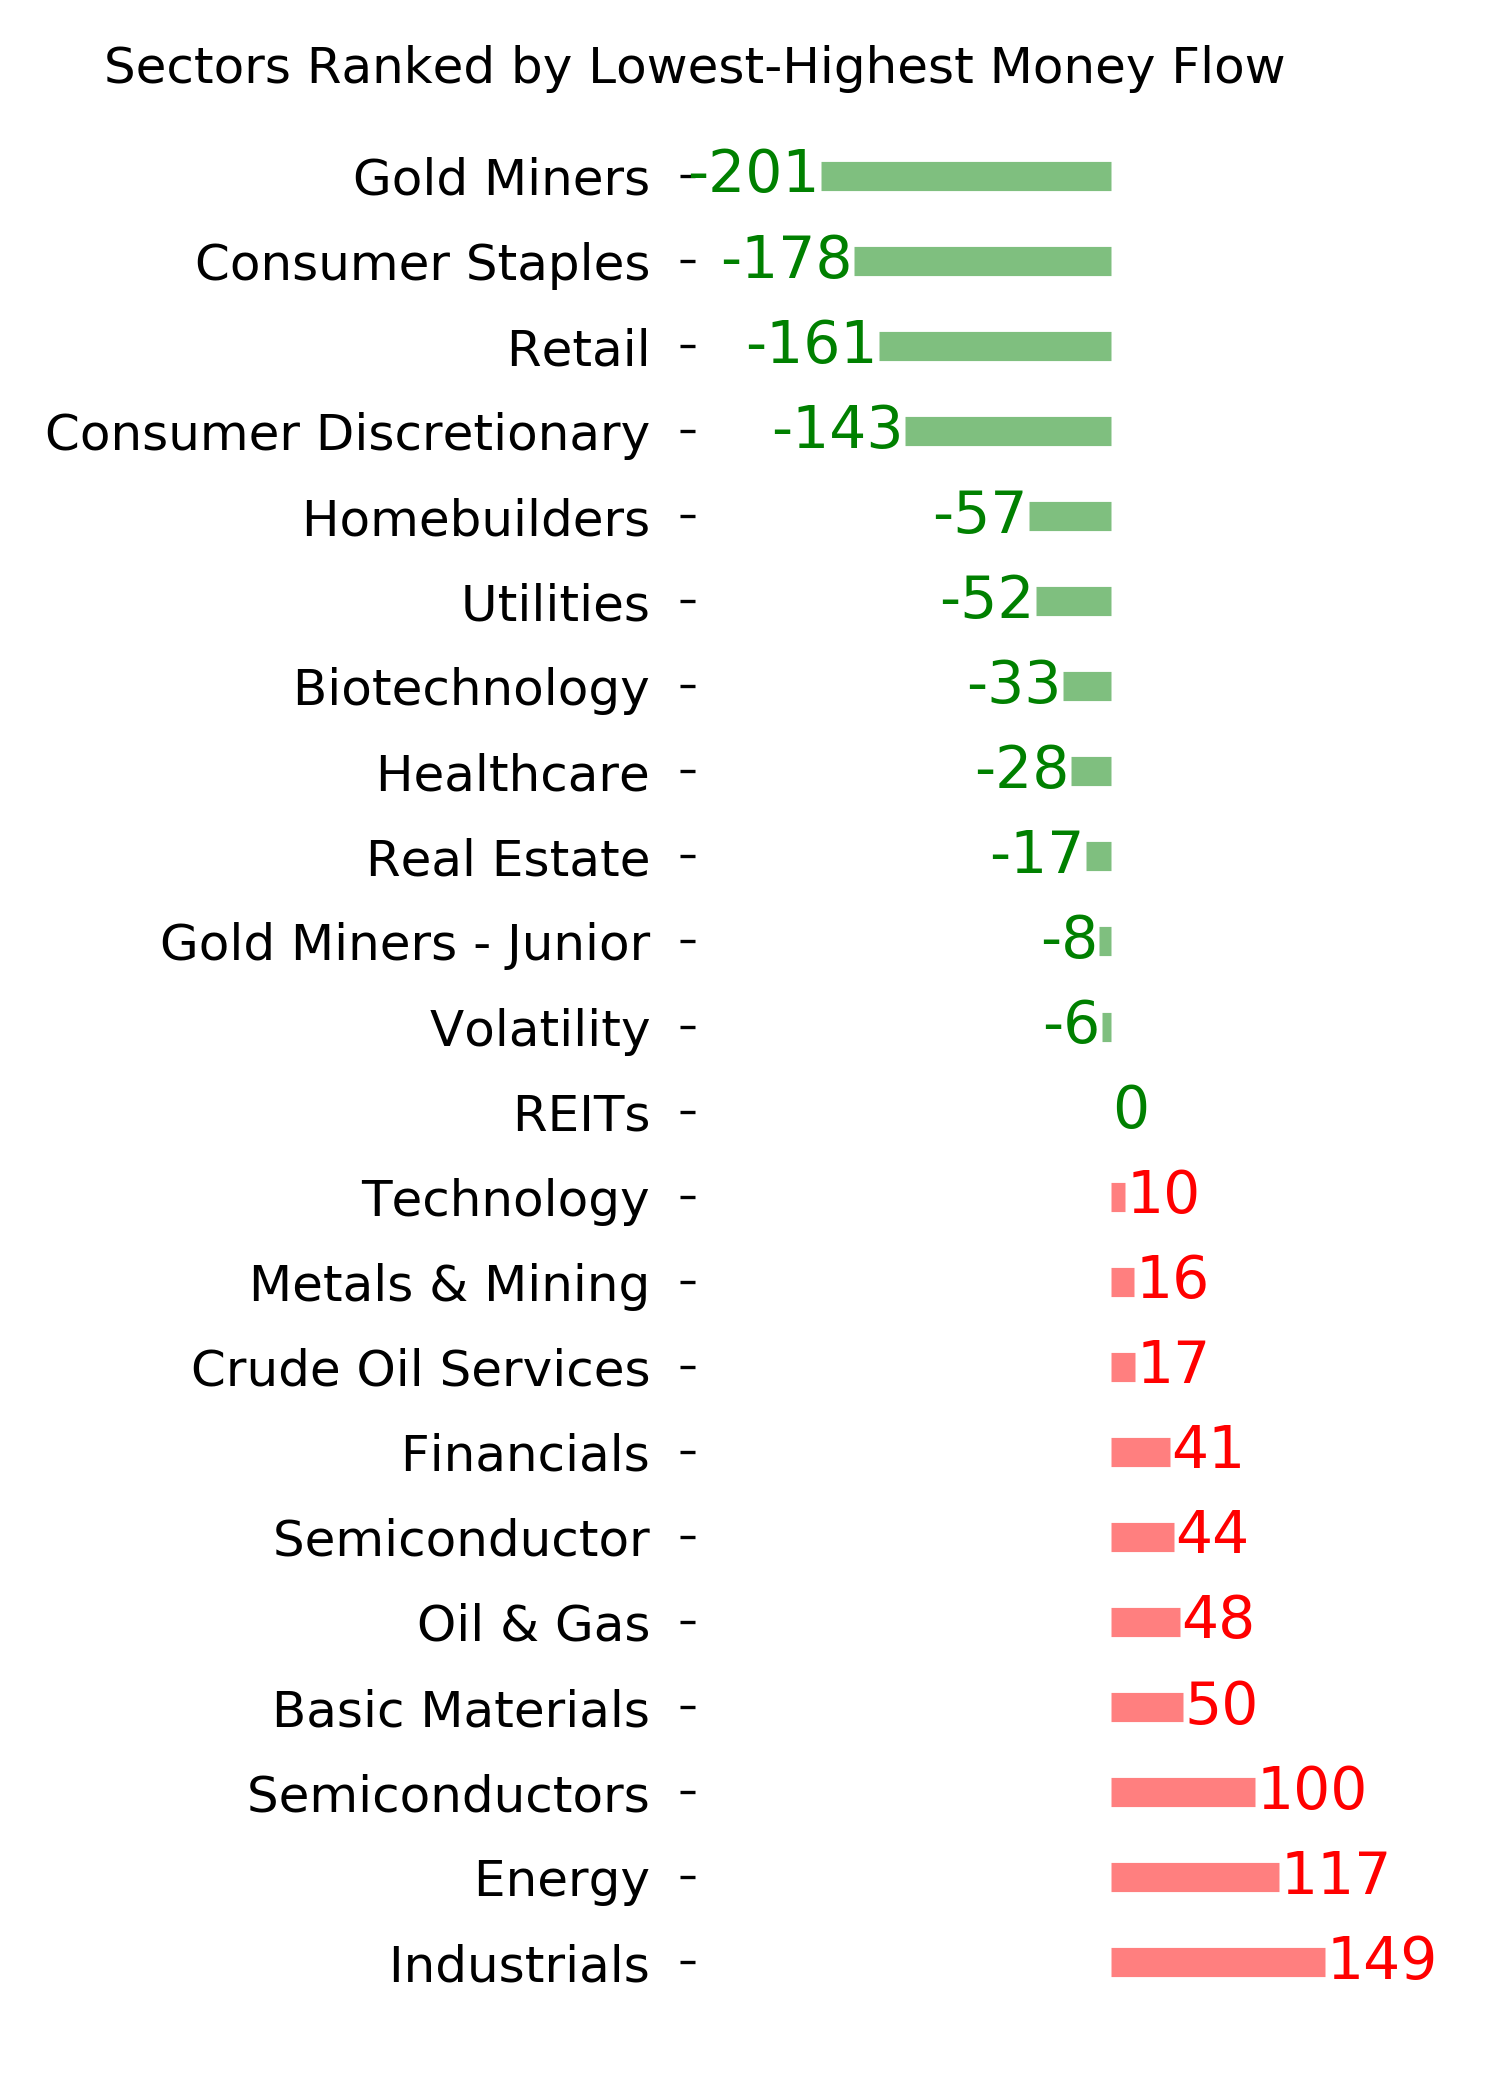
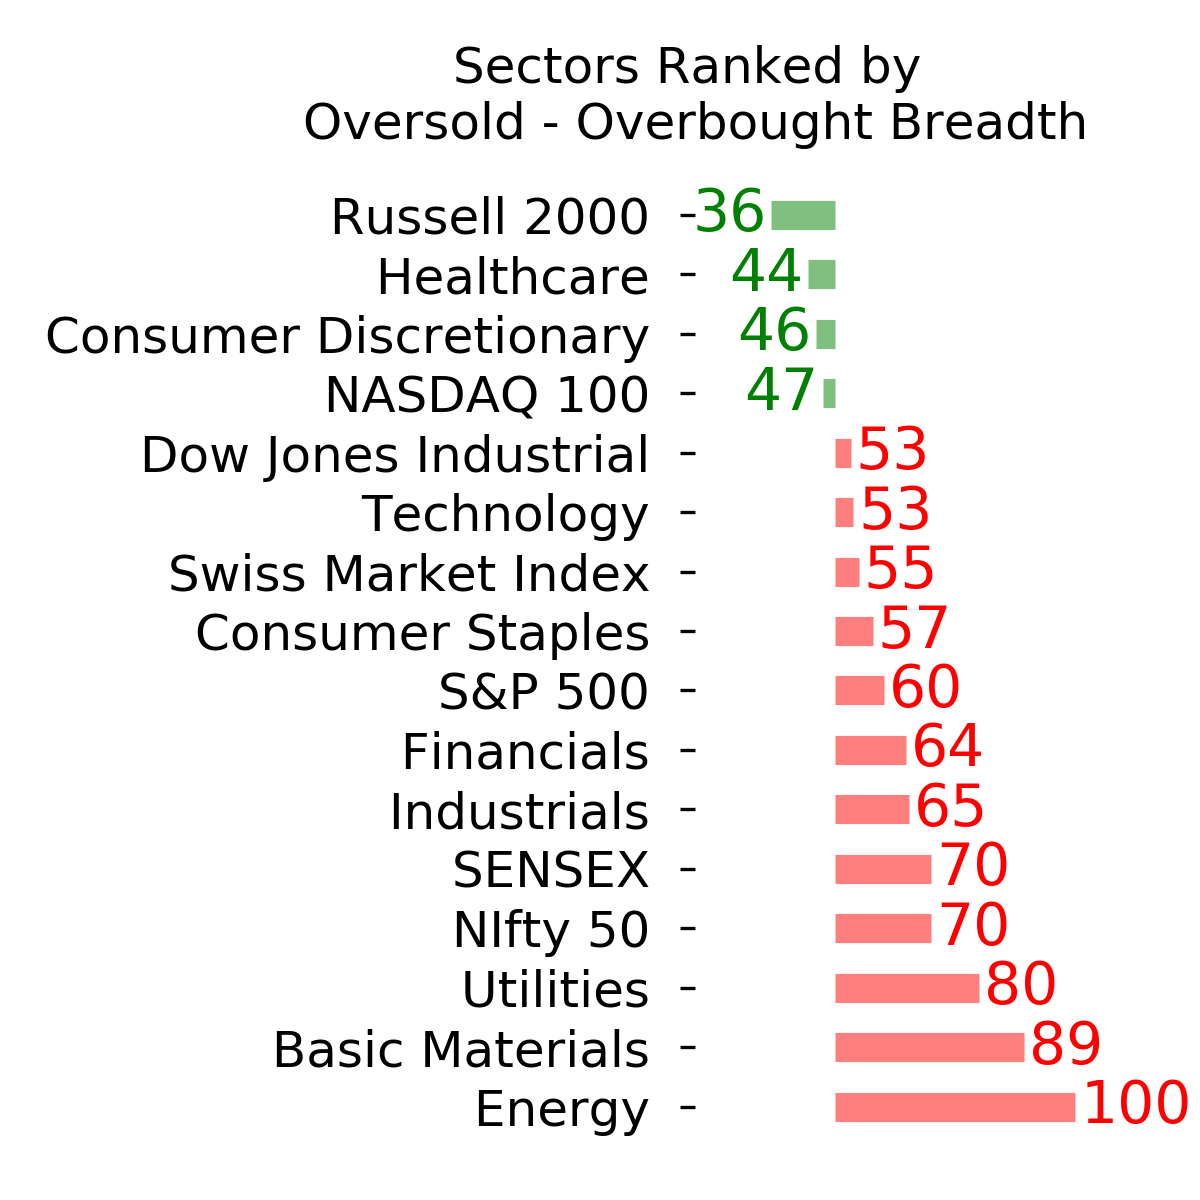
| Sector ETF's - 10-Day Moving Average |
|
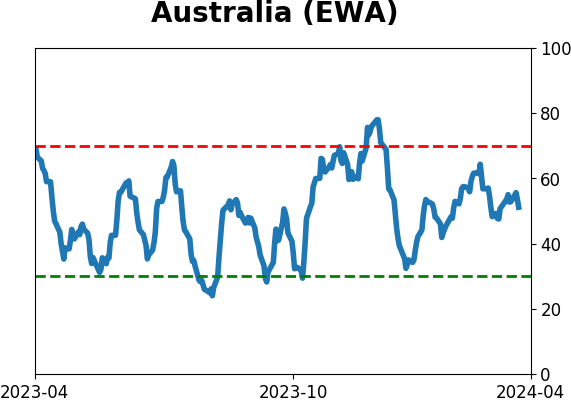
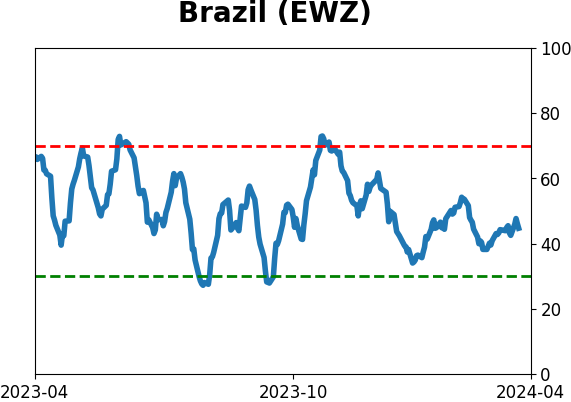
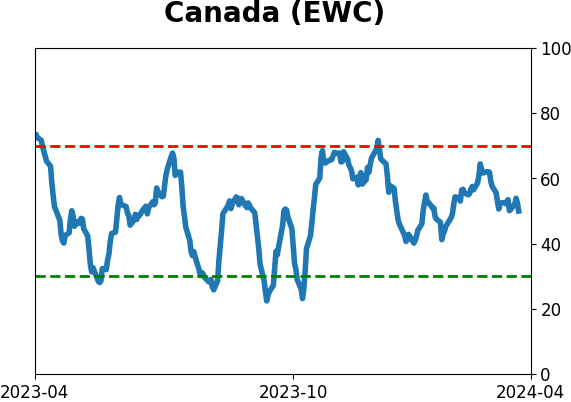
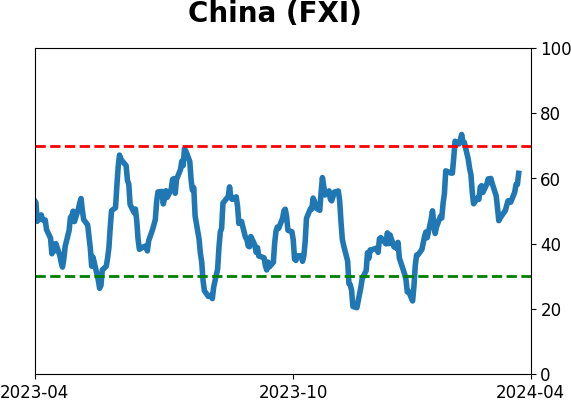
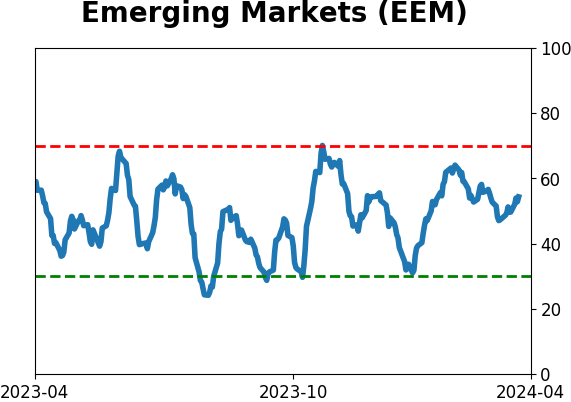
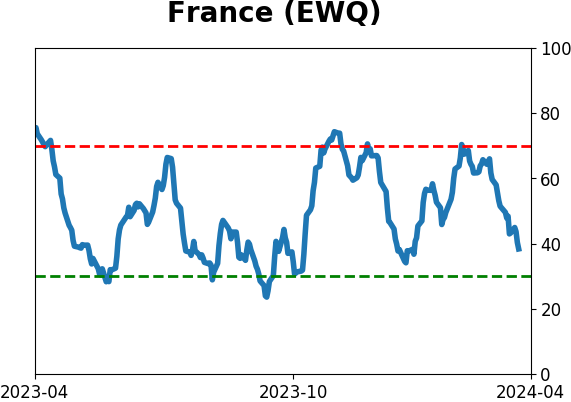
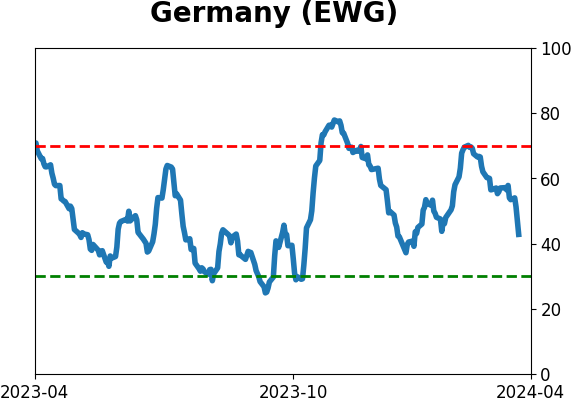
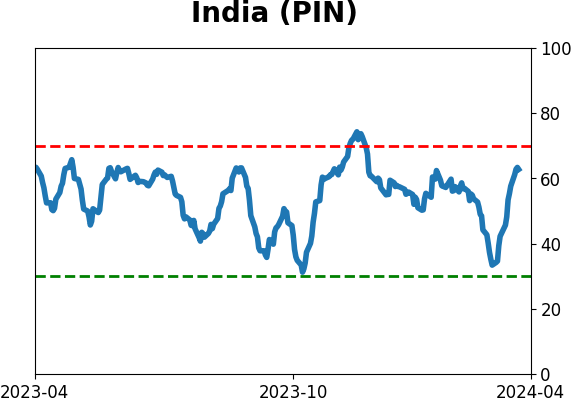
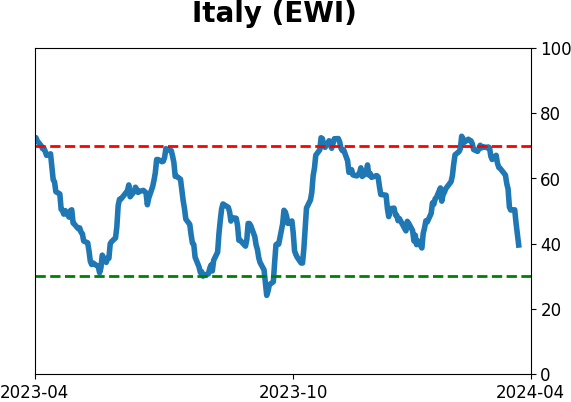
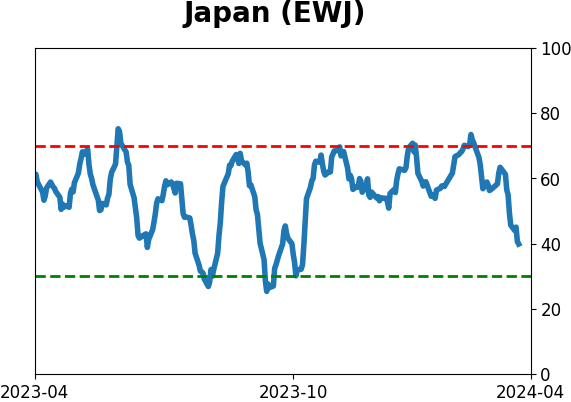
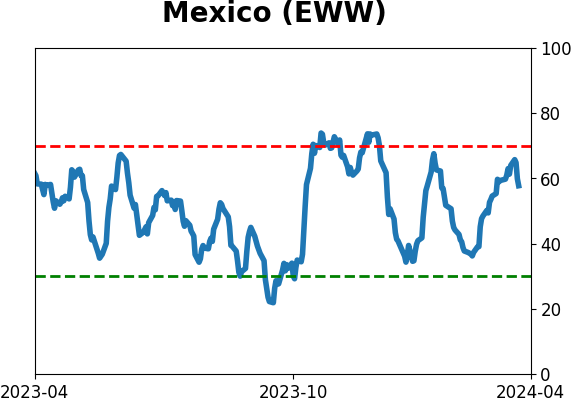
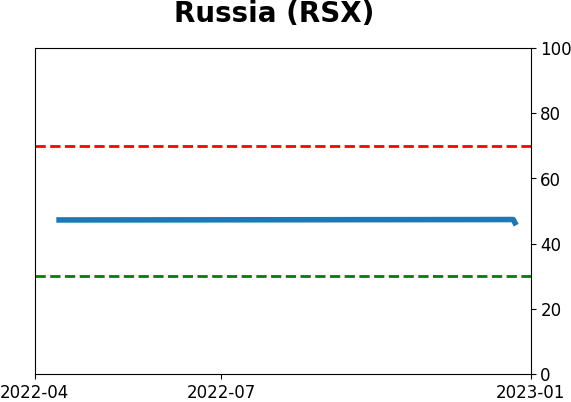
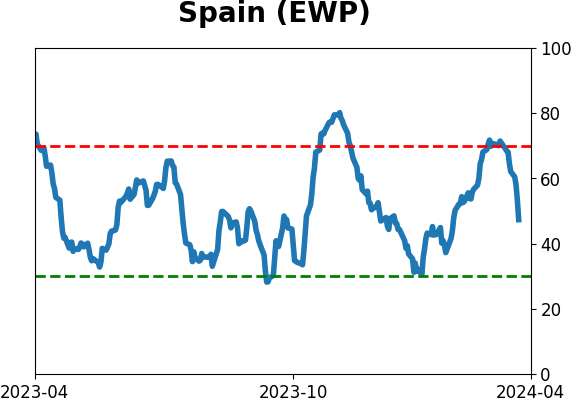
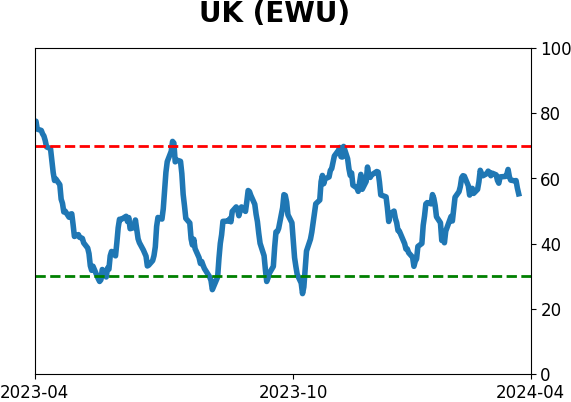
| Country ETF's - 10-Day Moving Average |
|
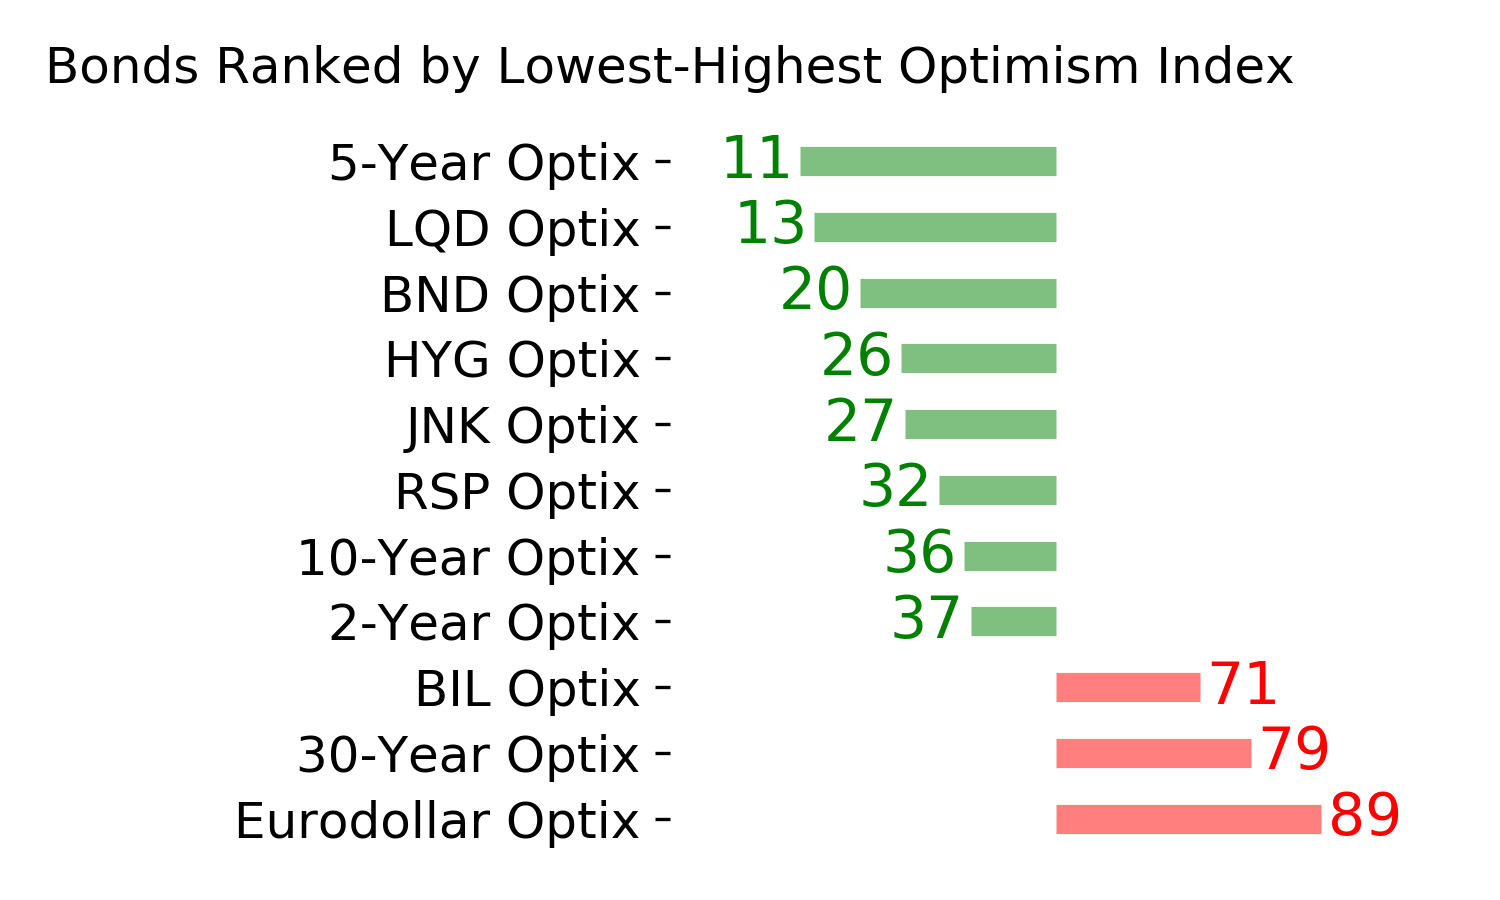
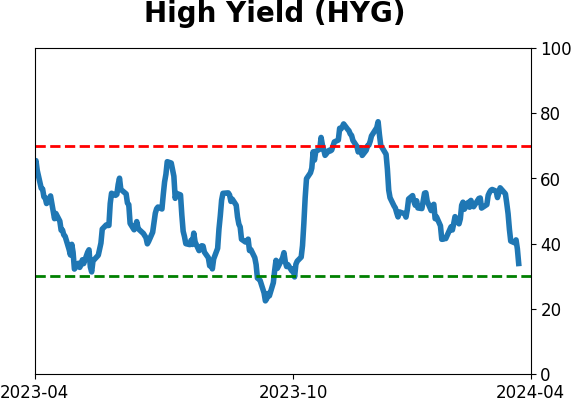
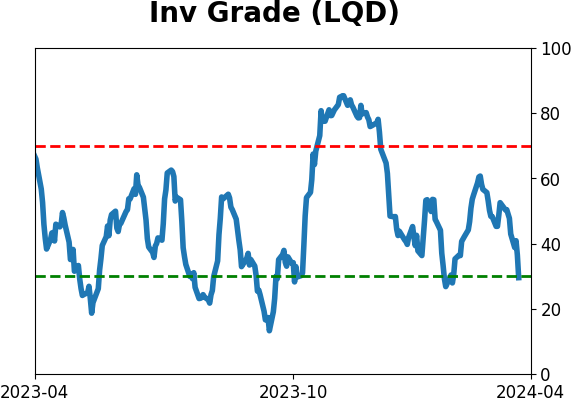
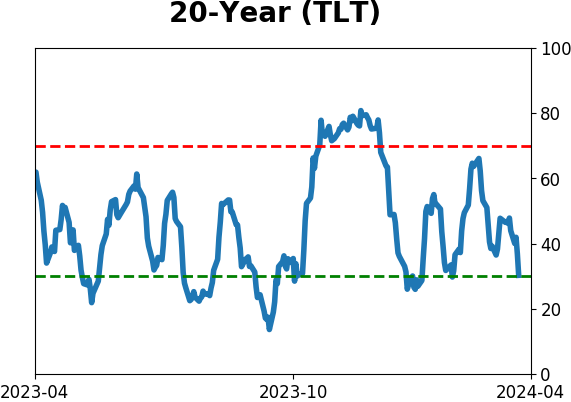
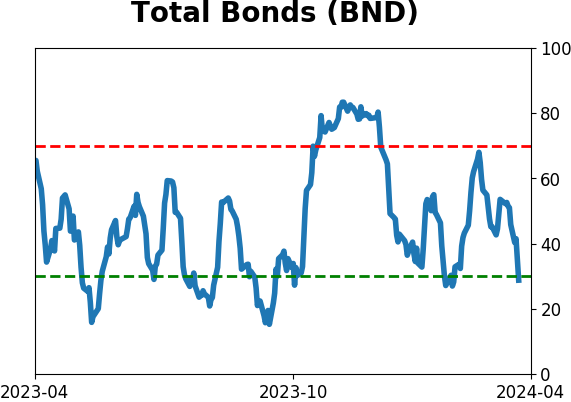
| Bond ETF's - 10-Day Moving Average |
|
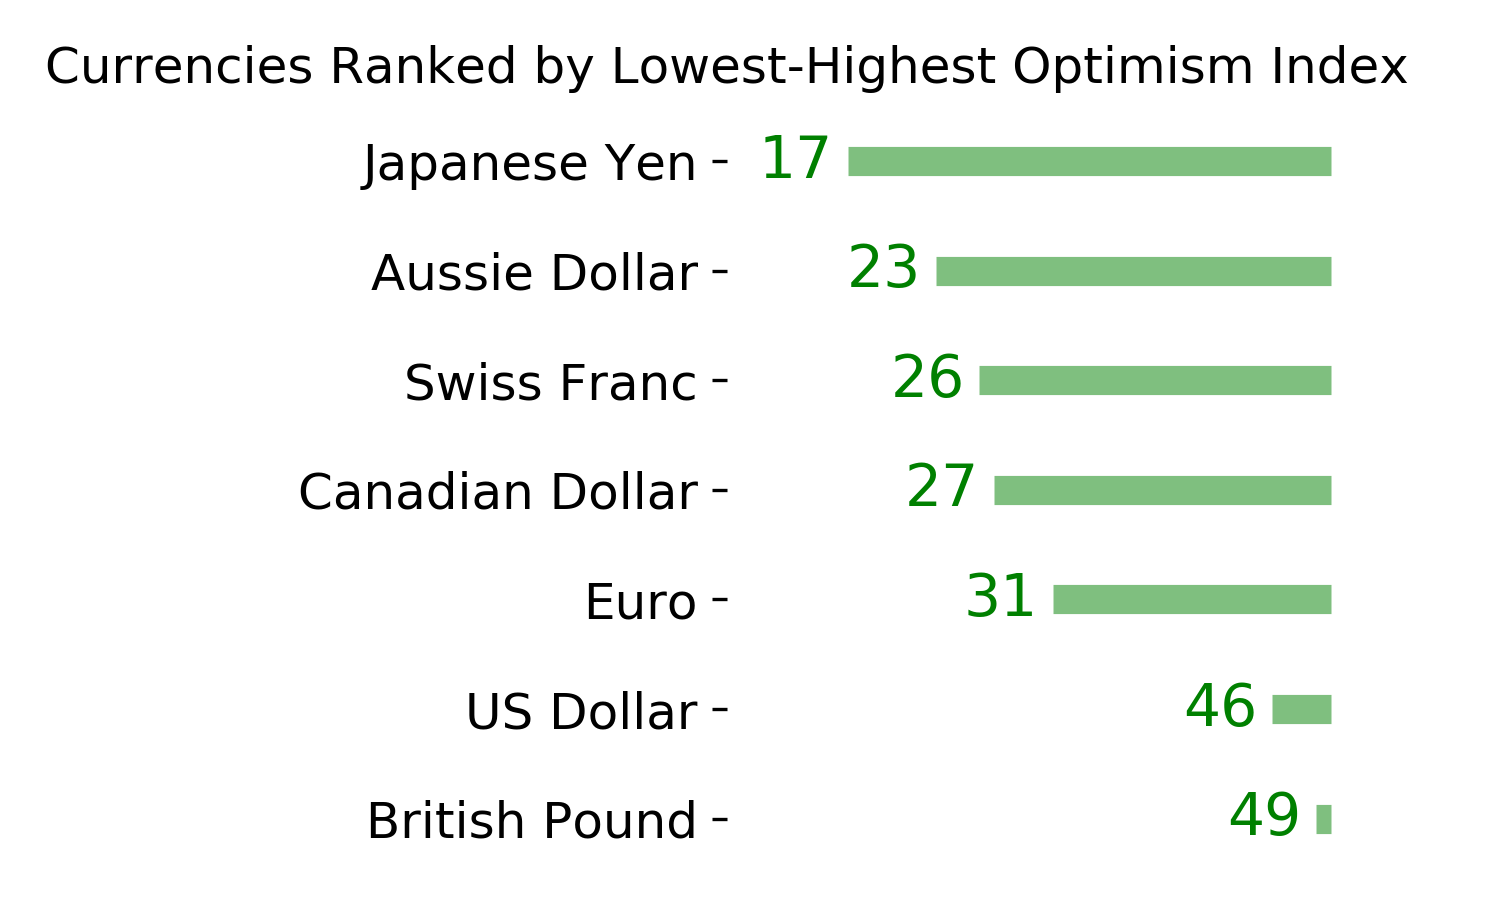
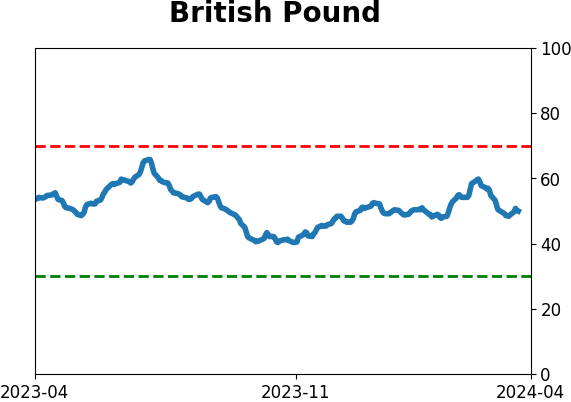
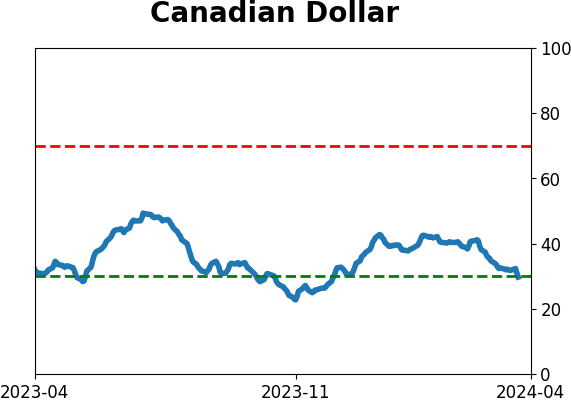
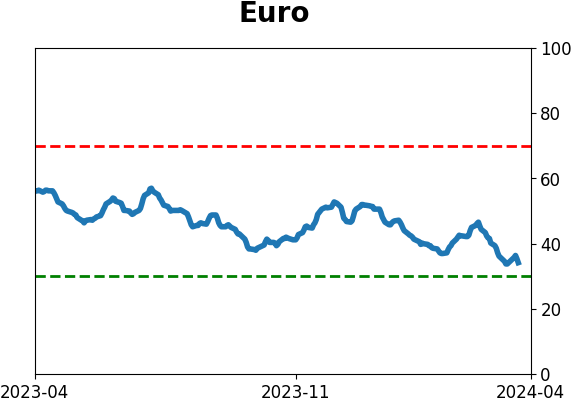
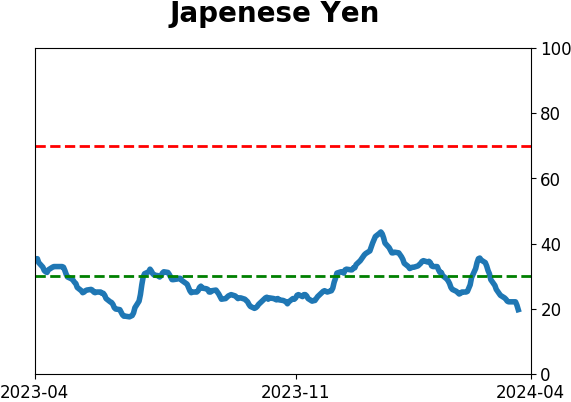
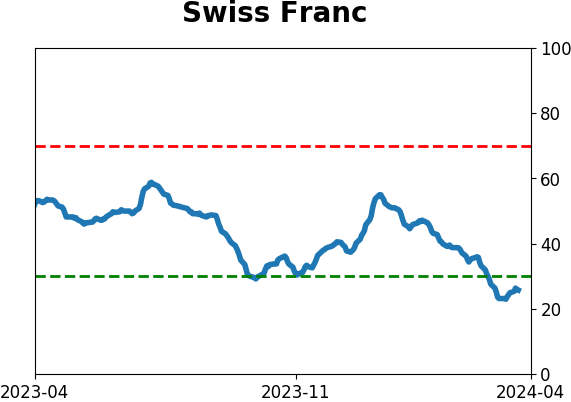
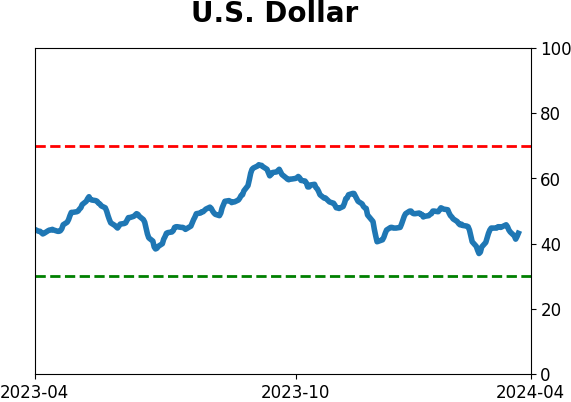
| Currency ETF's - 5-Day Moving Average |
|
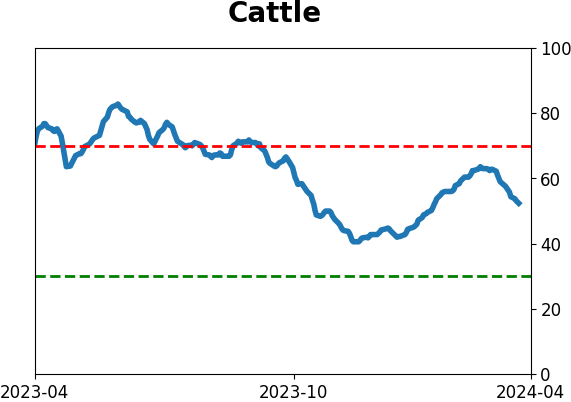
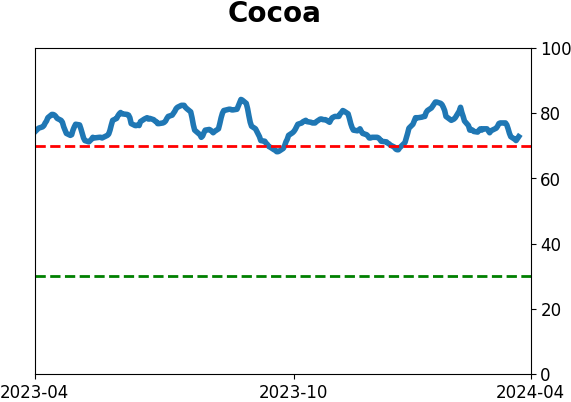
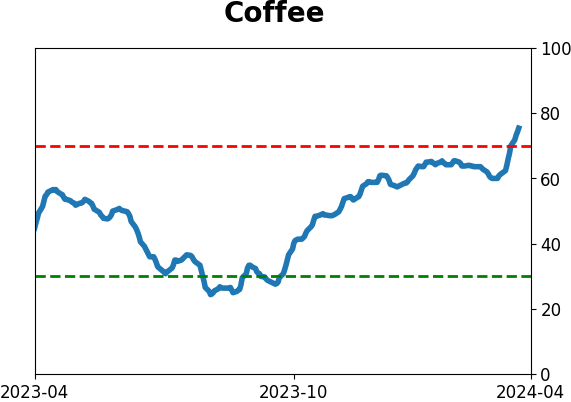
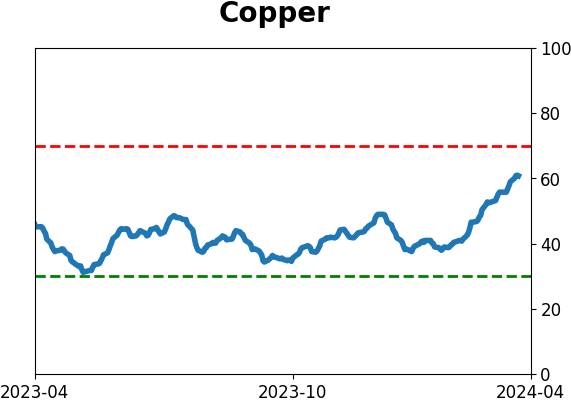
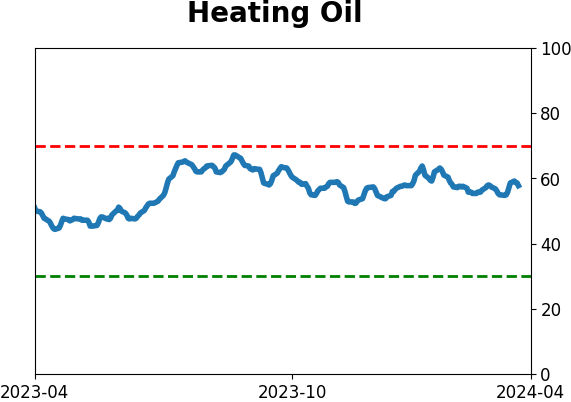
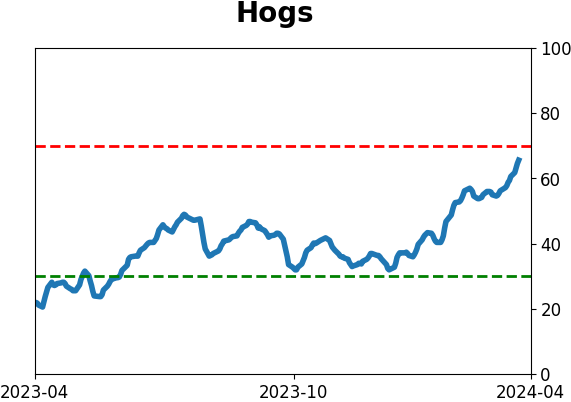
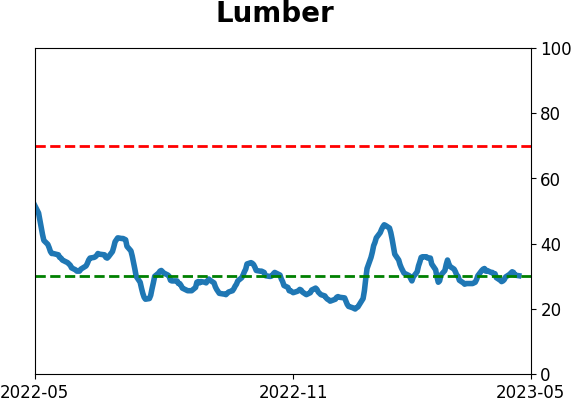
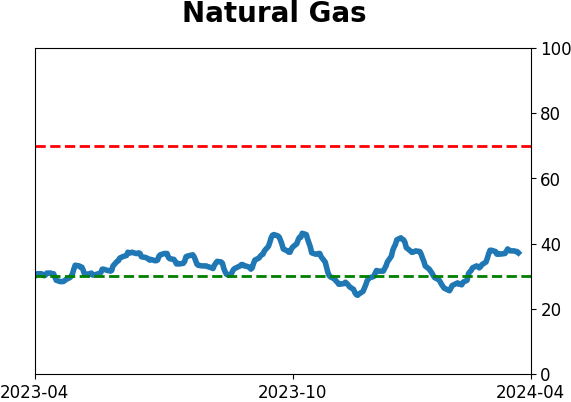
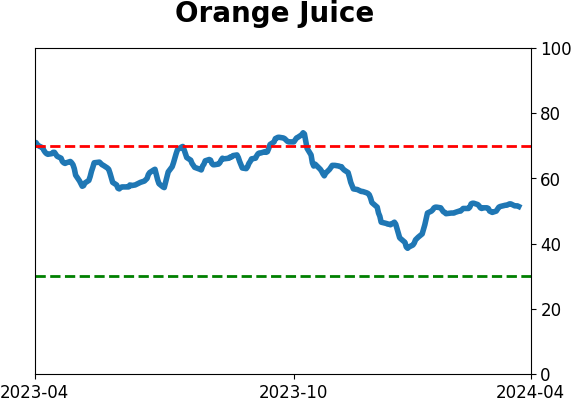
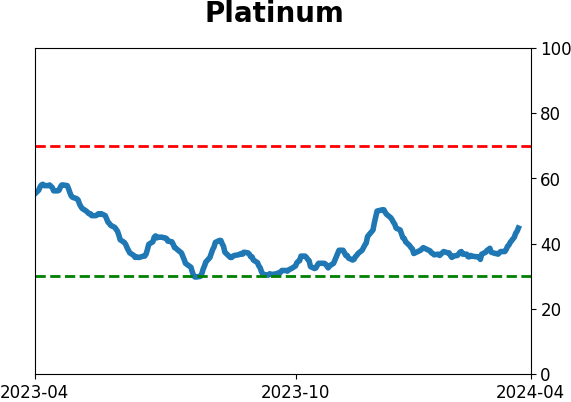
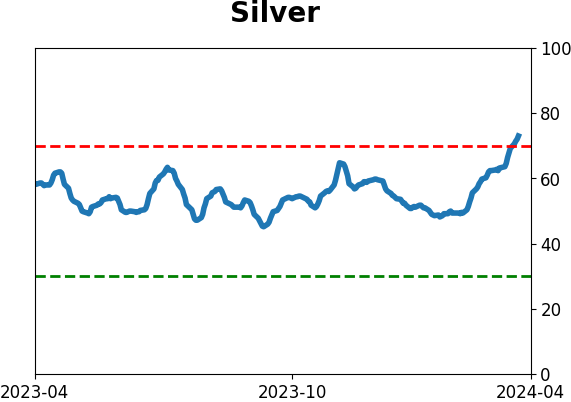
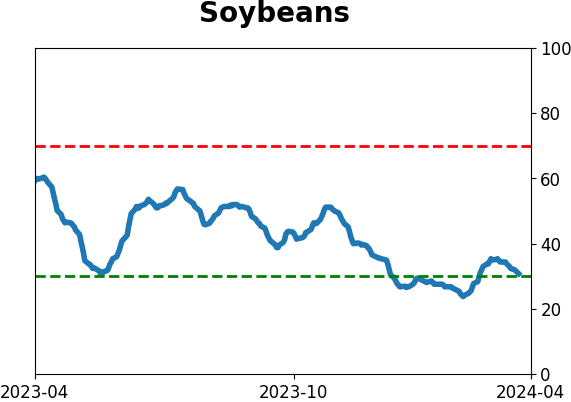
| Commodity ETF's - 5-Day Moving Average |
|