Headlines
|
|
Staid Utility stocks make a historic run:
Over the past 3 weeks, Utility stocks have surged. That has pushed a record number of them to 52-week highs. Other breadth metrics are seeing 70-year extremes in internal momentum, which has a strong record at preceding losses in the months ahead.
|
Smart / Dumb Money Confidence
|
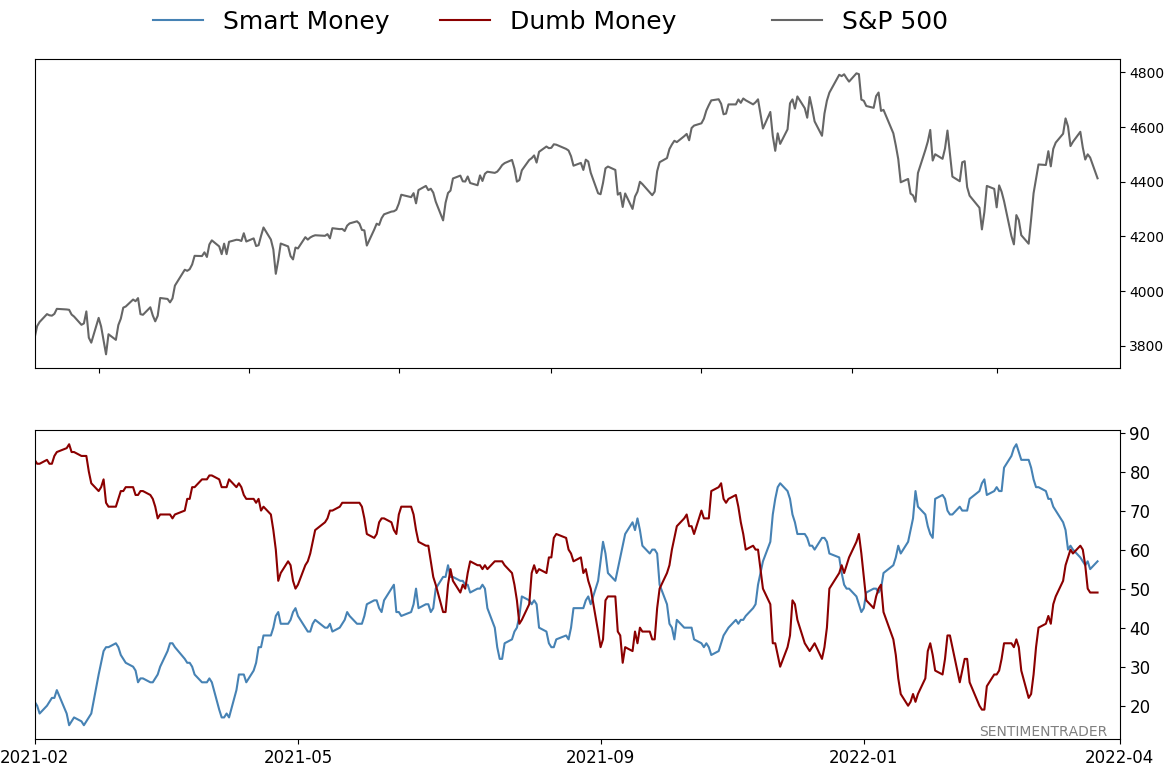
Smart Money Confidence: 57%
Dumb Money Confidence: 49%
|
|
Risk Levels
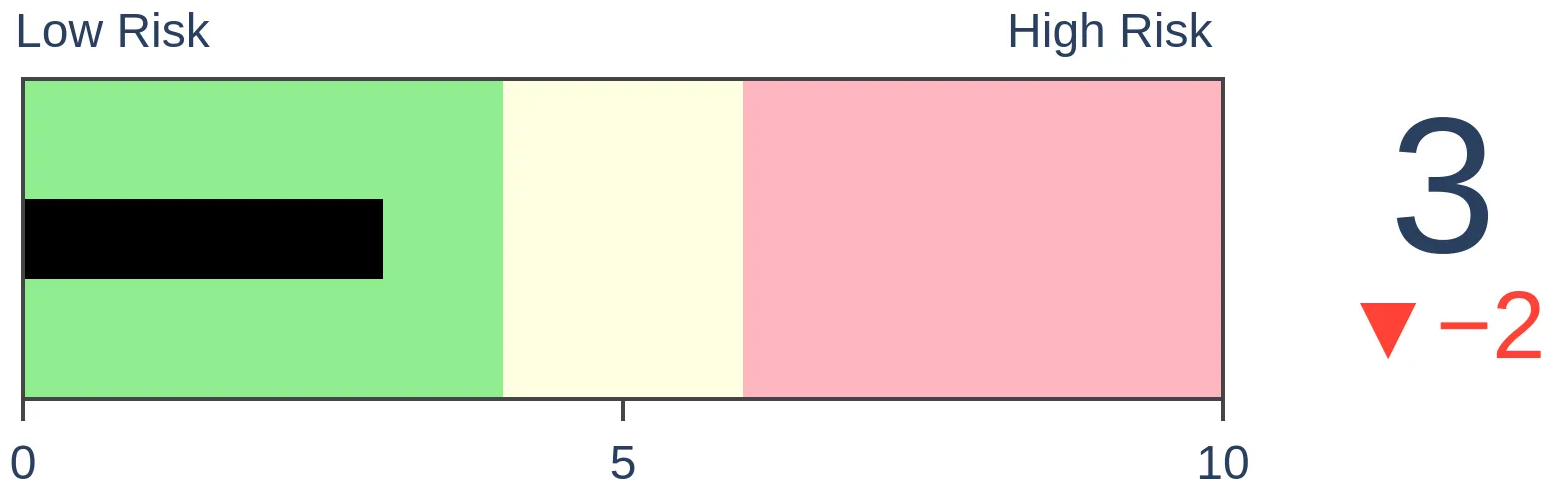
Stocks Short-Term
|
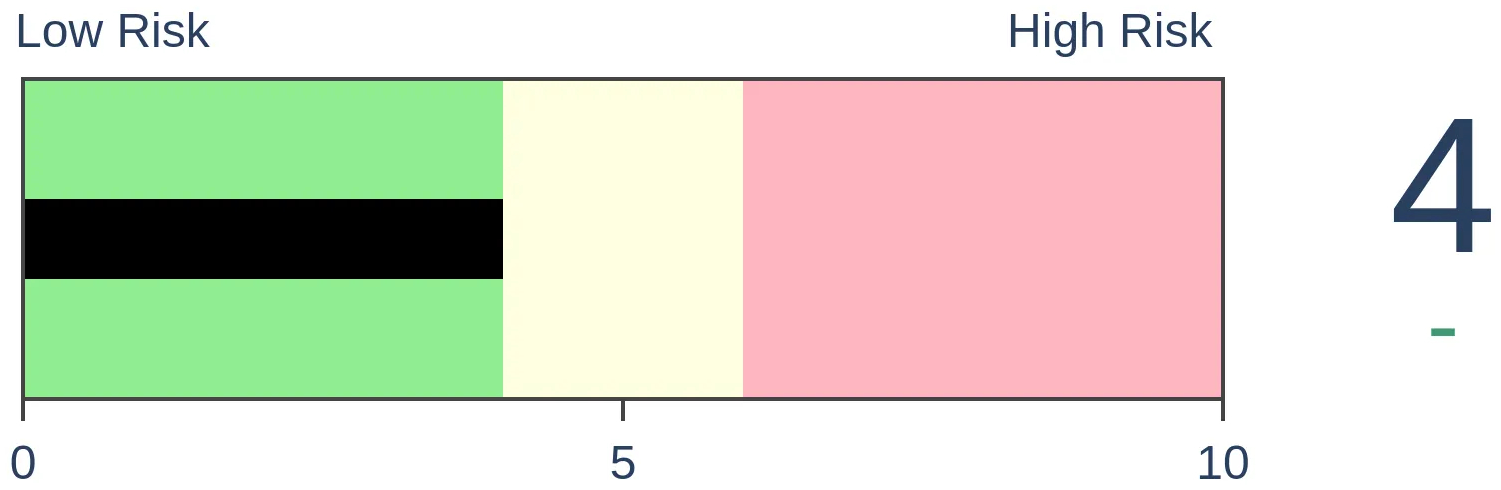
Stocks Medium-Term

|
|
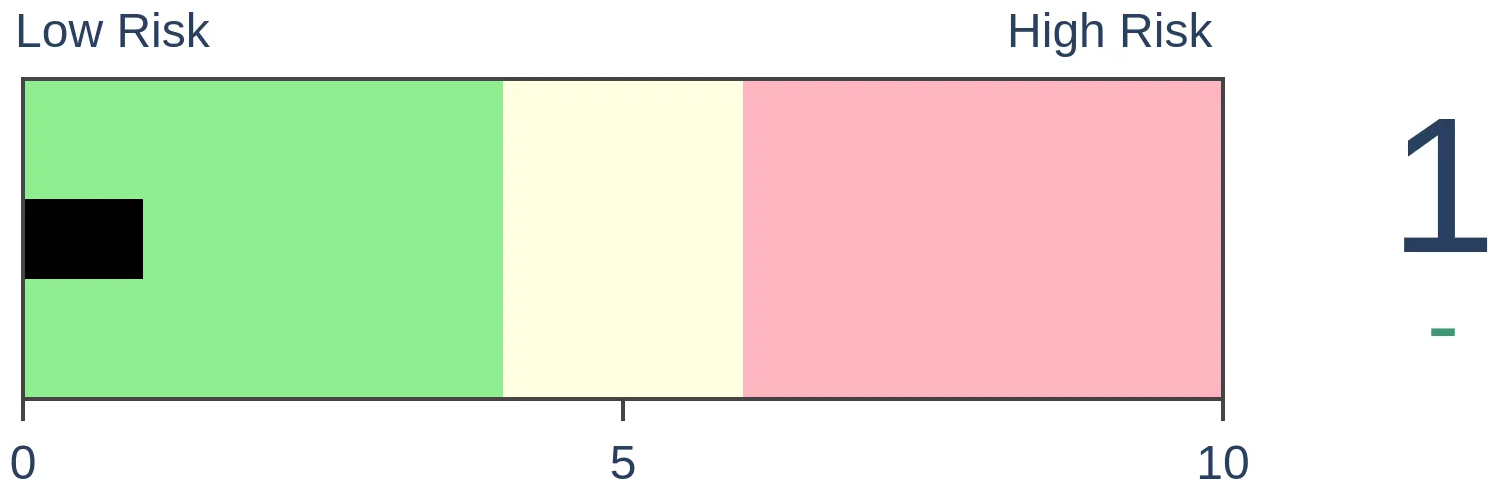
Bonds
|
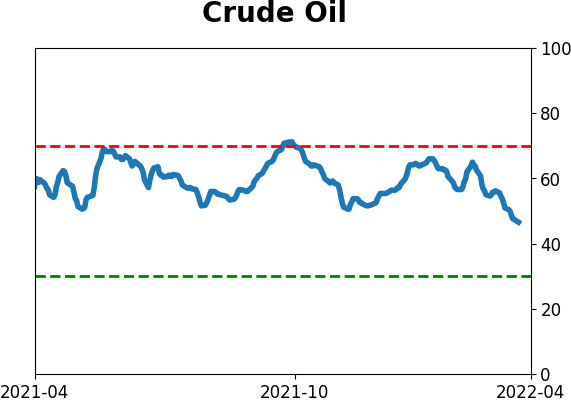
Crude Oil
|
|
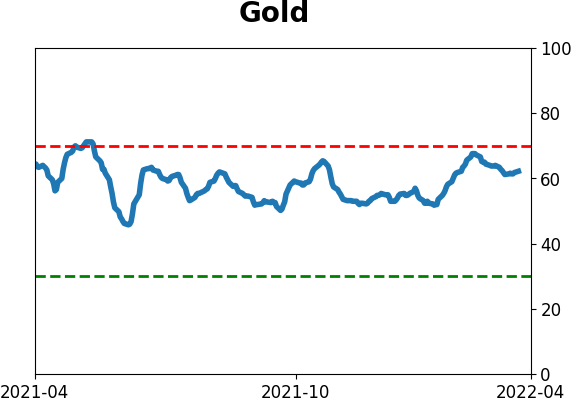
Gold
|
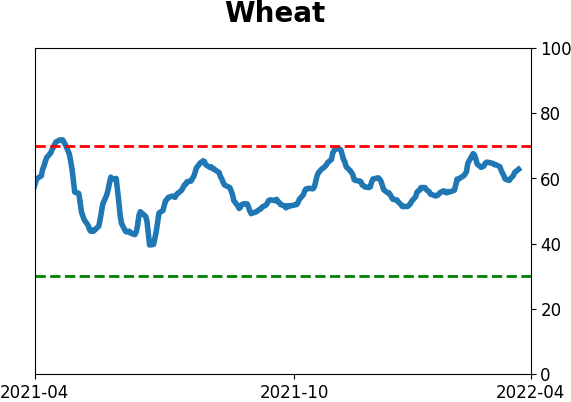
Agriculture

|
|
Research
By Jason Goepfert
BOTTOM LINE
Over the past 3 weeks, Utility stocks have surged. That has pushed a record number of them to 52-week highs. Other breadth metrics are seeing 70-year extremes in internal momentum, which has a strong record at preceding losses in the months ahead.
FORECAST / TIMEFRAME
XLU -- Down, Medium-Term
|
Key points:
- Utility stocks have surged since late February
- The moves have generated a 70-year extreme in many breadth metrics
- Internal momentum extremes in Utility stocks have a solid record at preceding losses
A staid sector makes a historic run
A funny thing has been happening in stocks since late February. Stocks usually relegated to widows and orphans have behaved like supercharged tech stars.
According to Investopedia, Utility stocks are literally the definition of a safe, steady investment.
"Widow-and-orphan stock refers to an equity investment that often pays a high dividend and is moreover generally considered low-risk. These tend to be large, mature, stalwart companies in non-cyclical business sectors such as utilities and consumer staples, which tend to hold up better during economic downturns."
Hopefully, the past few weeks put some pep in the steps of those bereaved individuals, as the Dow Jones Utility Average has enjoyed its 2nd-largest 30-day rate of change in 20 years.
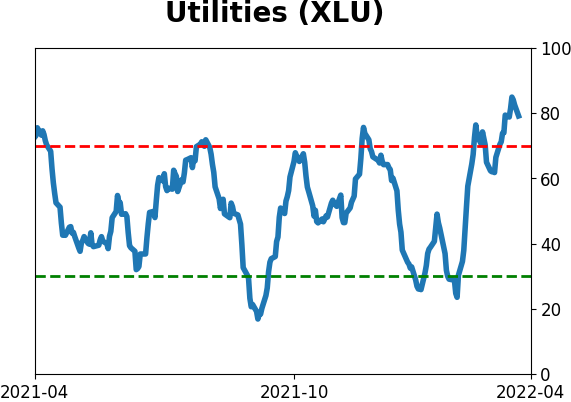
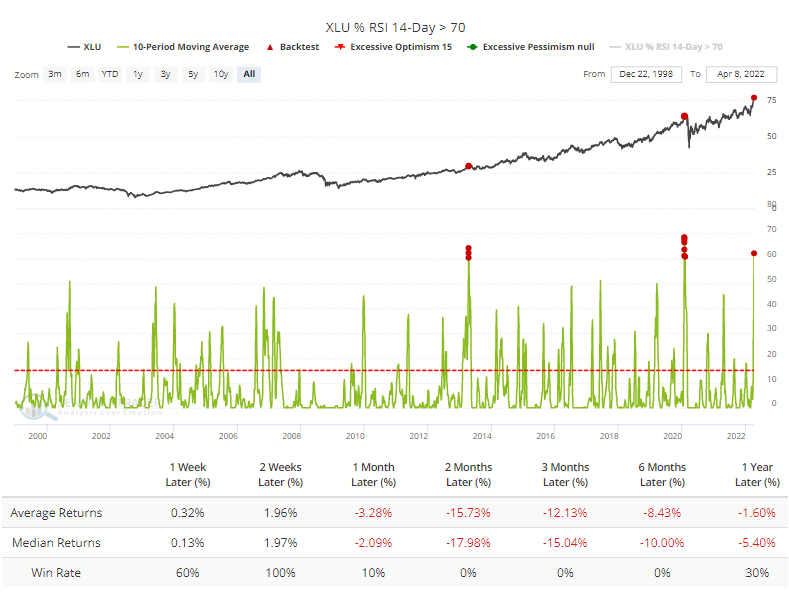
The surge has been so great that more than 60% of them became overbought on an average day over the past 2 weeks. Since 1999, only 2 distinct occasions encompassing 10 days total have exceeded this. The Backtest Engine shows that all 10 days saw losses in XLU over the next couple of months.
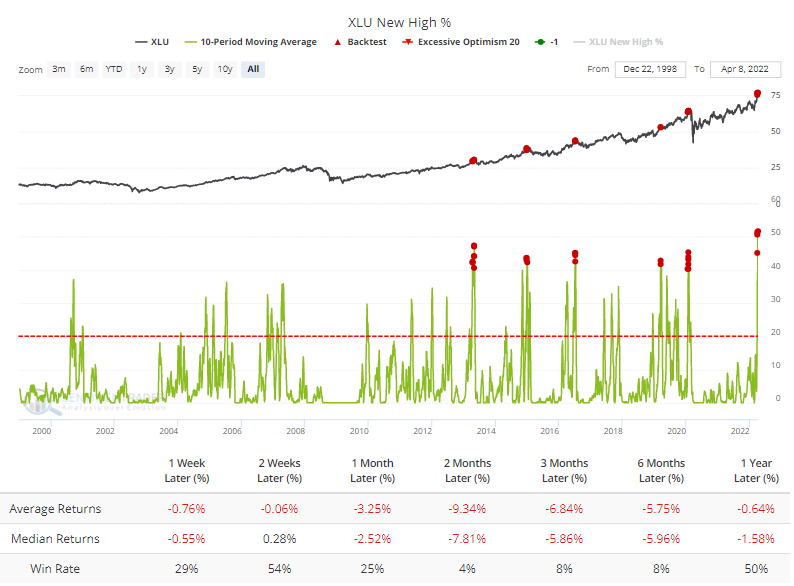
The jump in overbought stocks pushed more than half of them to 52-week highs on an average day over the past 10 sessions, a 23-year record. The Backtest Engine shows that future returns are horrid when the 10-day average reaches even 40%. Of 24 days, only 1 barely eked out a positive return 2 months later.
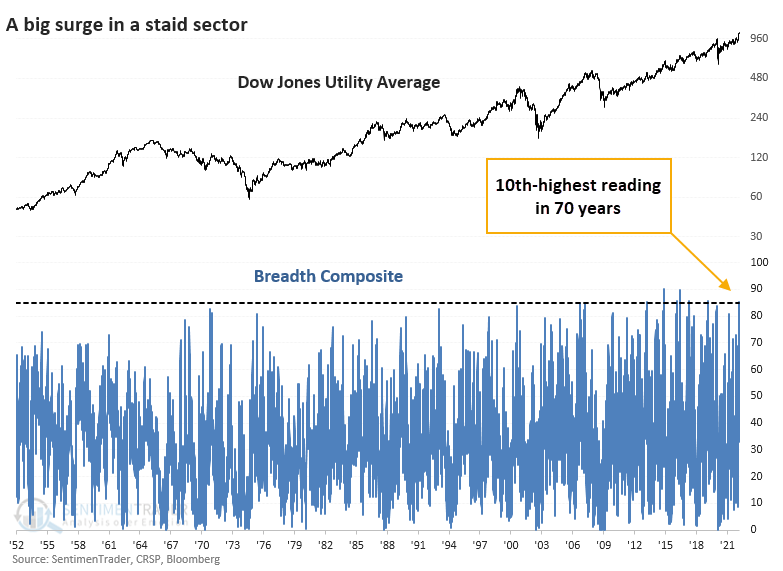
Even more astounding, a 10-day period when more than half of Utility stocks hit a 52-week high is a record dating back 70 years. In other words, at no other time since 1952 have so many of these stocks hit new highs at the same time for such a long stretch.
If we put together a composite breadth indicator that incorporates 7 different factors, it just hit the 10th-highest reading since 1952.
Upside momentum rarely generates good returns in these stocks
All of the highest readings have come in the past decade. All of them also preceded losses for Utility stocks during the next 1-2 months, though the 2019 signal was mild, didn't last long, and ultimately preceded excellent gains.
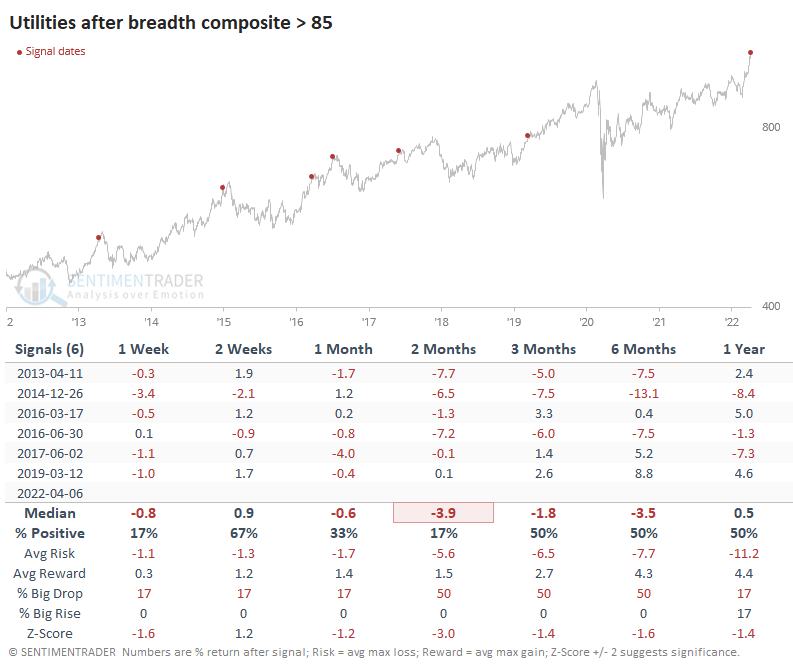
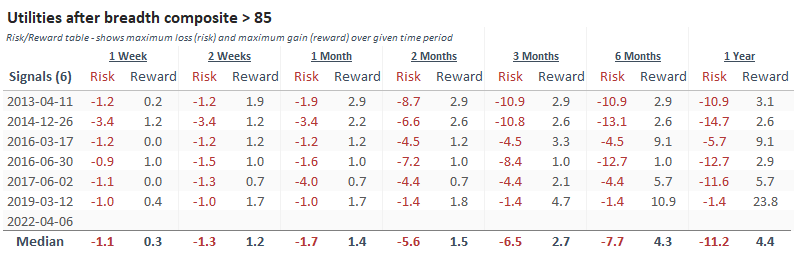
The Risk/Reward Table shows how much of the former and little of the latter these signals preceded.
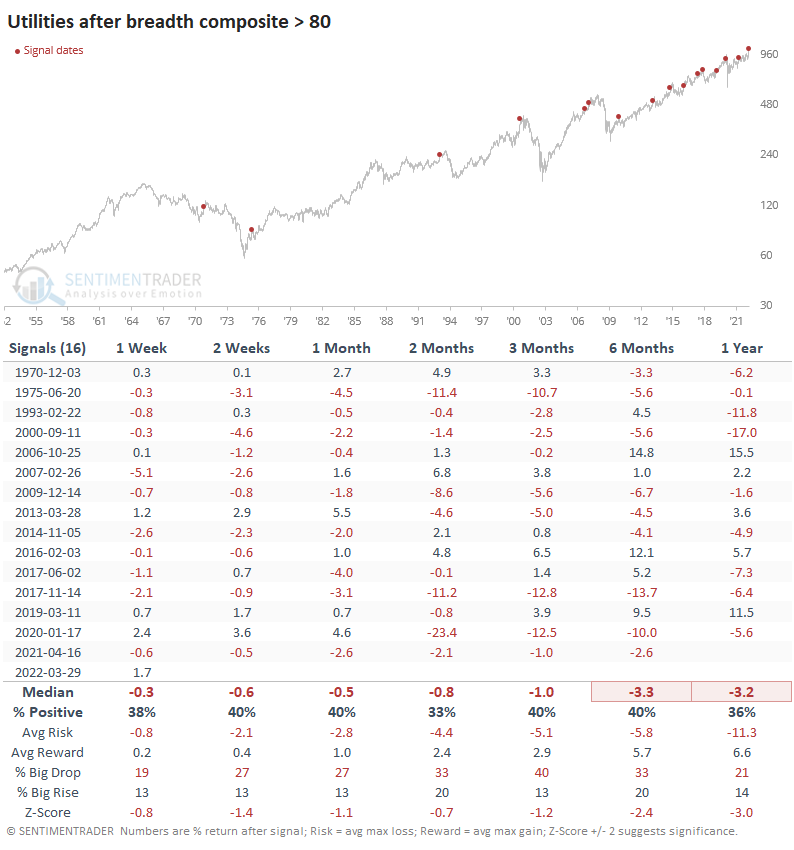
The overall theme remains the same if we relax the overbought threshold to generate a larger sample size. Out of the 16 signals, only 2007 and 2016 witnessed gains in these stocks during the usual soft spot from 1-6 months following the signal.
What the research tells us...
When we see markets hit true extremes, it's typically a good bet that they will self-correct and mean-revert. The tired maxim "extreme can always get more extreme" exists because nothing is ever 100%, and sometimes there is a structural change. Or, sometimes, people simply get crazy, and it lasts a while. Mean reversion has been the best bet when we see upside extremes in staid stocks and sectors. It's extremely rare to see groups like this extend momentum runs for very long.
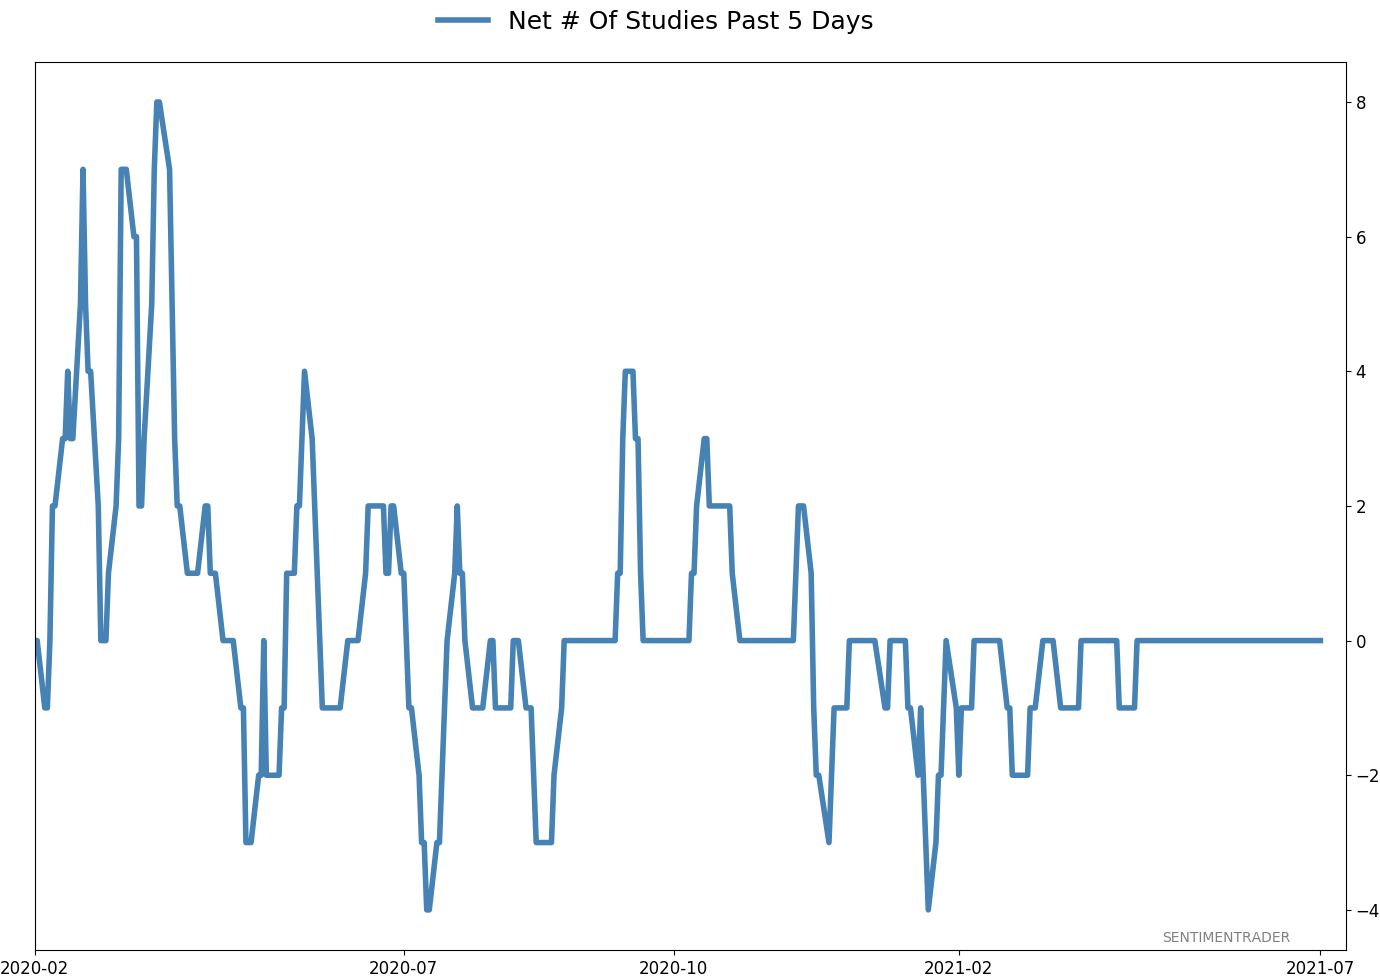
Active Studies
| Time Frame | Bullish | Bearish | | Short-Term | 4 | 0 | | Medium-Term | 25 | 3 | | Long-Term | 17 | 5 |
|
Indicators at Extremes
Portfolio
| Position | Description | Weight % | Added / Reduced | Date | | Stocks | 21.6% RSP, 5.1% IEMG | 26.7 | Added 5.3% | 2022-03-18 | | Bonds | 32.7% BND, 7.1% SCHP | 40.1 | Added 8.3% | 2021-10-26 | | Commodities | GCC | 2.4 | Reduced 2.1%
| 2020-09-04 | | Precious Metals | GDX | 4.6 | Reduced 4.2% | 2021-05-19 | | Special Situations | 7.6% KWEB, 4.9% XBI, 3.7% XLE, 1.8% PSCE | 18.0 | Added 4.6% | 2022-02-24 | | Cash | | 7.9 | | |
|
Updates (Changes made today are underlined)
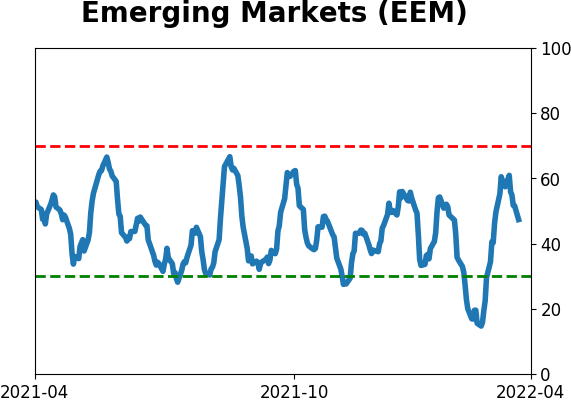
We had a volatile few weeks into mid-March, and it was enough to trigger a number of extremes. Most of the studies we've looked at have had a clear bullish edge over a multi-month time frame. I'd typically be more proactive instead of reactive with changes in positions, adding exposure into weakness instead of strength, but during an unhealthy environment like we're in, I tend to be more conservative. I did add some exposure to emerging markets, choosing a fund with the least exposure to China, since I already have exposure there with KWEB. It's still heavily weighted to that market. The only other times the MSCI Emerging Markets Index has had a weekly reversal like this week were October 2008, October 2011, and August 2015, all leading to long-term gains. RETURN YTD: -1.2% 2021: +8.7%, 2020: +8.1%, 2019: +12.6%, 2018: +0.6%, 2017: +3.8%, 2016: +17.1%, 2015: +9.2%, 2014: +14.5%, 2013: +2.2%, 2012: +10.8%, 2011: +16.5%, 2010: +15.3%, 2009: +23.9%, 2008: +16.2%, 2007: +7.8%
|
|
Phase Table
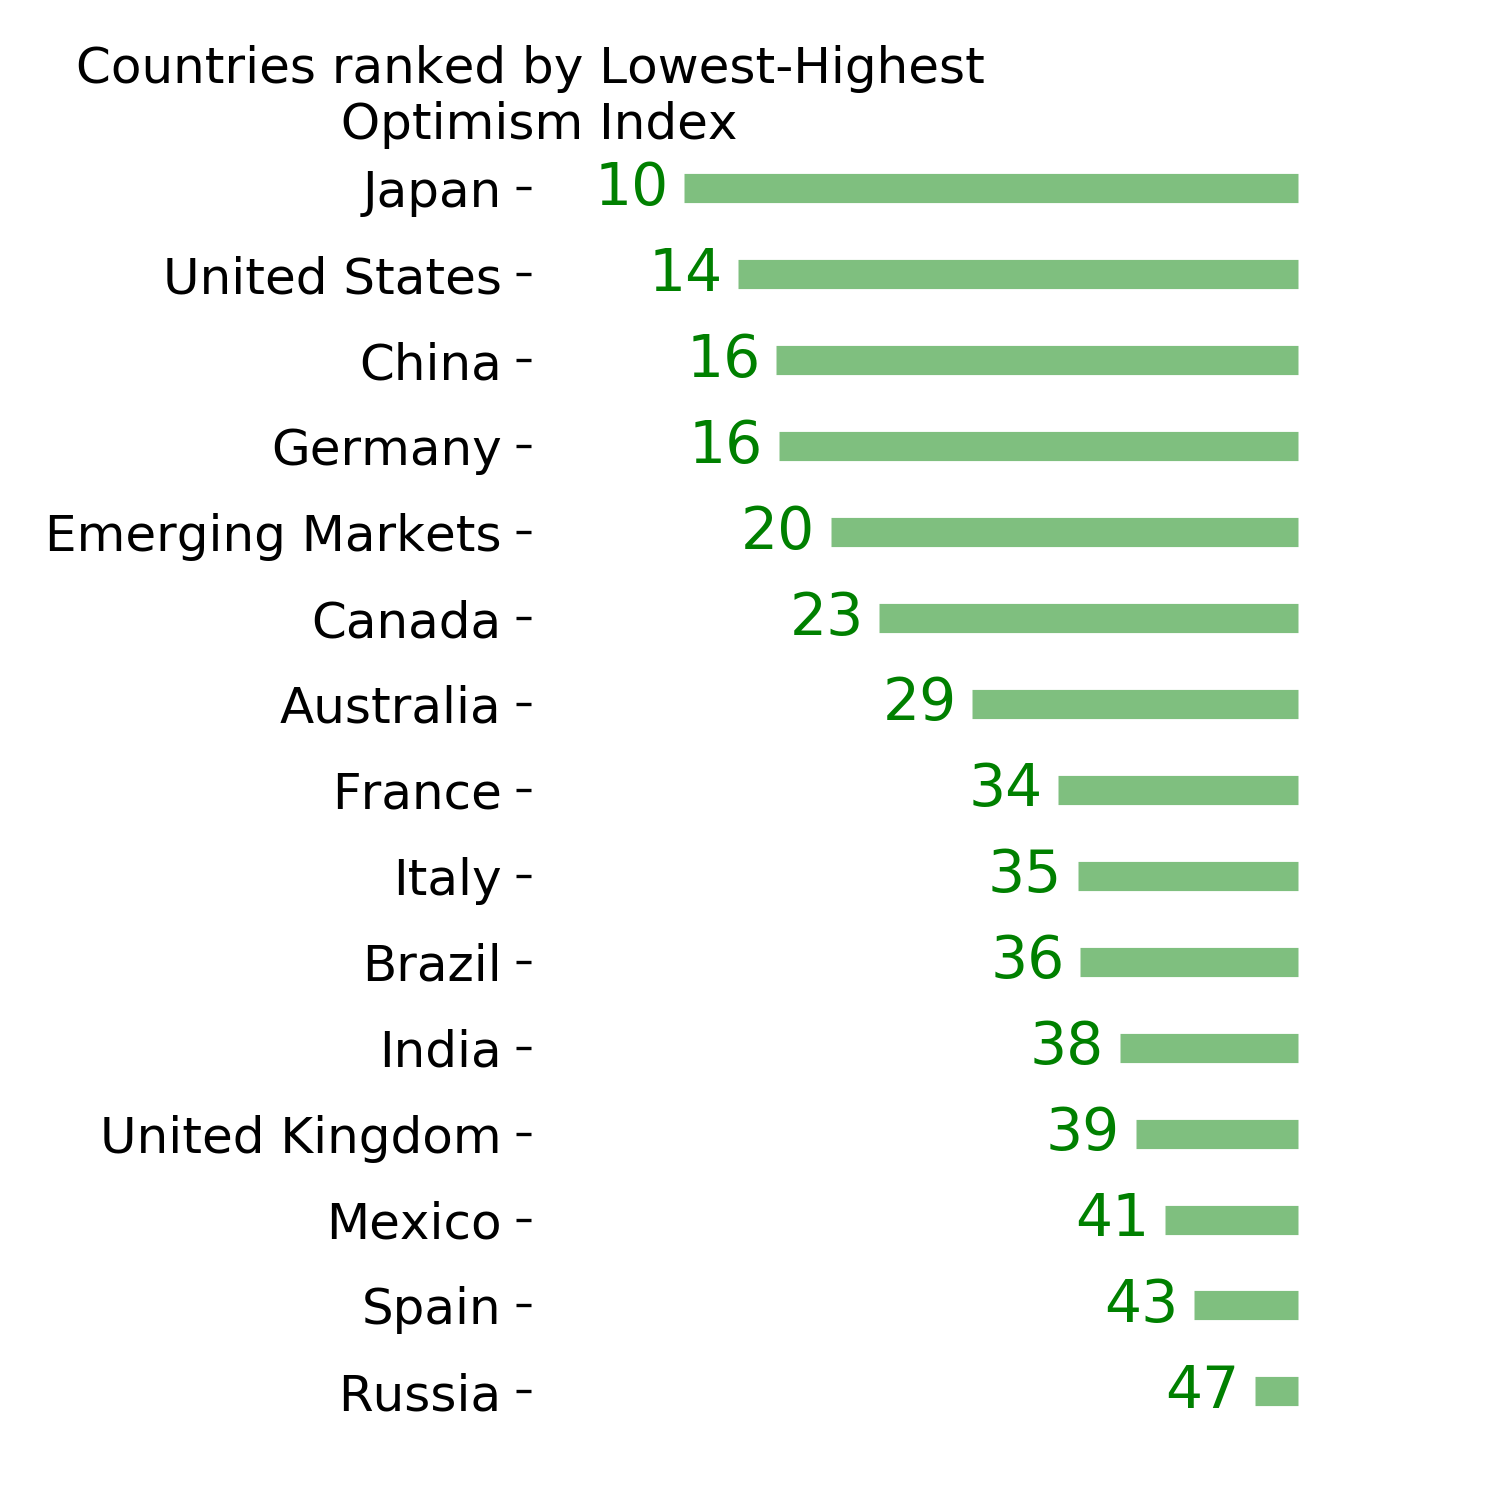
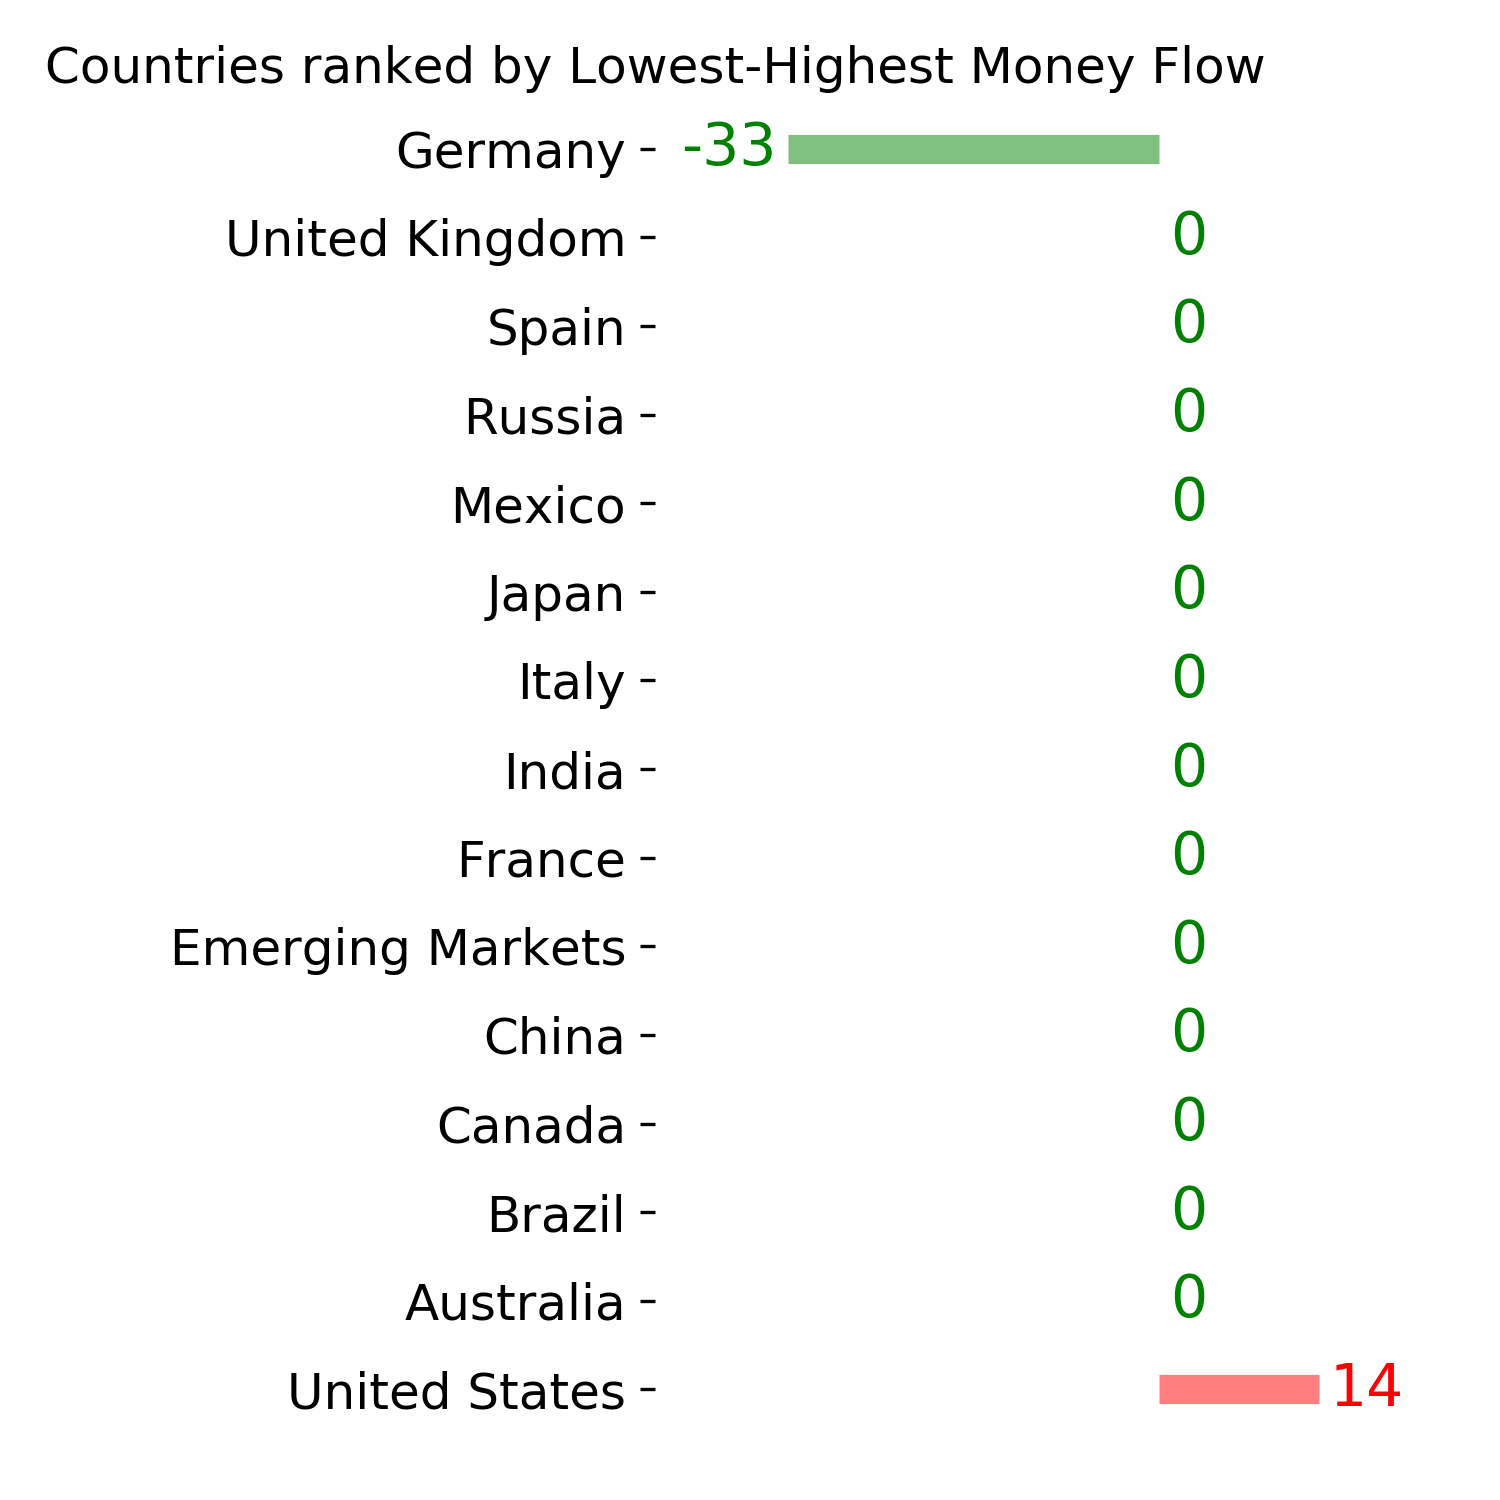
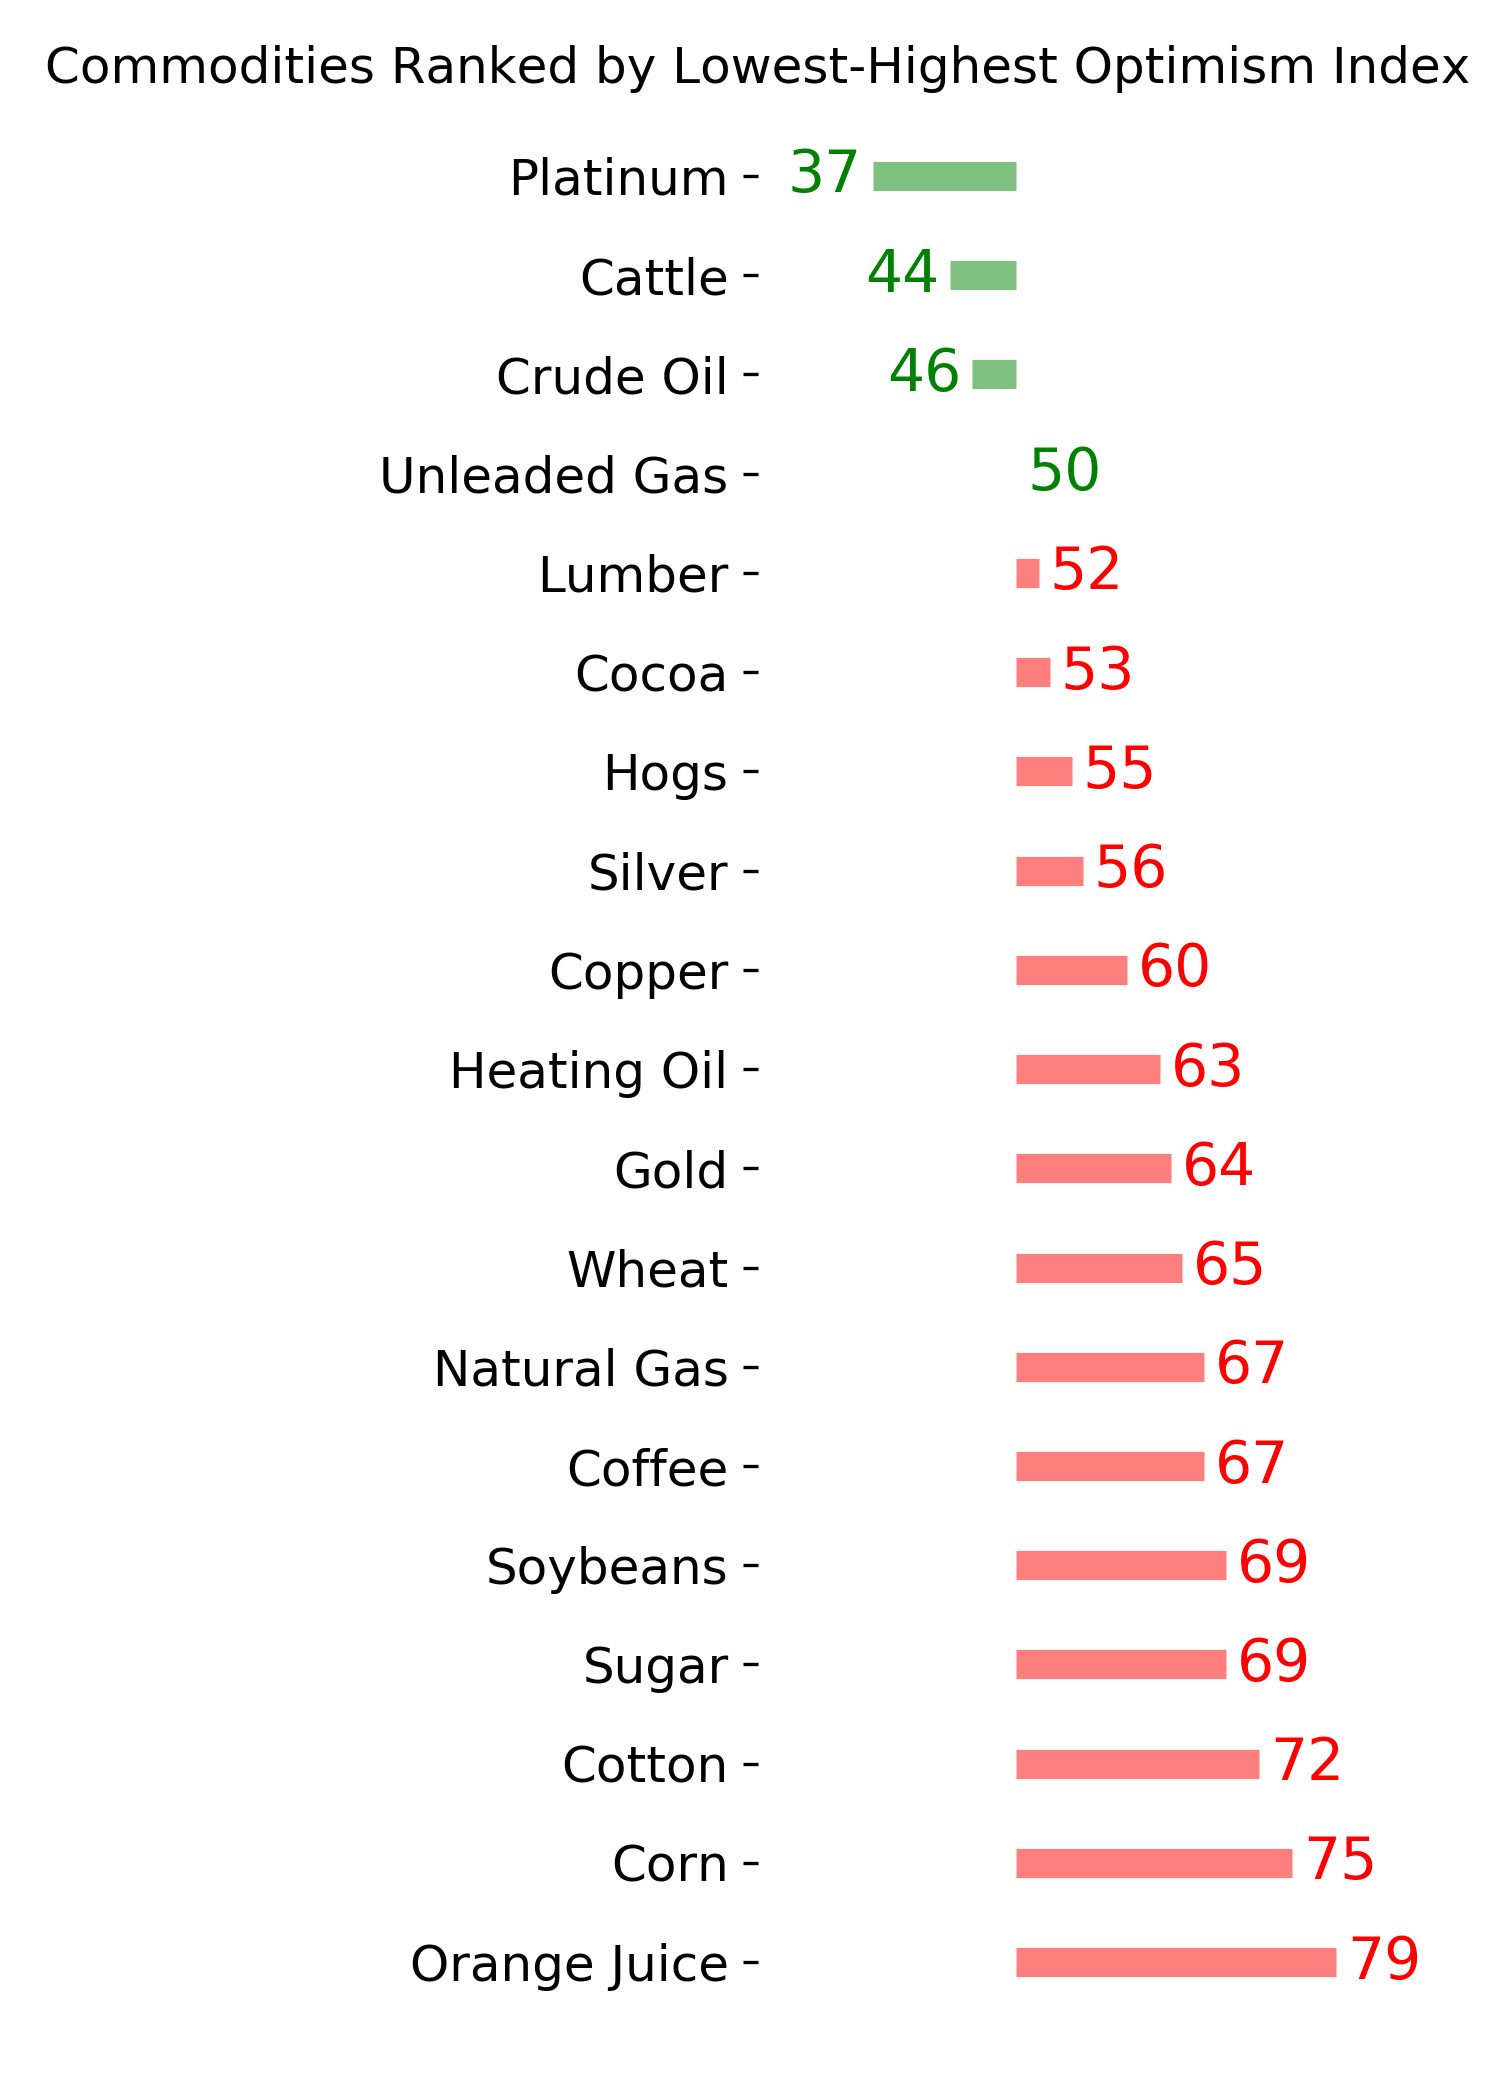
Ranks
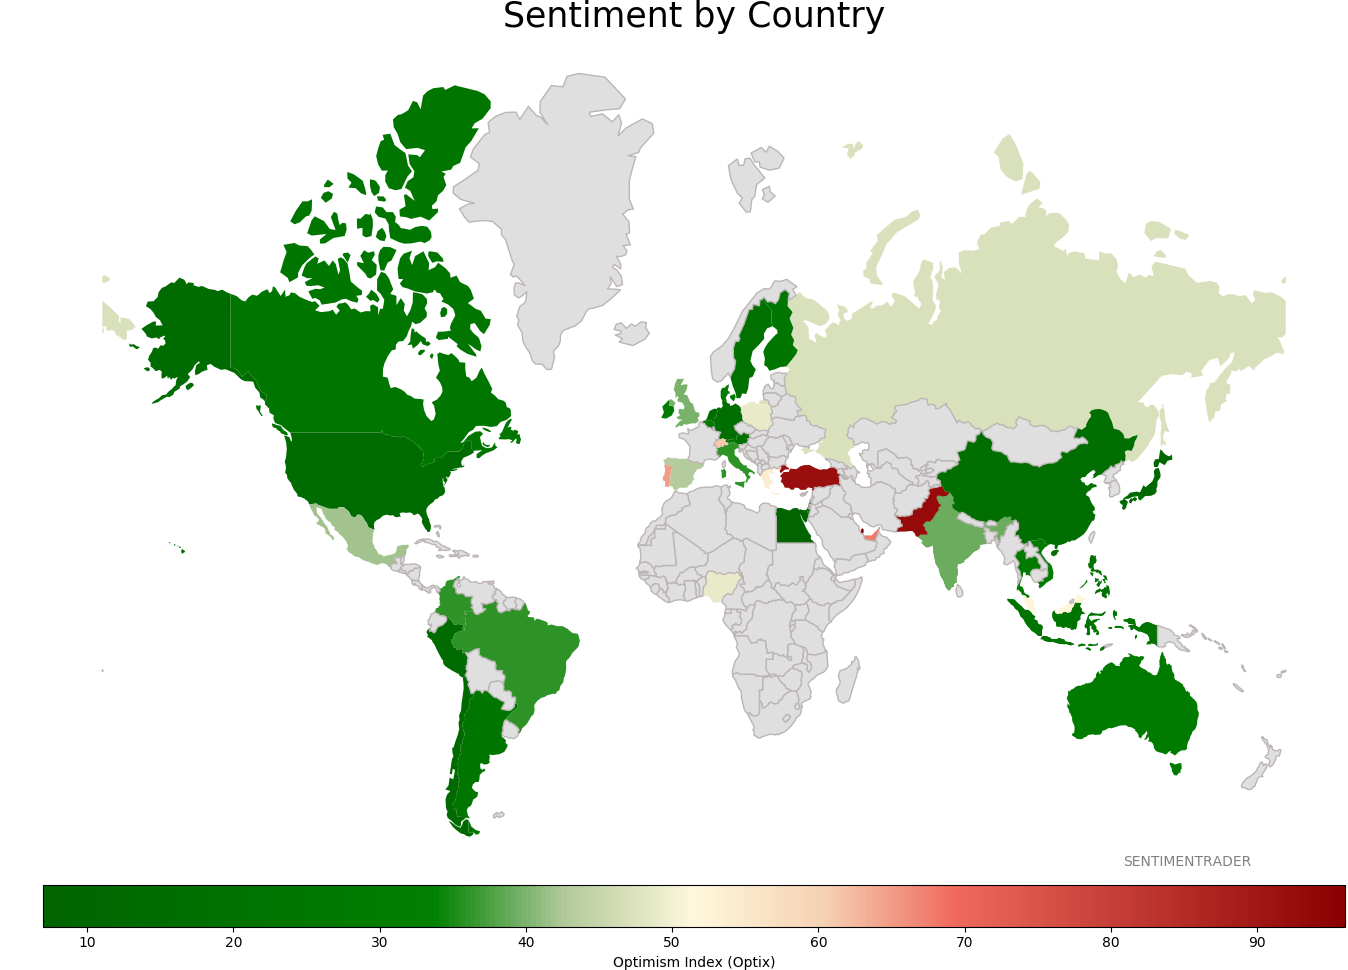
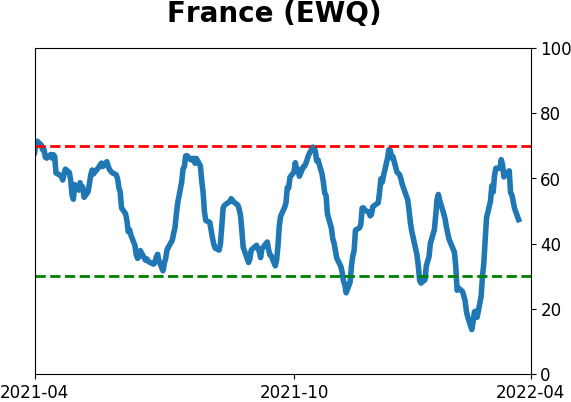
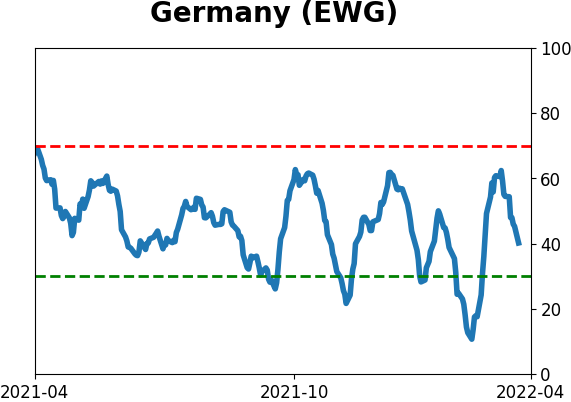
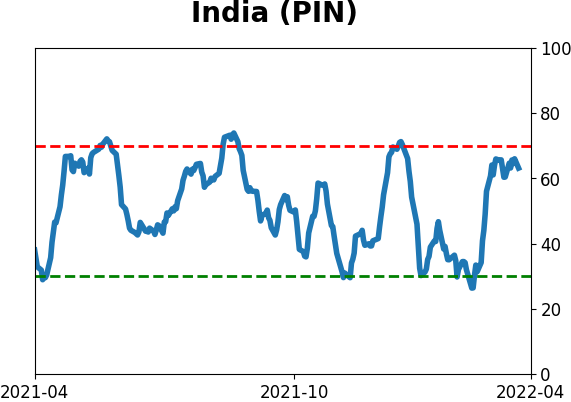
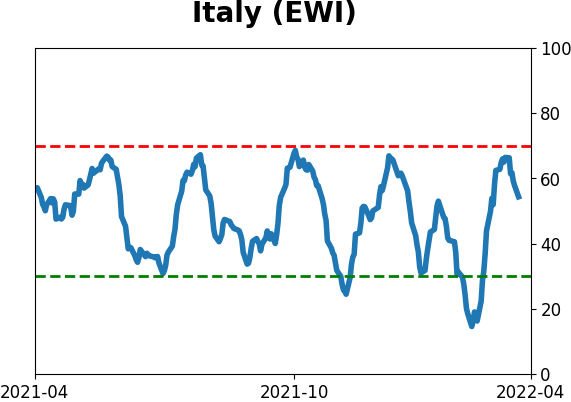
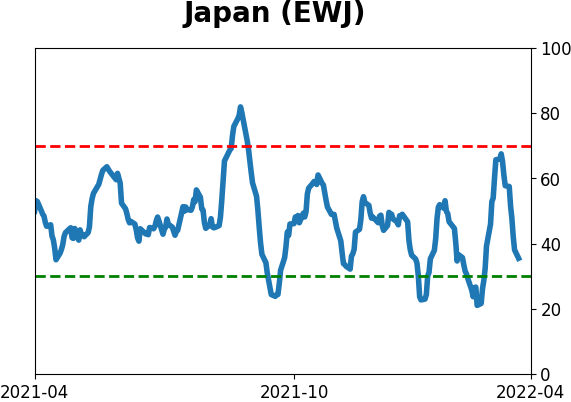
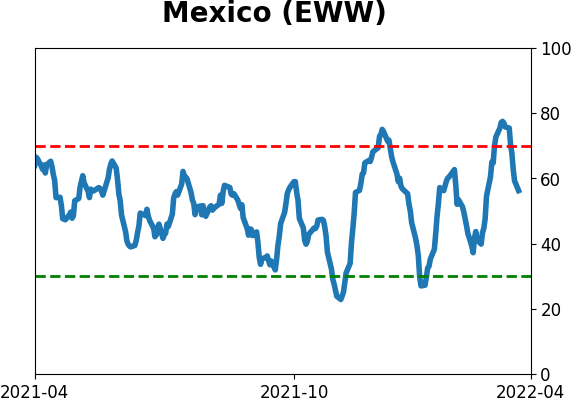
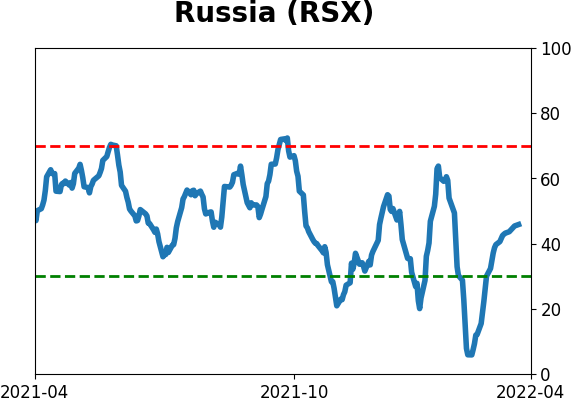
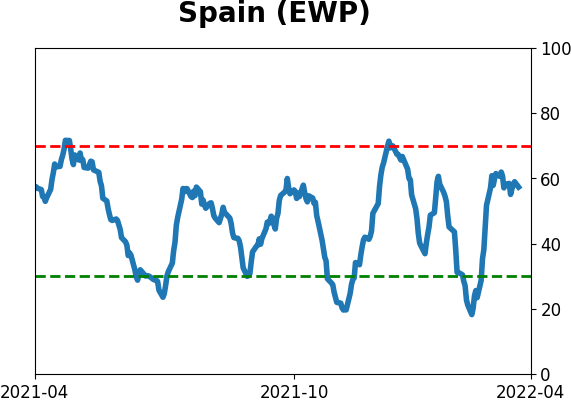
Sentiment Around The World
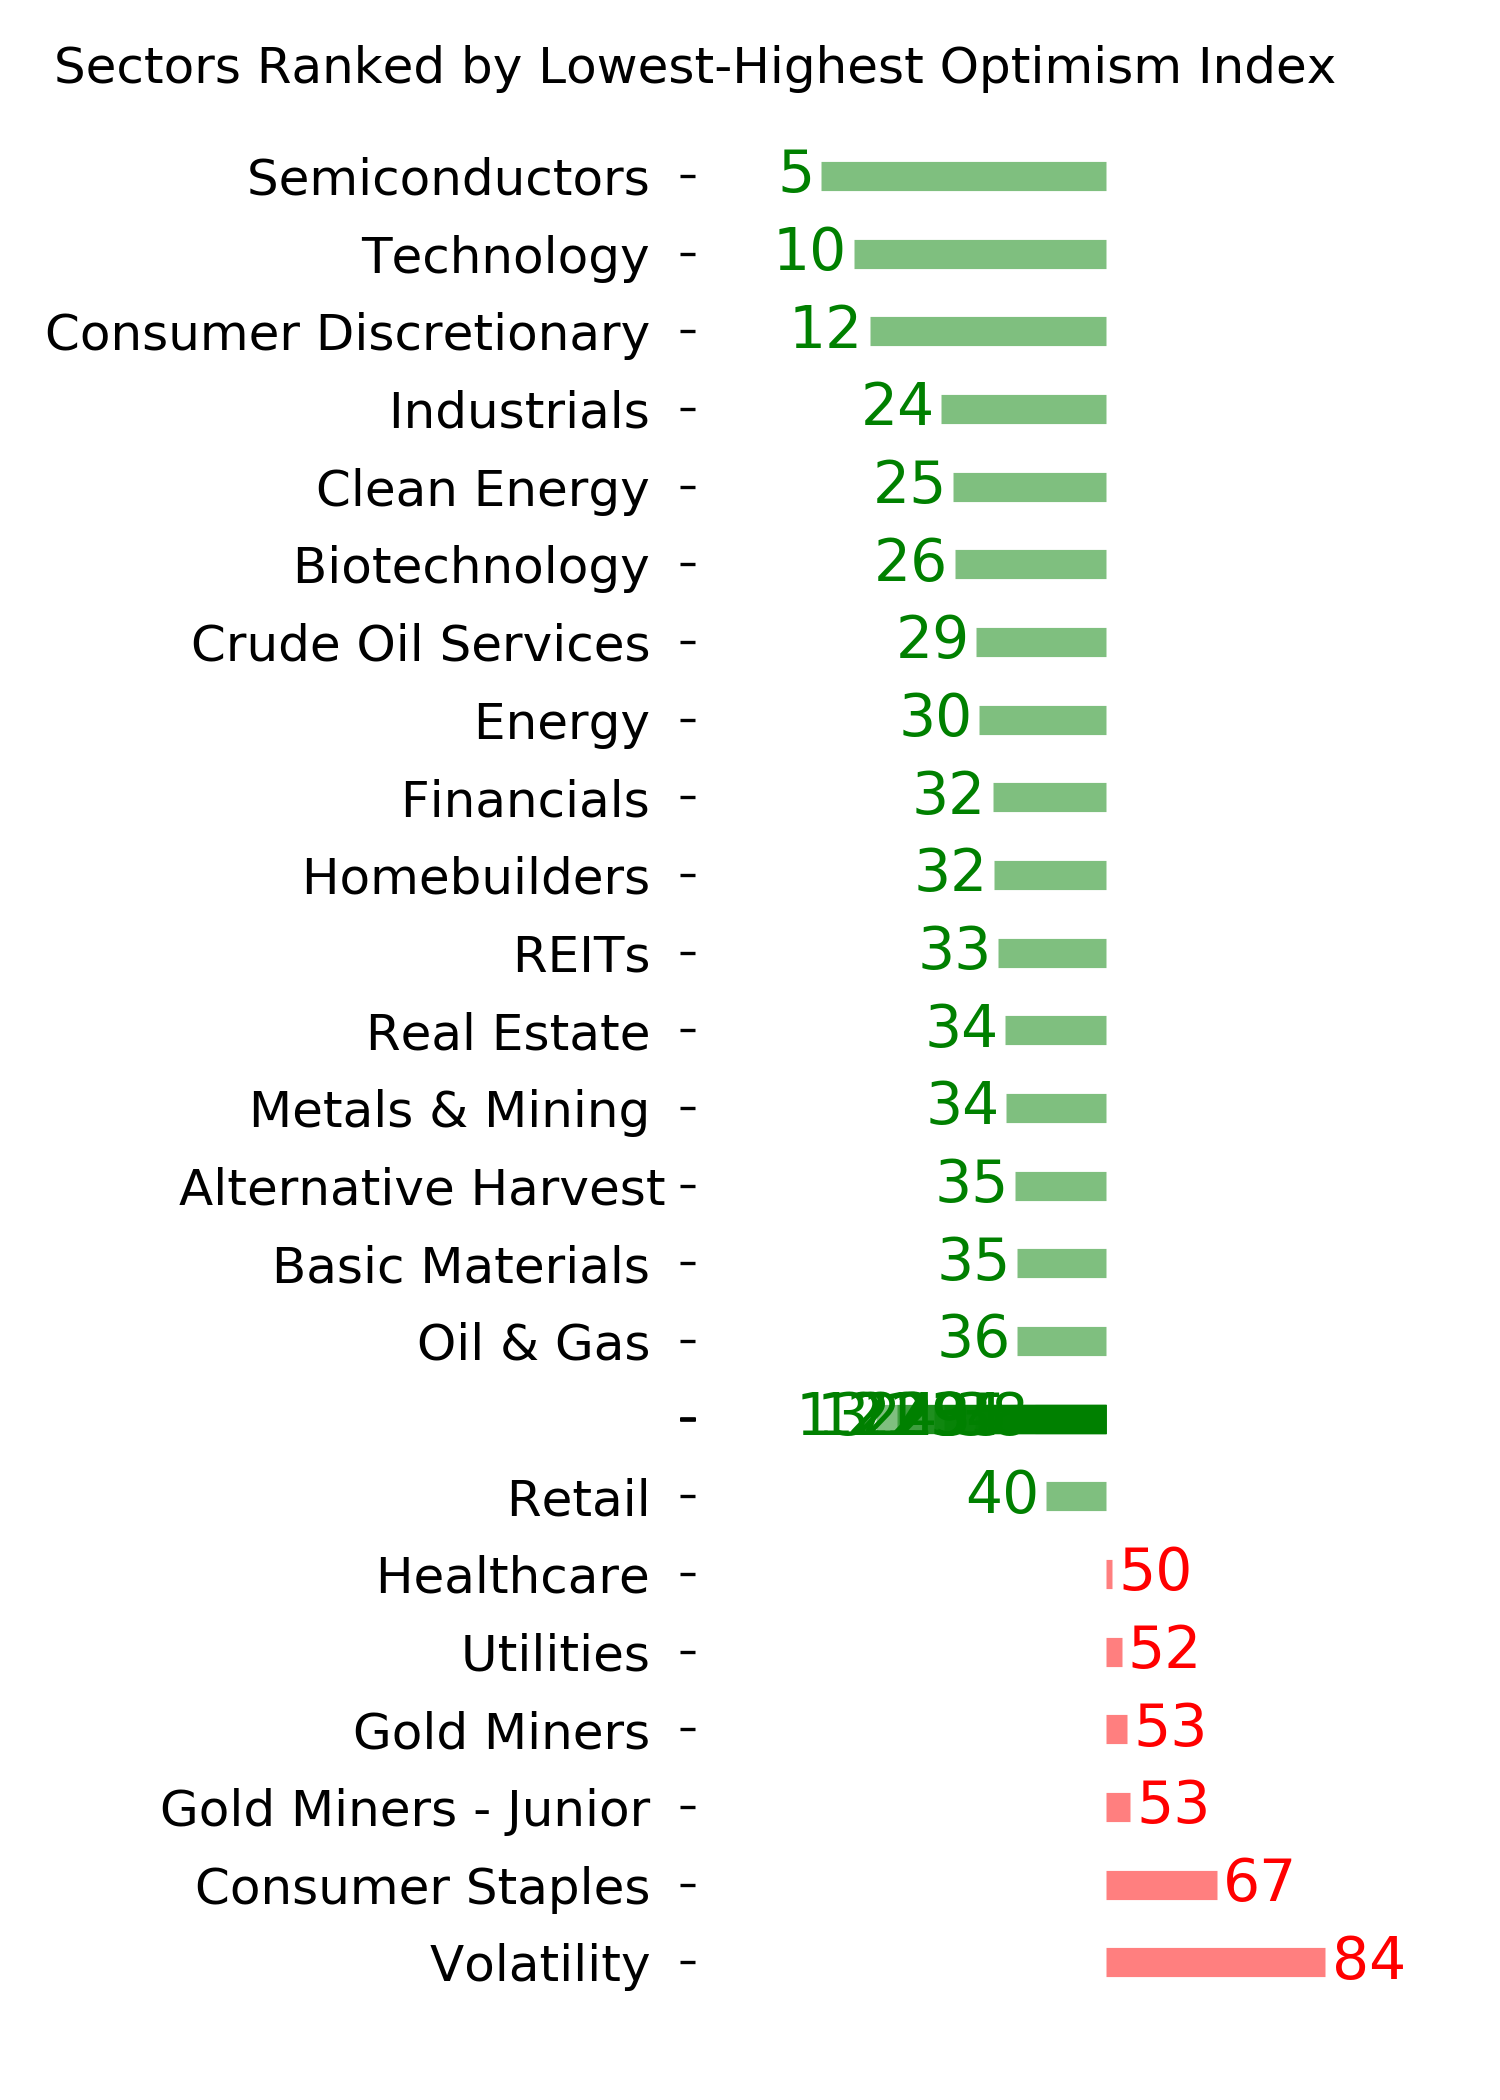
Optimism Index Thumbnails
|
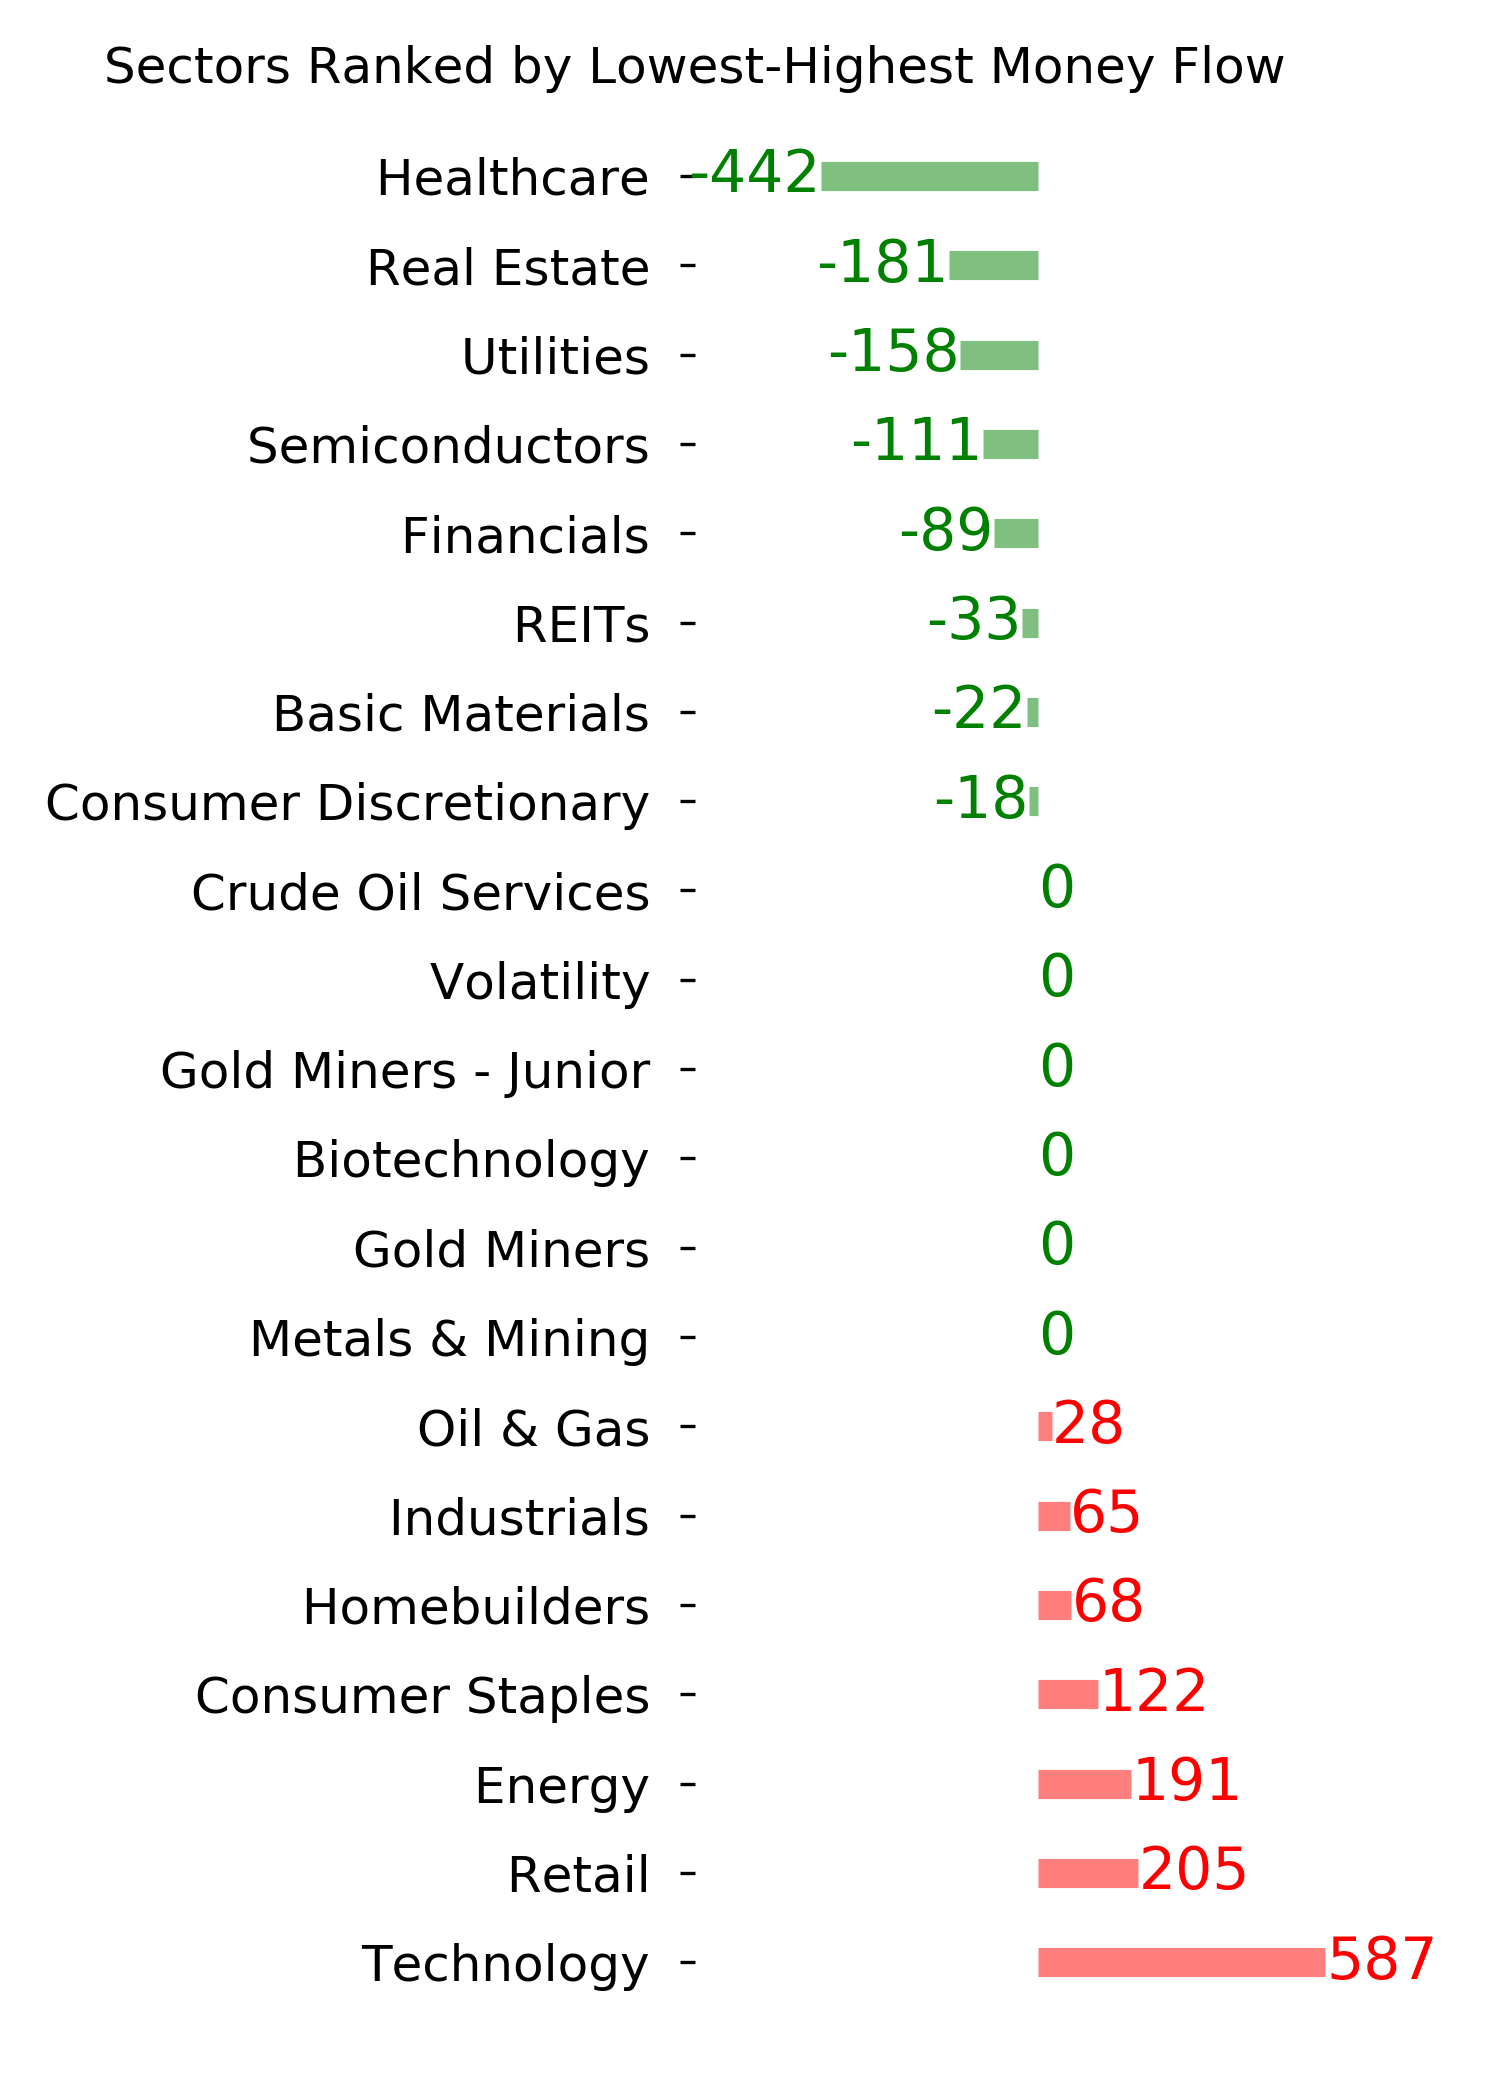
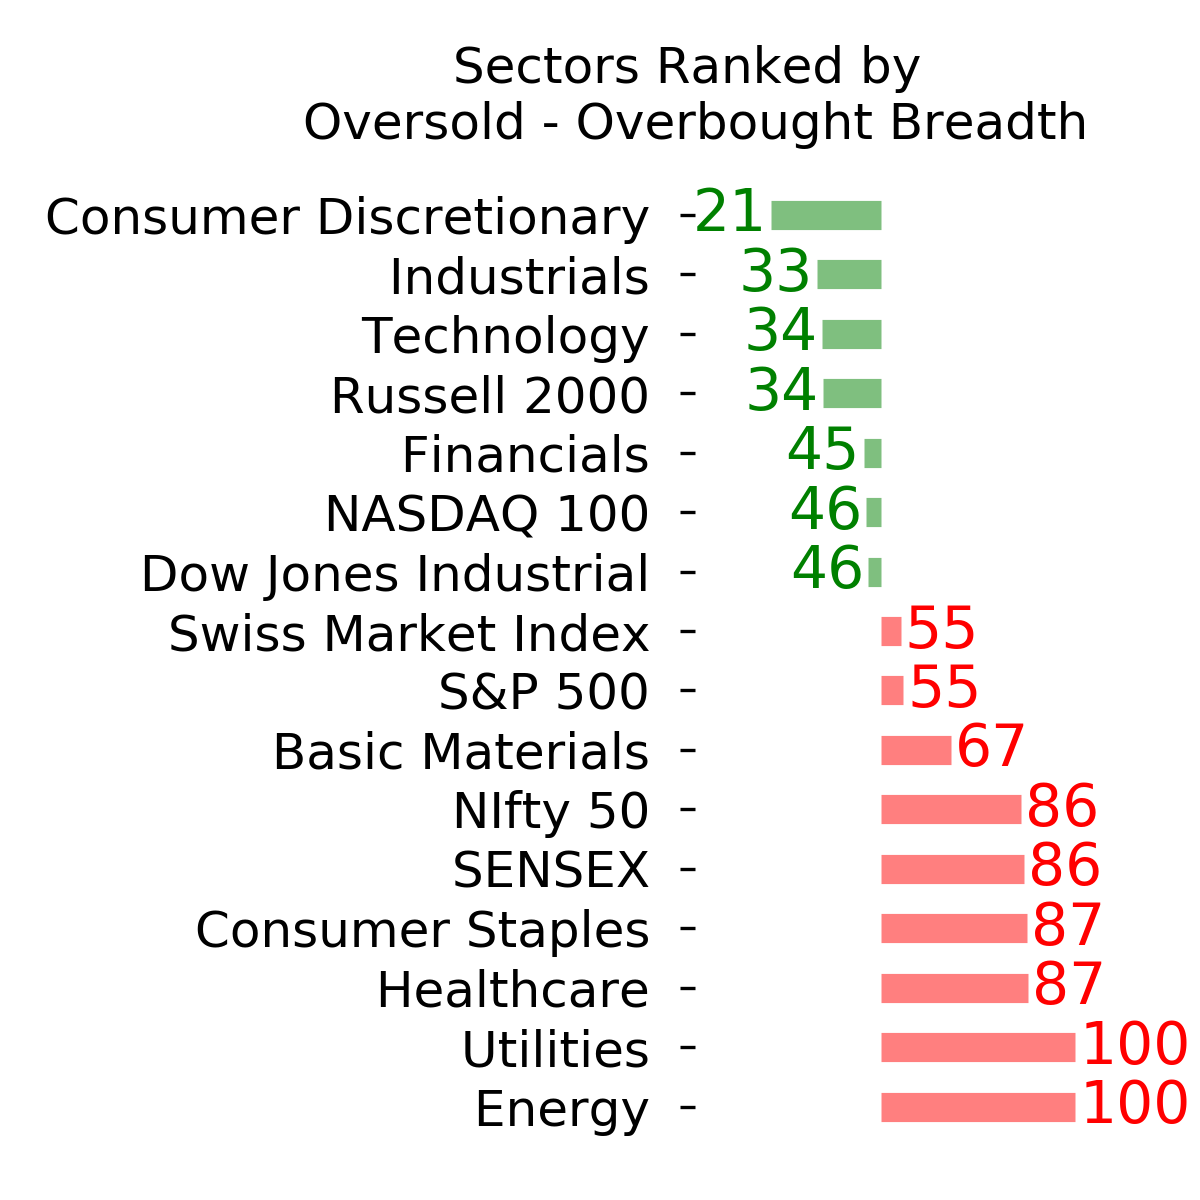
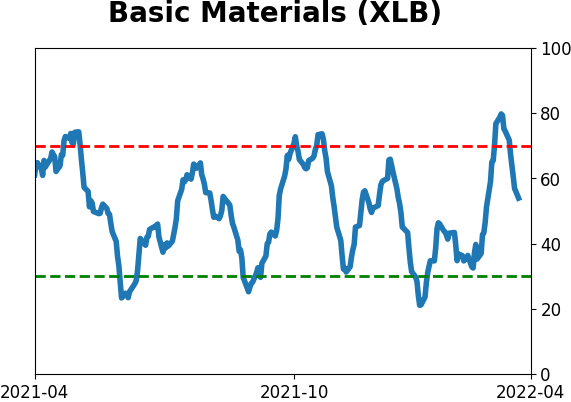
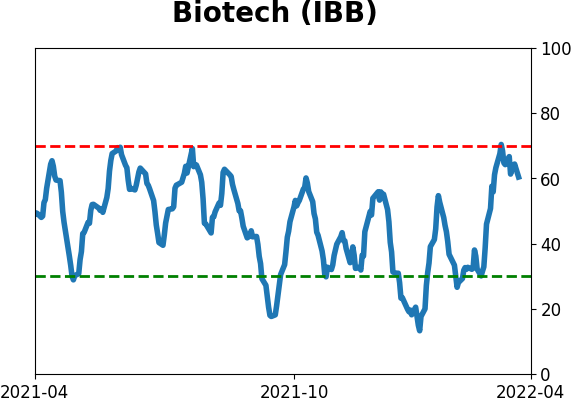
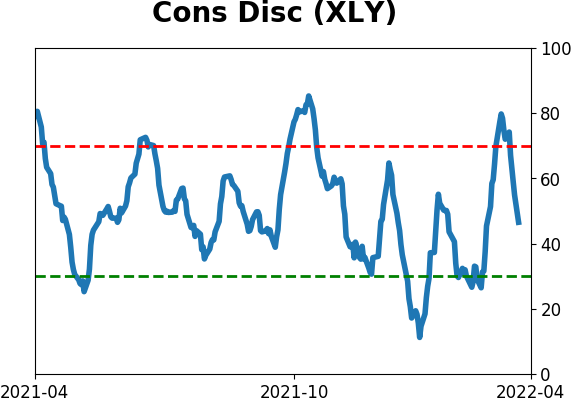
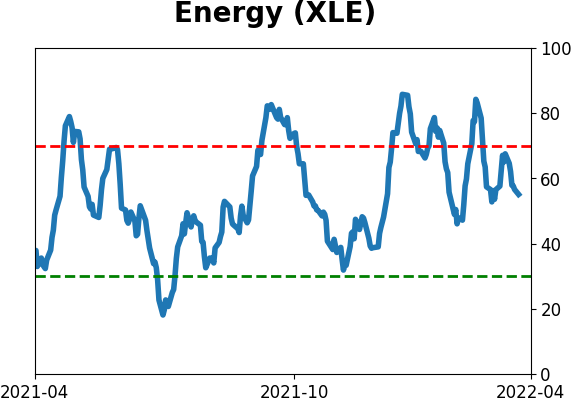
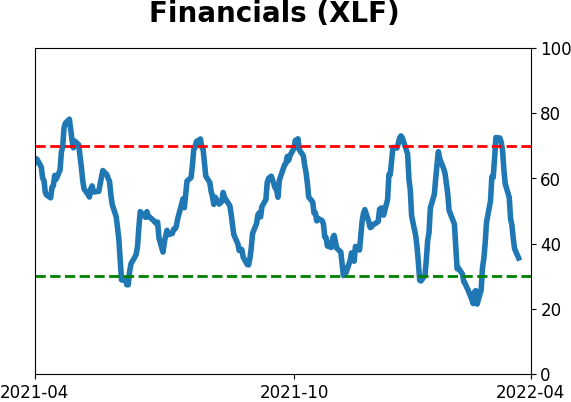
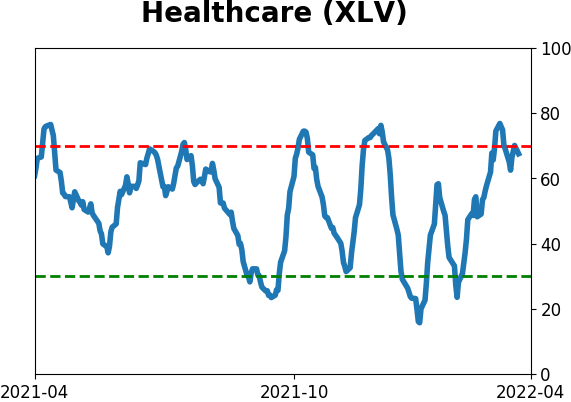
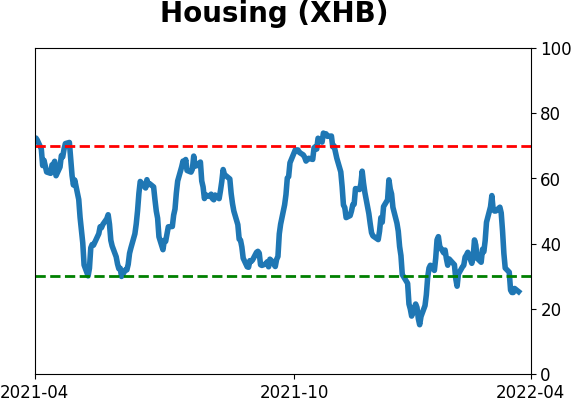
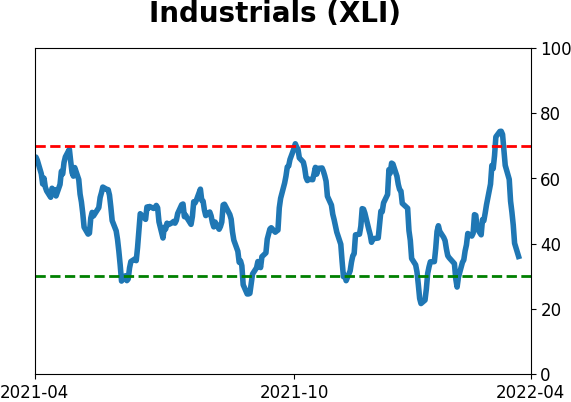
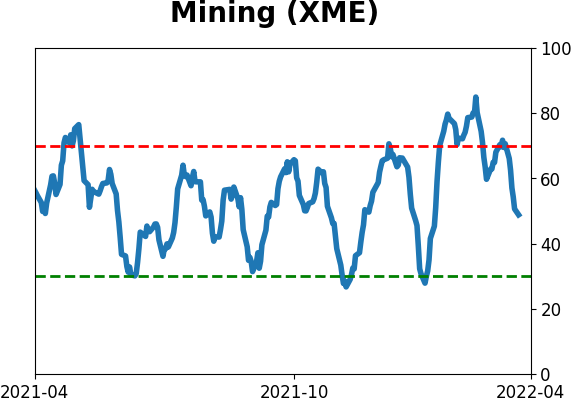
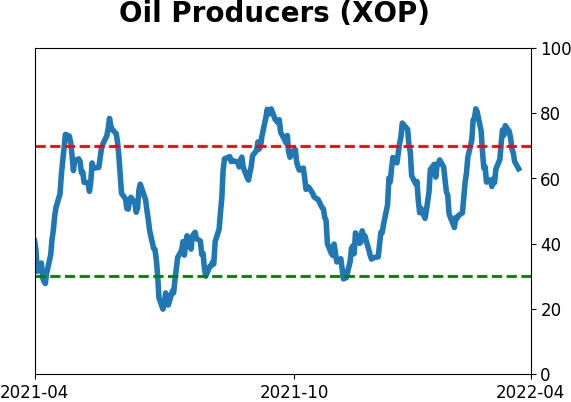
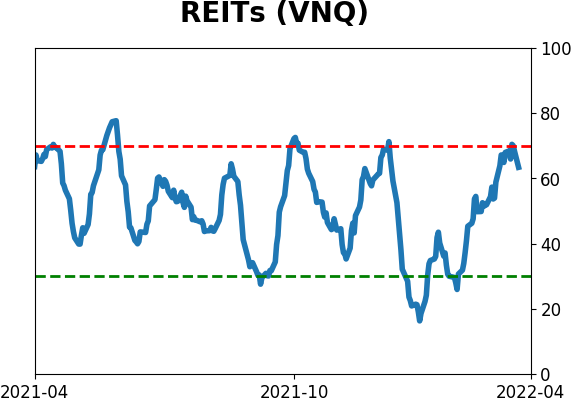
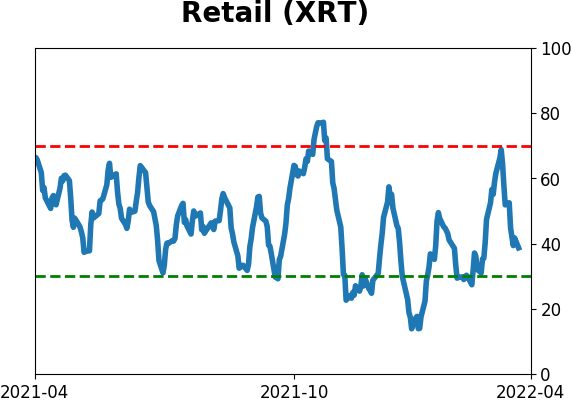
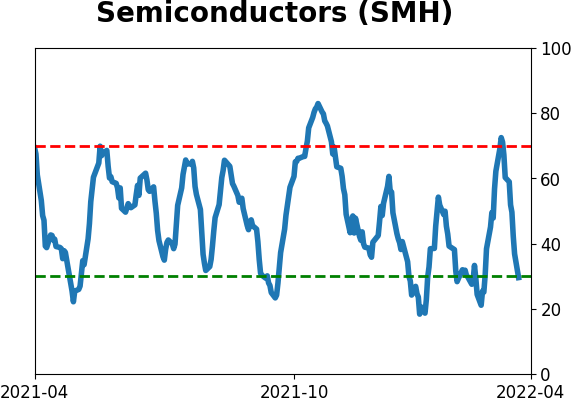
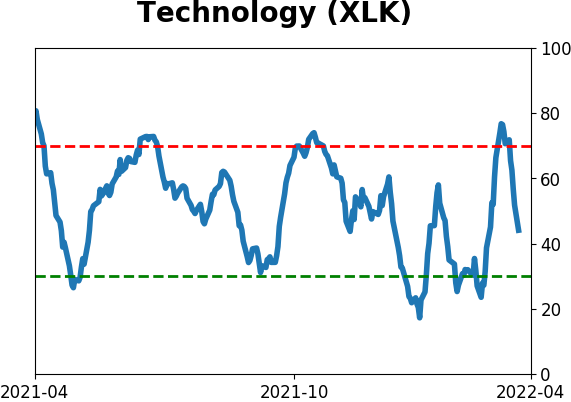
Sector ETF's - 10-Day Moving Average
|
|
|
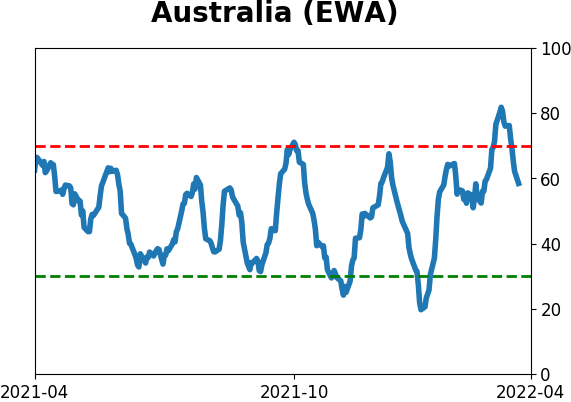
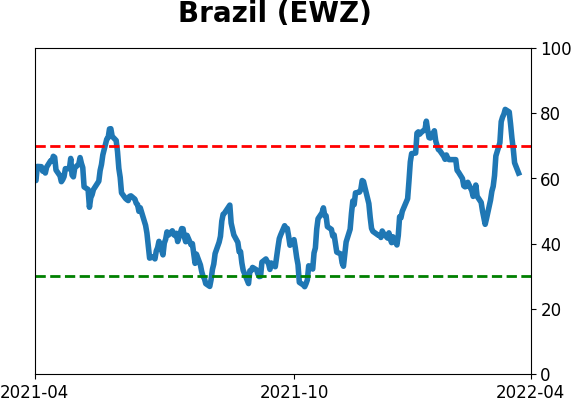
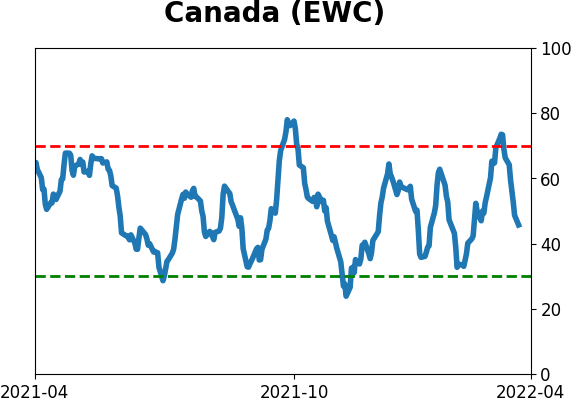
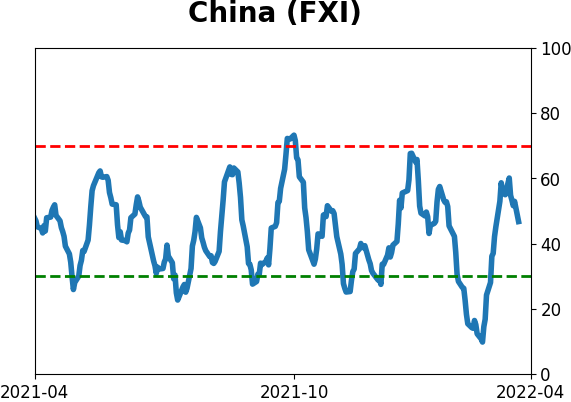
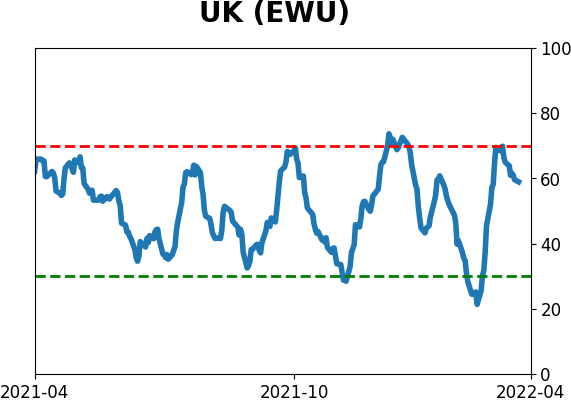
Country ETF's - 10-Day Moving Average
|
|
|
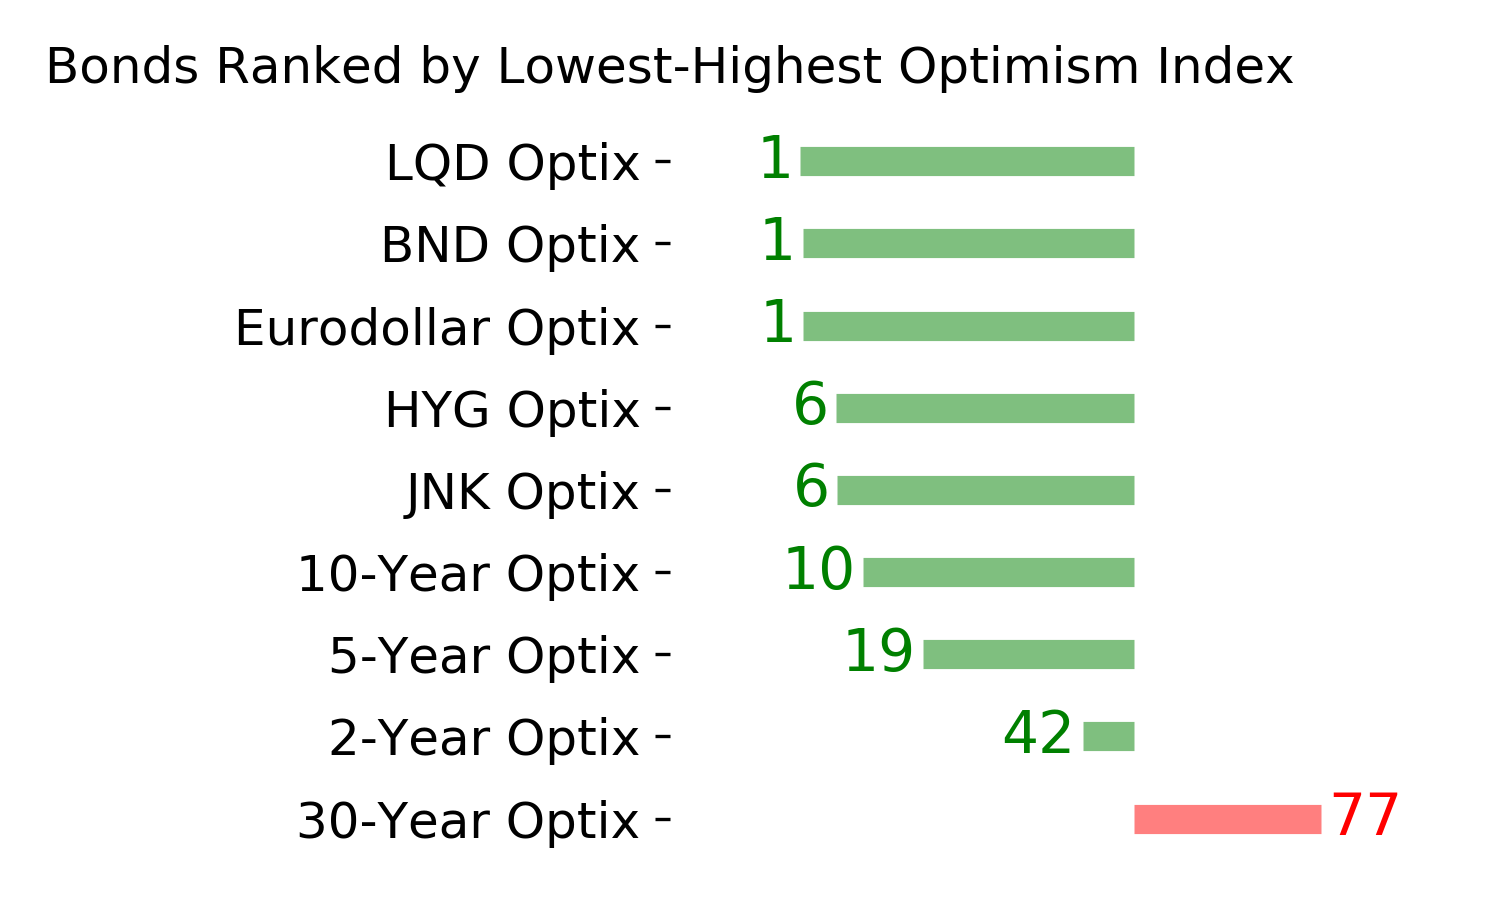
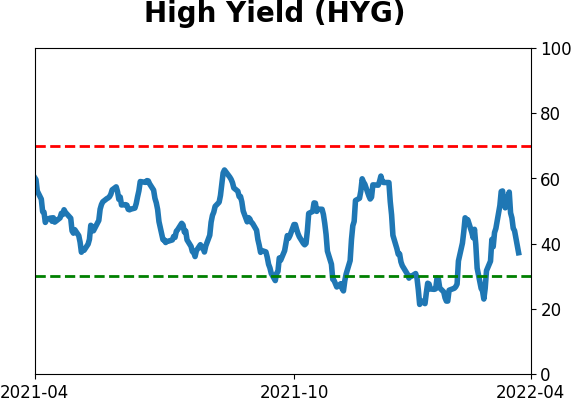
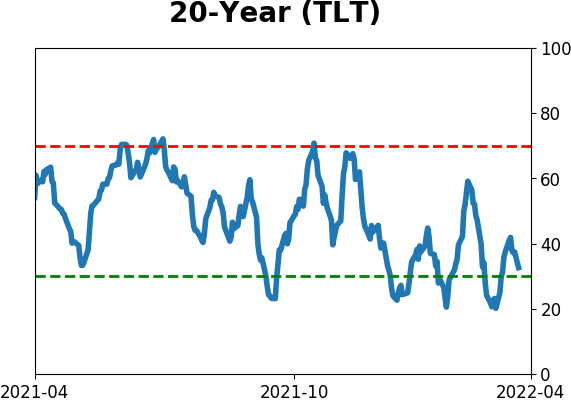
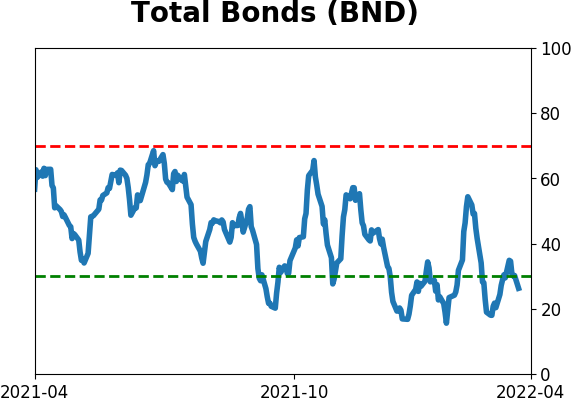
Bond ETF's - 10-Day Moving Average
|
|
|
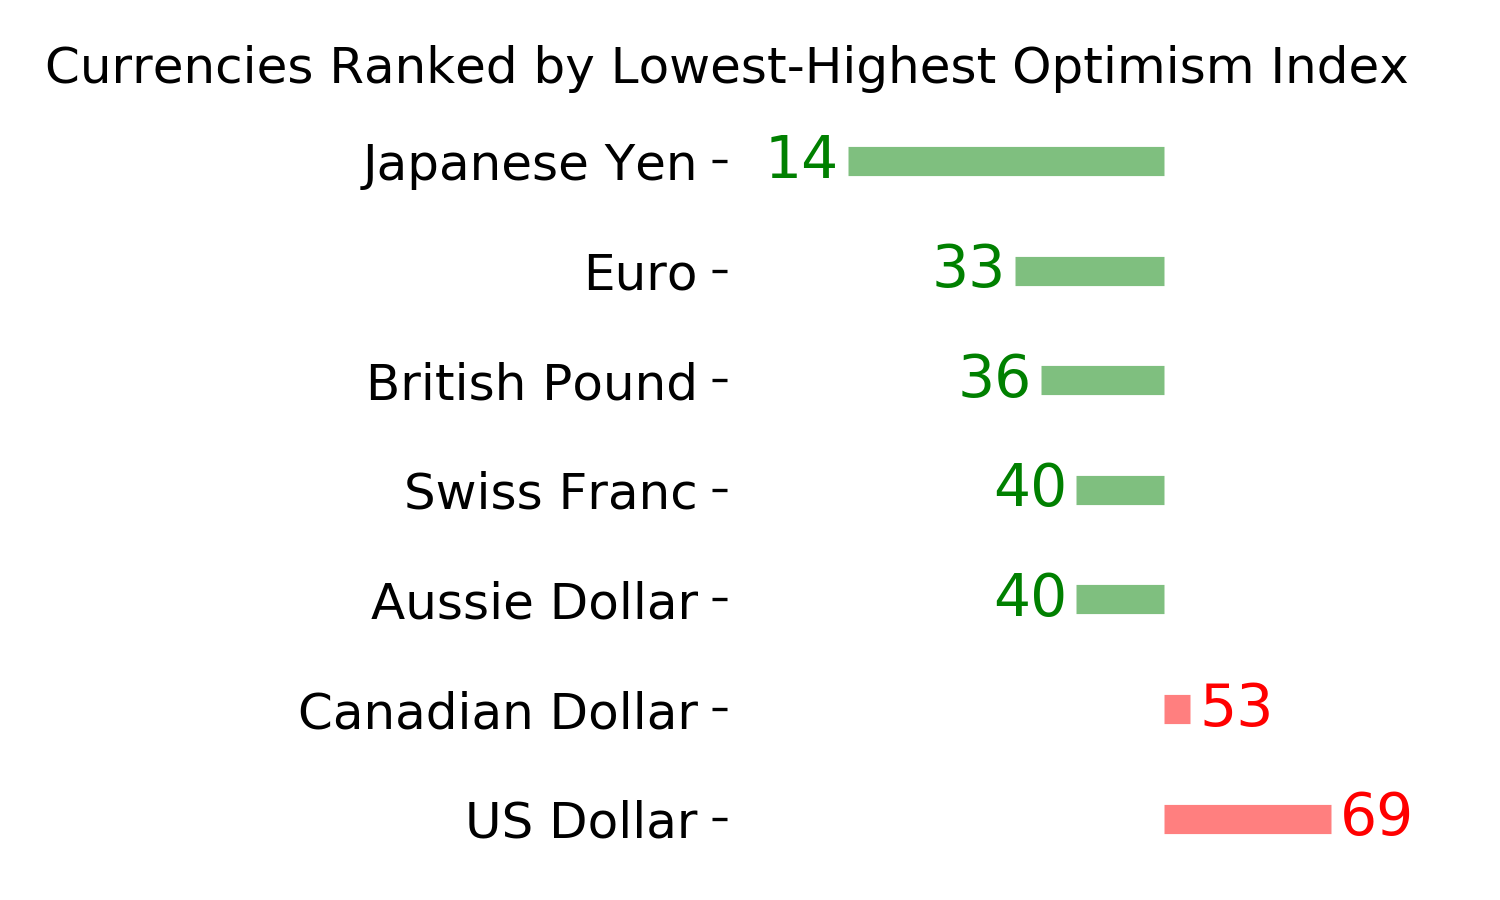
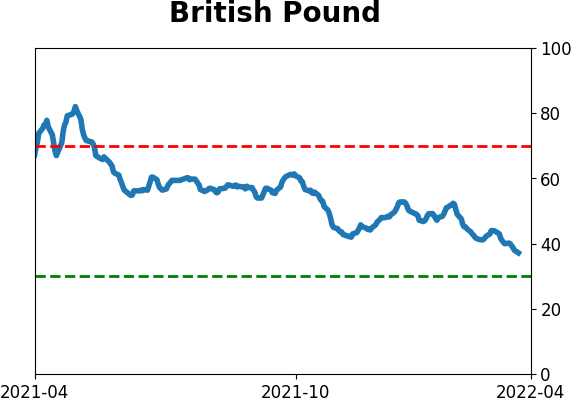
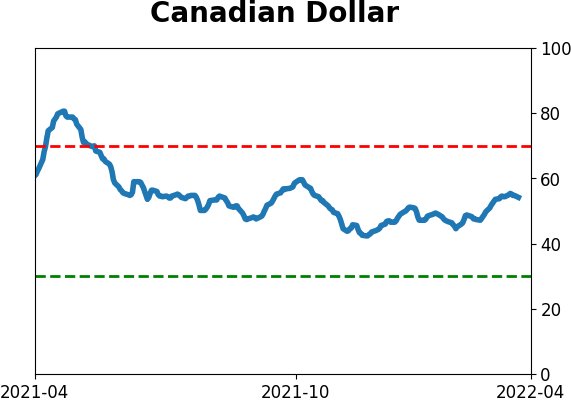
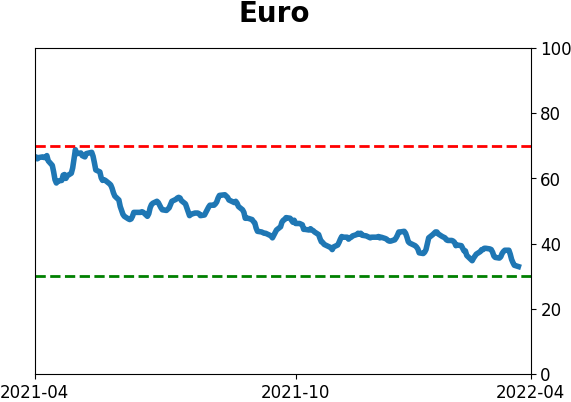
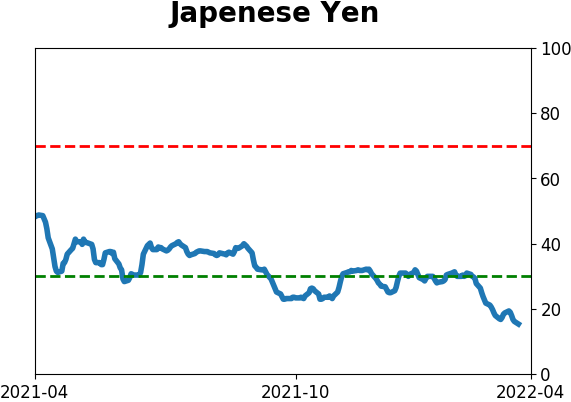
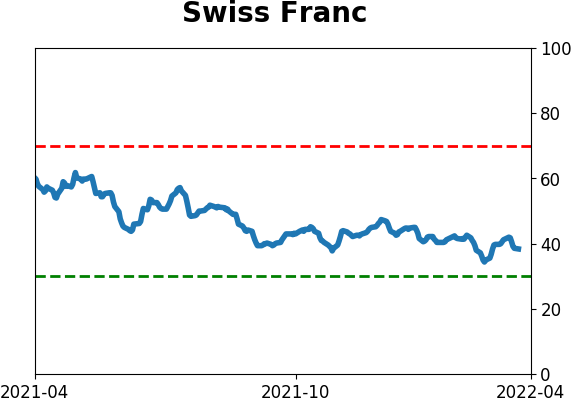
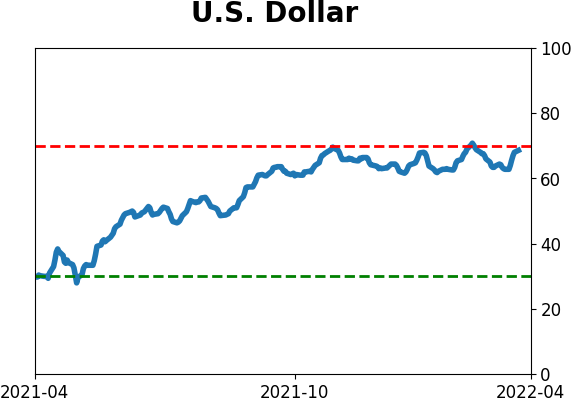
Currency ETF's - 5-Day Moving Average
|
|
|
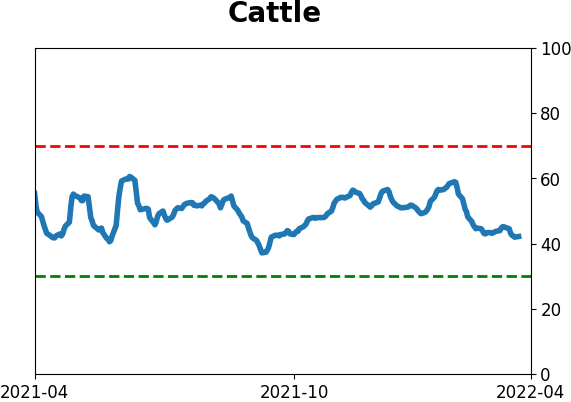
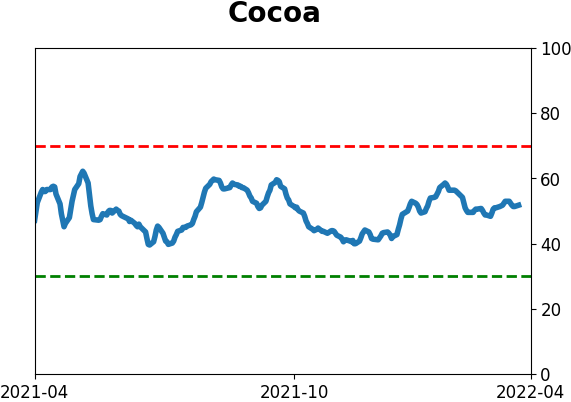
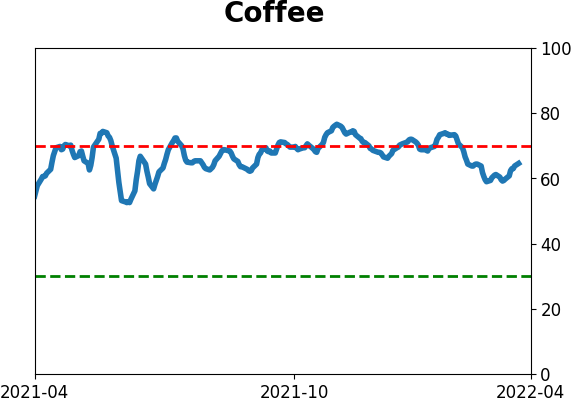
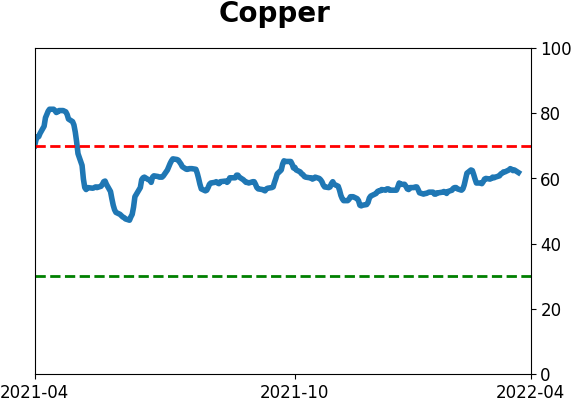
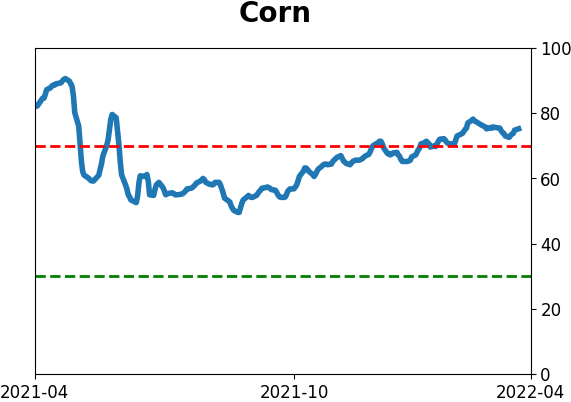
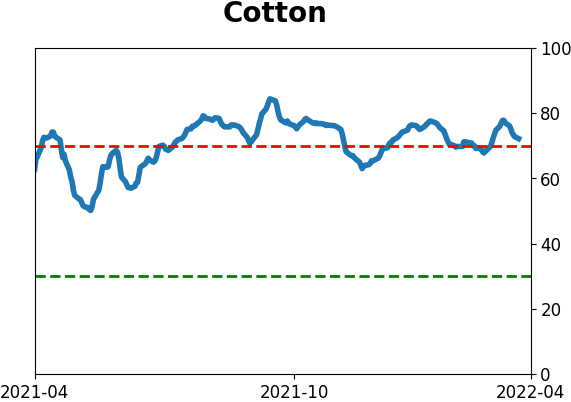
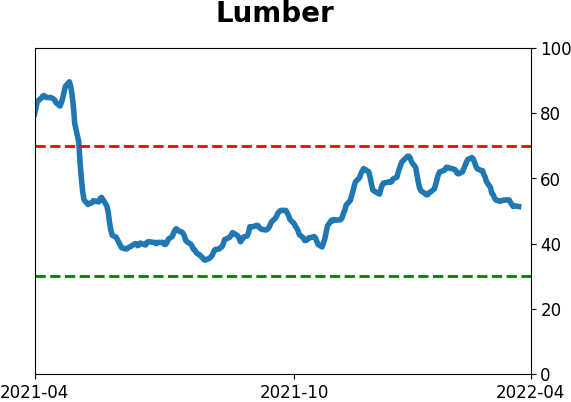
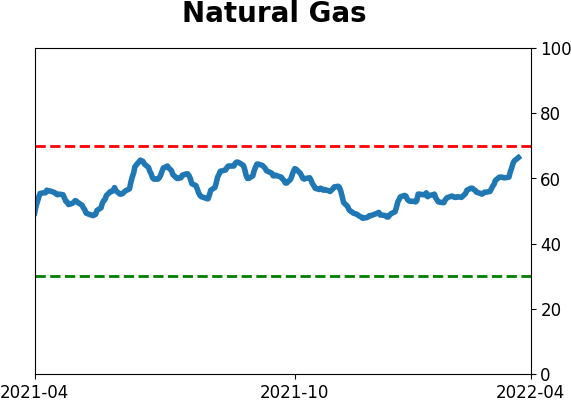
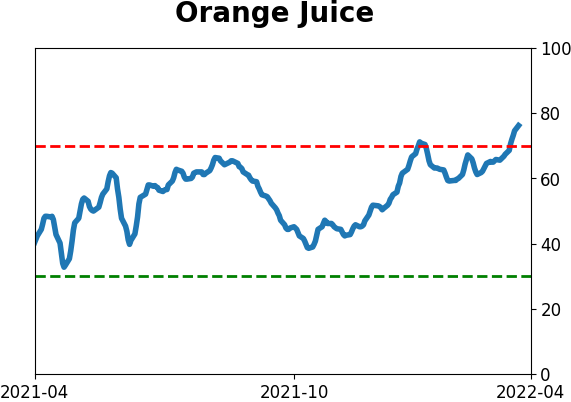
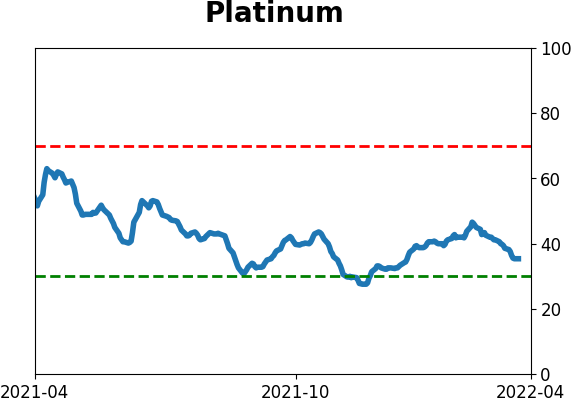
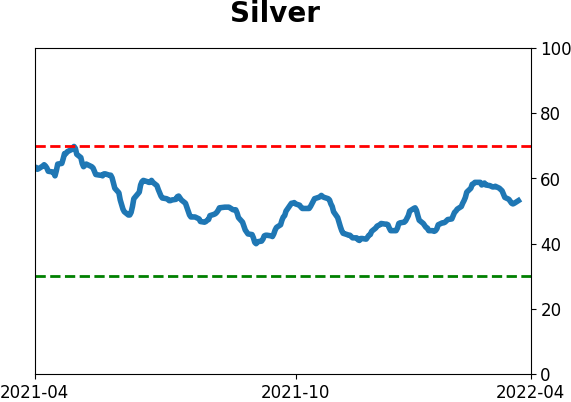
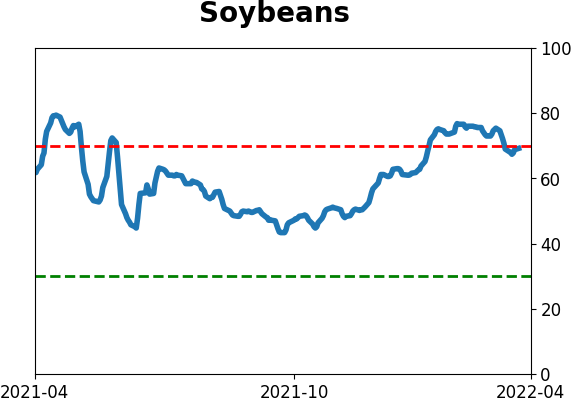
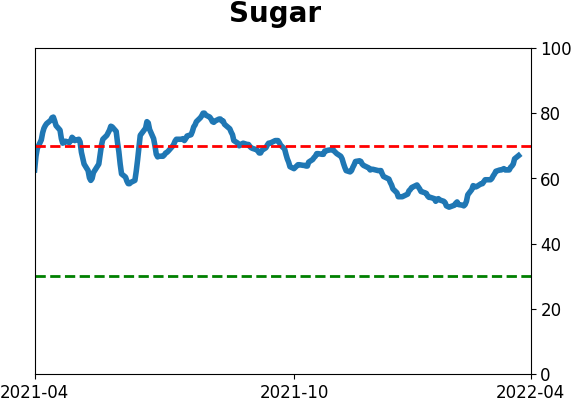
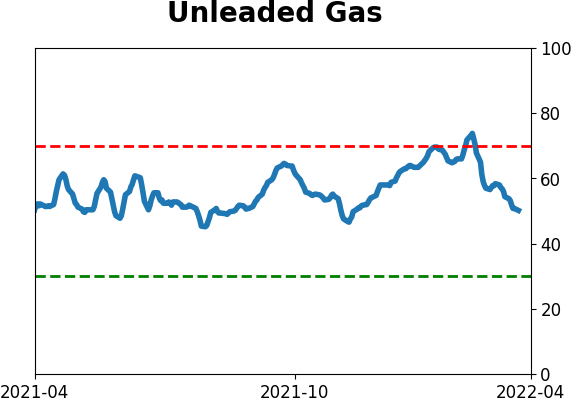
Commodity ETF's - 5-Day Moving Average
|
|