Headlines
|
|
Historic trend persistence in the average stock:
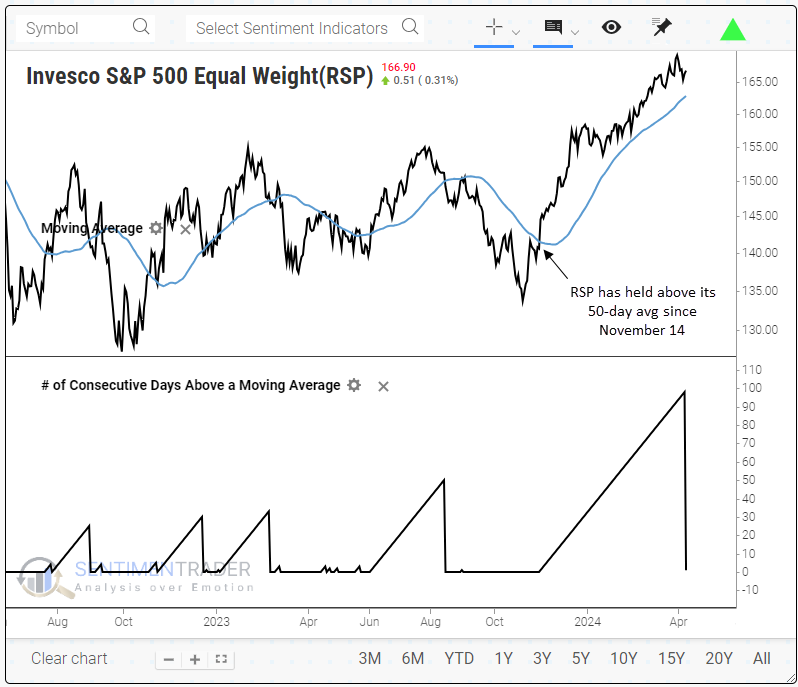
The S&P 500 has been doing very well. Both versions of it - the common one that weights constituent stocks based on market capitalization and the equal-weight one that treats each stock equally. The equal-weight version just reached 100 days holding above its 50-day moving average, which tends to lead to further gains.
|
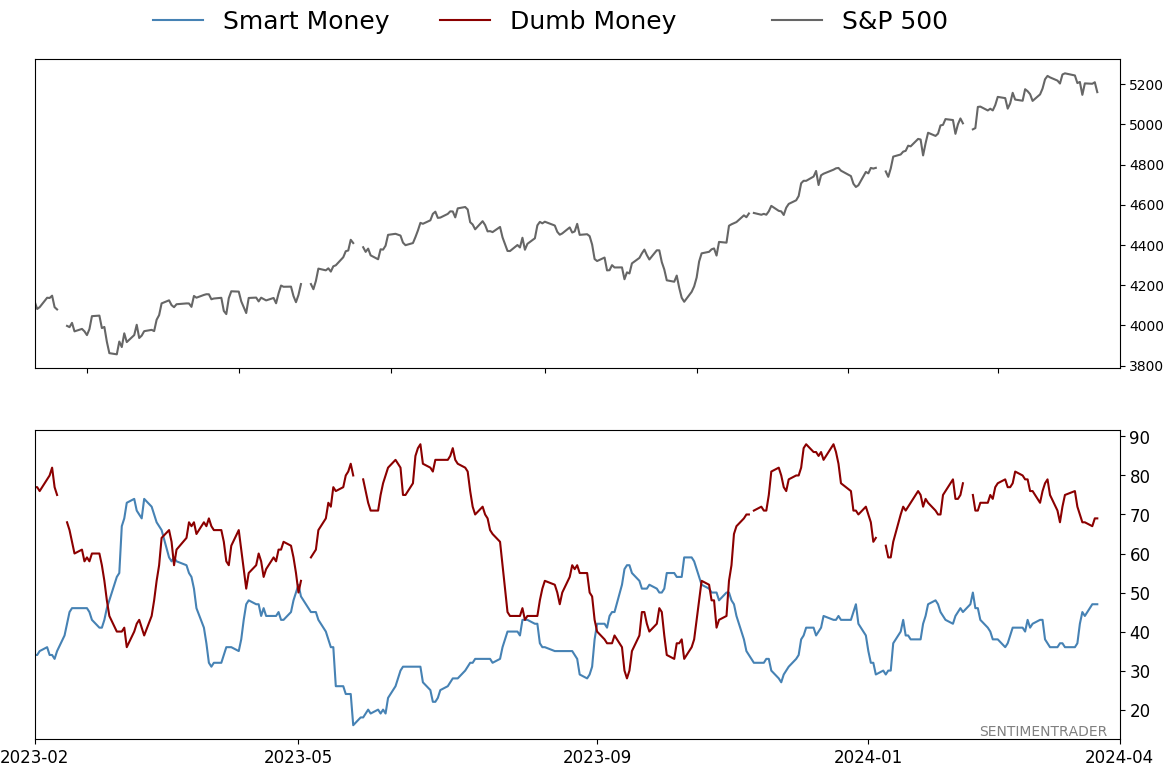
Smart / Dumb Money Confidence
|
Smart Money Confidence: 47%
Dumb Money Confidence: 69%
|
|
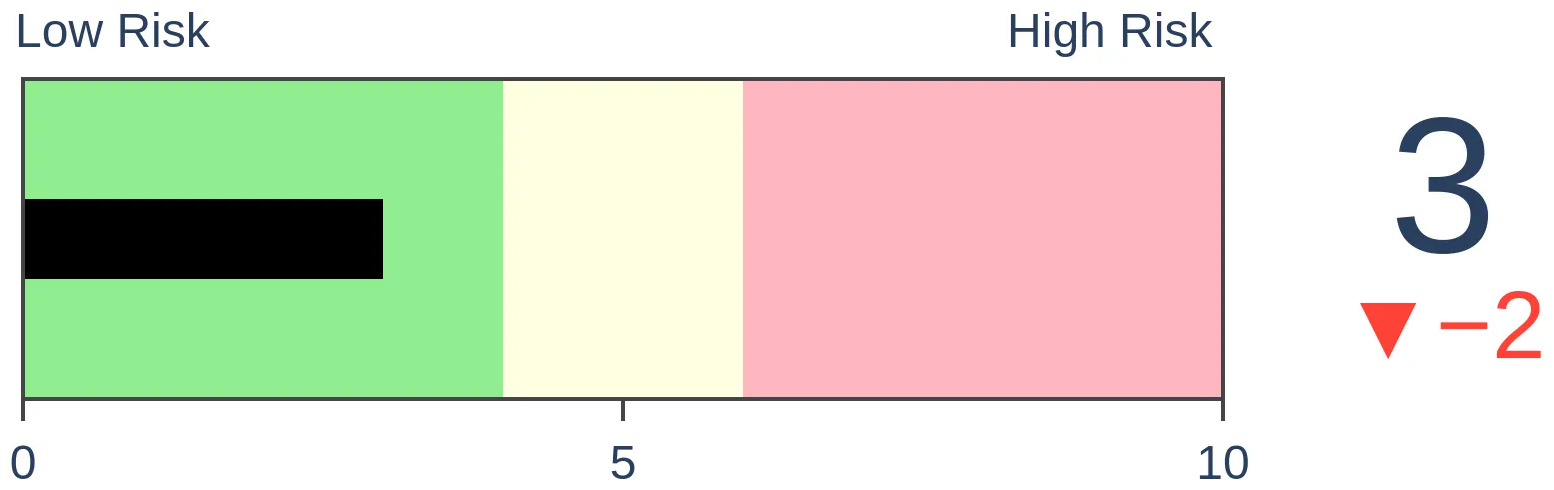
Risk Levels
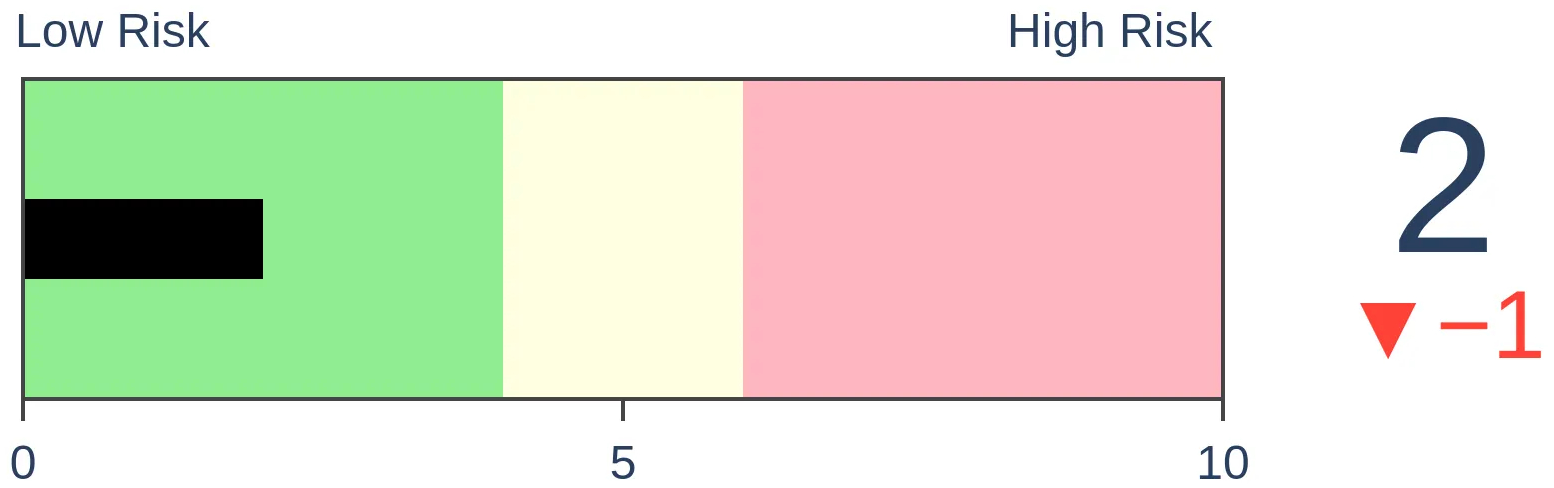
Stocks Short-Term
|
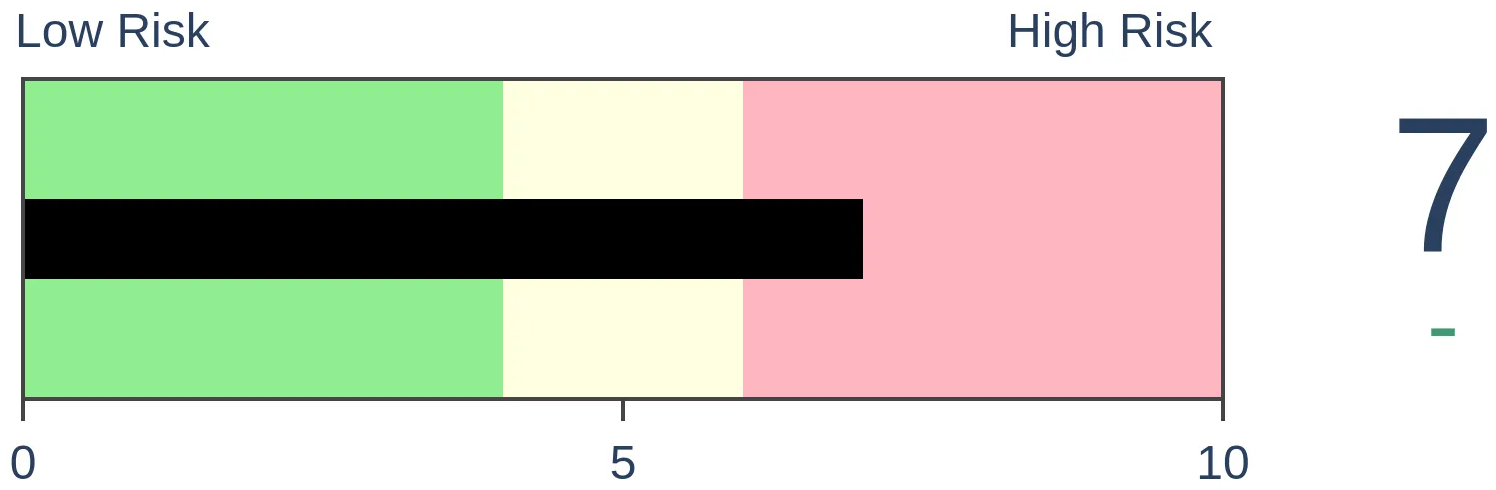
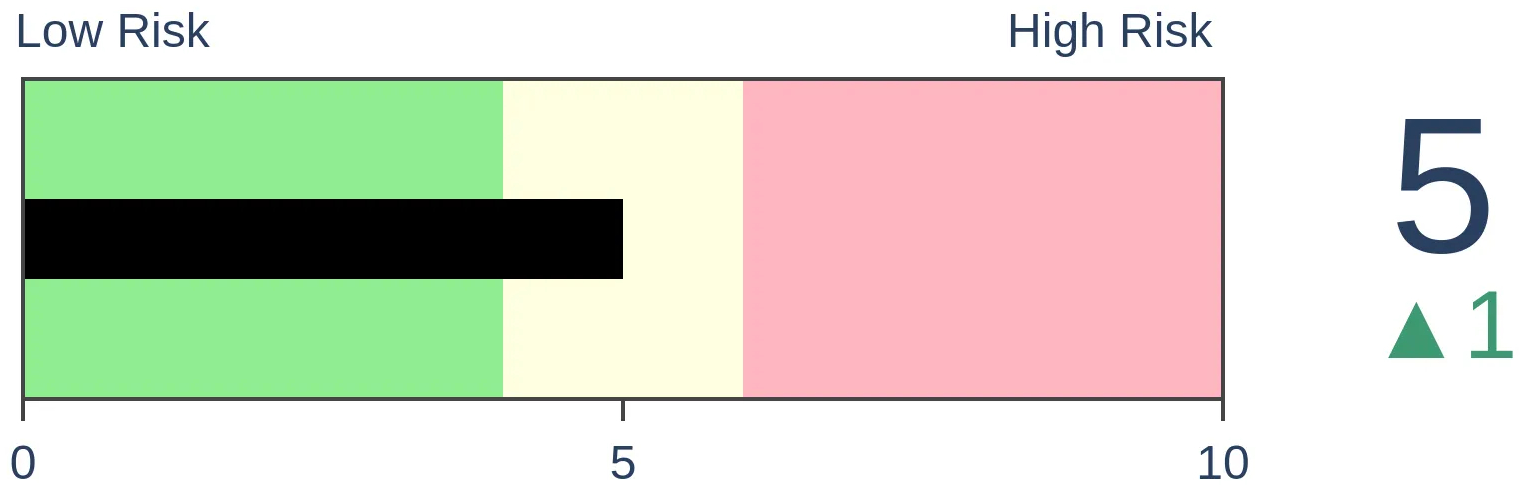
Stocks Medium-Term
|
|
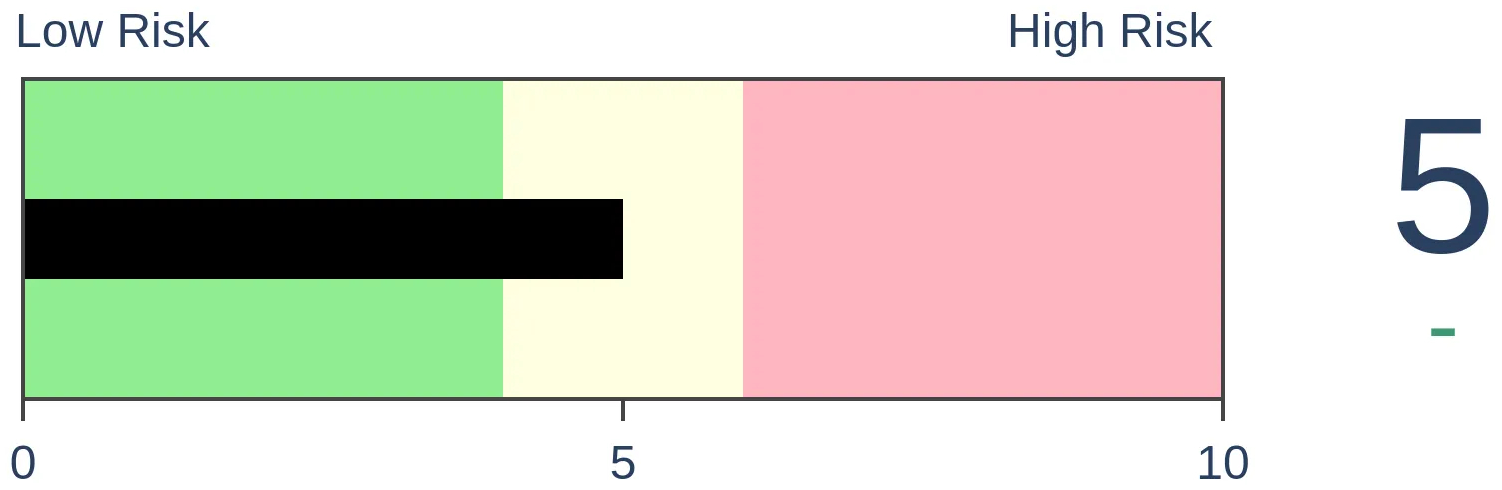
Bonds
|
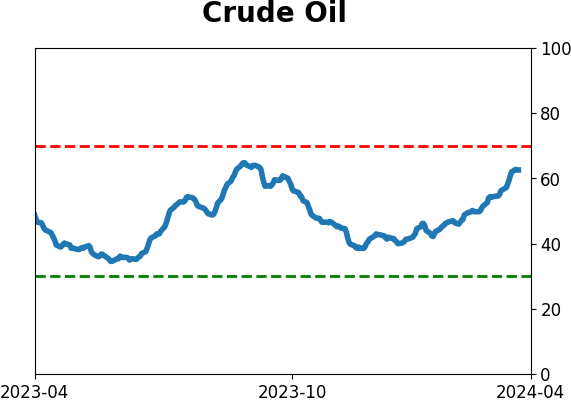
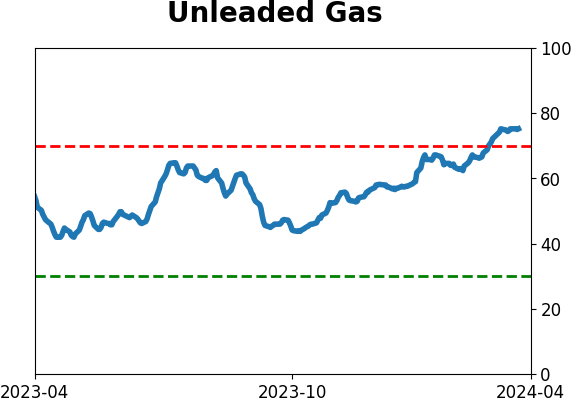
Crude Oil
|
|
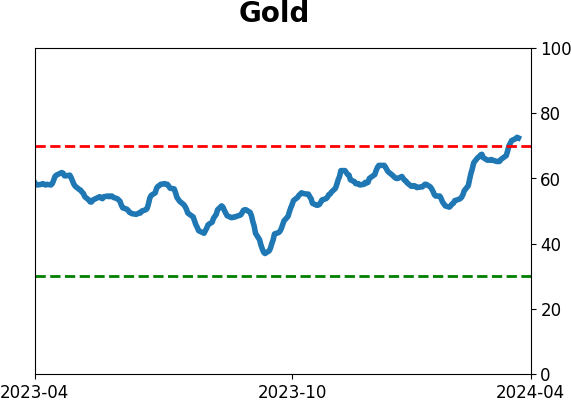
Gold

|
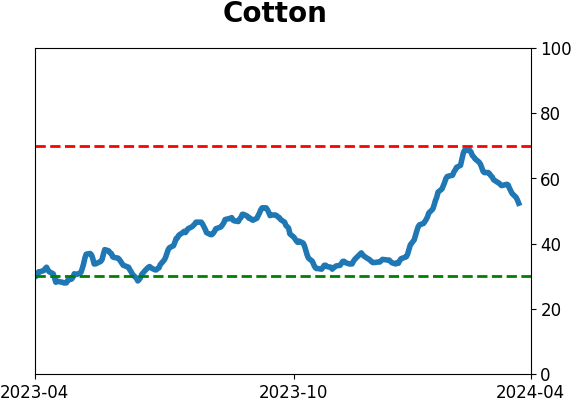
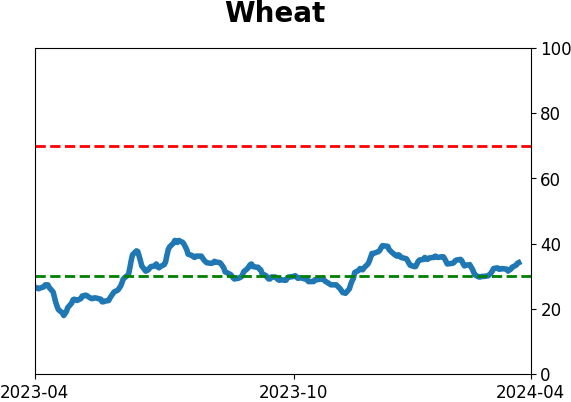
Agriculture
|
|
Research
By Jason Goepfert
BOTTOM LINE
The S&P 500 has been doing very well. Both versions of it - the common one that weights constituent stocks based on market capitalization and the equal-weight one that treats each stock equally. The equal-weight version just reached 100 days holding above its 50-day moving average, which tends to lead to further gains.
FORECAST / TIMEFRAME
None
|
Key points:
- The equal-weight version of the S&P 500 has held above its 50-day moving average for 100 consecutive sessions
- That's the 5th-longest streak in nearly 30 years and among the longest since 1957
- Persistent medium-term uptrends tend to lead to further gains over the next 2-3 months
The average S&P 500 stock is doing well, thank you very much
There has been no shortage of remarkable displays of momentum over the past few months. We've mentioned them repeatedly in recent months, most commonly for the most benchmarked index in the world, the S&P 500.
That index has shown monster momentum, largely thanks to a few behemoth stocks that have dragged the index along for the ride. It's not quite that simple, though - even the equal-weight version of the index has shown remarkable persistence.
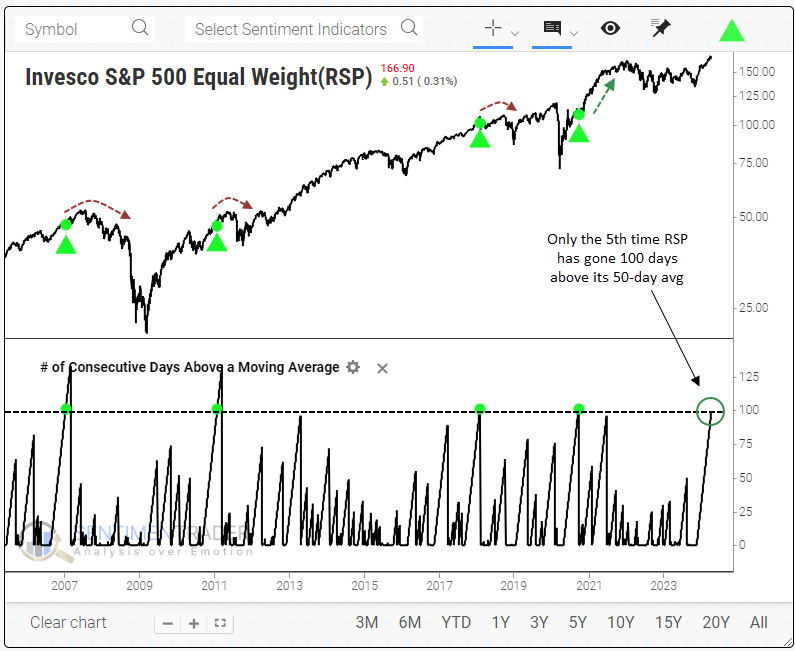
This version of the index assigns the same weight to every stock, so no one (or two, or three...) stocks can distort its performance. For the index to rise, the average stock must be doing well. And well they have; the popular RSP fund has now gone 100 consecutive sessions above its 50-day moving average, having crossed above it in mid-November and not touching it since.
The streak has moved into 5th place in its most persistent medium-term uptrends. Three of the other four preceded some further upside (except in 2018) but then rolled over and more than erased those gains. In late 2020, RSP suffered only some modest choppiness, then resumed its stunning rise into the 2021 peak.
Trend persistence is usually a good thing
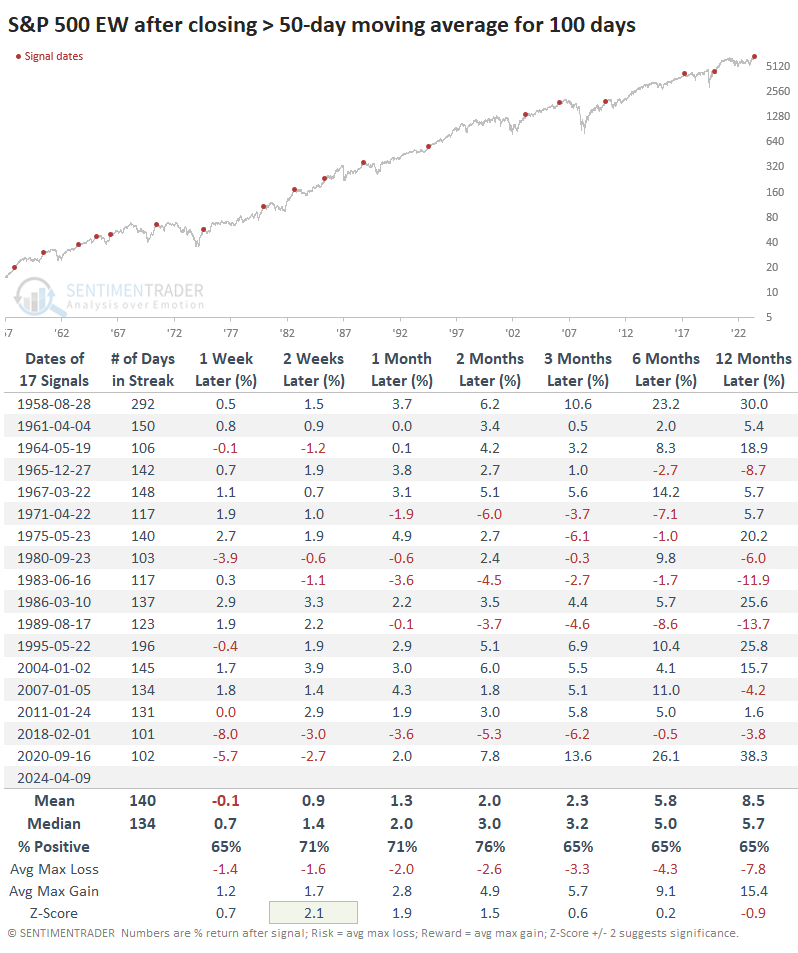
The table below goes back the furthest we can, to 1957. It shows every time the equal-weight S&P 500 levitated 100 days above its 50-day moving average and its performance in the following weeks and months. The "# of Days in Streak" column shows the number of days the streak ultimately lasted. The median was an additional 34 trading days once the streak reached 100 days.
Overall, this was a decent sign of momentum but not nearly as impressive as others we've studied. The equal-weight S&P showed above-average and consistently positive returns from two to eight weeks later. After that, several rolled over into troubling declines.
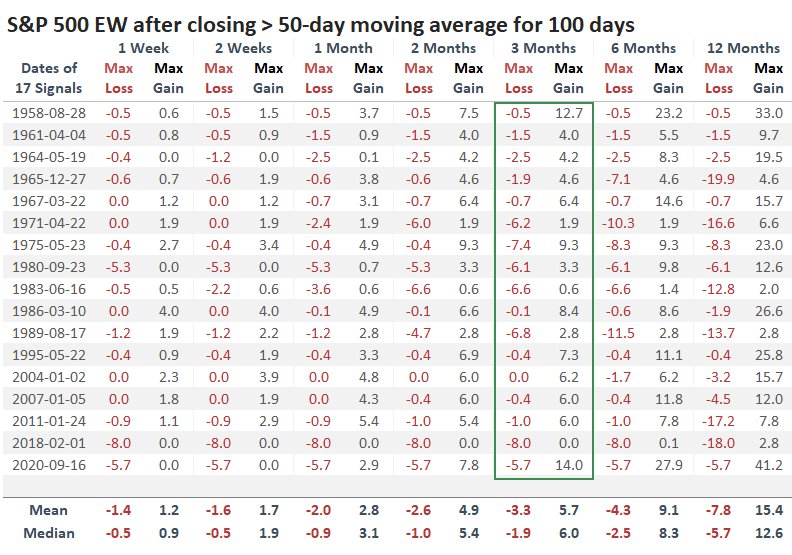
The table of maximum gains and losses across time frames shows the best risk/reward over the next two to three months. Over the next few months, only five signals suffered more significant losses than gains, and none of those losses were larger than -8%.
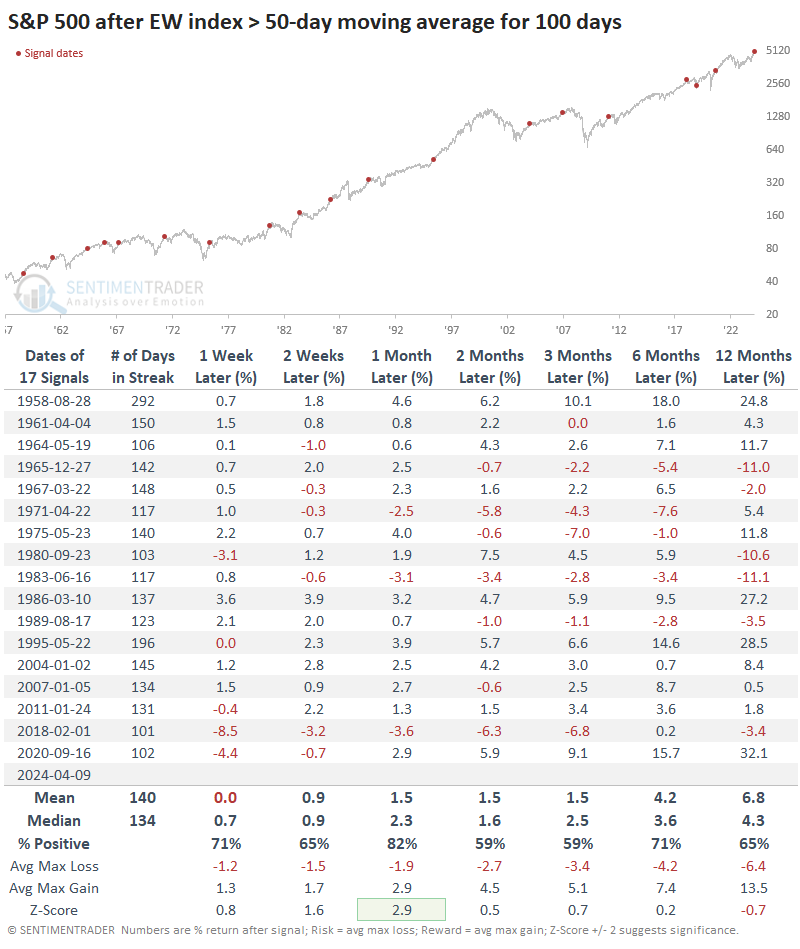
These signals were also a good sign for the weeks ahead for the "regular" S&P 500 index, which weights its constituent stocks based on their market capitalization. It actually outperformed the equal-weight version over the next month, in particular. The cap-weight index suffered only three losses over that time frame, all relatively small. After that, its performance was much more in line with random.
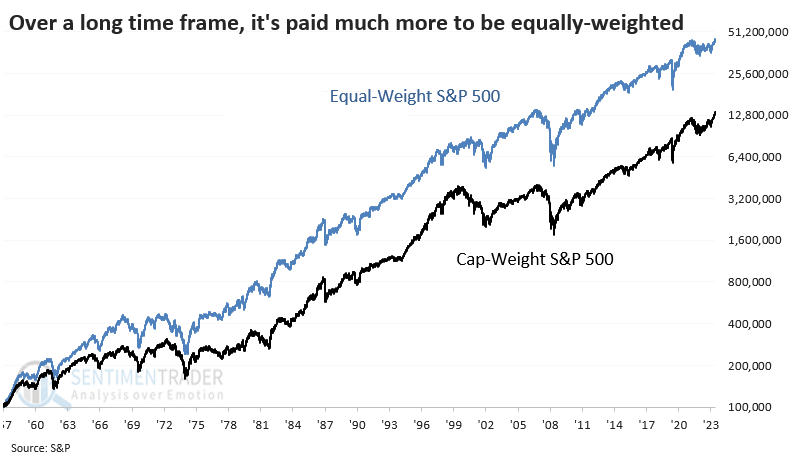
Given the better performance of the much more commonly cited cap-weighted S&P 500 index, many investors forget how much of a historical anomaly recent years have been. Since 1957, $100,000 invested in both indexes would have turned into nearly $45 million in the equal-weight index versus "only" $13.3 million in the cap-weight index.
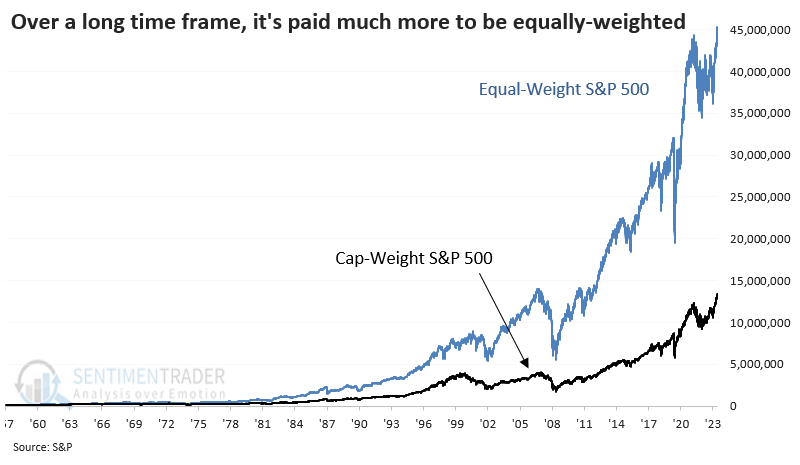
For the sticklers, the log scale version of the chart shows how consistent and persistent the equal-weight outperformance has been.
What the research tells us...
Signs of positive momentum in the U.S. stock market tend to mostly be good omens for future returns. It's a market that tends to feed on good vibes, unlike others that invite opportunistic sellers.
Over a long time frame, the equal-weight version of the S&P 500 has vastly outperformed the cap-weight version, to which most investors' passive investments are benchmarked. Over the past few years, that's been a fortunate oversight for many 401k accounts. Given the persistence of even the equal-weight index, though, it's hard to argue that the average stock is anything but healthy (the Nasdaq may be a different story), and that's a mostly good sign for the months ahead.
Indicators at Extremes
Phase Table
Ranks
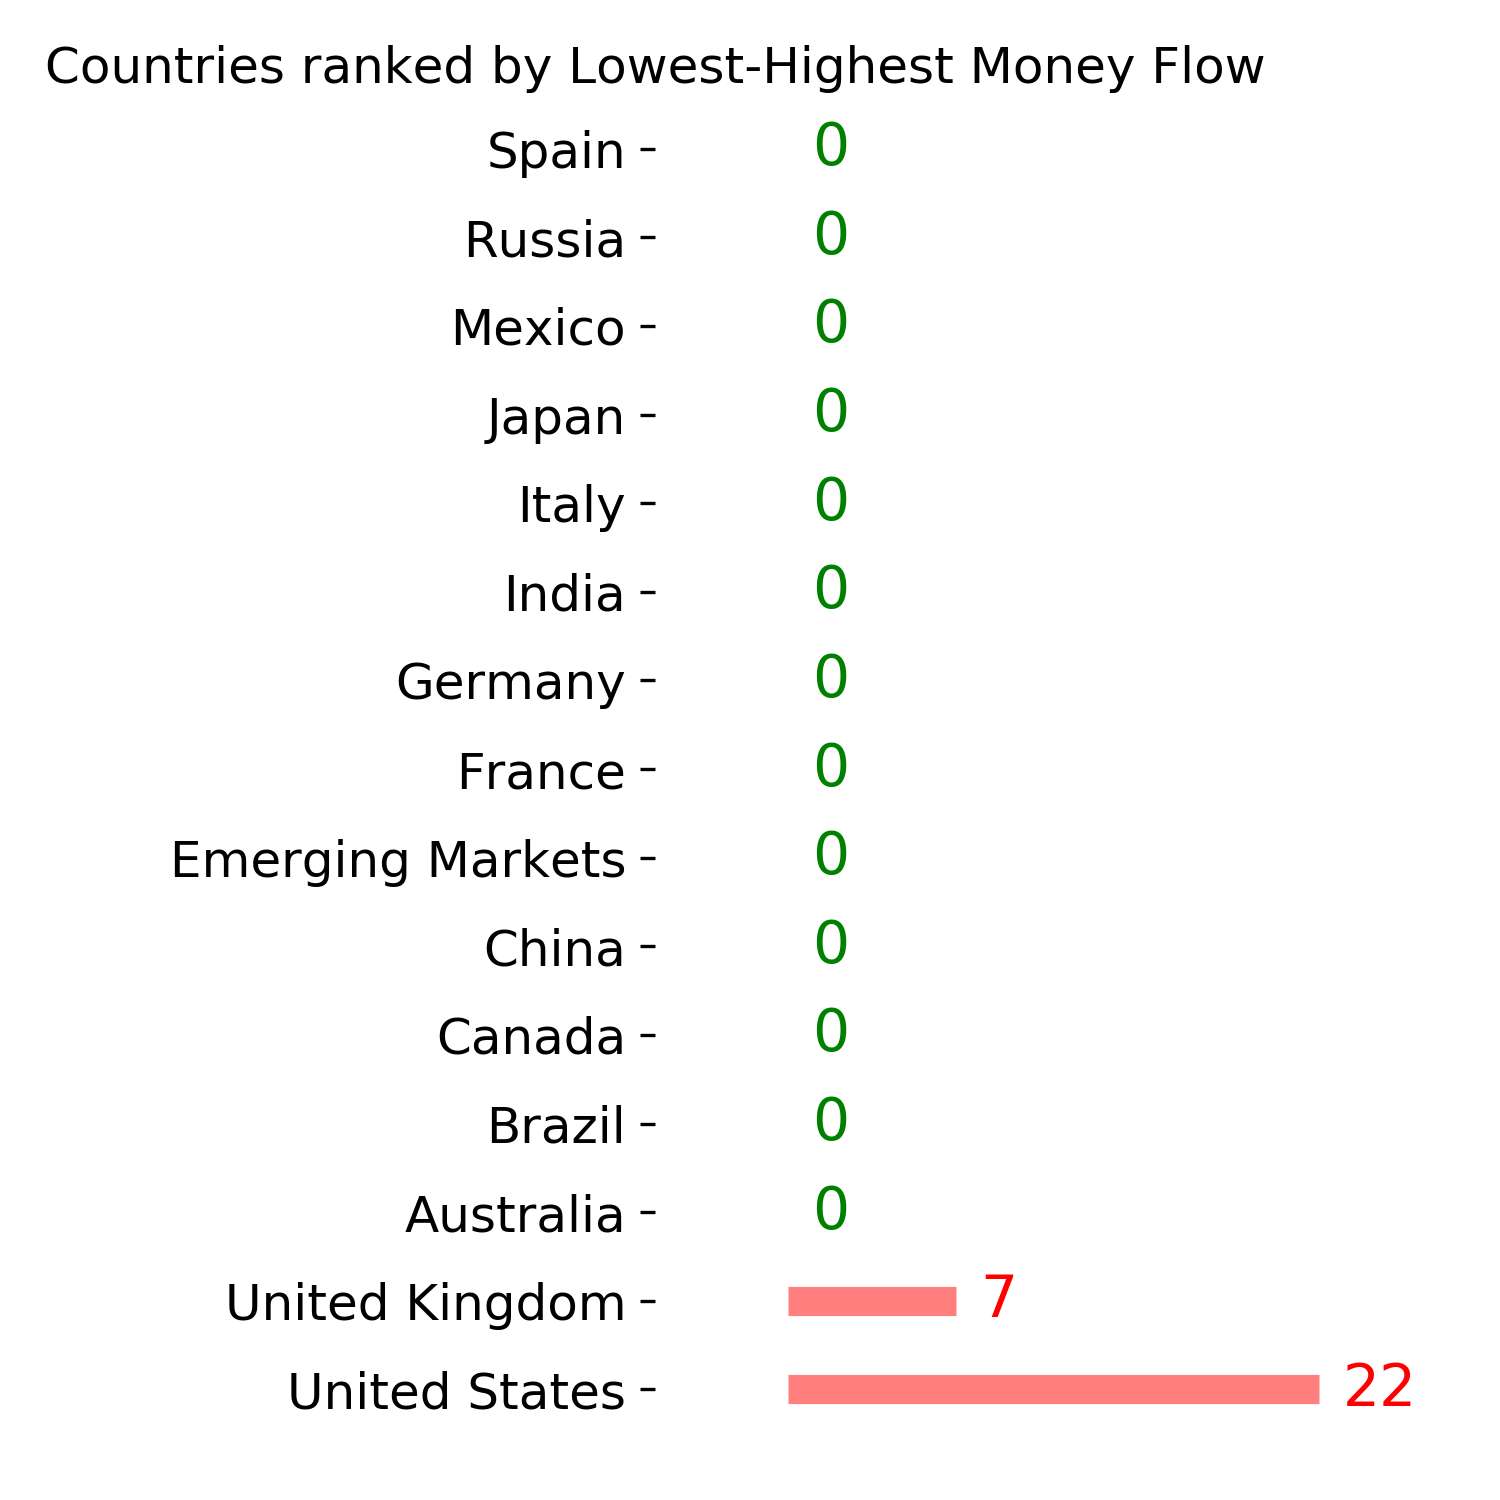
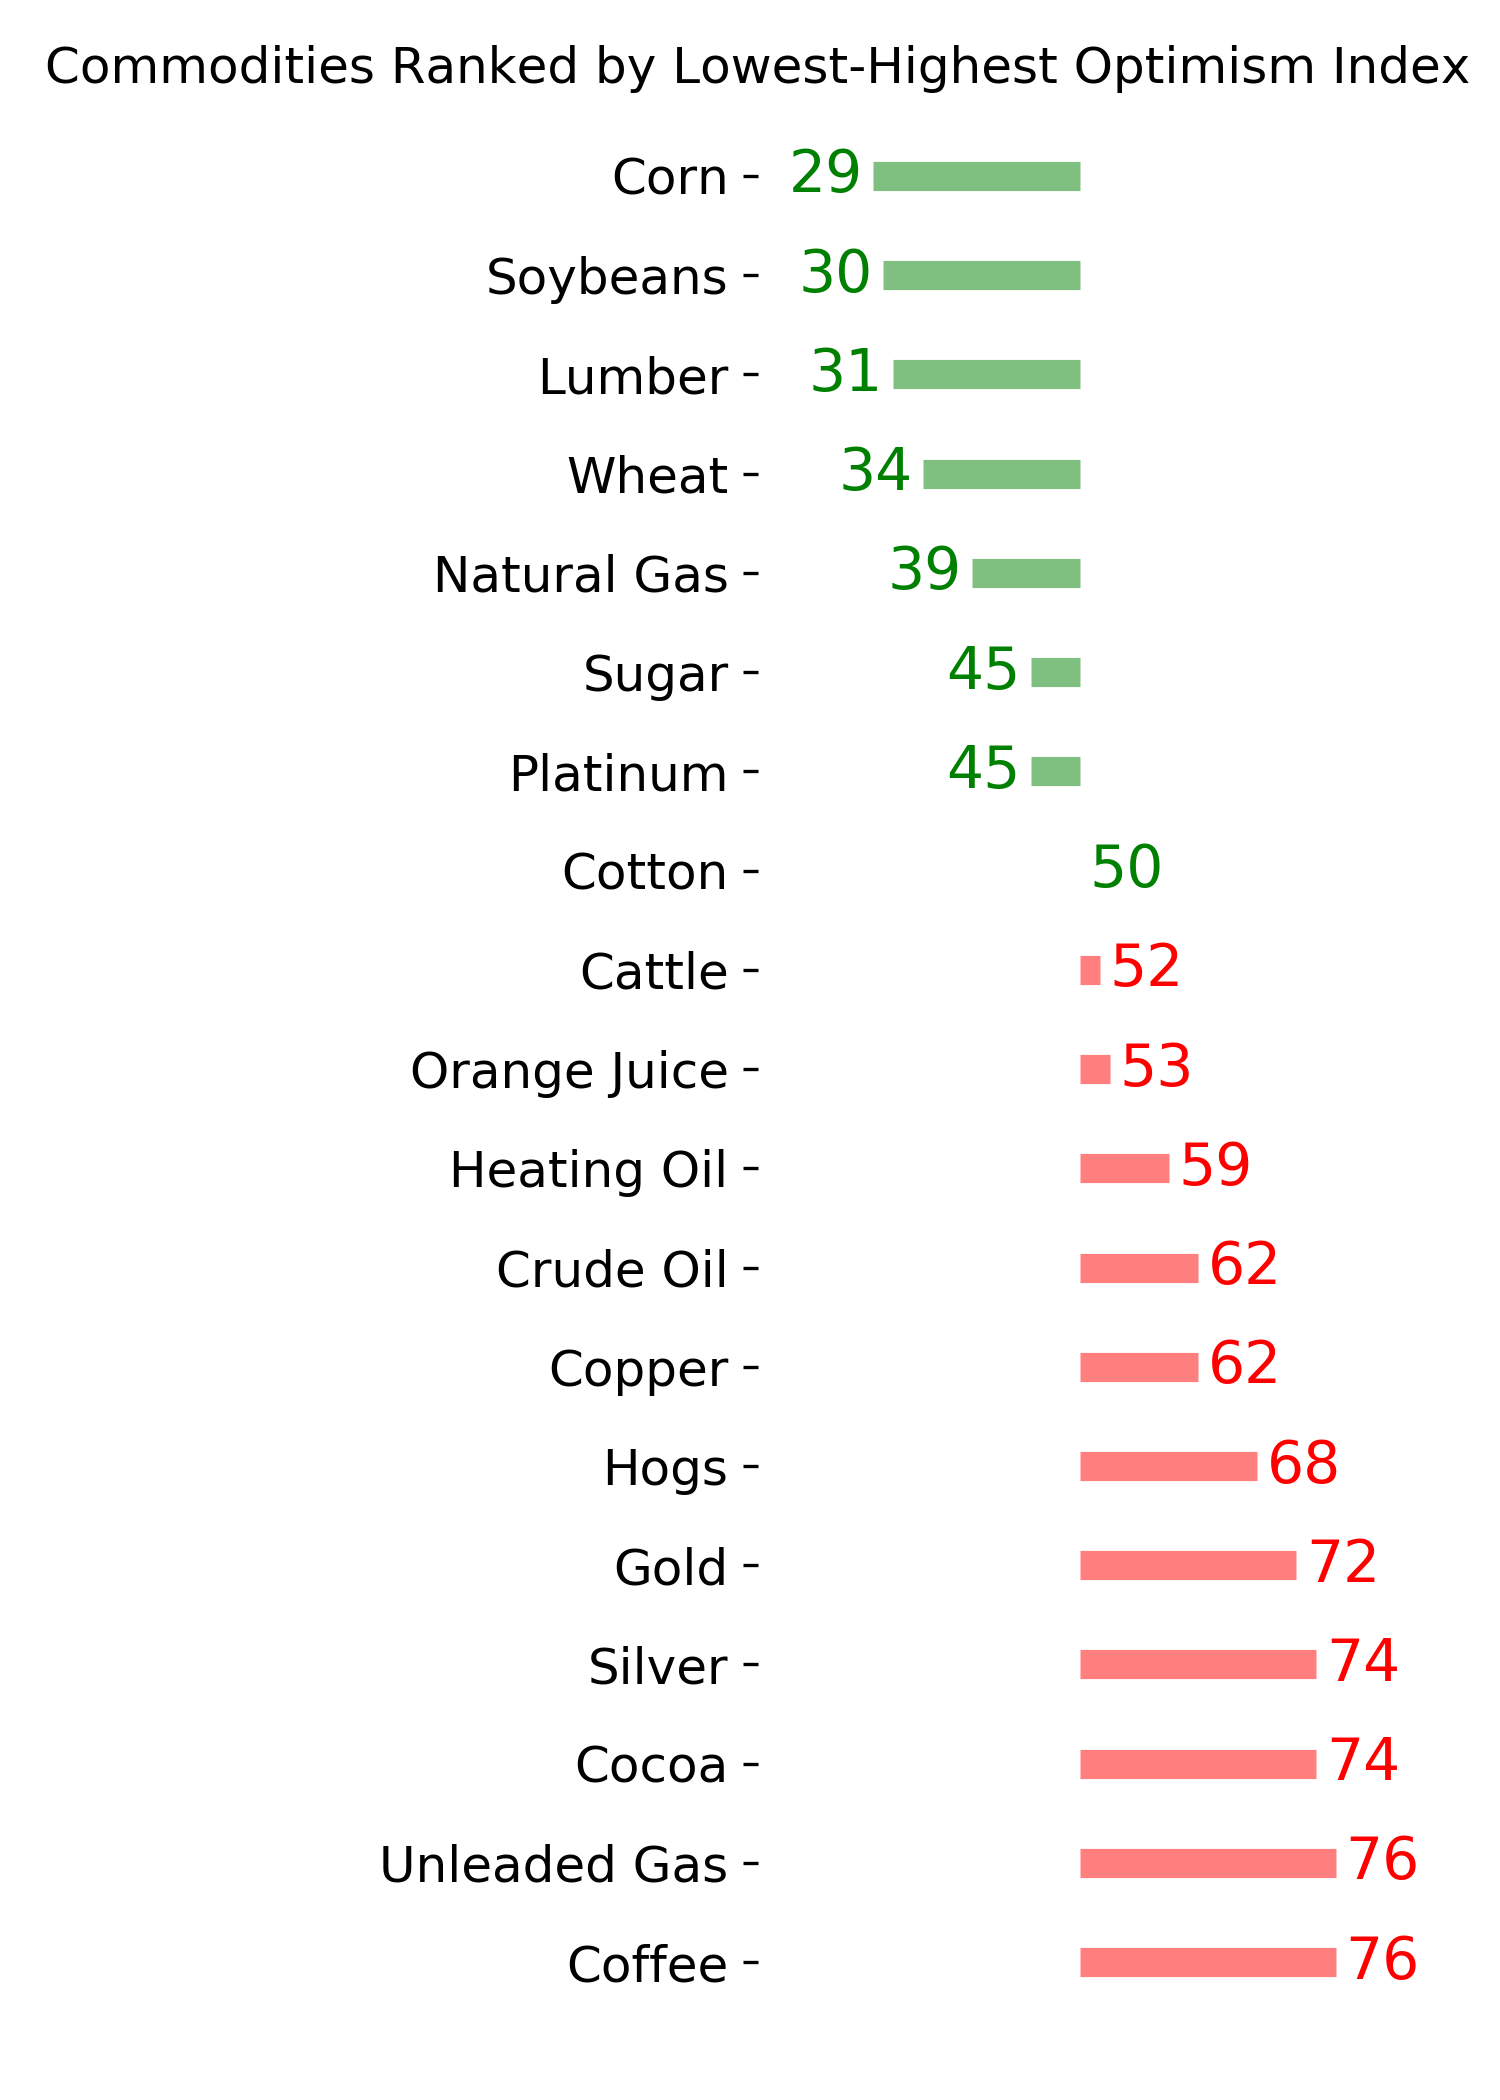
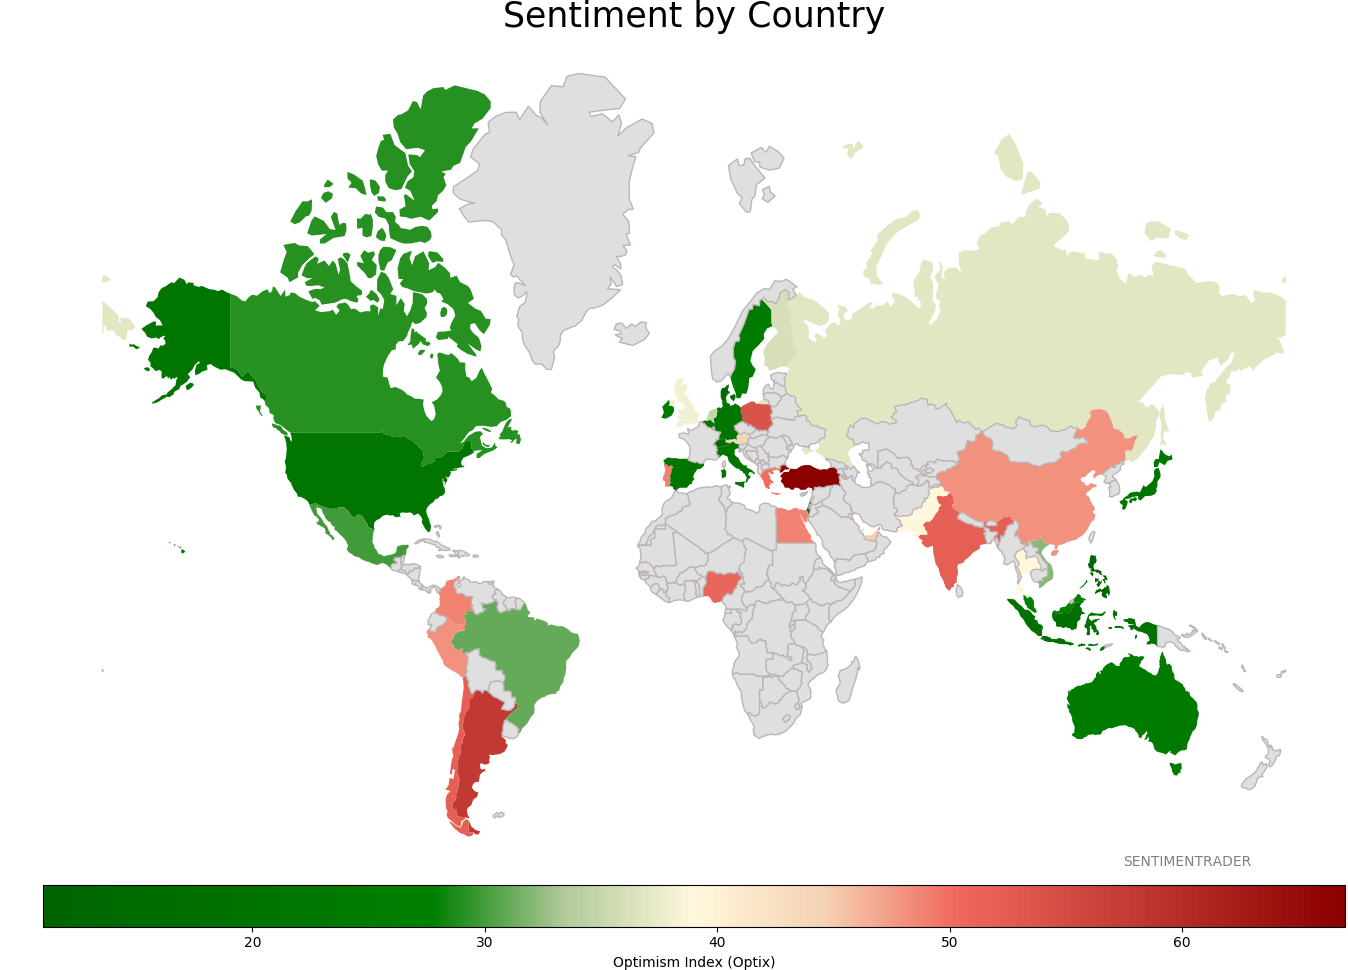
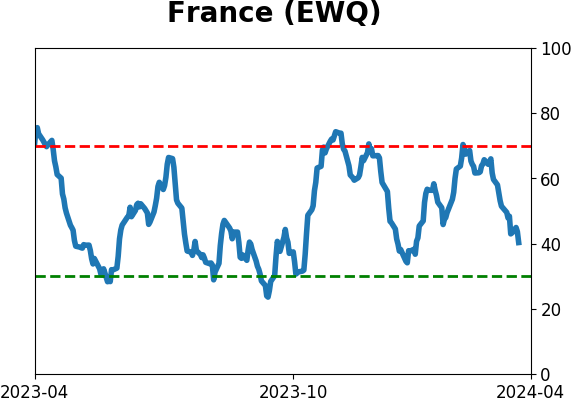
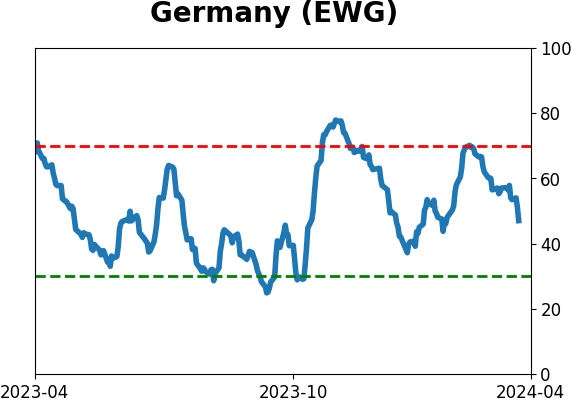
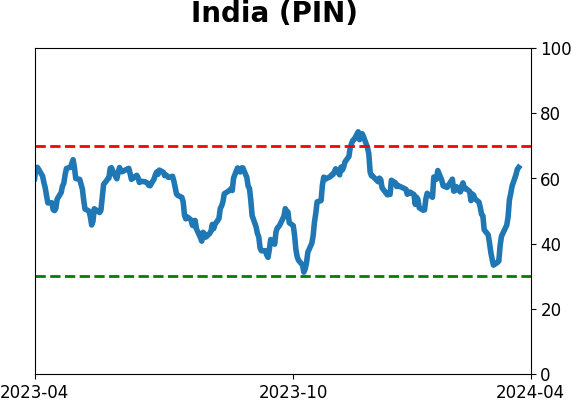
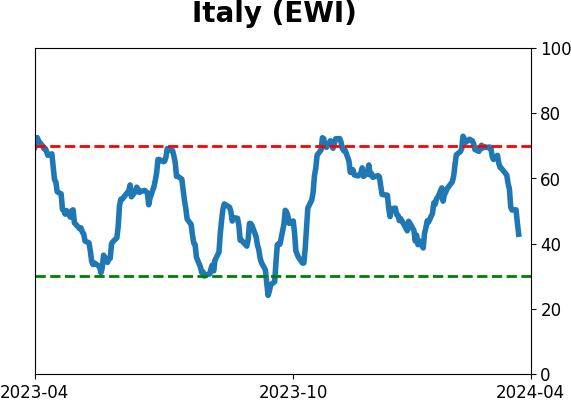
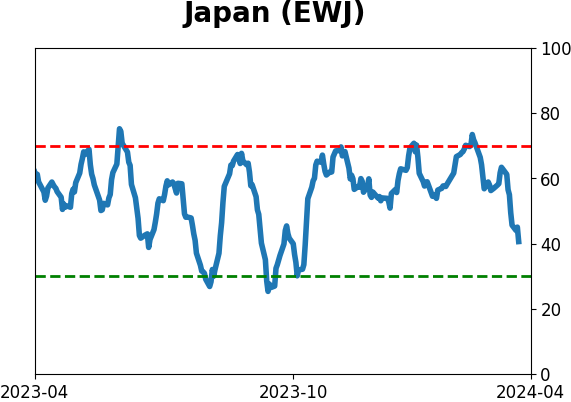
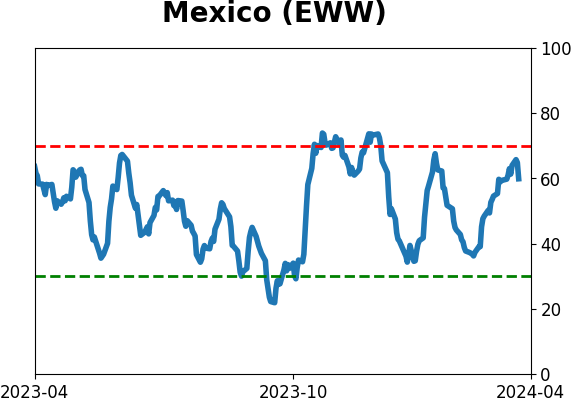
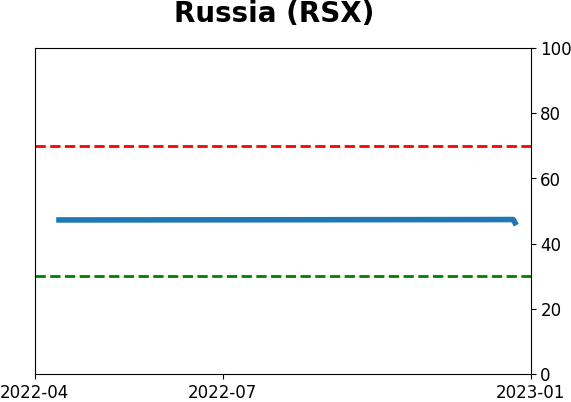
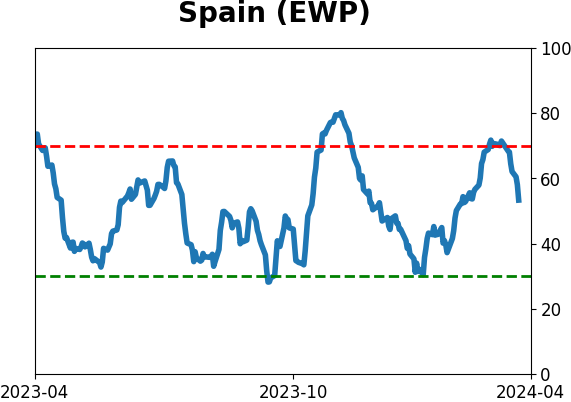
Sentiment Around The World
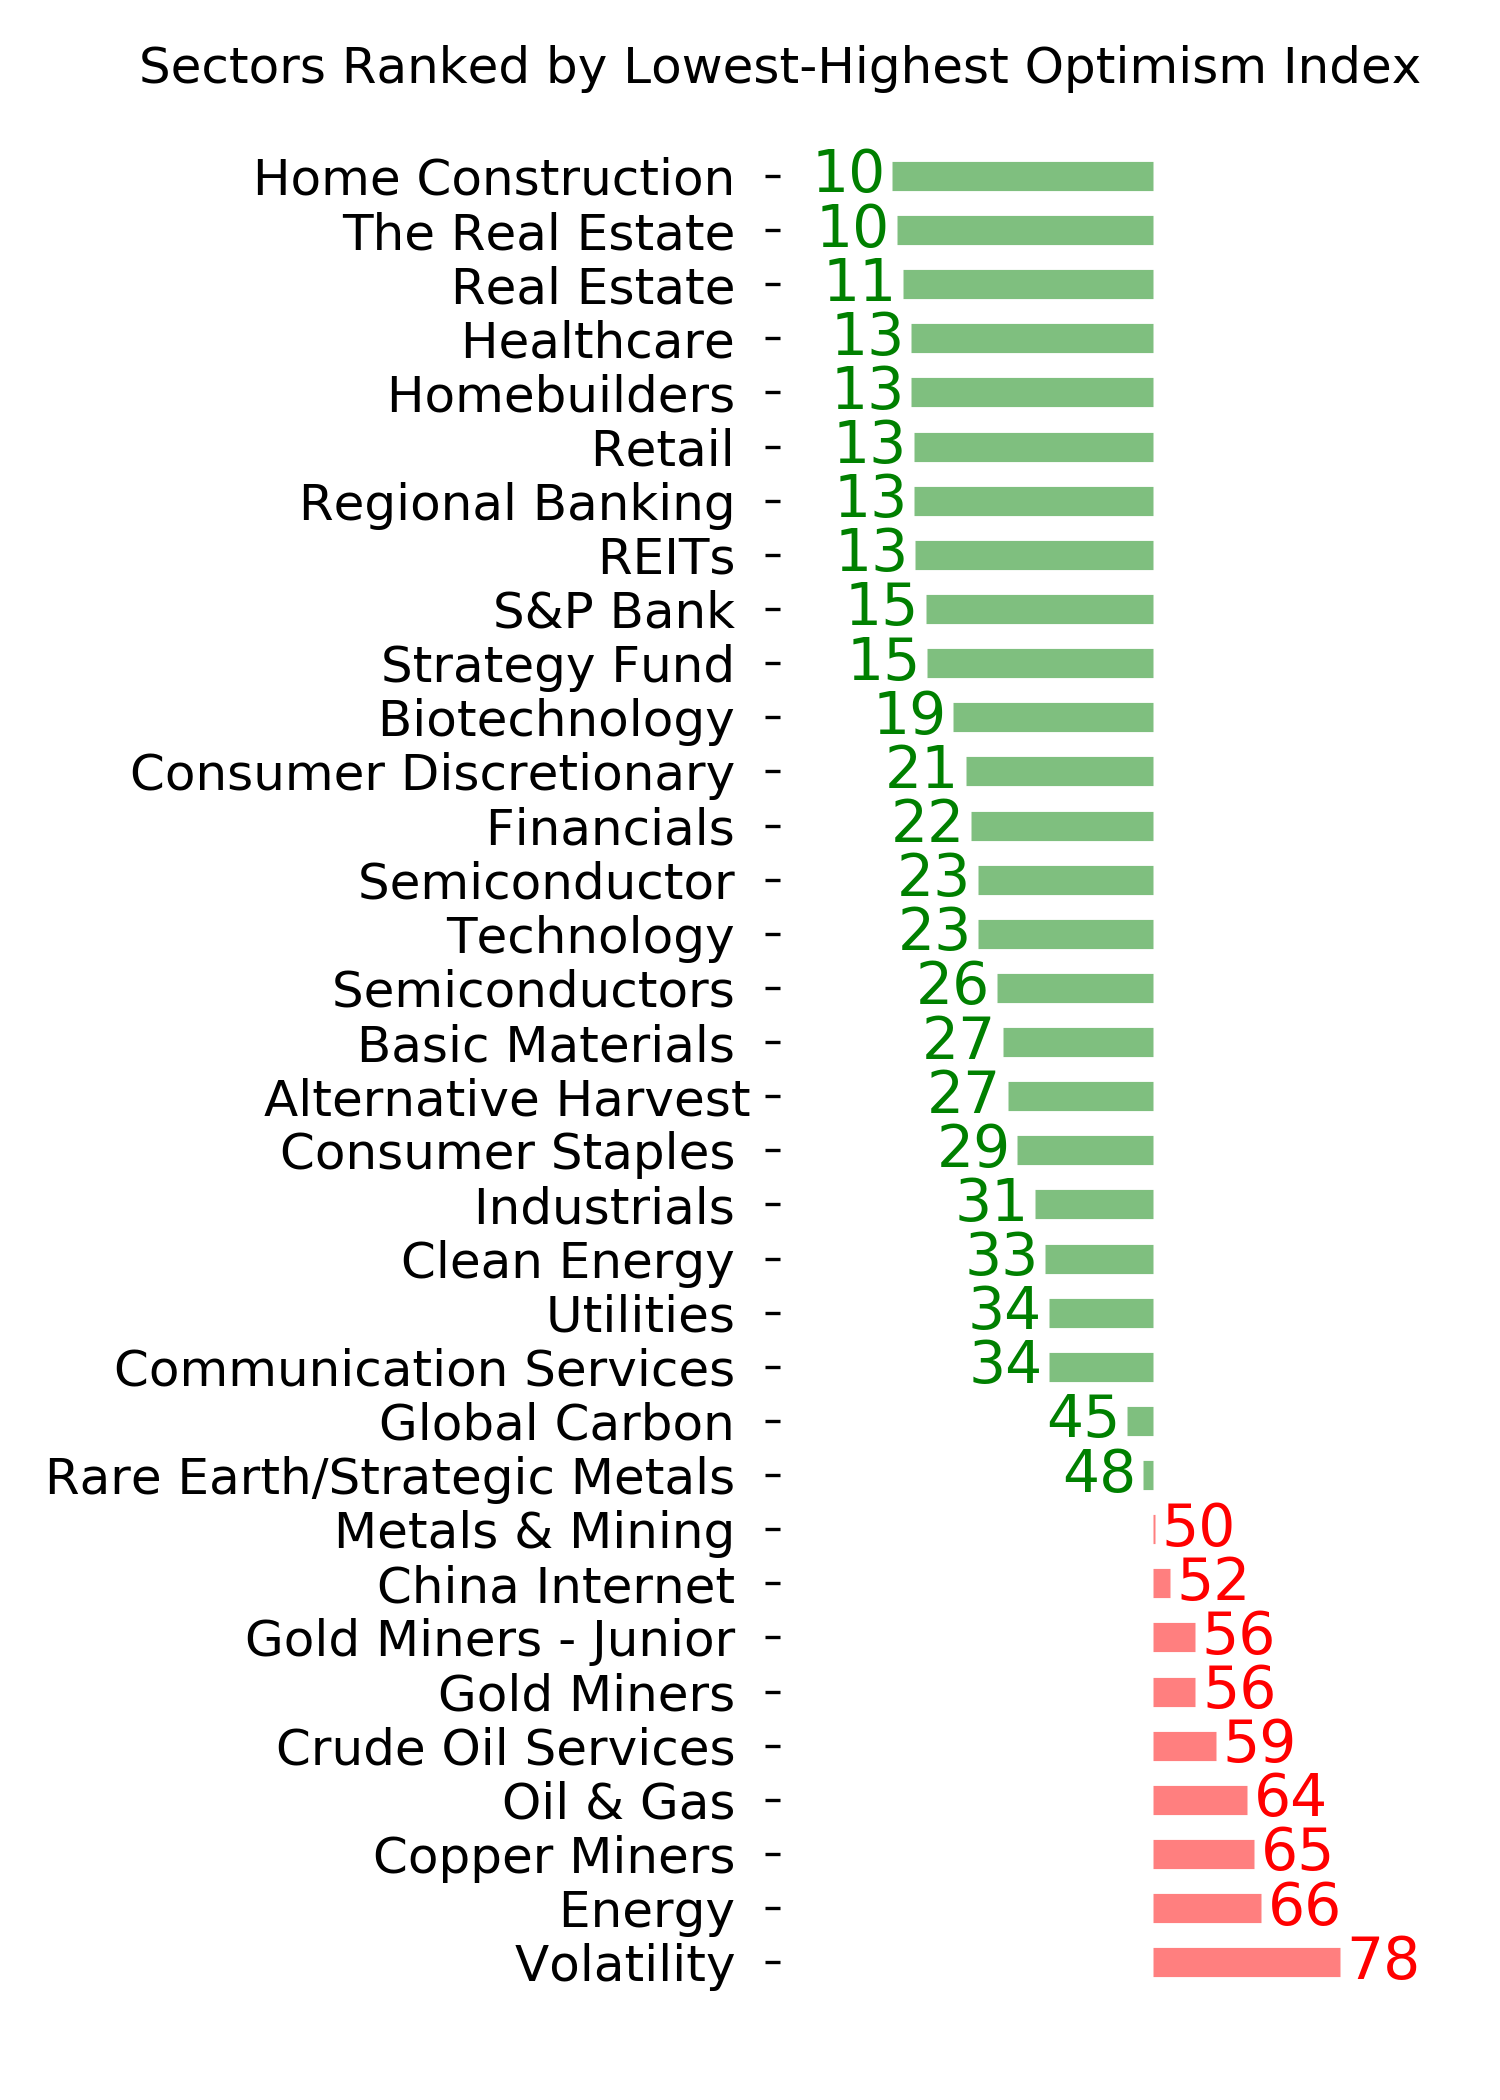
Optimism Index Thumbnails
|
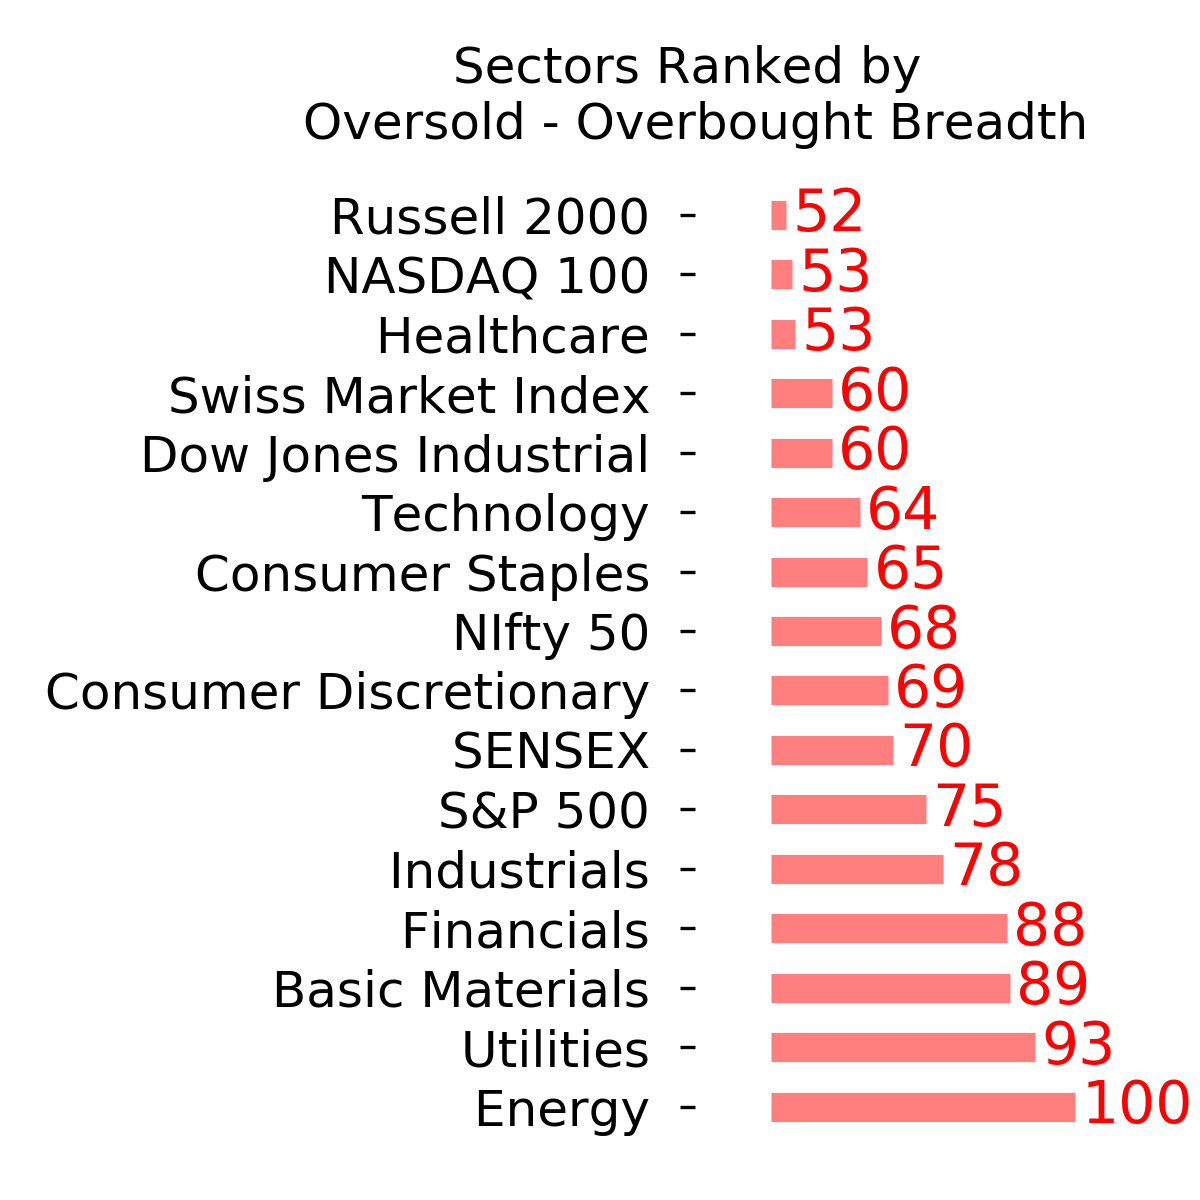
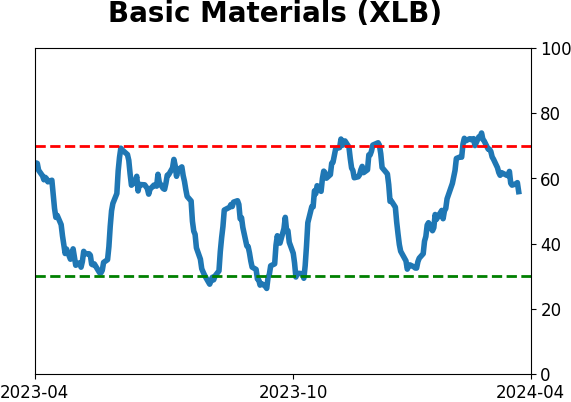
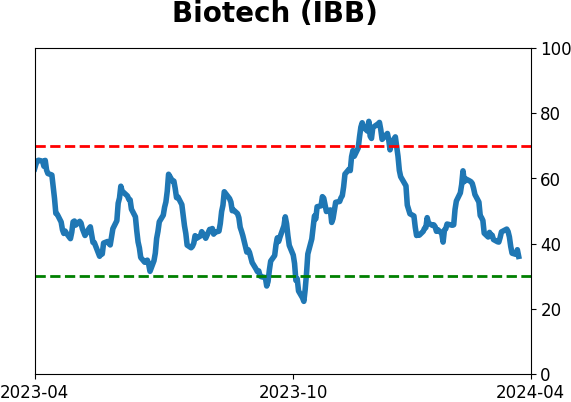
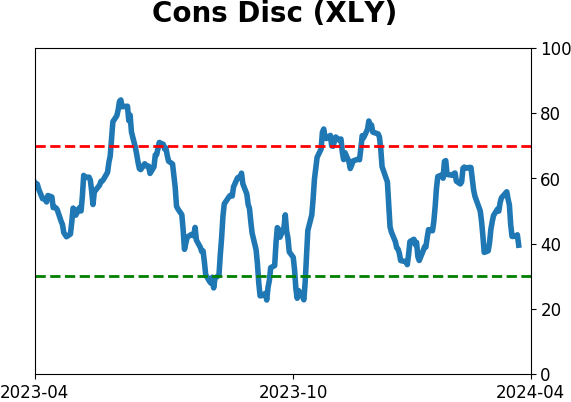
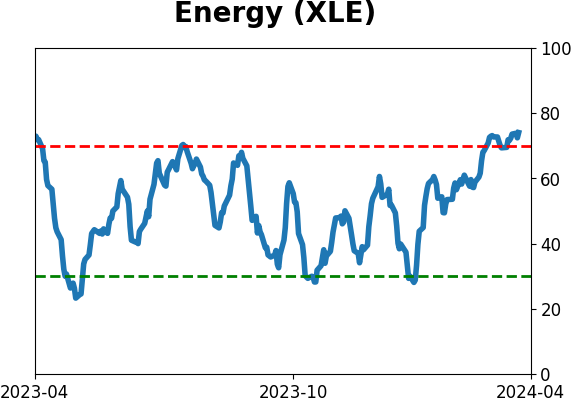
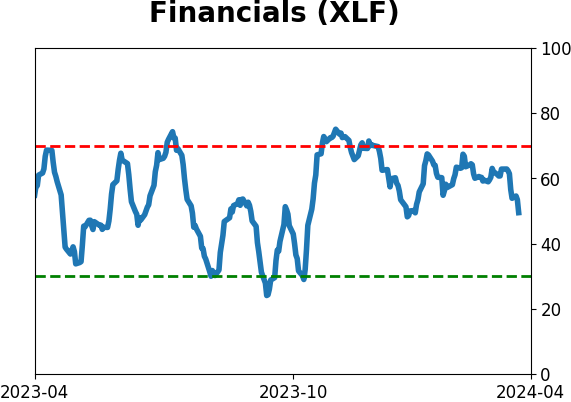
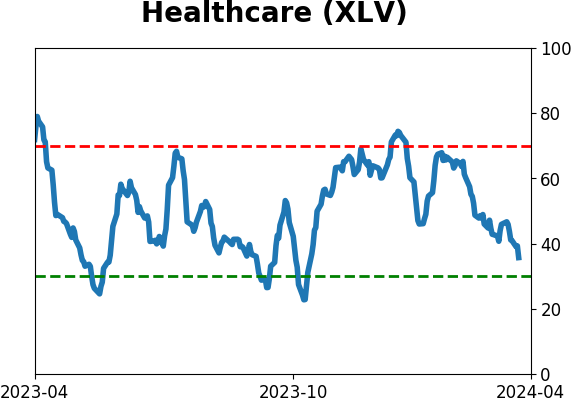
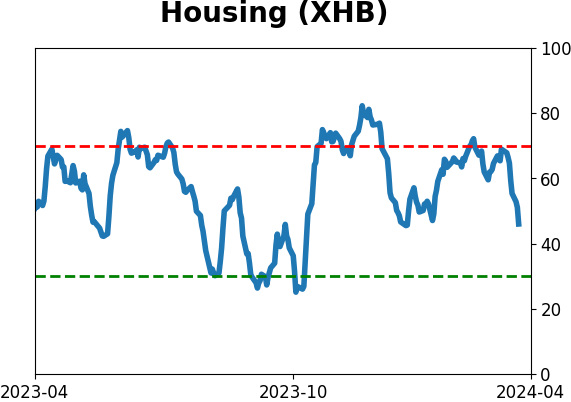
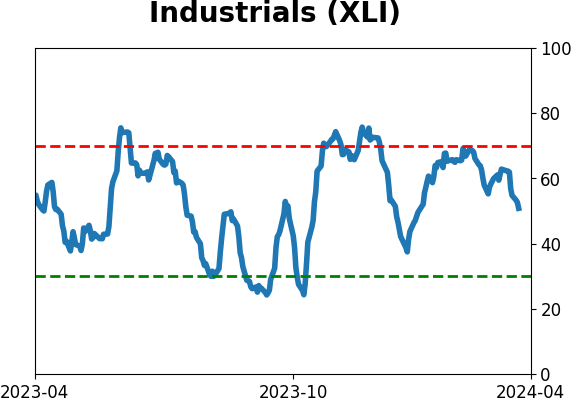
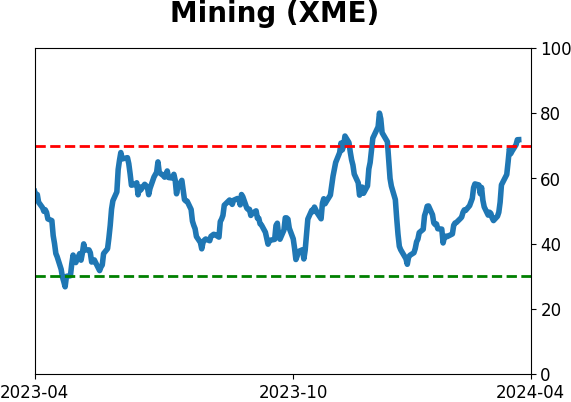
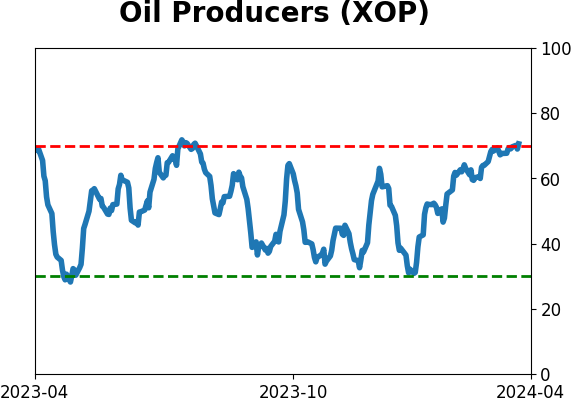
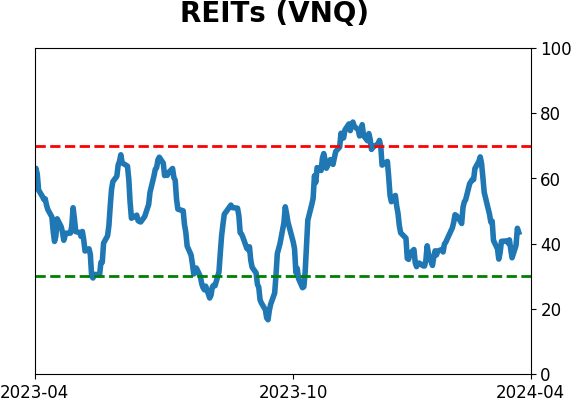
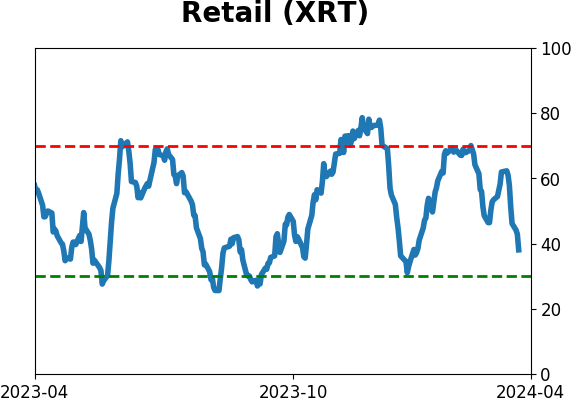
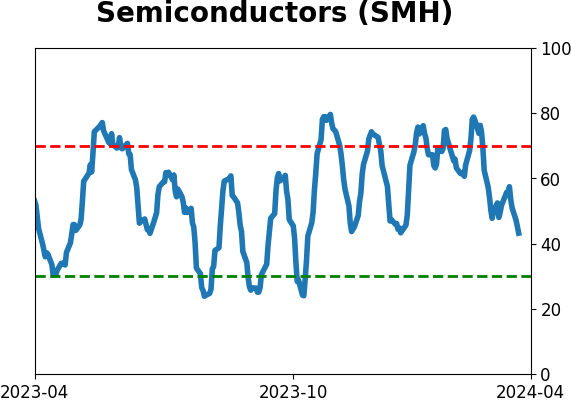
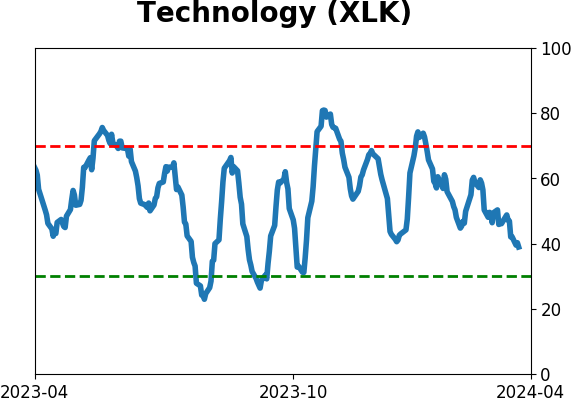
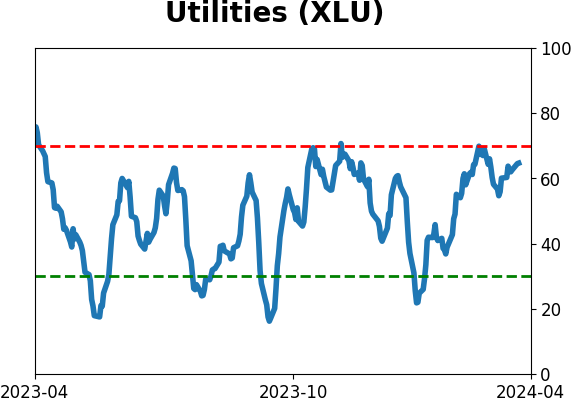
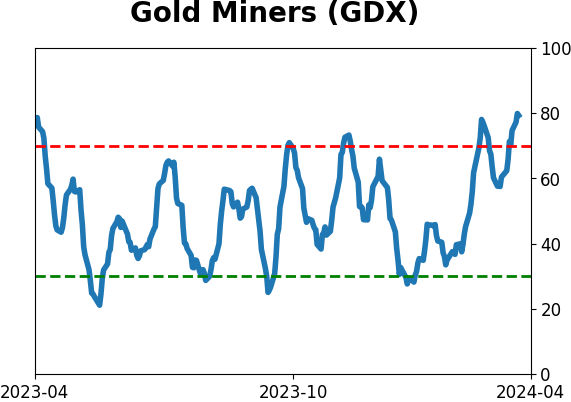
Sector ETF's - 10-Day Moving Average
|
|
|
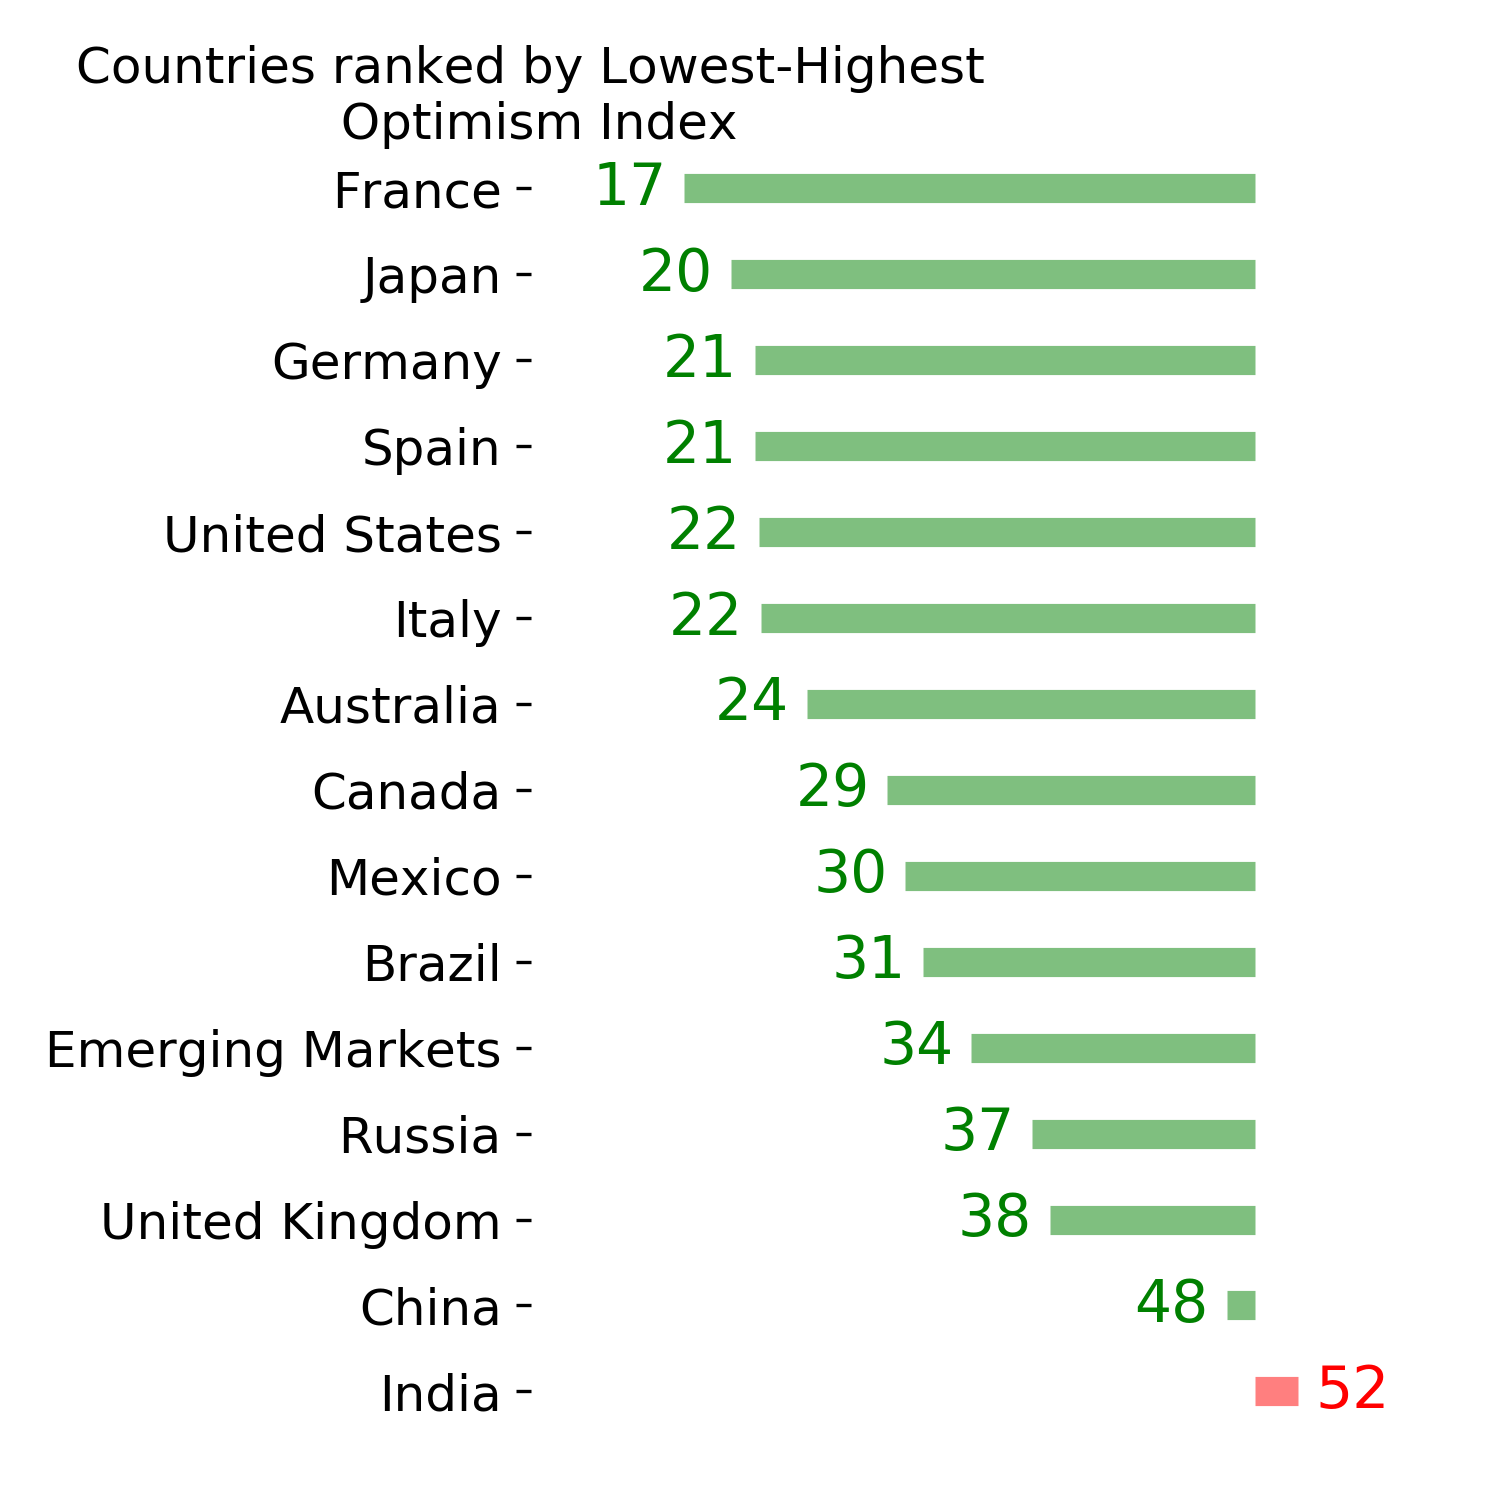
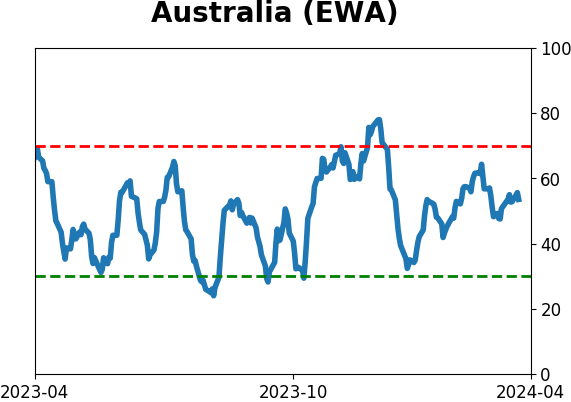
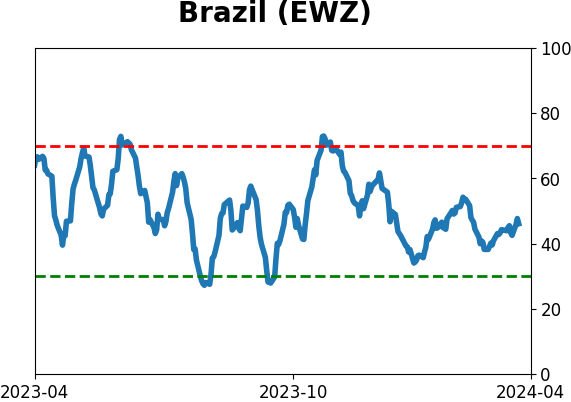
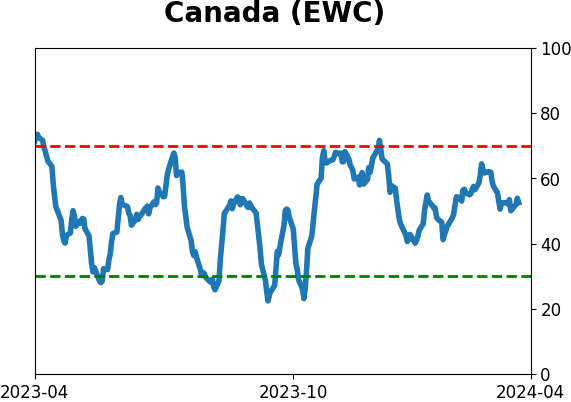
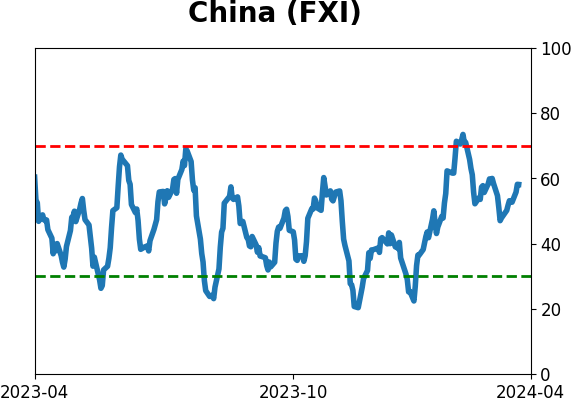
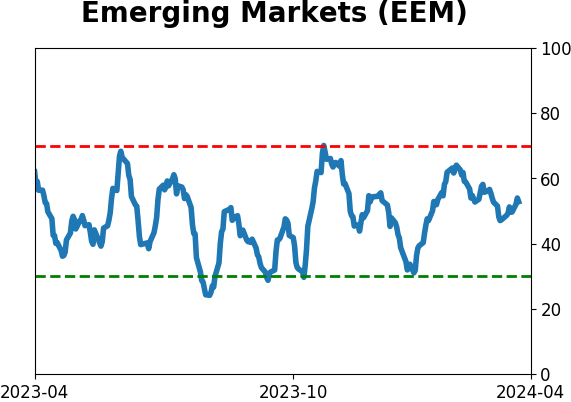
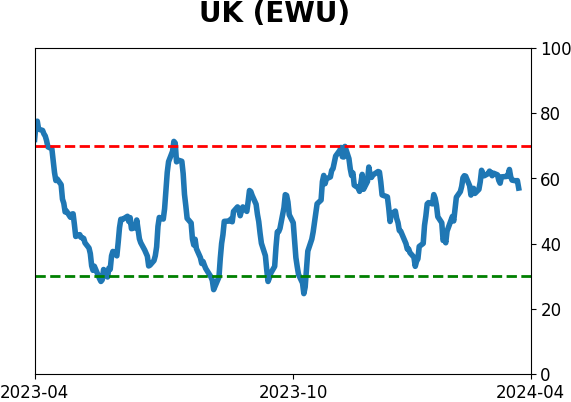
Country ETF's - 10-Day Moving Average
|
|
|
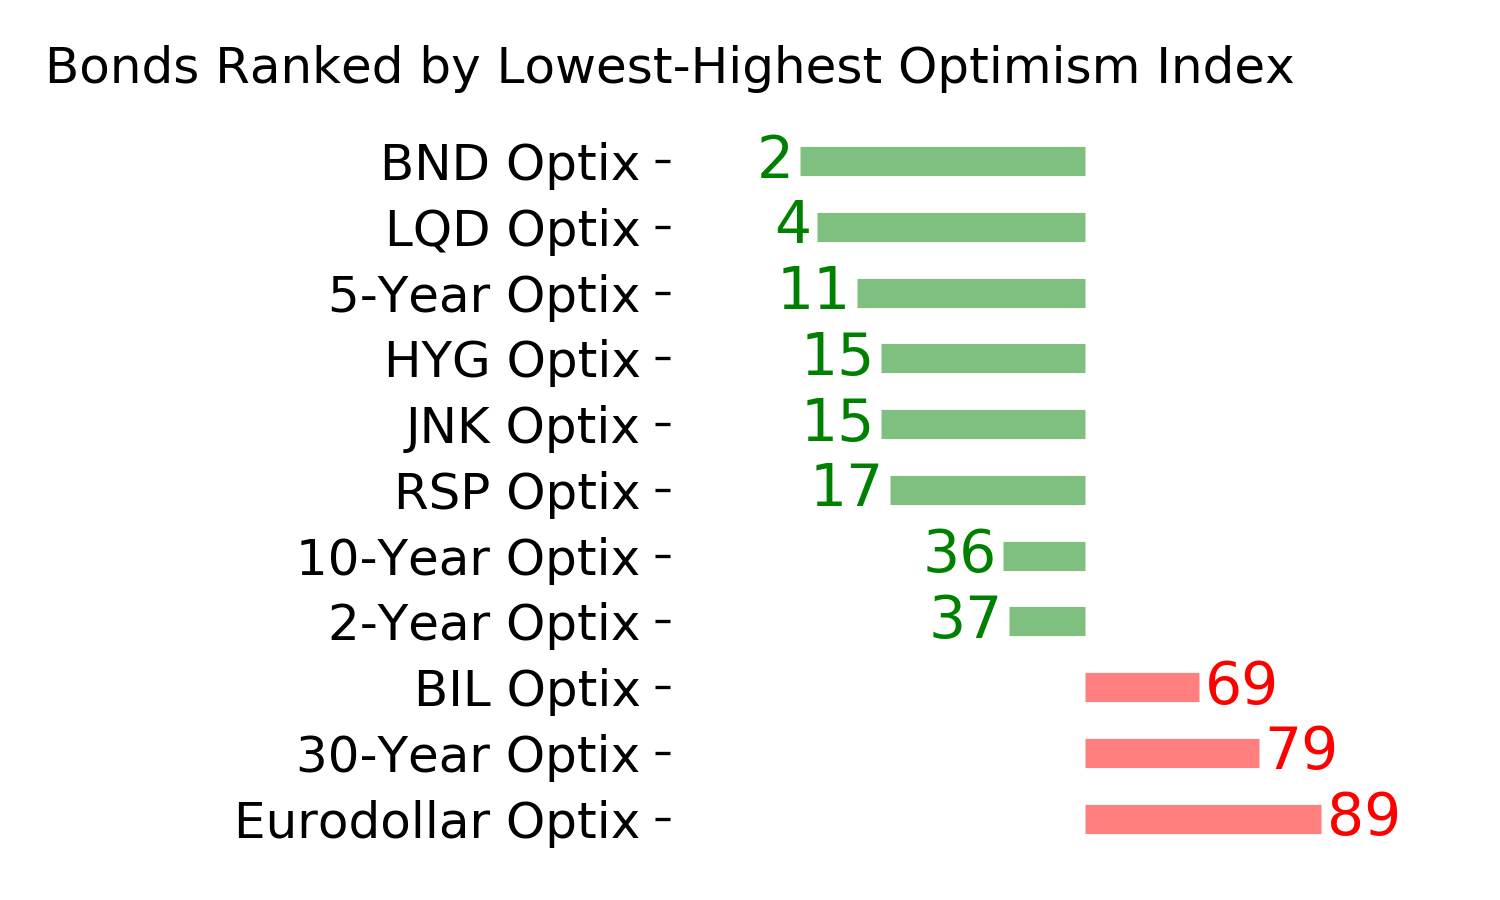
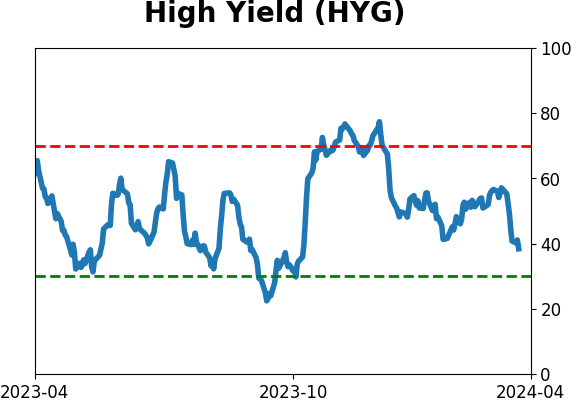
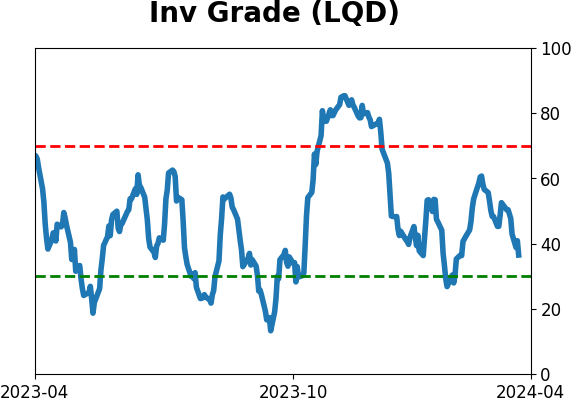
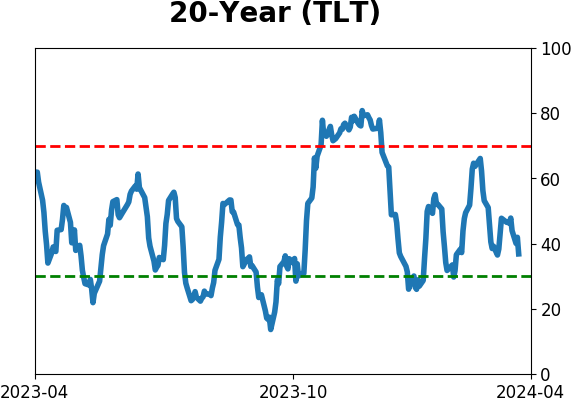
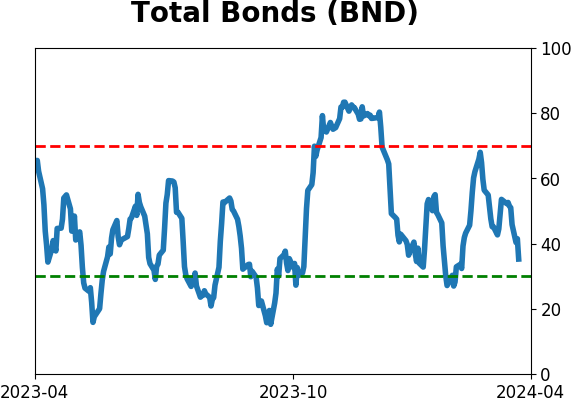
Bond ETF's - 10-Day Moving Average
|
|
|
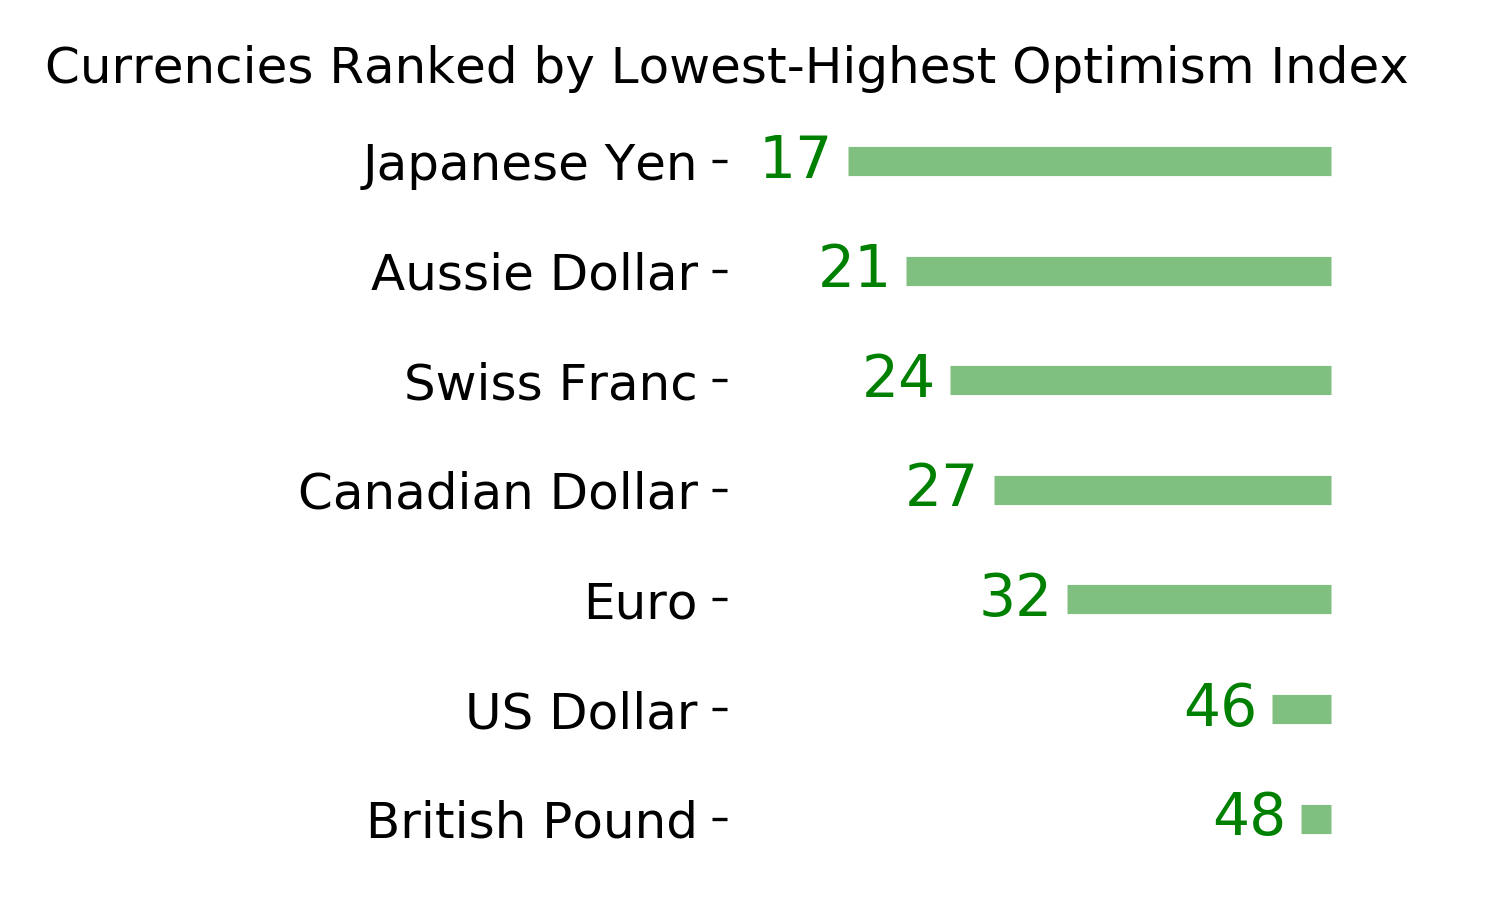
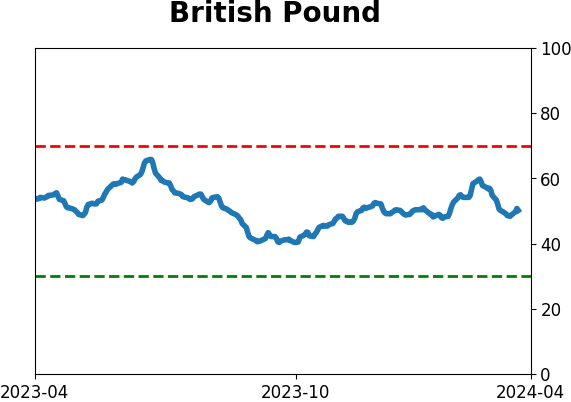
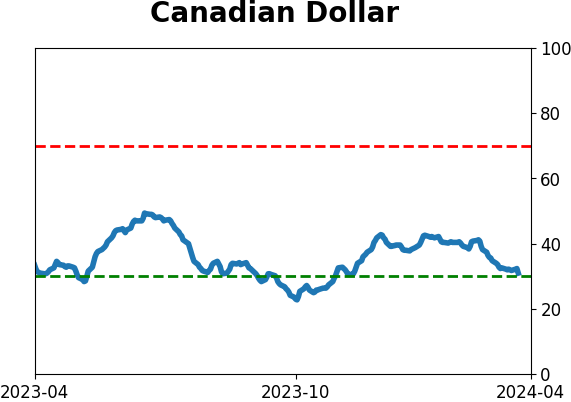
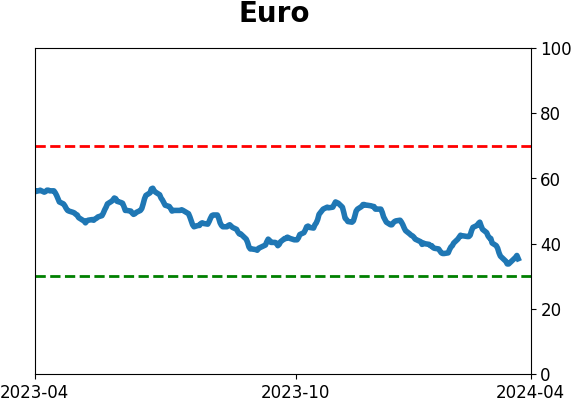
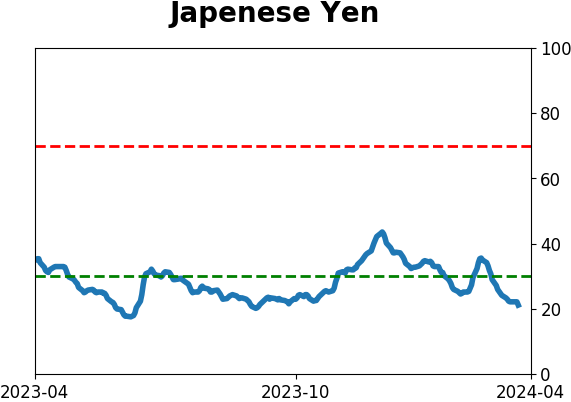
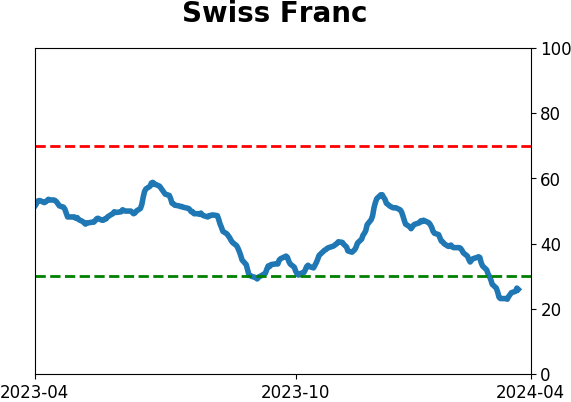
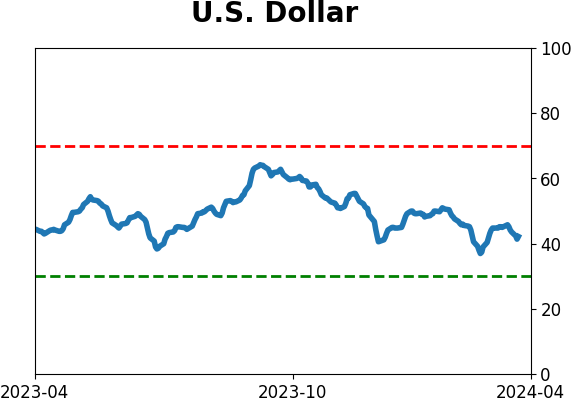
Currency ETF's - 5-Day Moving Average
|
|
|
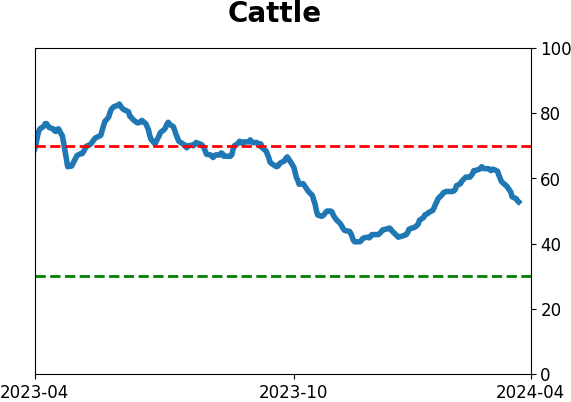
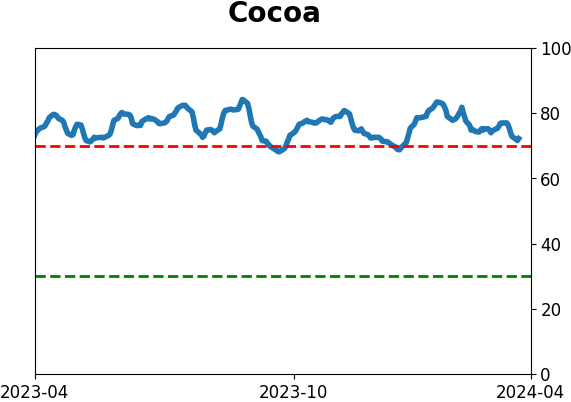
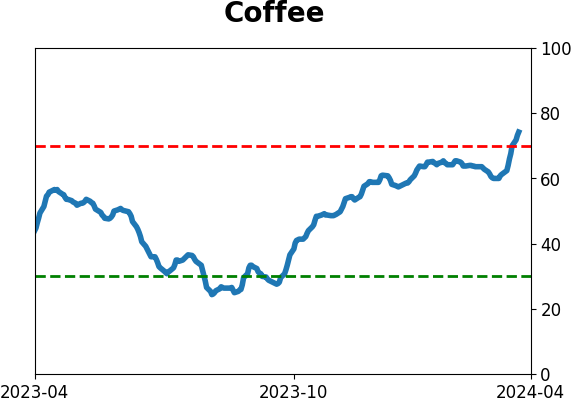
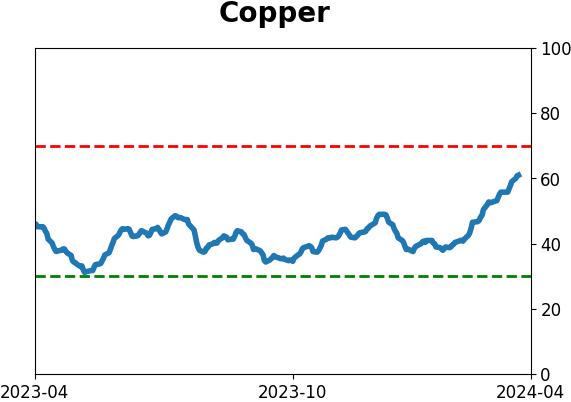
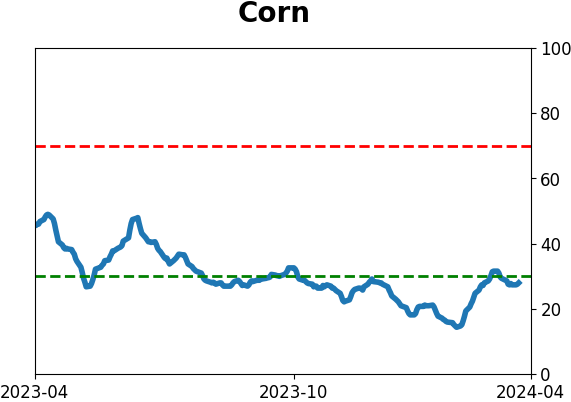
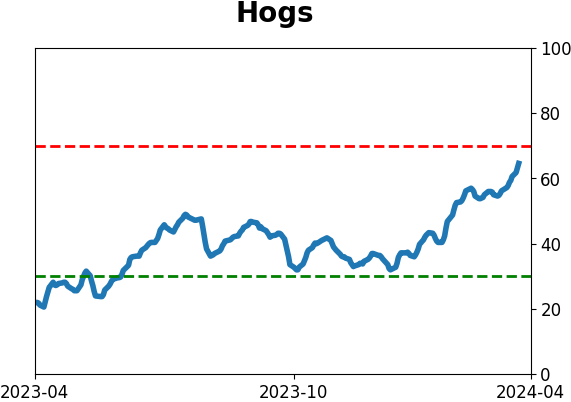
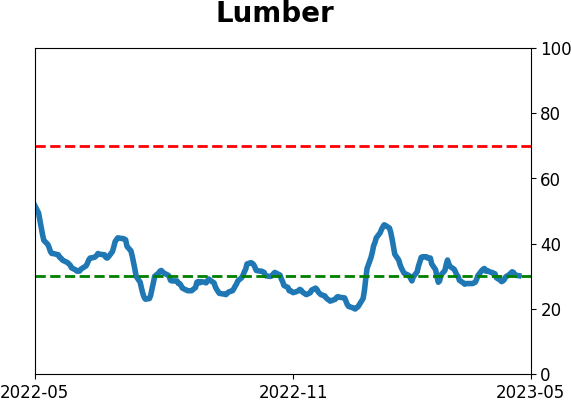
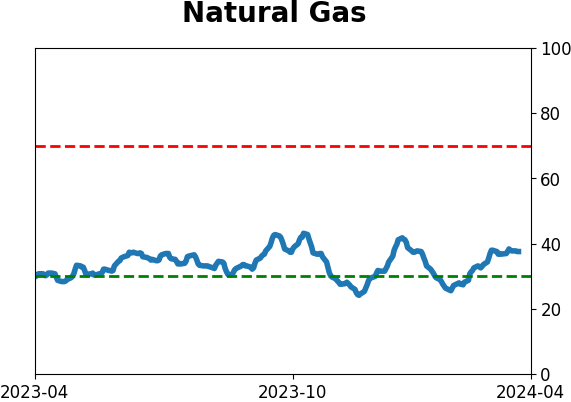
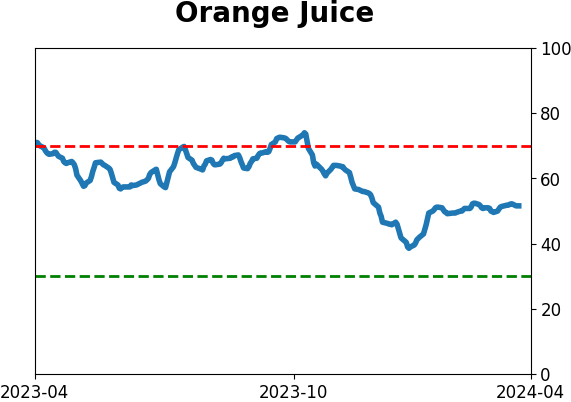
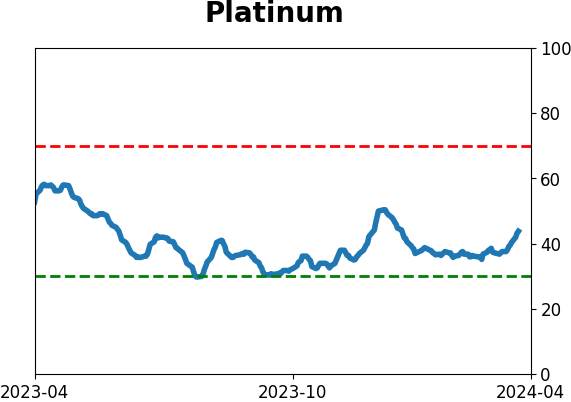
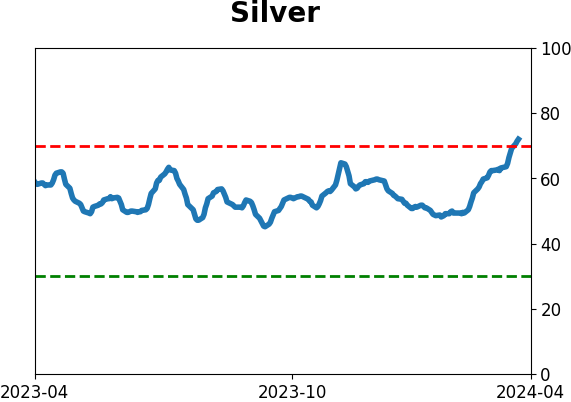
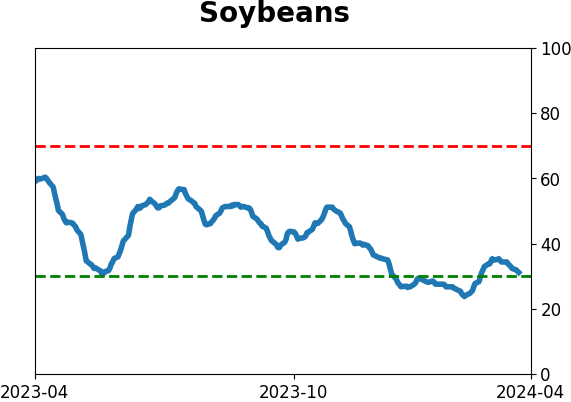
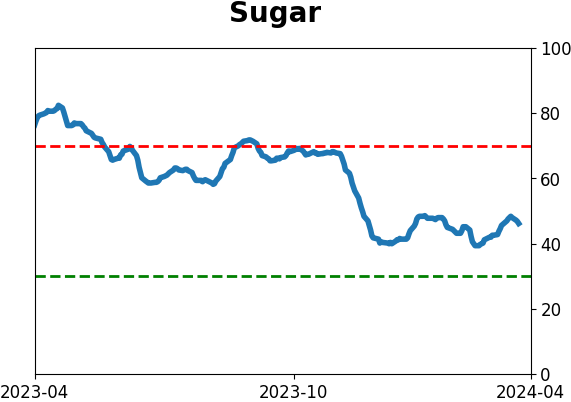
Commodity ETF's - 5-Day Moving Average
|
|