Headlines
|
|
Big Tech is driving the Nasdaq 100 but the recovery is much deeper:
Even though four stocks have driven most of the gains in the Nasdaq 100 since December, there is also a recovery under the surface. Fewer stocks are in corrections and bear markets than at any time since January 2022. After similar internal recoveries, the Nasdaq showed pristine returns, as did the S&P 500.
|
Smart / Dumb Money Confidence
|
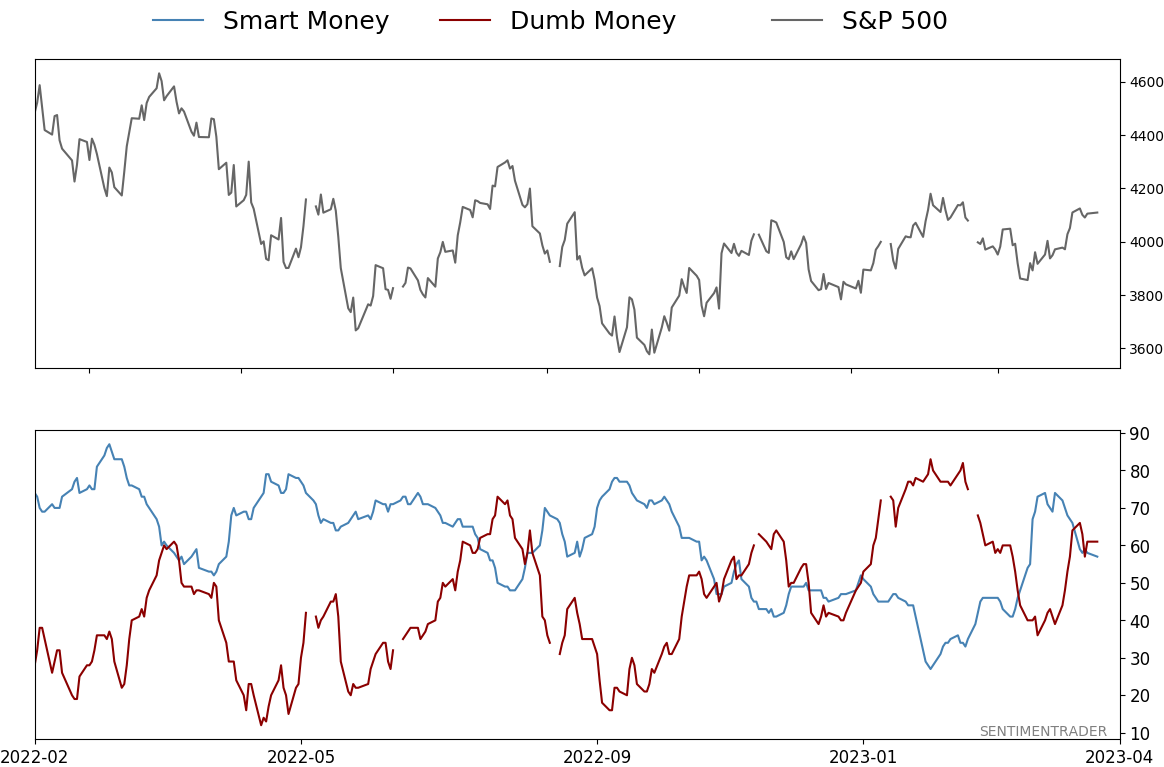
Smart Money Confidence: 57%
Dumb Money Confidence: 61%
|
|
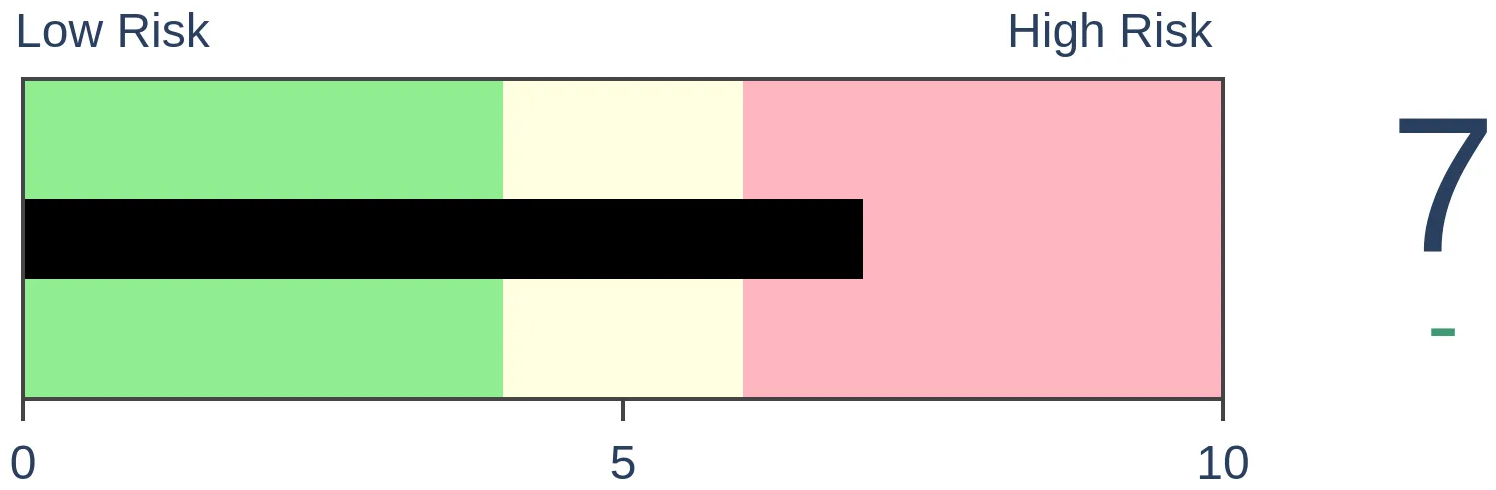
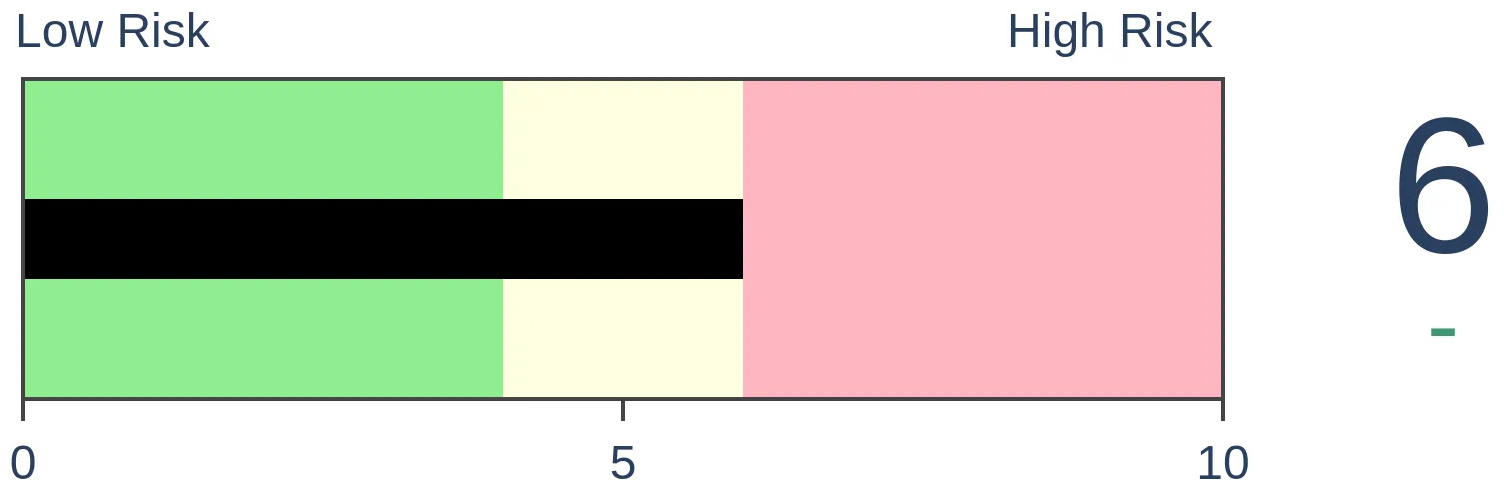
Risk Levels
Stocks Short-Term
|
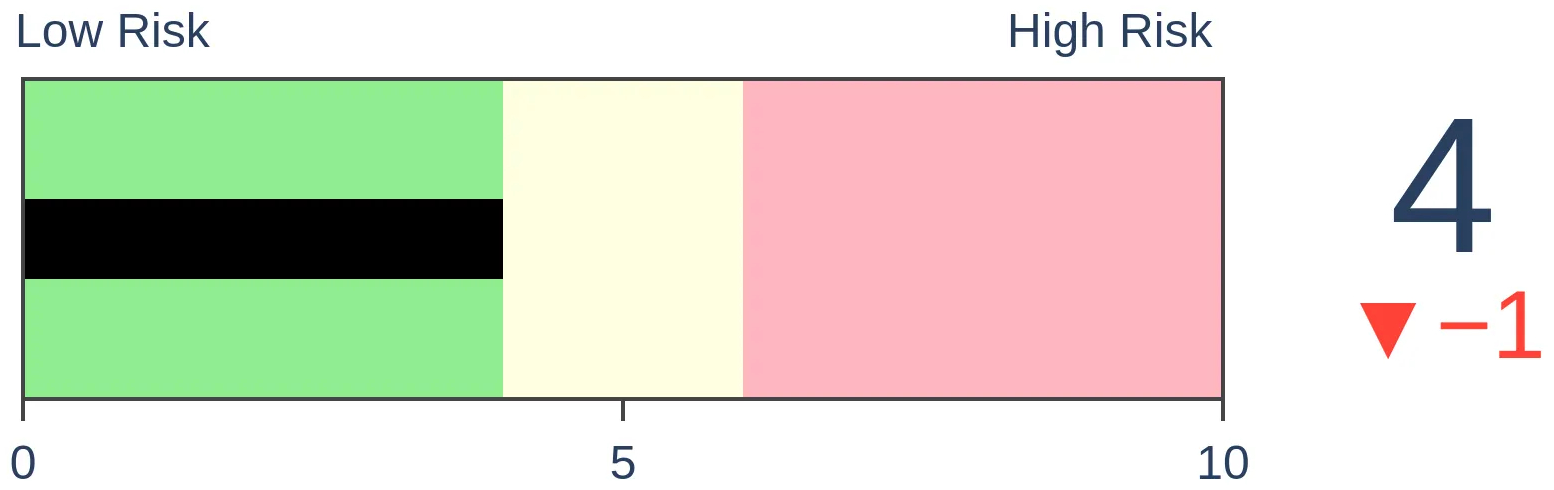
Stocks Medium-Term
|
|
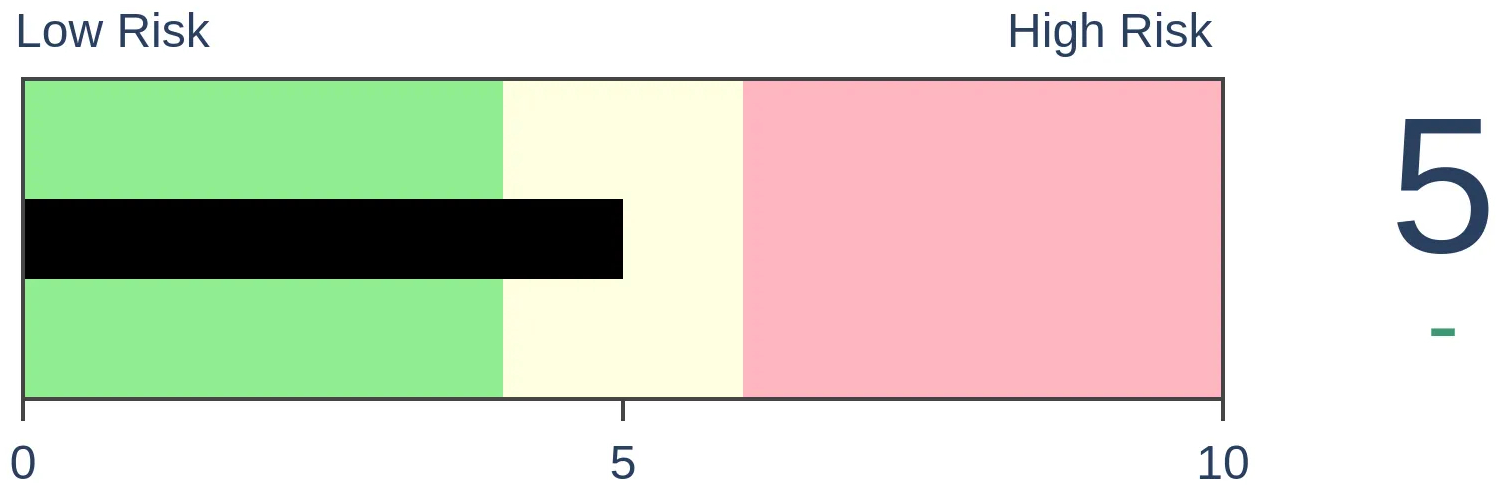
Bonds
|
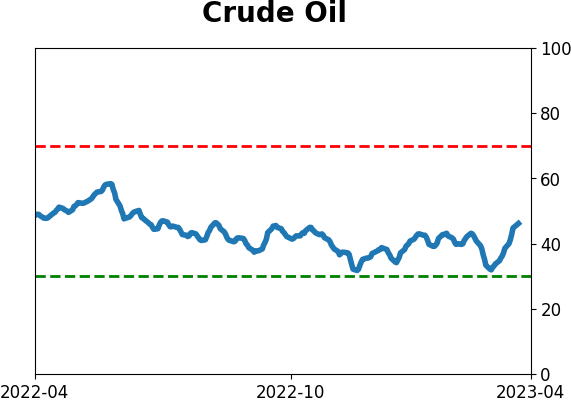
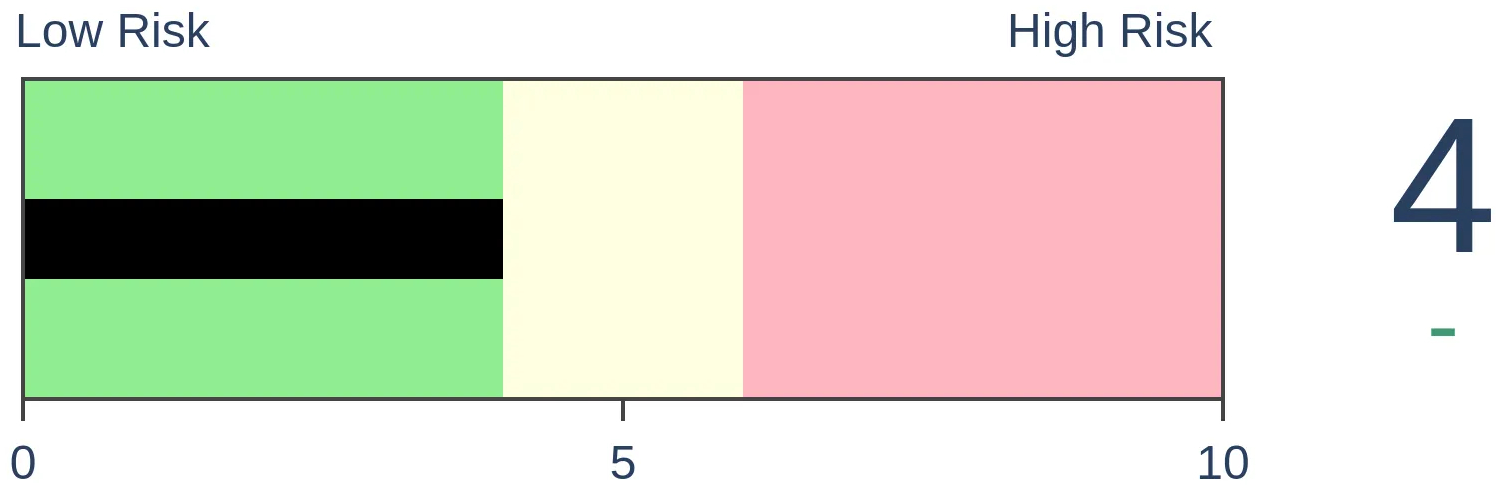
Crude Oil
|
|
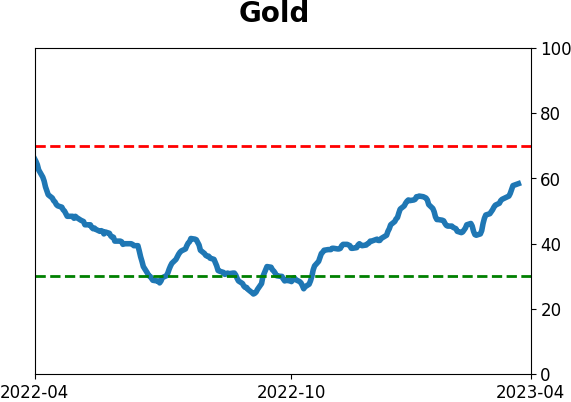
Gold
|
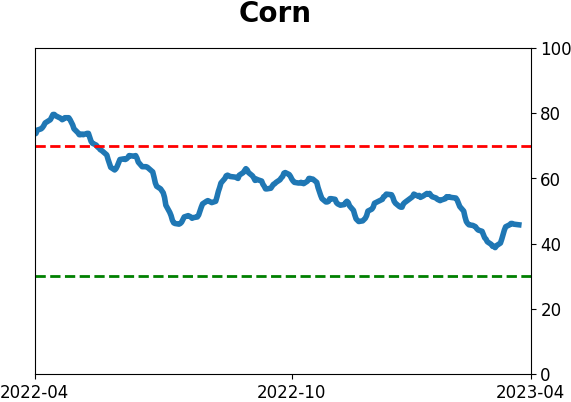
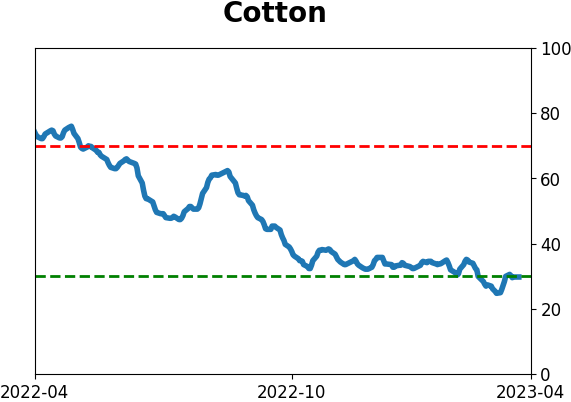
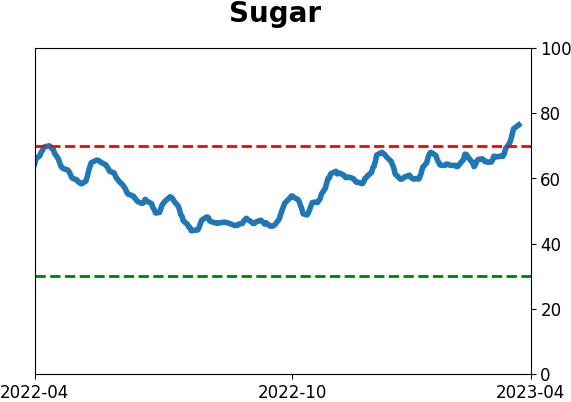
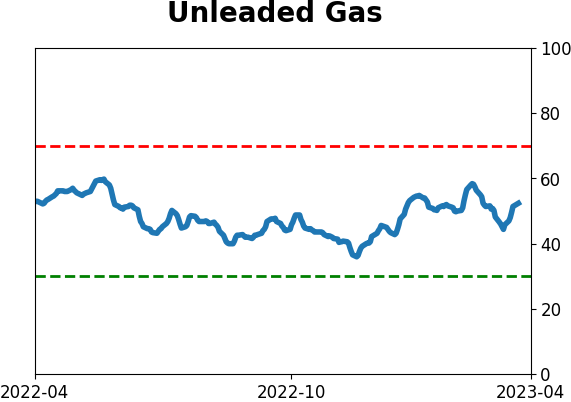
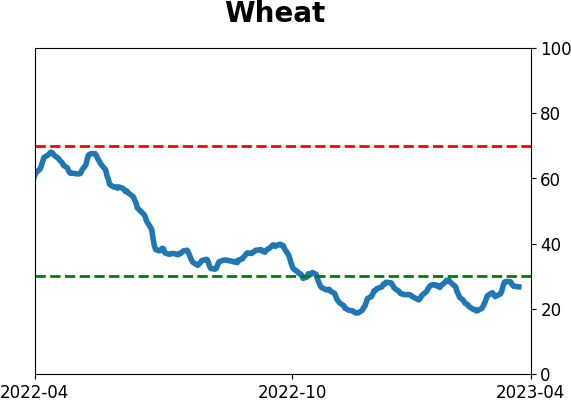
Agriculture

|
|
Research
By Jason Goepfert
BOTTOM LINE
Even though four stocks have driven most of the gains in the Nasdaq 100 since December, there is also a recovery under the surface. Fewer stocks are in corrections and bear markets than at any time since January 2022. After similar internal recoveries, the Nasdaq showed pristine returns, as did the S&P 500.
FORECAST / TIMEFRAME
None
|
Key points:
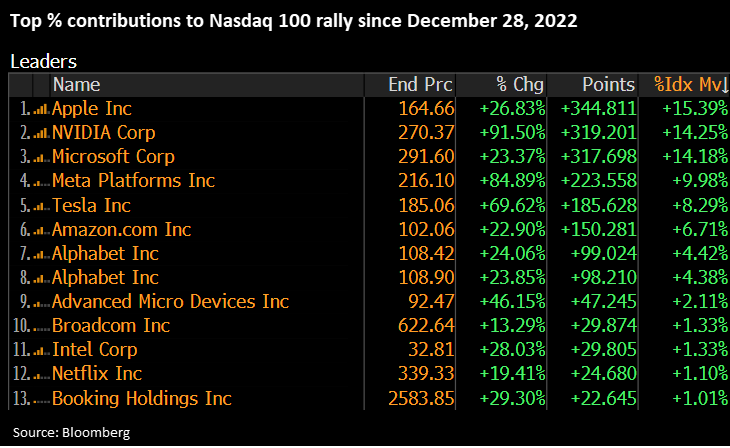
- Most of the Nasdaq 100's gain since December has been driven by only four stocks
- There has also been a recovery under the surface, with fewer stocks in corrections and bear markets
- Similar recoveries over the past 40 years preceded pristine returns in the Nasdaq and S&P
A few stocks are driving the Nasdaq 100, but lots of others are contributing
Thanks to a renewed interest in large technology stocks, the Nasdaq 100 has recovered more than 22% from its December low. Much of that has been driven by the largest stocks, with only four stocks contributing more than half the percentage gain in the index.
But not all of it.
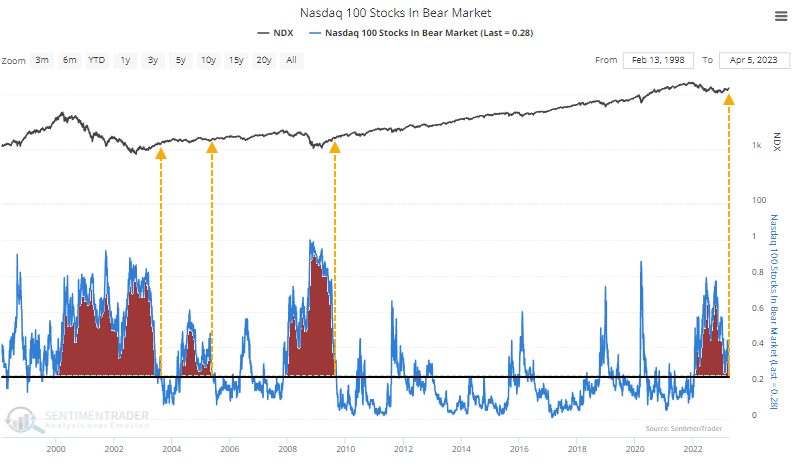
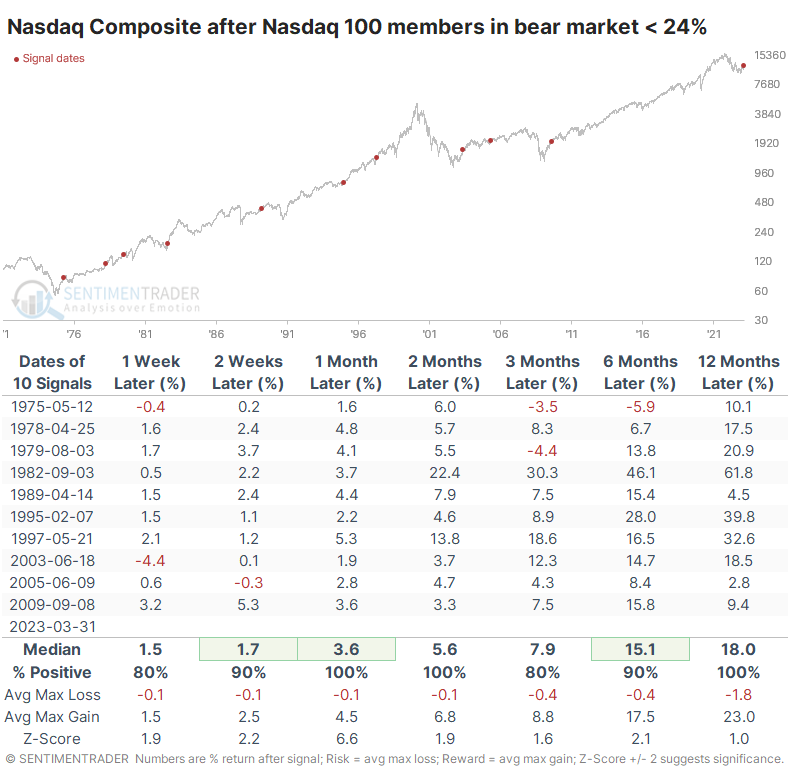
The percentage of stocks in the Nasdaq 100 that are in bear market territory, down 20% or more from their 52-week high, recently plunged below 24%. That's the lowest since January 2022 and is a stark change from last year when nearly 80% of companies were in bear markets.
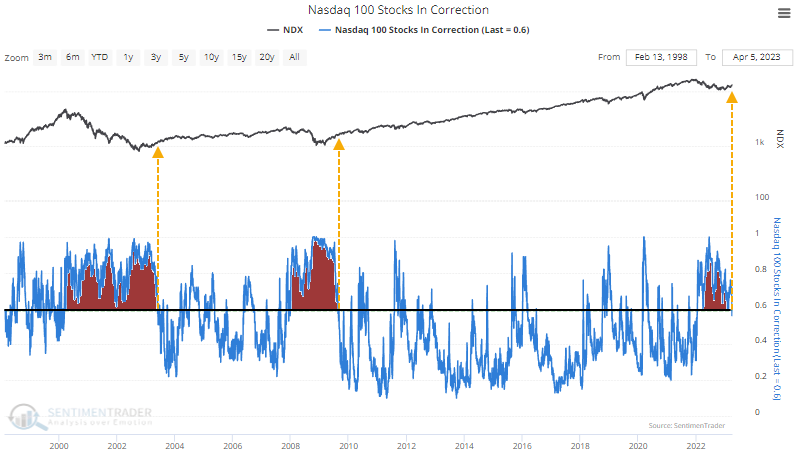
 Likewise, the percentage in correction territory, down 10% or more, has slid below 59%.
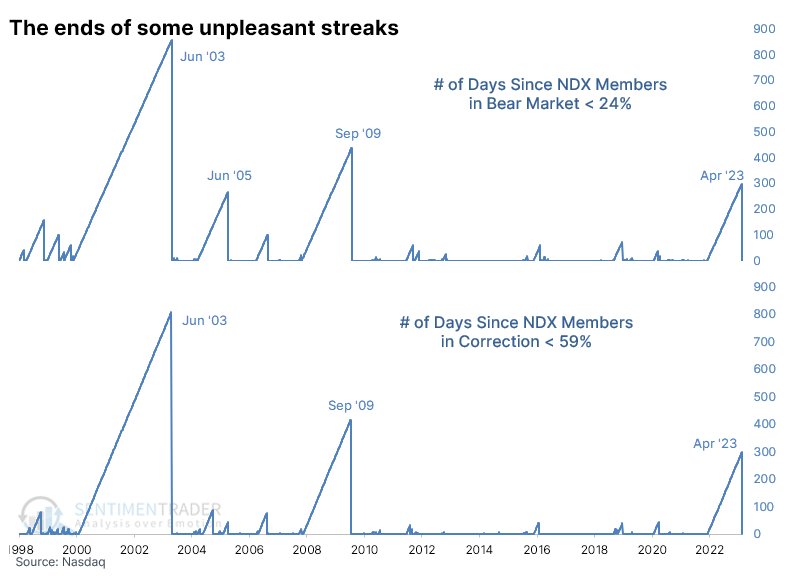
The ends of long corrections and bear markets preceded pristine returns
These recoveries ended some of the longest streaks with many struggling stocks over the past 23 years.
 We can use a slightly different data source that recreates Nasdaq 100 data from the early 1970s to understand what this might have looked like in prior decades.
Using that and the Nasdaq Composite index for return calculations, the ends of long streaks with so many stocks in bear markets preceded pristine returns. Losses were rare to nonexistent across time frames, risk was exceptionally low, and forward returns were impressive.
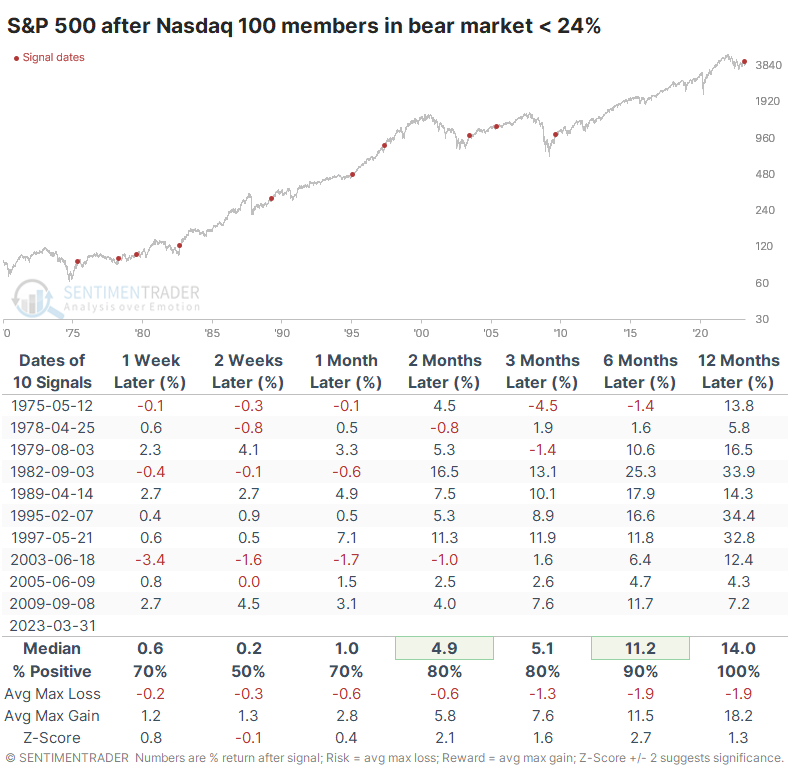
It was an excellent sign for the S&P 500 as well. That index showed less consistency in the short-term, but medium- to long-term returns were exceptional.
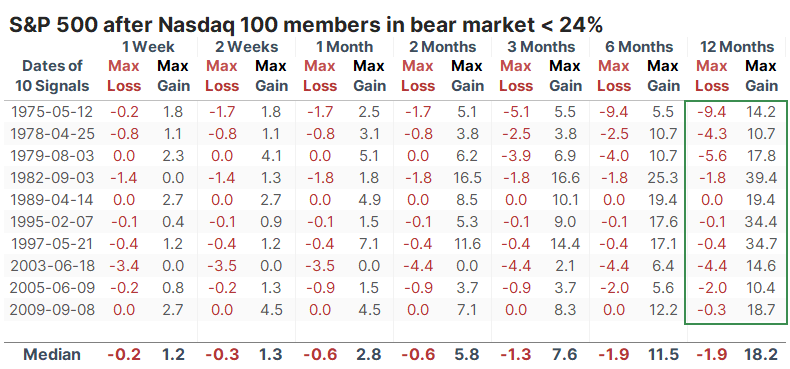
The table of maximum losses and maximum gains across each time frame shows that the S&P never pulled back more than 10% at any point after any signal within the following year. At the same time, every signal saw a gain of at least +10% at some point.
What the research tells us...
Last week, Dean noted that price trends in the Nasdaq 100 and long-term trends in the stocks within the index had reversed from deeply negative to positive, which indicated favorable forward conditions. We see that with this data as well, with reversals in the percentage of stocks down 10% or even 20% from their peaks.
Forward returns after recoveries like this were highly compelling for the broader market and Technology stocks in particular. Even if a handful of stocks are driving the index's gains, there has also been a notable and impressive recovery under the surface. And that's a good thing.
Indicators at Extremes
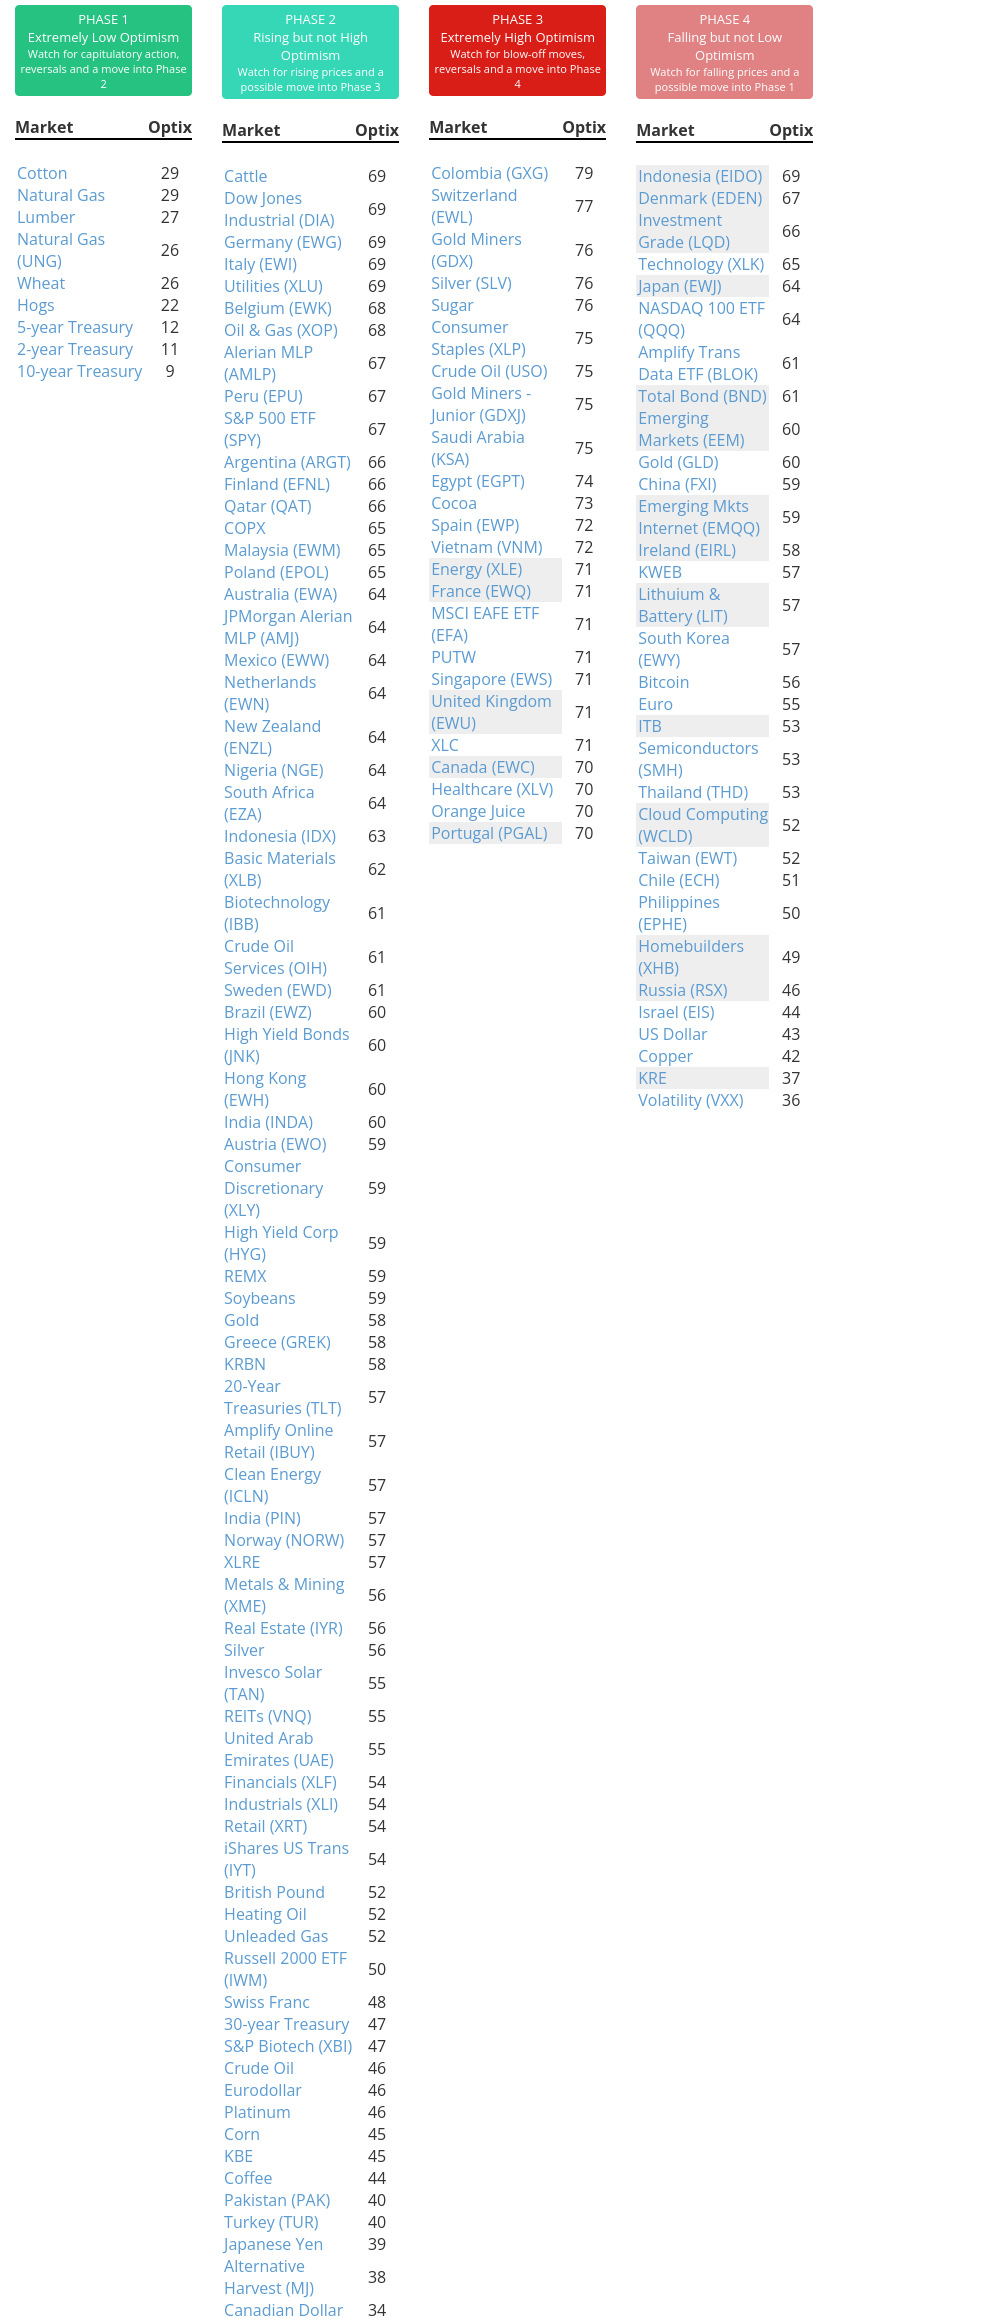
Phase Table
Ranks
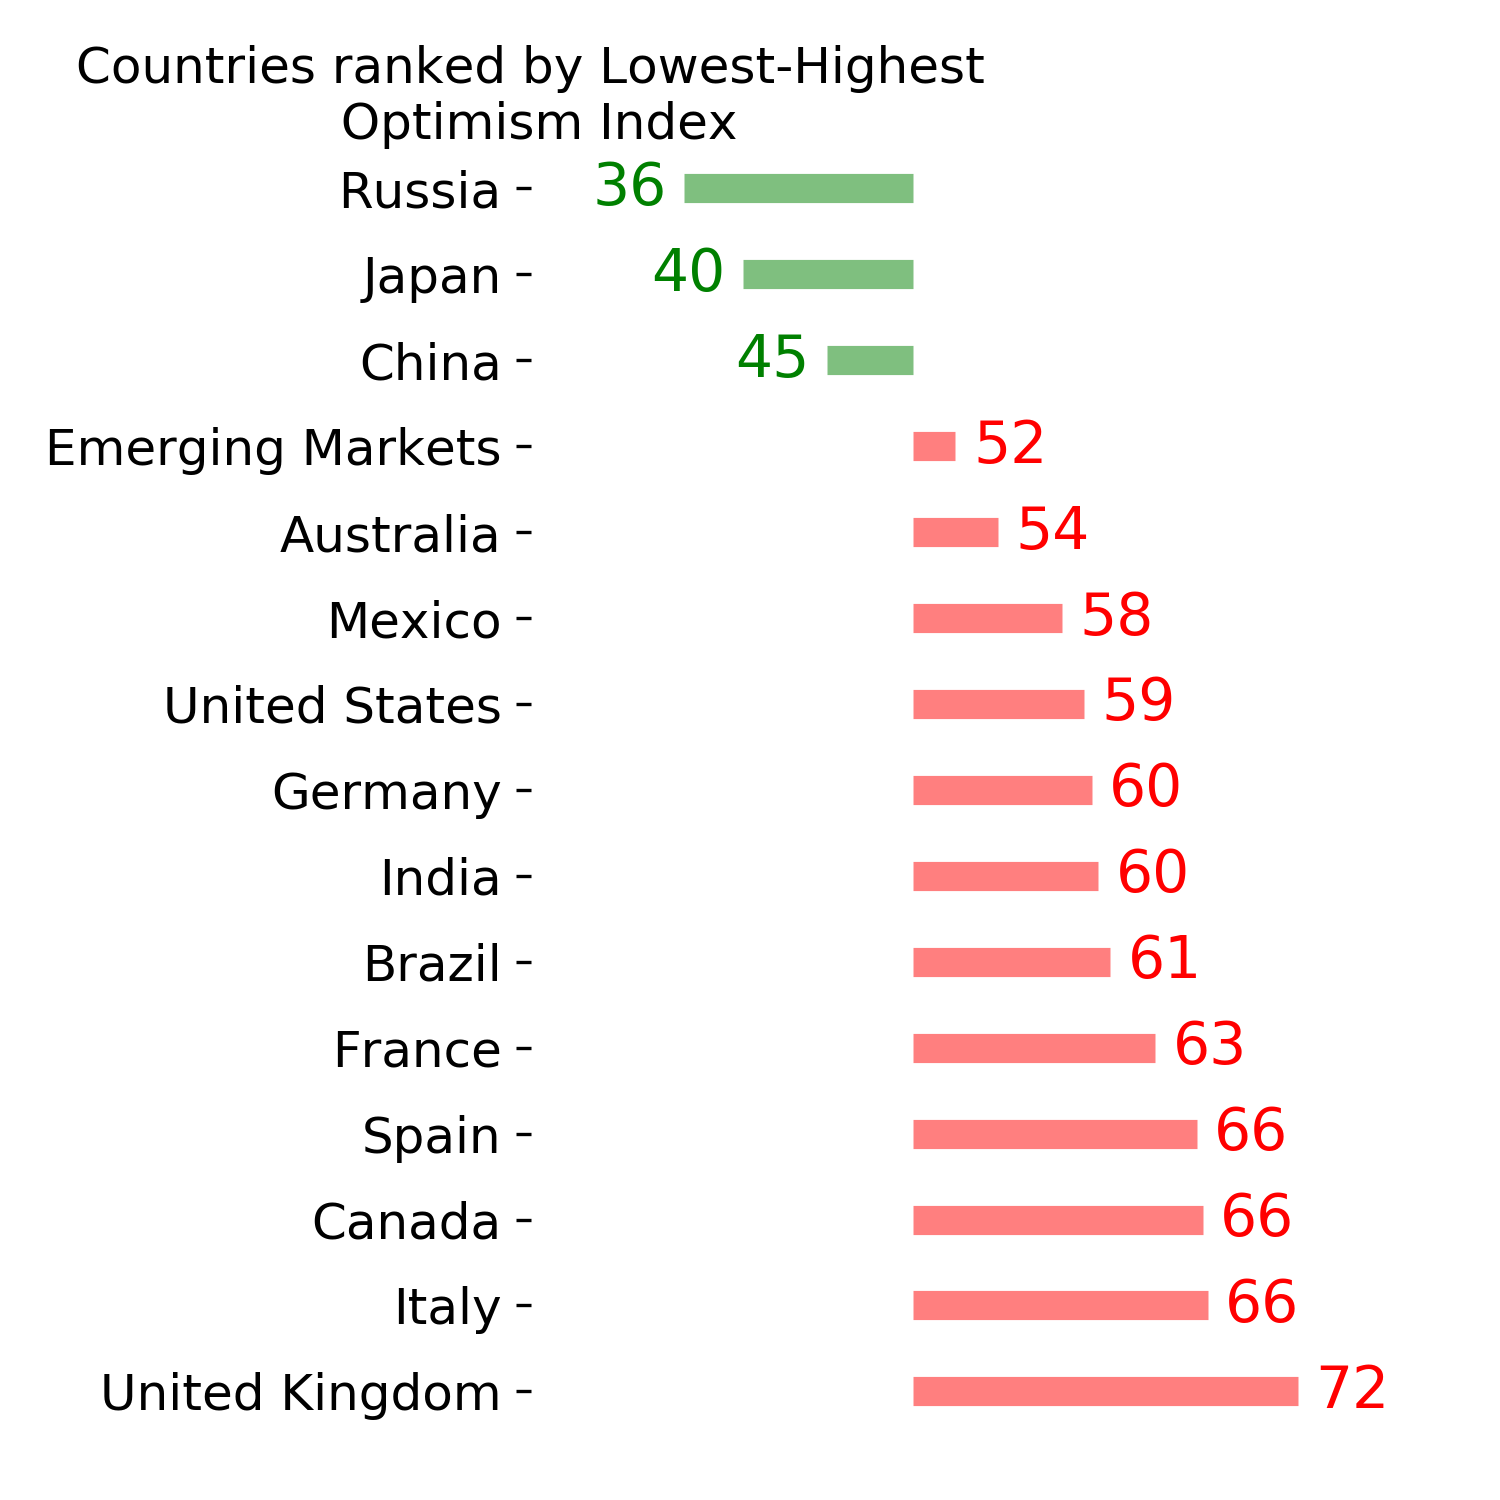
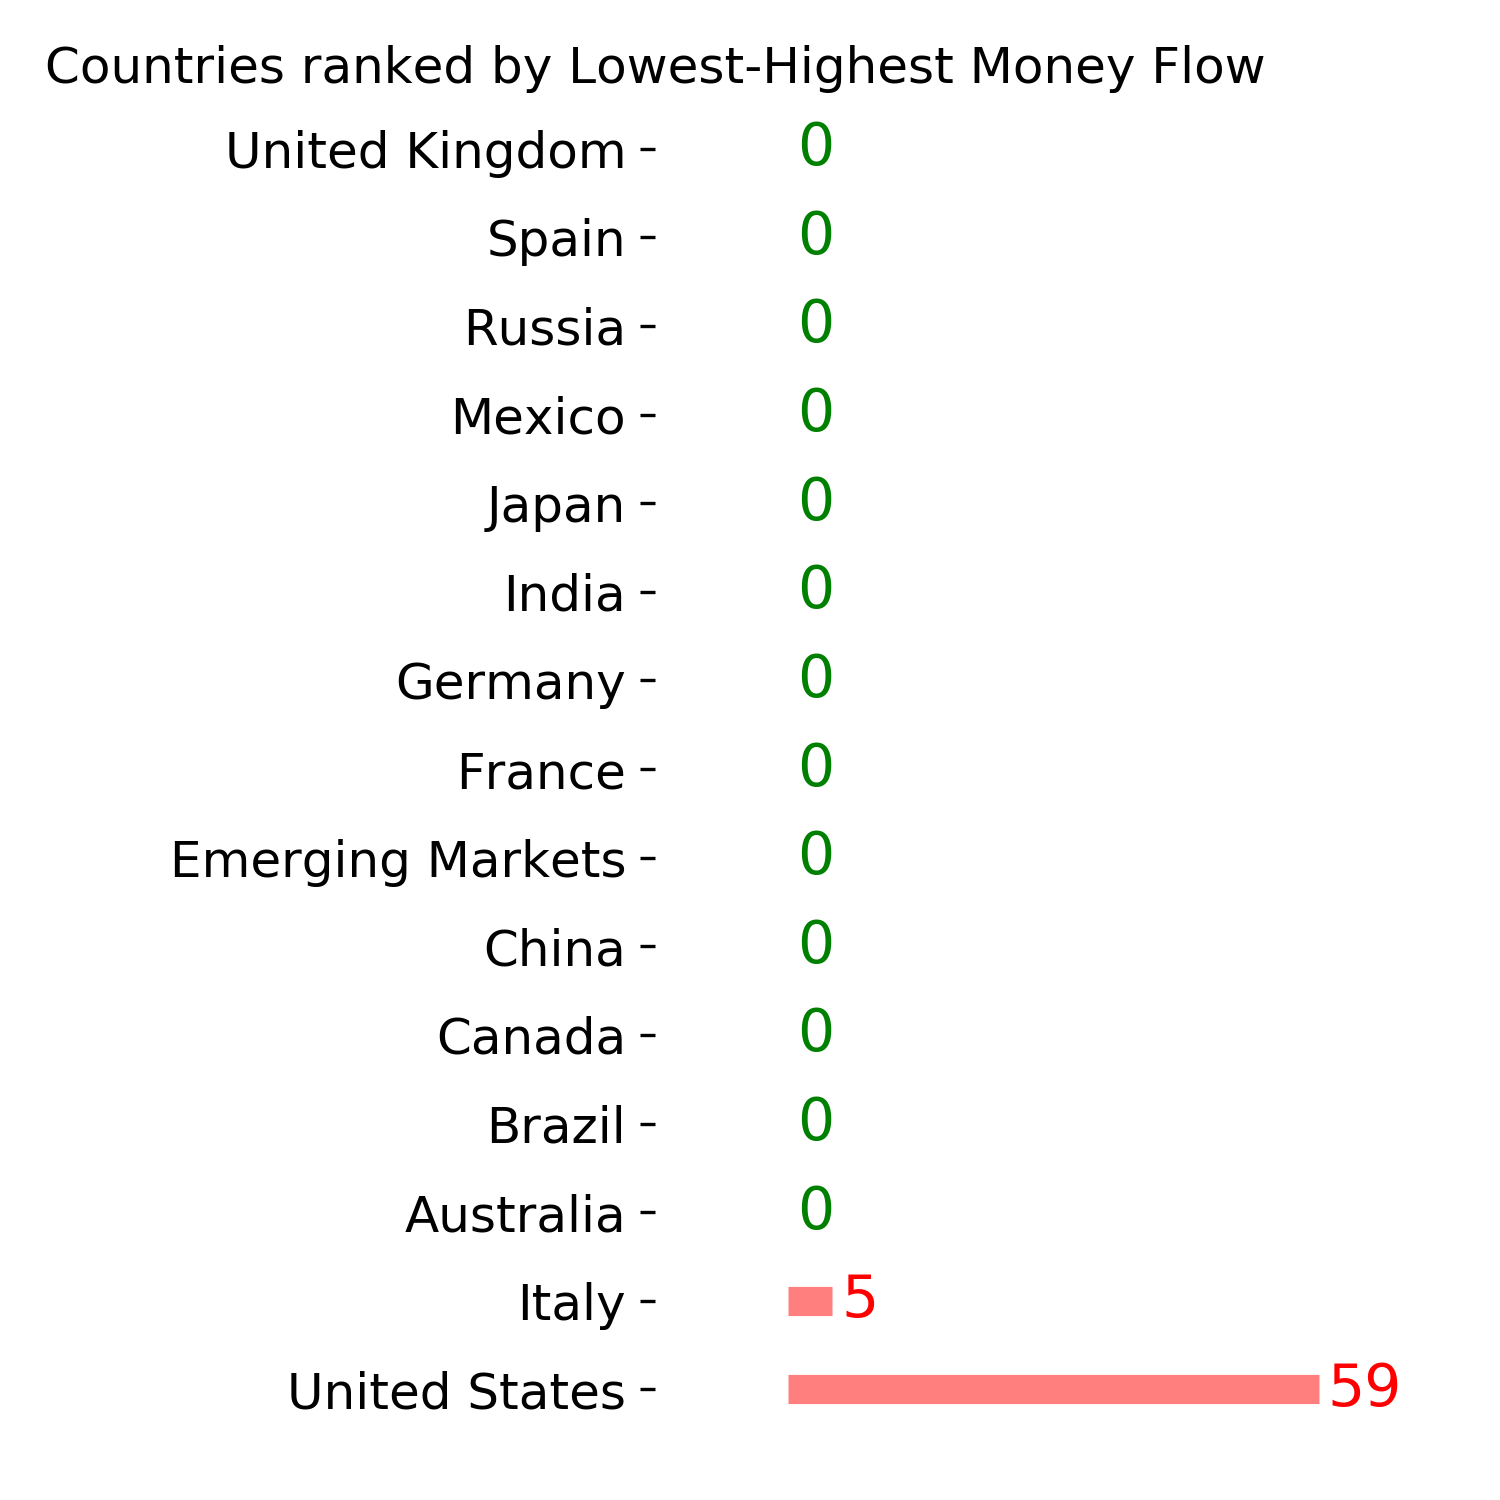
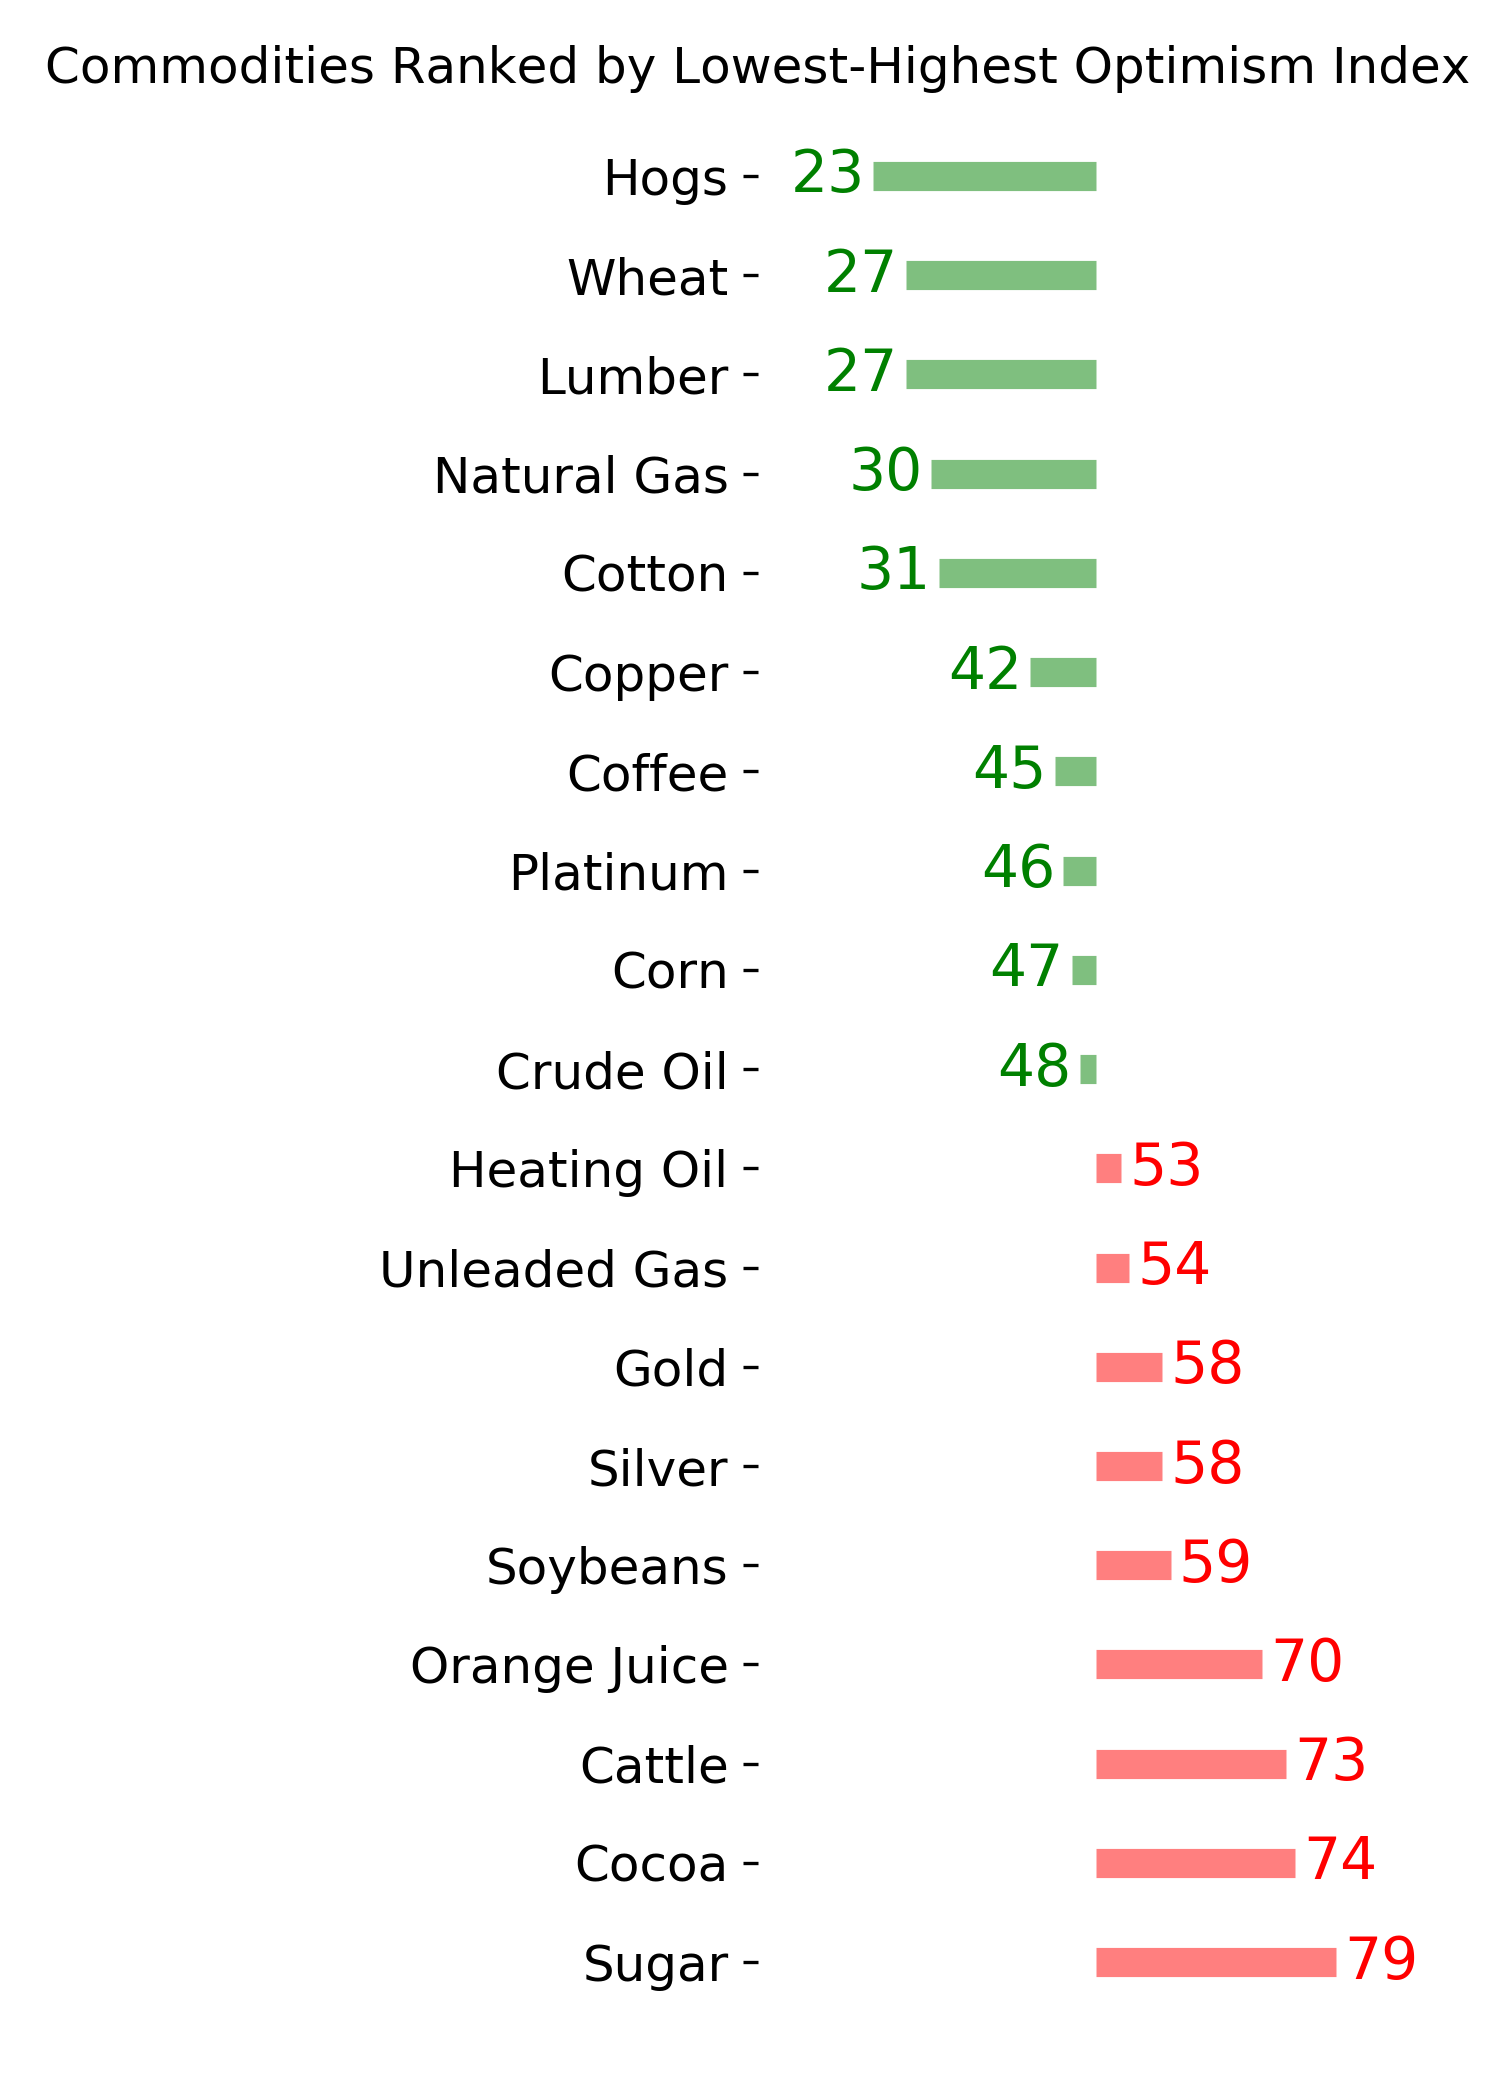
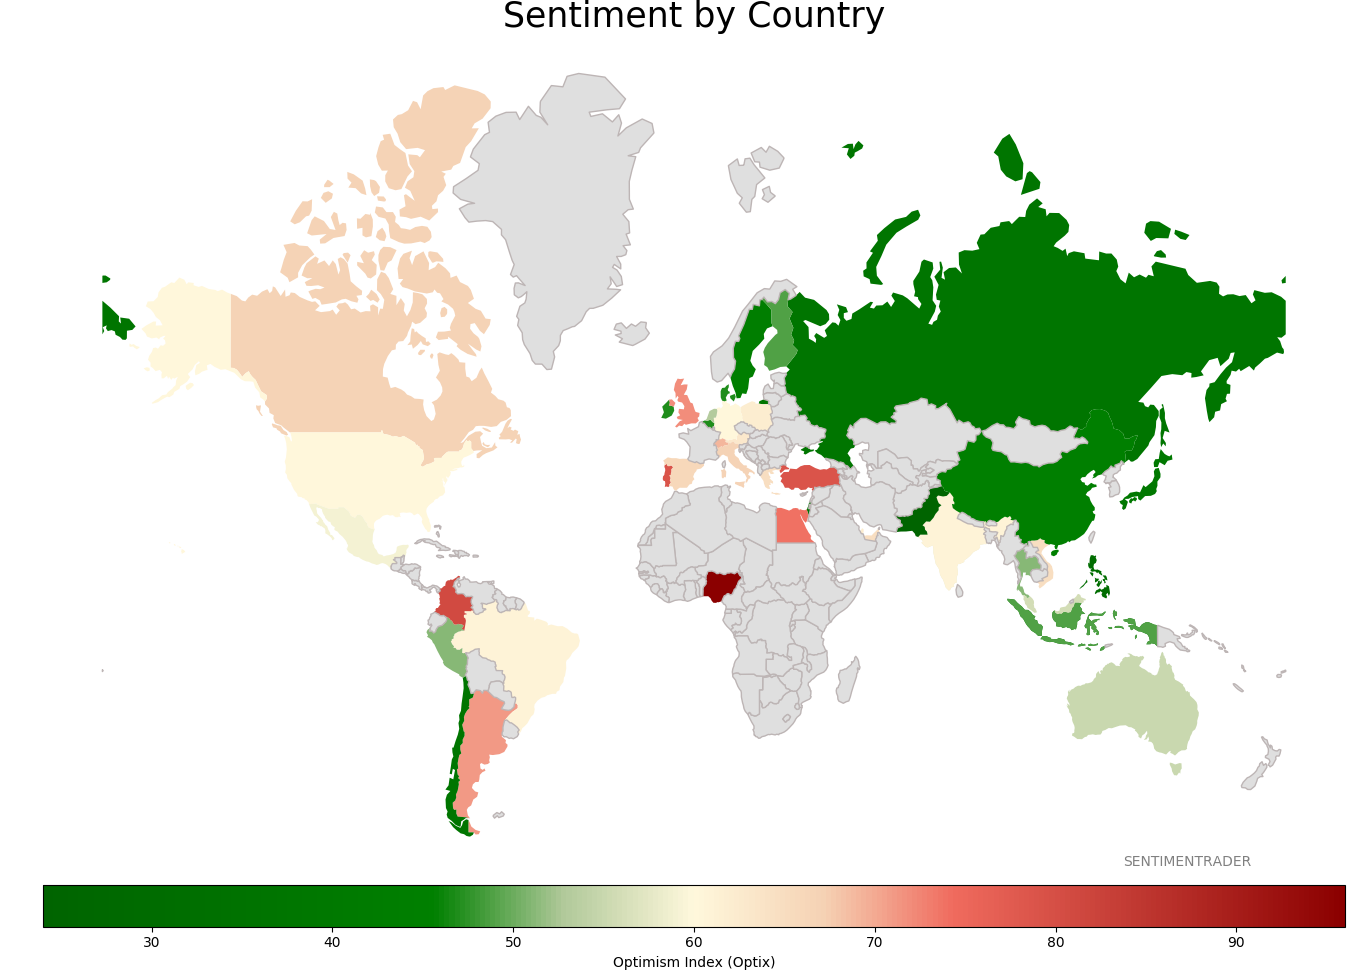
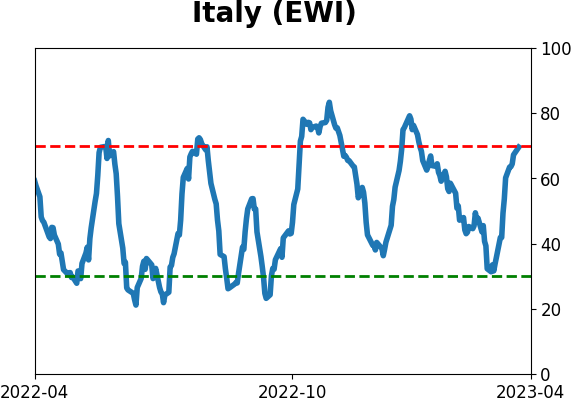
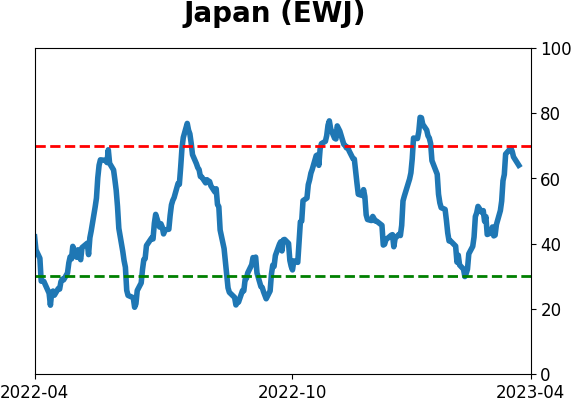
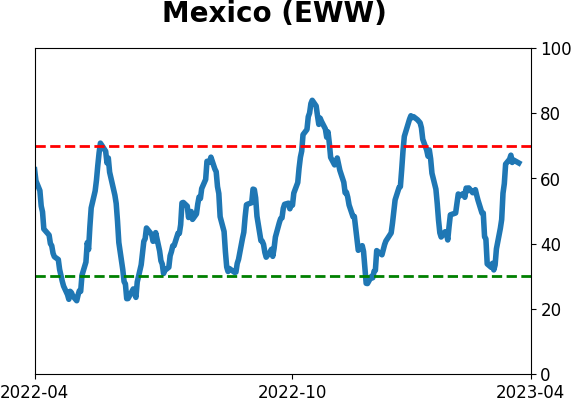
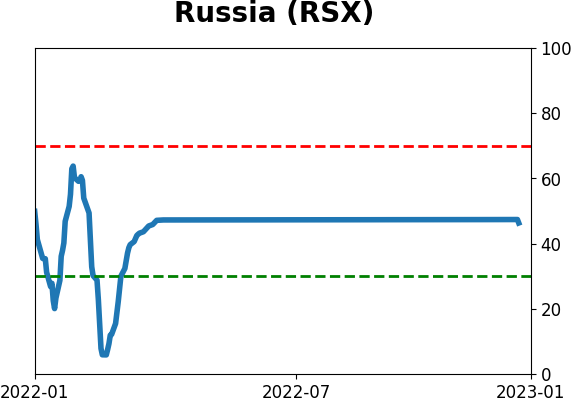
Sentiment Around The World
Optimism Index Thumbnails
|
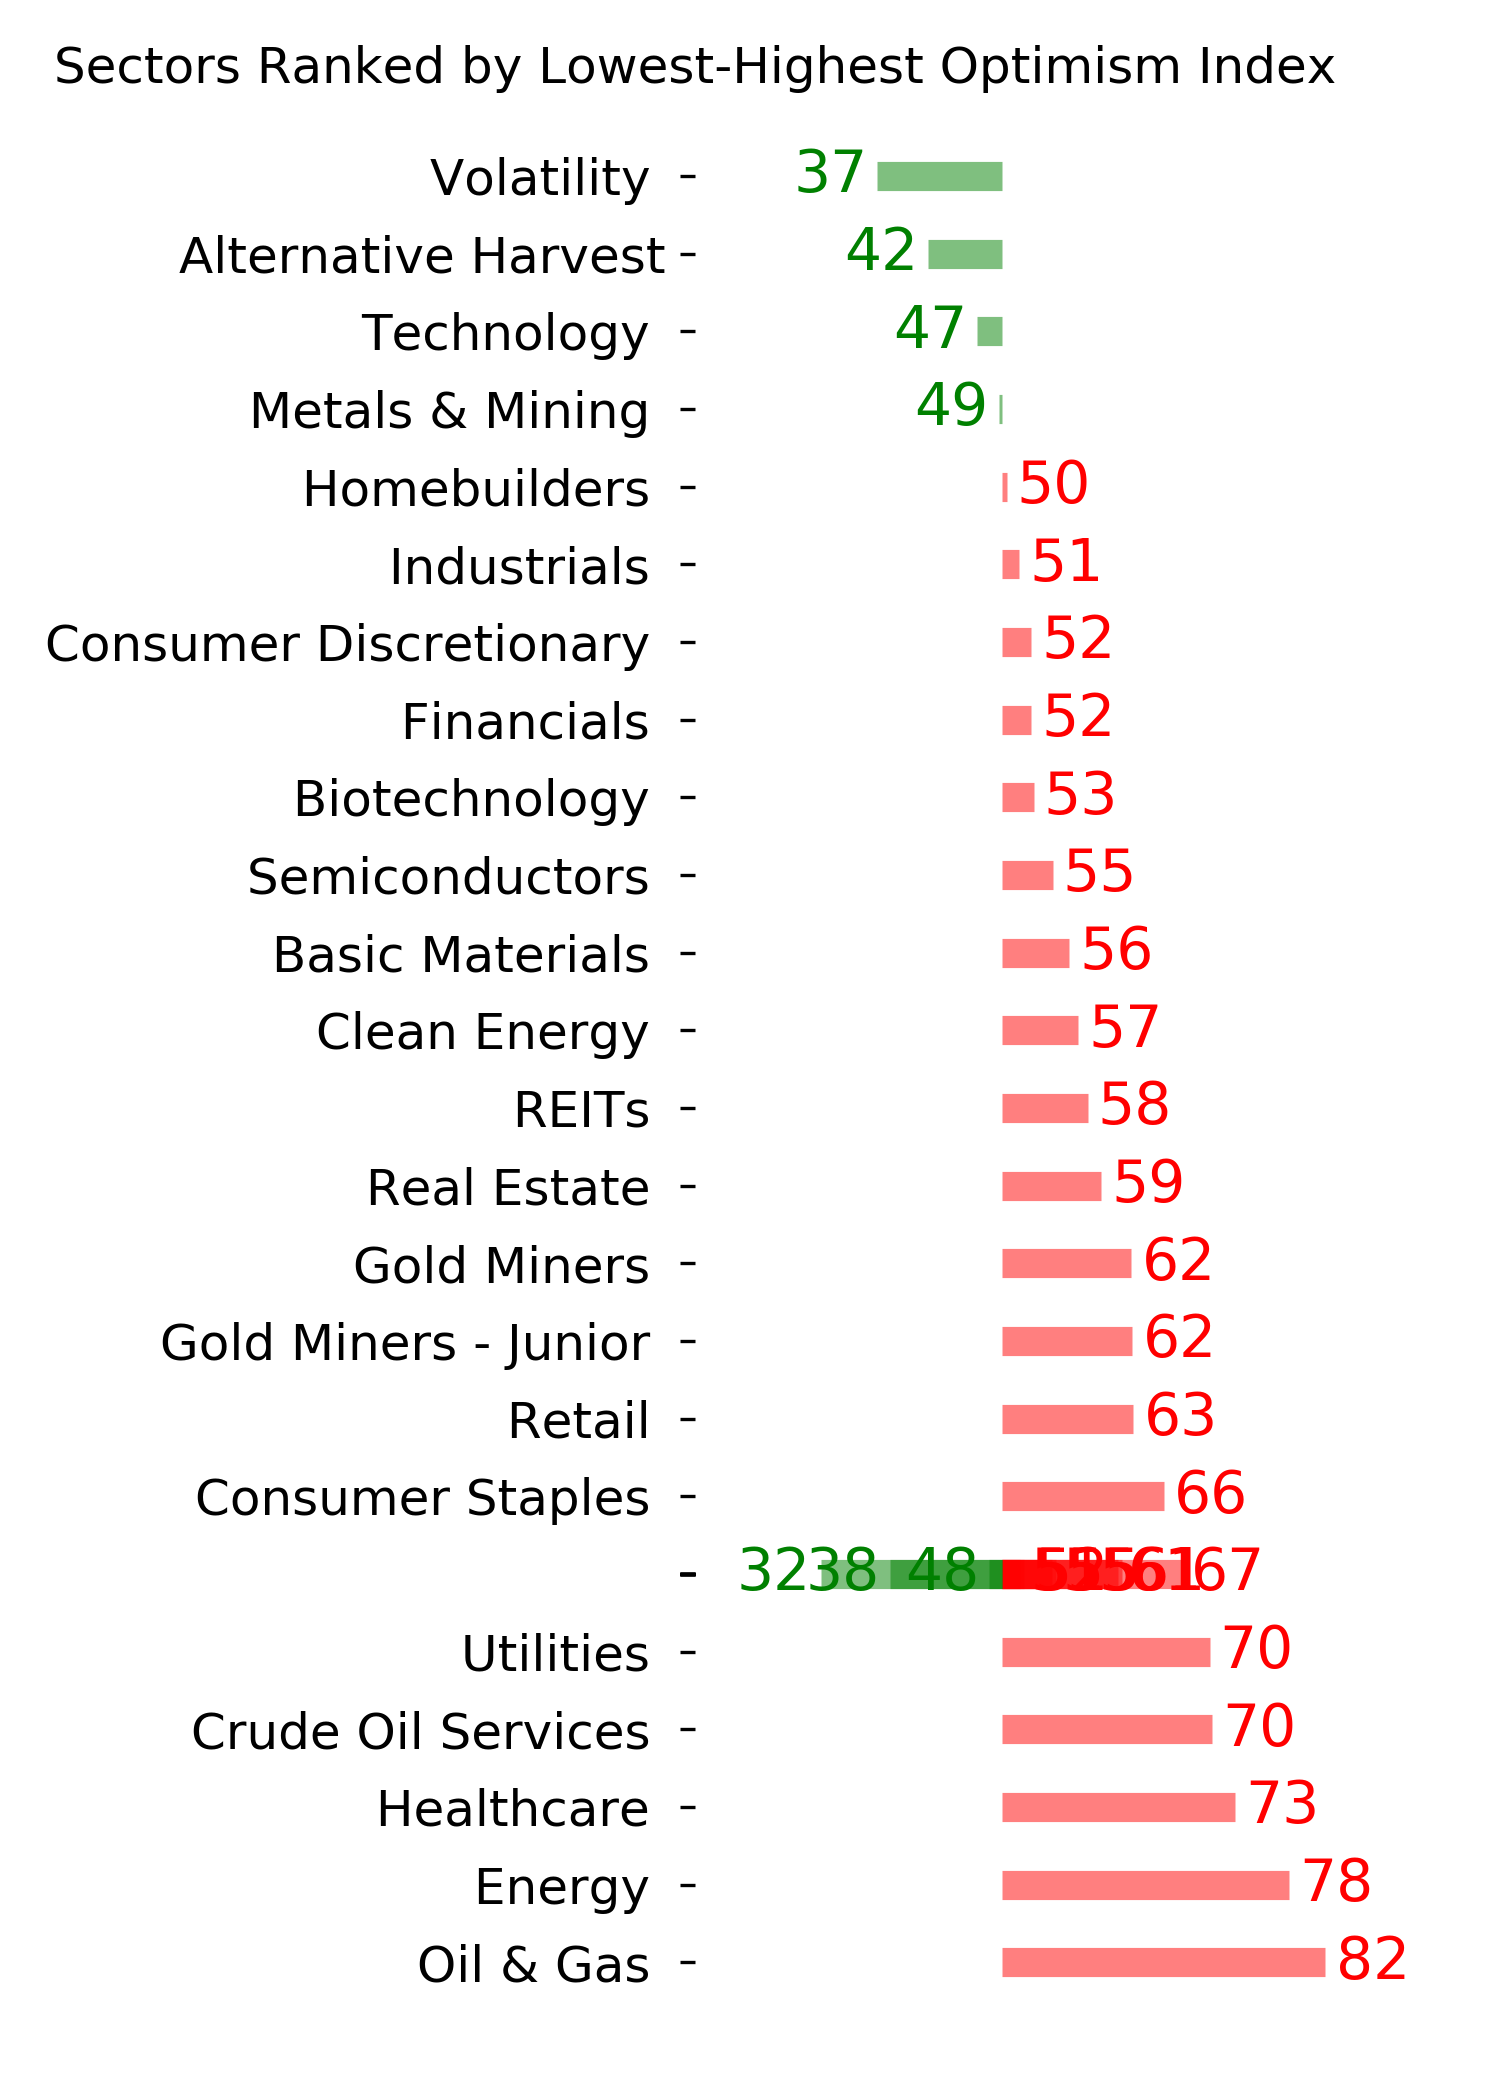
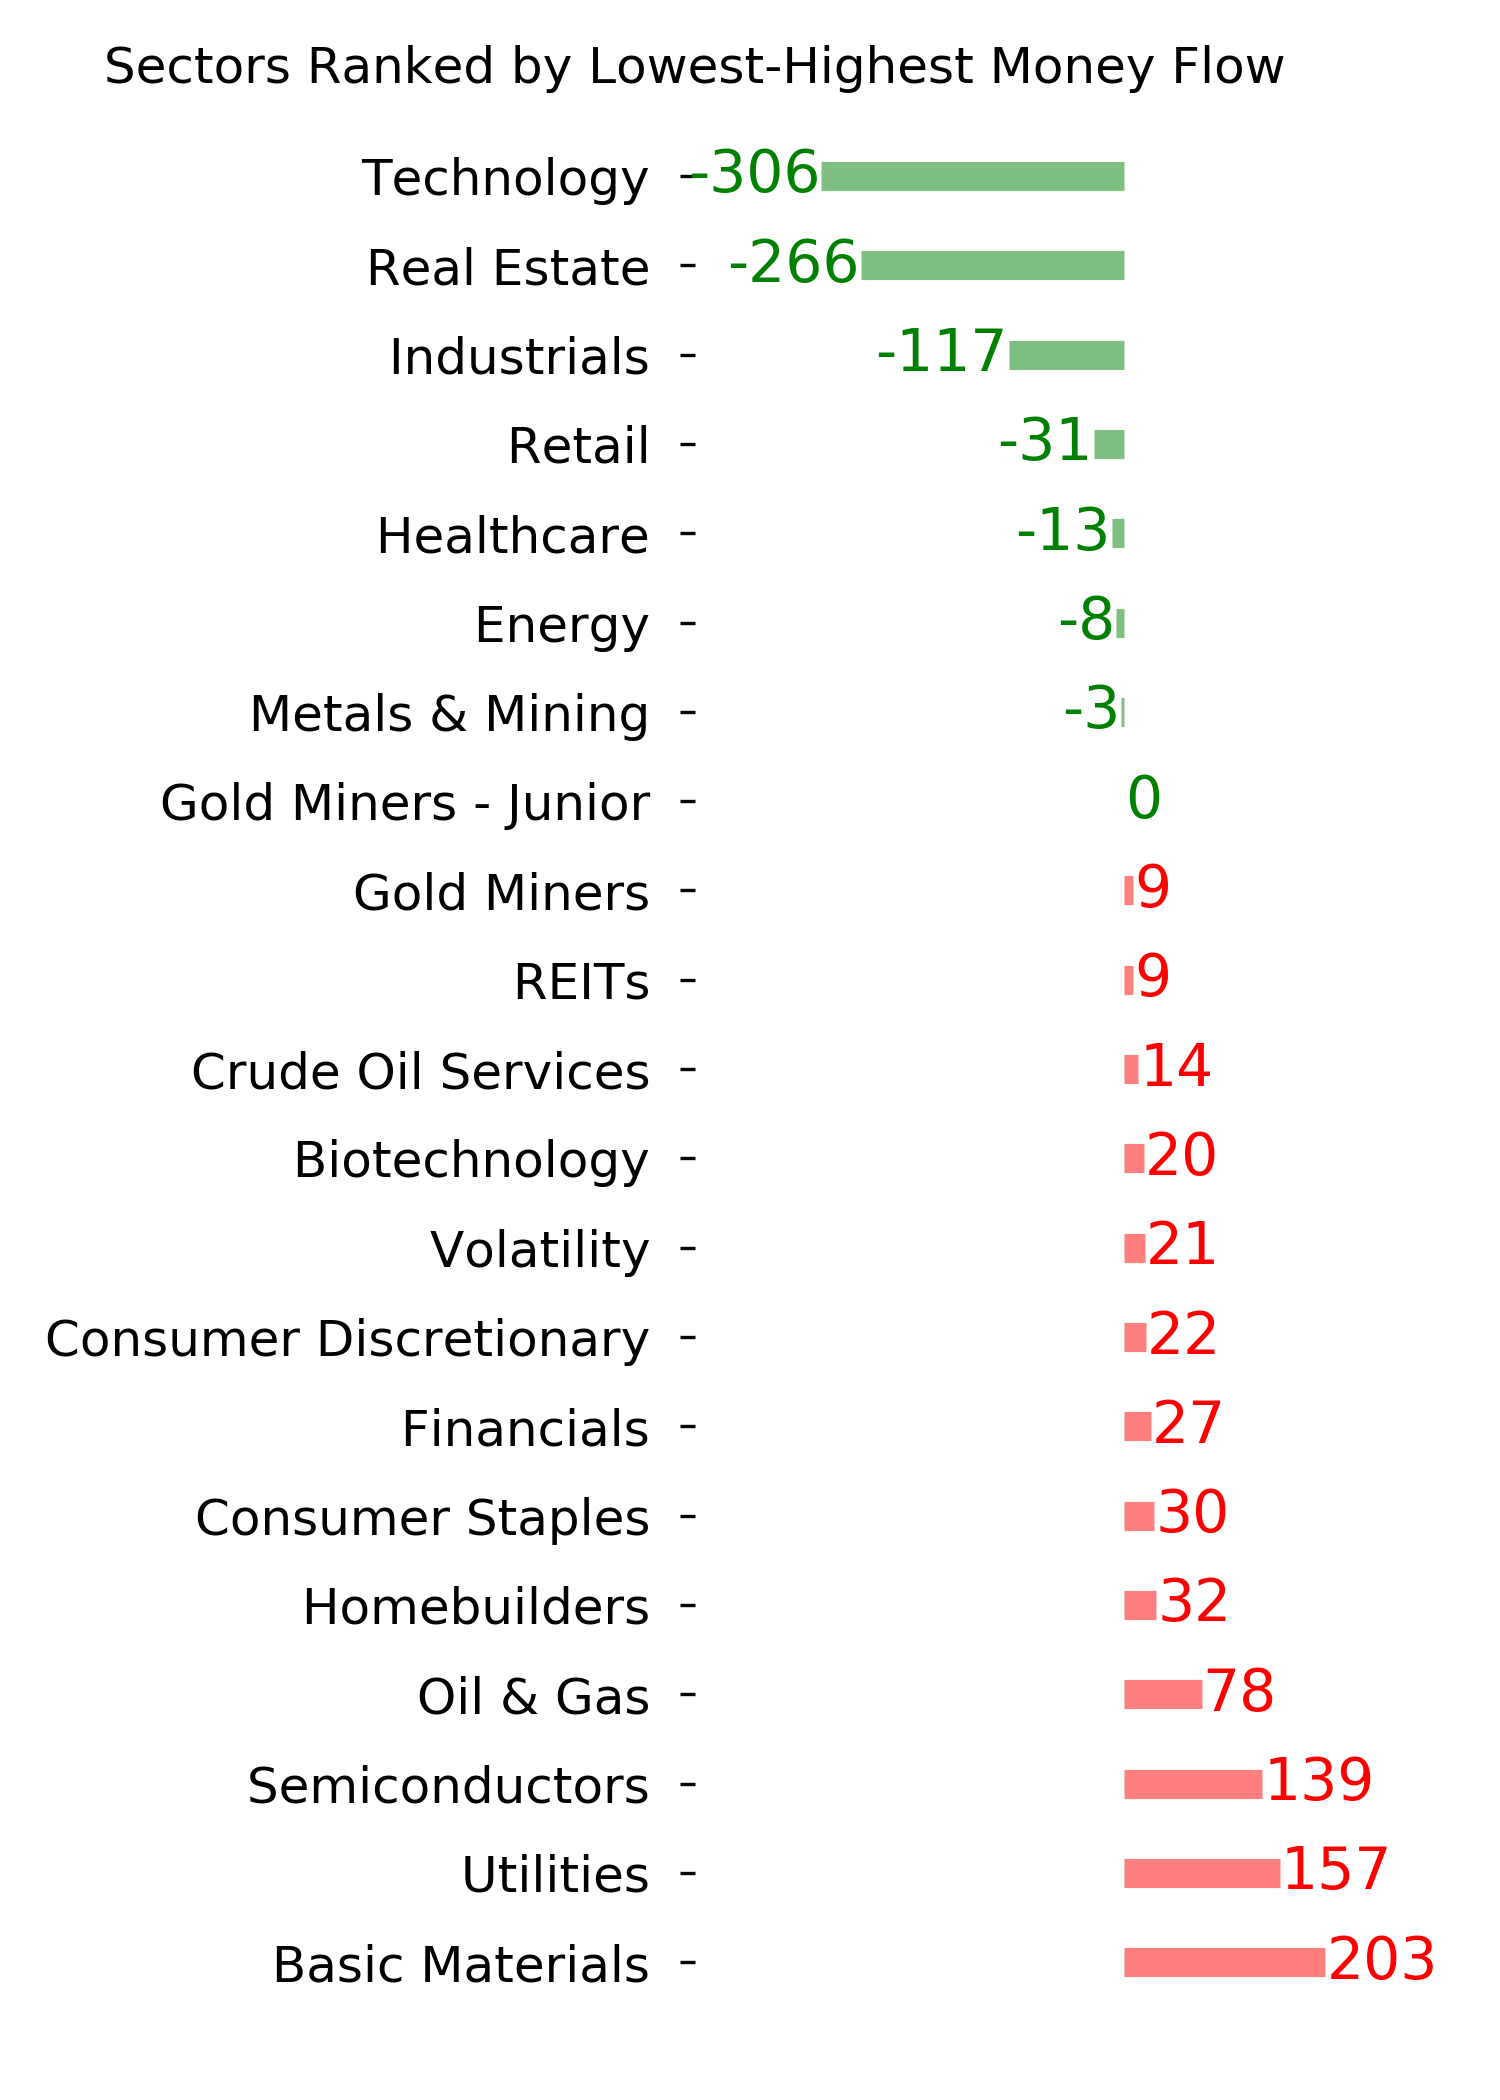
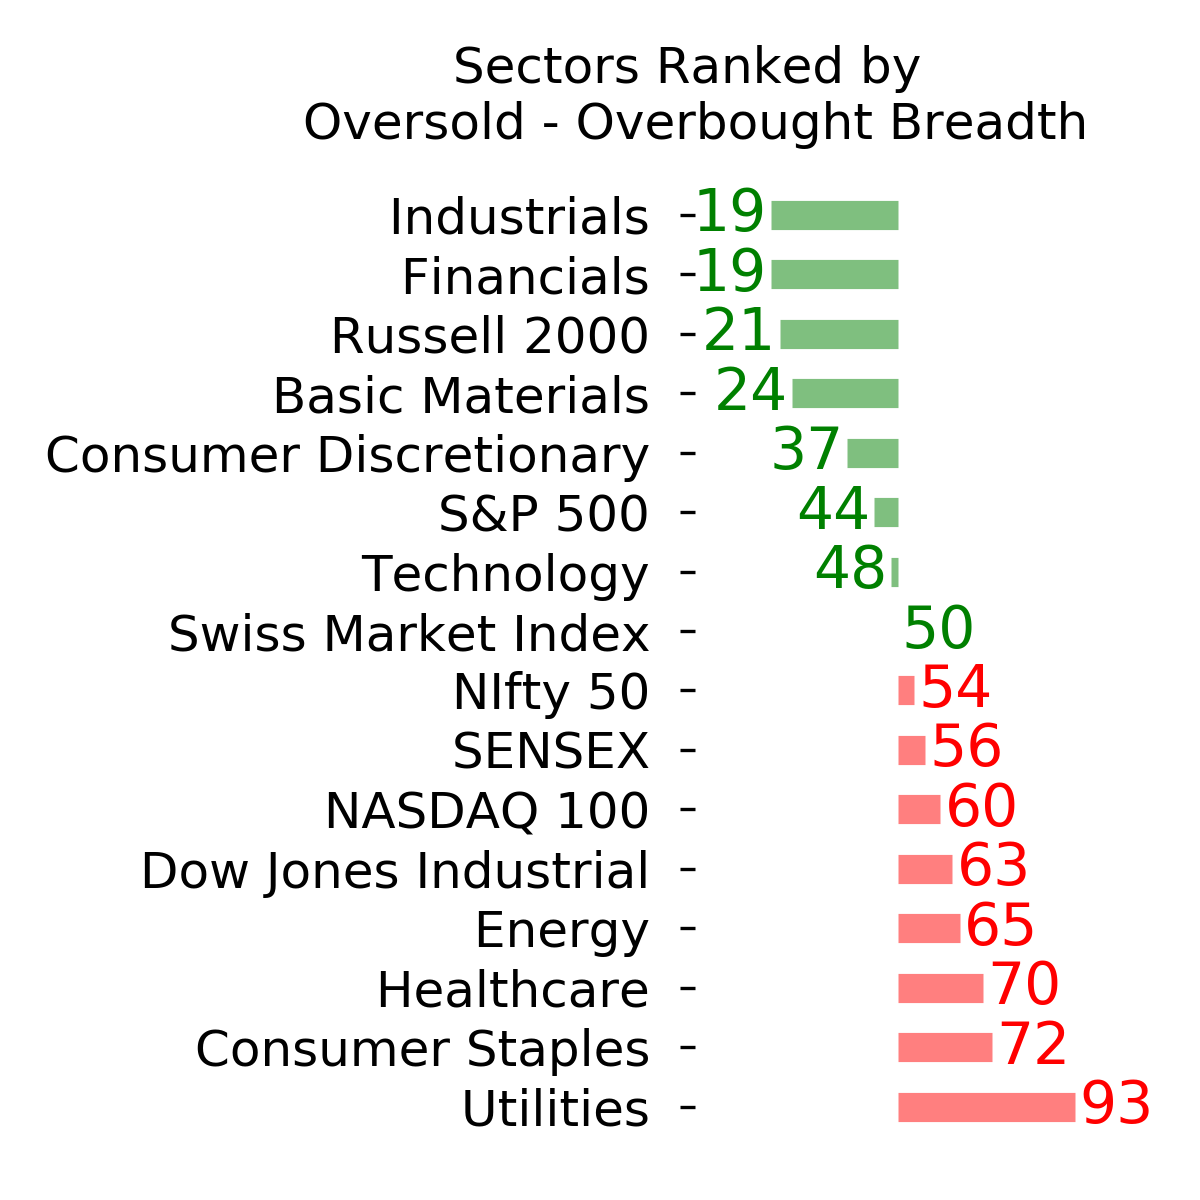
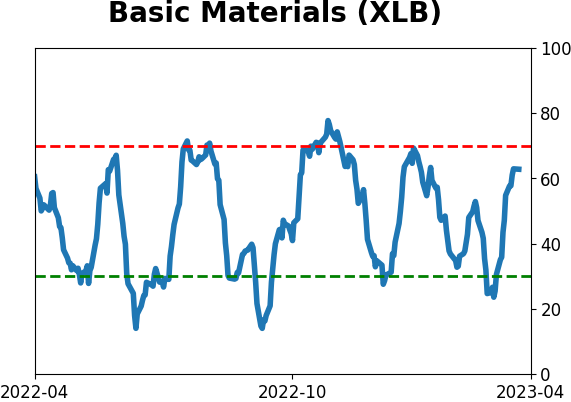
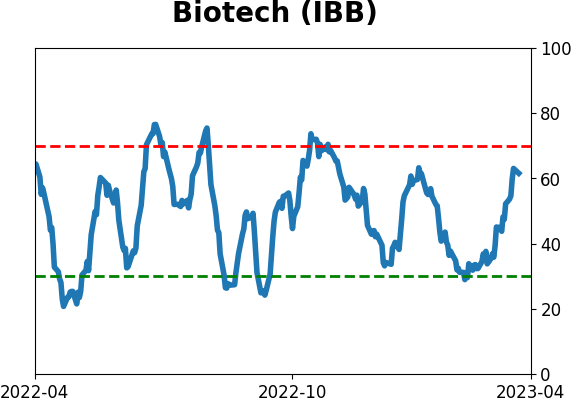
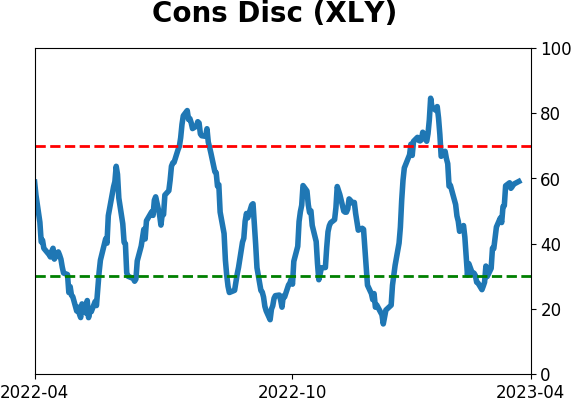
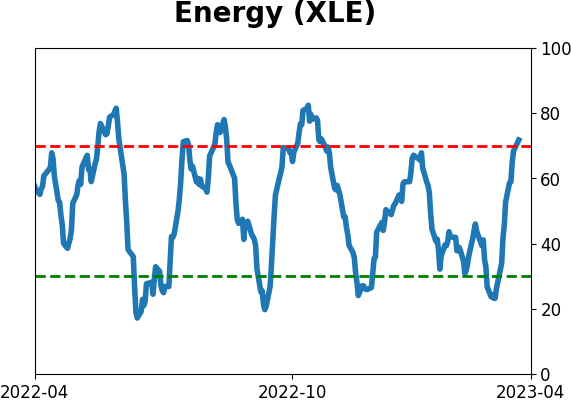
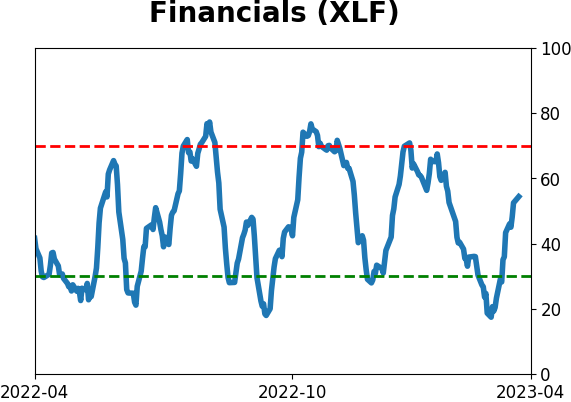
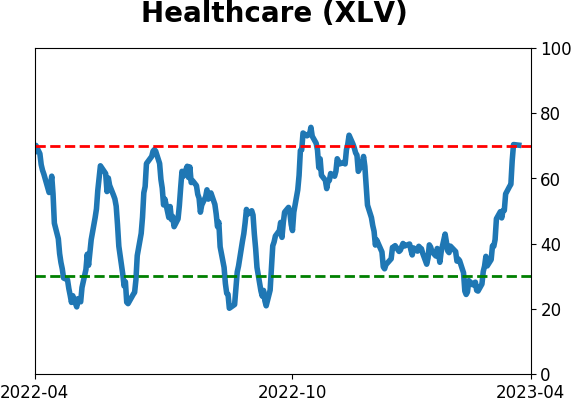
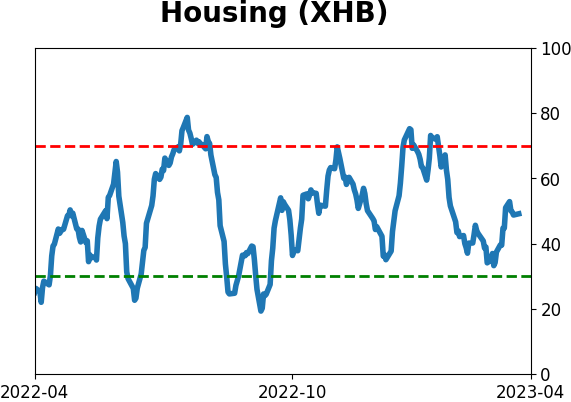
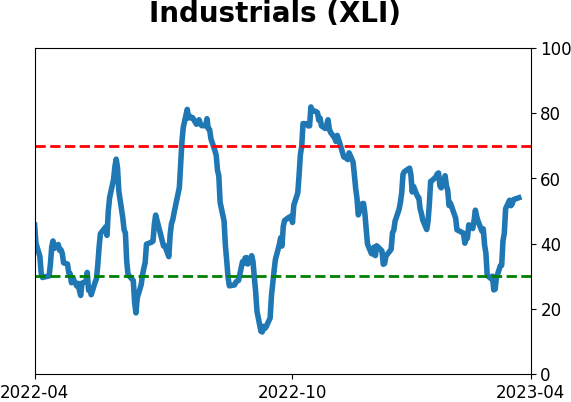
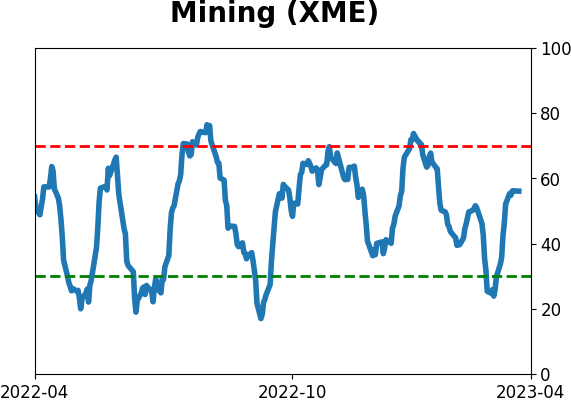
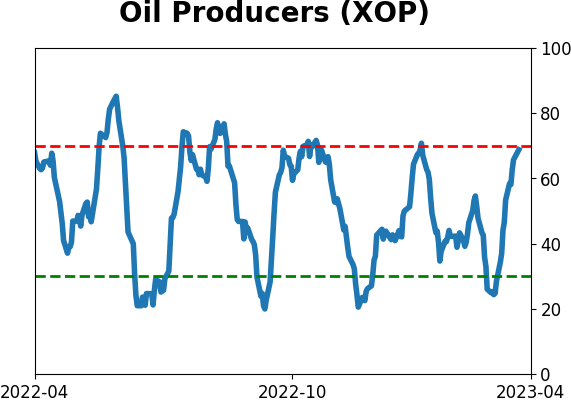
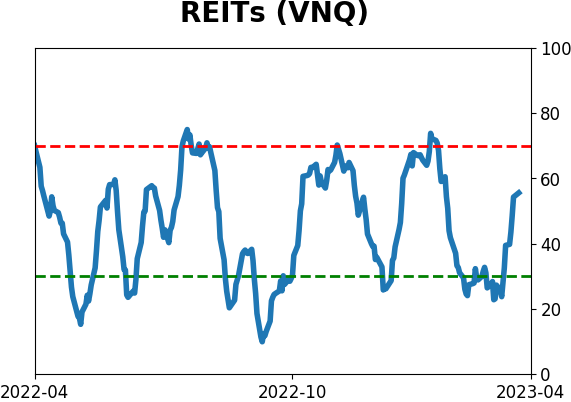
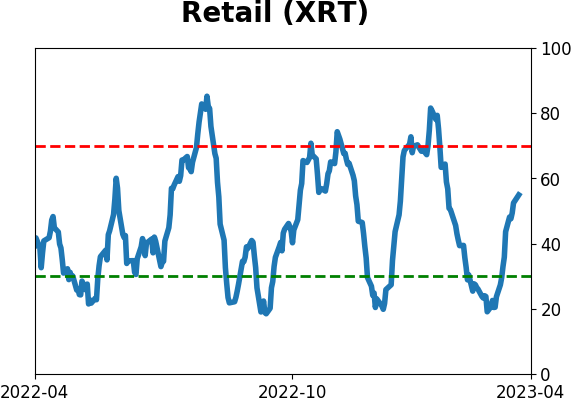
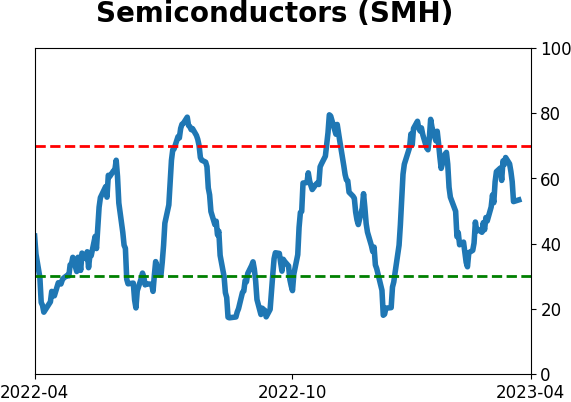
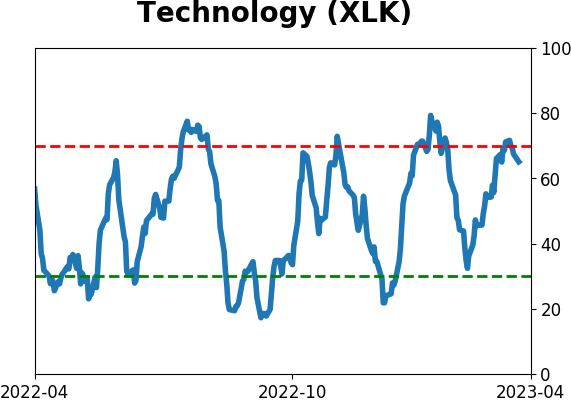
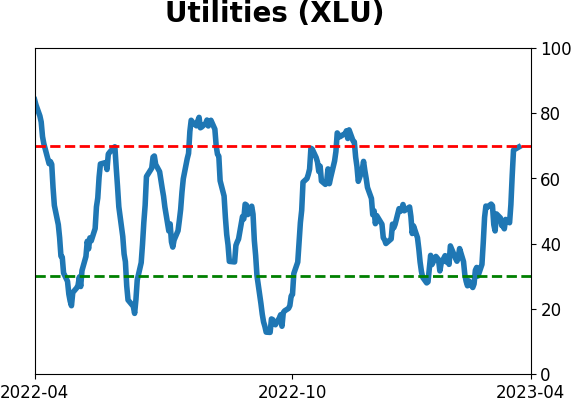
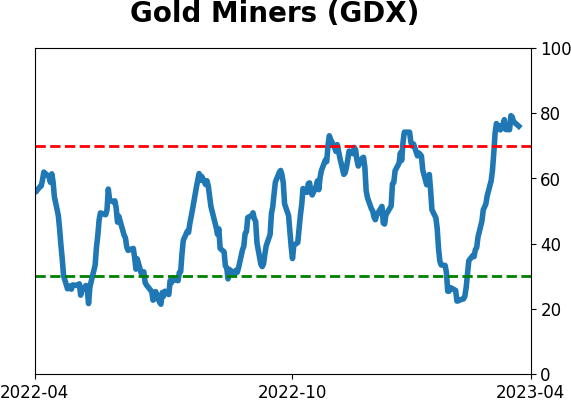
Sector ETF's - 10-Day Moving Average
|
|
|
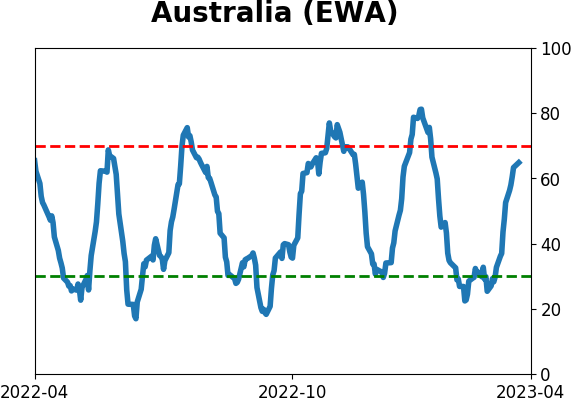
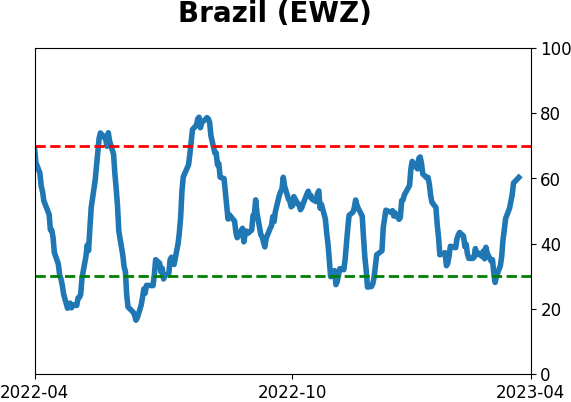
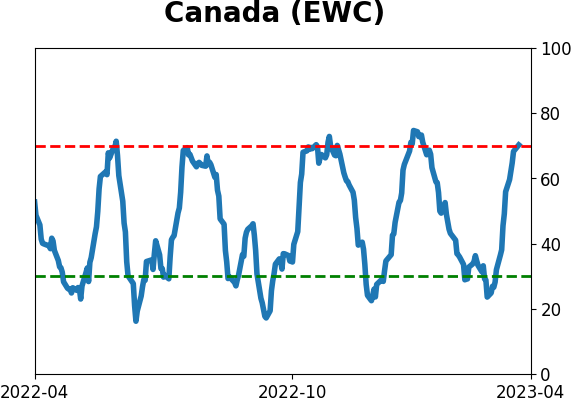
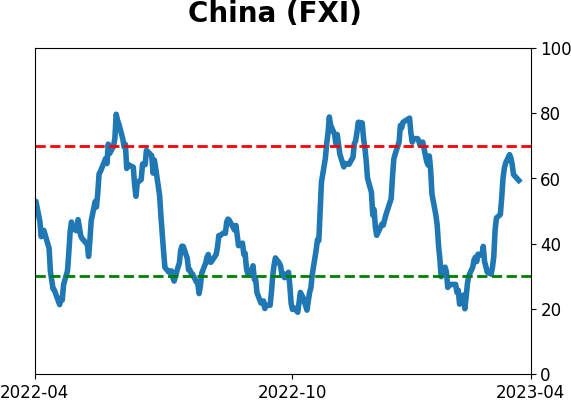
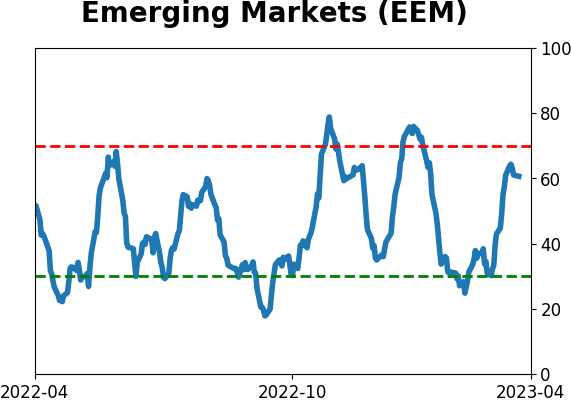
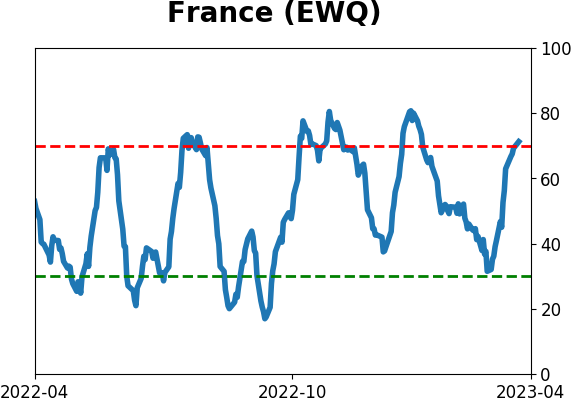
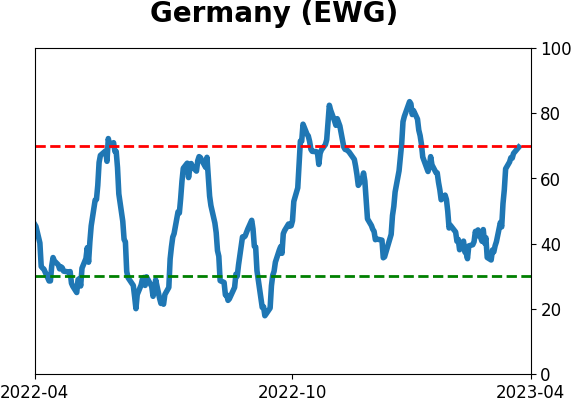
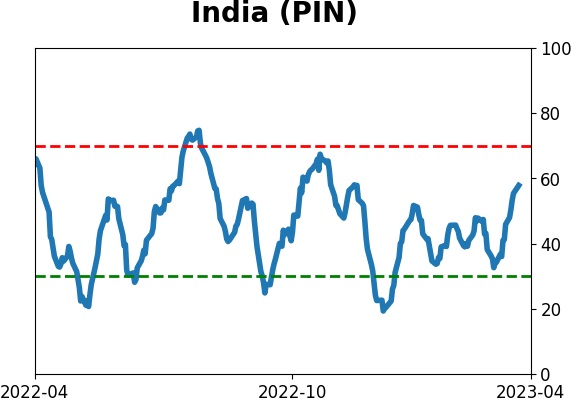
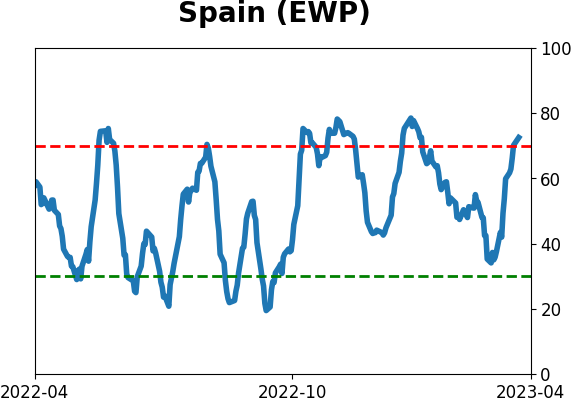
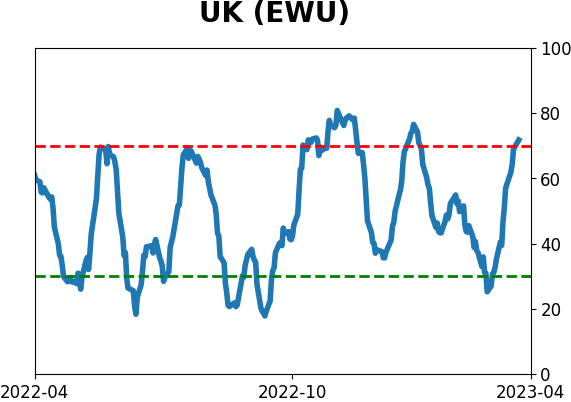
Country ETF's - 10-Day Moving Average
|
|
|
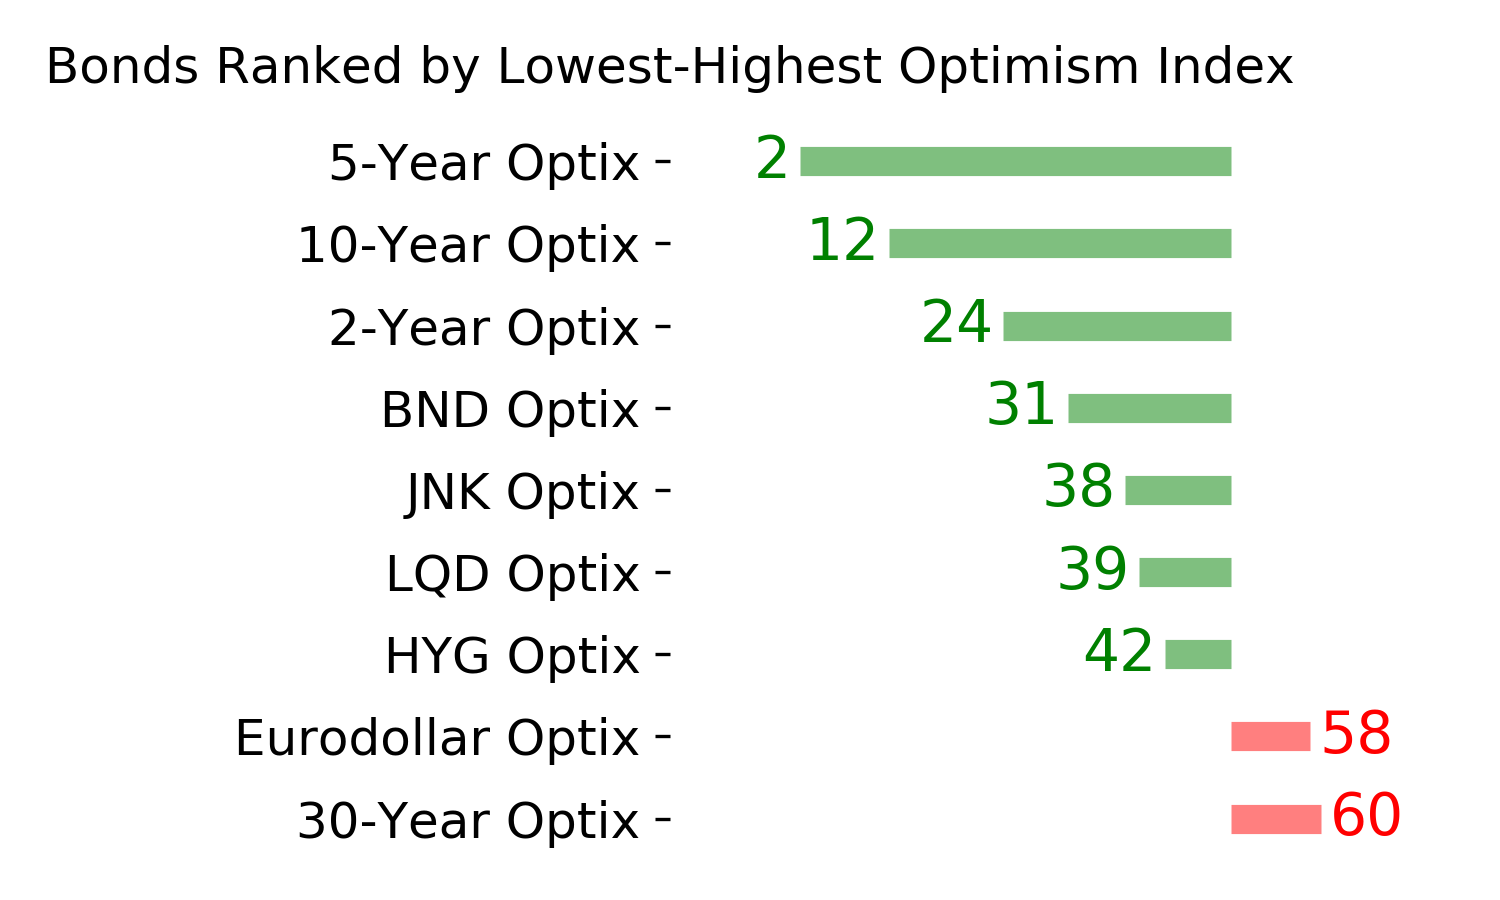
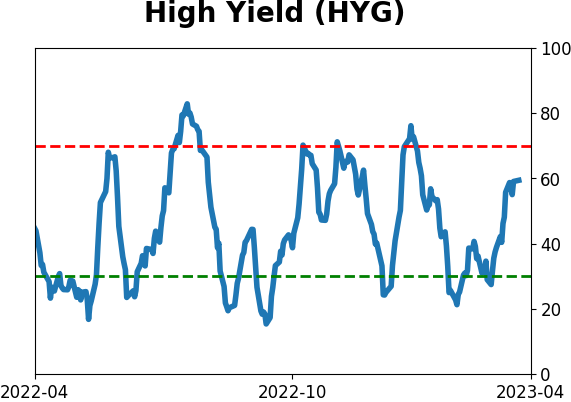
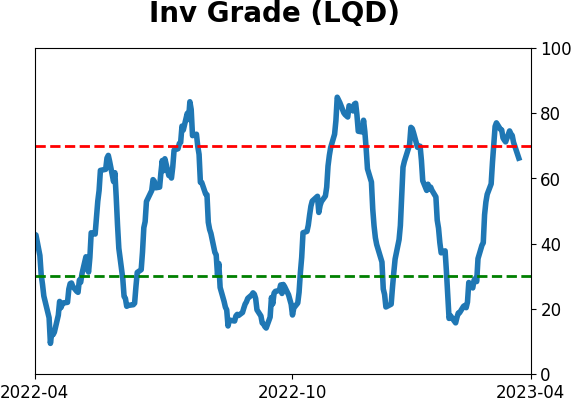
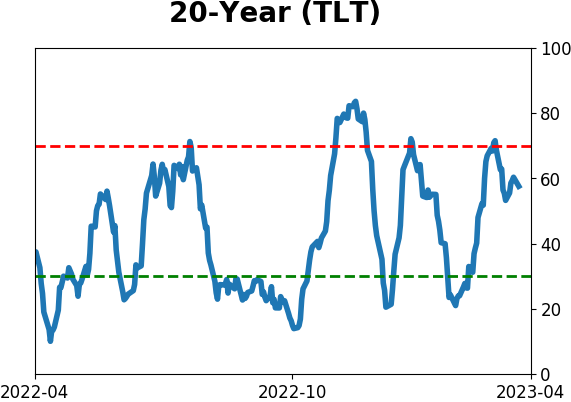
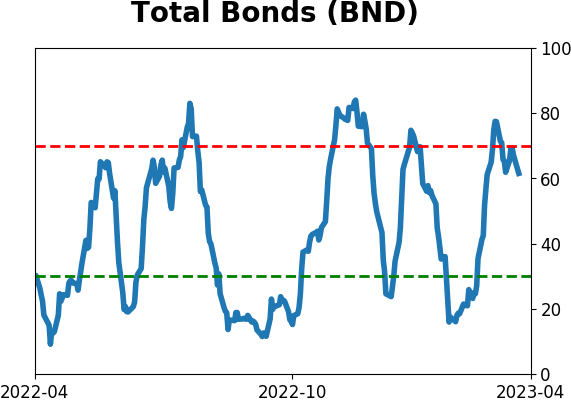
Bond ETF's - 10-Day Moving Average
|
|
|
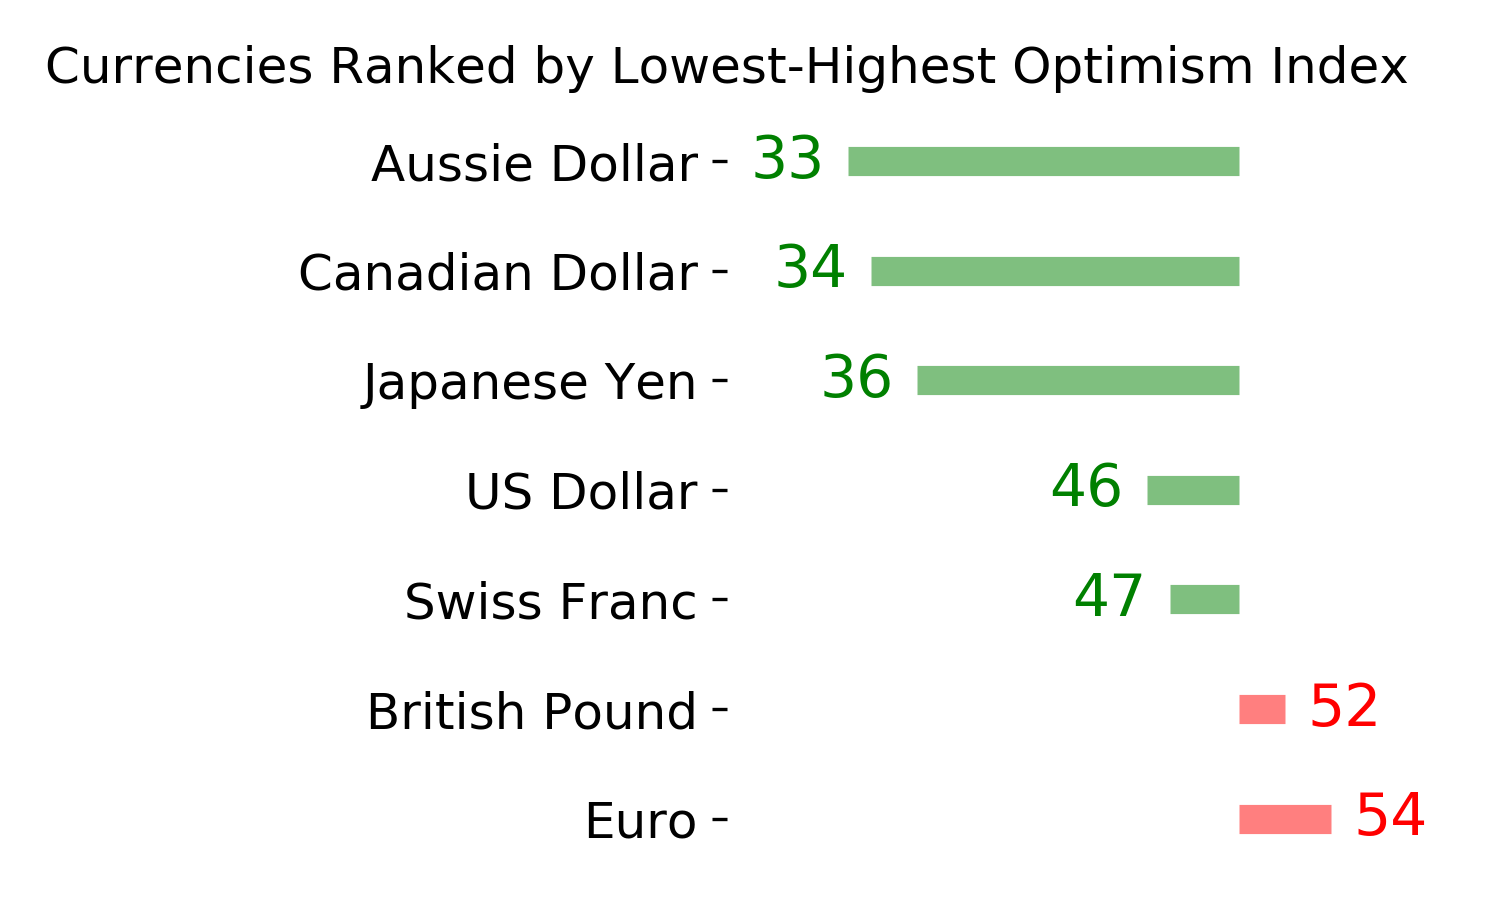
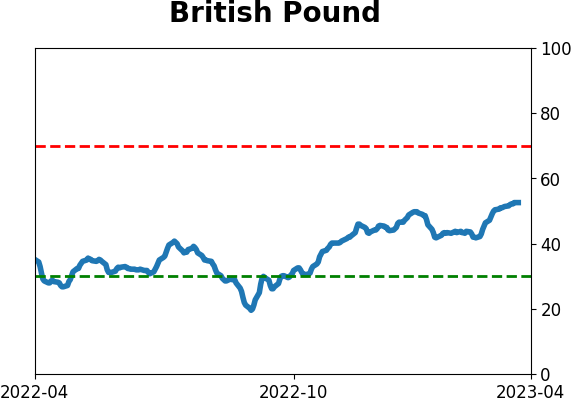
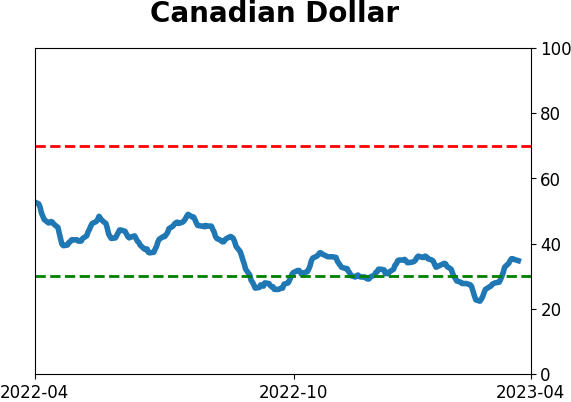
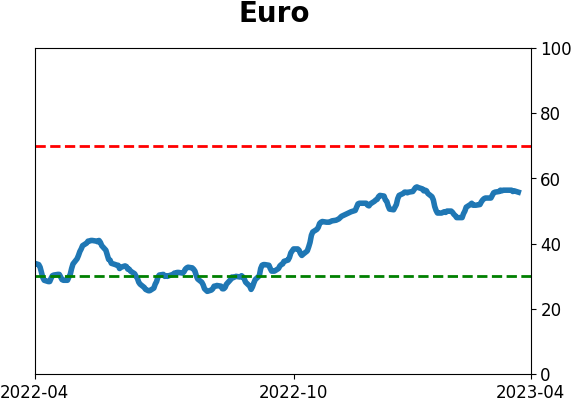
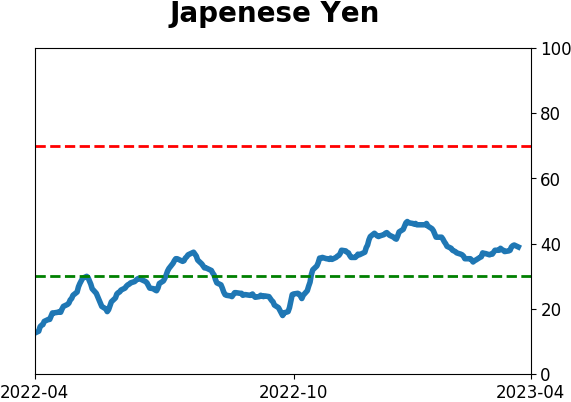
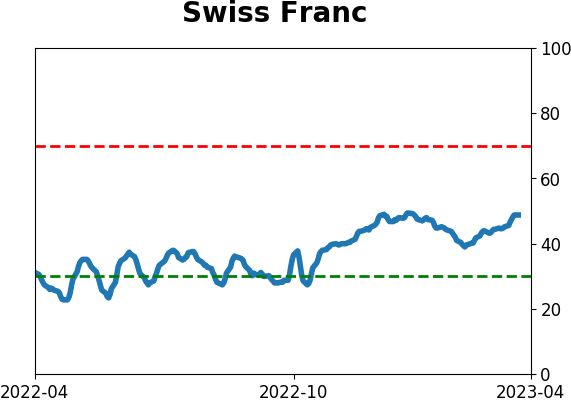
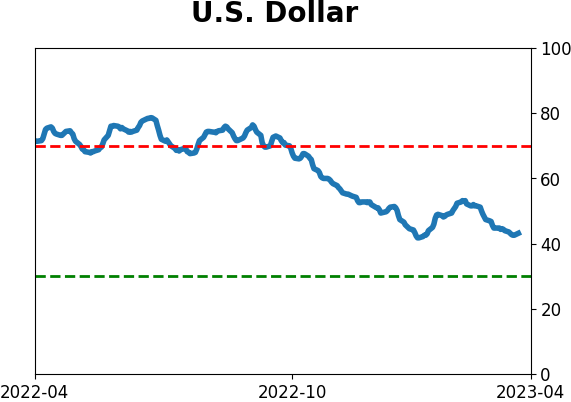
Currency ETF's - 5-Day Moving Average
|
|
|
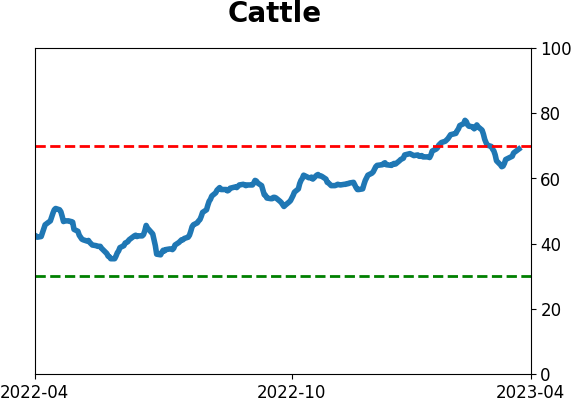
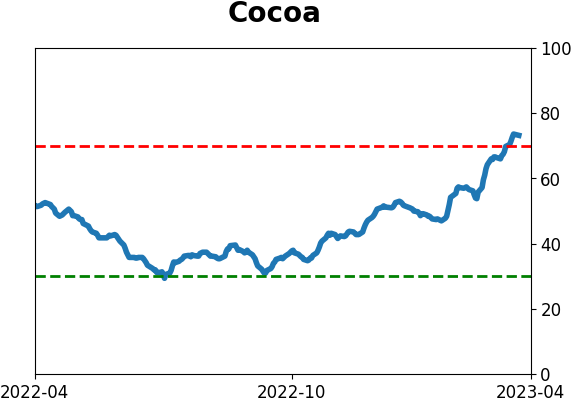
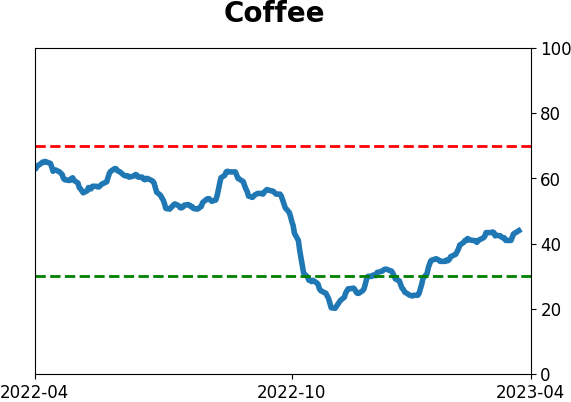
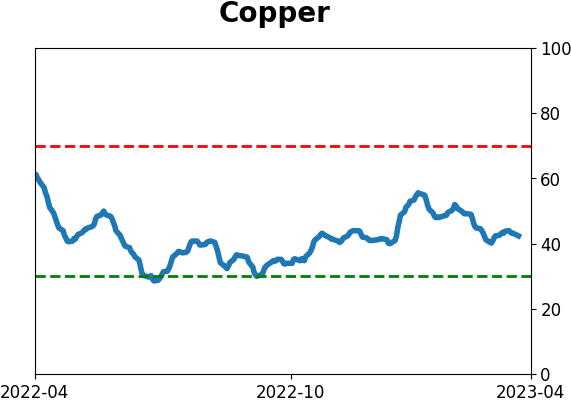
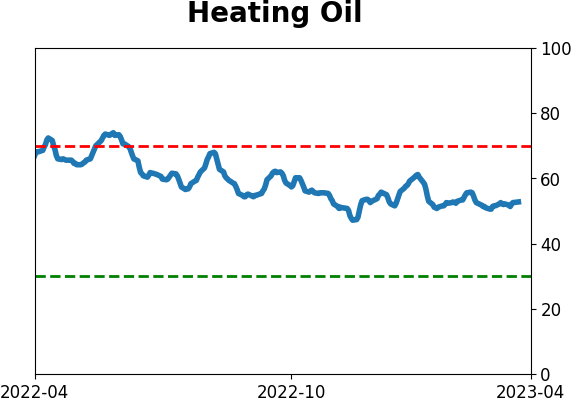
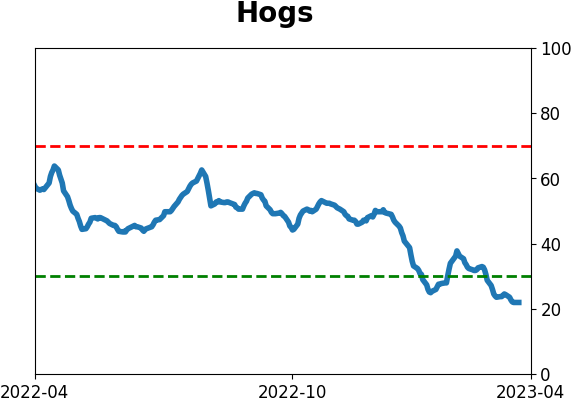
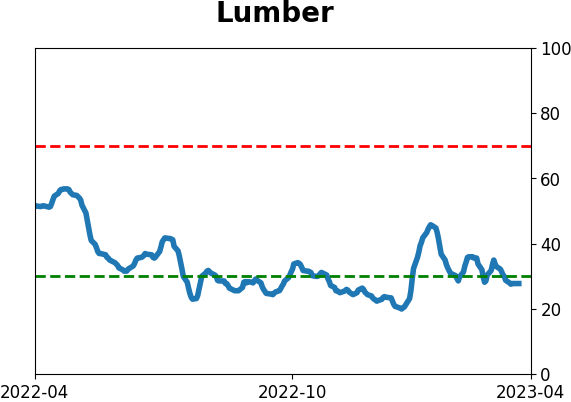
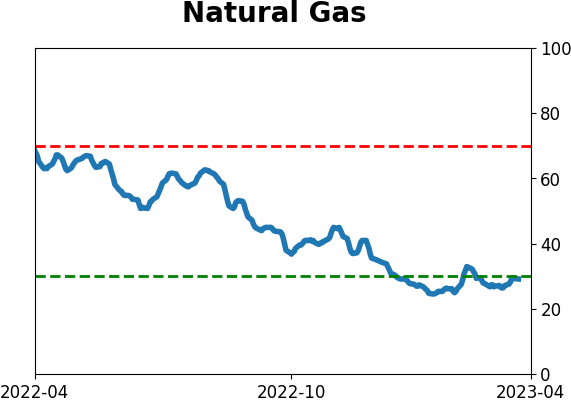
Commodity ETF's - 5-Day Moving Average
|
|