Headlines
|
|
On the Nasdaq, some warning signs emerge:
The Nasdaq Composite has held up well over the past month, but fewer stocks have been holding it up. In the past month, many days have witnessed negative breadth and more stocks falling to new lows than rising to new highs. Technical warnings are the highest since 2000 and 2007, which is an obvious worry for bulls.
|
Smart / Dumb Money Confidence
|
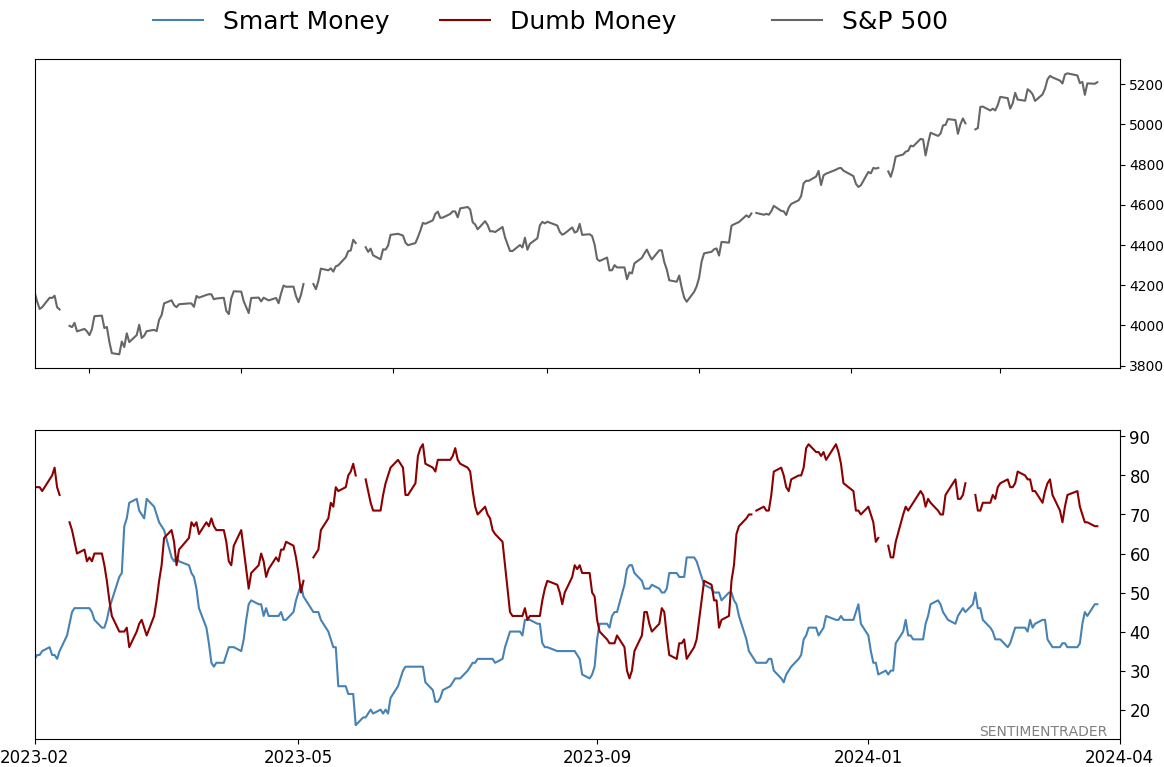
Smart Money Confidence: 47%
Dumb Money Confidence: 67%
|
|
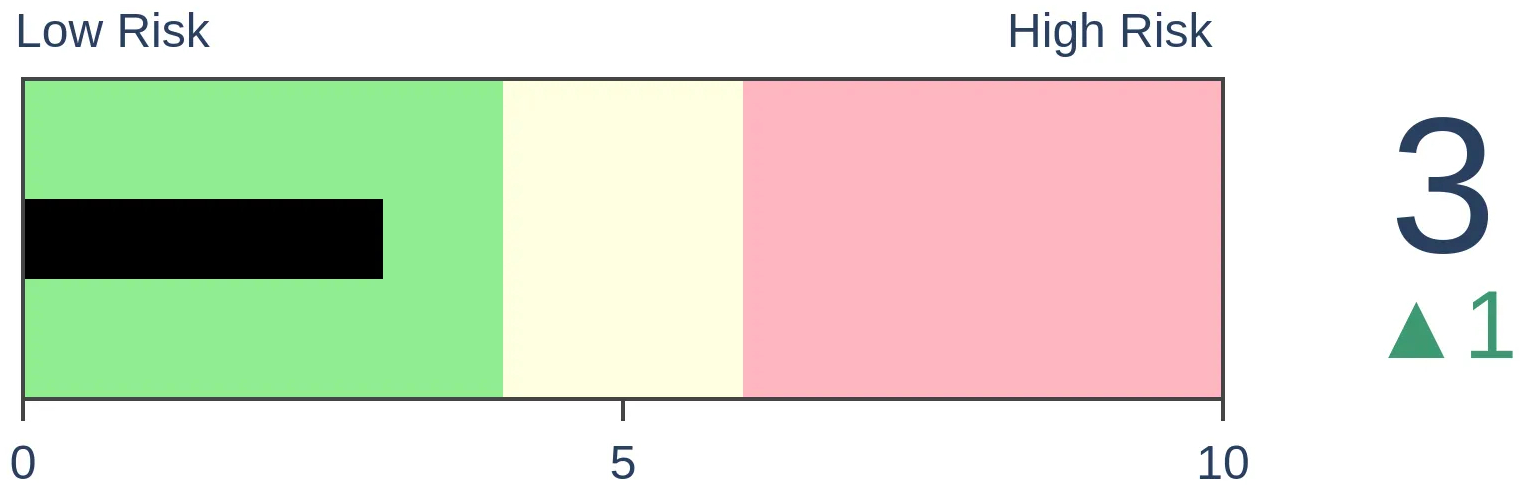
Risk Levels
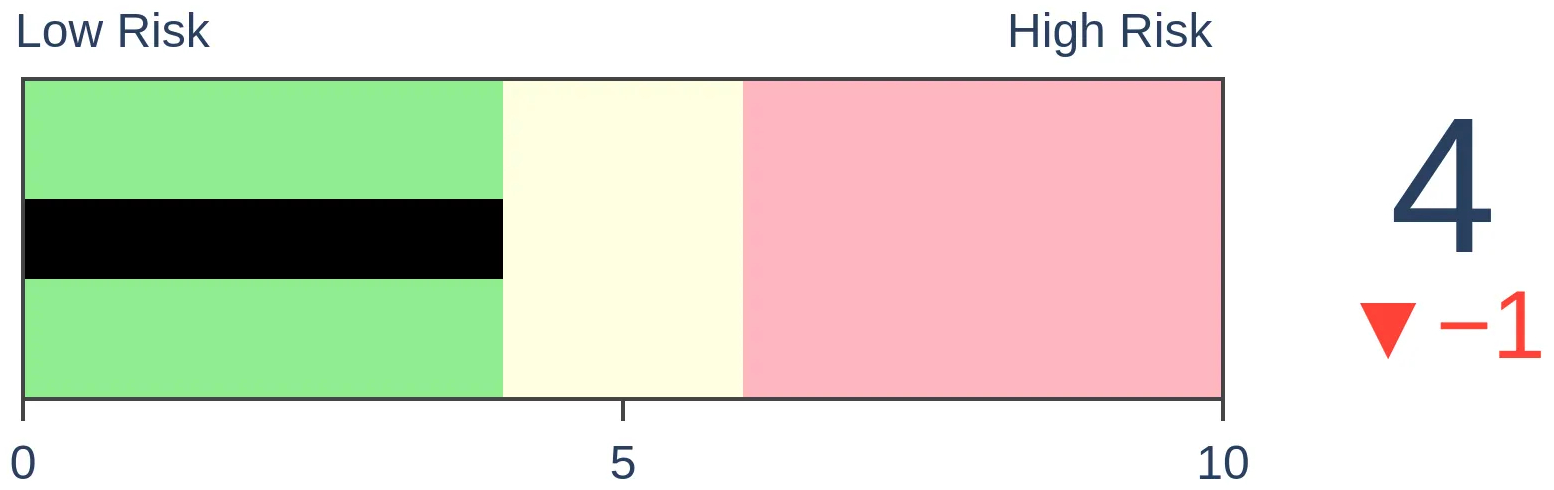
Stocks Short-Term

|
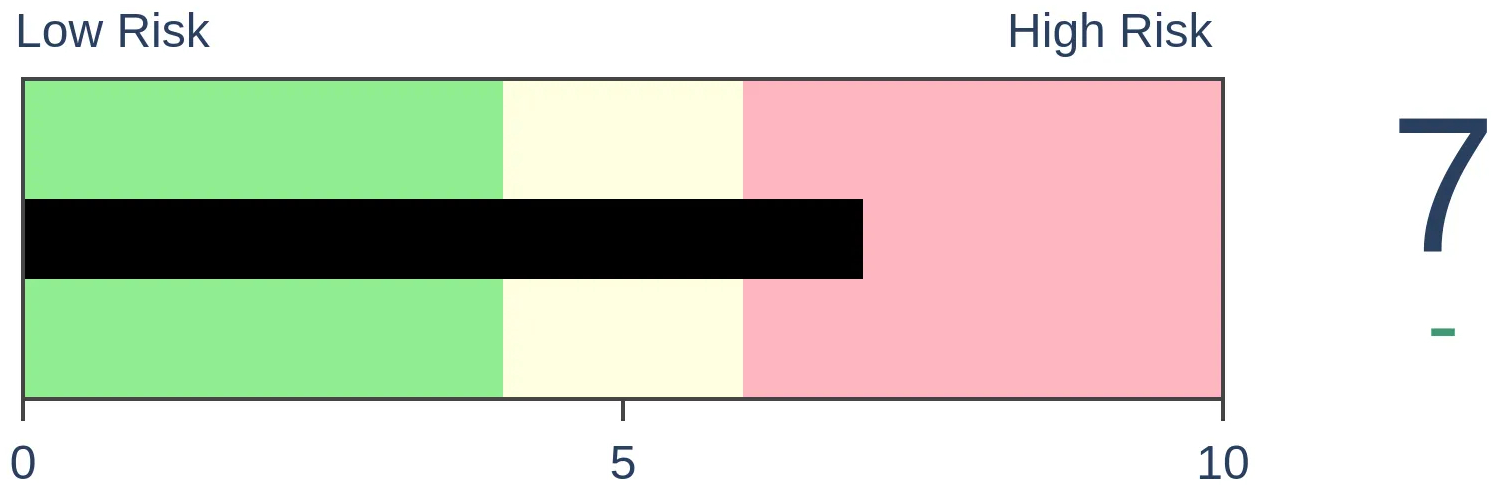
Stocks Medium-Term

|
|
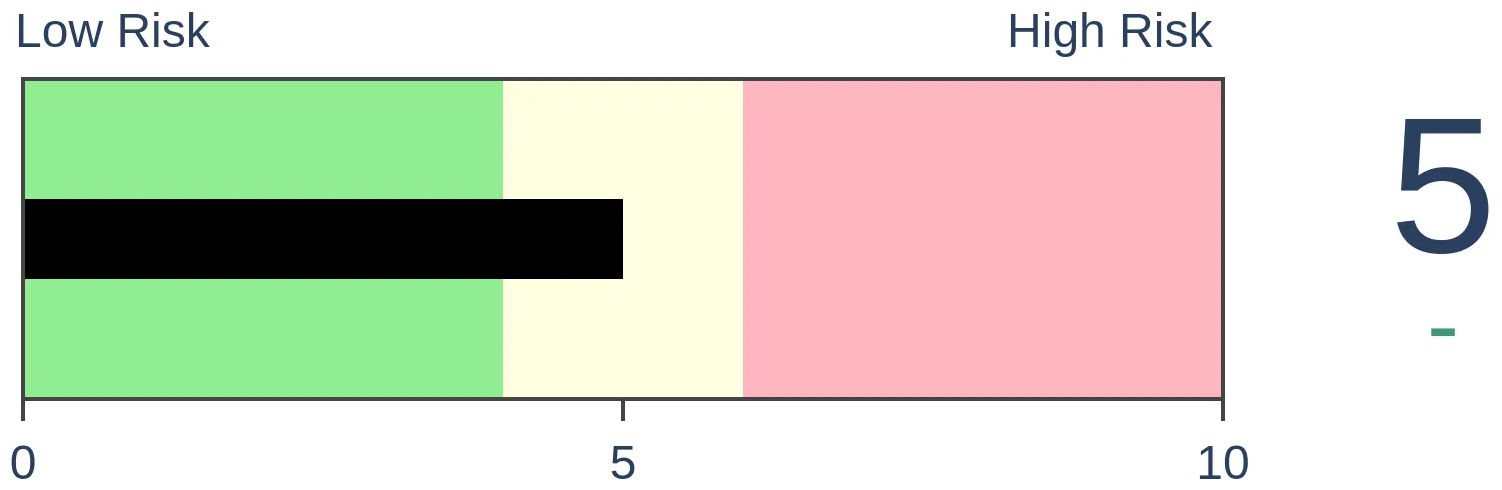
Bonds
|
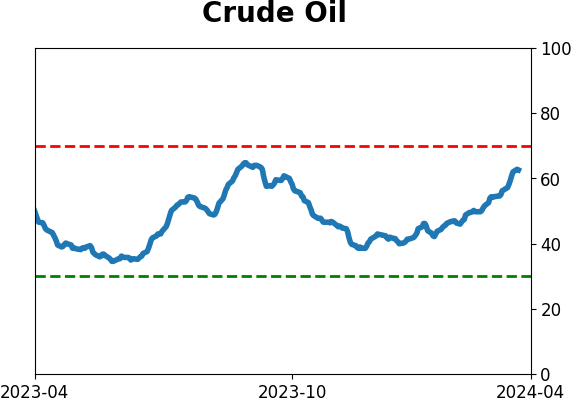
Crude Oil
|
|
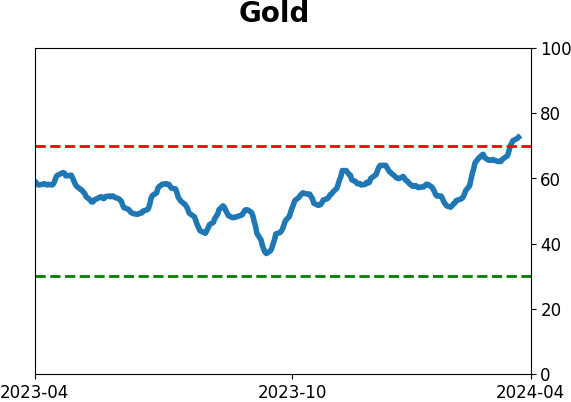
Gold
|
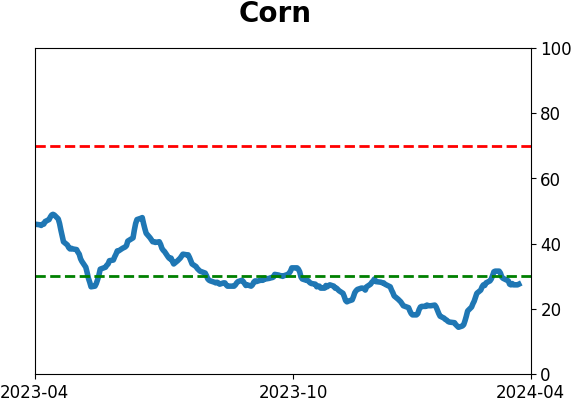
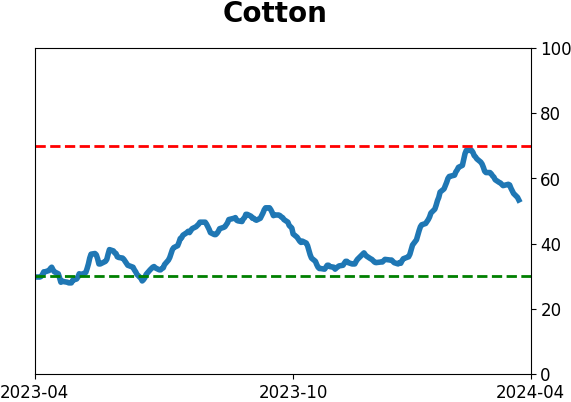
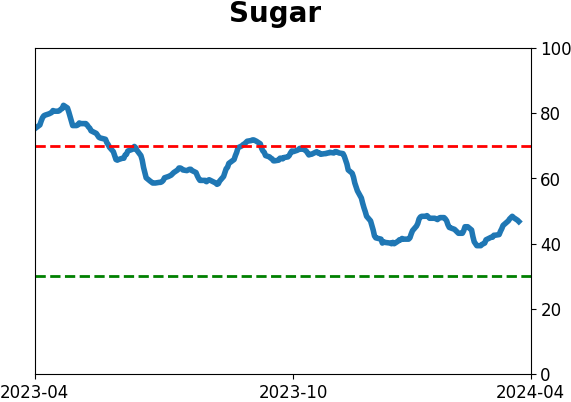
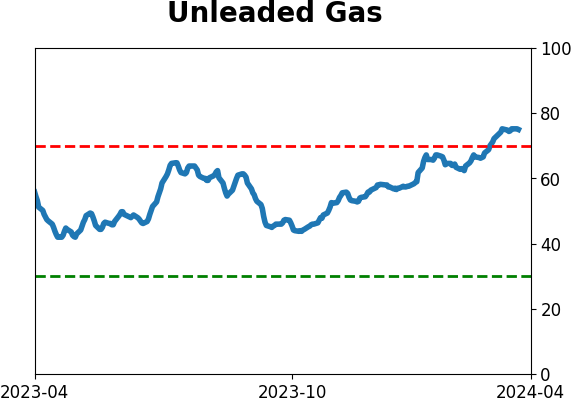
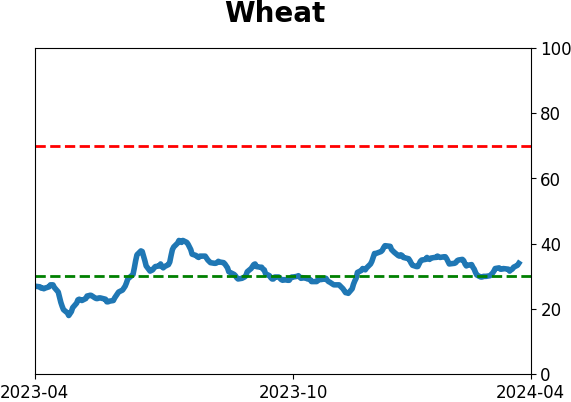
Agriculture
|
|
Research
By Jason Goepfert
BOTTOM LINE
The Nasdaq Composite has held up well over the past month, but fewer stocks have been holding it up. In the past month, many days have witnessed negative breadth and more stocks falling to new lows than rising to new highs. Technical warnings are the highest since 2000 and 2007, which is an obvious worry for bulls.
FORECAST / TIMEFRAME
None
|
Key points:
- After an impressive surge to the end of 2023, more stocks on the Nasdaq are struggling
- Breadth has been negative on most days in the past month, and more stocks are falling to new lows
- Similar divergences tended to precede trouble for the Nasdaq Composite
The Nasdaq is rising, but most of its stocks aren't
Some of the big stocks on the Nasdaq have held up exceptionally well this year. That has helped mask what otherwise has been declining health in many other stocks.
As noted by The Wall Street Journal, some concerns are piling up:
To be sure, the Nasdaq's advance-decline line started off strong when the bull market returned in November. Many more stocks beyond the Magnificent Seven started to outperform, including healthcare, financial and consumer companies.
But the advance-decline line has been trending lower since January as fewer stocks have participated in the Nasdaq's upturn. Megastocks like Nvidia, Microsoft, Amazon.com and Meta Platforms continue their market leadership as they hold near highs. These four stocks make up about 27% of the Nasdaq Composite.
What's more, the 10-day moving average of new highs on the Nasdaq started trending lower in March. And the 10-day moving average of new lows started to swing higher but has flattened out recently.
He's not wrong. In the initial push from the October lows, the 10-day sum of advancing to declining stocks surged higher. It has meandered unimpressively since then, and most of the past month has seen more declining than advancing stocks.
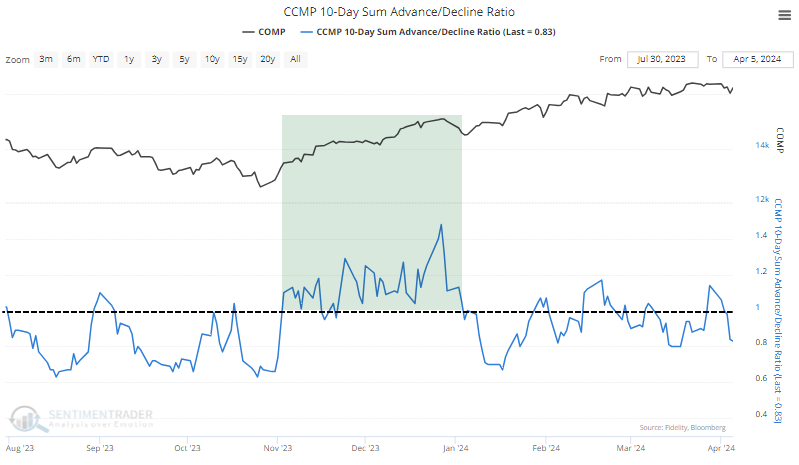
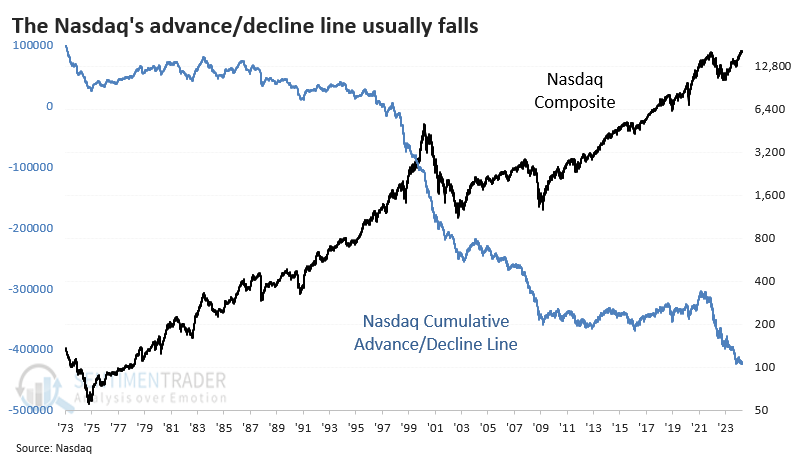
That has helped to push the cumulative advance/decline line lower. However, this is a mostly useless observation since that has been the case for most of the past 50 years. The Nasdaq is littered with questionable securities, and almost any cumulative breadth measure resembles the following.
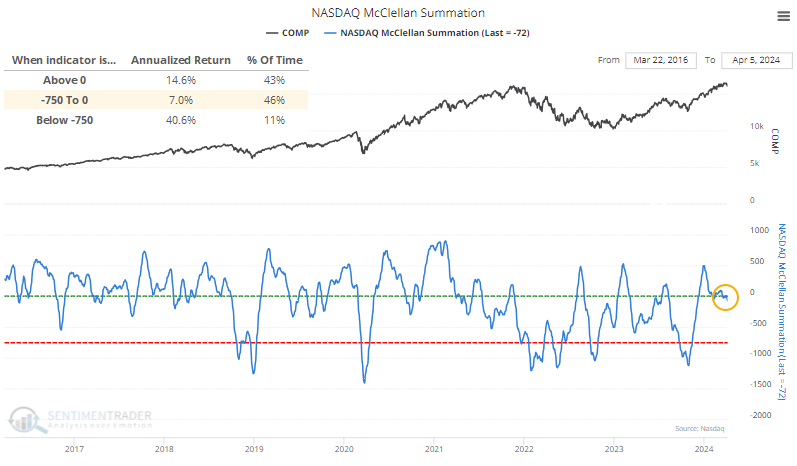
What is notable is that the McClellan Summation Index has been slipping for weeks and just dipped below zero. This is not a good place for any Summation Index, and we can see that for the Nasdaq, too. The Composite's annualized return when its Summation Index was below zero - but not oversold - was half the return when the Summation Index was positive (healthy environments) or deeply negative (heavily oversold and prone to mean-reversion).
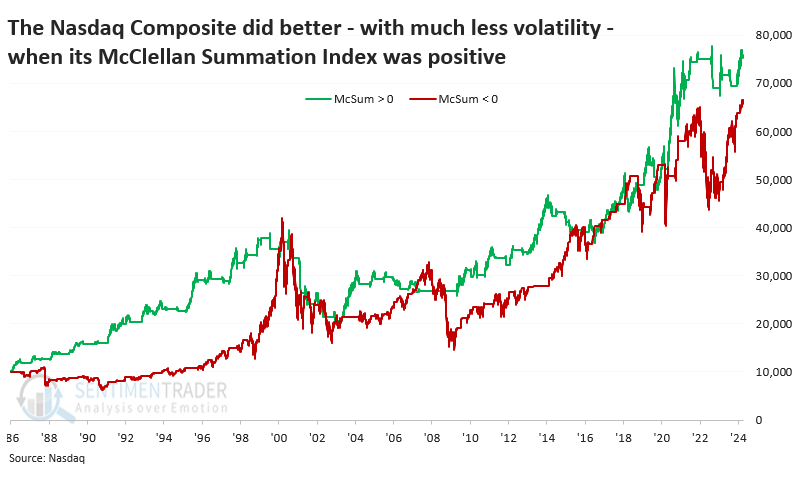
If we held the Nasdaq Composite only when the Summation Index was positive and held until the next day, returns were better than when the Summation Index was negative. Also, the swings were much less dramatic.
The worst declines tended to cluster when it was below zero; over nearly 40 years, 81% of the Composites -3% or worse daily declines happened when the Summation Index was below zero (granted, 89% of +3% days also happened when the Summation was below zero).
If you only held the Composite when the Summation was above zero, you'd avoid almost all the worst losses, though you'd have to suffer numerous small whipsaws. That really hurt during 2000-01, but it wasn't too wicked outside of that period.
More stocks are hitting lows than highs
The article also noted the decreasing percentage of stocks reaching new highs. This is also true, as it has been declining for months.
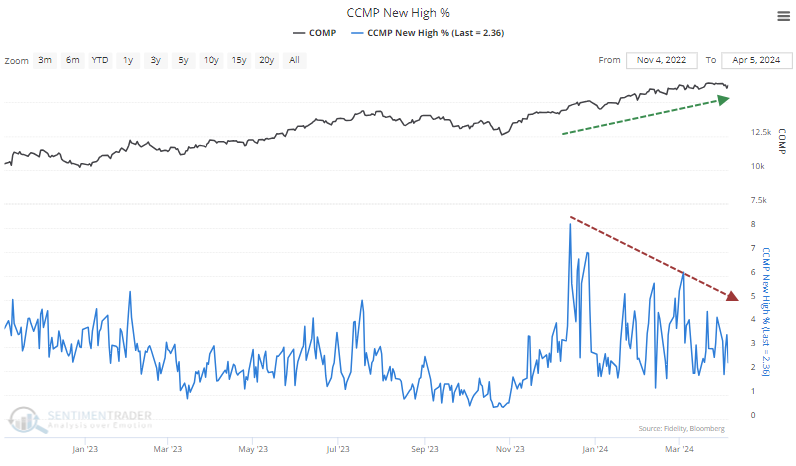
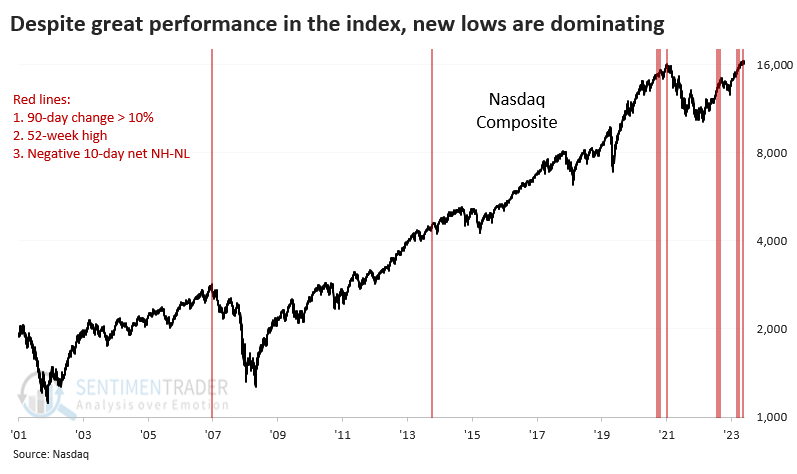
The chart below shows times when the Nasdaq Composite was hitting 52-week highs with a 90-day rate of change larger than +10%, while there were more 52-week lows than 52-week highs over a rolling 10-day basis. These were not the best times for buy-and-hold investors.
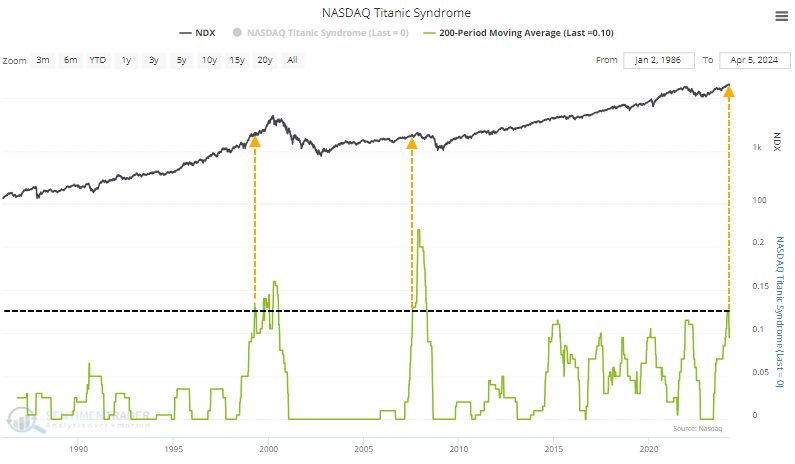
The divergences have been triggering technical warnings for months. We noted this in January, then they went away for a while. They've returned and added to the total over the past year. The number of Titanic Syndrome warnings over the past 200 days has exceeded all periods other than those leading up to bull market peaks in 2000 and 2007.
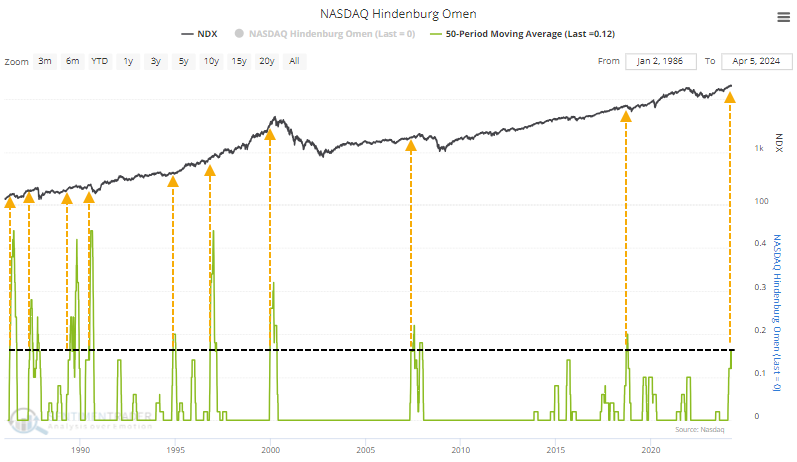
Similar divergences have triggered many Hindenburg Omen warnings on the Nasdaq. The 50-day average is at the 3rd-highest level in more than 20 years.
What the research tells us...
Persistent bull markets habitually trick people into selling, then reverse and hit new highs. Something like that happened in January, and it's happening again. The difference is that it's three months later, and there has been more time to gather divergences and weakening internal momentum.
Evidence is increasing that the average stock on the Nasdaq (and really only on the Nasdaq) is not doing all that well. While these conditions can persist for quite a while, they've already persisted for a while and haven't gone on much longer before trouble sets in. Risk has increased on that exchange, and indexes like the Nasdaq Composite because of it.
Indicators at Extremes
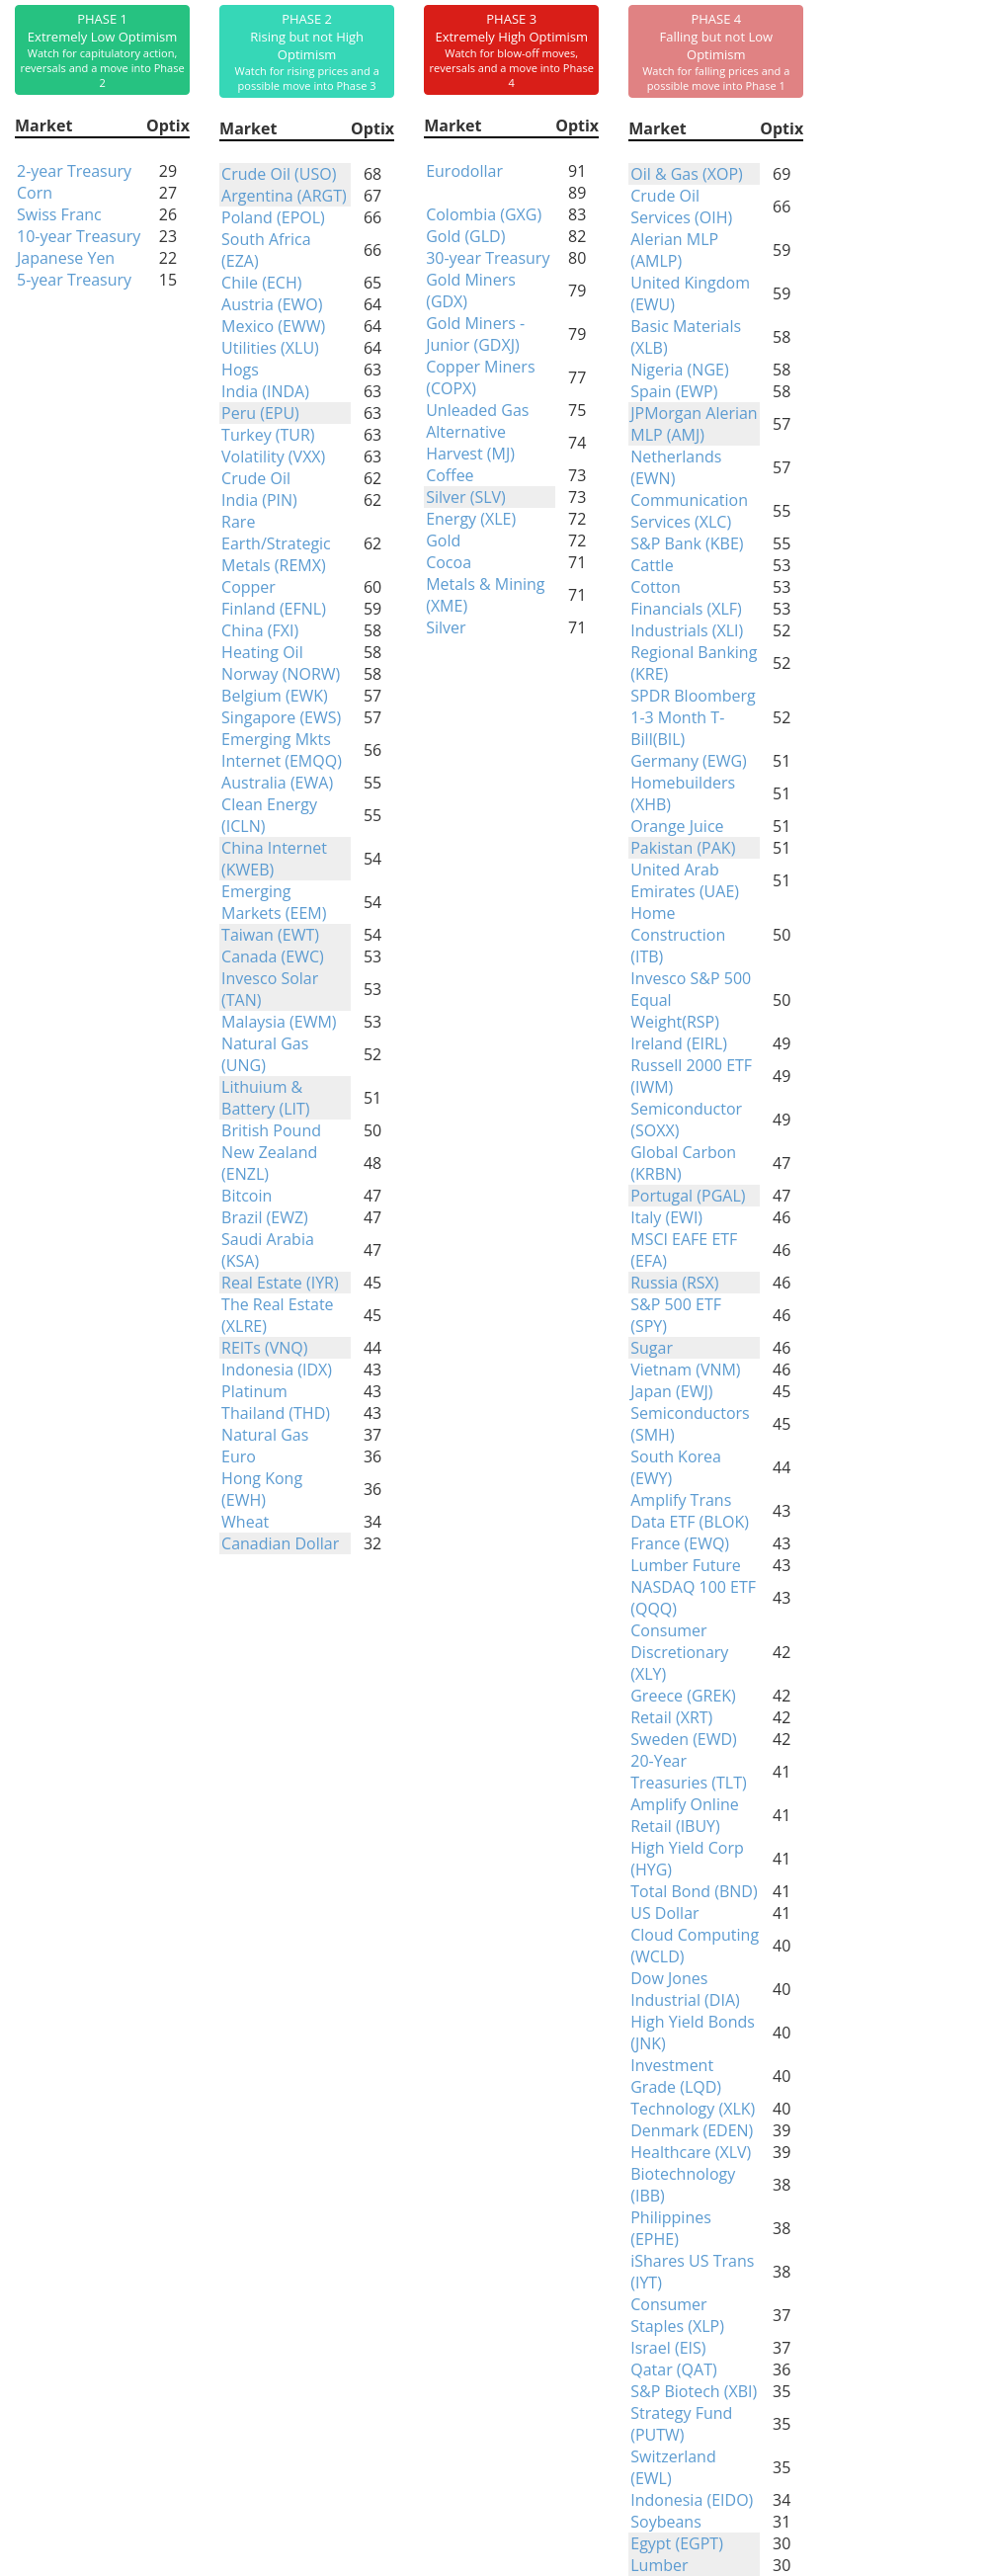
Phase Table
Ranks
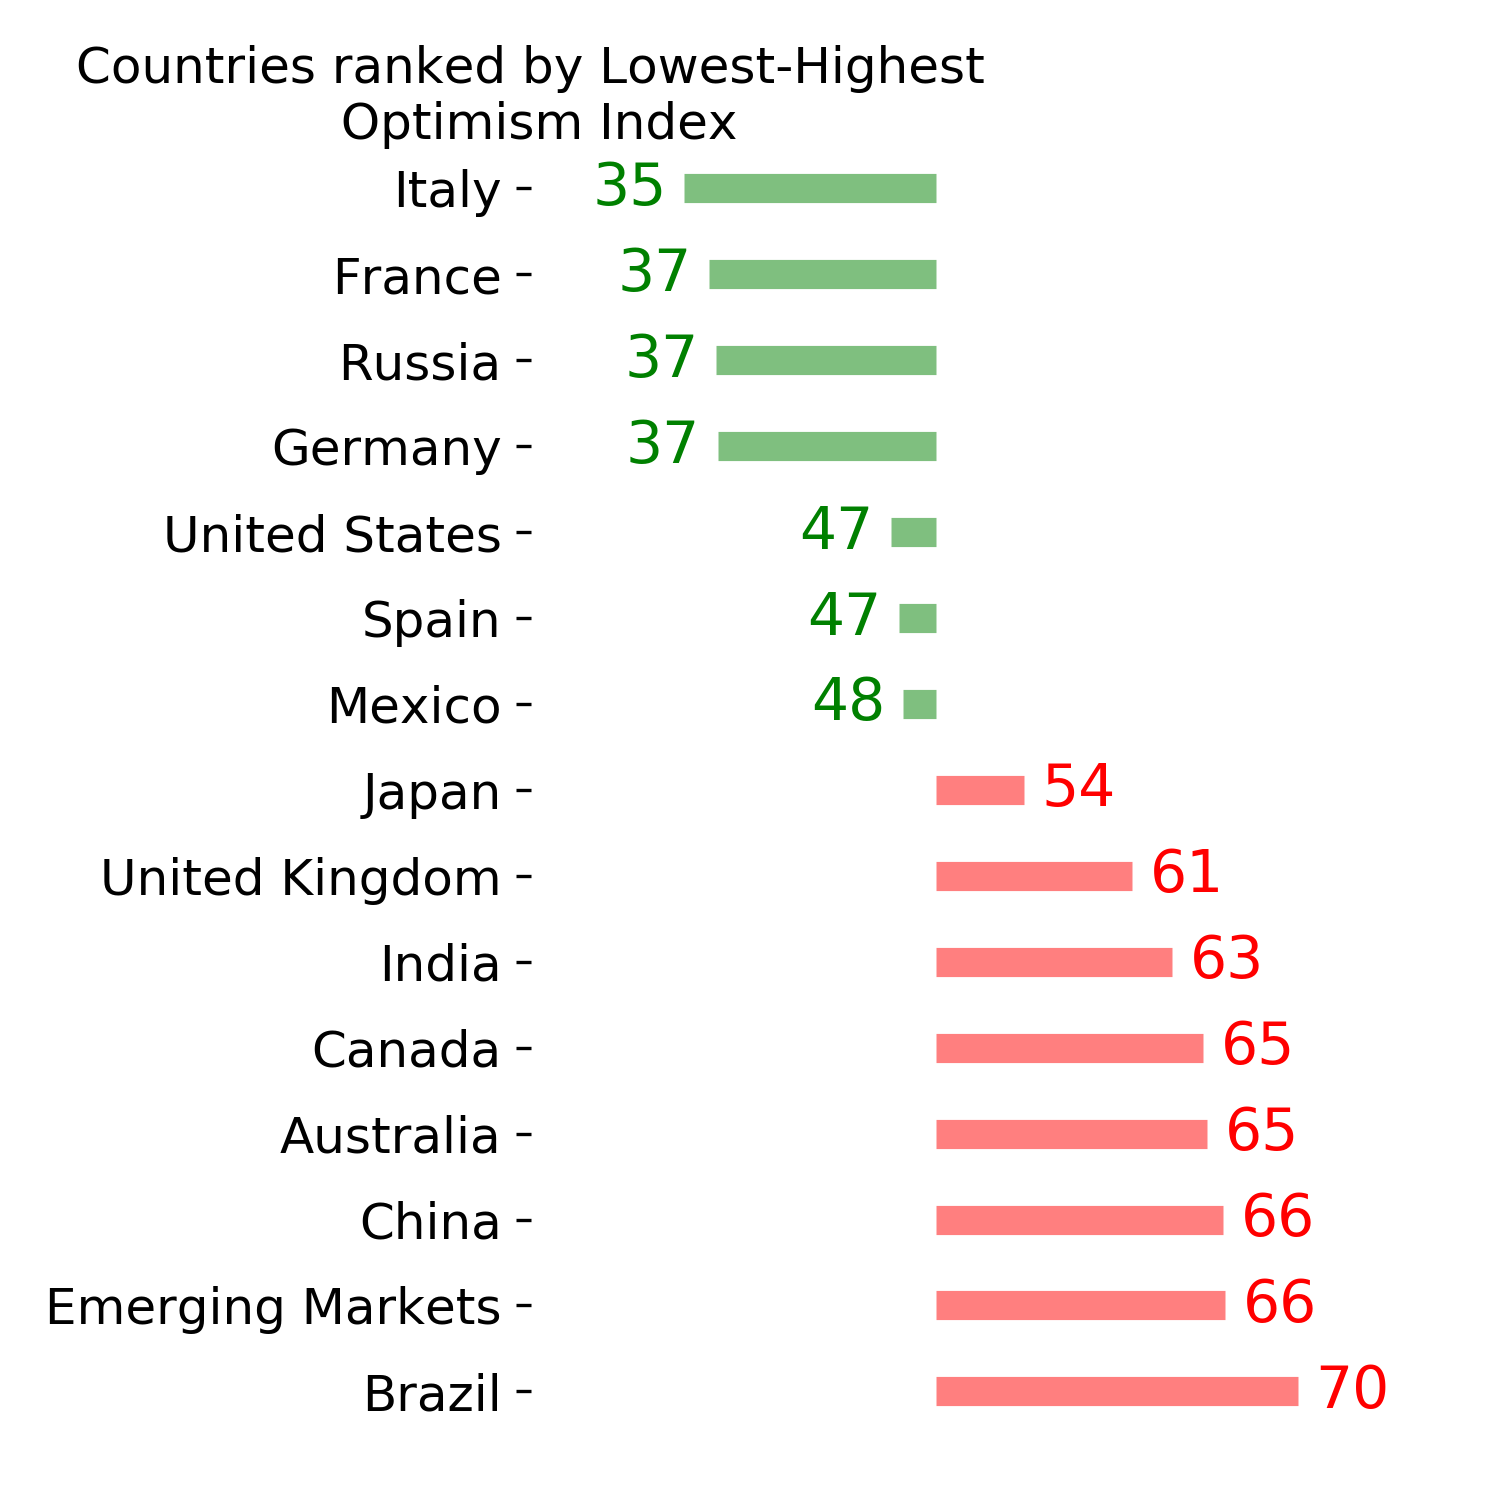
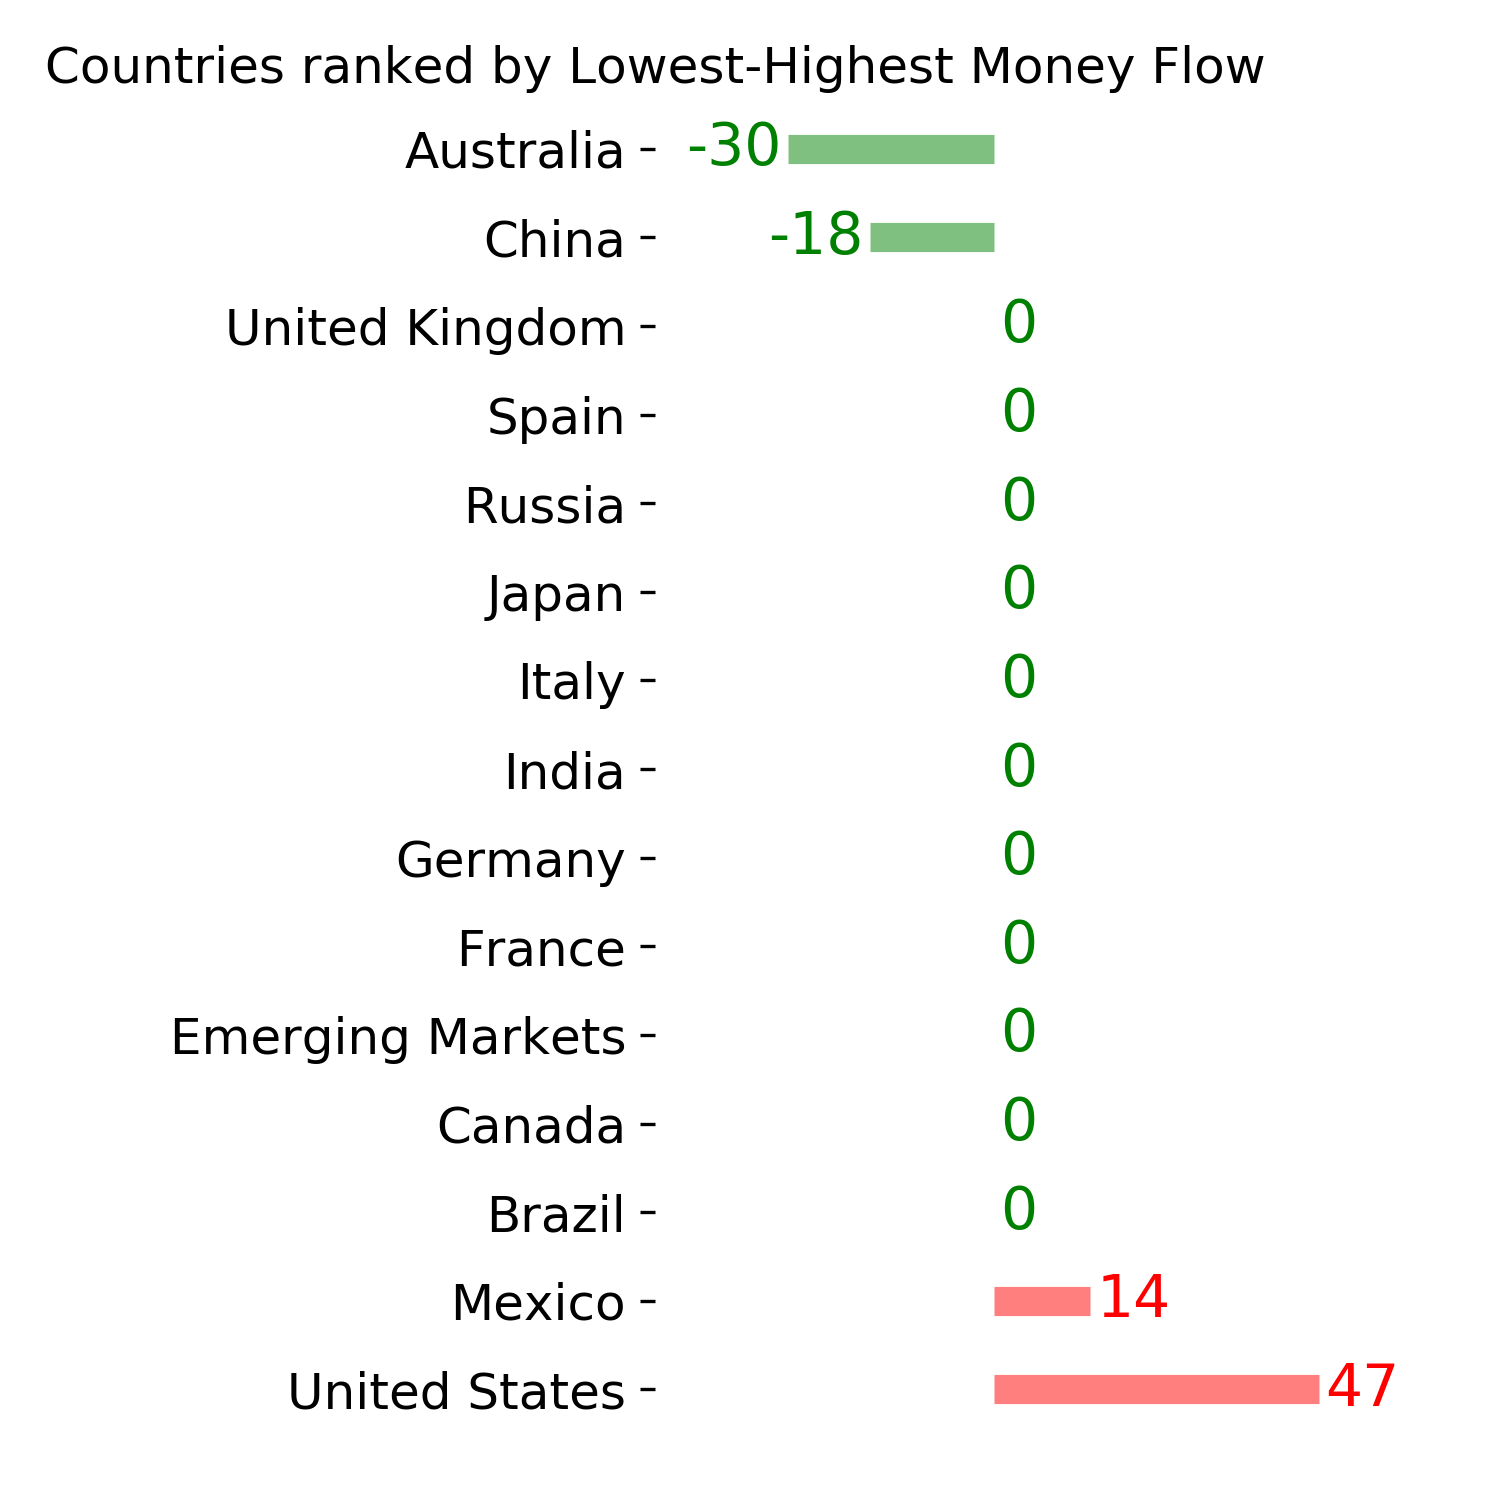
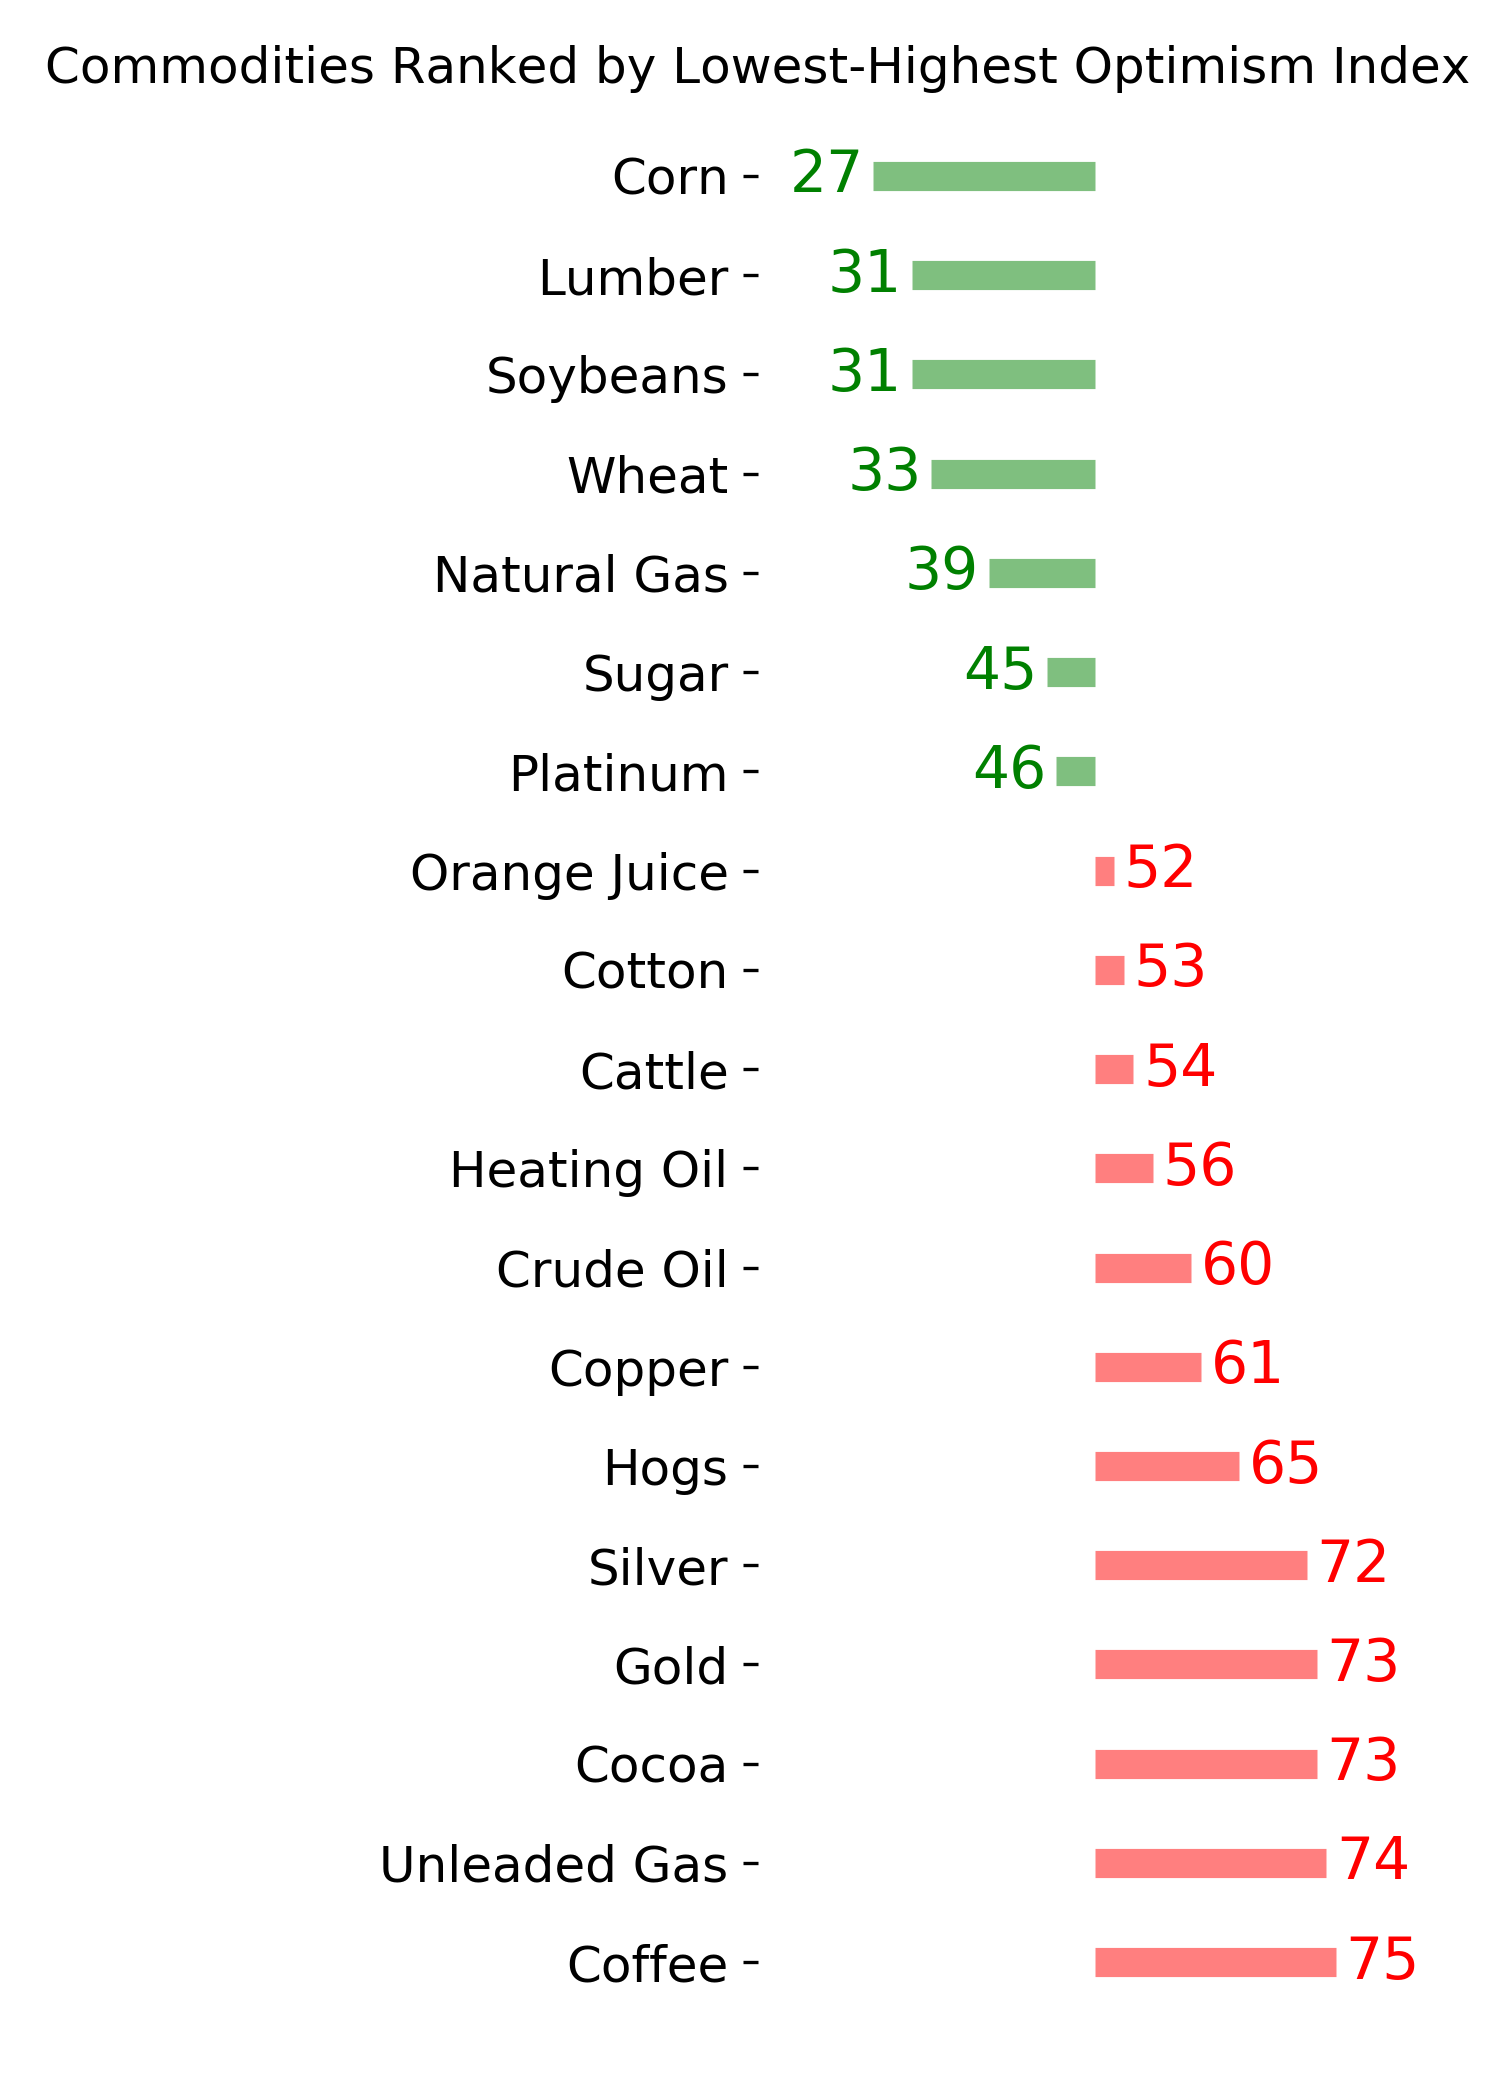
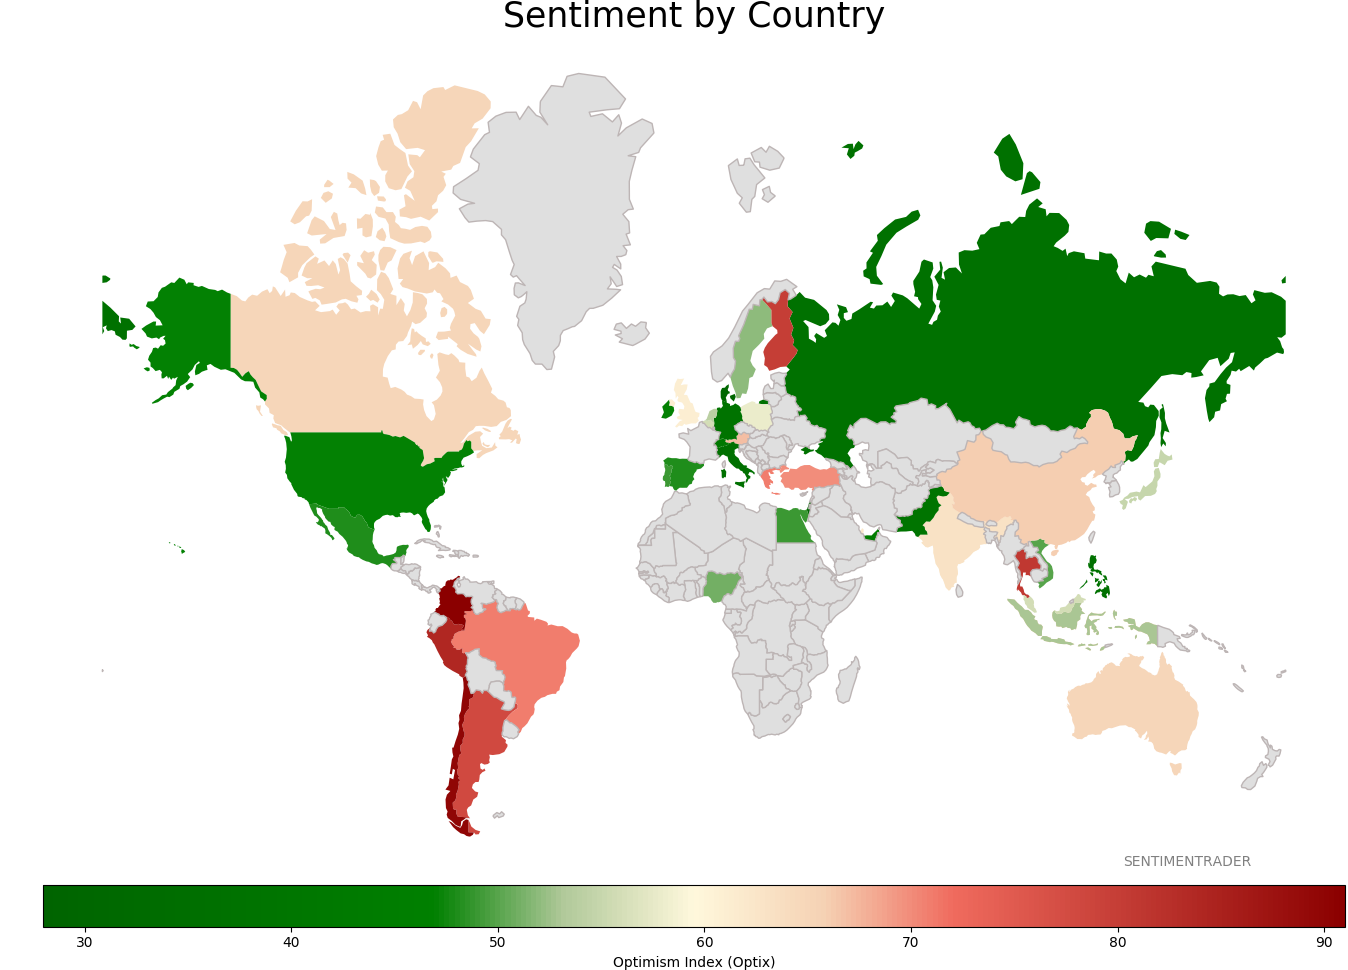
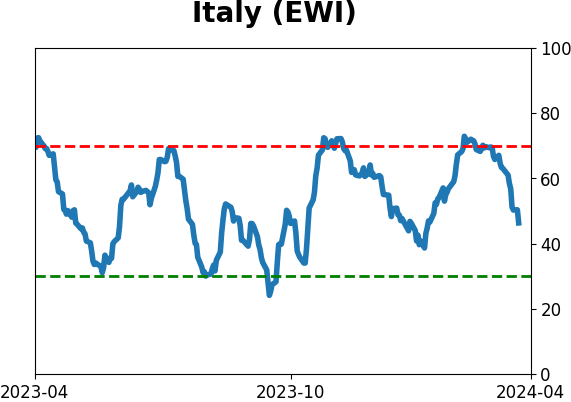
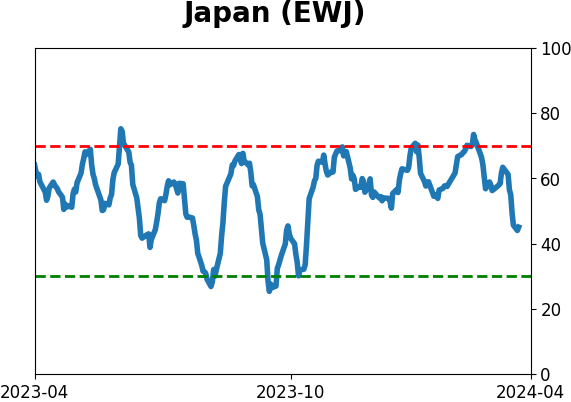
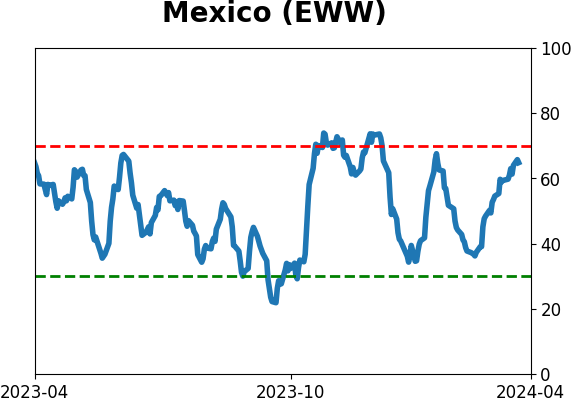
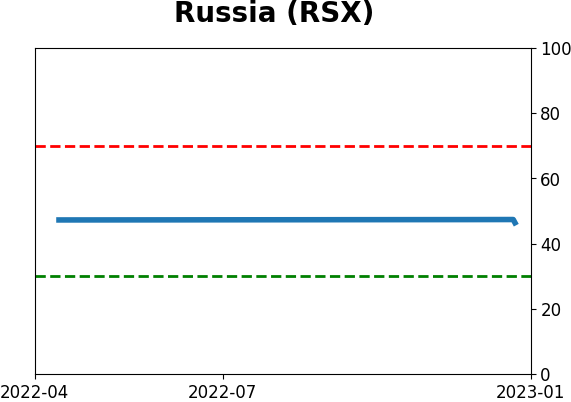
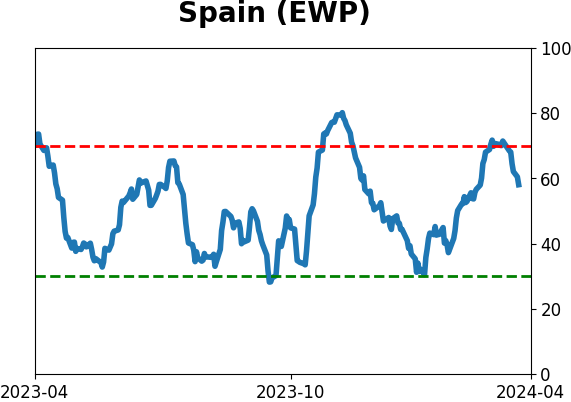
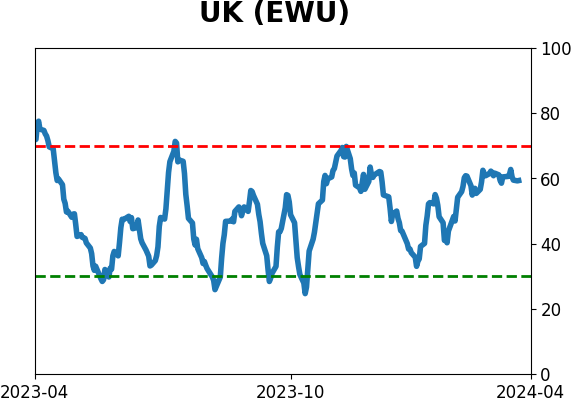
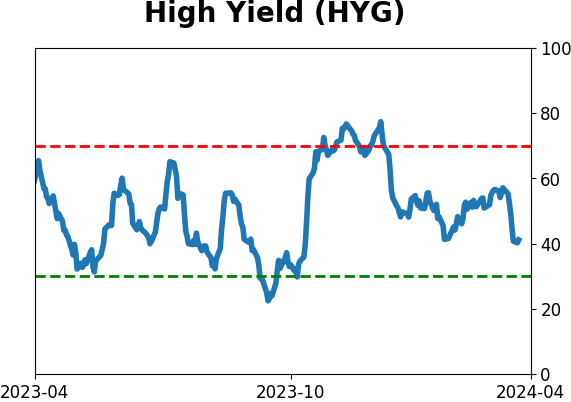
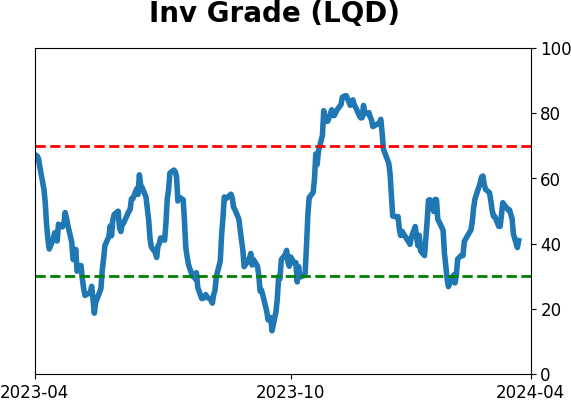
Sentiment Around The World
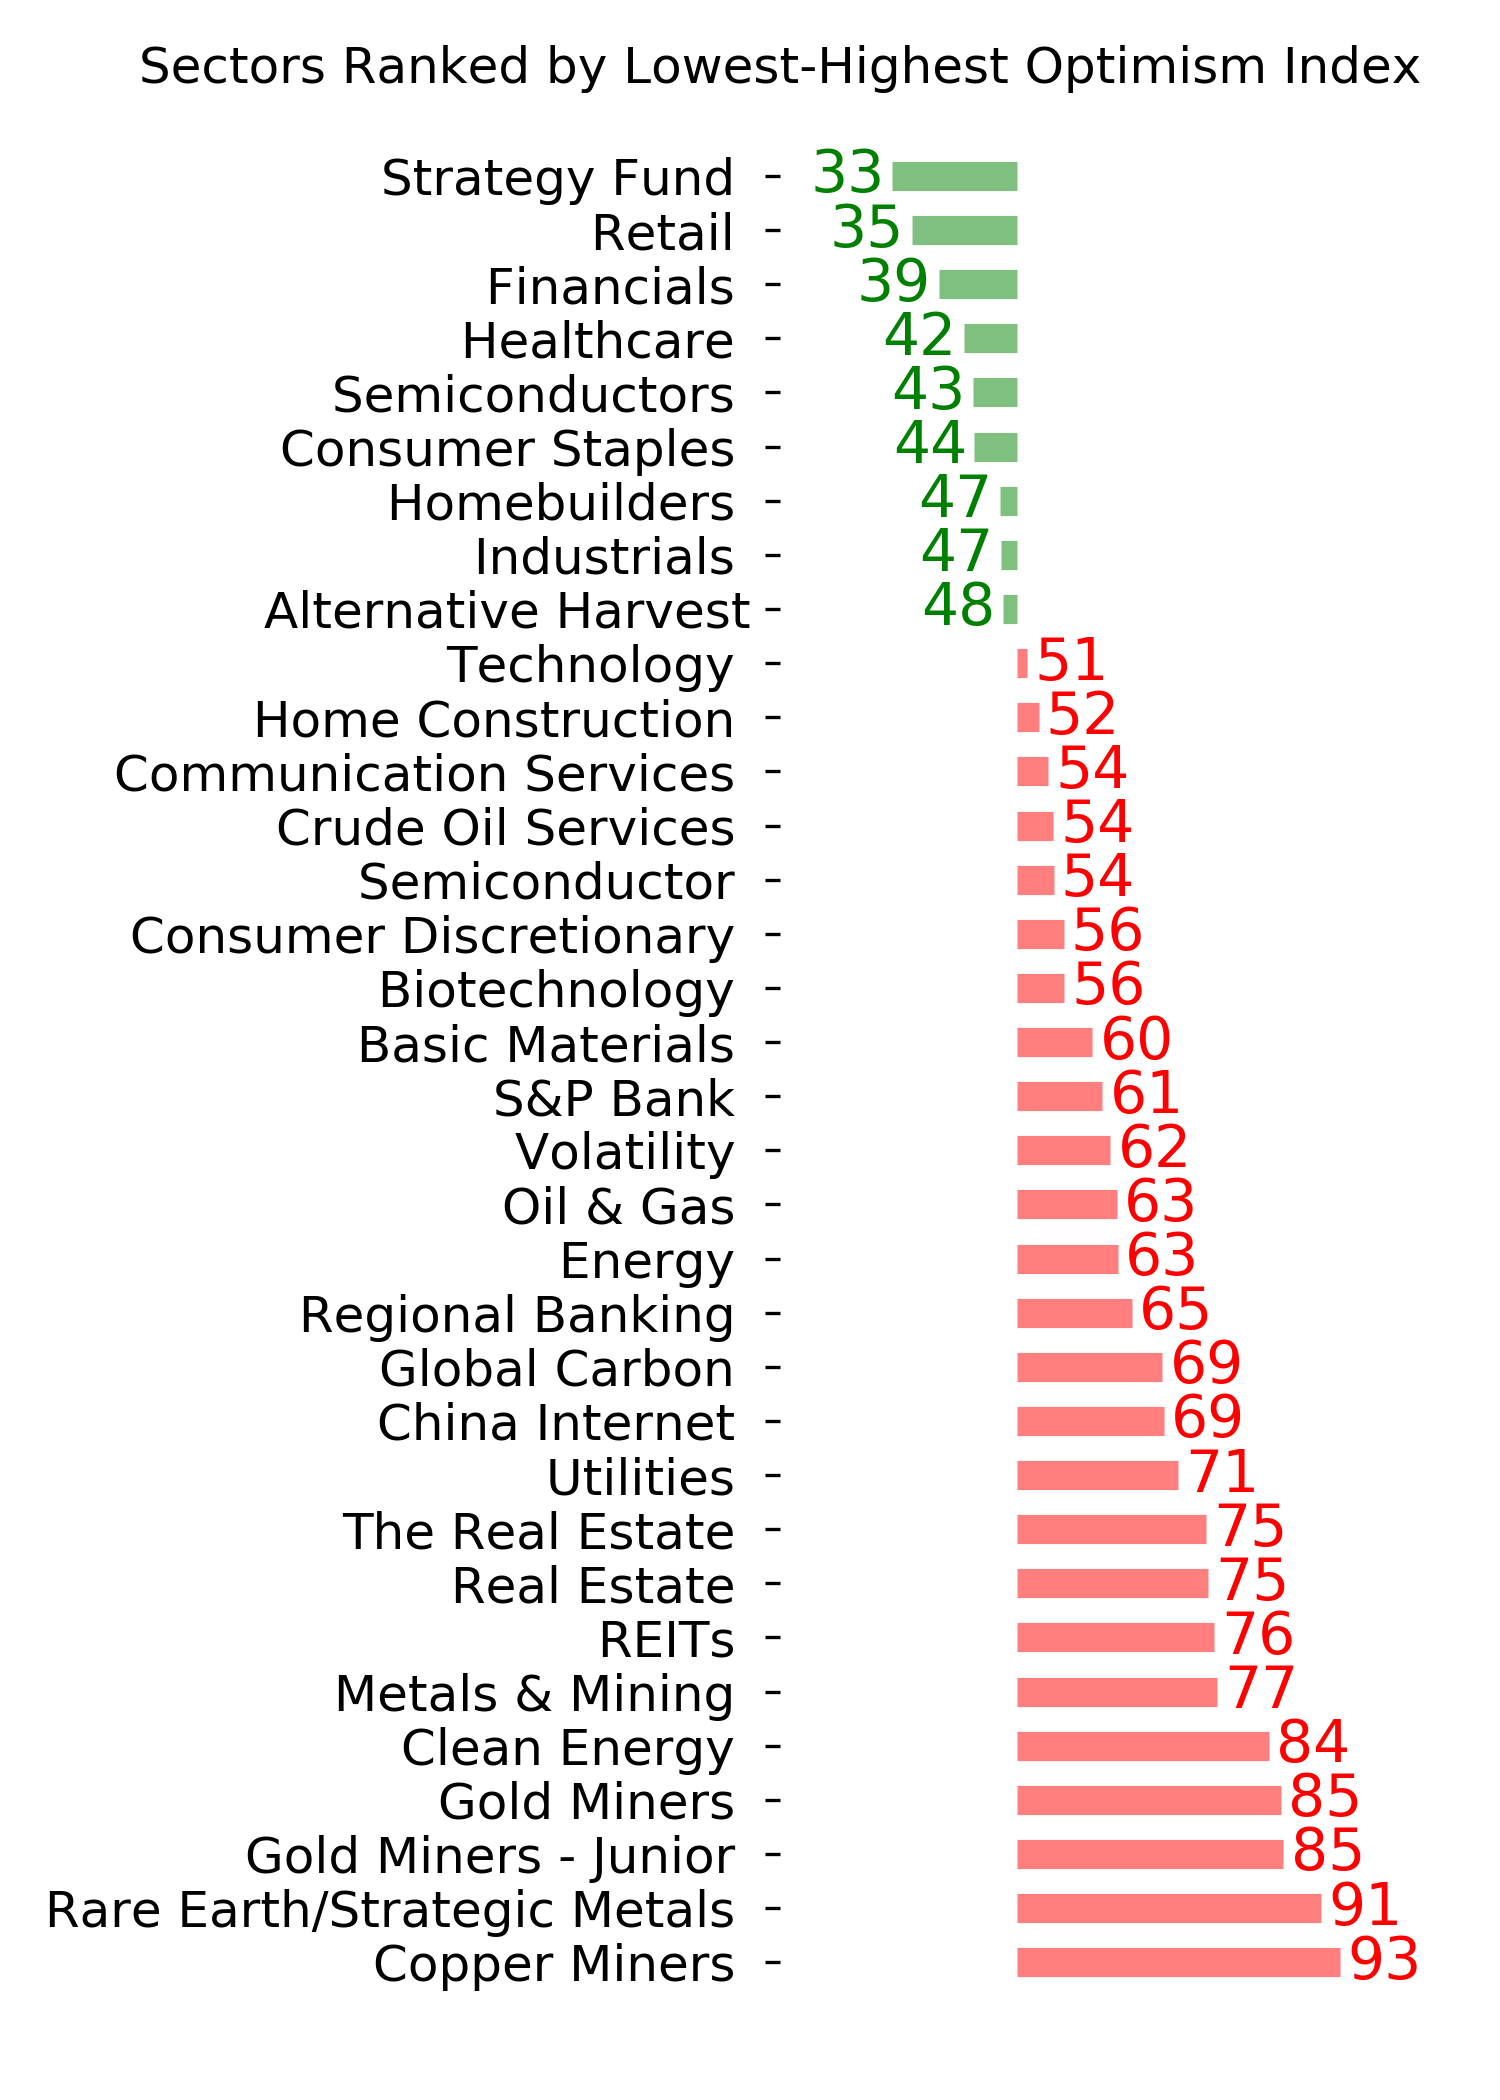
Optimism Index Thumbnails
|
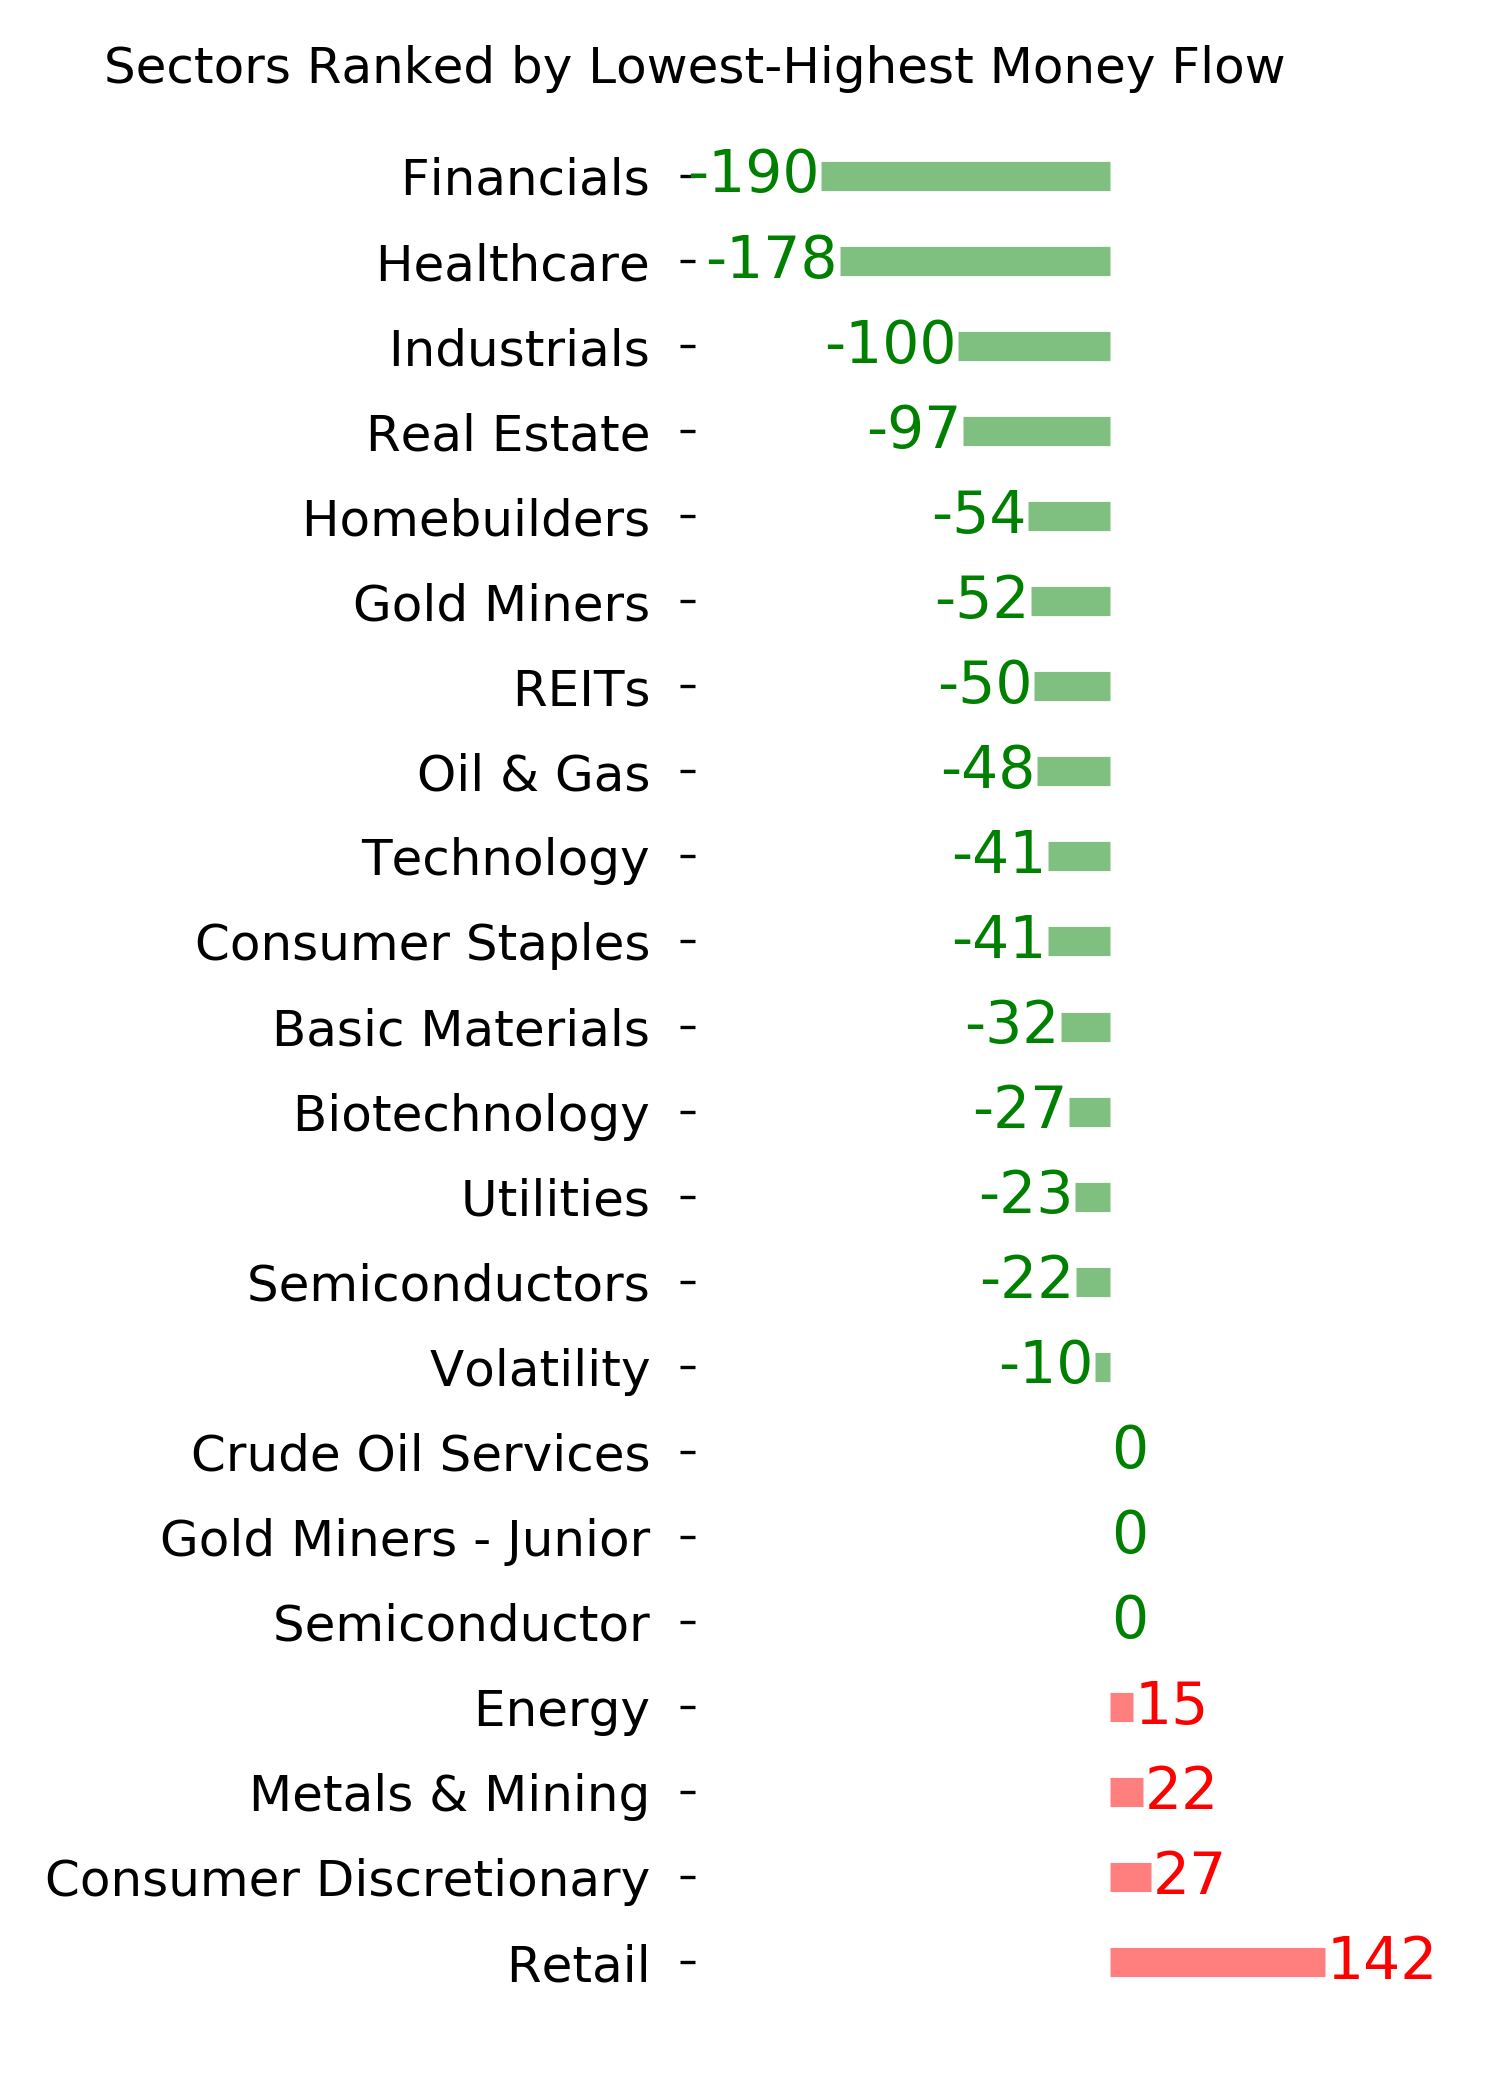
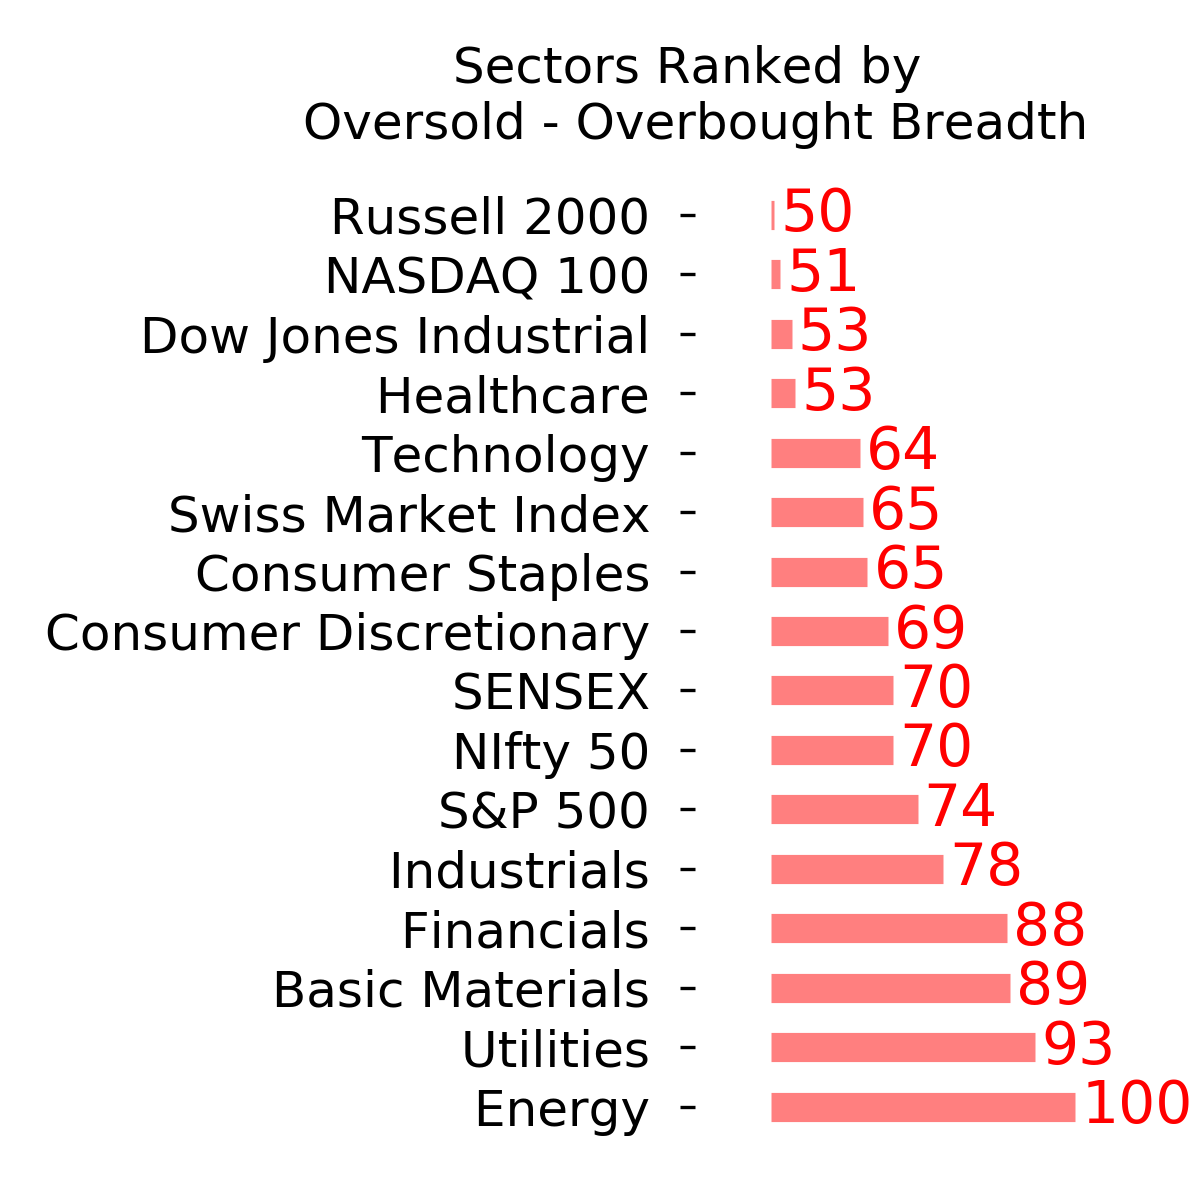
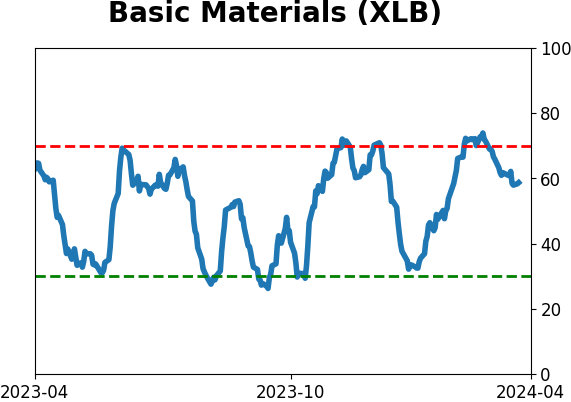
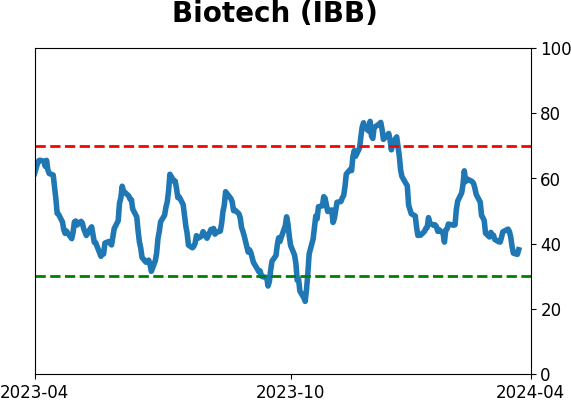
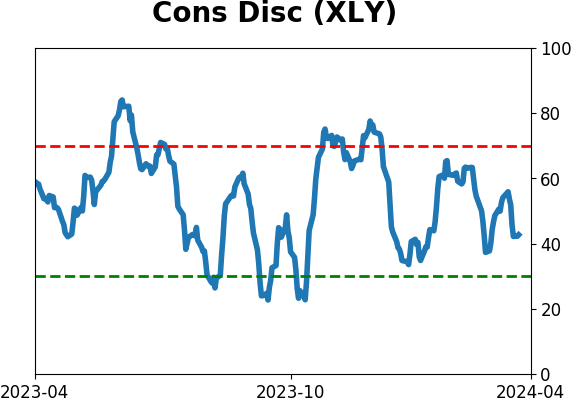
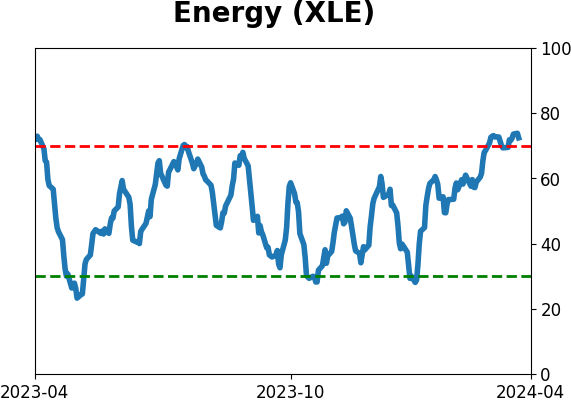
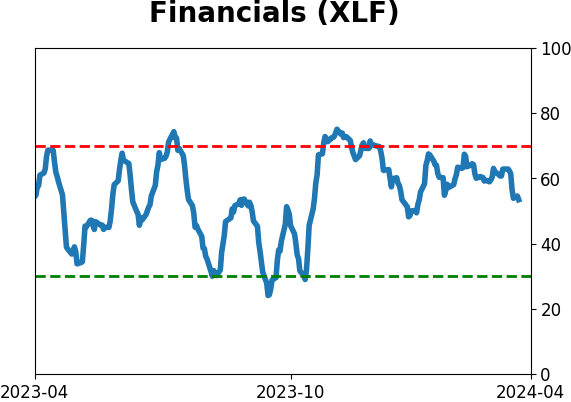
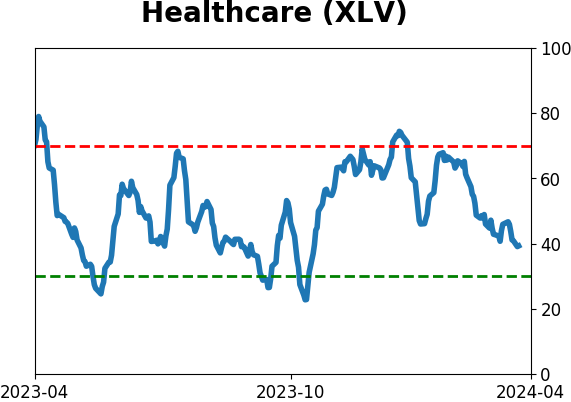
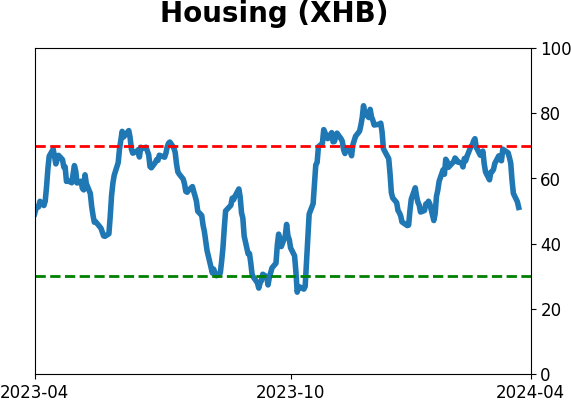
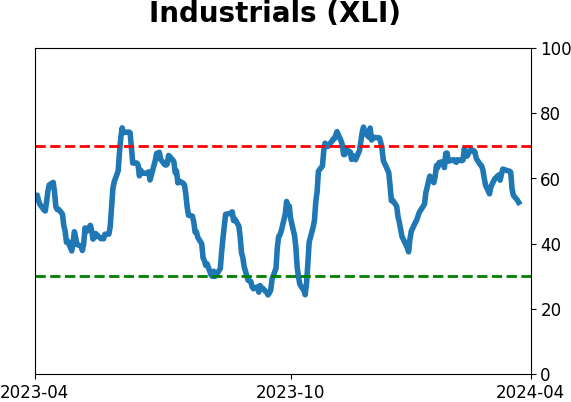
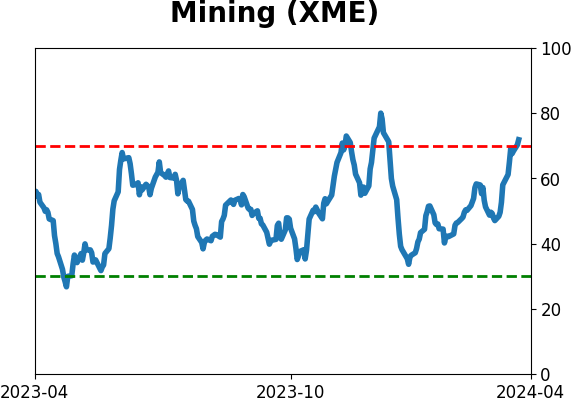
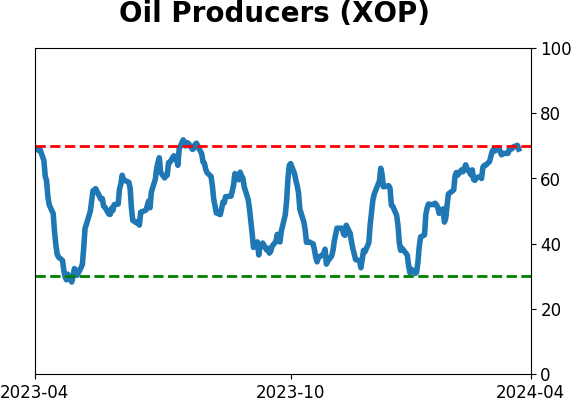
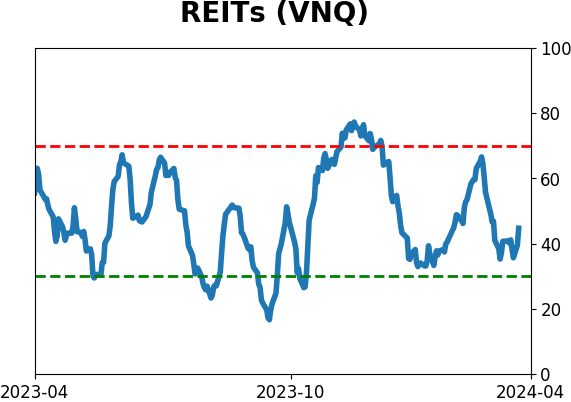
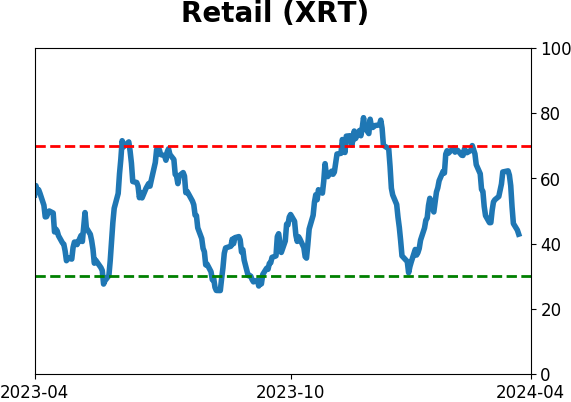
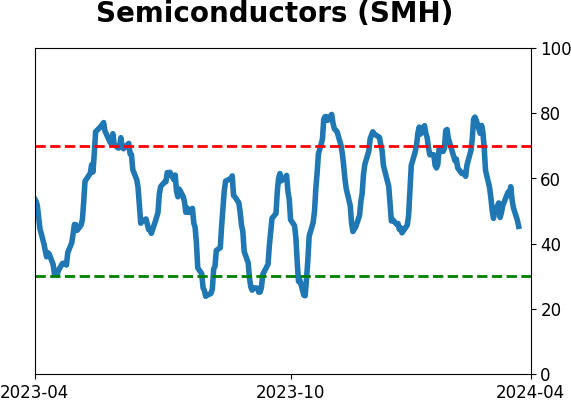
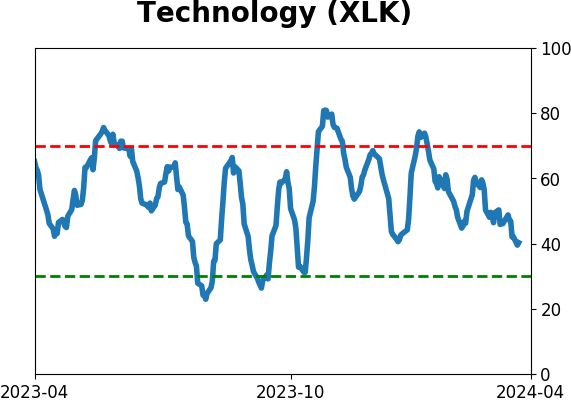
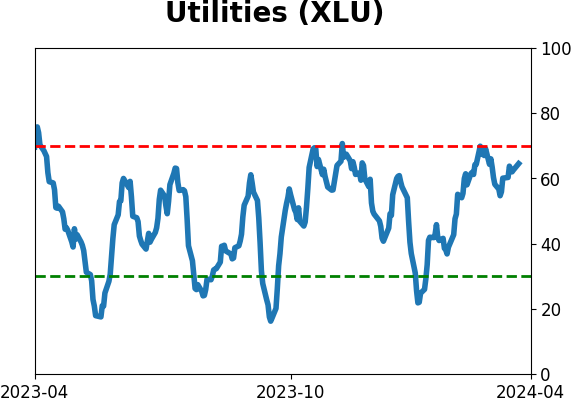
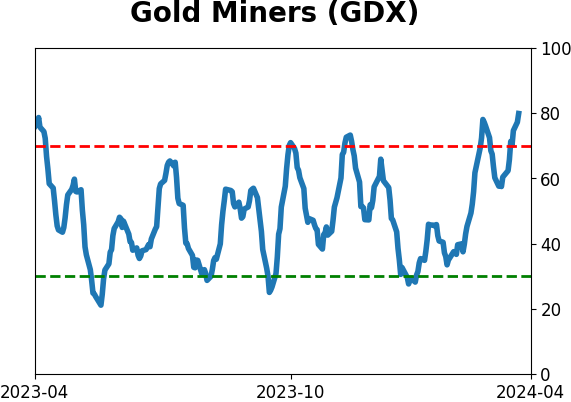
Sector ETF's - 10-Day Moving Average
|
|
|
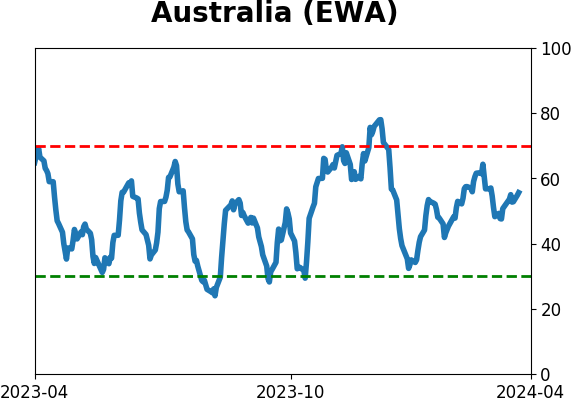
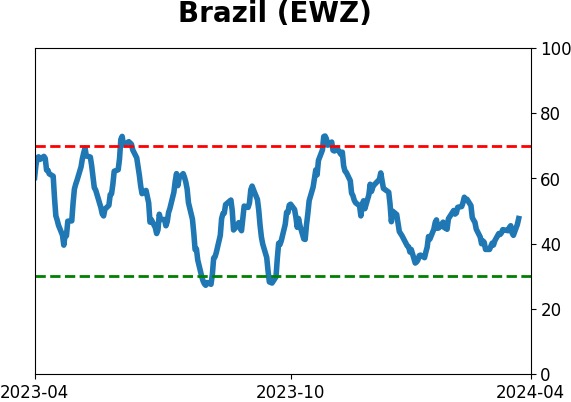
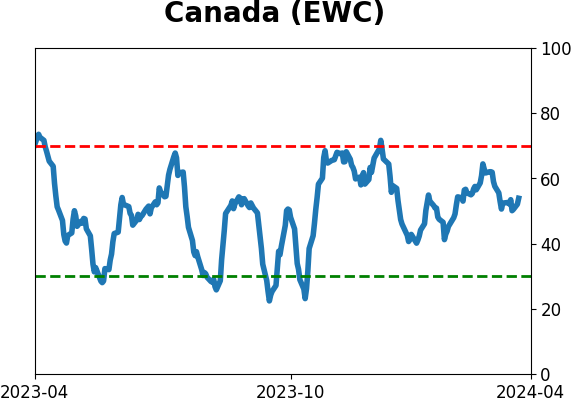
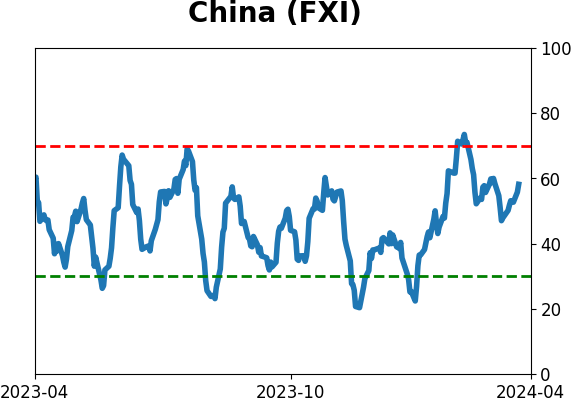
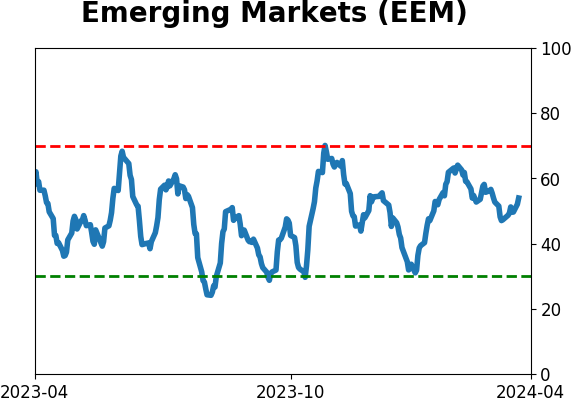
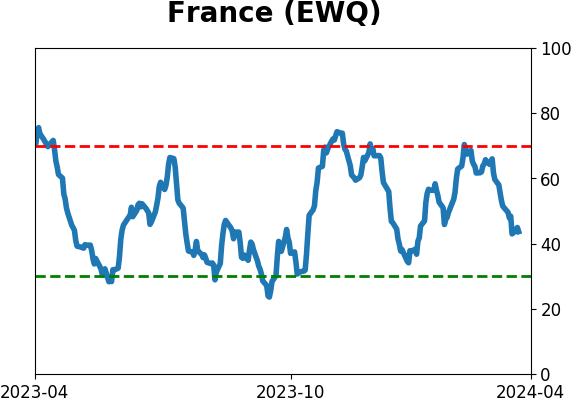
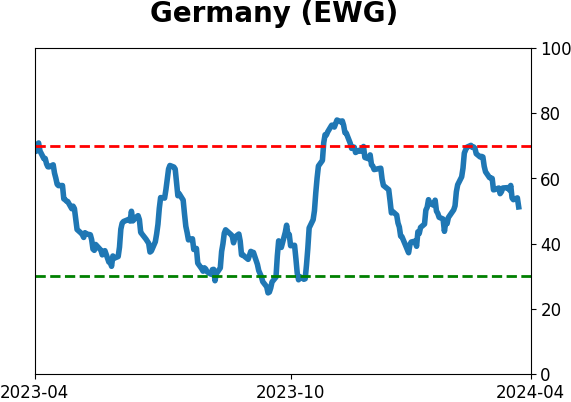
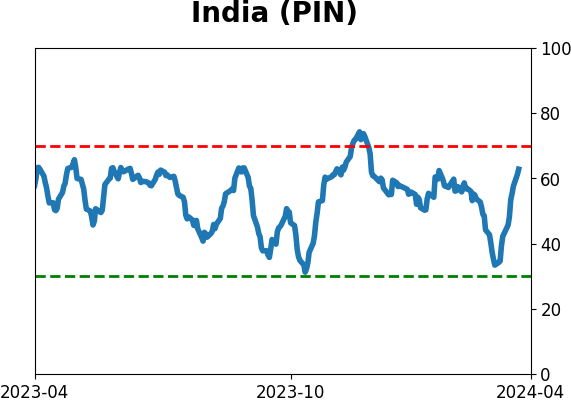
Country ETF's - 10-Day Moving Average
|
|
|
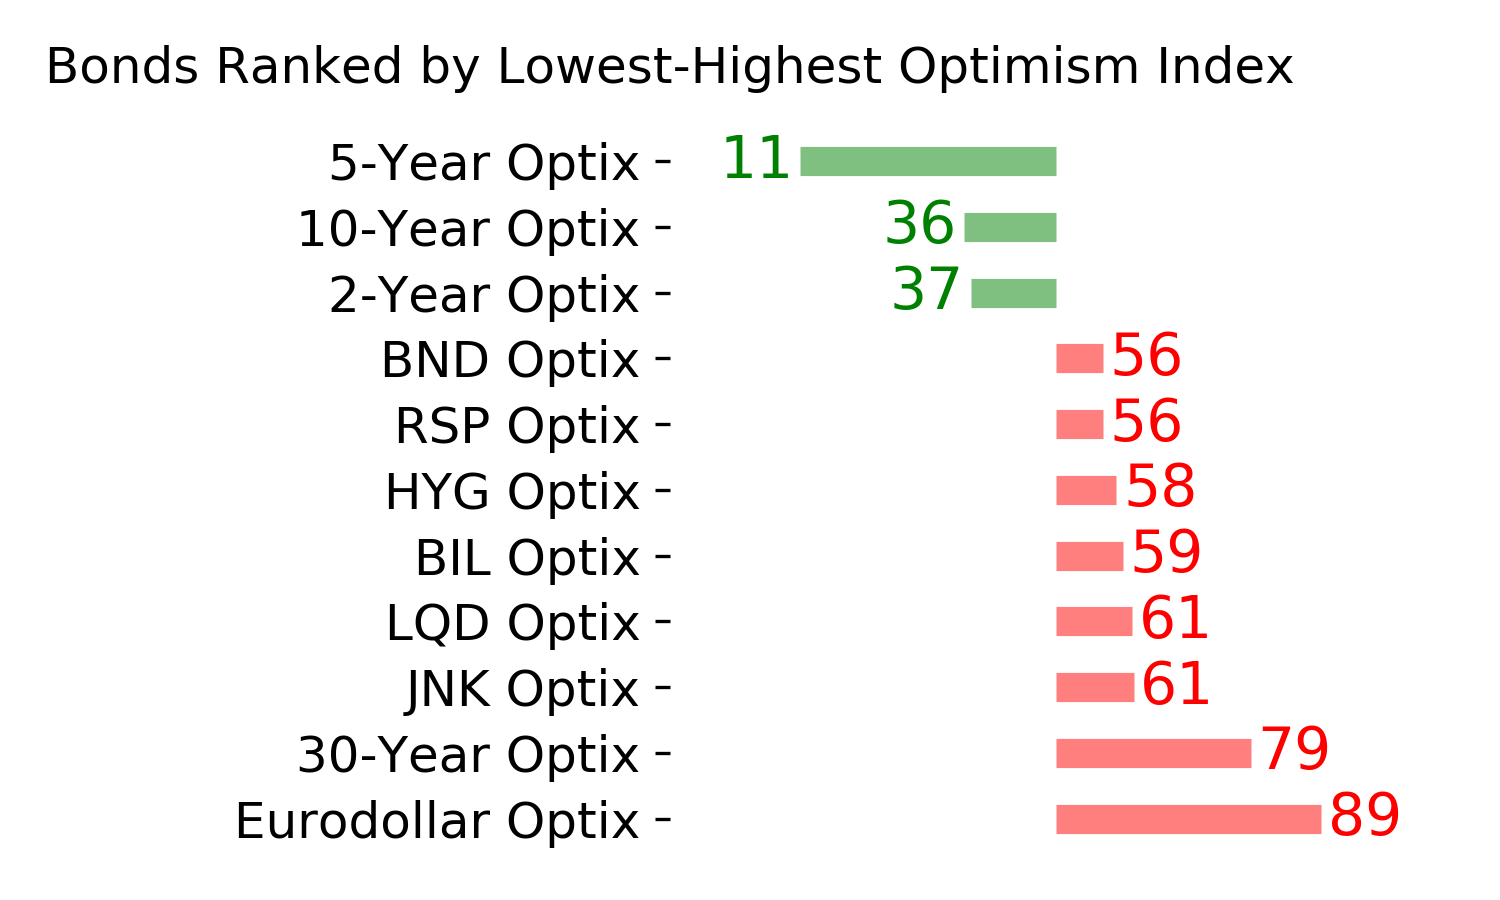
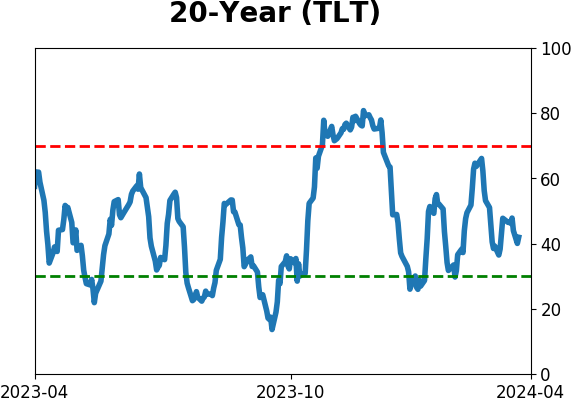
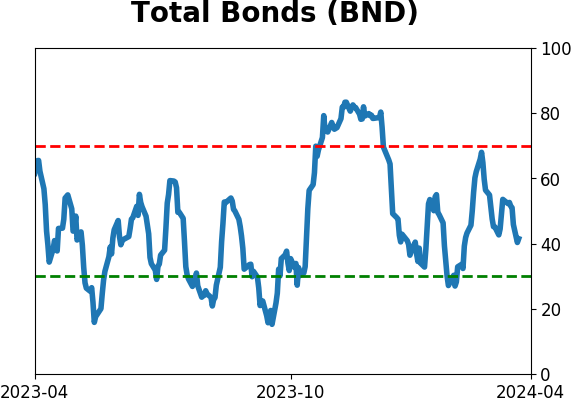
Bond ETF's - 10-Day Moving Average
|
|
|
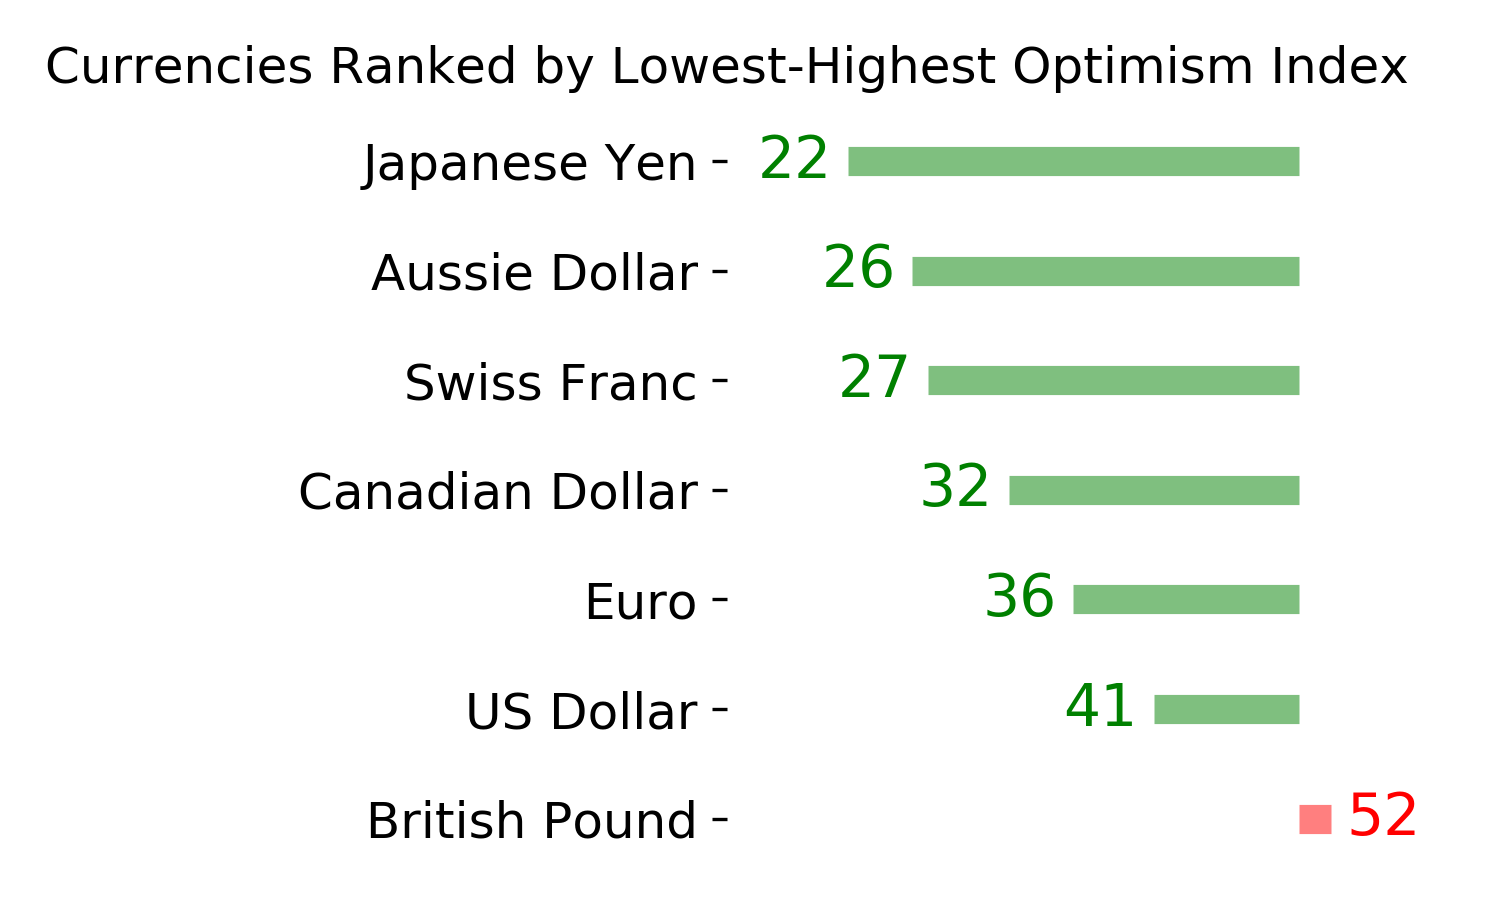
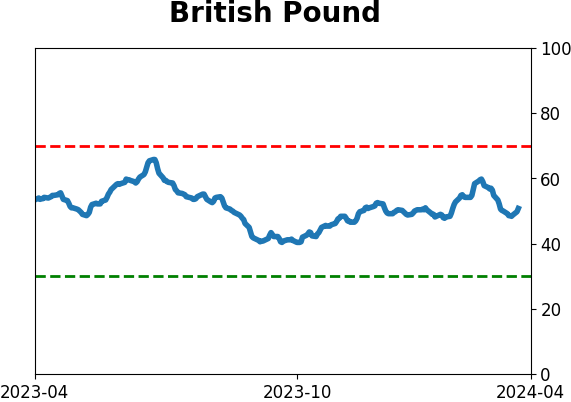
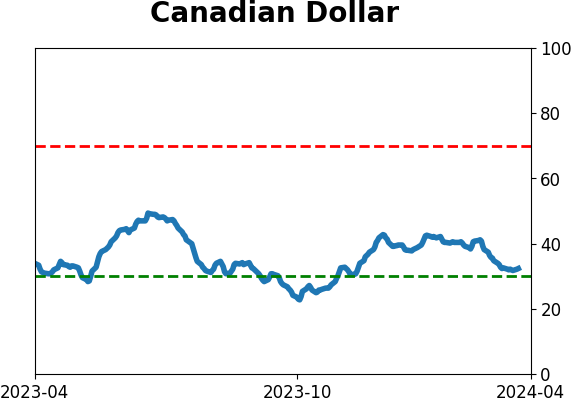
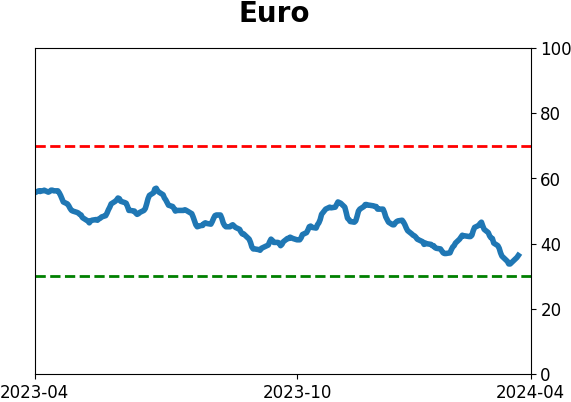
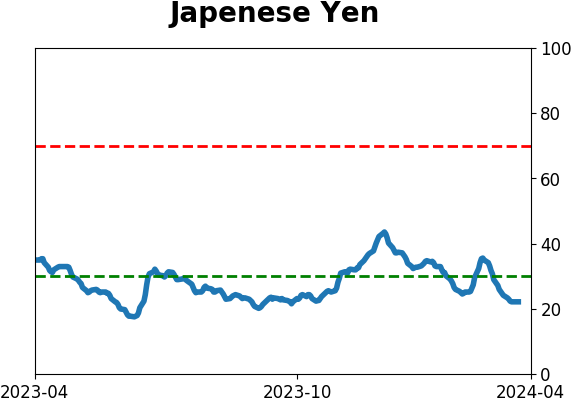
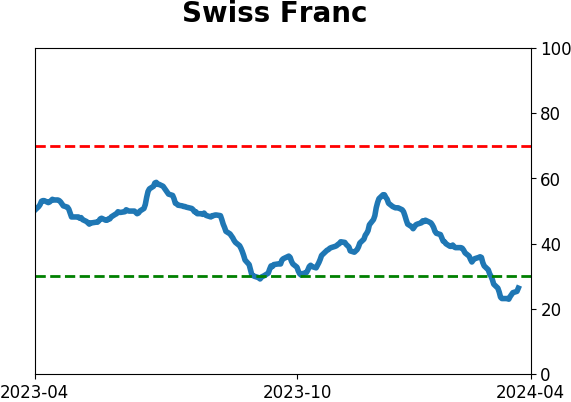
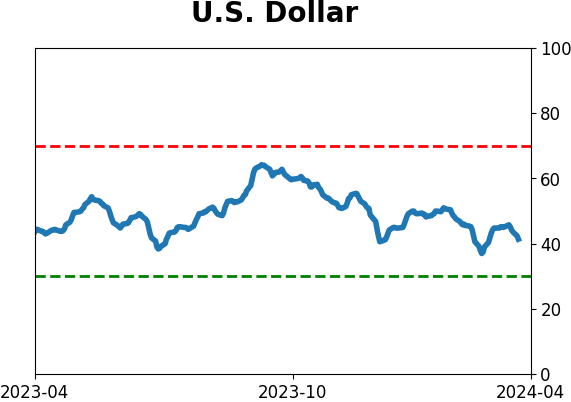
Currency ETF's - 5-Day Moving Average
|
|
|
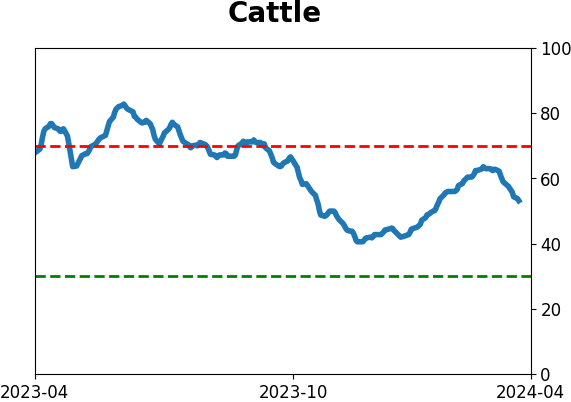
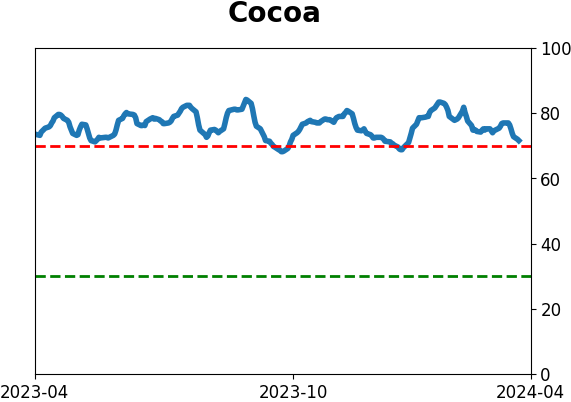
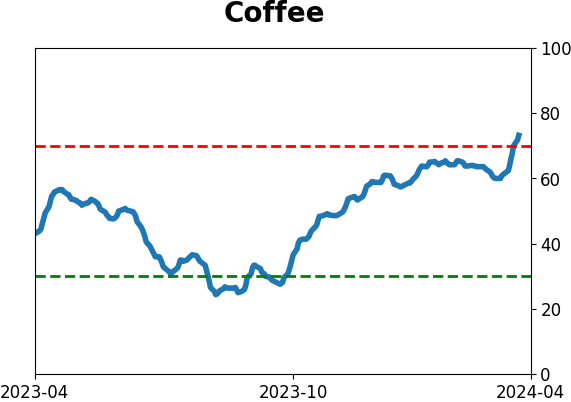
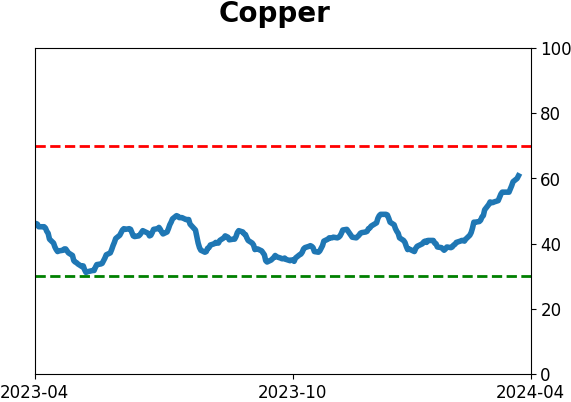
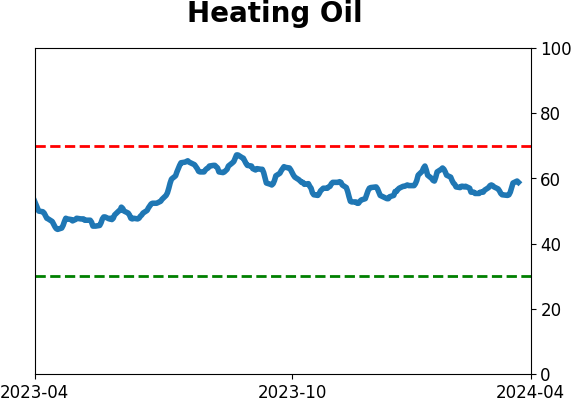
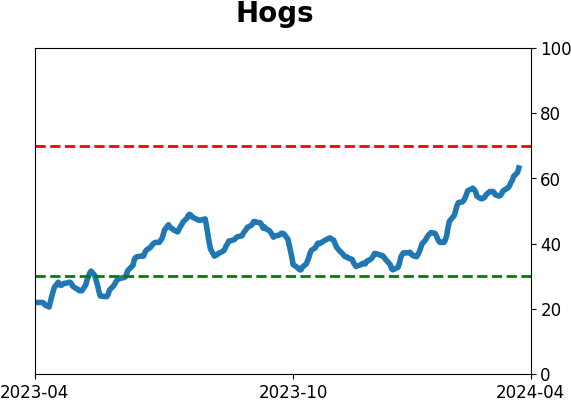
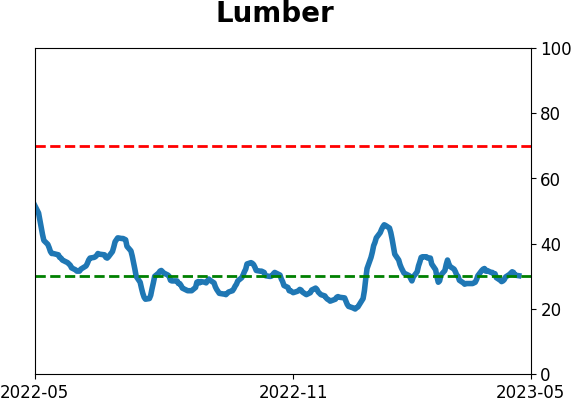
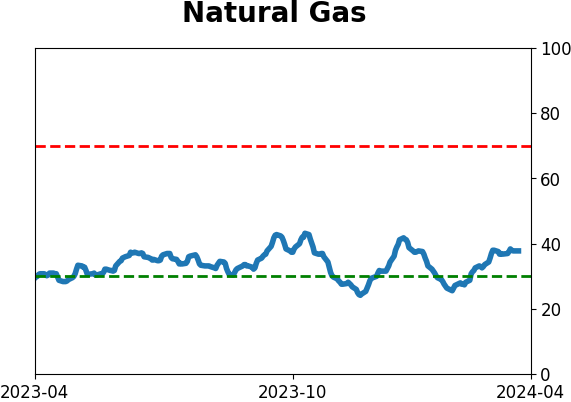
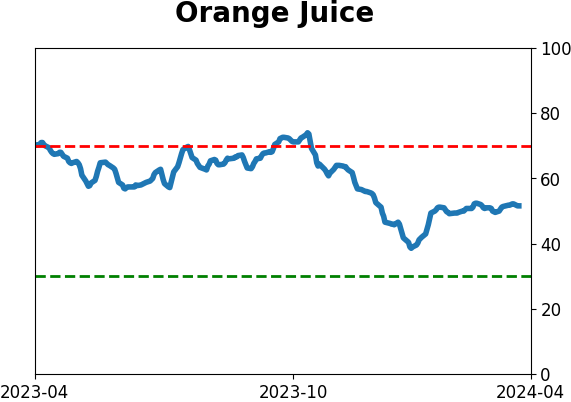
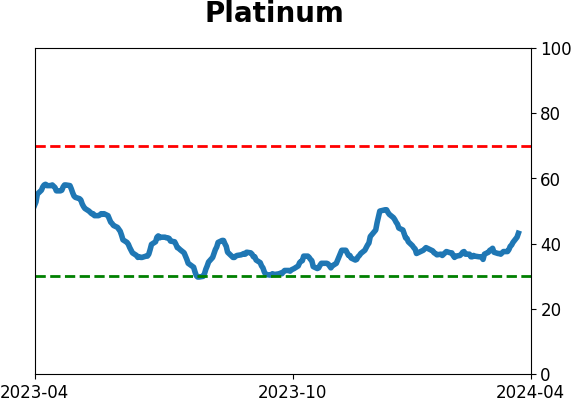
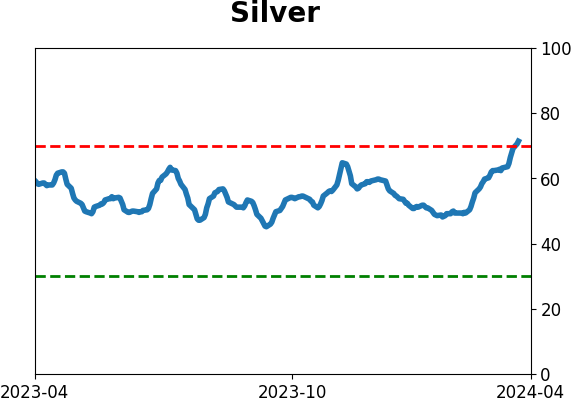
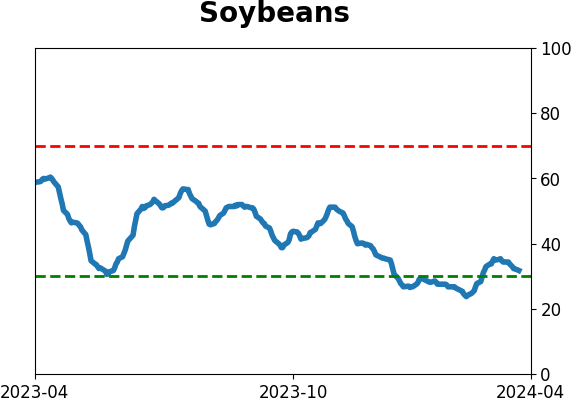
Commodity ETF's - 5-Day Moving Average
|
|