Headlines
|
|
Still waiting for the market environment to turn healthy:
In recent weeks, buyers have came in with force, triggering thrusts in indexes, exchanges, and even the bond market. But so far, that hasn't translated to an objectively healthy market environment. That needs to change to have more confidence in a sustainable rally.
|
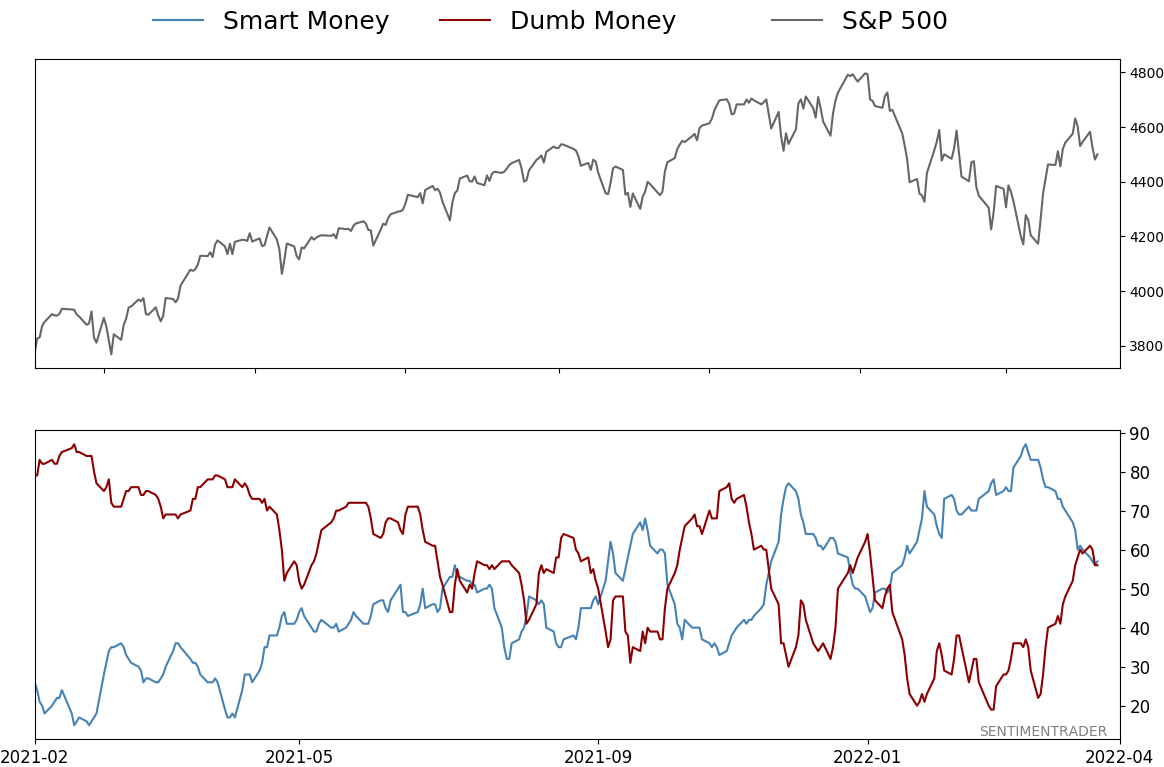
Smart / Dumb Money Confidence
|
Smart Money Confidence: 57%
Dumb Money Confidence: 56%
|
|
Risk Levels
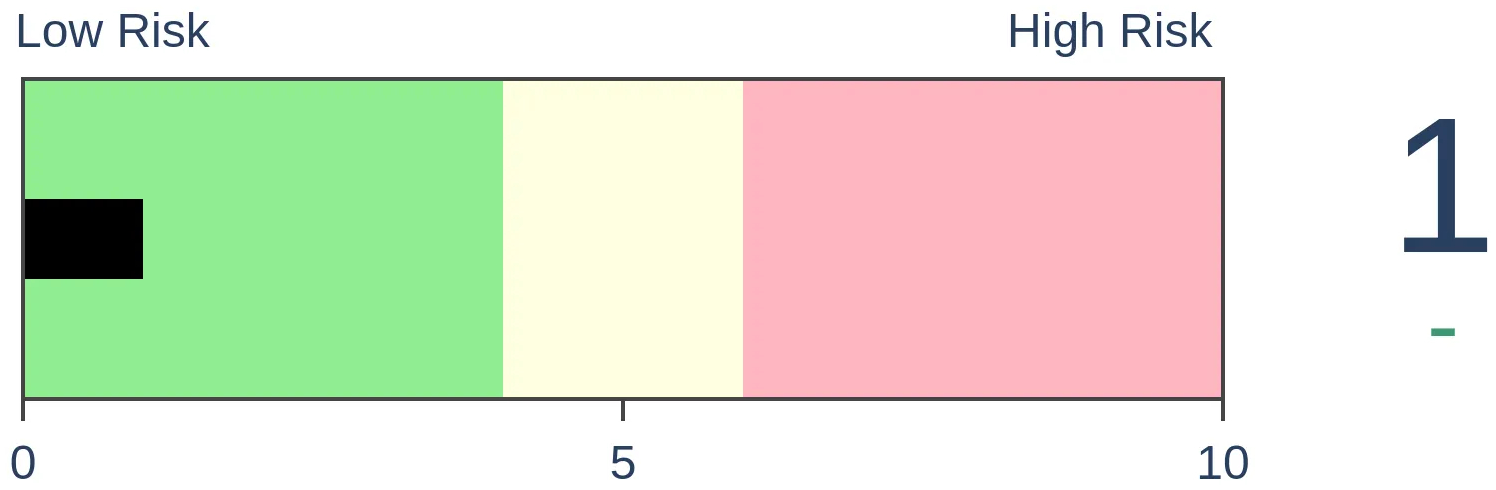
Stocks Short-Term
|
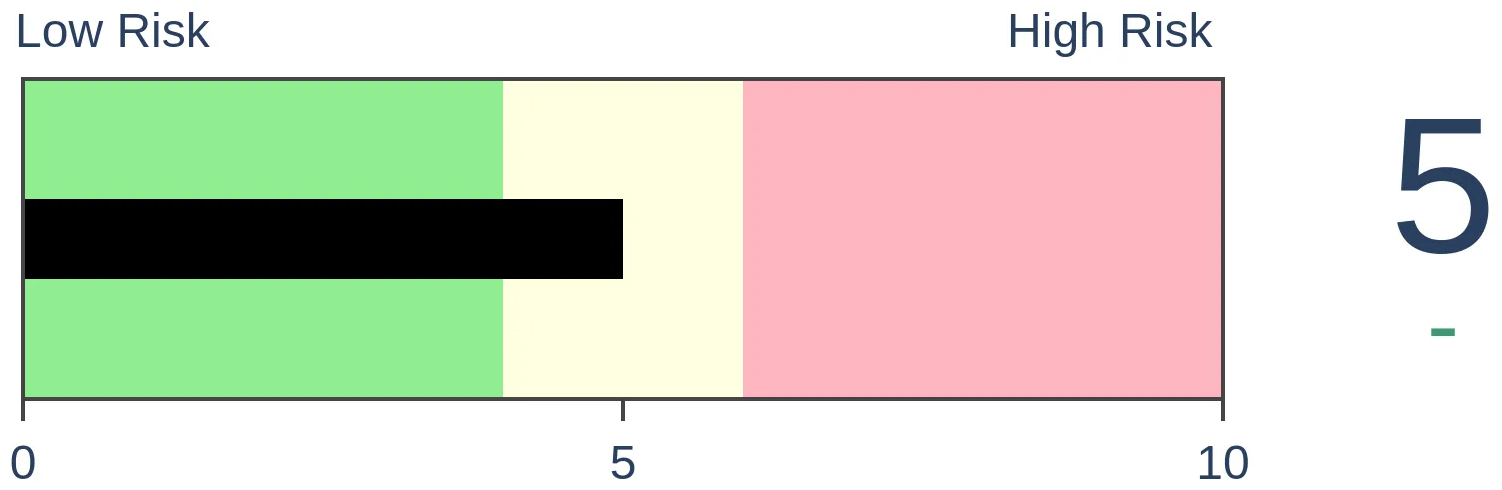
Stocks Medium-Term

|
|
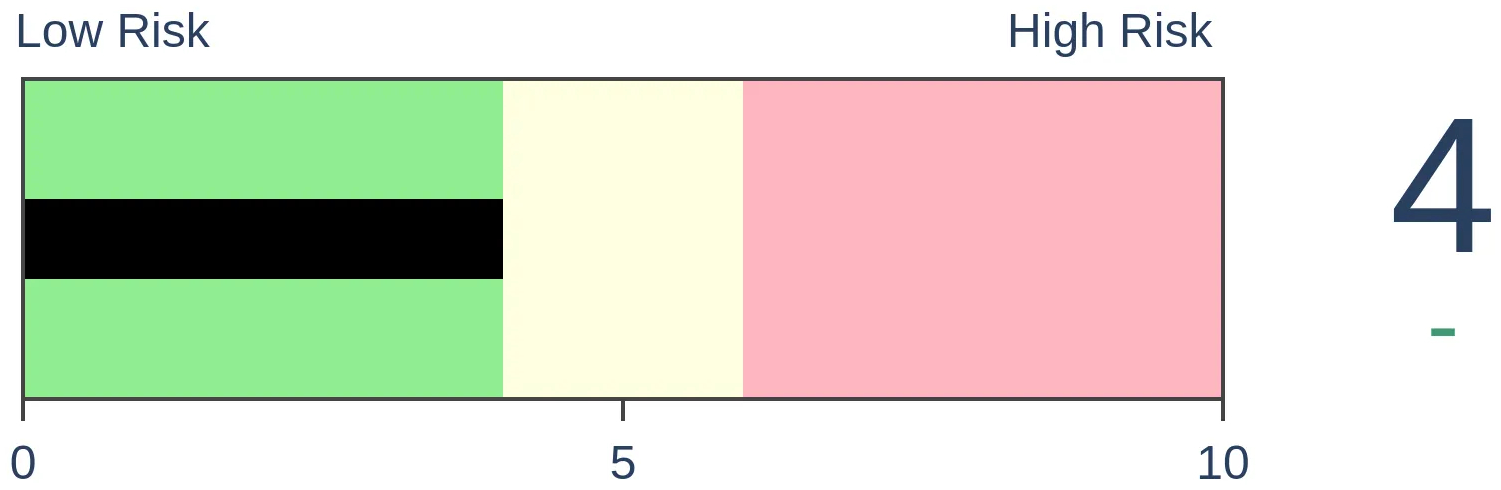
Bonds
|
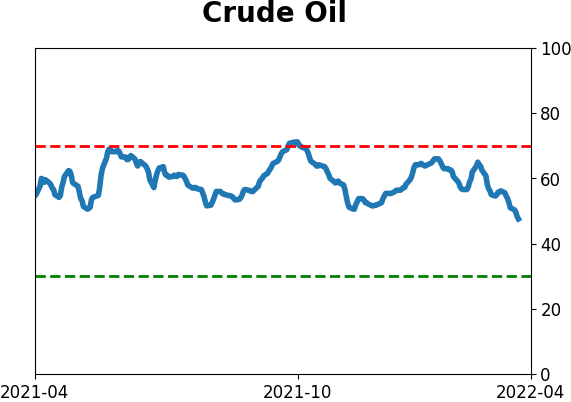
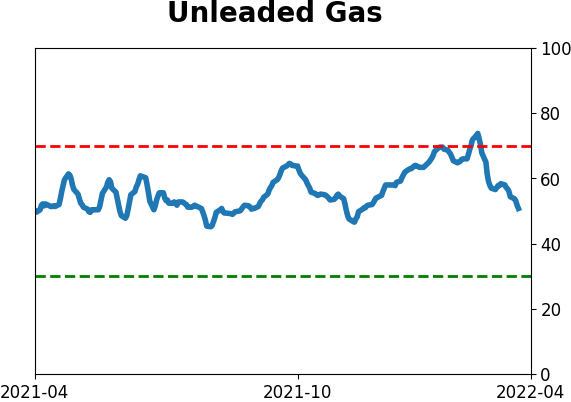
Crude Oil

|
|
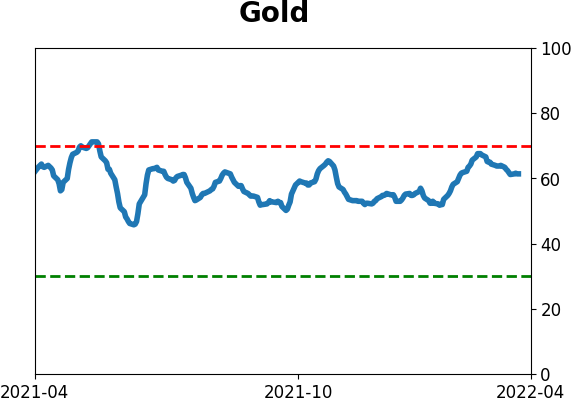
Gold
|
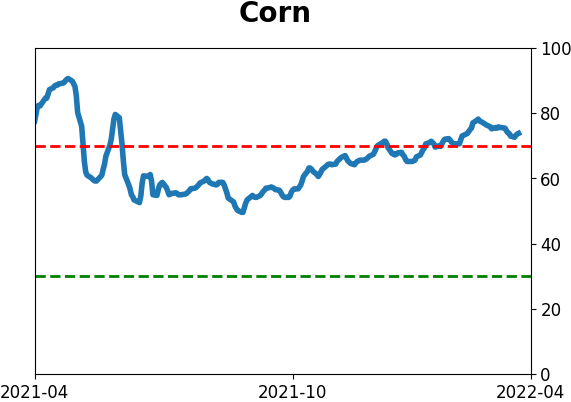
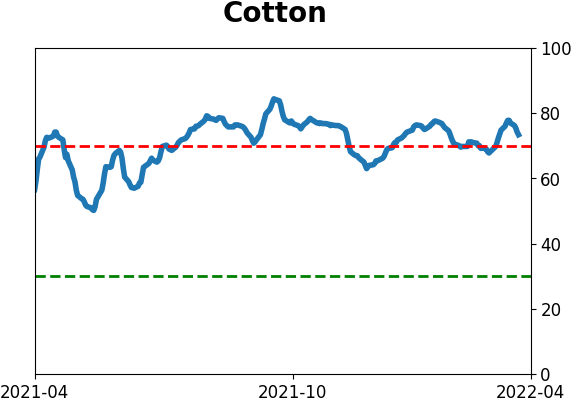
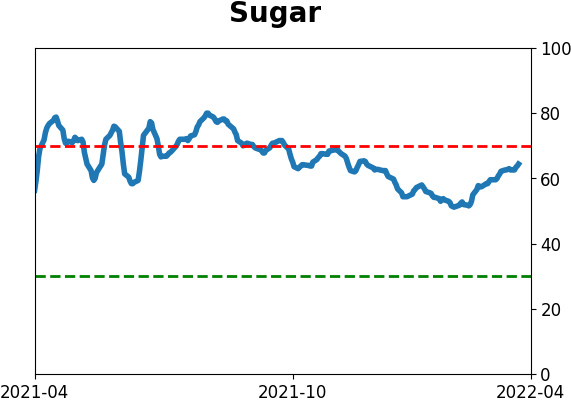
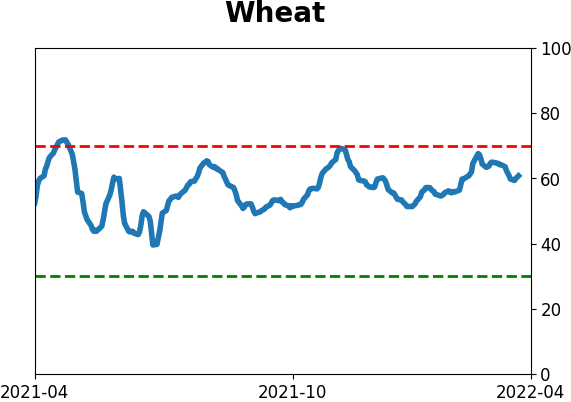
Agriculture
|
|
Research
By Jason Goepfert
BOTTOM LINE
In recent weeks, buyers have came in with force, triggering thrusts in indexes, exchanges, and even the bond market. But so far, that hasn't translated to an objectively healthy market environment. That needs to change to have more confidence in a sustainable rally.
FORECAST / TIMEFRAME
None
|
Key points:
- It's been a struggle to see a majority of 8 key market environment factors turn healthy
- In unhealthy environments, advances tend to be choppy and prone to failure
- The recent thrusts need to morph into longer-term sustainable advances
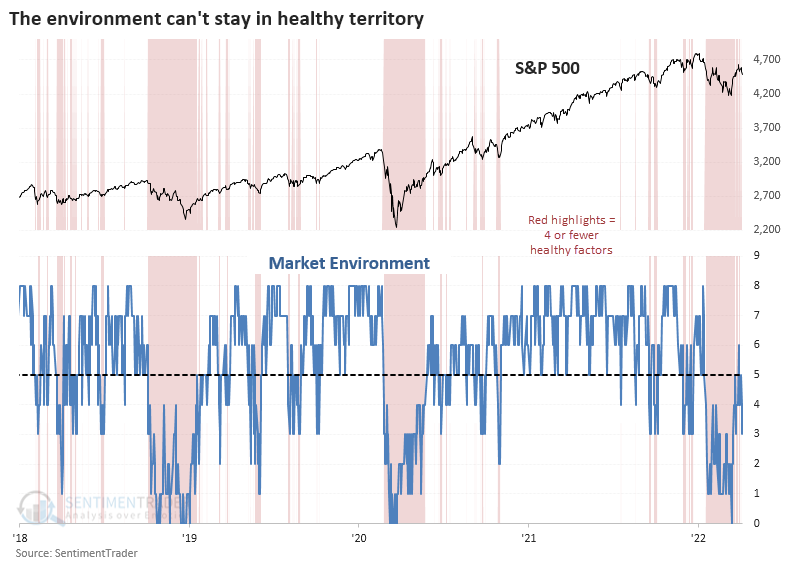
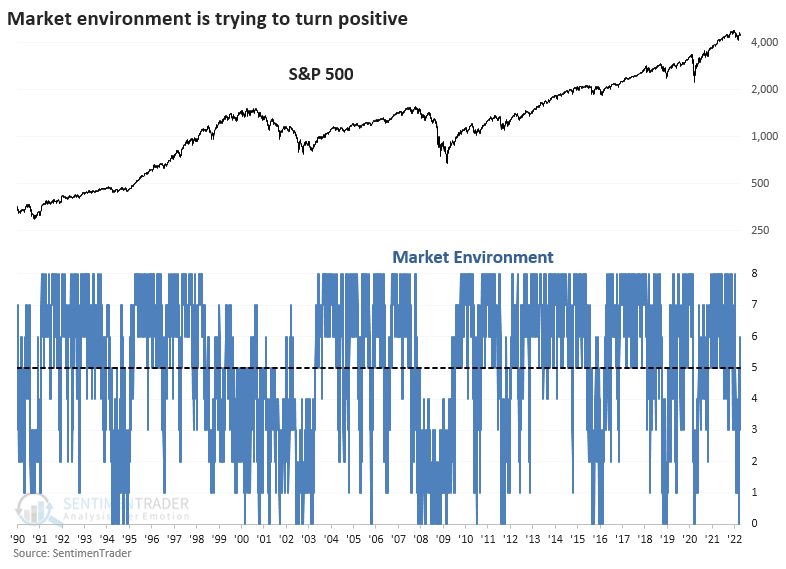
The market environment is struggling to turn healthy
After the most benchmarked index in the world fell into a "10-and-10" correction, buyers stepped in with force. Breadth thrusts have been recorded in indexes, entire exchanges, and even in high-yield bonds.
And yet this is all within a post-speculative sentiment bubble and a still-struggling market environment. Even after the thrusts, the environment has not managed to turn consistently positive.
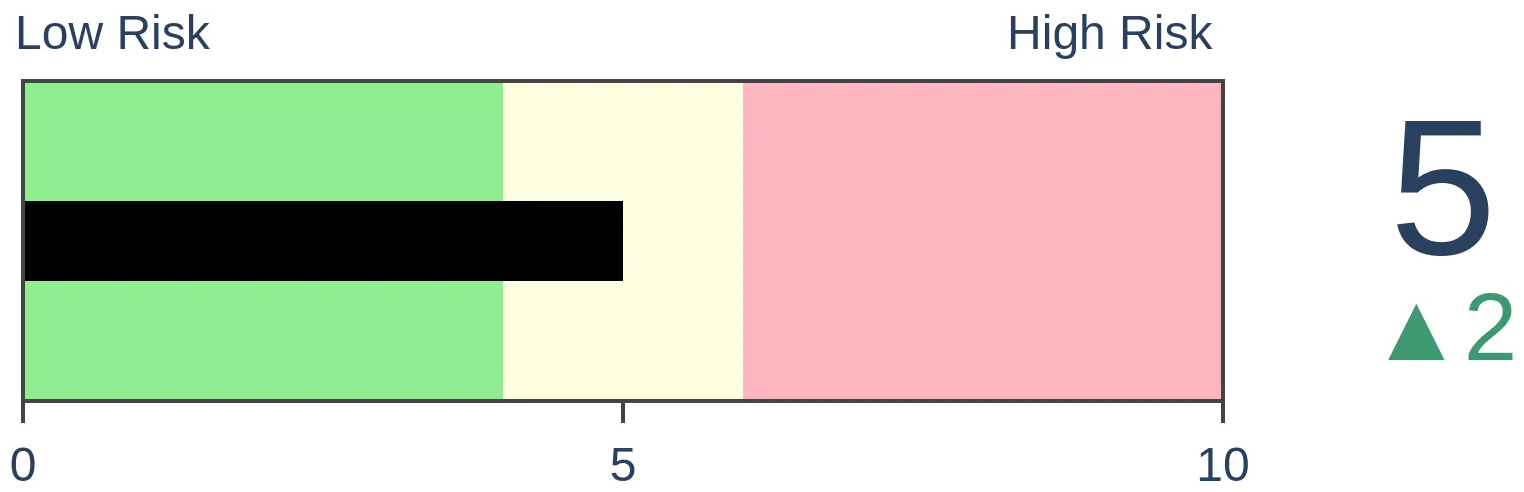
As noted in the Knowledge Base, I follow 8 basic measures of market health that anyone can monitor. There are certainly more complicated indicators and more sophisticated ways of paring the list, like machine learning or principal component analysis. This is based on brute-force testing and a whole lot of experience.
As of Tuesday's close, only 3 of the factors were in healthy territory. A couple of them are flirting around their thresholds, so this can improve quickly, but it needs to be sustained.
Unhealthy environments tend to have the choppiest trading
Over the past several years, these measures have provided a good heads-up to stay out, or at least cautious, when the environment is unhealthy. It's been trying to poke above 5 but hasn't been able to hold, and the last couple of days pushed us right back down. Through testing over the past 50 years, when 5 or more factors are healthy, stocks tend to do their best.
Over the past 30 years, stocks have spent 65% of the time in a healthy environment and 35% in an unhealthy one.
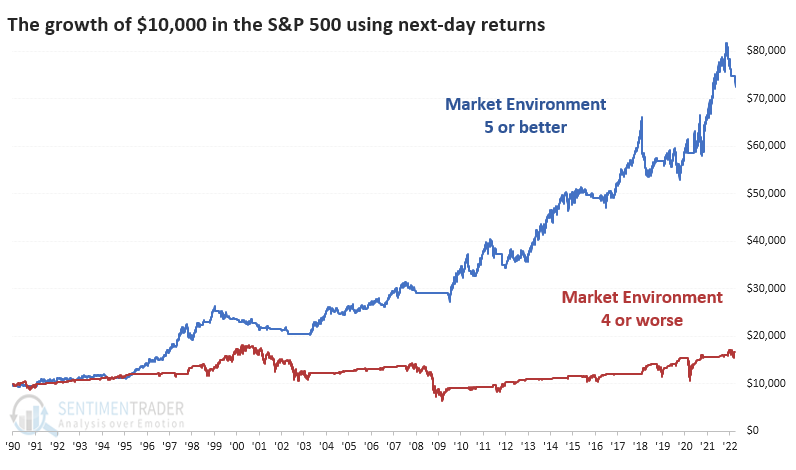
Using this as a trading system would be difficult because it can jump in and out during choppy markets. But using next-day returns, the equity curve is drastically different depending on the environment. Since 1990, $10,000 grew to more than $72,000 during healthy environments and only $17,000 during unhealthy ones. Early 2018 was kind of screwy; otherwise, these figures would be stretched even further.
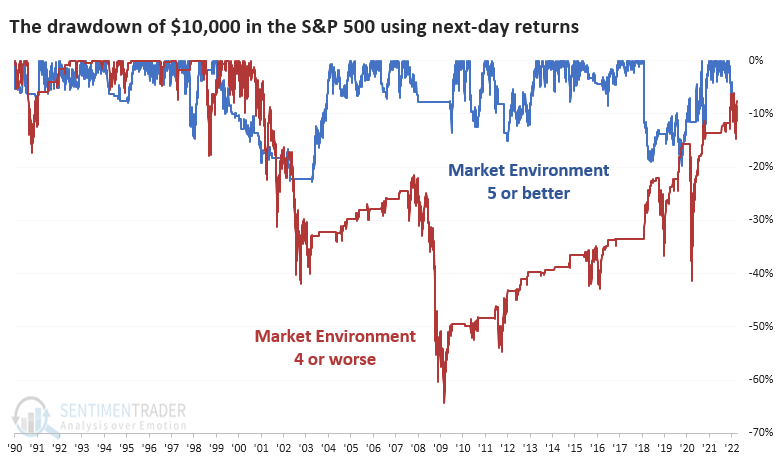
We're always more concerned about risk than reward, and looking at the drawdowns in the two curves, unhealthy environments saw a drawdown about 3 times greater than healthy ones.
What the research tells us...
There are strong suggestions that the interest from buyers over the past 3 weeks is the kind of activity that tends to generate even more buying interest during the next 1 to 3 months. We place a lot of weight on breadth thrusts in all their various forms, and many of them have triggered. Given the larger context, we'd like to see more environmental factors turn positive. The fact that they're not makes it riskier to add exposure.
We will be adding this Market Environment to the daily site updates at some point. We're currently involved in the most extensive tech upgrade in our history, so we've mostly put off adding anything further to the site until that's completed. The public face of the site will be updated next week, after which we're tackling the user side, which involves a complete overhaul in the architecture of the data and its presentation. At that time, we'll have the capability of adding more indicators, models, and tools in a more logical and easier-to-use way.
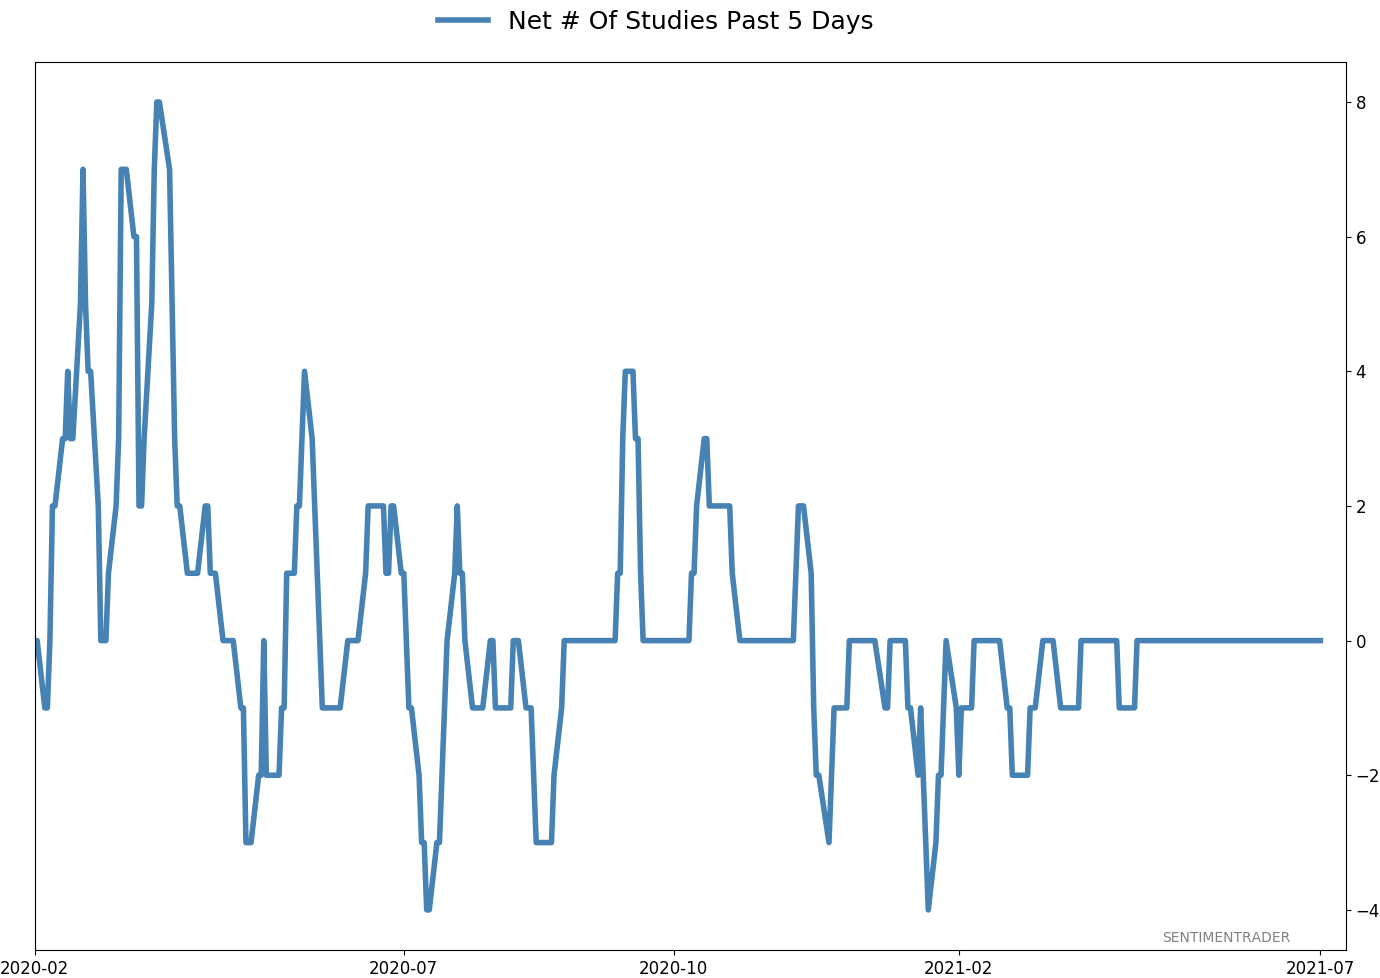
Active Studies
| Time Frame | Bullish | Bearish | | Short-Term | 4 | 0 | | Medium-Term | 25 | 3 | | Long-Term | 17 | 5 |
|
Indicators at Extremes
Portfolio
| Position | Description | Weight % | Added / Reduced | Date | | Stocks | 21.6% RSP, 5.1% IEMG | 26.7 | Added 5.3% | 2022-03-18 | | Bonds | 32.7% BND, 7.1% SCHP | 40.1 | Added 8.3% | 2021-10-26 | | Commodities | GCC | 2.4 | Reduced 2.1%
| 2020-09-04 | | Precious Metals | GDX | 4.6 | Reduced 4.2% | 2021-05-19 | | Special Situations | 7.6% KWEB, 4.9% XBI, 3.7% XLE, 1.8% PSCE | 18.0 | Added 4.6% | 2022-02-24 | | Cash | | 7.9 | | |
|
Updates (Changes made today are underlined)
We had a volatile few weeks into mid-March, and it was enough to trigger a number of extremes. Most of the studies we've looked at have had a clear bullish edge over a multi-month time frame. I'd typically be more proactive instead of reactive with changes in positions, adding exposure into weakness instead of strength, but during an unhealthy environment like we're in, I tend to be more conservative. I did add some exposure to emerging markets, choosing a fund with the least exposure to China, since I already have exposure there with KWEB. It's still heavily weighted to that market. The only other times the MSCI Emerging Markets Index has had a weekly reversal like this week were October 2008, October 2011, and August 2015, all leading to long-term gains. RETURN YTD: -0.4% 2021: +8.7%, 2020: +8.1%, 2019: +12.6%, 2018: +0.6%, 2017: +3.8%, 2016: +17.1%, 2015: +9.2%, 2014: +14.5%, 2013: +2.2%, 2012: +10.8%, 2011: +16.5%, 2010: +15.3%, 2009: +23.9%, 2008: +16.2%, 2007: +7.8%
|
|
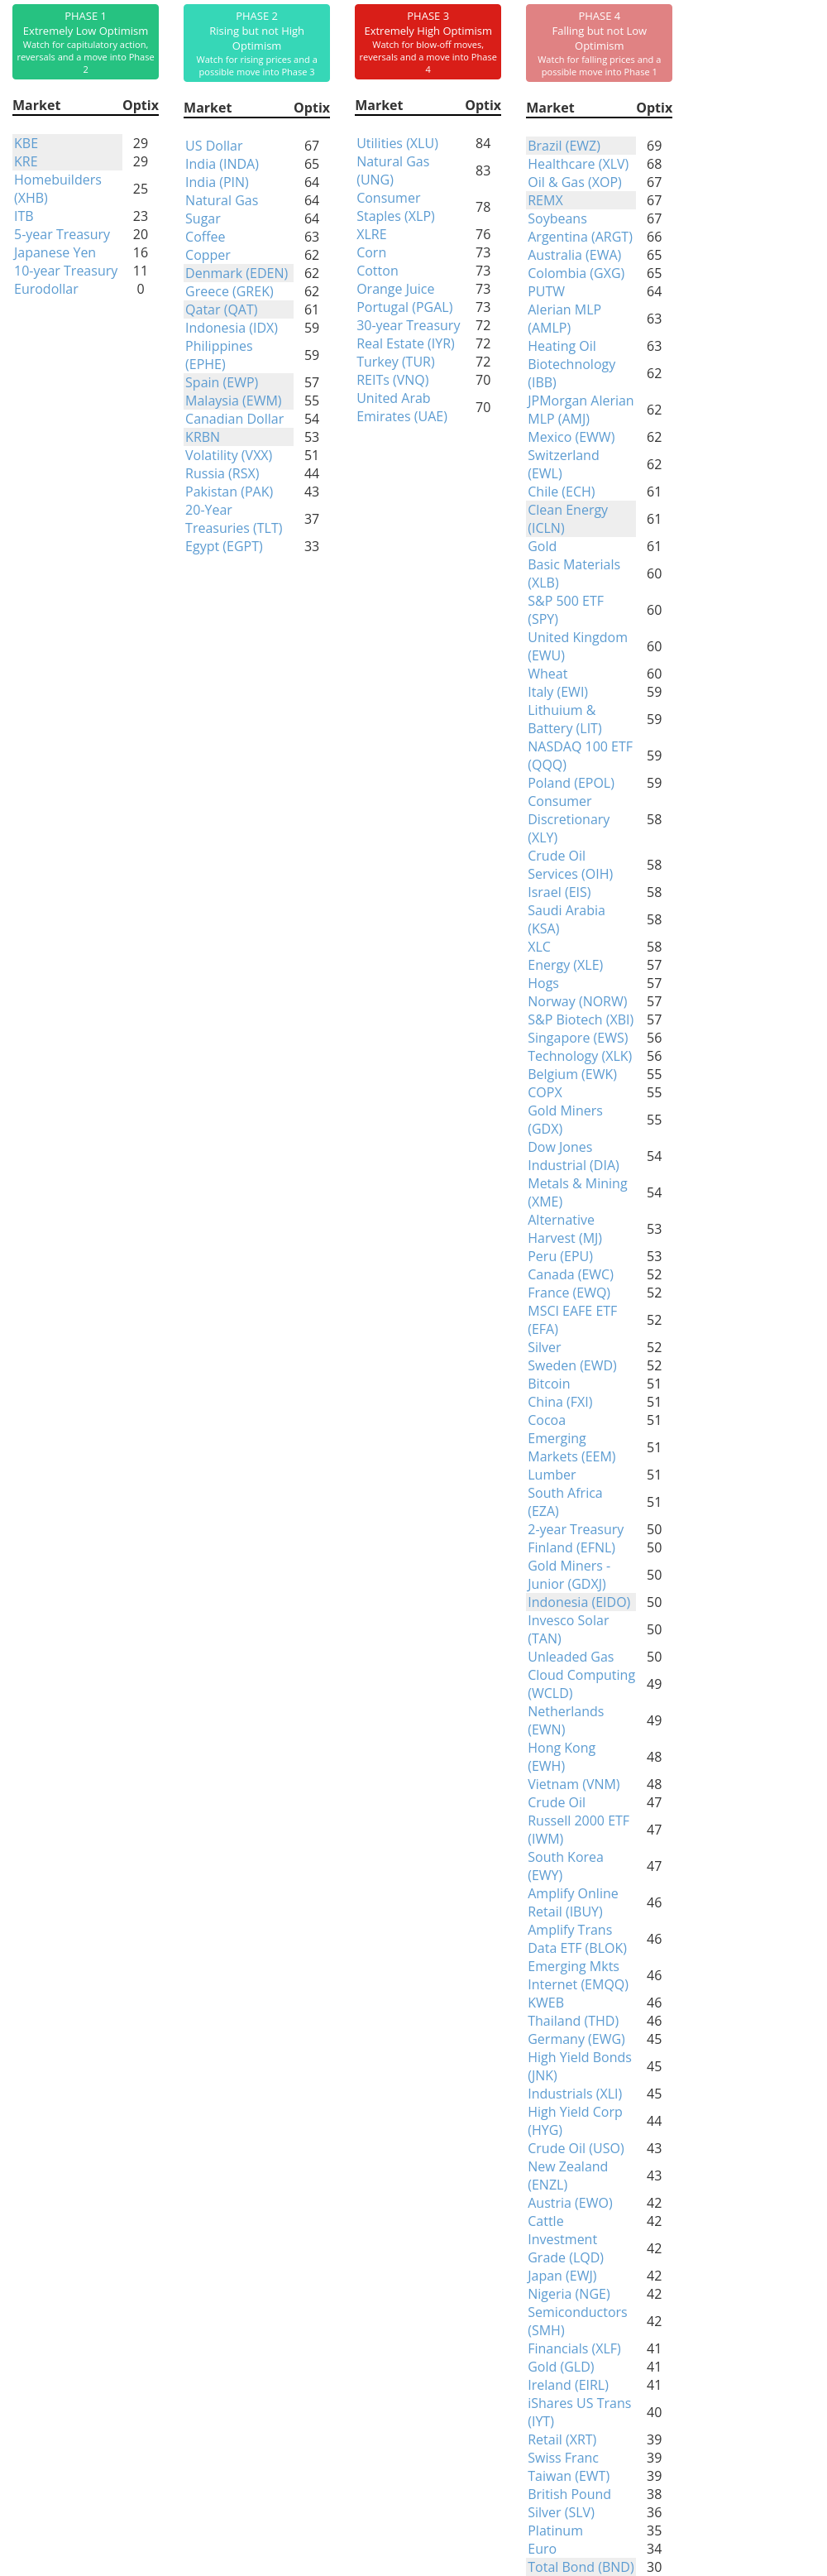
Phase Table
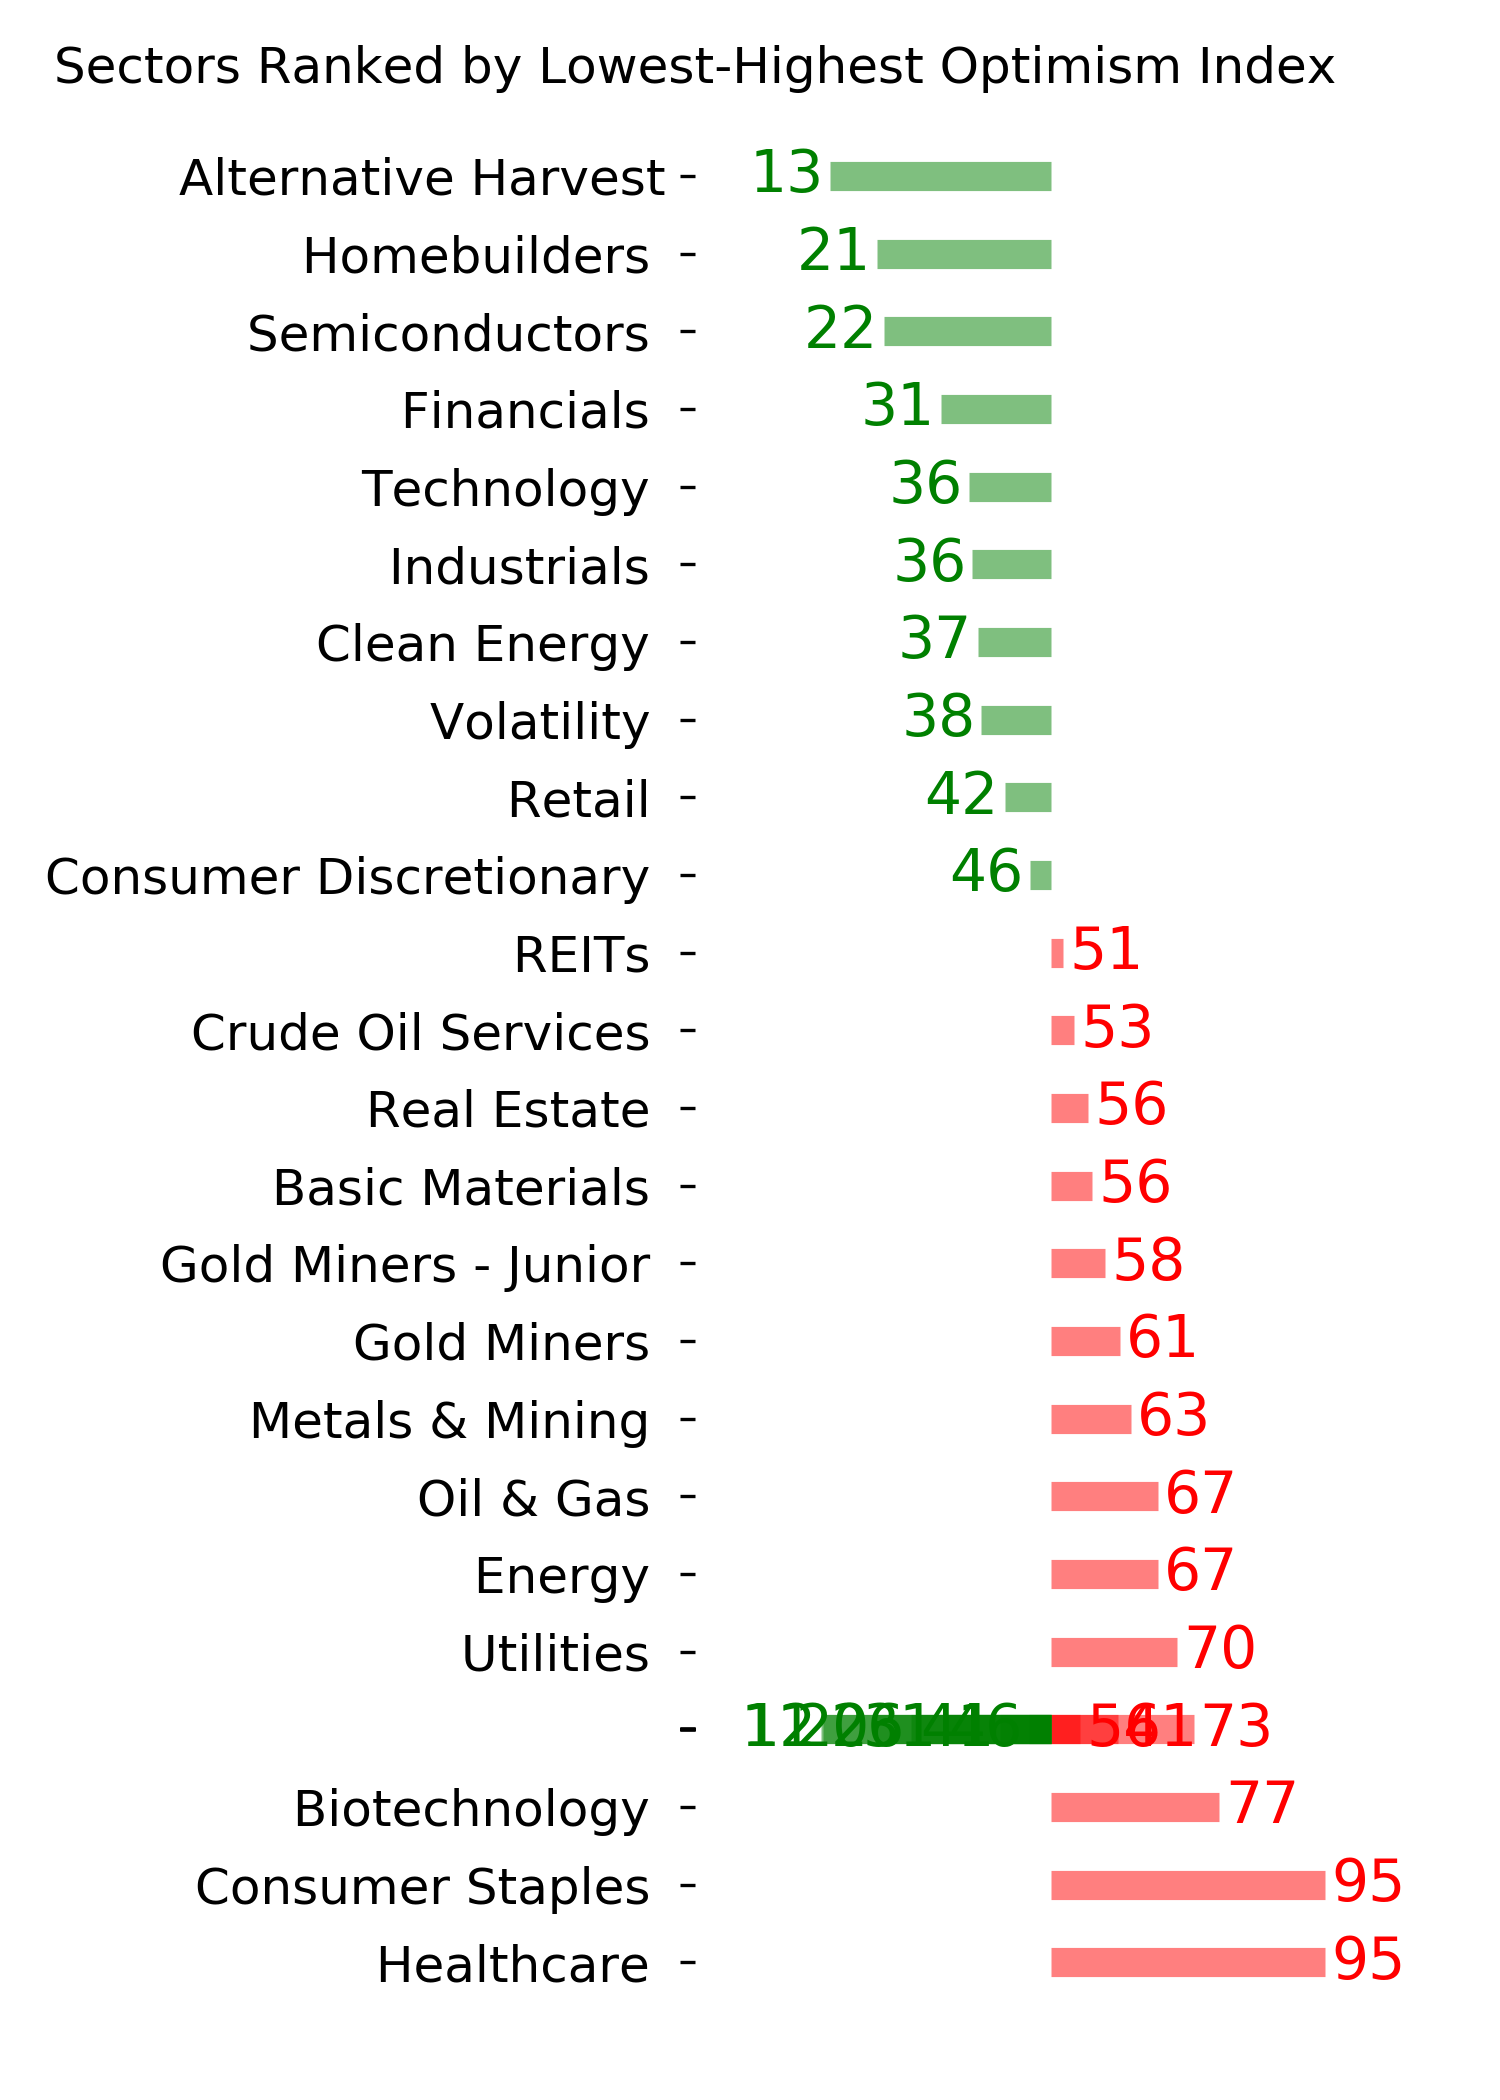
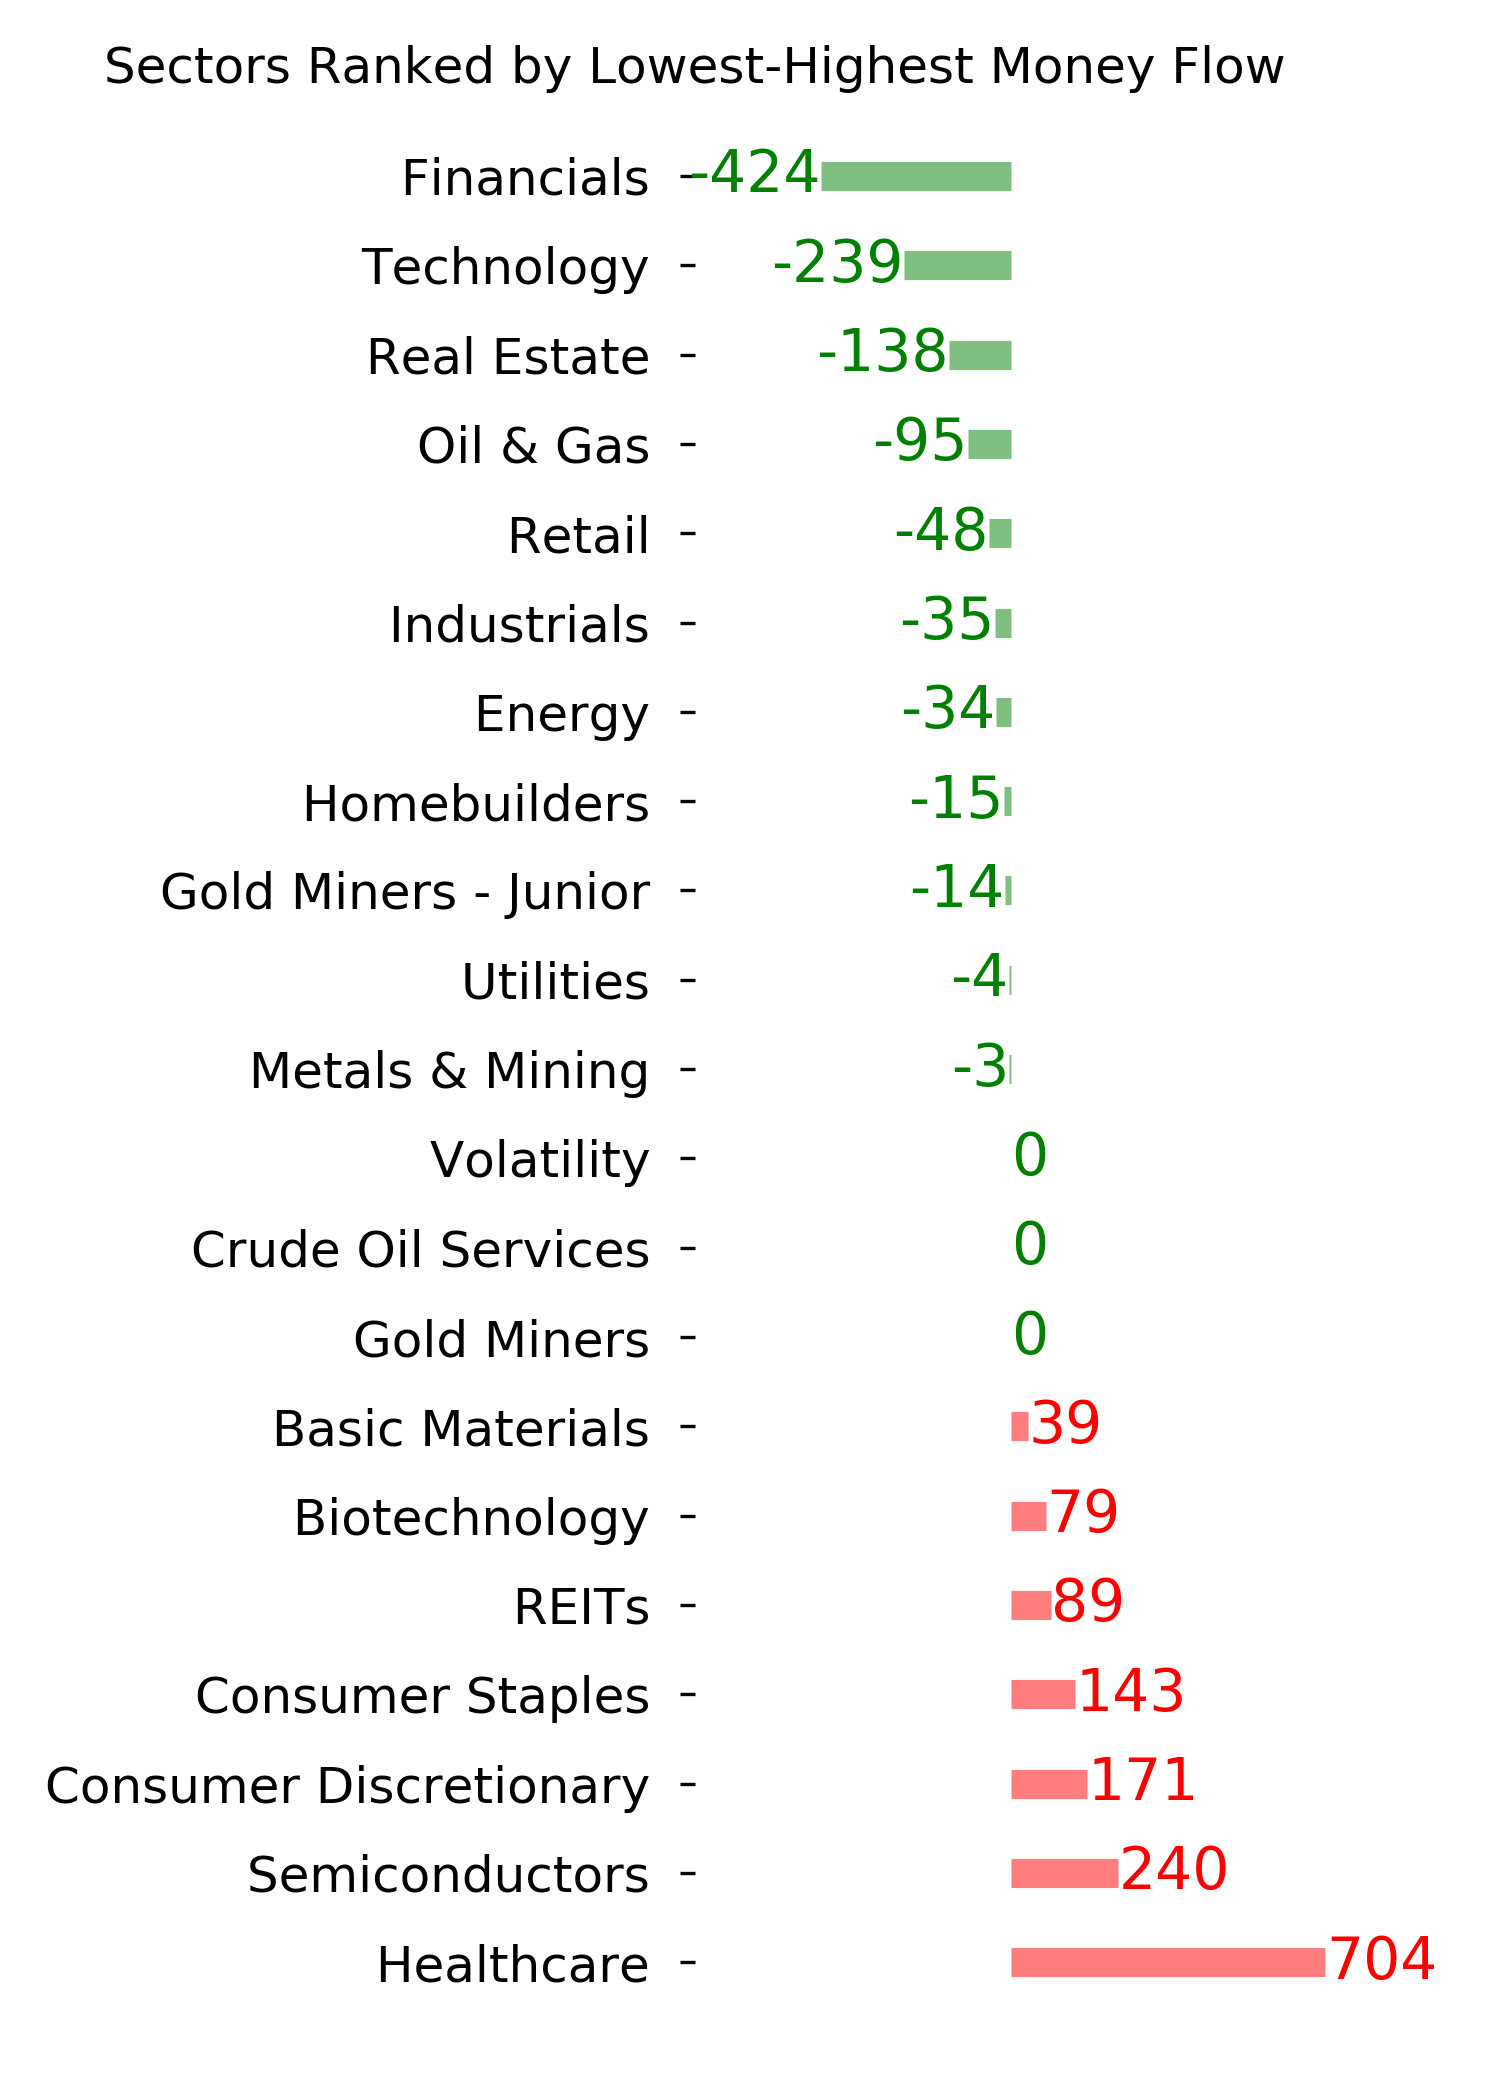
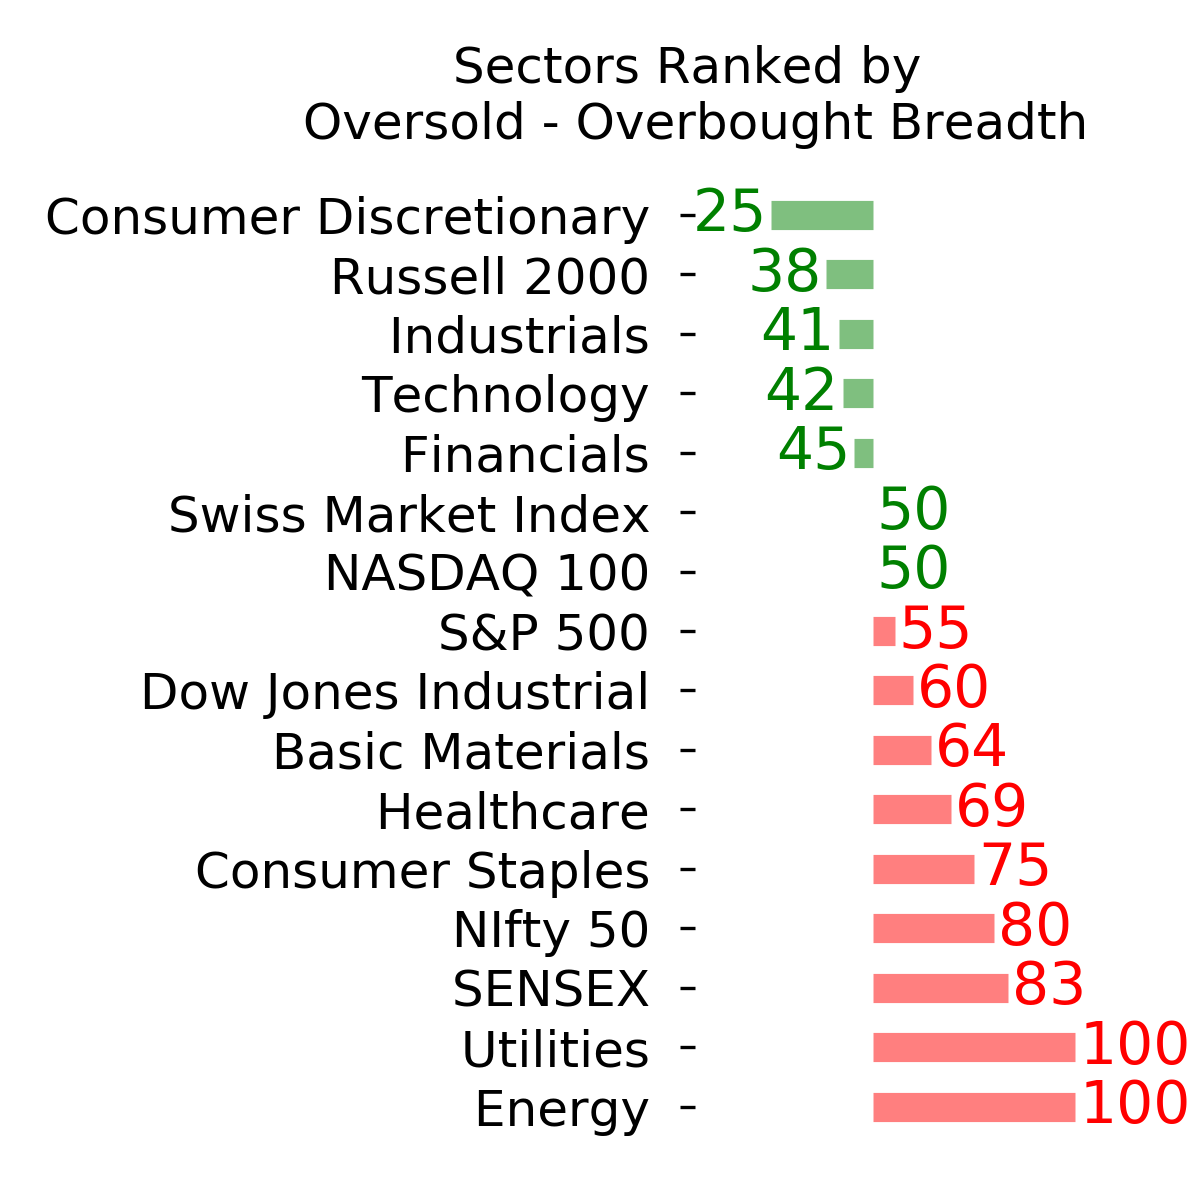
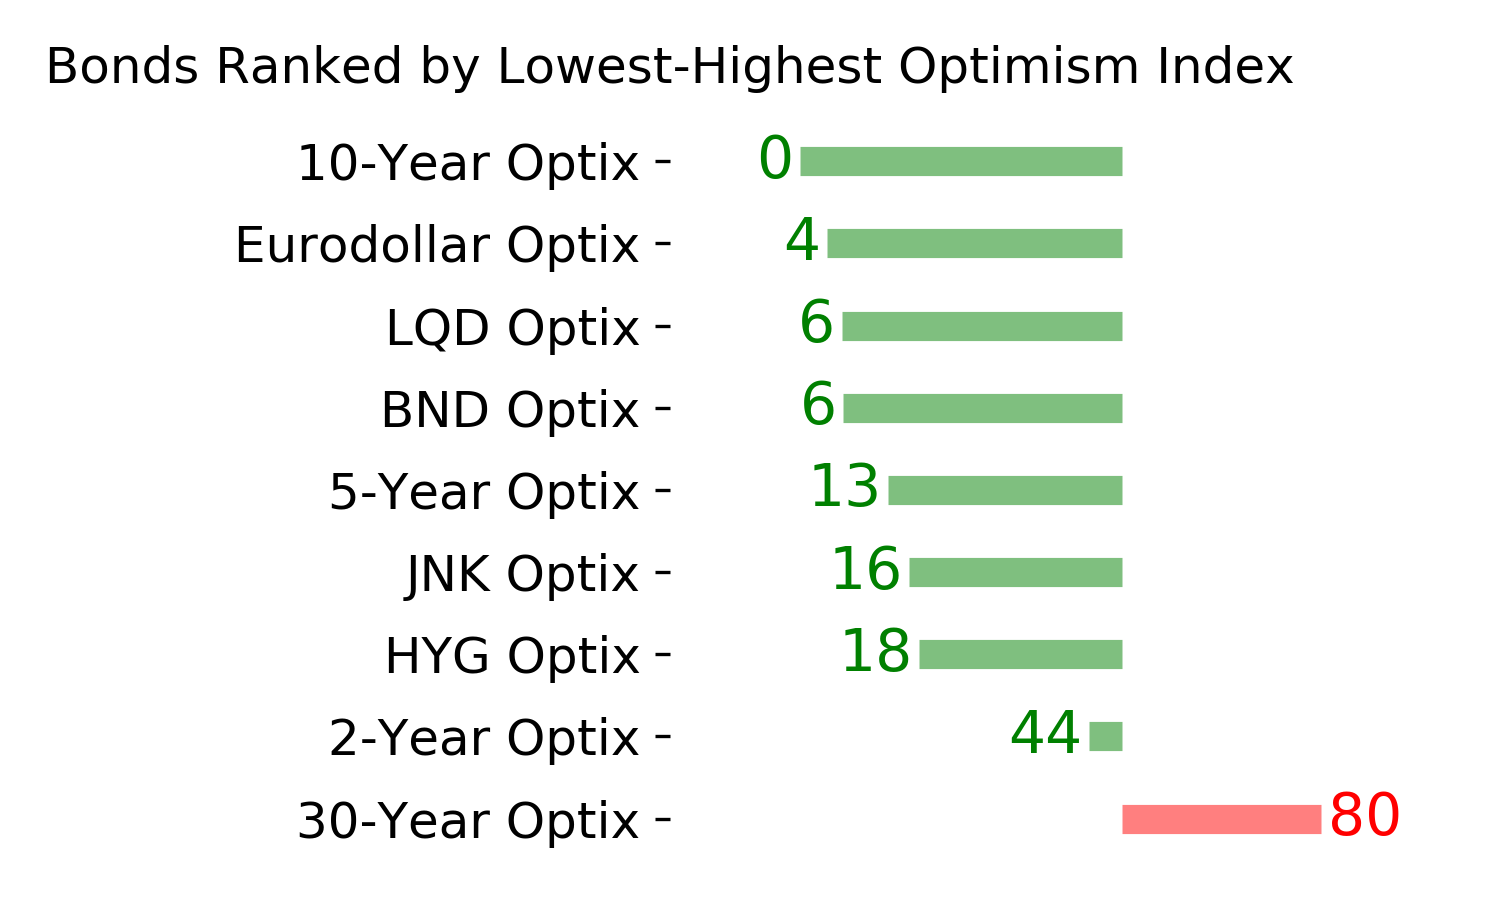
Ranks
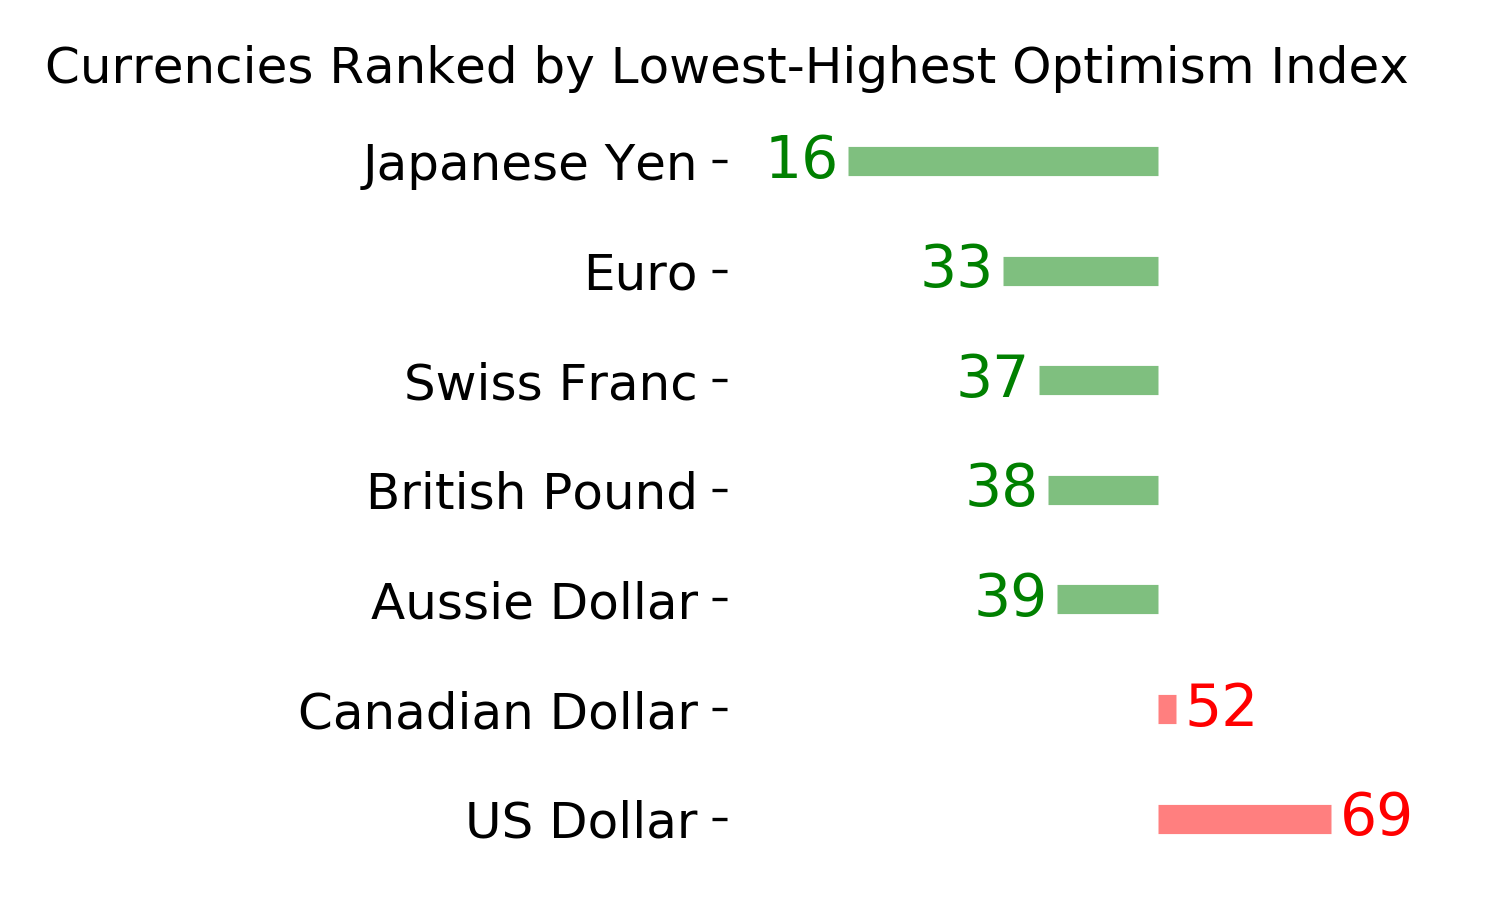
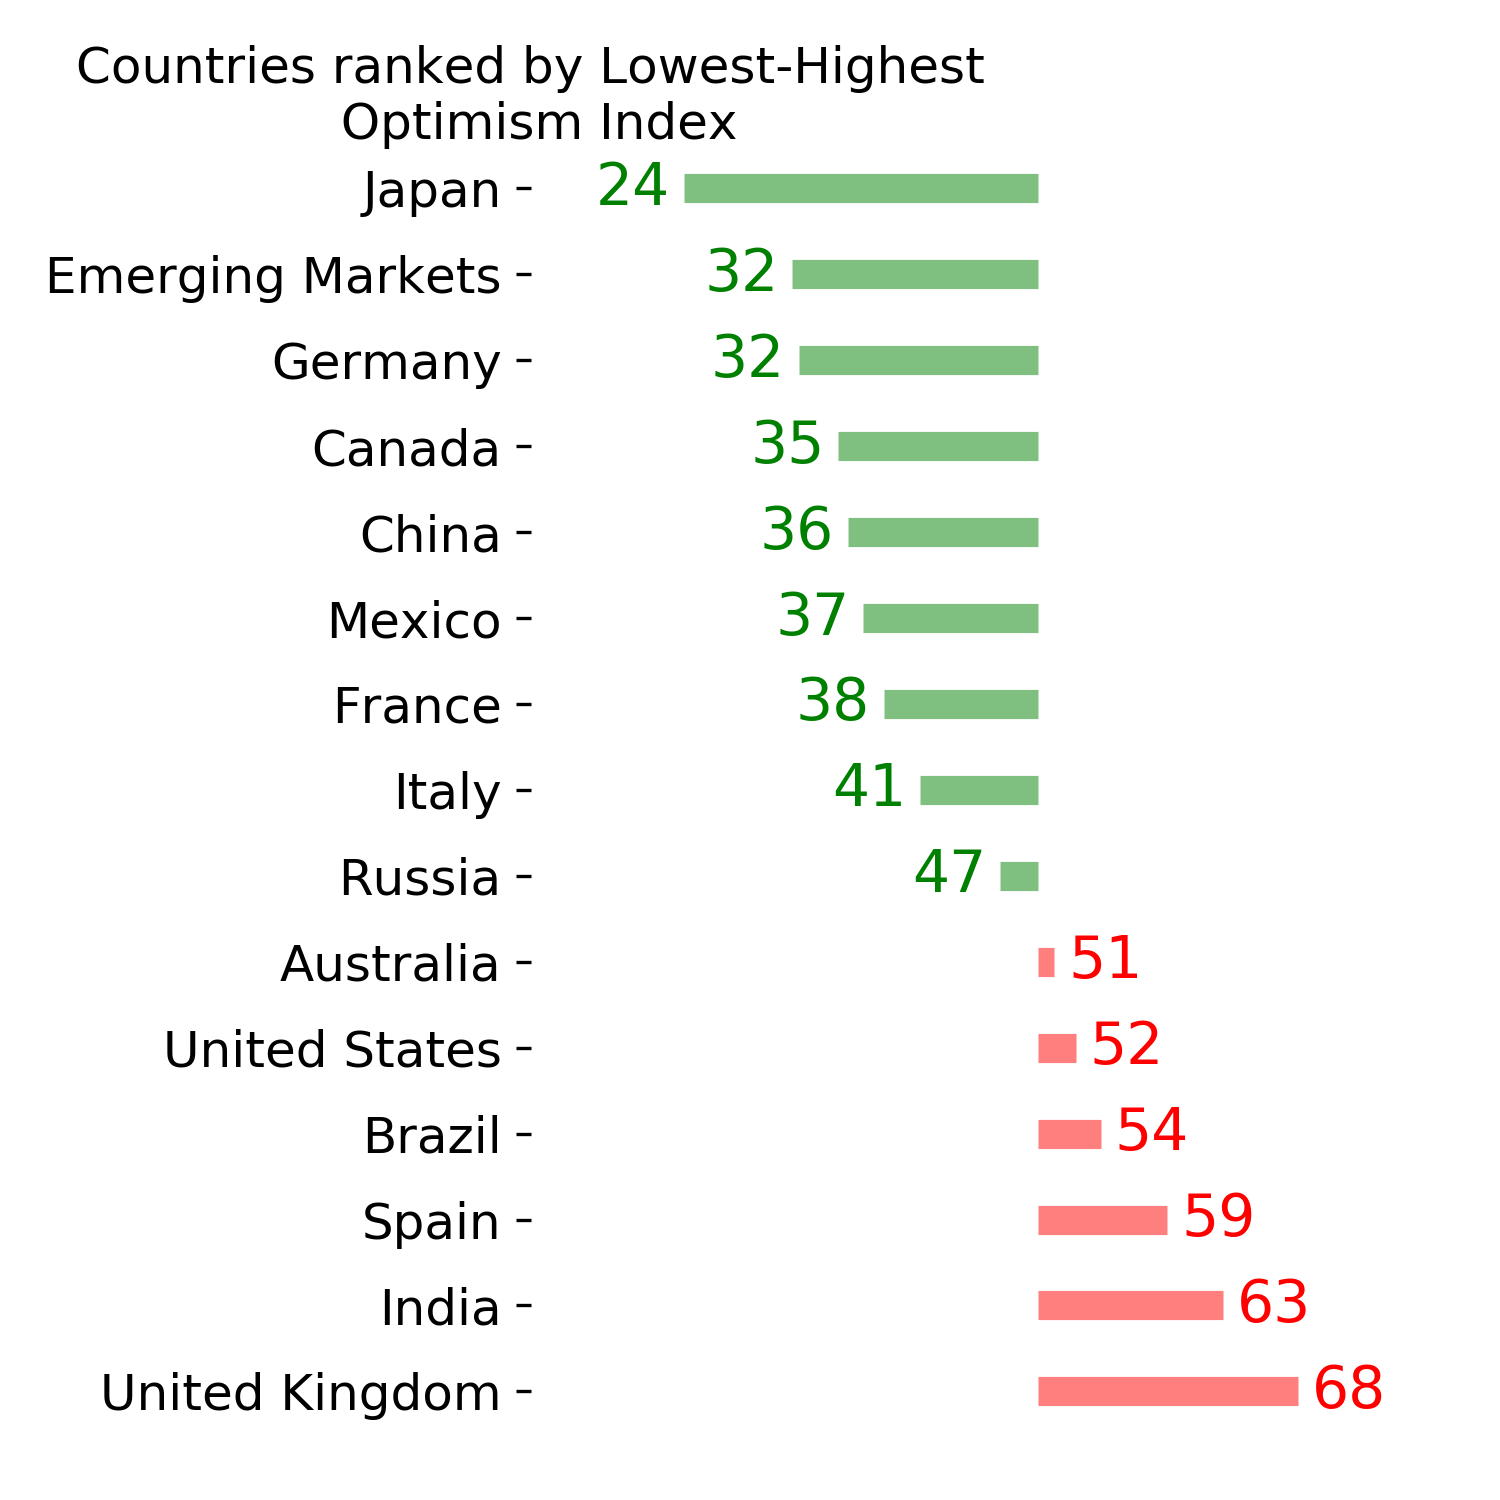
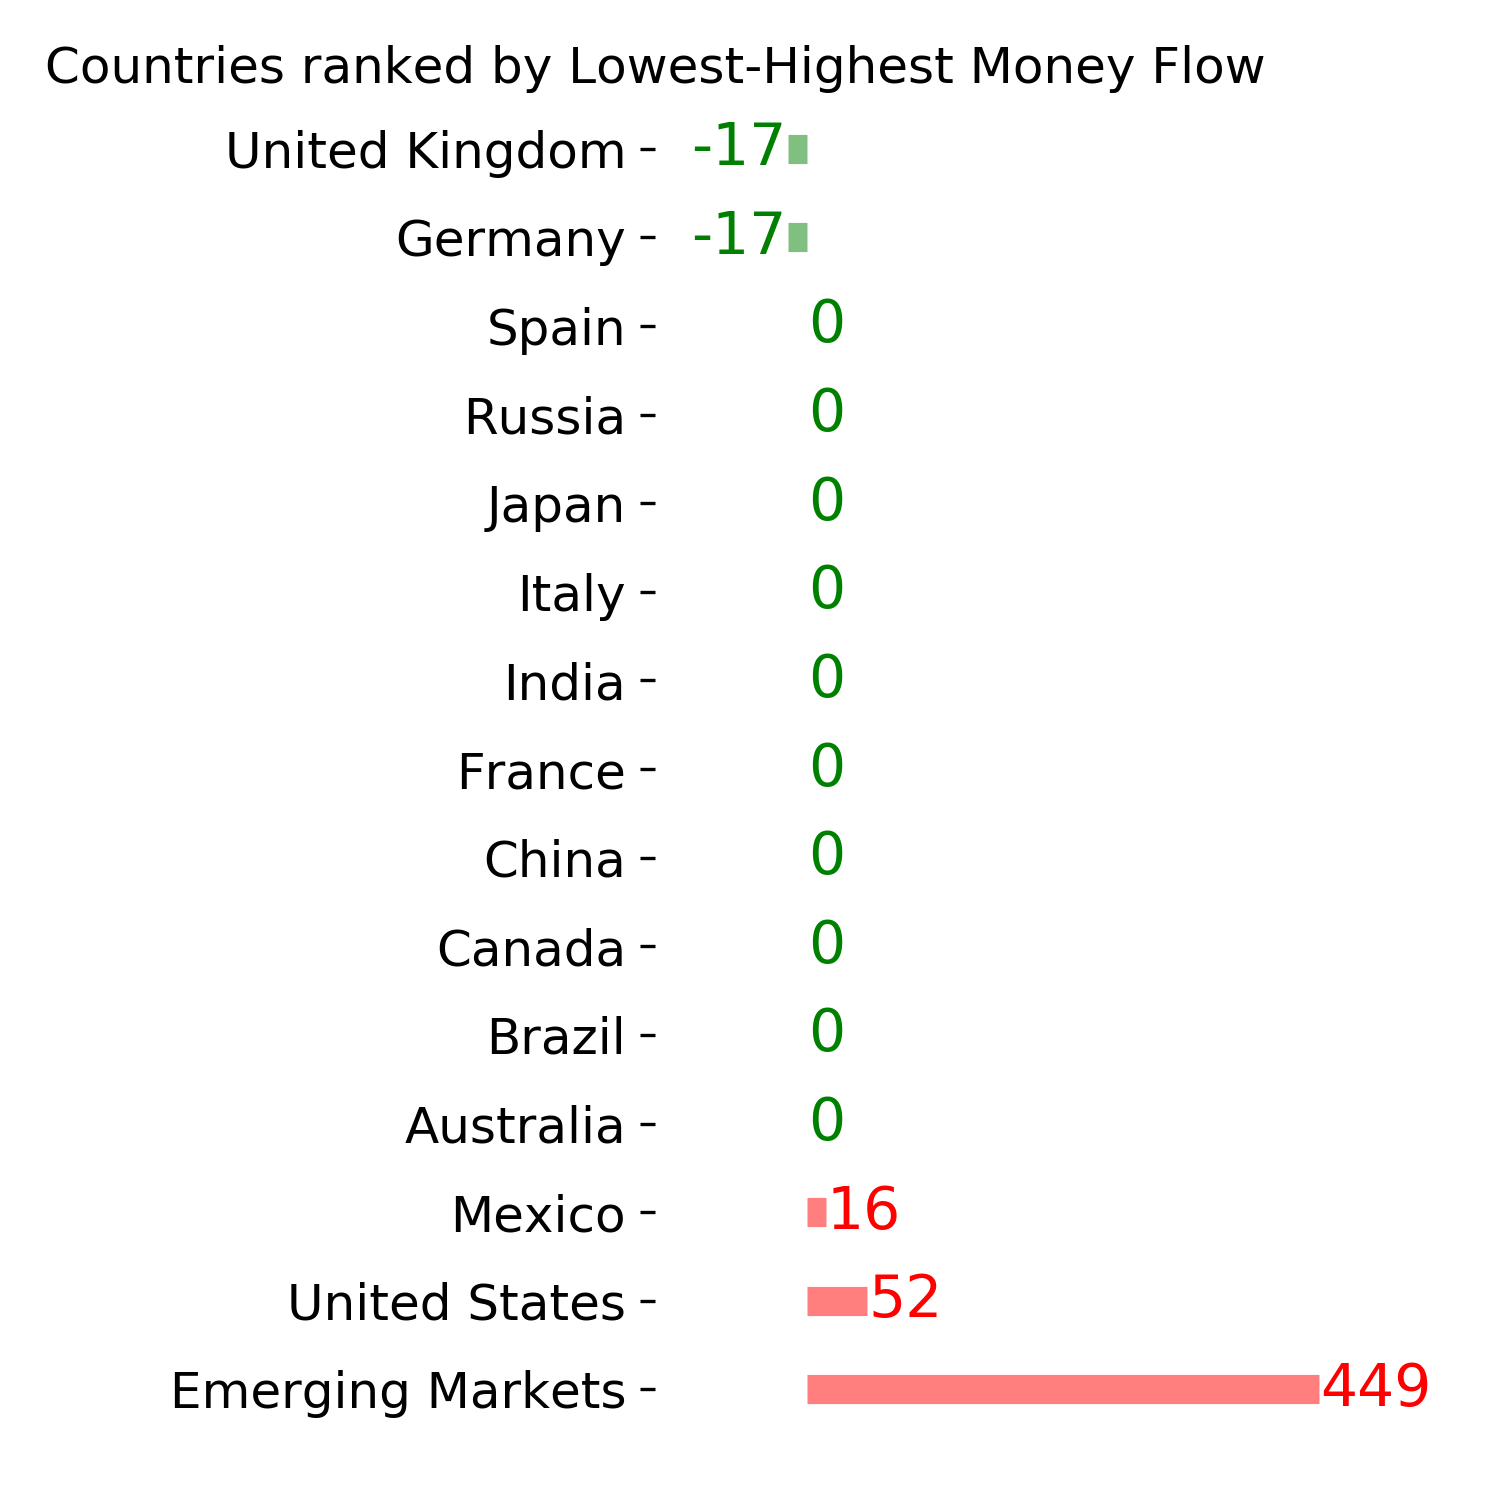
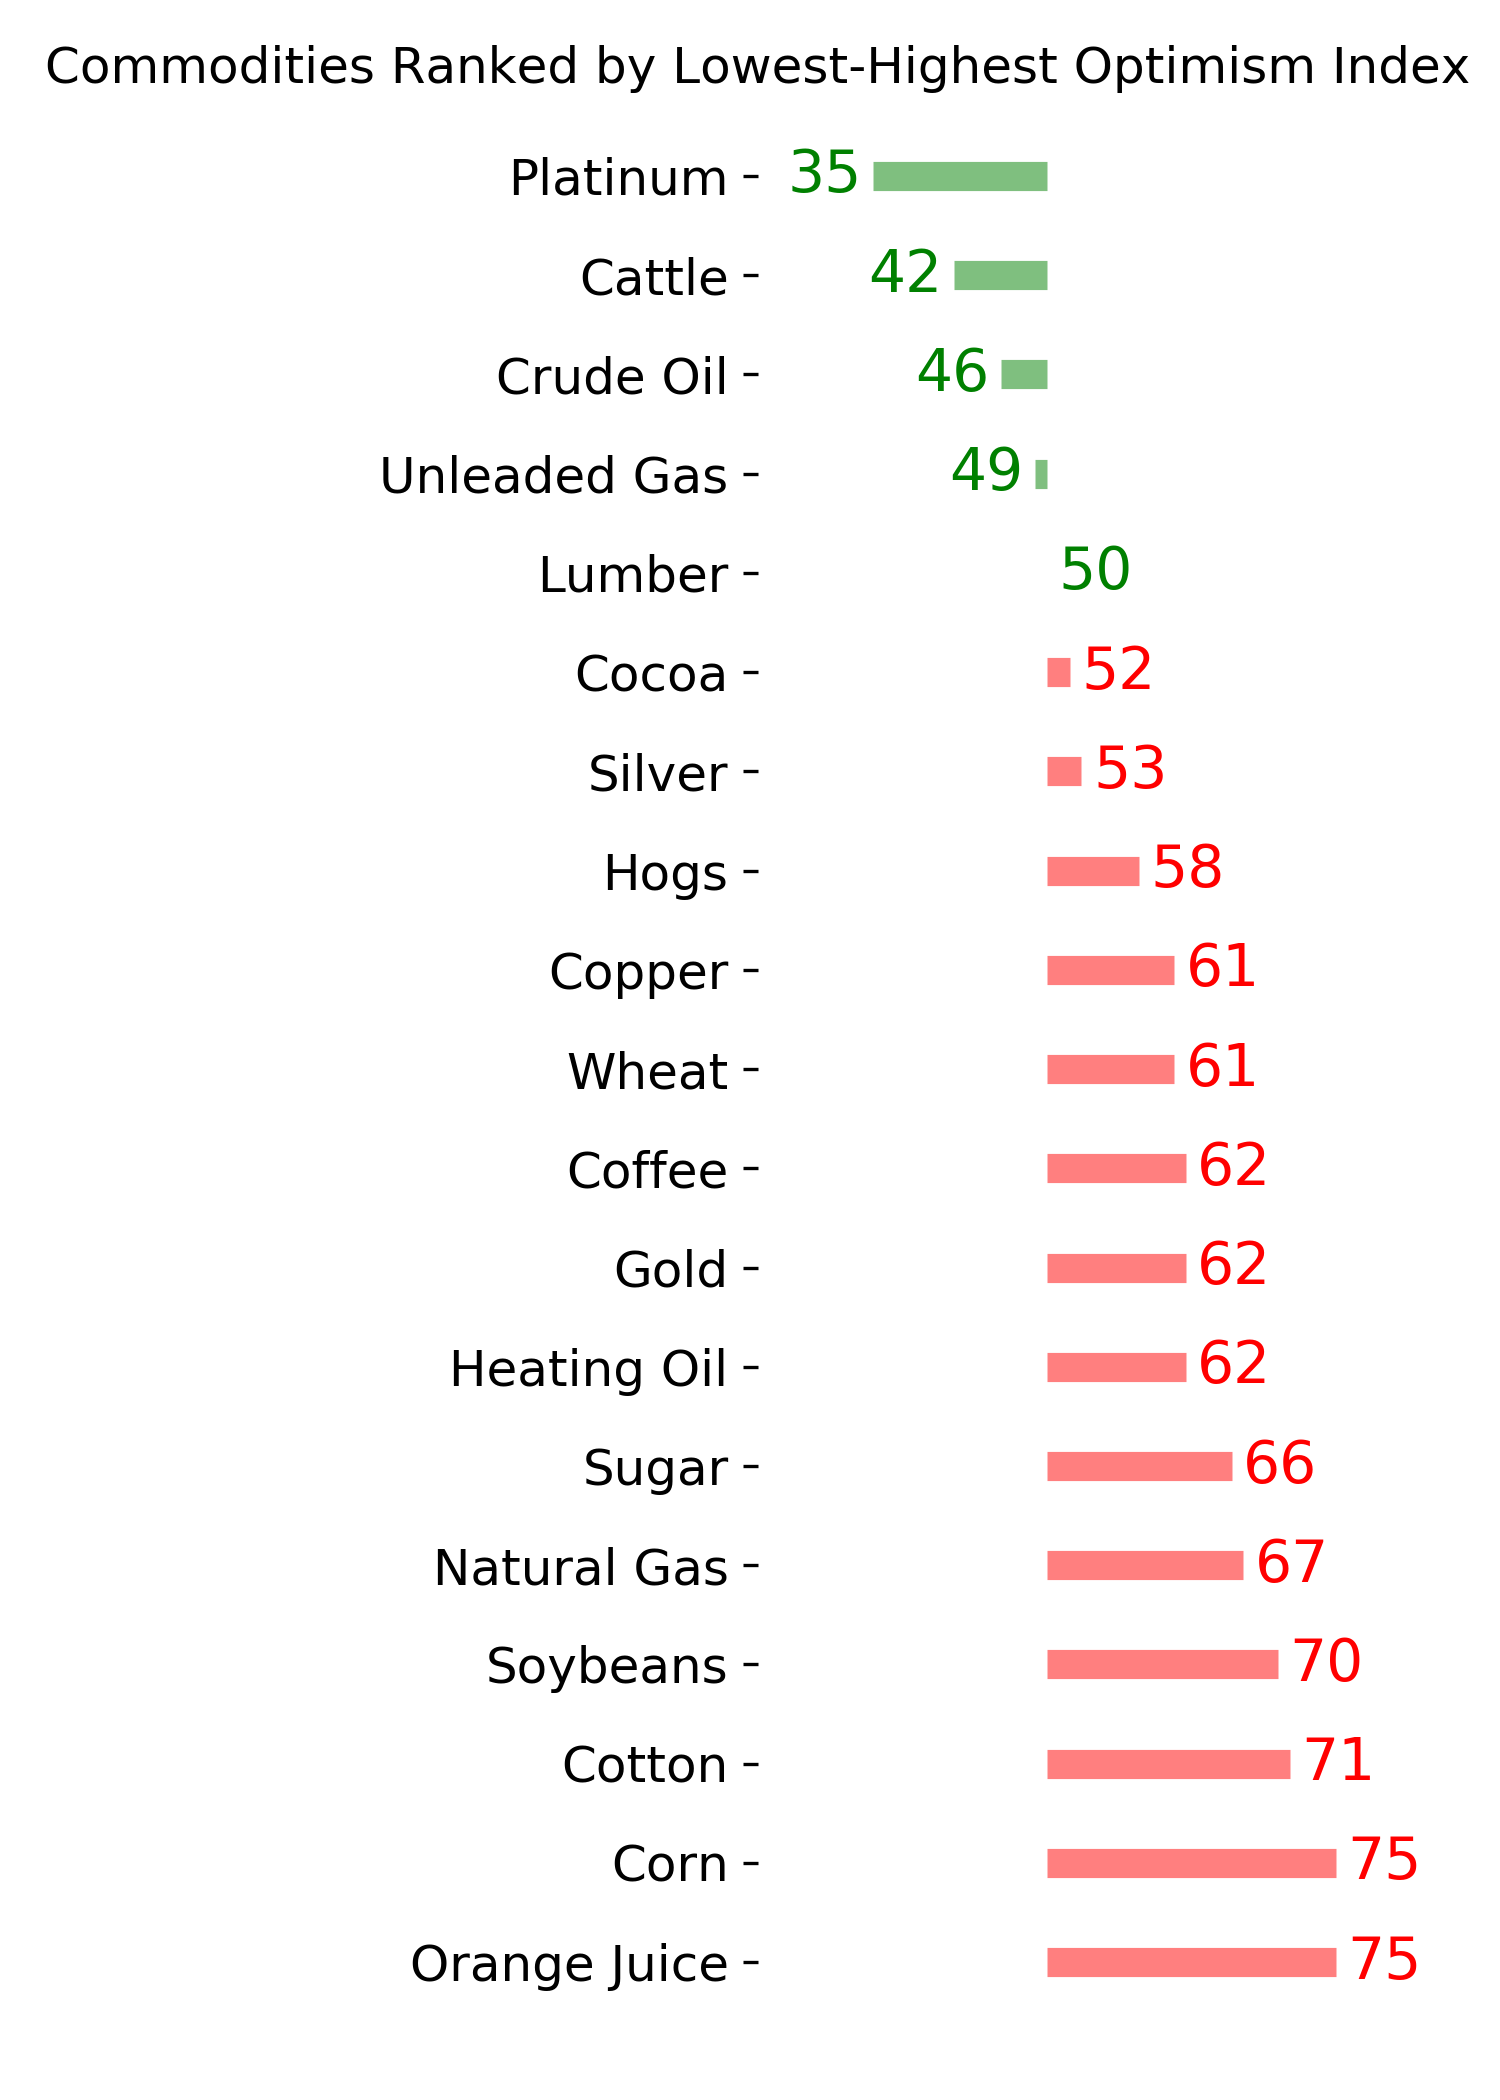
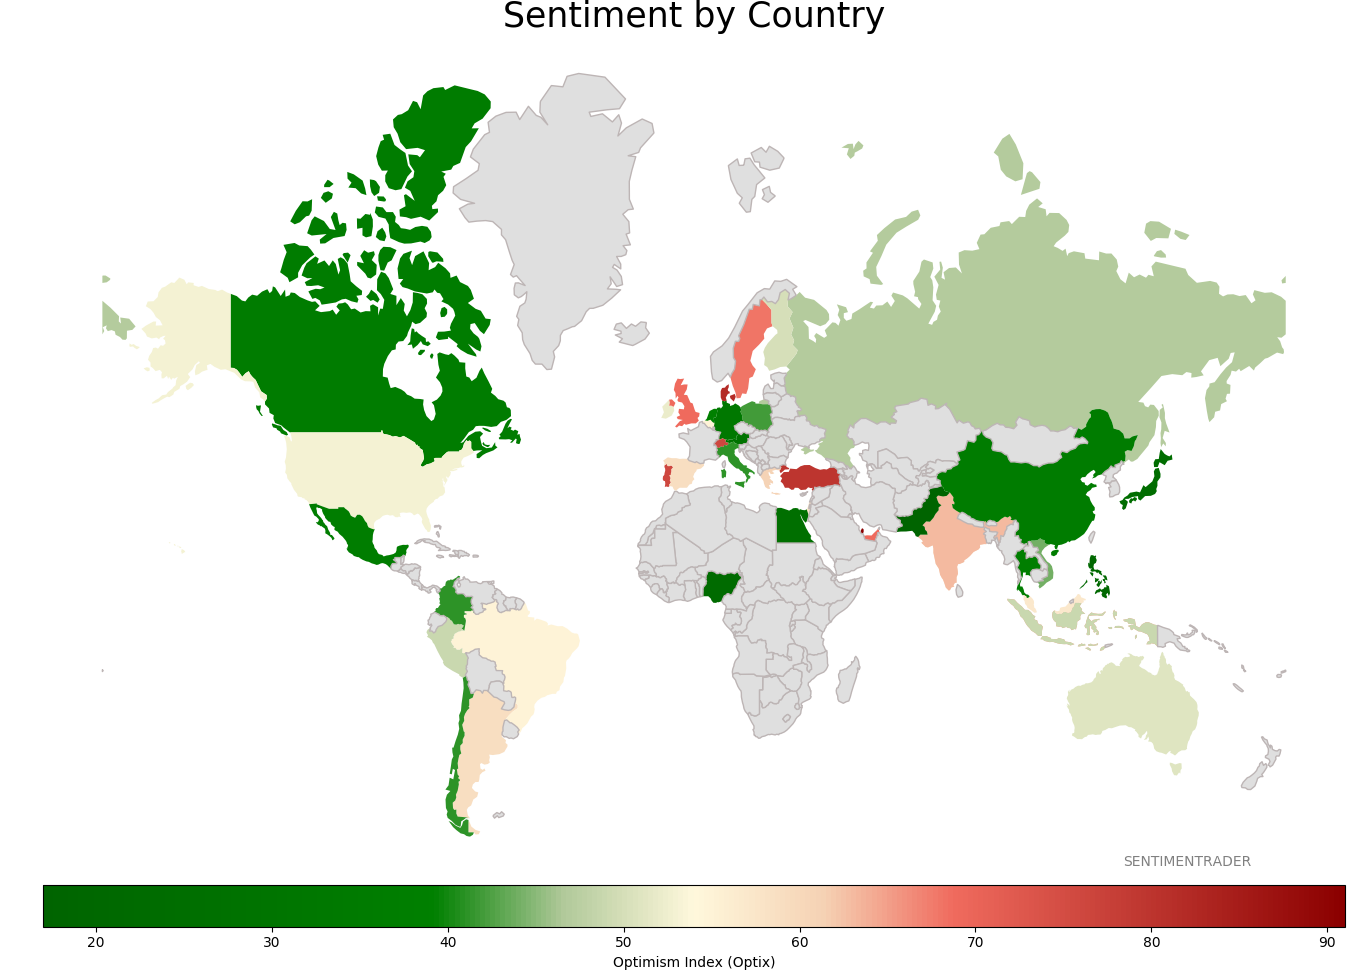
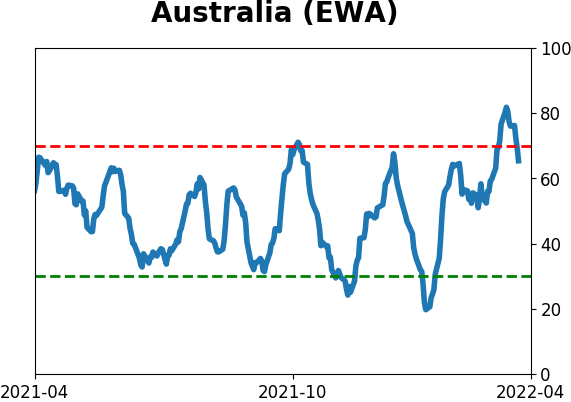
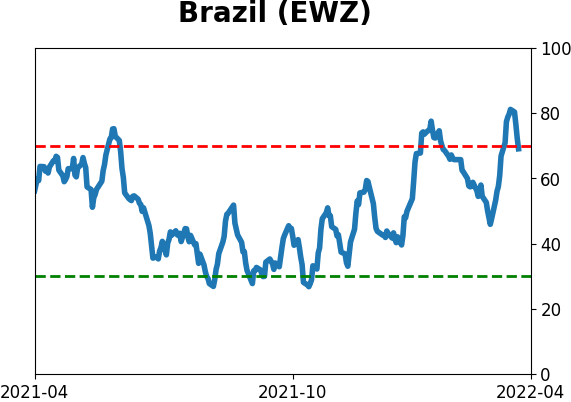
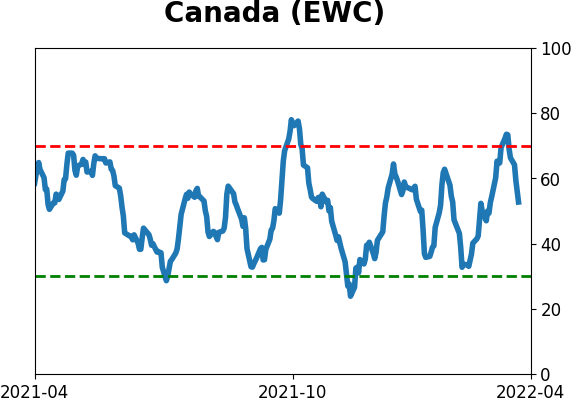
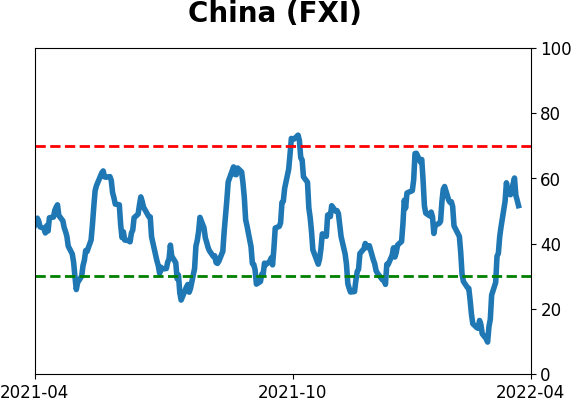
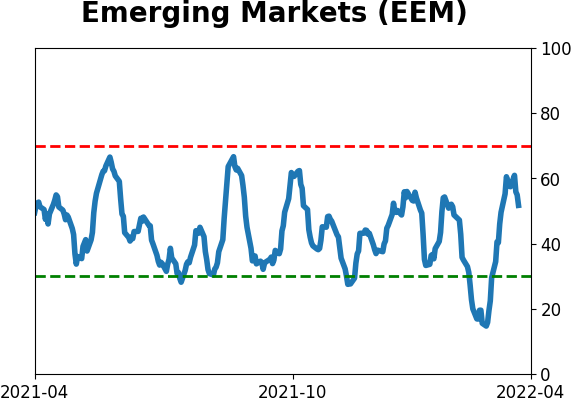
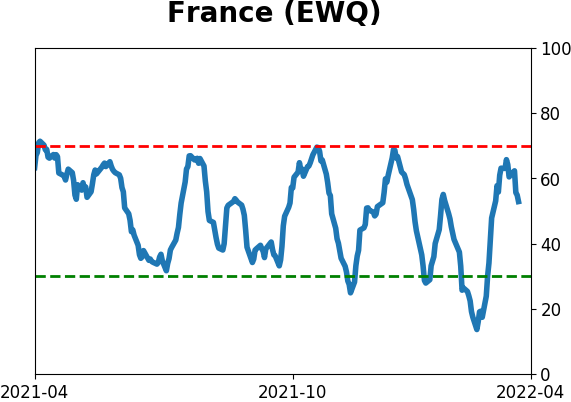
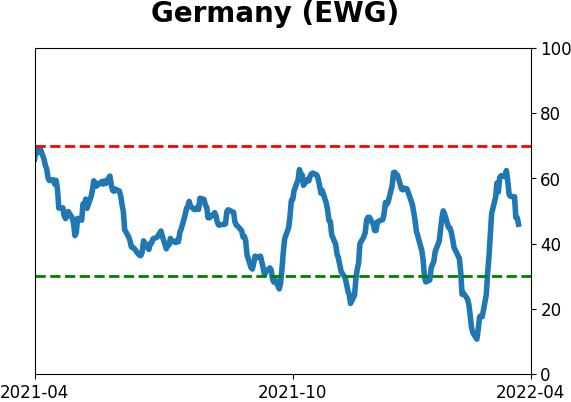
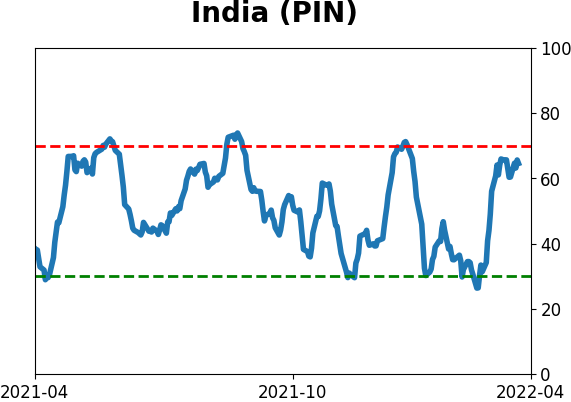
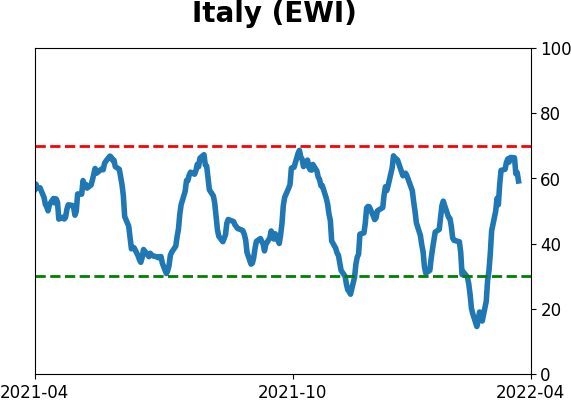
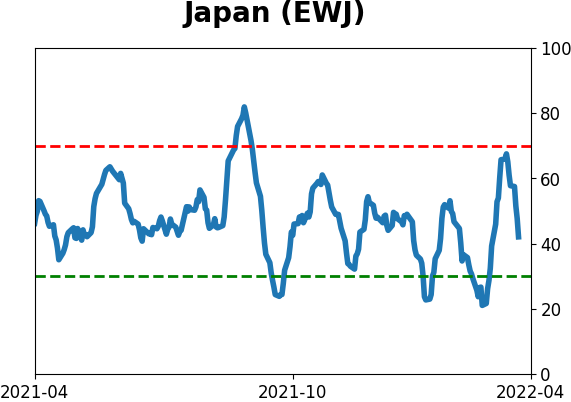
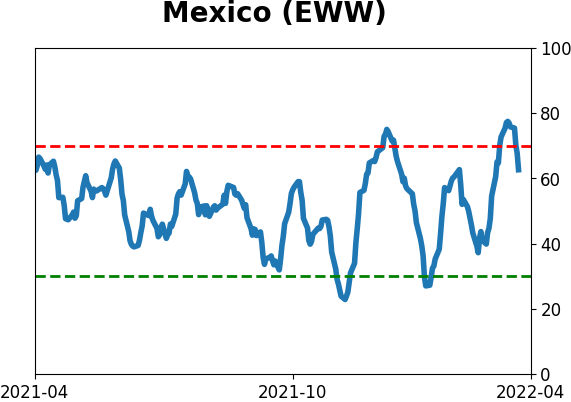
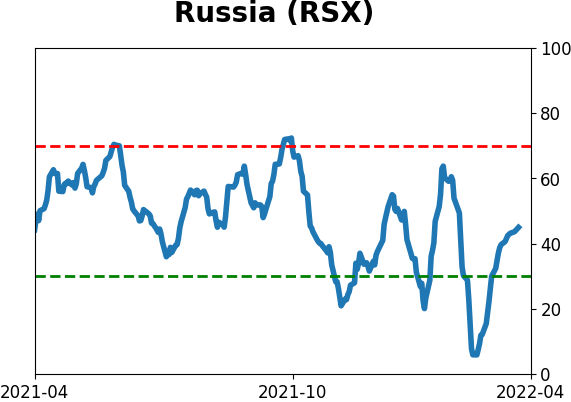
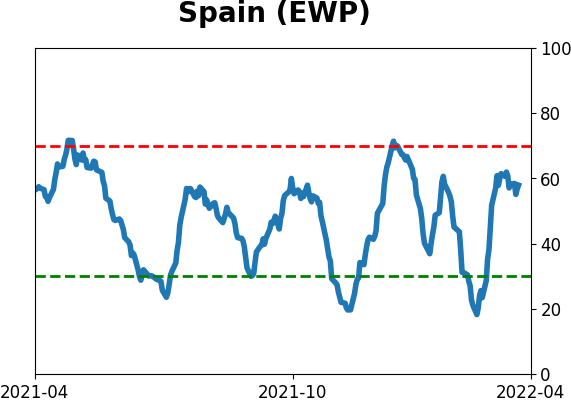
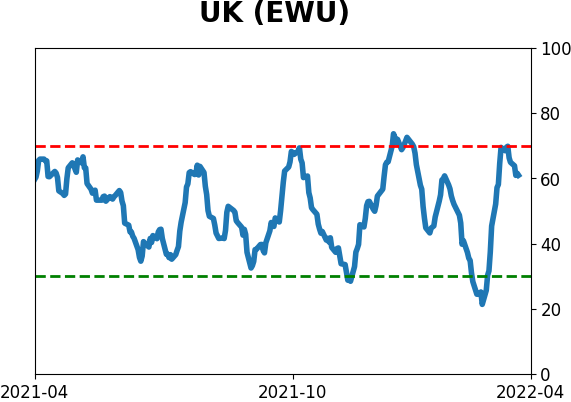
Sentiment Around The World
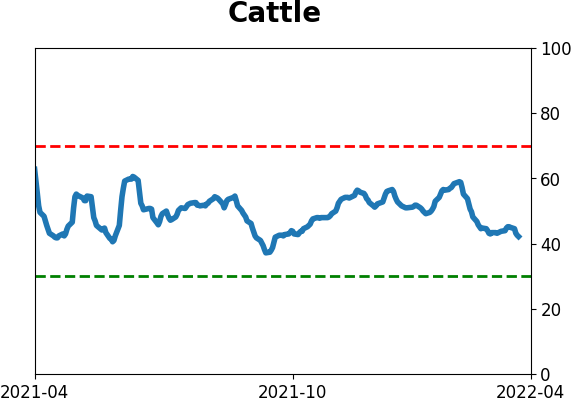
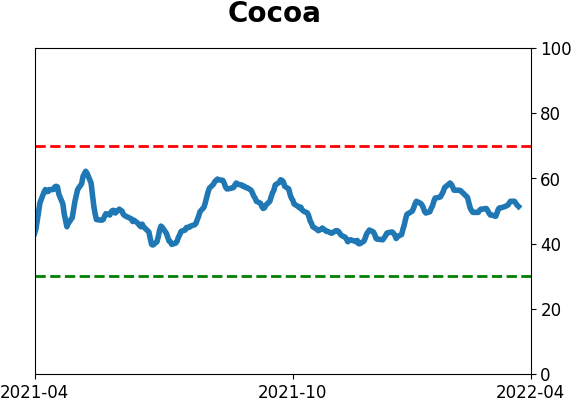
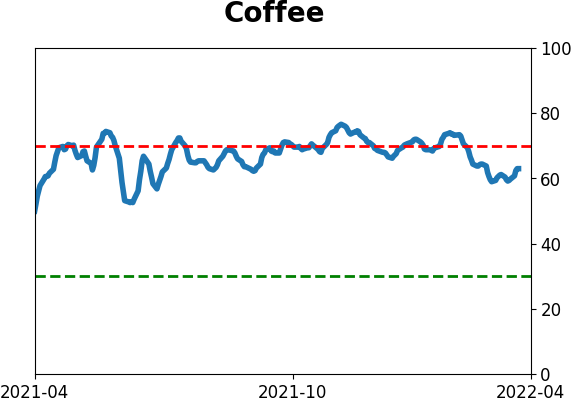
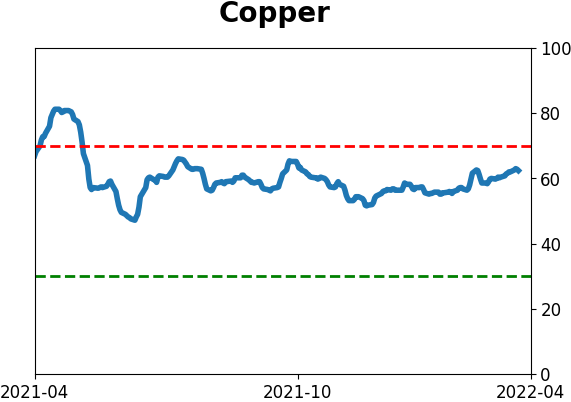
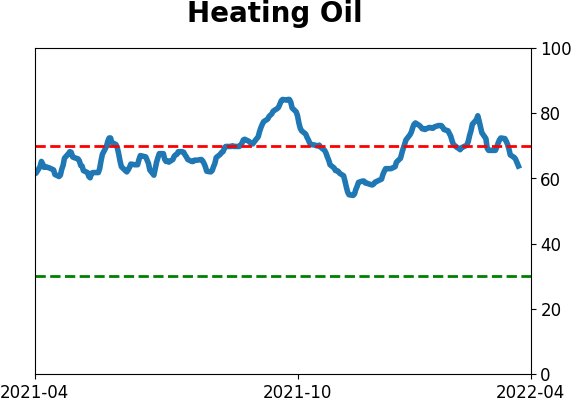
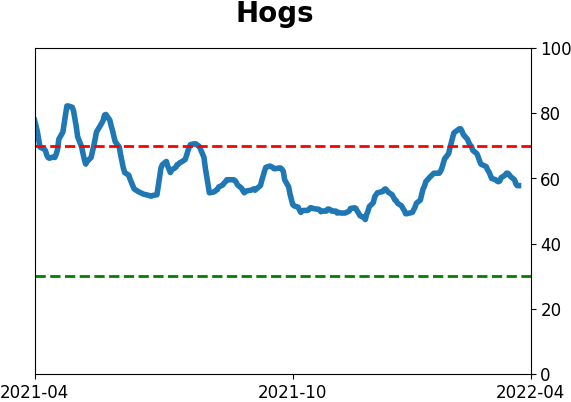
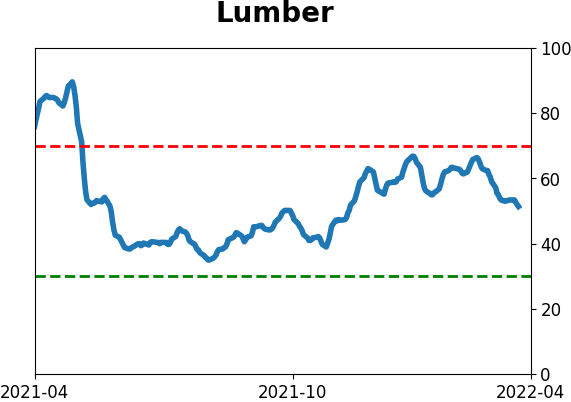
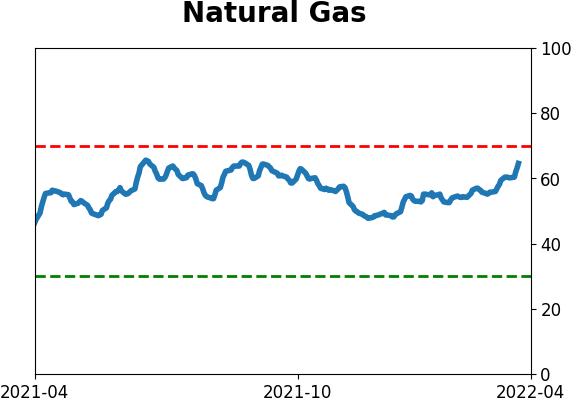
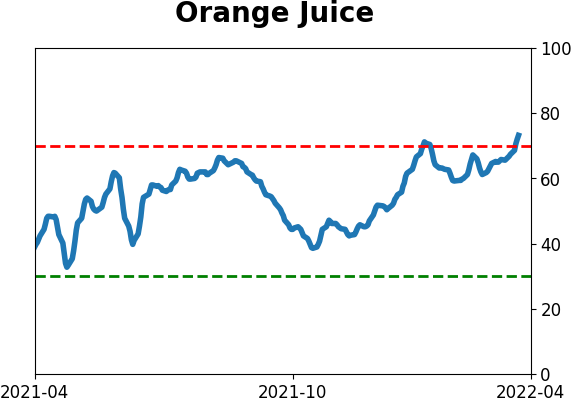
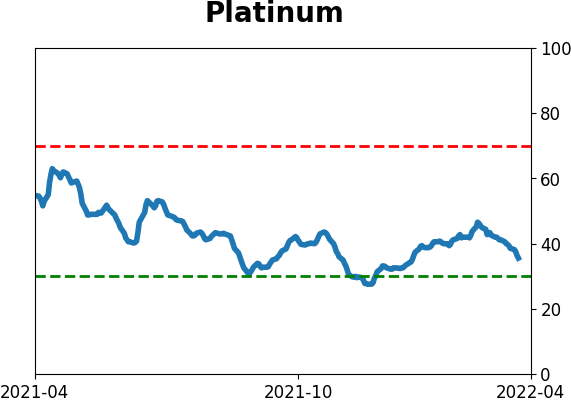
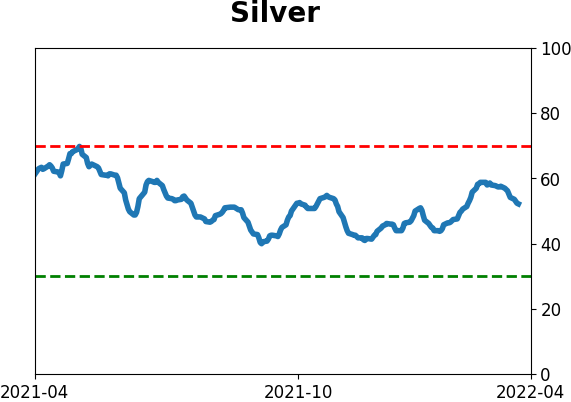
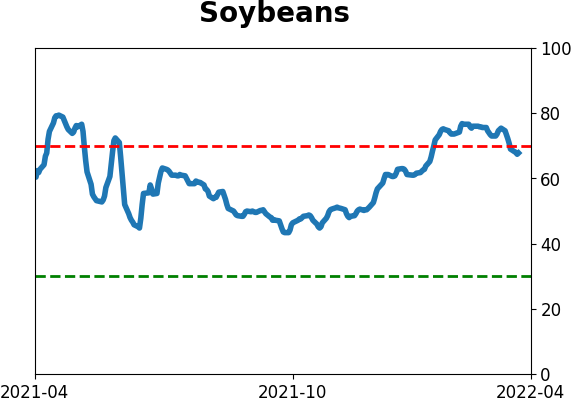
Optimism Index Thumbnails
|
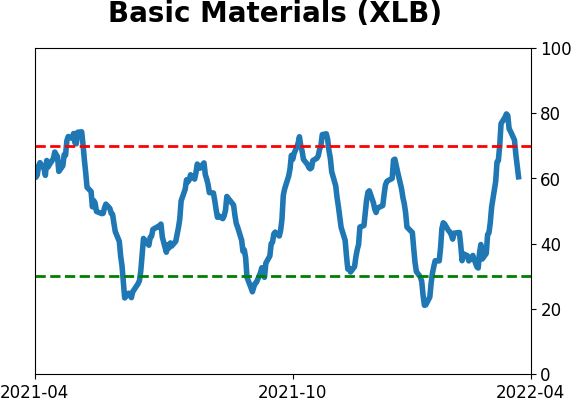
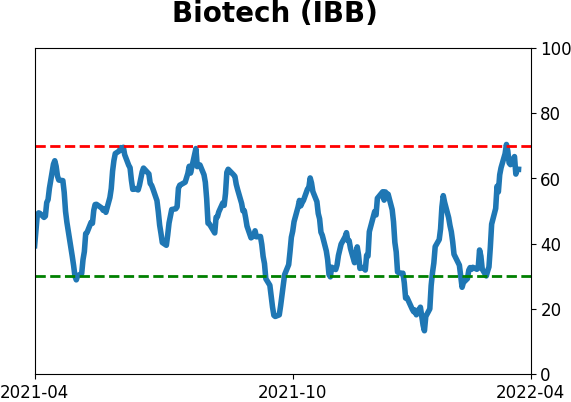
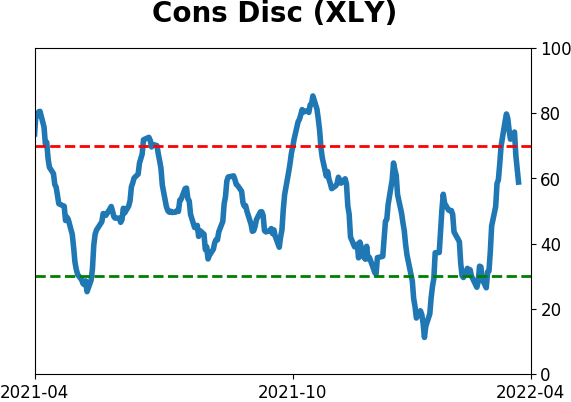
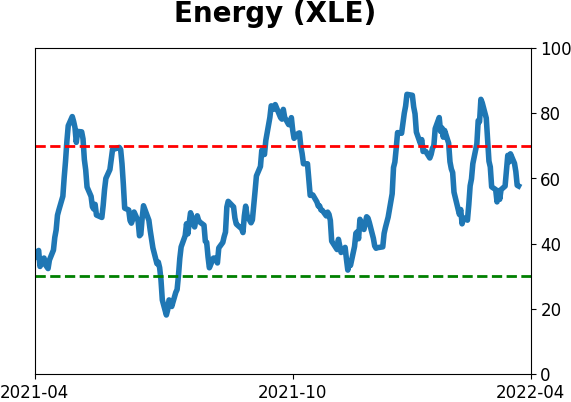
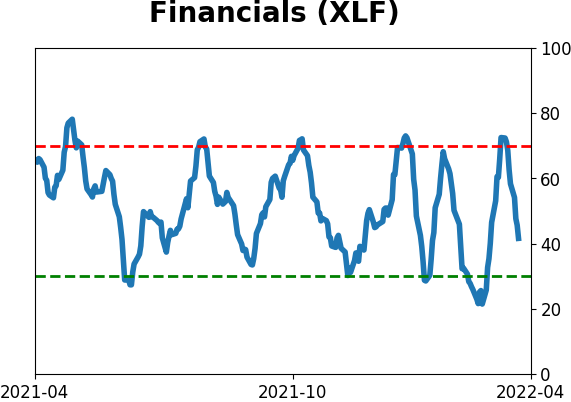
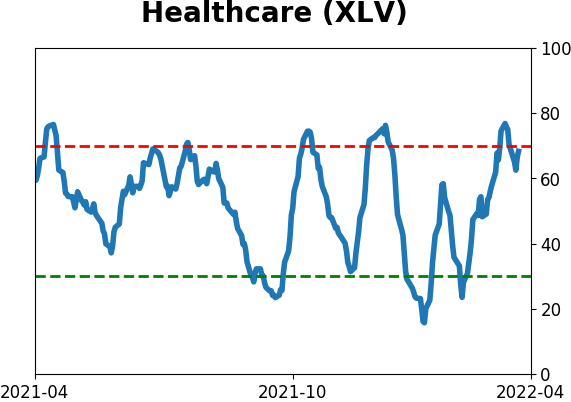
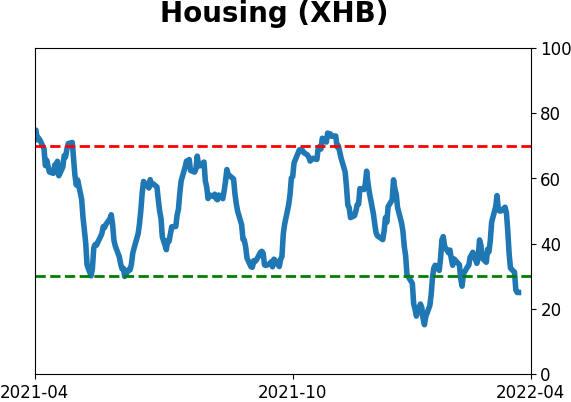
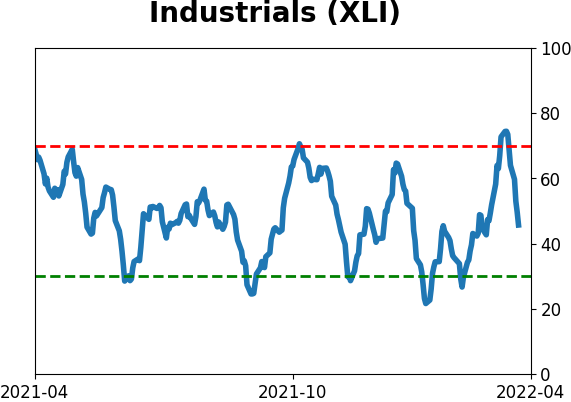
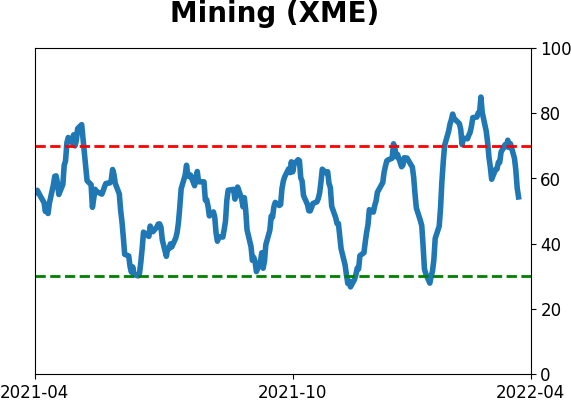
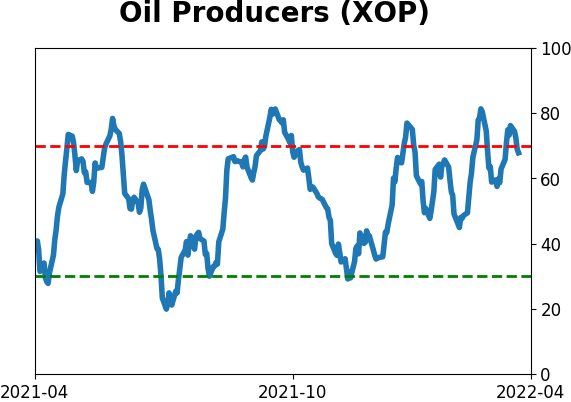
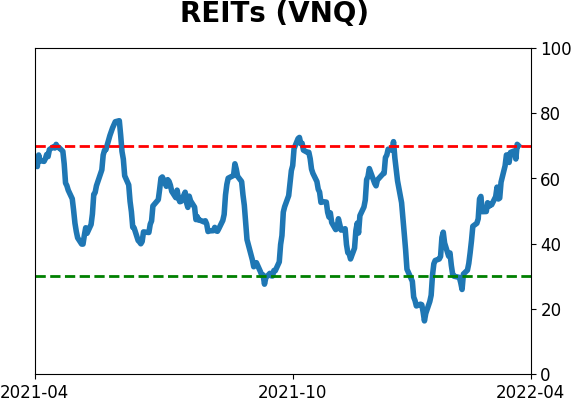
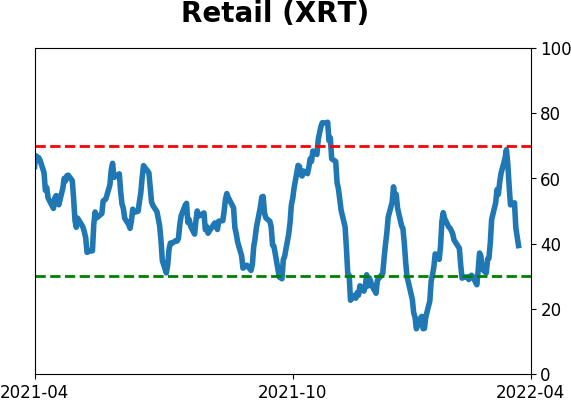
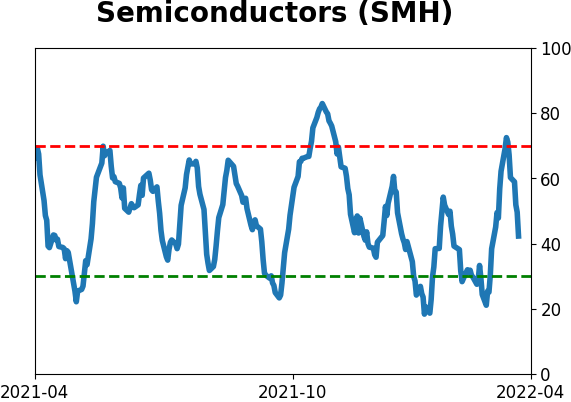
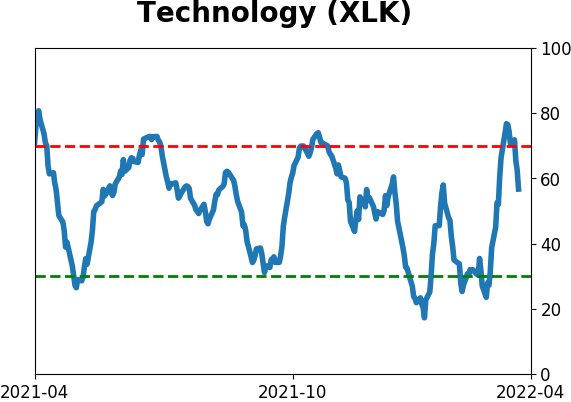
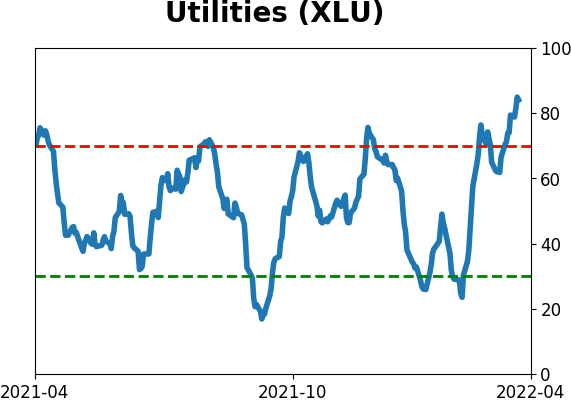
Sector ETF's - 10-Day Moving Average
|
|
|
Country ETF's - 10-Day Moving Average
|
|
|
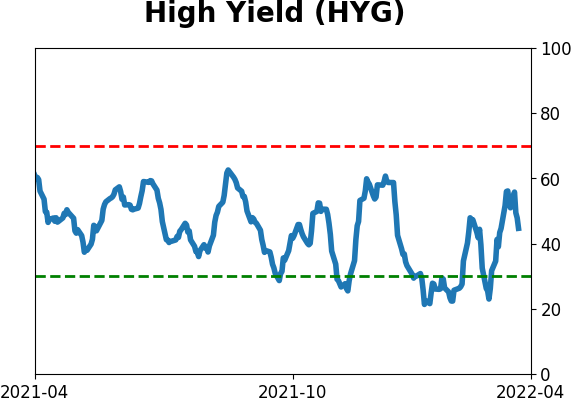
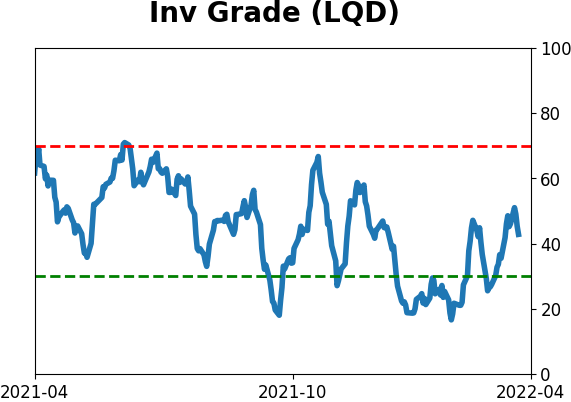
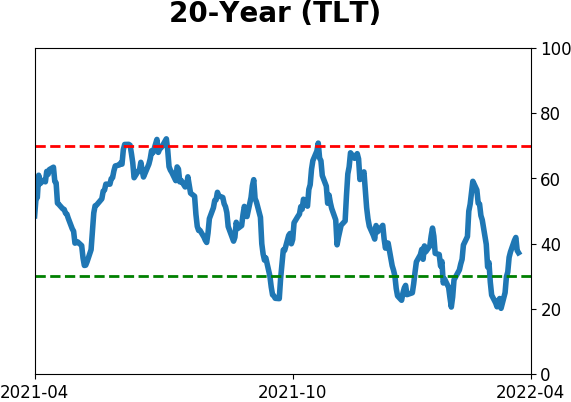
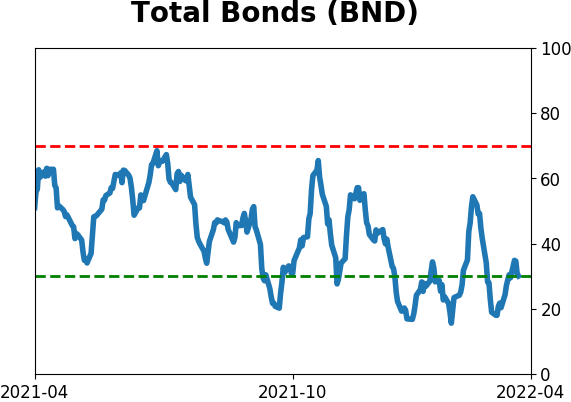
Bond ETF's - 10-Day Moving Average
|
|
|
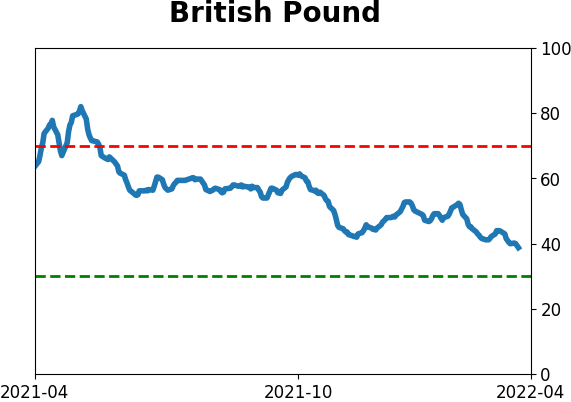
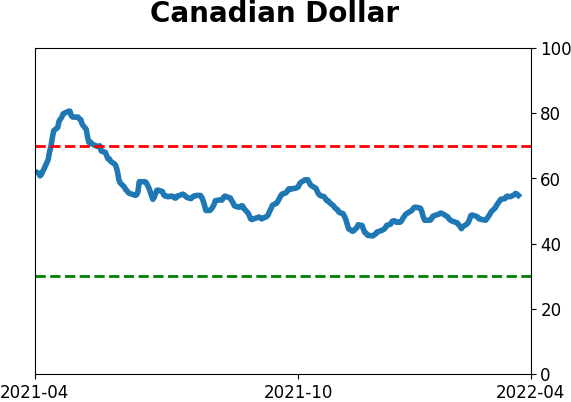
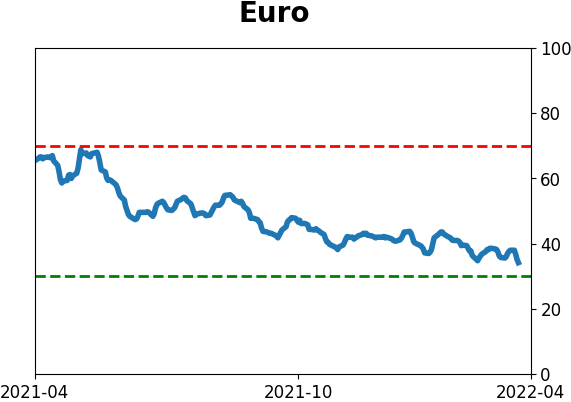
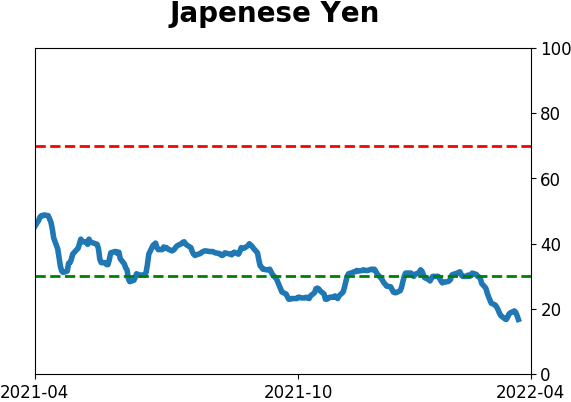
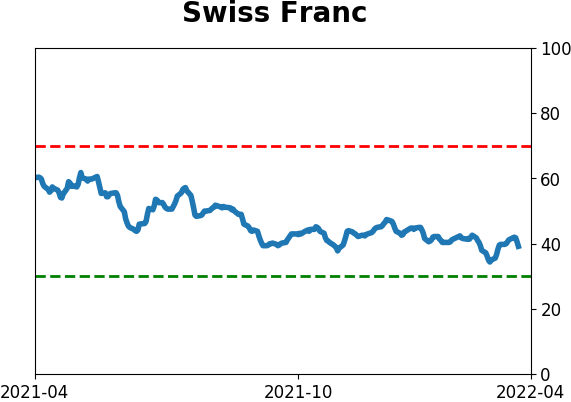
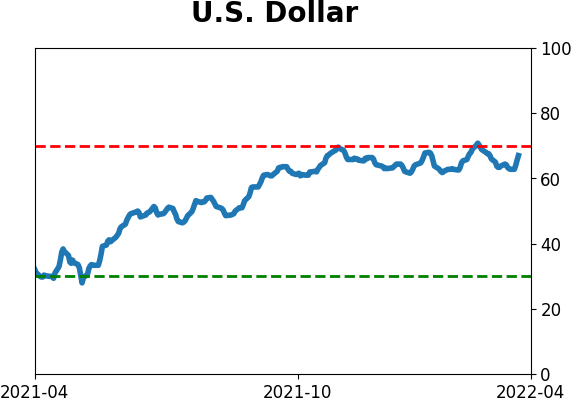
Currency ETF's - 5-Day Moving Average
|
|
|
Commodity ETF's - 5-Day Moving Average
|
|