Headlines
|
|
Q1 offers a stock market clue - Part III:
The S&P 500 Index registered a significant gain (+7%) during the first three months of 2023. Historically, this has been a favorable harbinger of things to come for the rest of the calendar year.
|
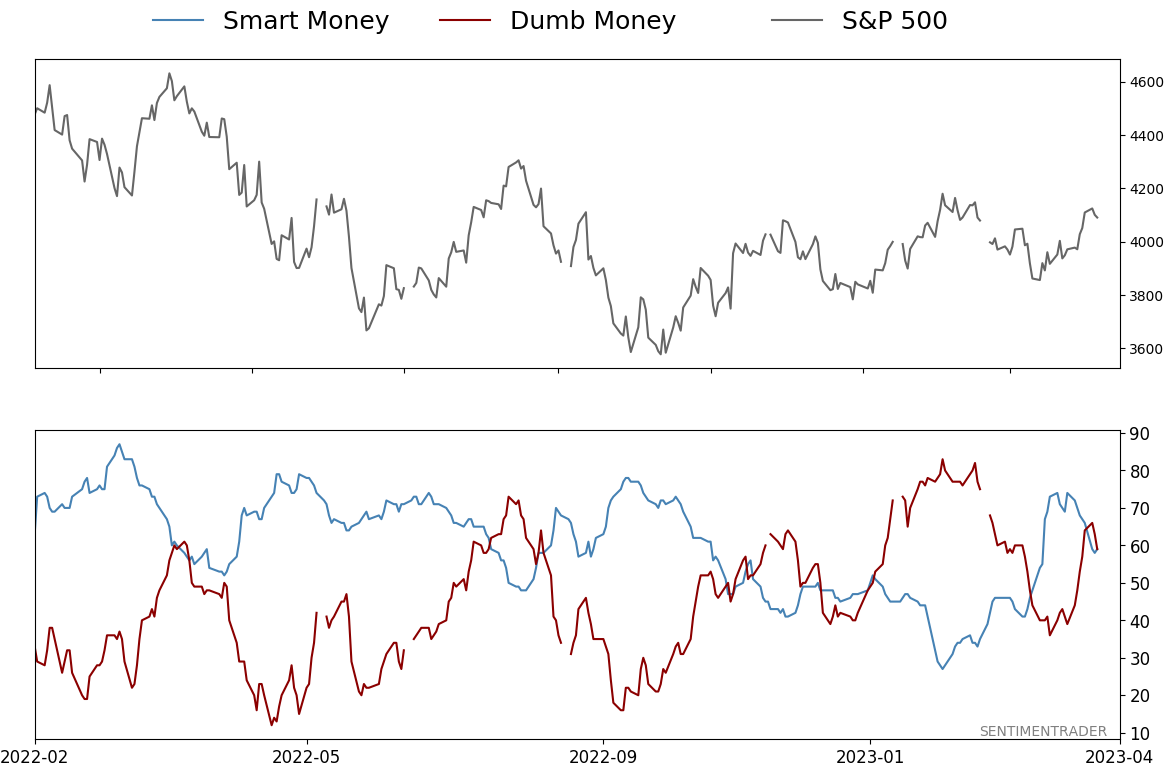
Smart / Dumb Money Confidence
|
Smart Money Confidence: 59%
Dumb Money Confidence: 59%
|
|
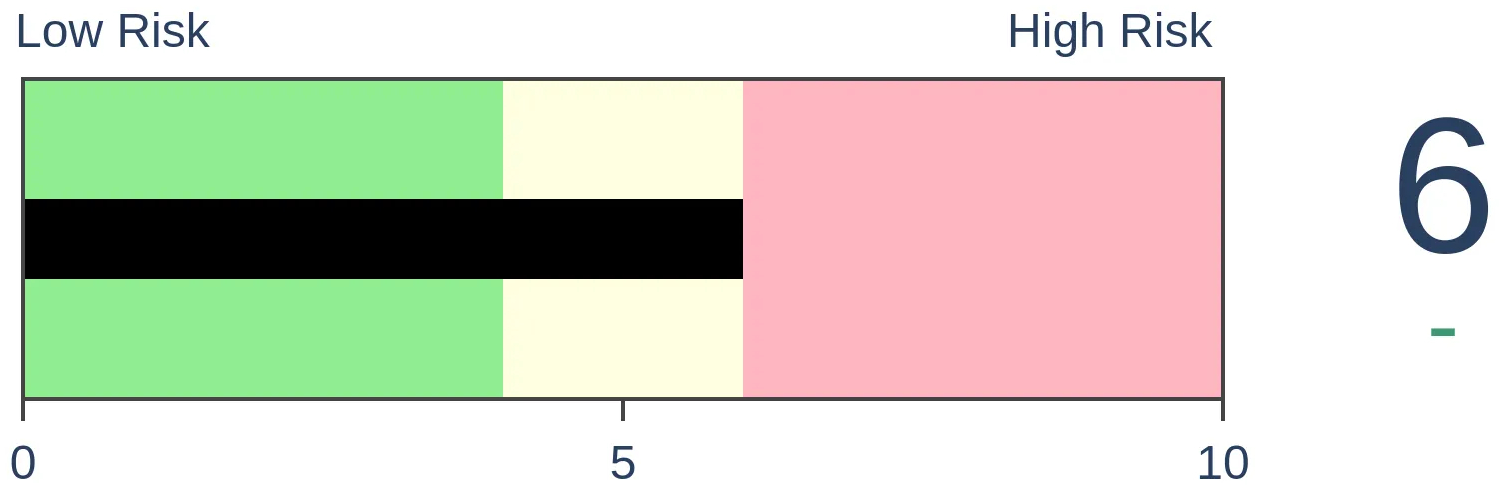
Risk Levels
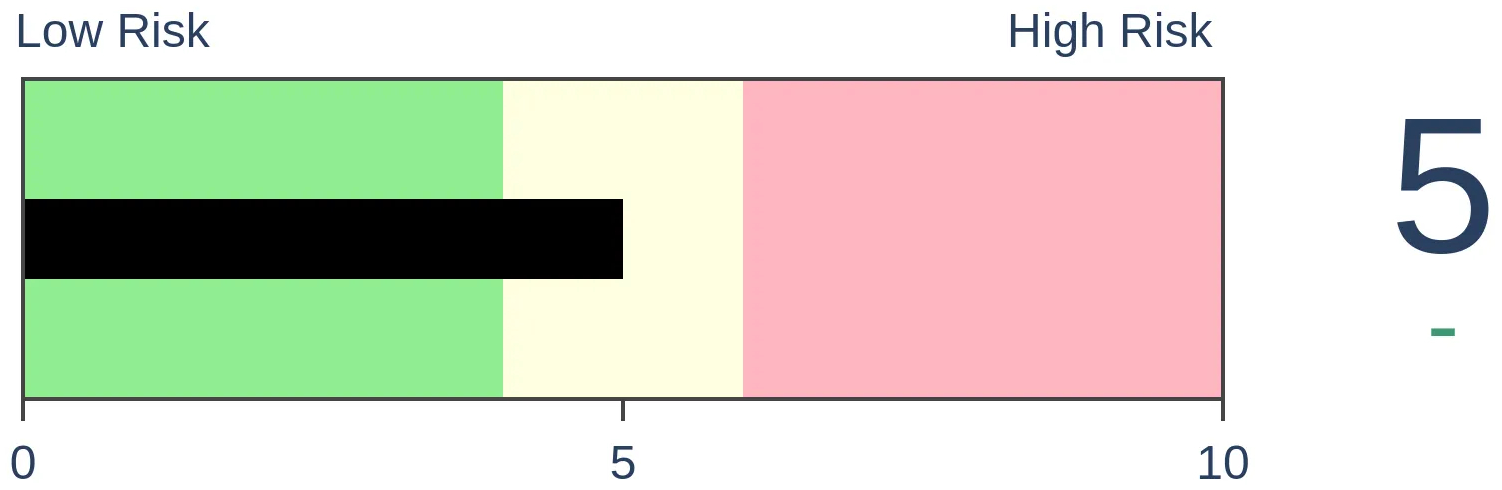
Stocks Short-Term

|
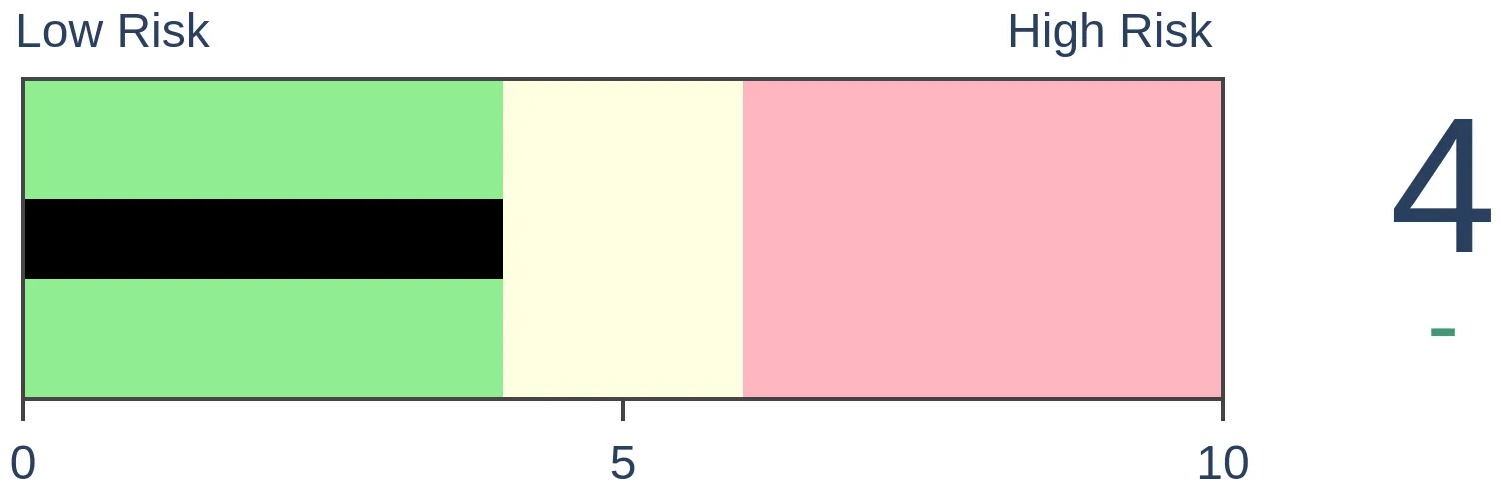
Stocks Medium-Term
|
|
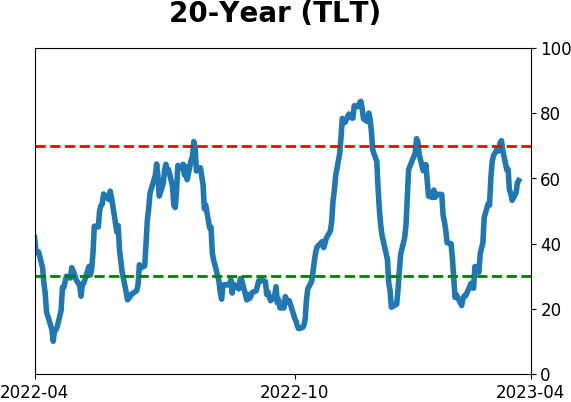
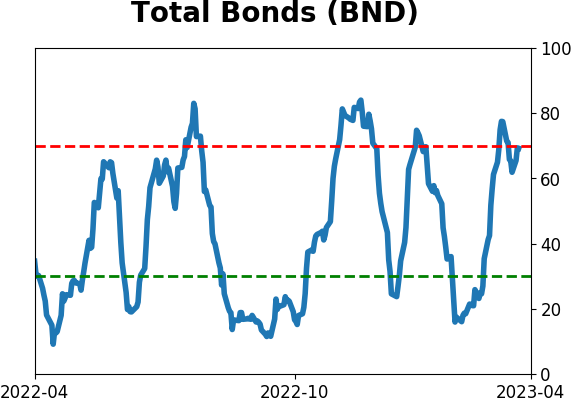
Bonds

|
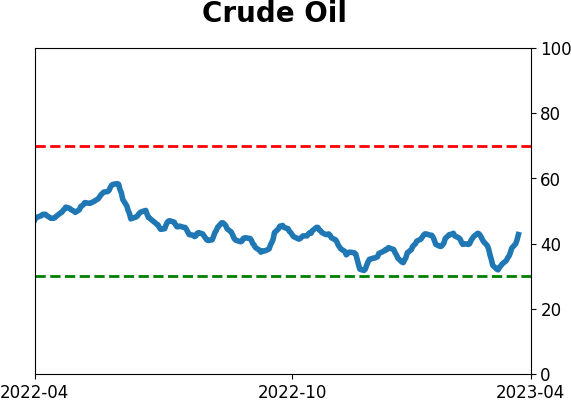
Crude Oil
|
|
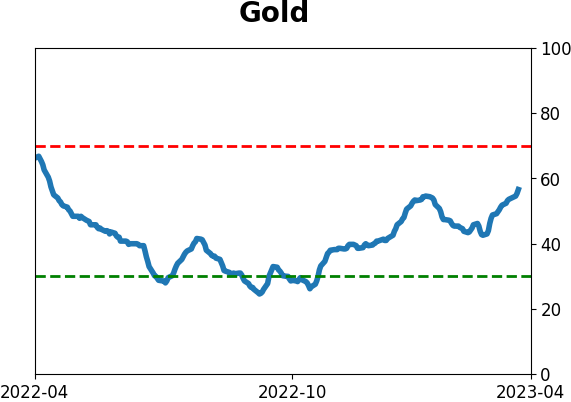
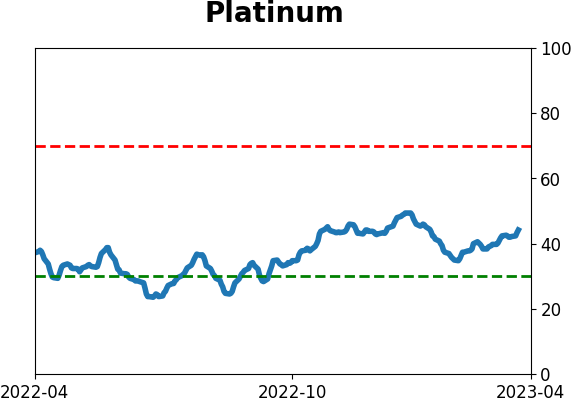
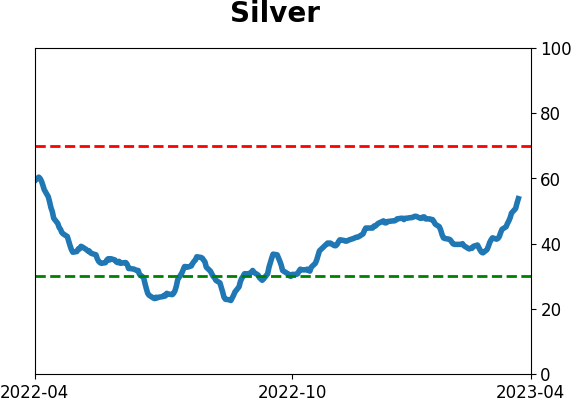
Gold
|
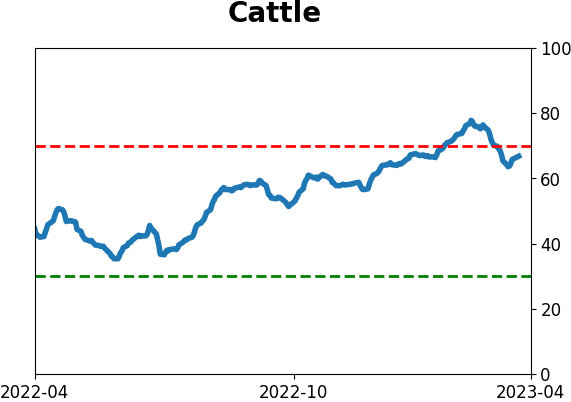
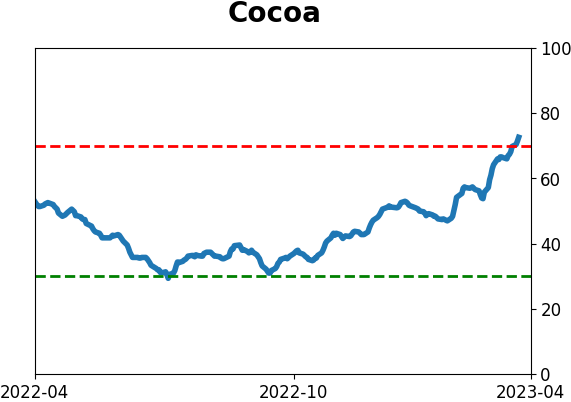
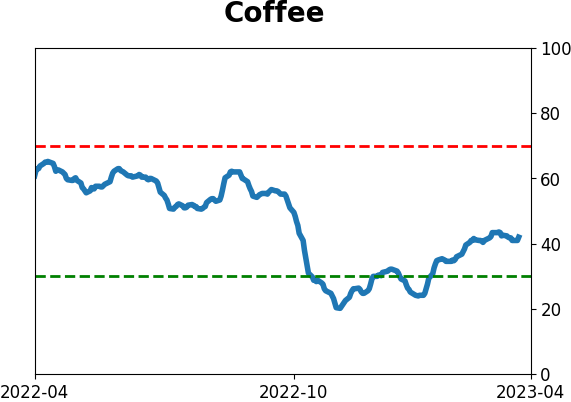
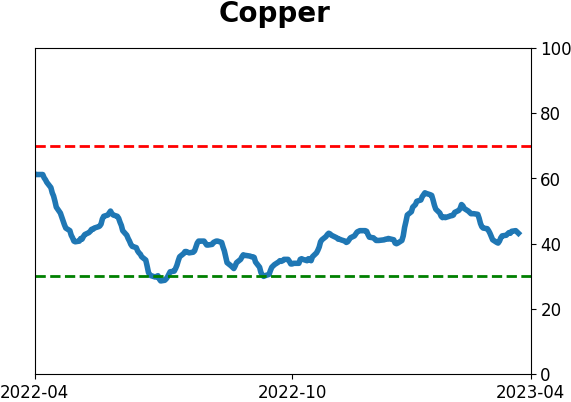
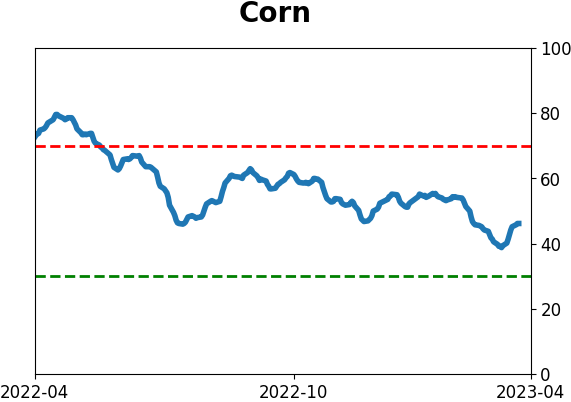
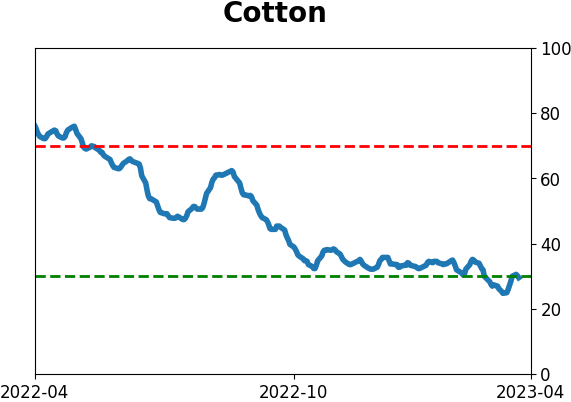
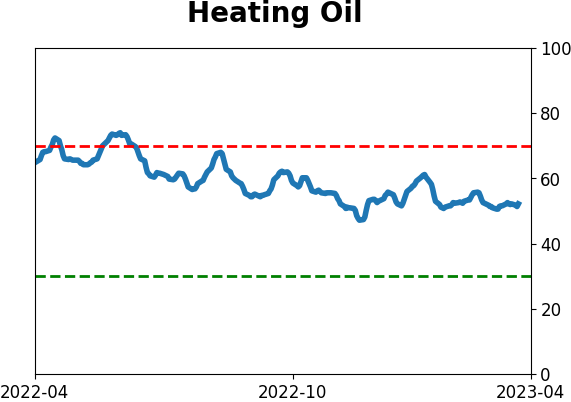
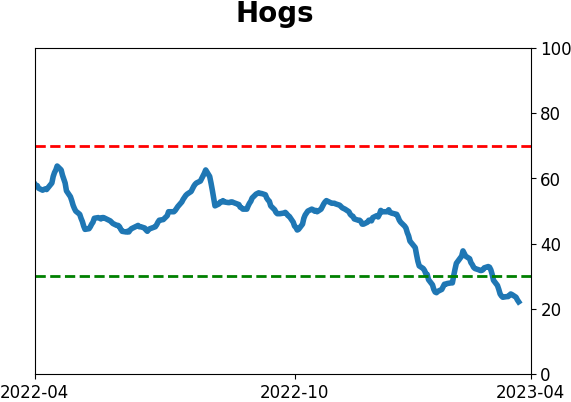
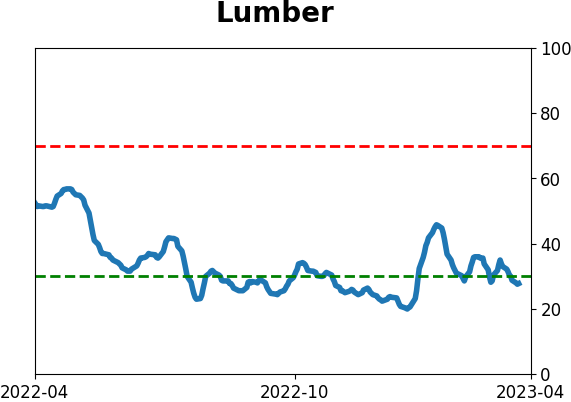
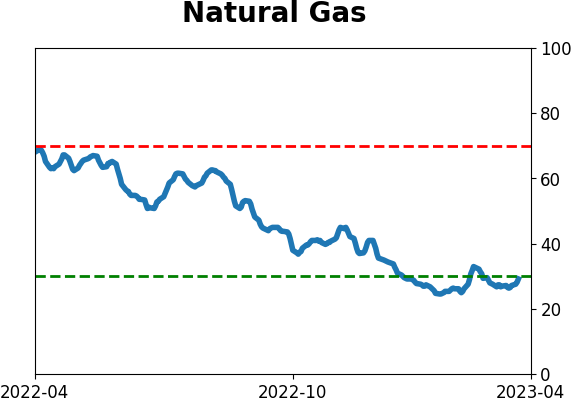
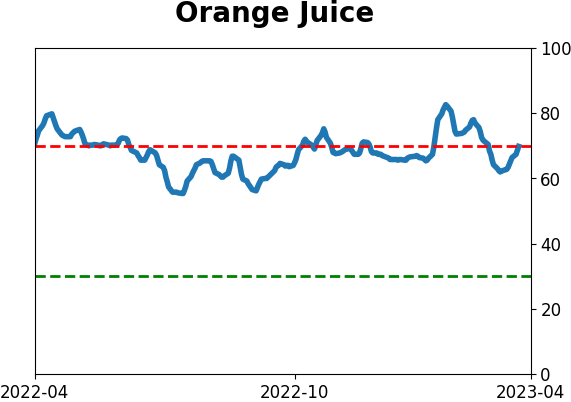
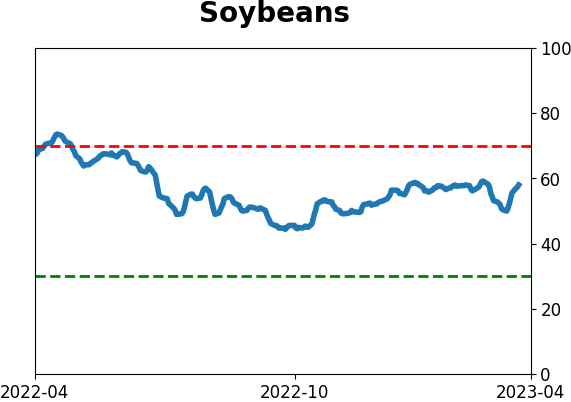
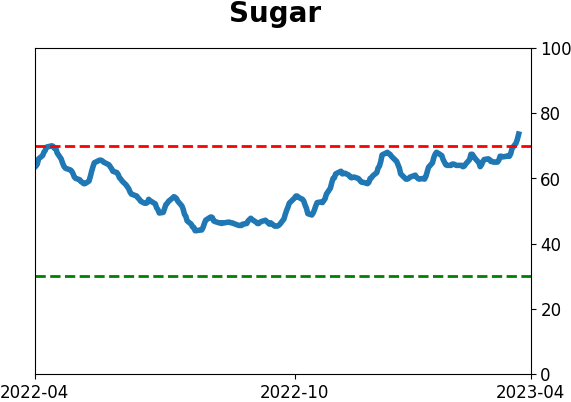
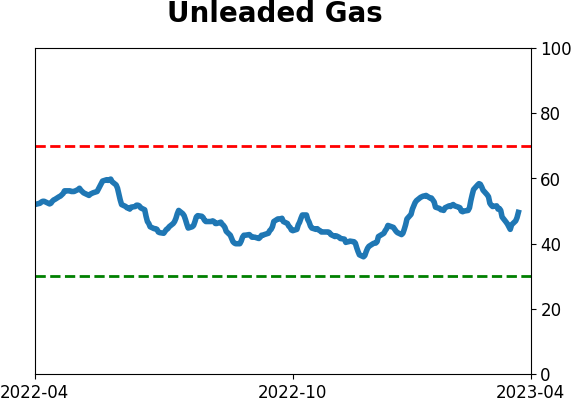
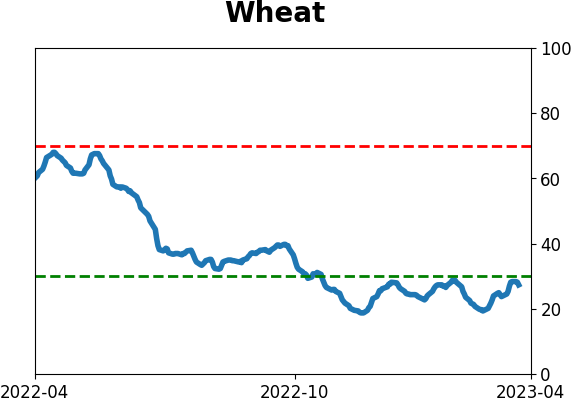
Agriculture

|
|
Research
By Jay Kaeppel
BOTTOM LINE
The S&P 500 Index registered a significant gain (+7%) during the first three months of 2023. Historically, this has been a favorable harbinger of things to come for the rest of the calendar year.
FORECAST / TIMEFRAME
None
|
Key points
- The S&P 500 index registered a gain of +7% in Q1 2023
- 1st quarter gains over +5% have tended to presage bullish years in the past
- Other favorable signals from Q1 results can be found here and here
Q1 gains above 5% tend to follow through
The S&P 500 registered a gain of +7% during the first three months of 2023. Does this mean anything? In the past 73 years, there have been 26 times when the S&P 500 gained +5% or more during the first three months of the year. As it turns out, this type of action has tended to be a good barometer for how the market will do during the remaining nine months of the year.
For our test, we will buy the S&P 500 Index at the March 31st close if the index has gained at least +5% or more through that date. Also, for this test, we will hold the index for nine months through the end of the current calendar year.
The chart below displays the growth of $1 invested in the S&P 500 for the last nine months of the year if the index gained +5% or more in the first quarter of that year.
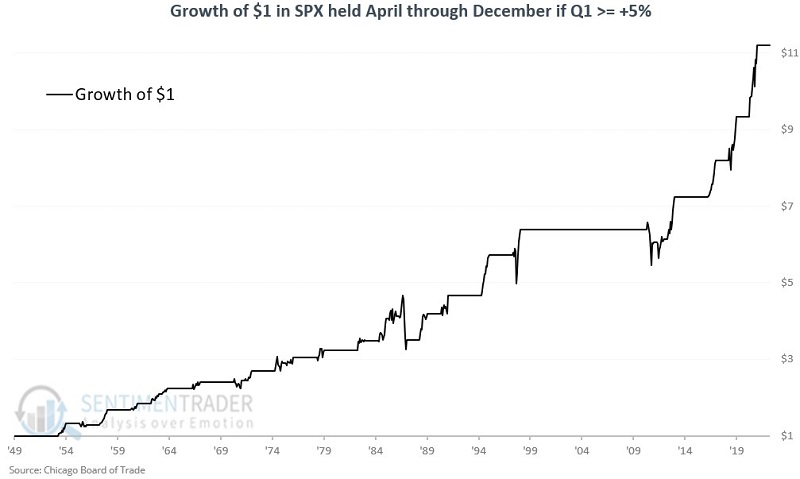
The table below summarizes the results. The key things to note are an 89% Win Rate and the fnine-montharge nine-month price movements have all been to the upside - with the one exception of 1987 when the market crashed -22% in one day during October.
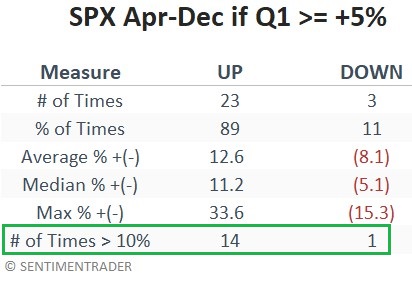
The table below displayed year-by-year results for the S&P 500 during the last nine months in those years when Q1 gained more than 5%.
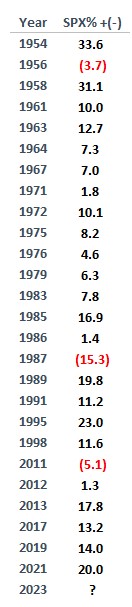
What the research tells us…
The good news is that the S&P has enjoyed a high Win Rate during the last nine months of the year when the 1st quarter shows a significant gain. Likewise, 14 of the 23 positive years saw the S&P 500 gain over 10% during the last nine months of the year. As long as the major indexes (SPX, NDX, Dow) hold above their longer-term moving average, this bullish thrust signal suggests giving the bullish case the benefit of the doubt in the months ahead.
On the other hand, despite a high historical Win Rate of 89%, there is no guarantee that the last nine months of 2023 will see the S&P 500 trend higher. In addition, it should be remembered that an investor who had relied solely on this particular market pattern would have ridden the 1987 market crash down -22% in a day fully invested. So be forewarned that an up 1st quarter provides bullish weight of the evidence butconsiderede thought of as a "trading system" or evnecessarily as a "buy" signal.
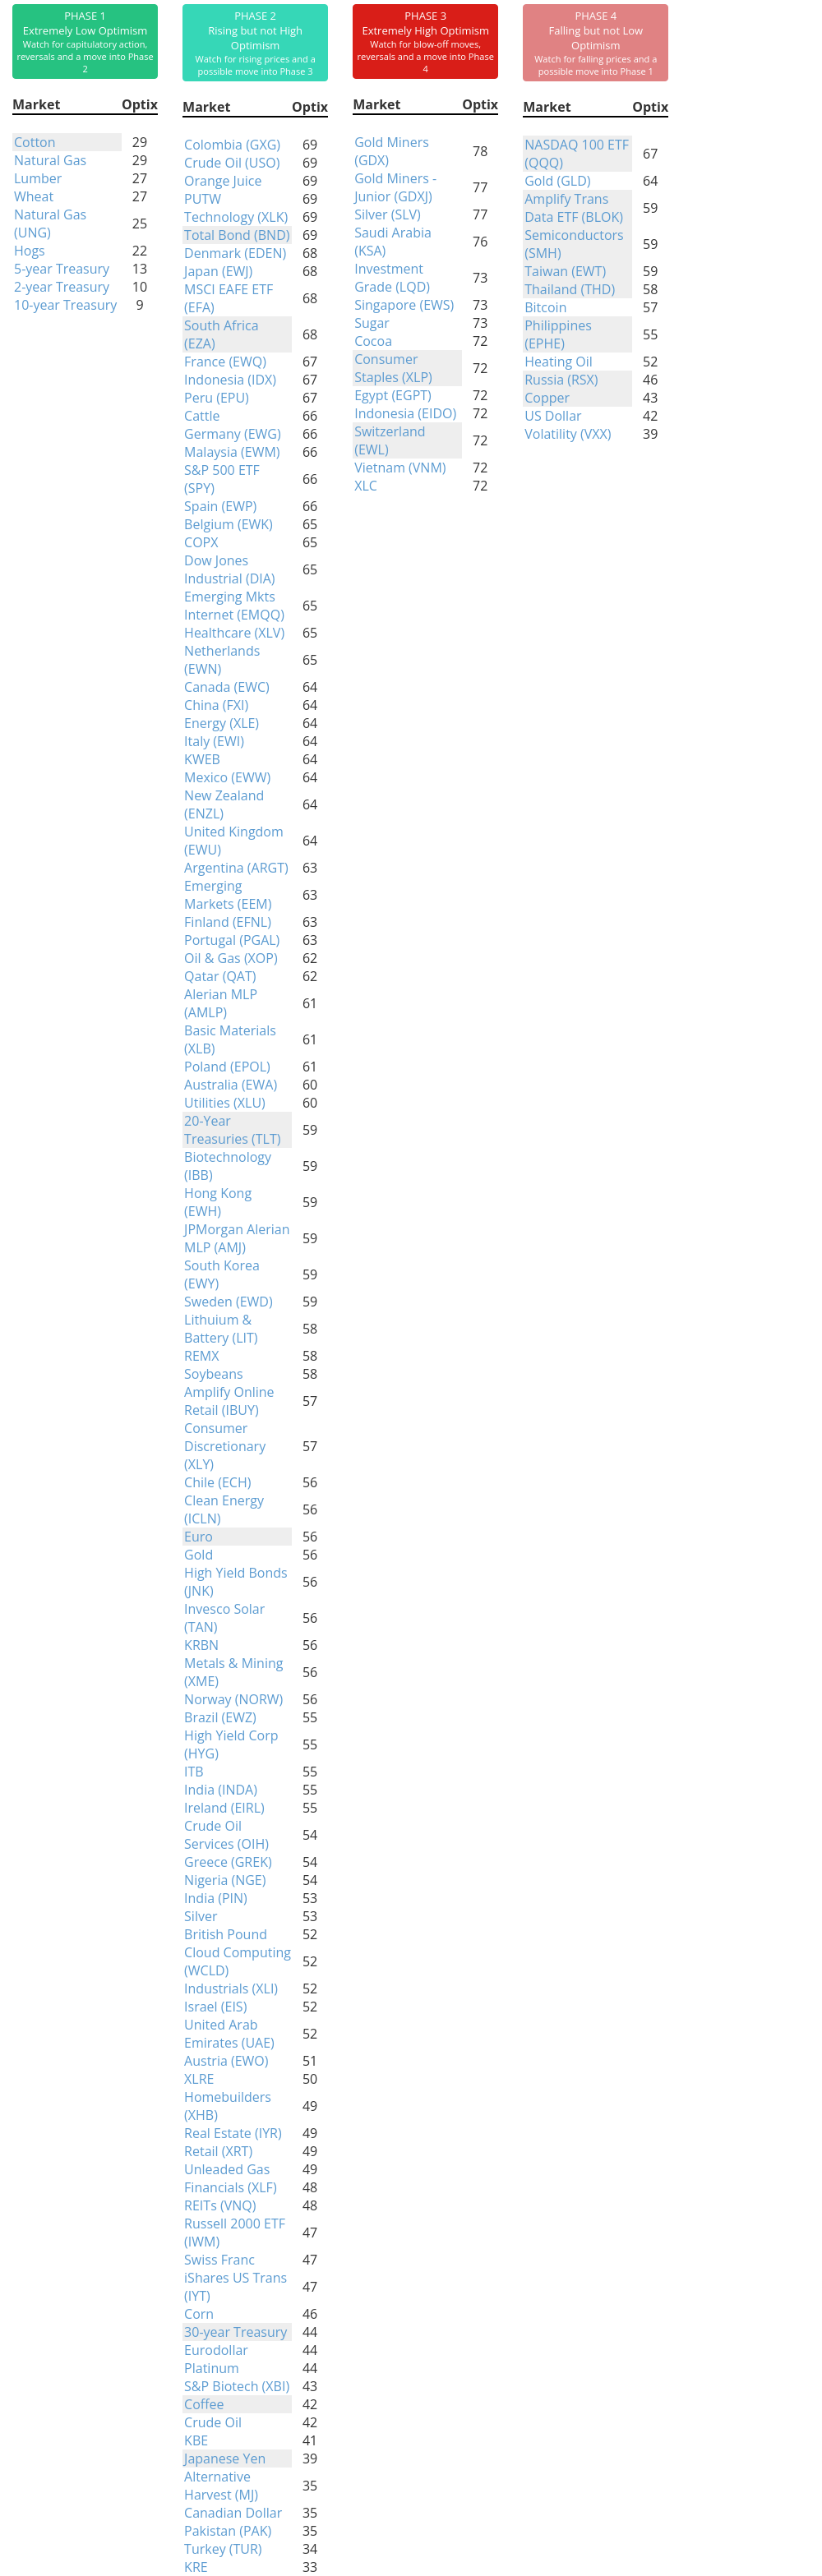
Indicators at Extremes
Phase Table
Ranks
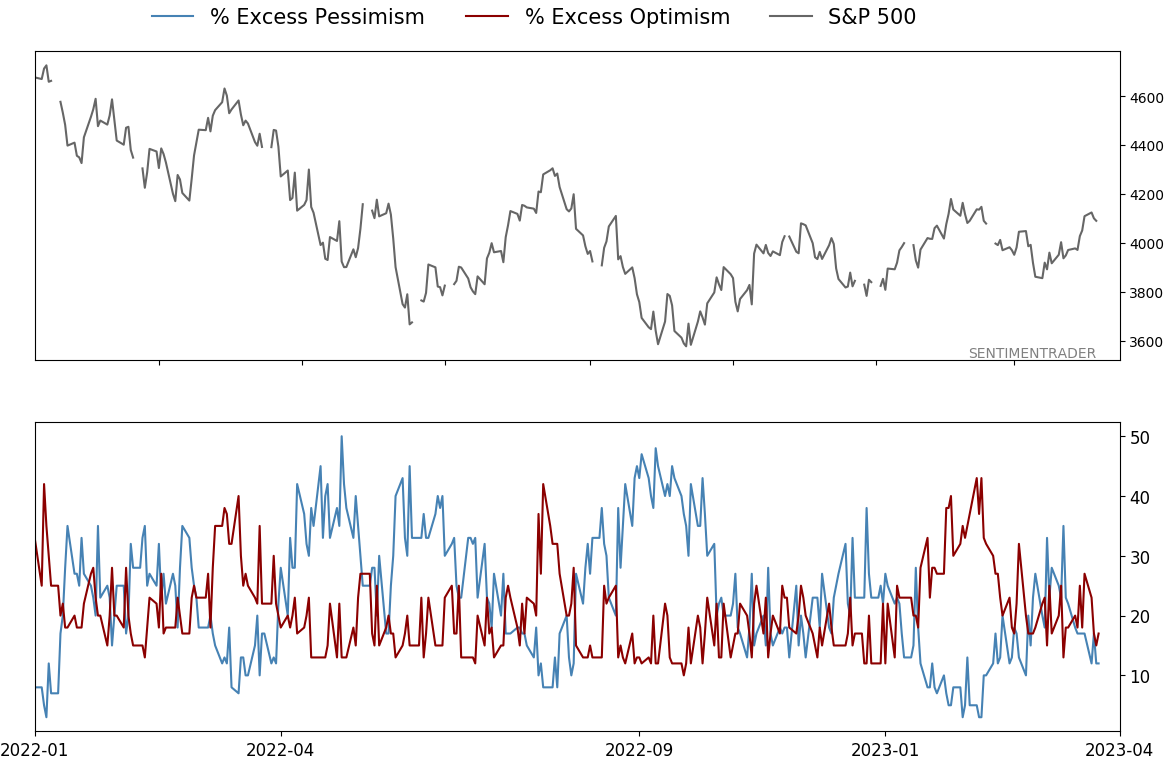
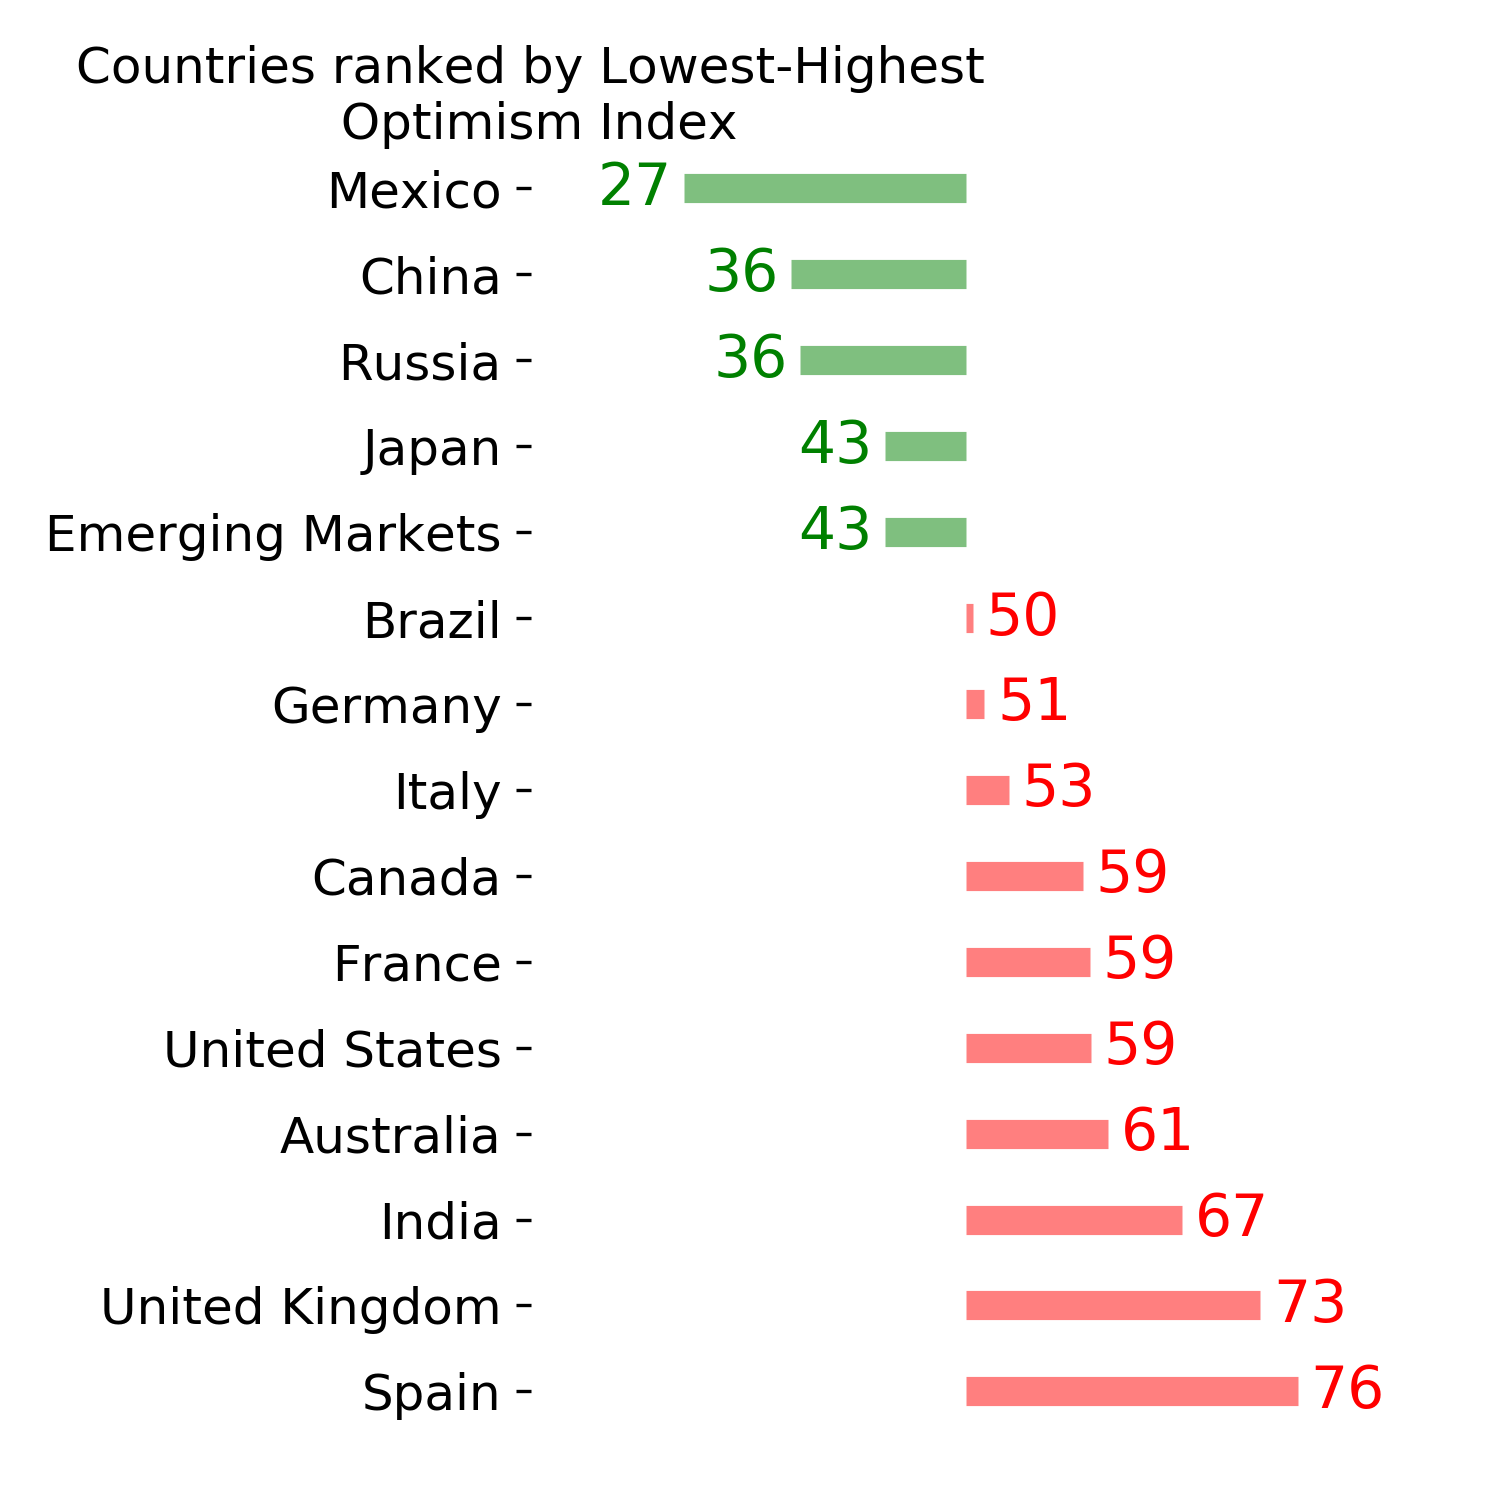
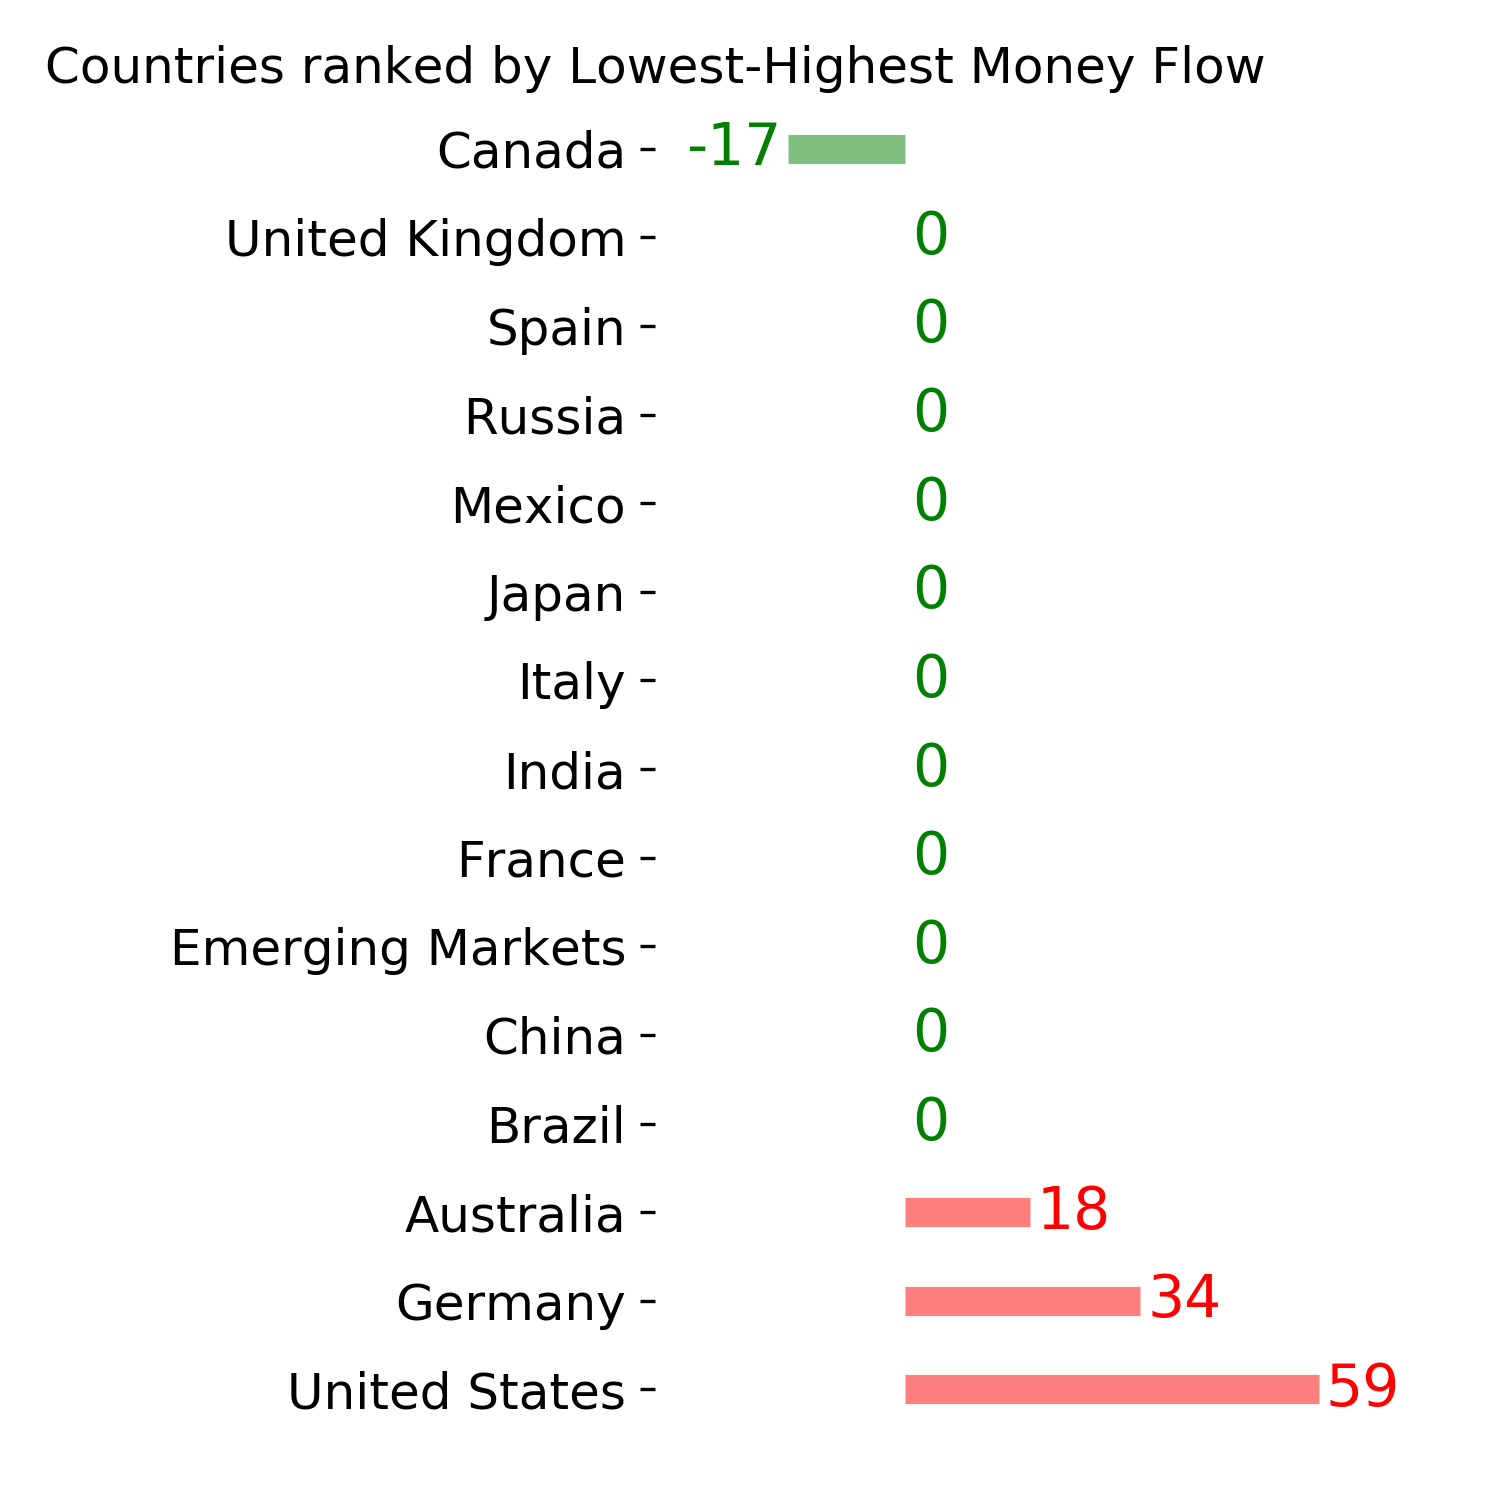
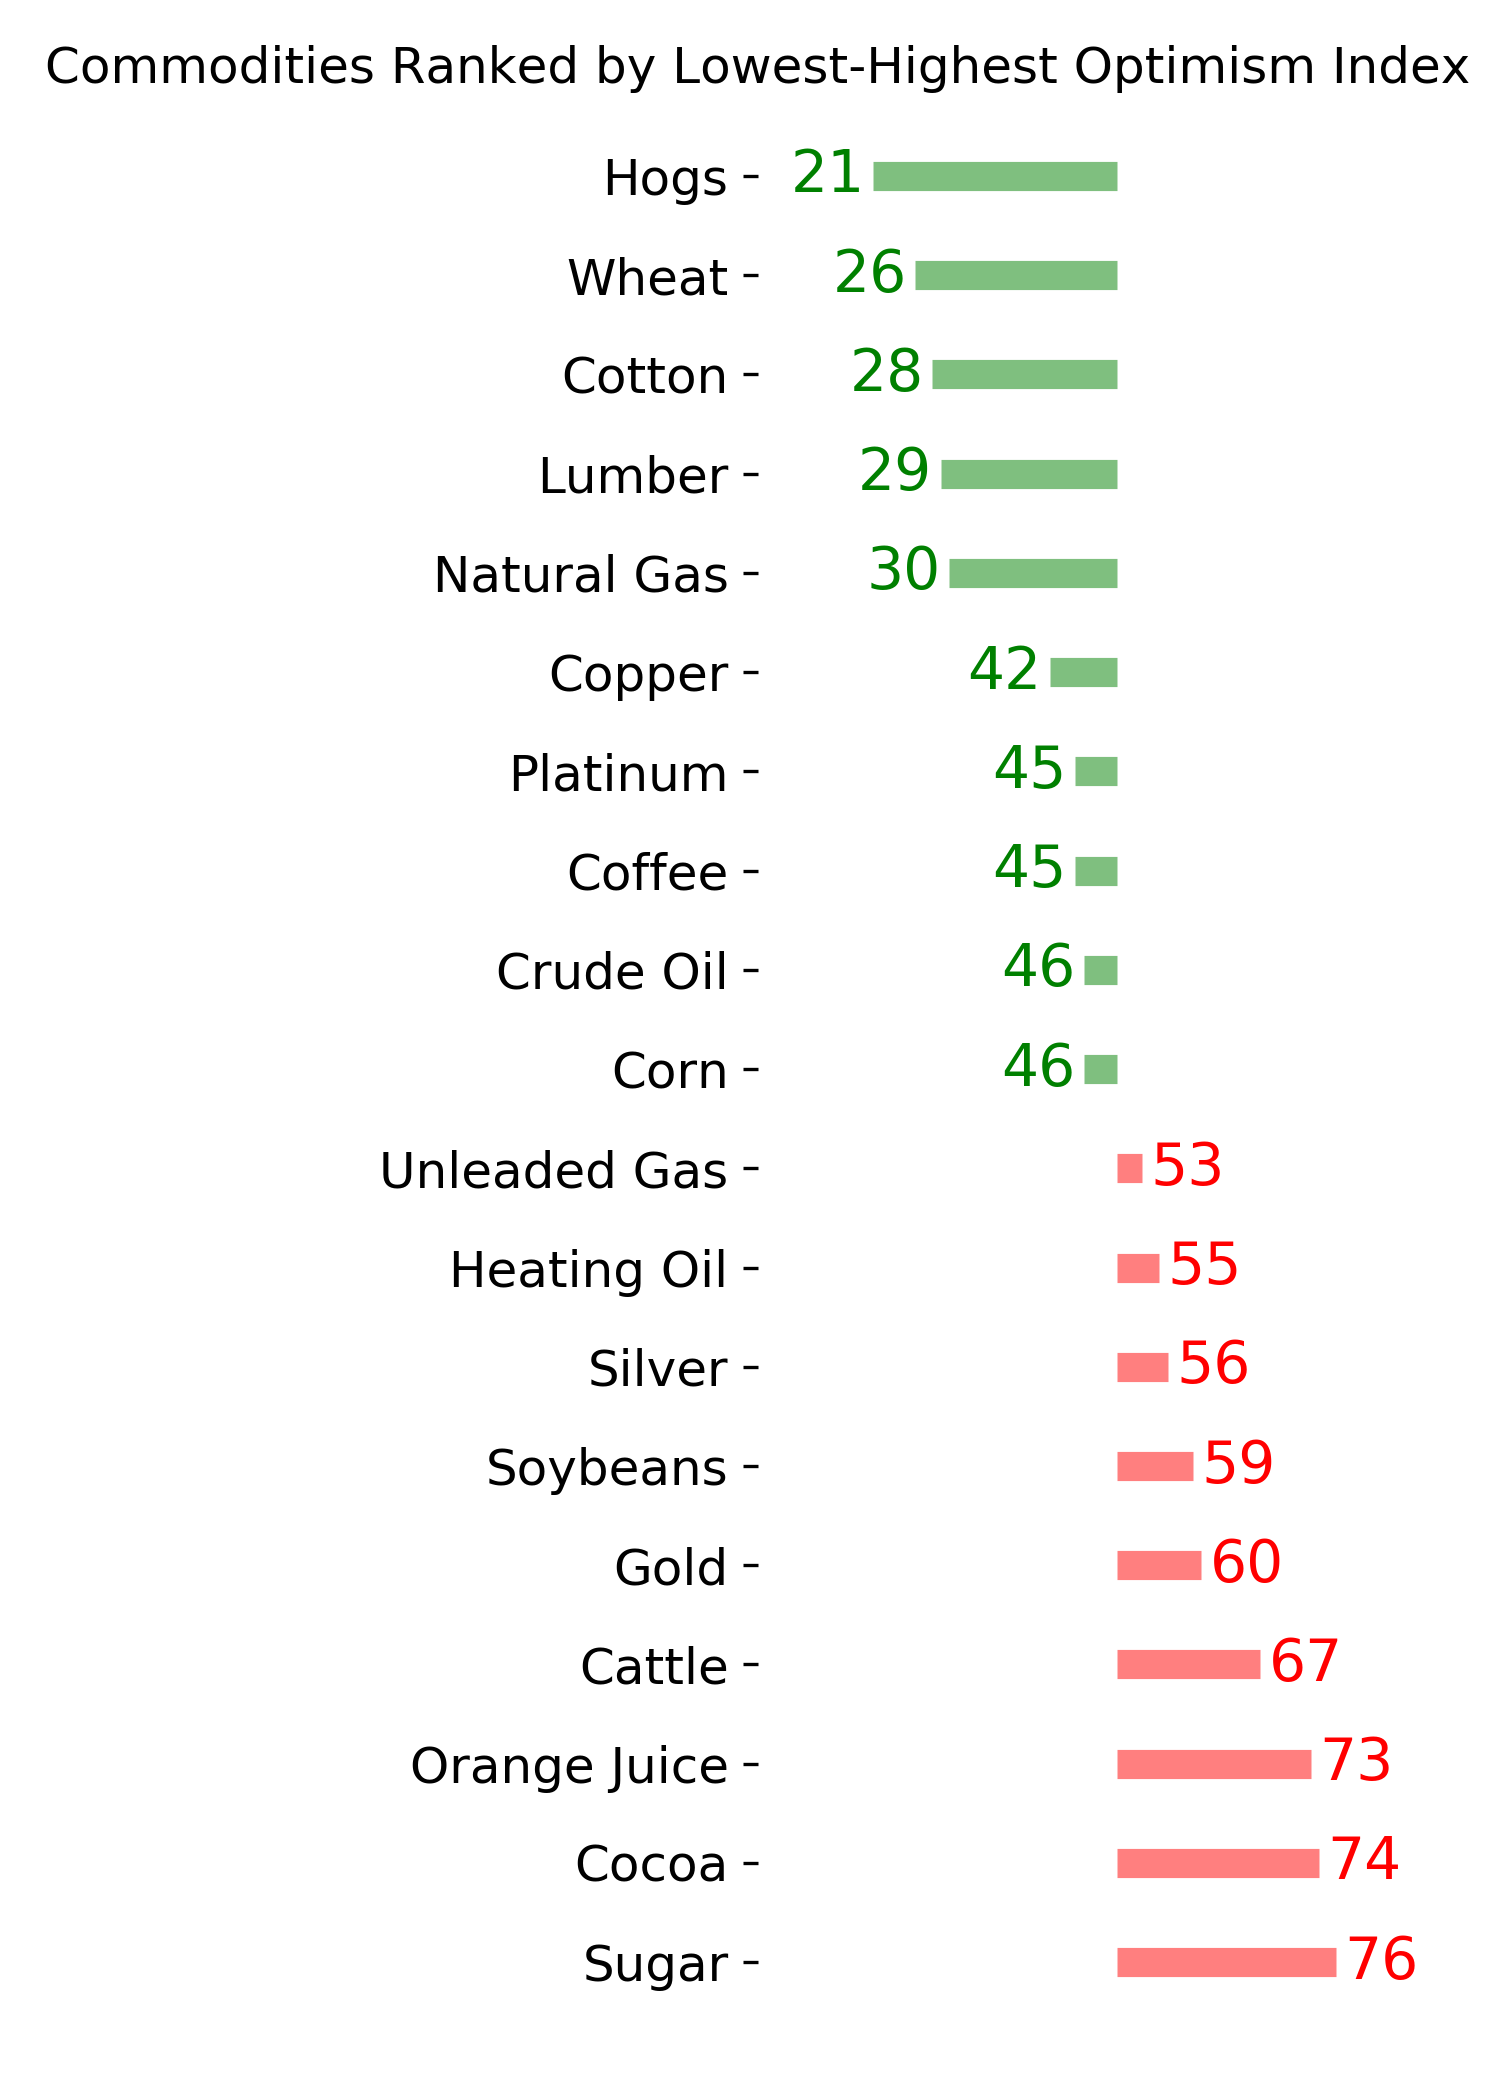
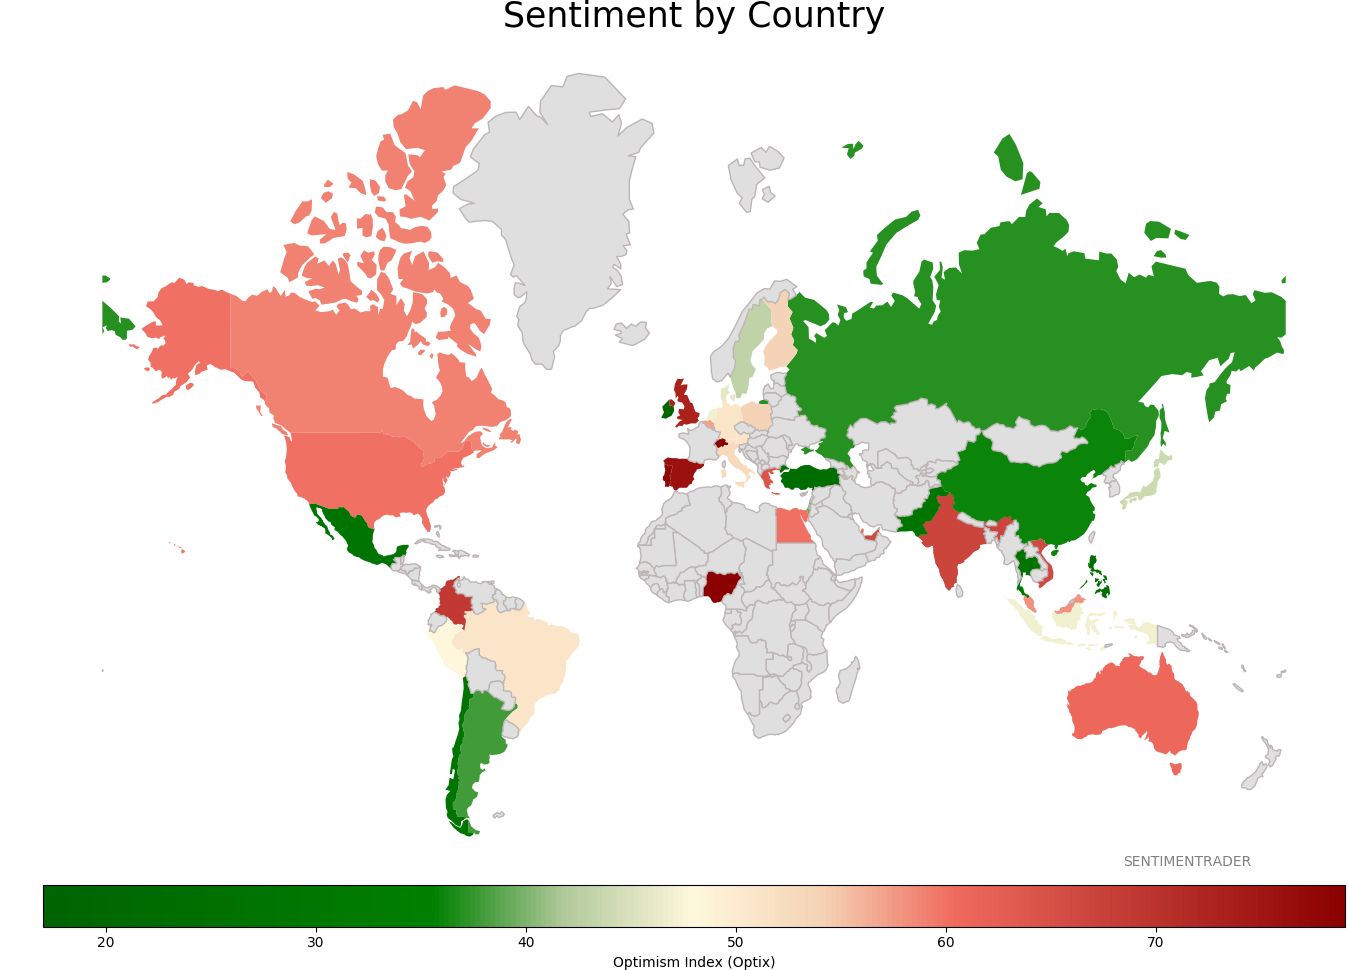
Sentiment Around The World
Optimism Index Thumbnails
|
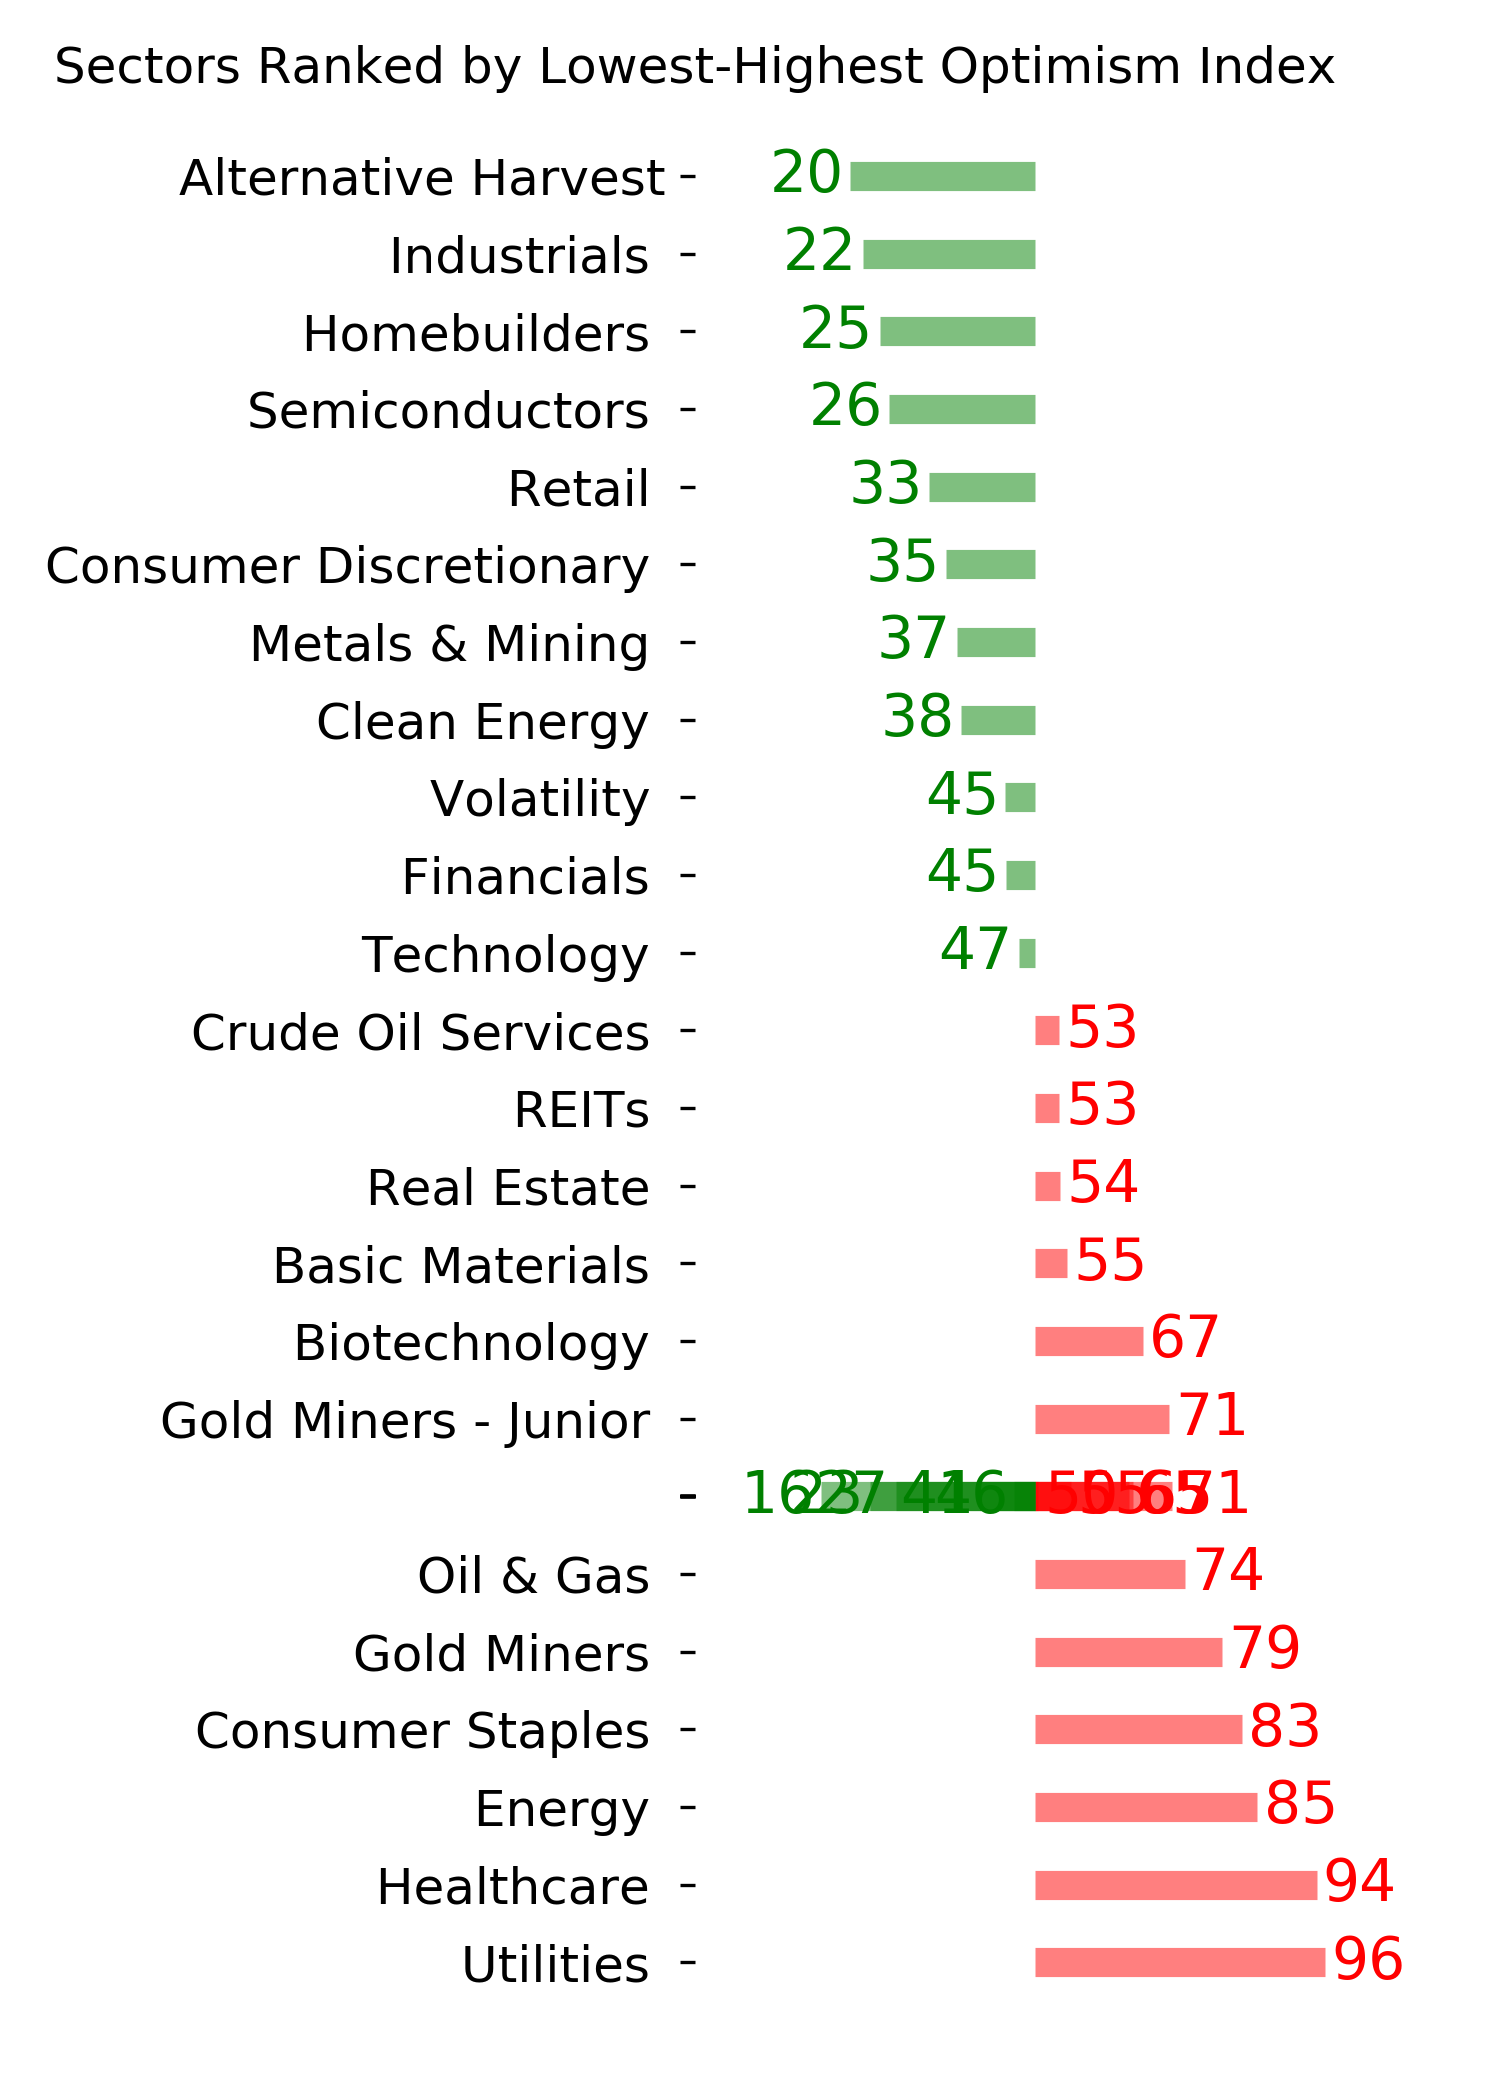
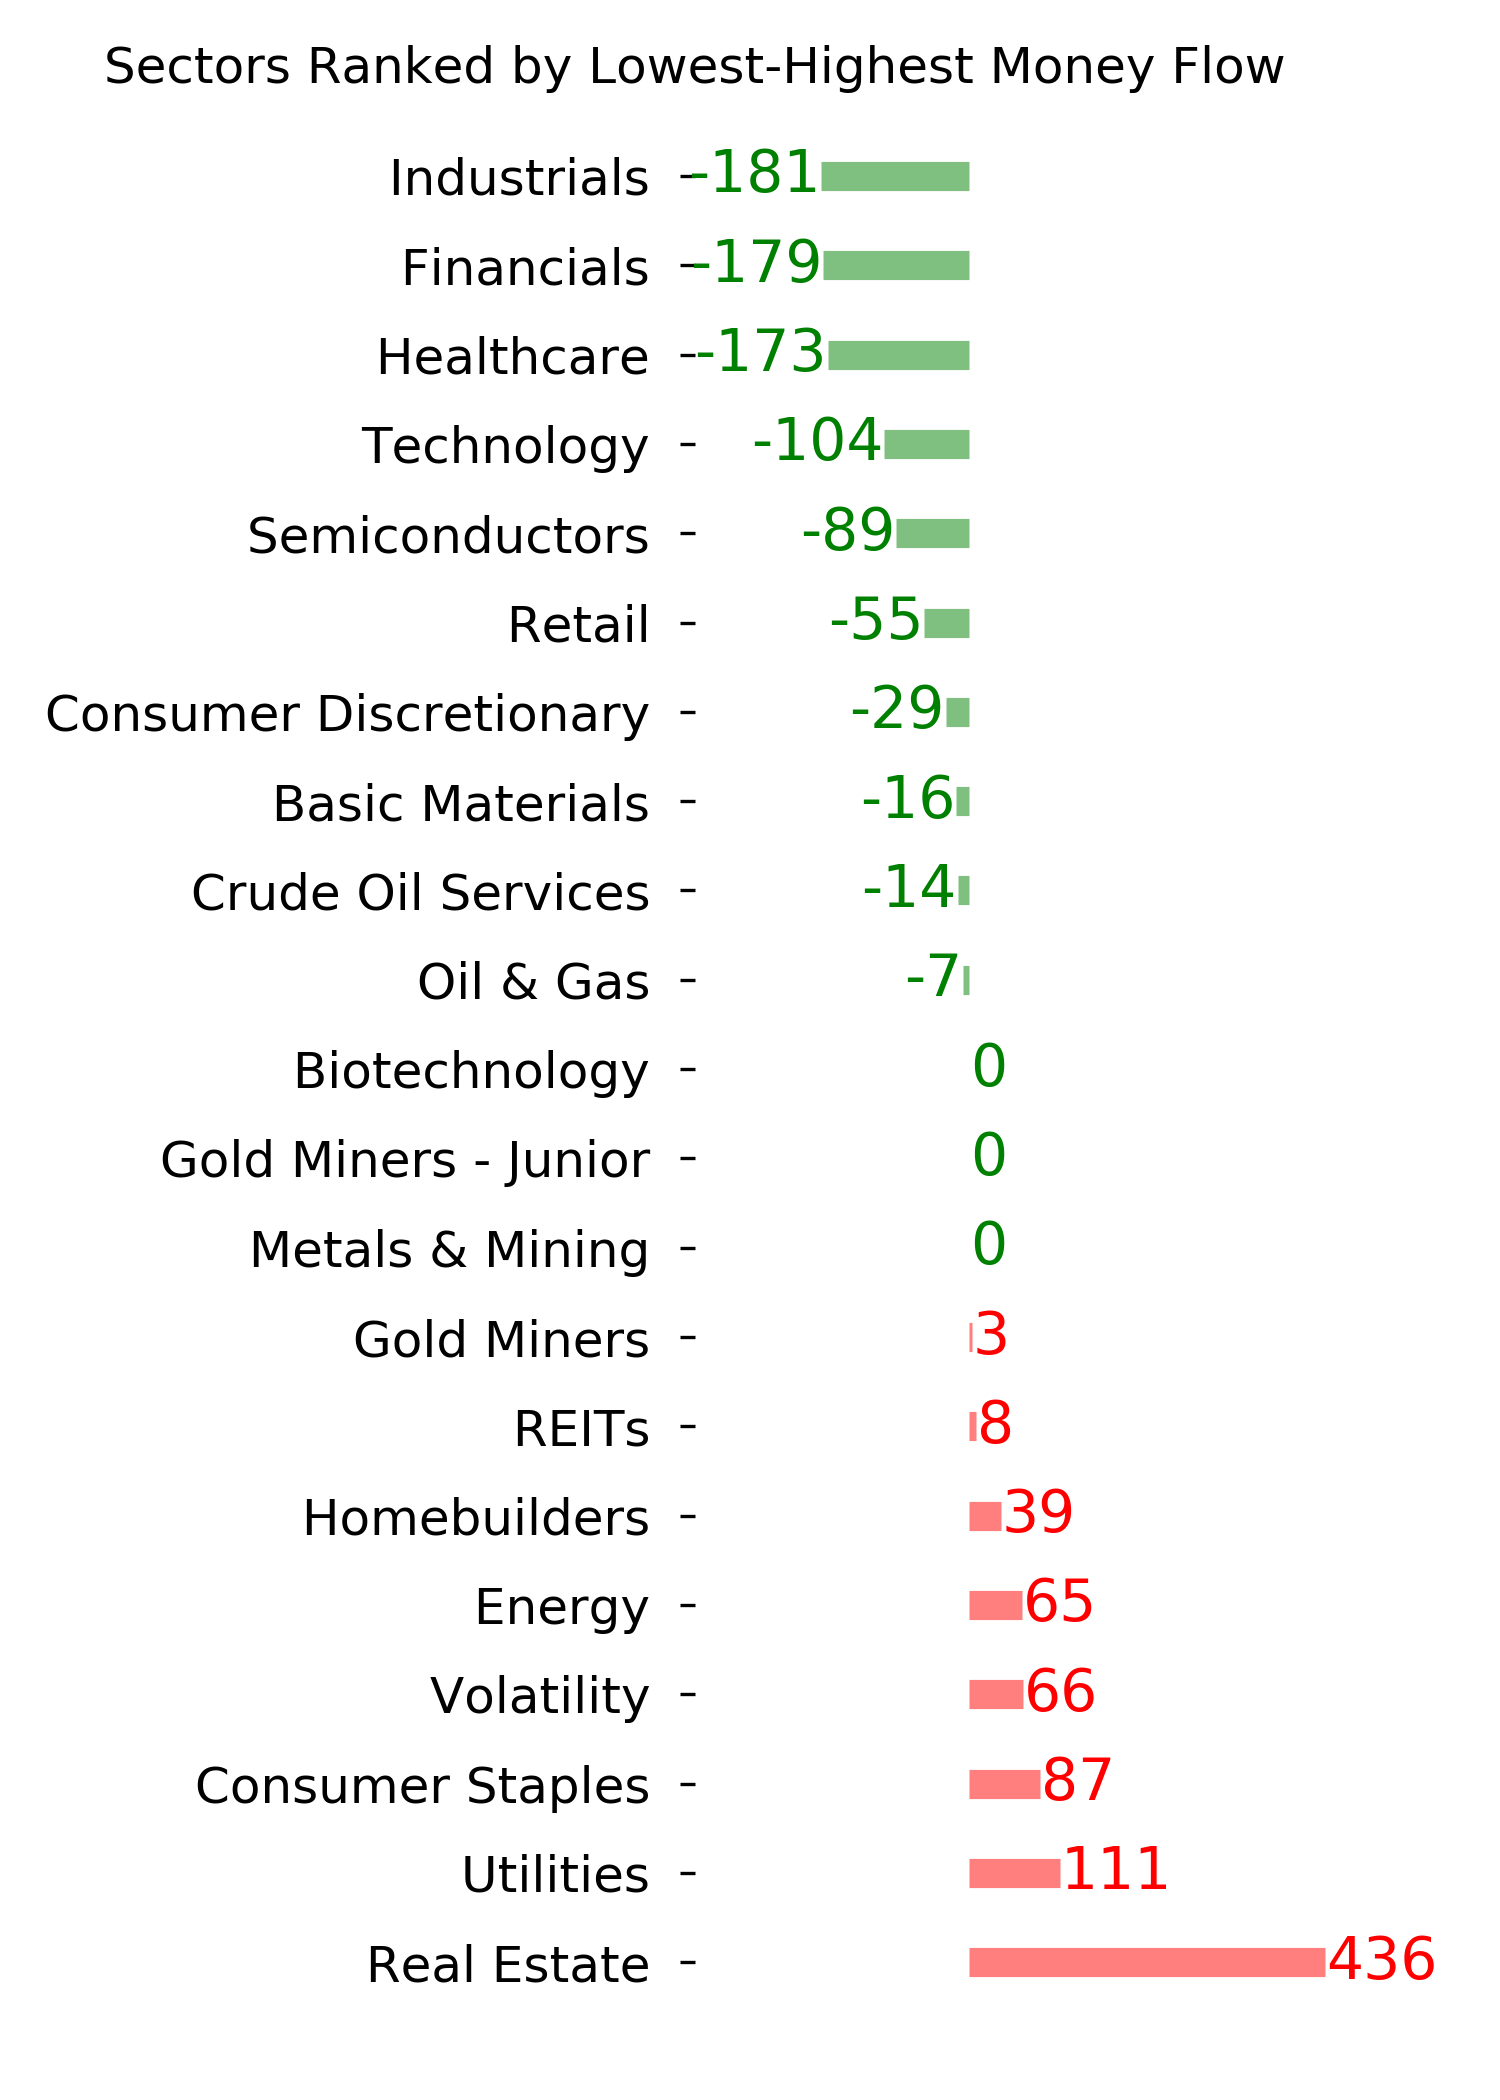
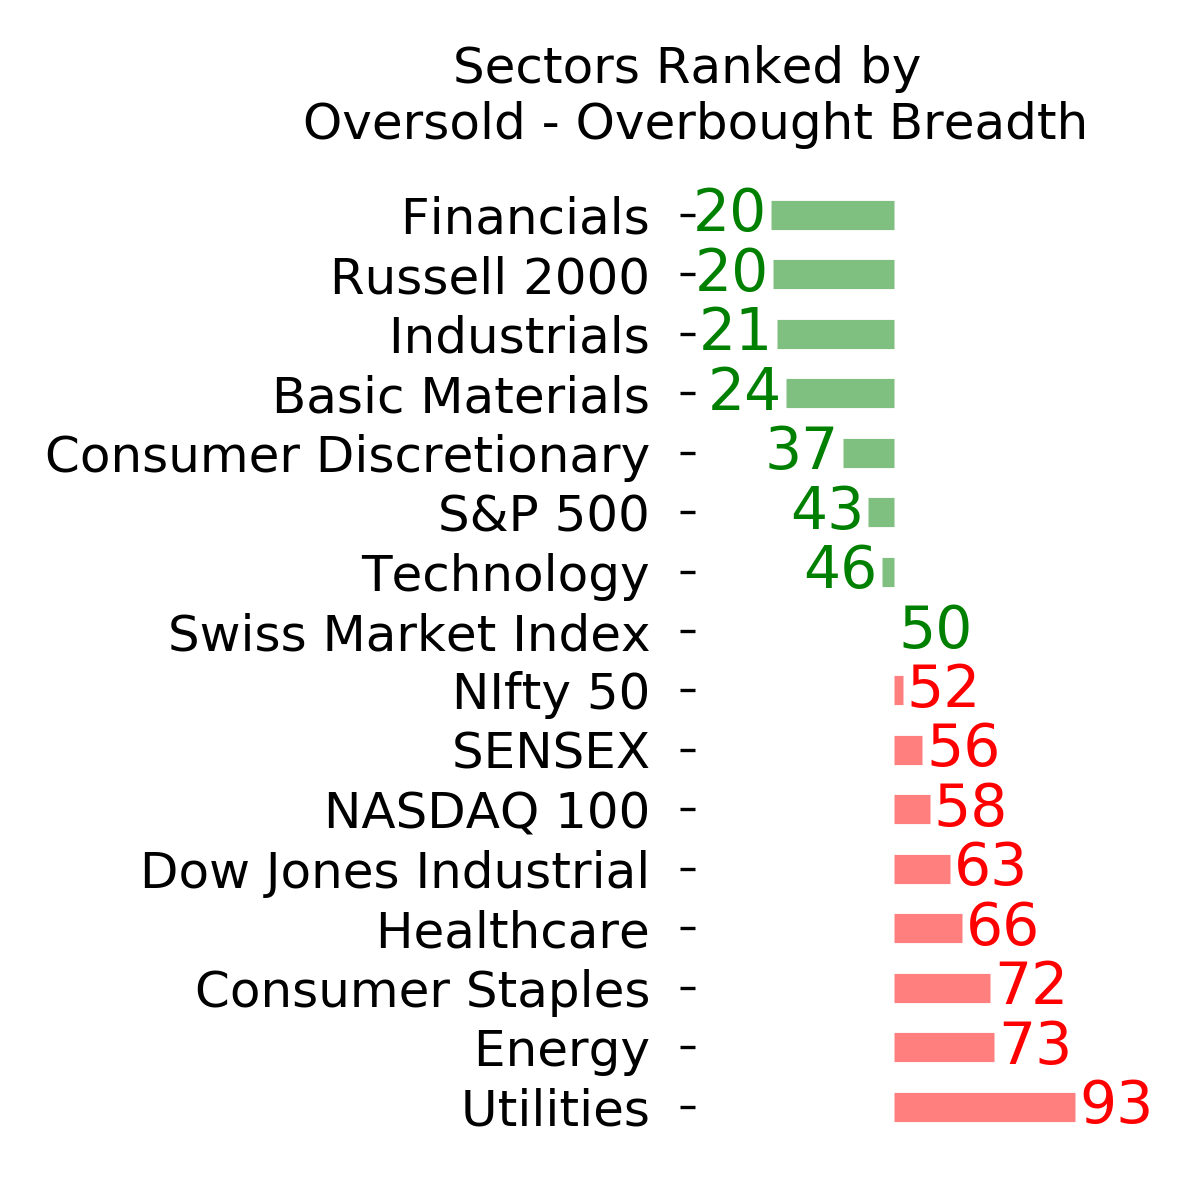
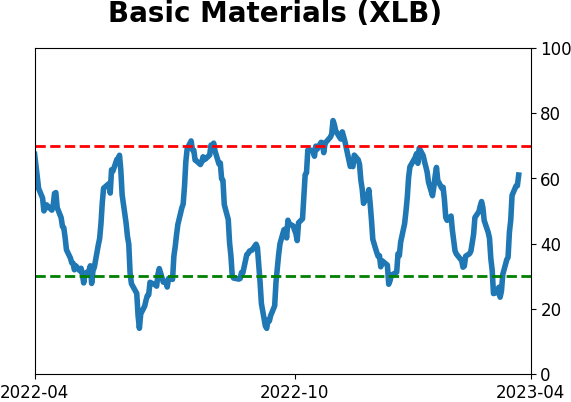
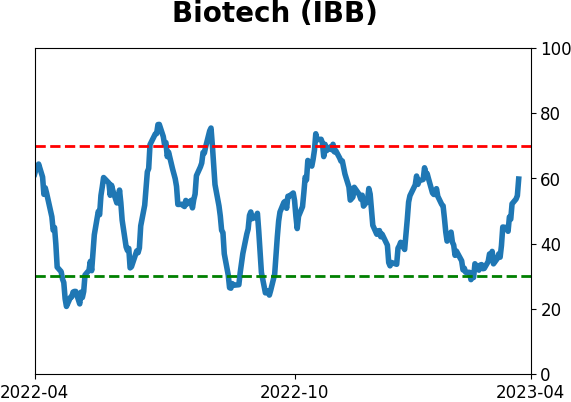
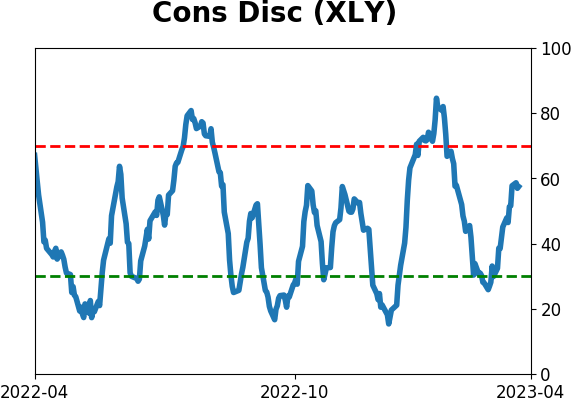
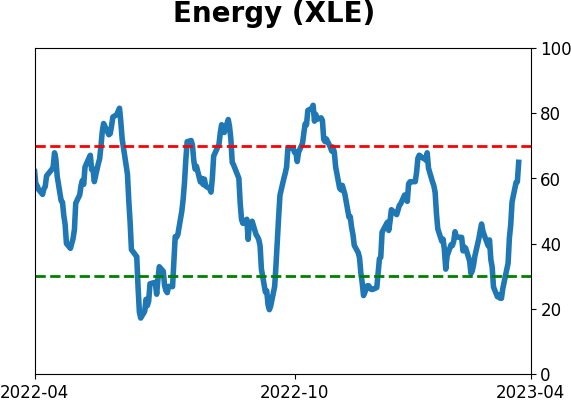
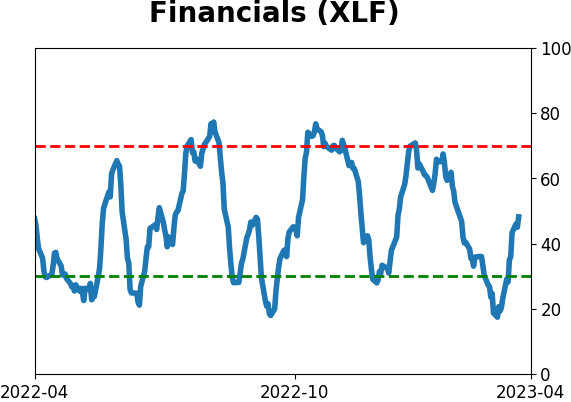
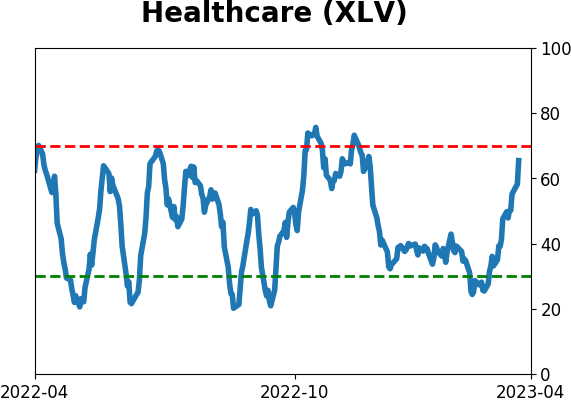
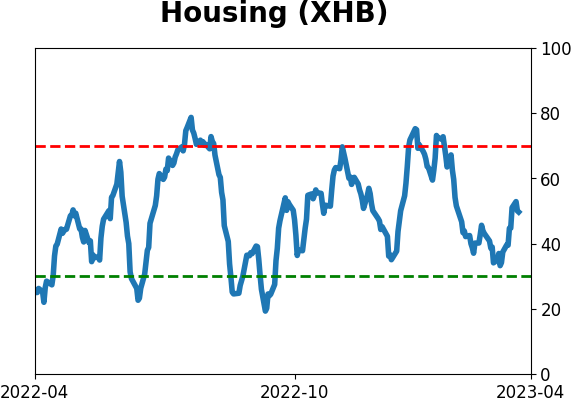
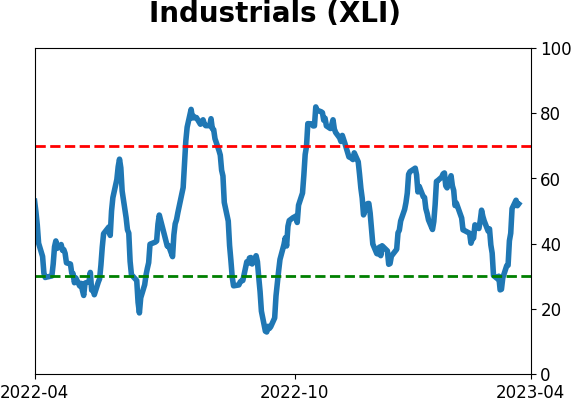
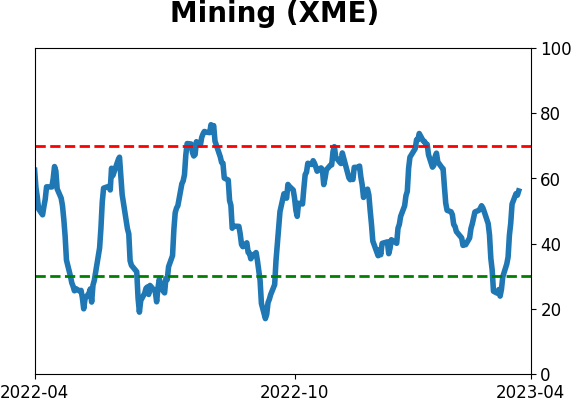
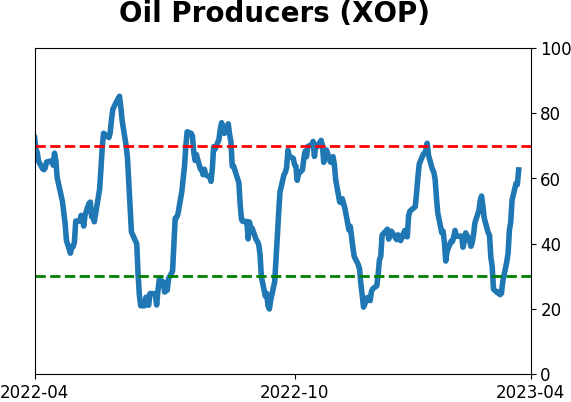
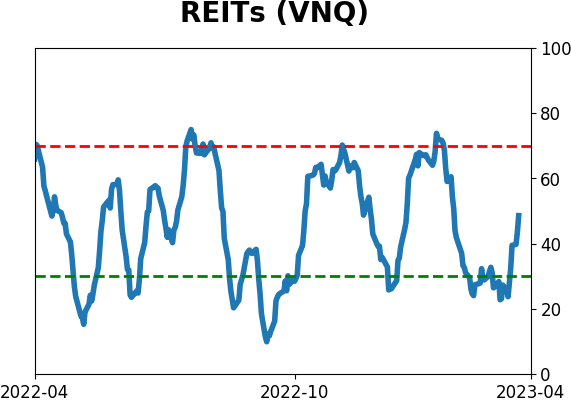
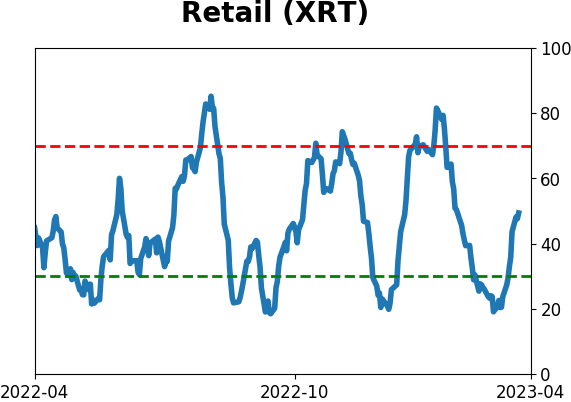
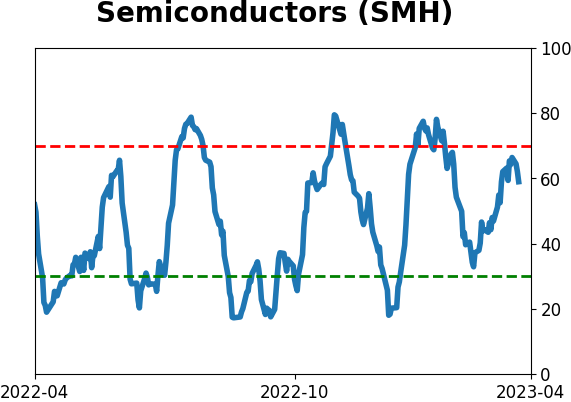
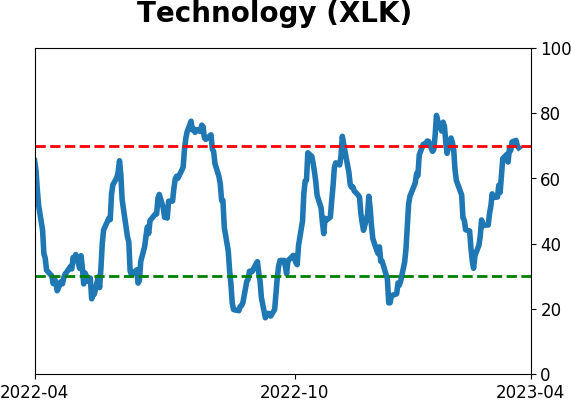
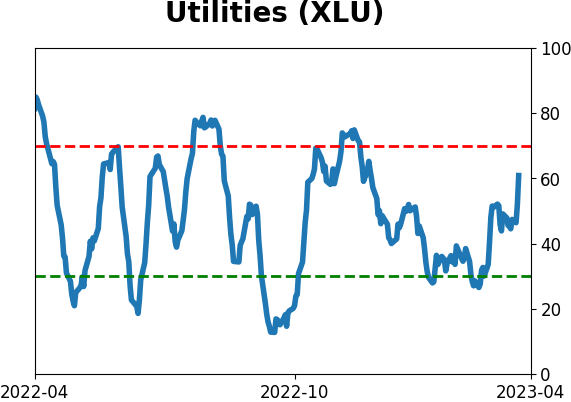
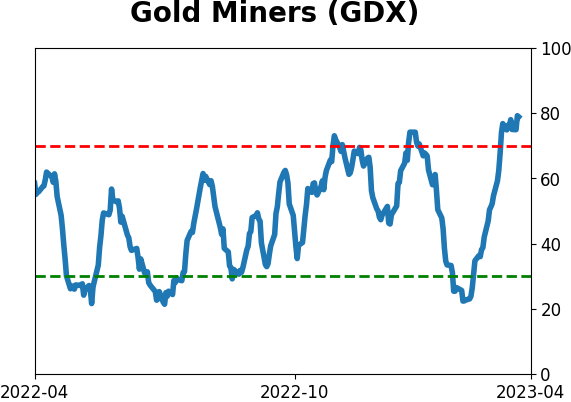
Sector ETF's - 10-Day Moving Average
|
|
|
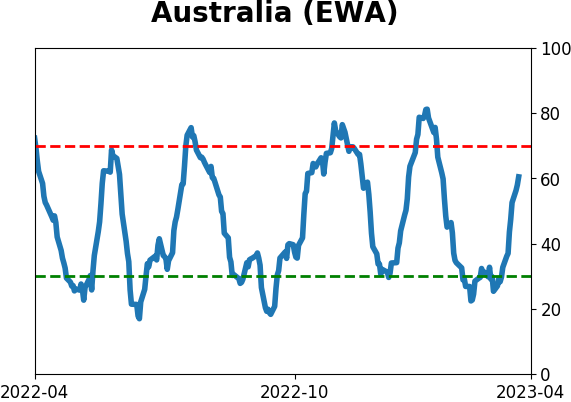
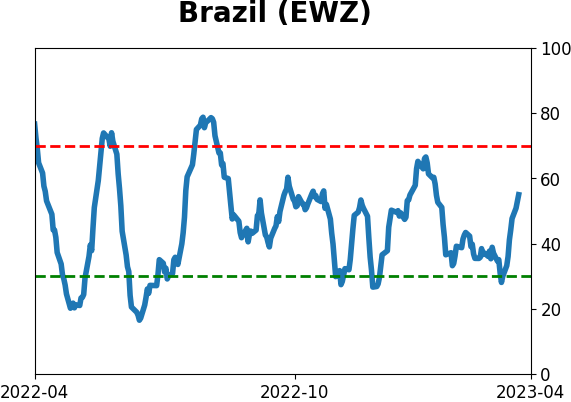
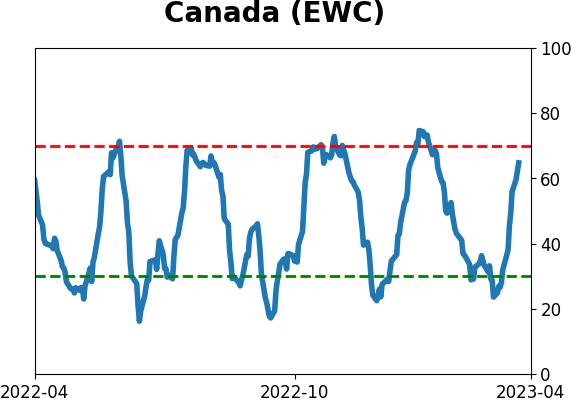
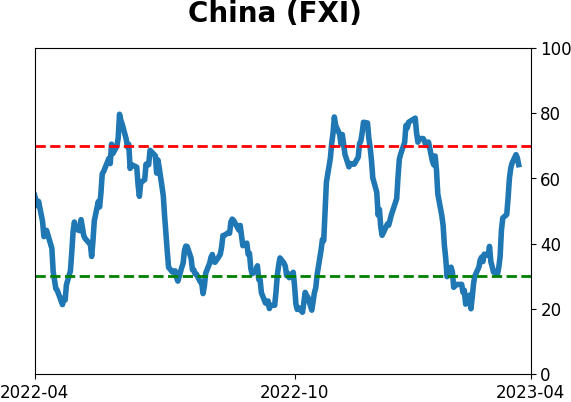
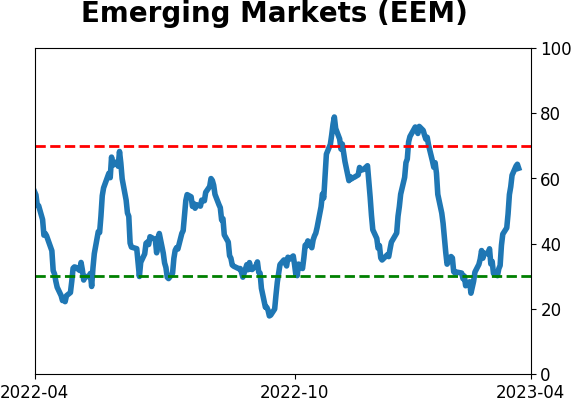
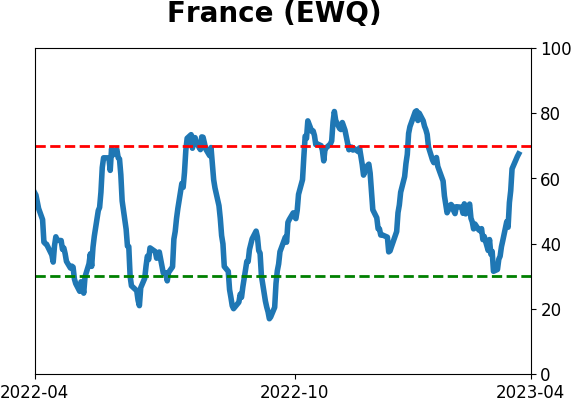
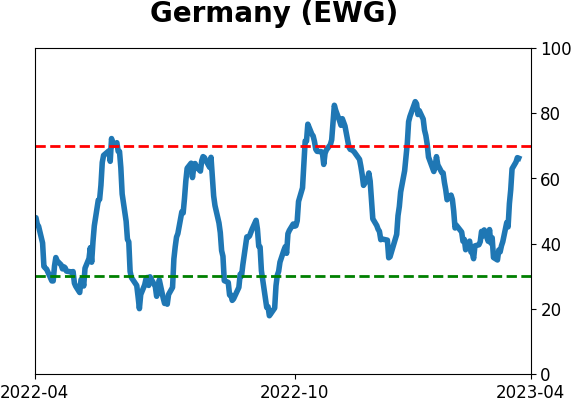
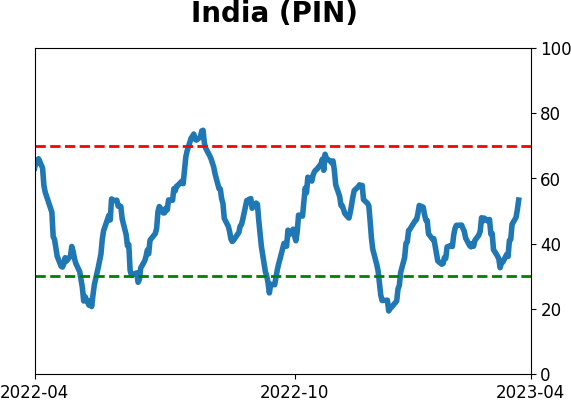
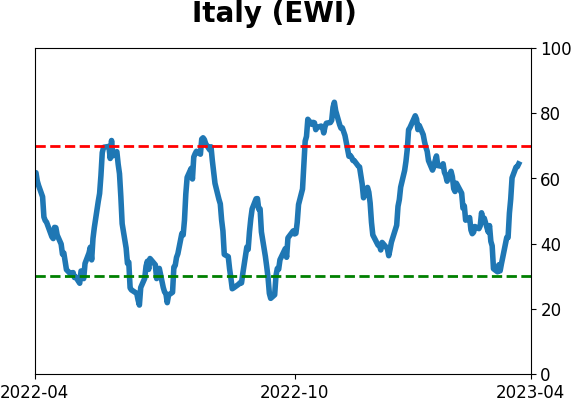
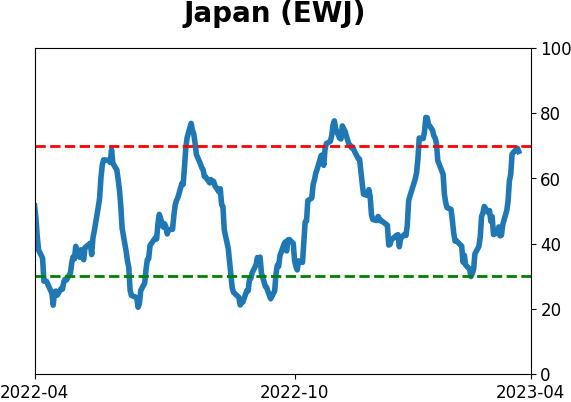
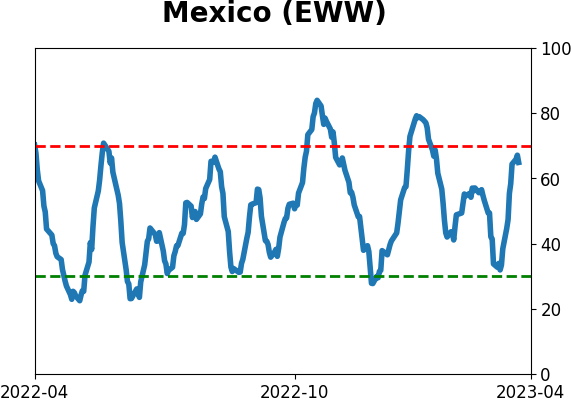
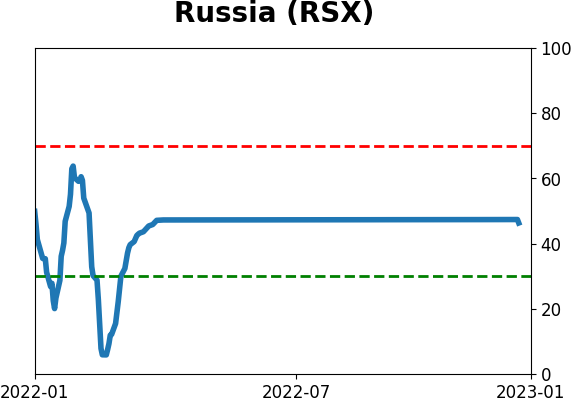
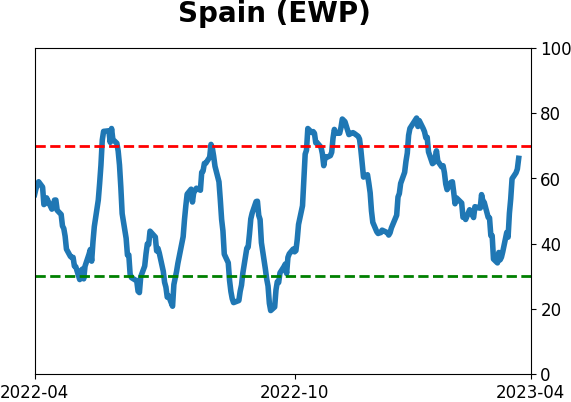
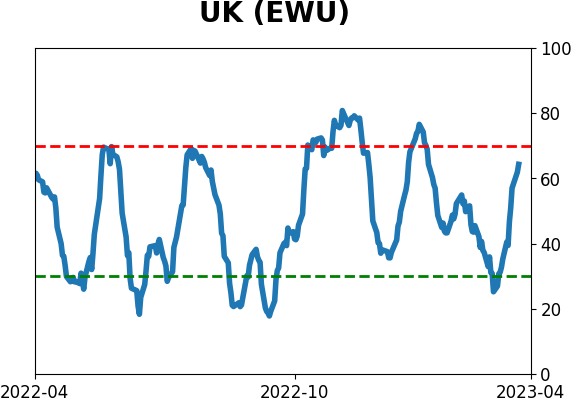
Country ETF's - 10-Day Moving Average
|
|
|
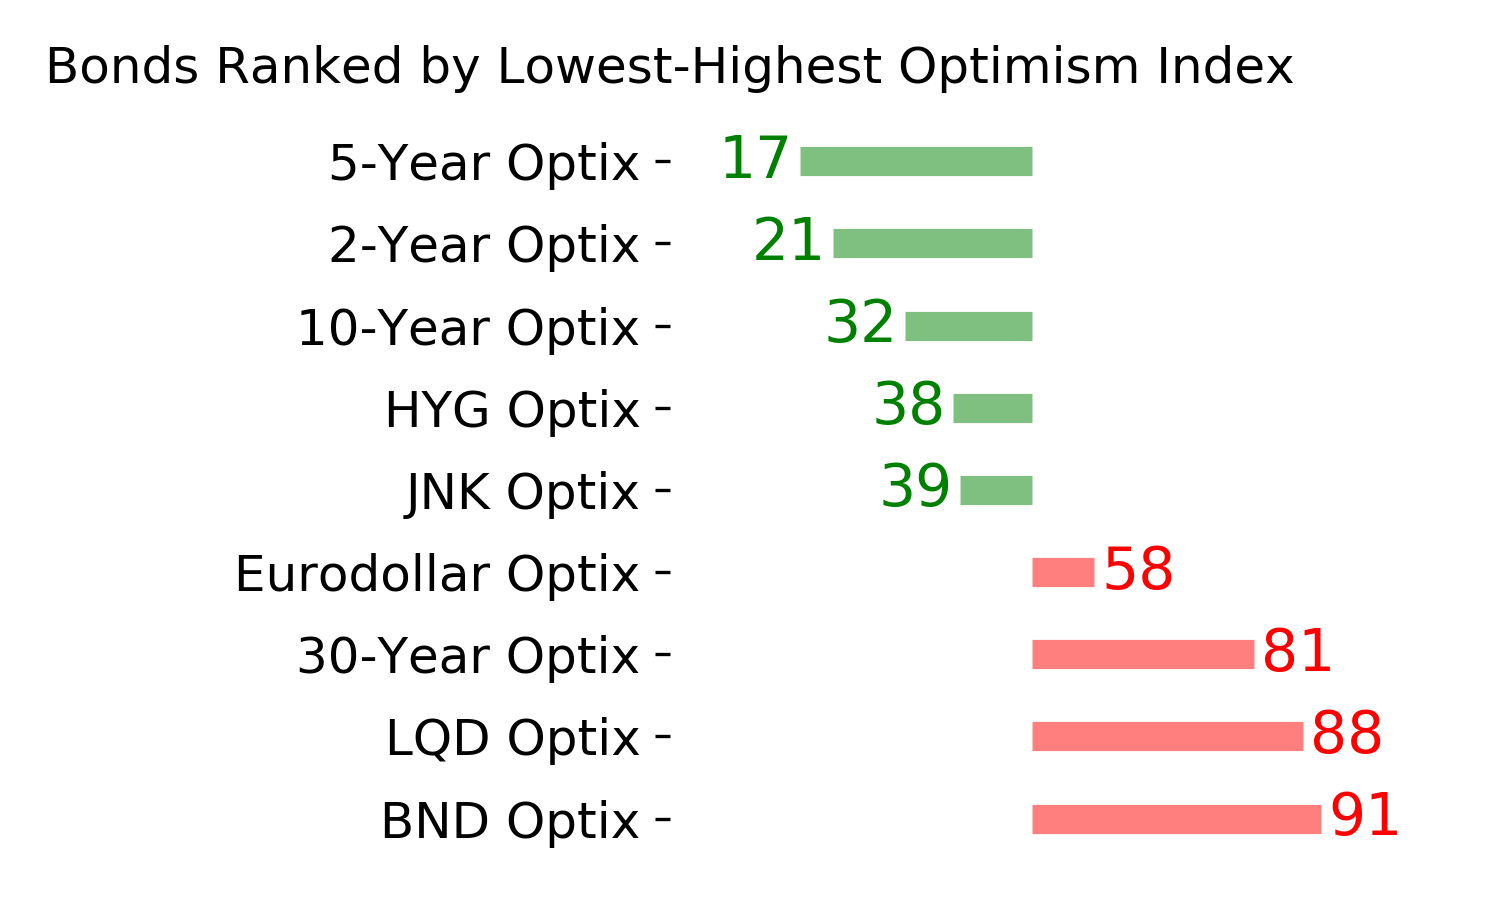
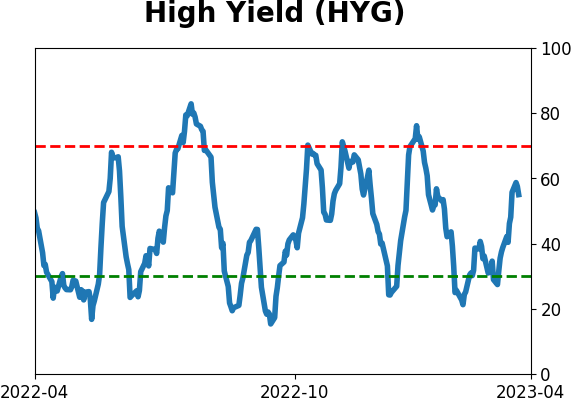
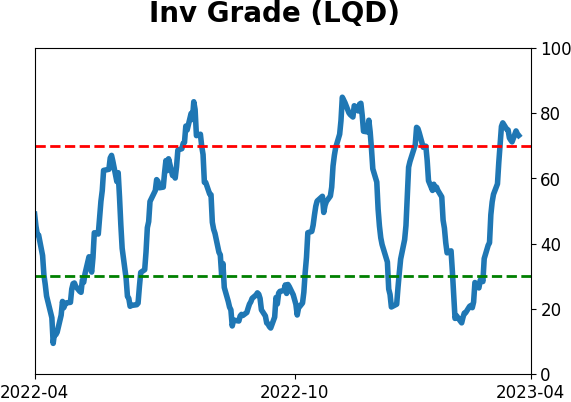
Bond ETF's - 10-Day Moving Average
|
|
|
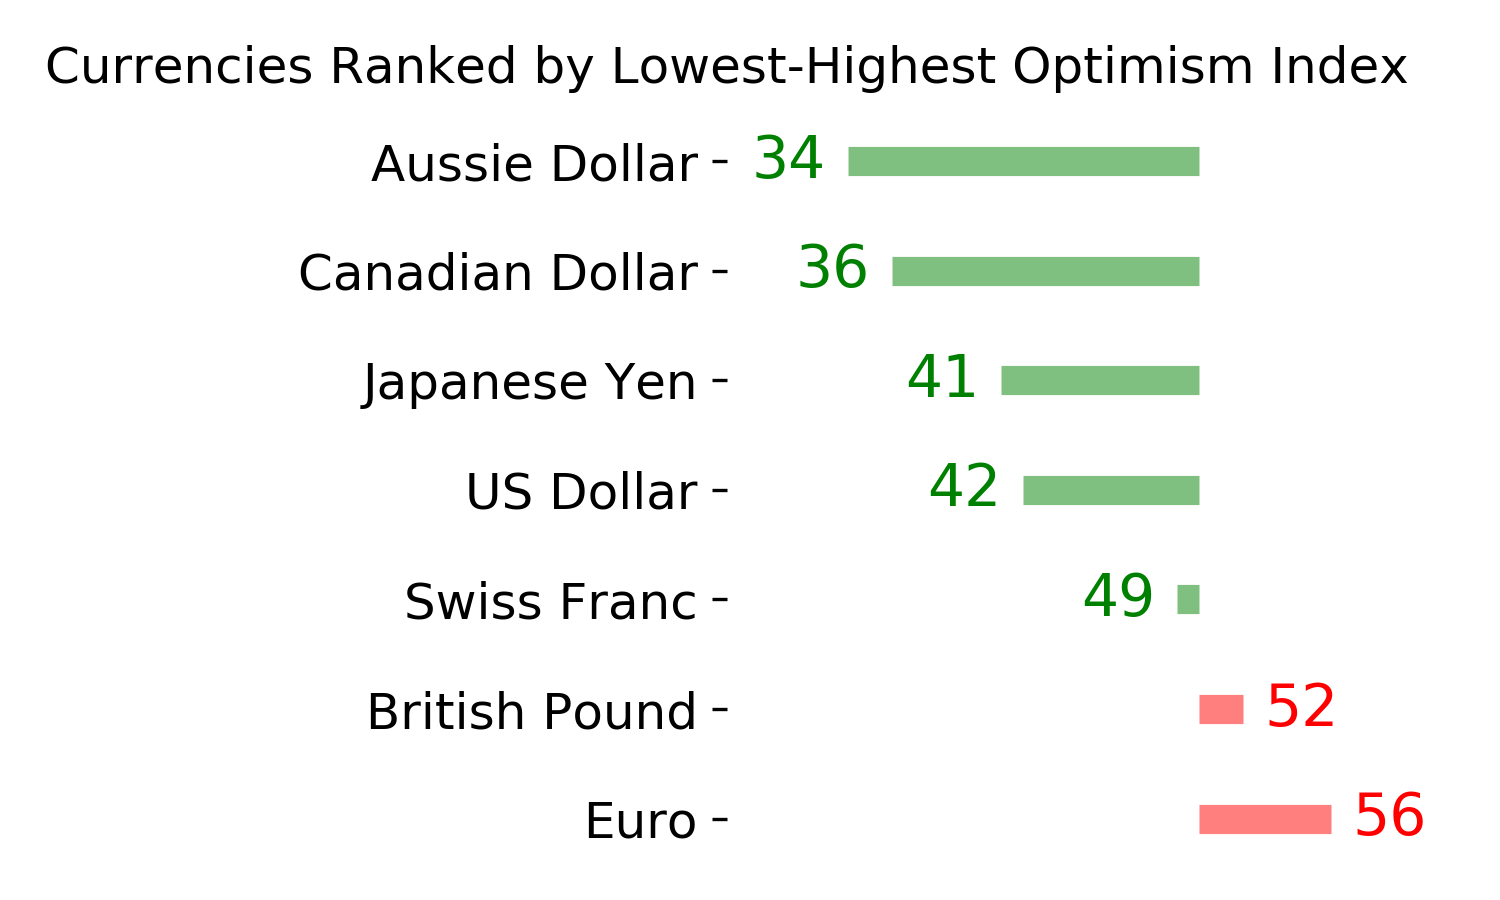
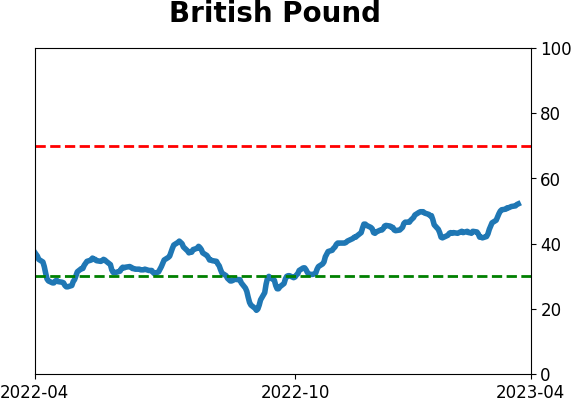
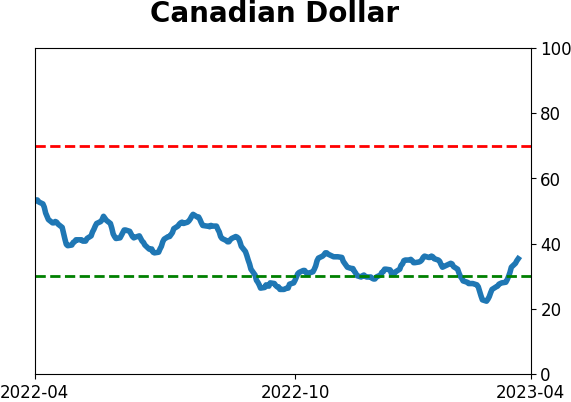
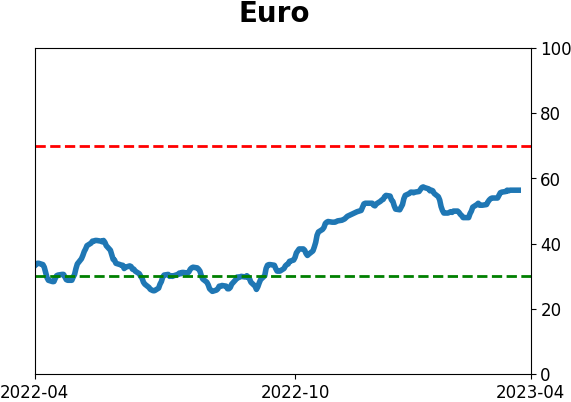
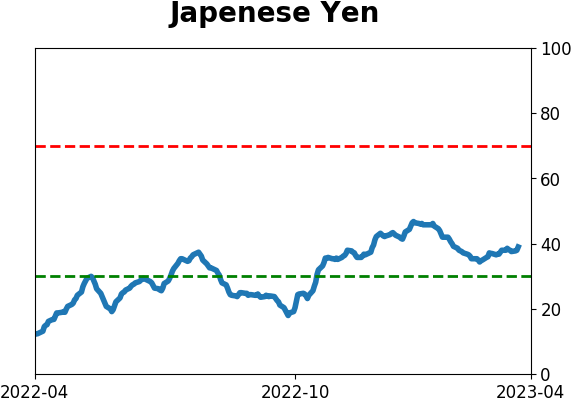
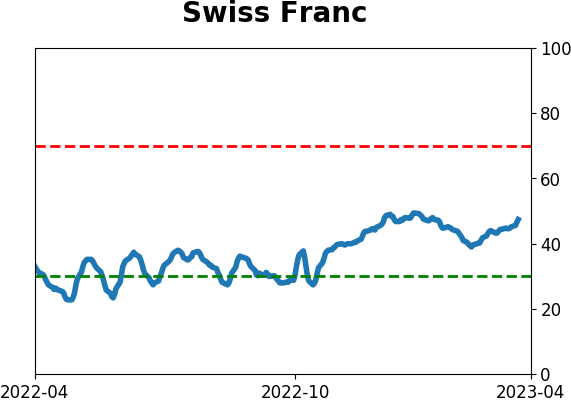
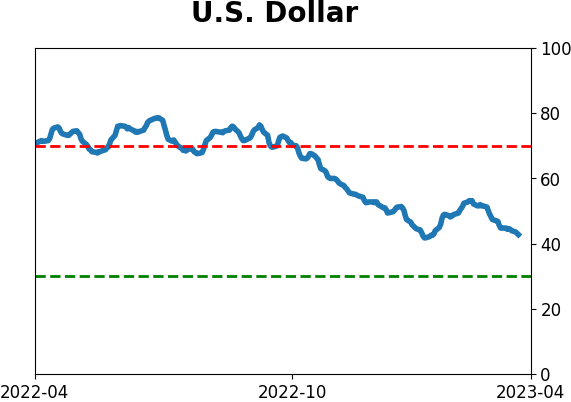
Currency ETF's - 5-Day Moving Average
|
|
|
Commodity ETF's - 5-Day Moving Average
|
|