Headlines
|
|
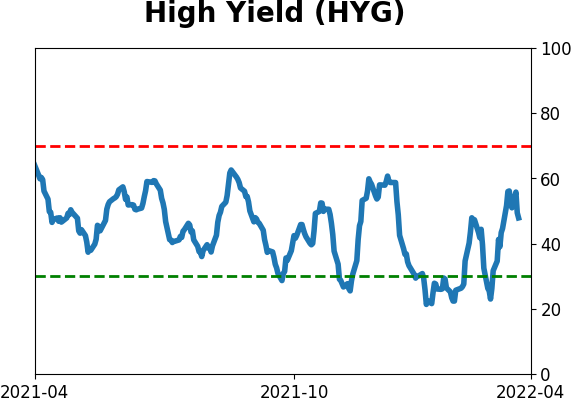
Breadth thrust reaches the high-yield bond market:
Internal momentum in high-yield bonds has surged, with the McClellan Oscillator for that market rising to an extremely high +75. Similar readings led to weak returns in HYG, but strong medium- and long-term ones. It was the same for returns in high-beta stock funds like QQQ, while volatility tended to drop hard.
|
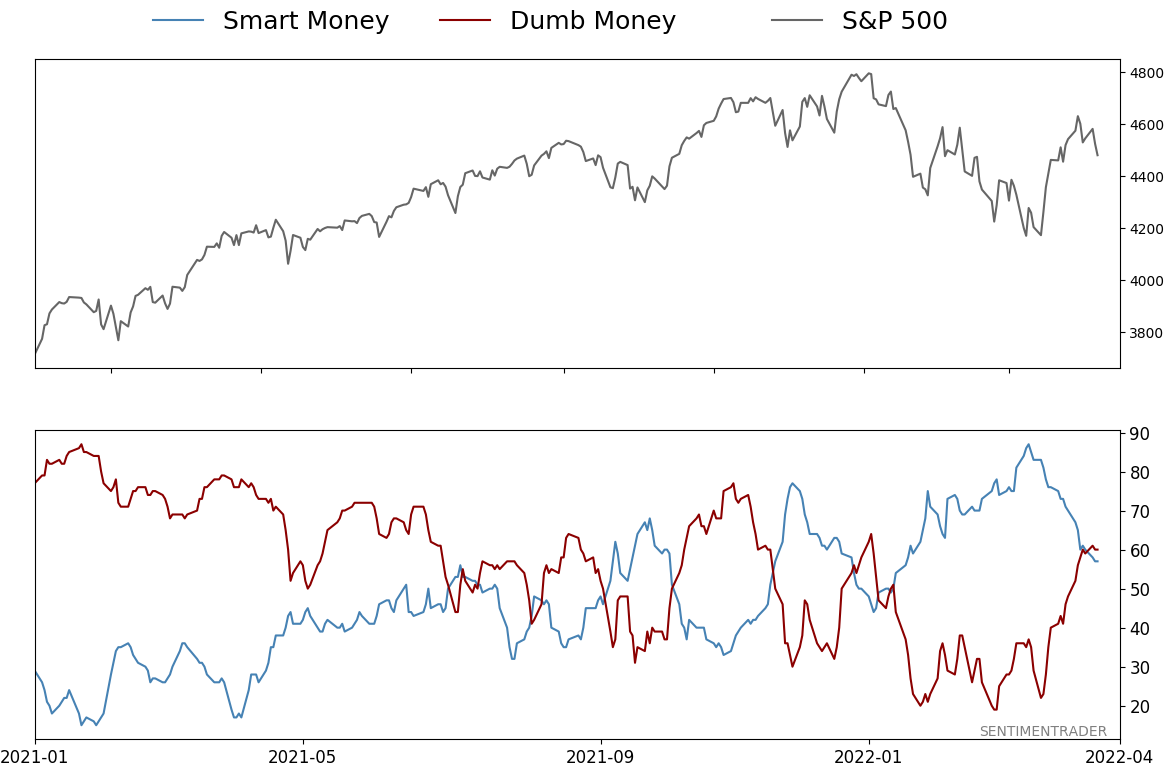
Smart / Dumb Money Confidence
|
Smart Money Confidence: 57%
Dumb Money Confidence: 60%
|
|
Risk Levels
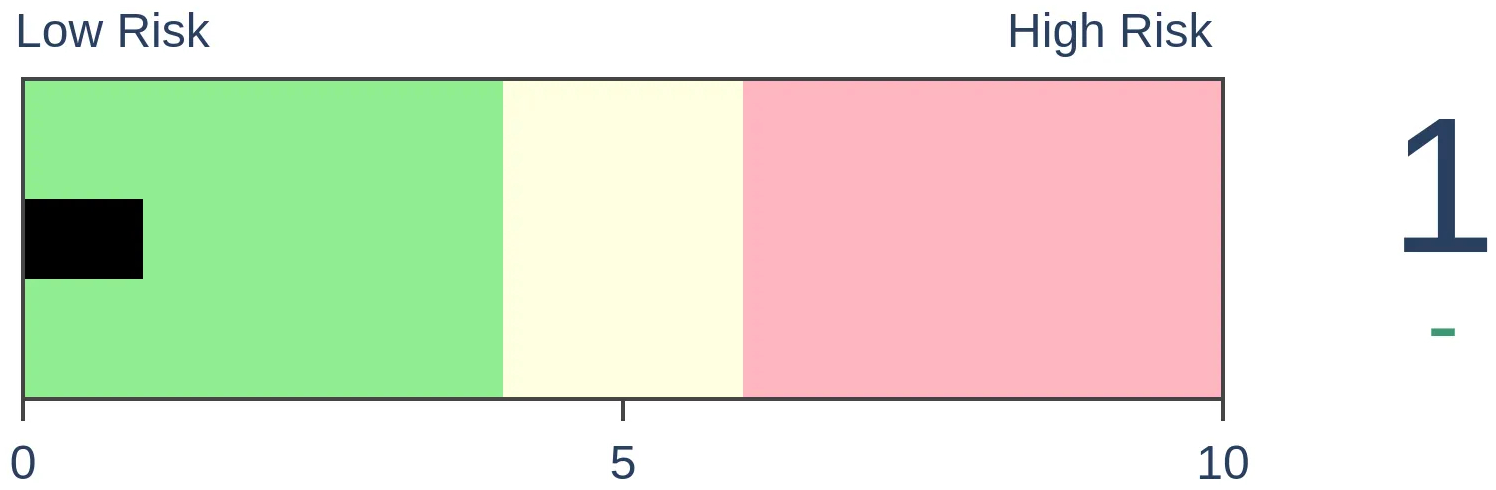
Stocks Short-Term
|
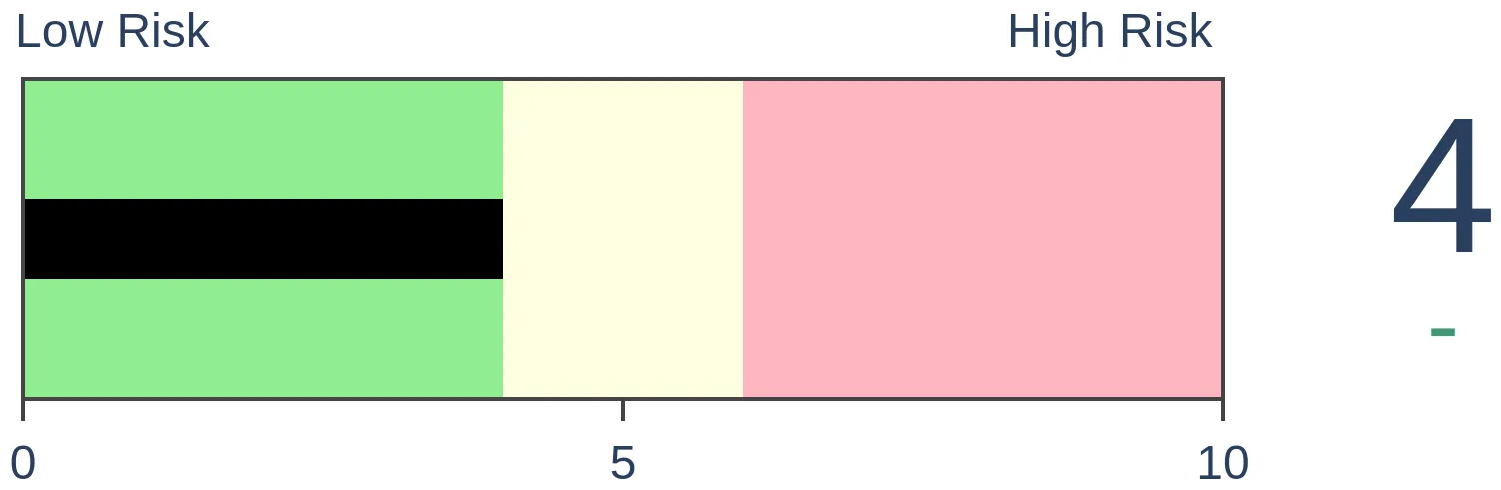
Stocks Medium-Term
|
|
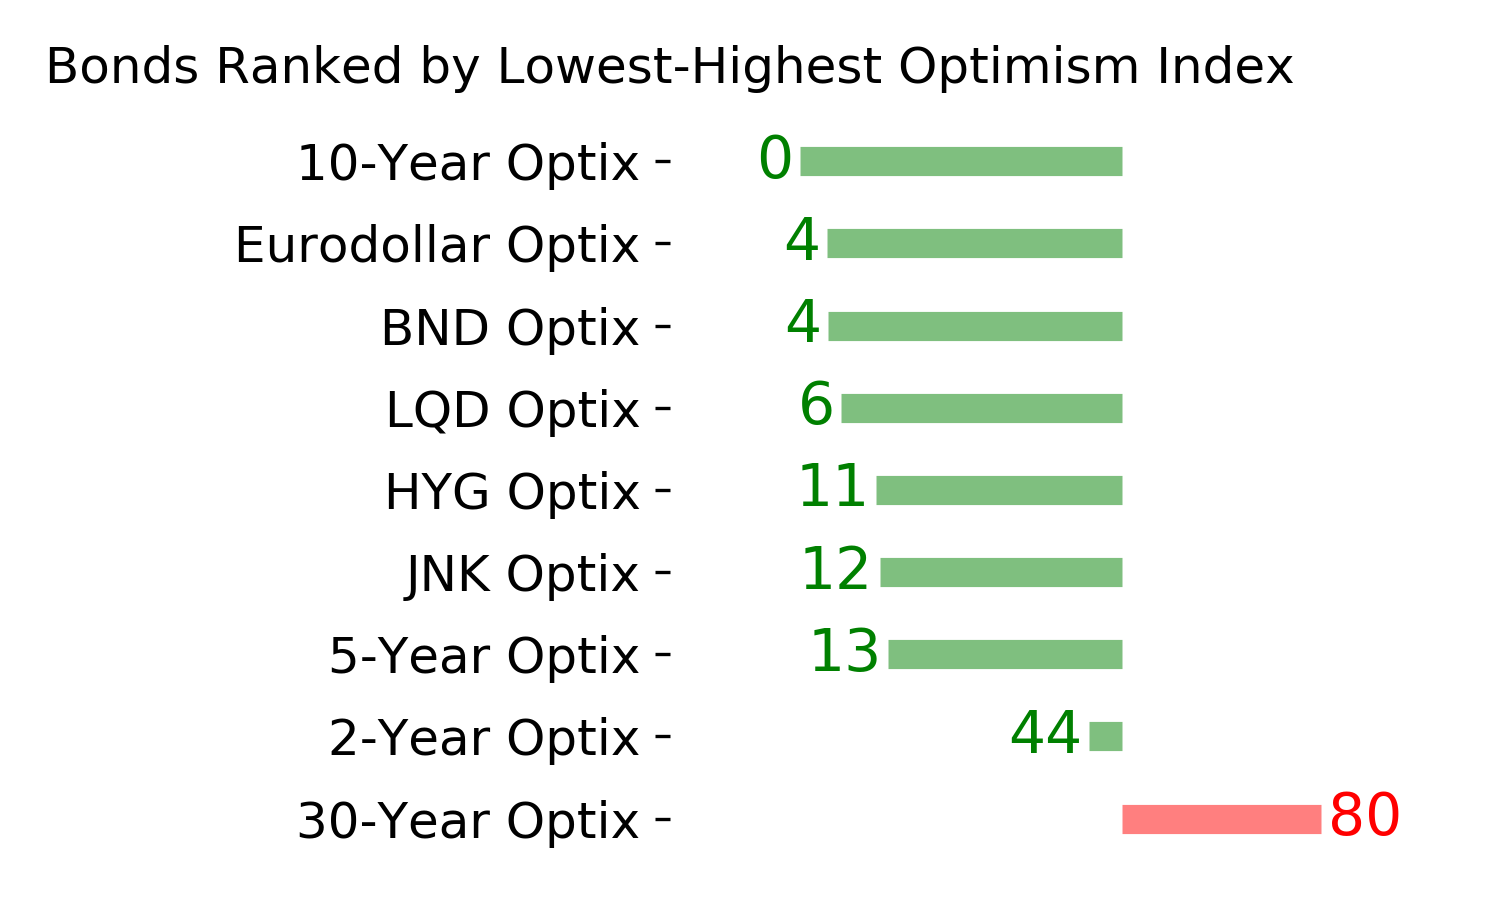
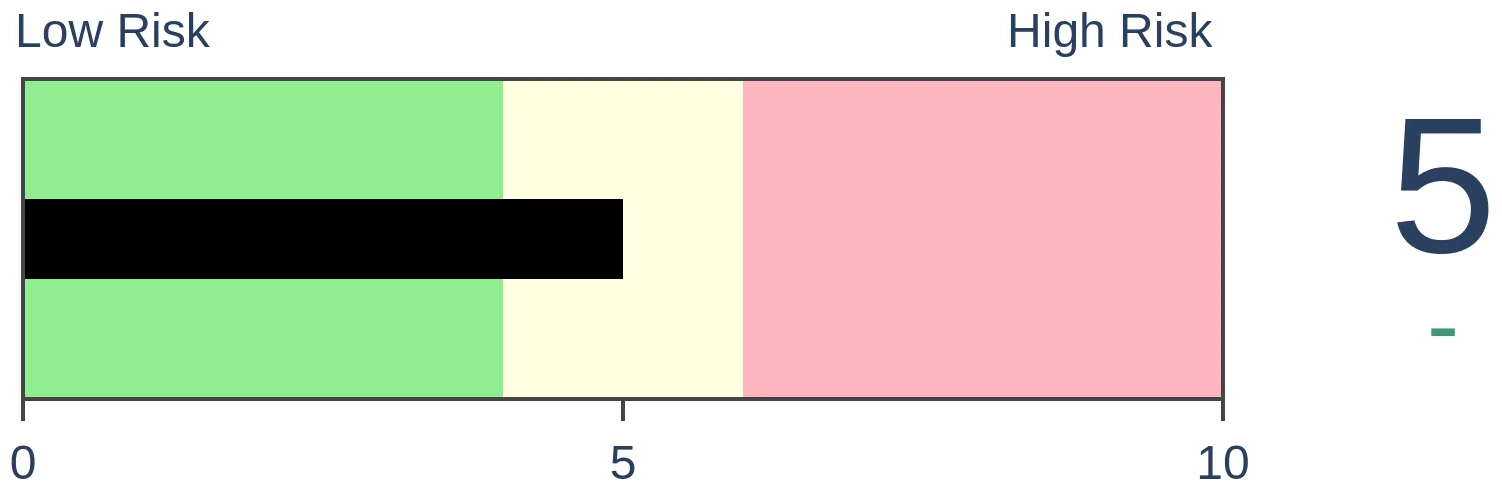
Bonds
|
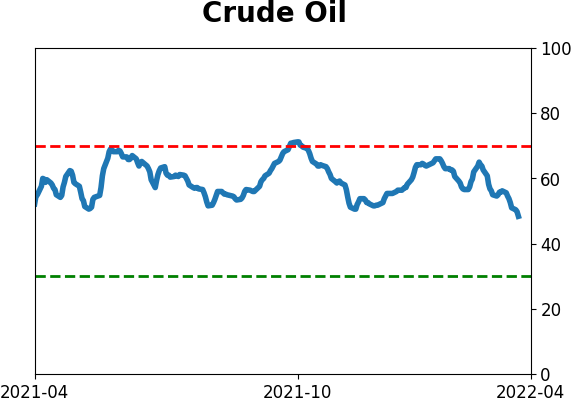
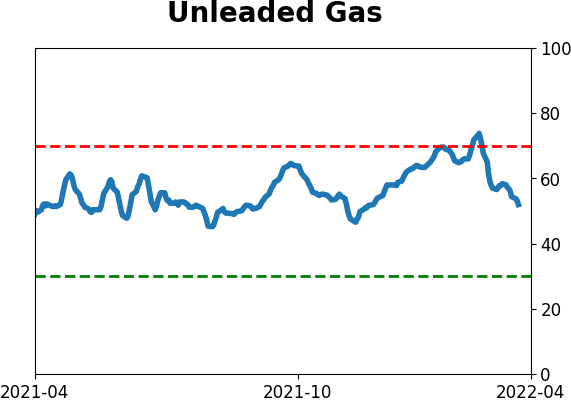
Crude Oil
|
|
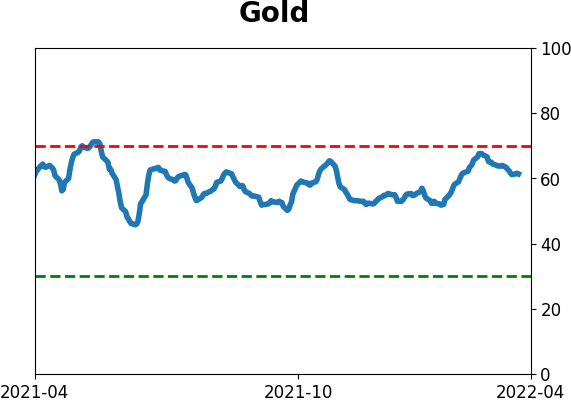
Gold
|
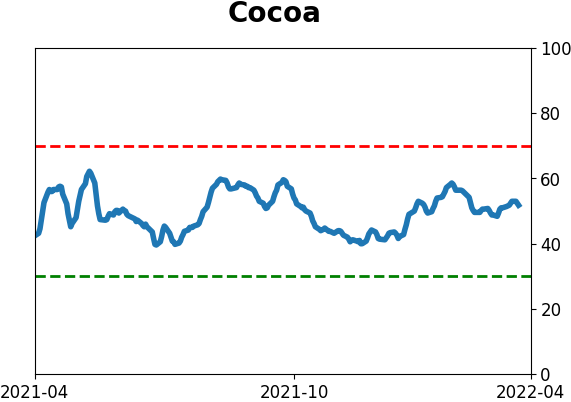
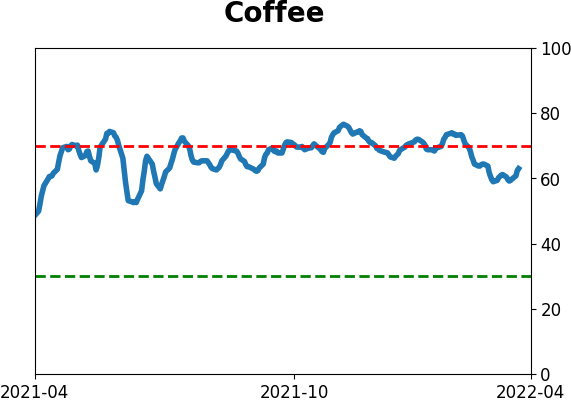
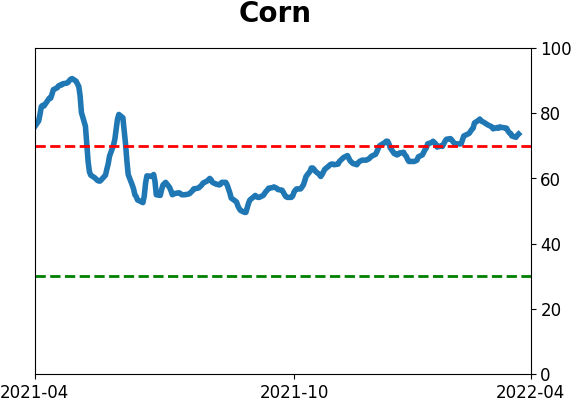
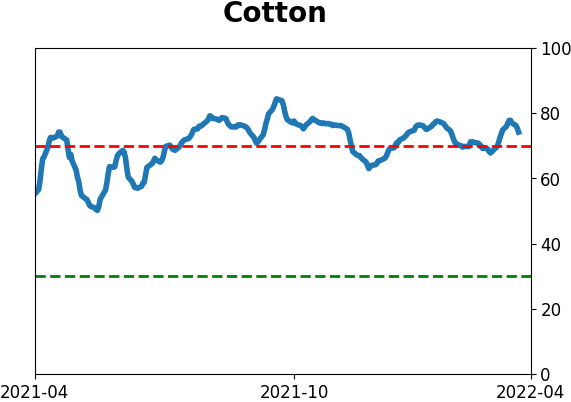
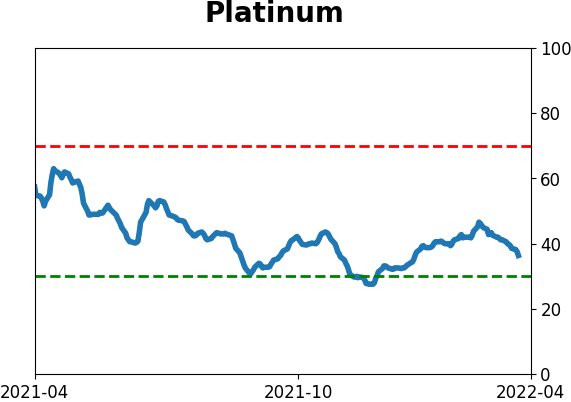
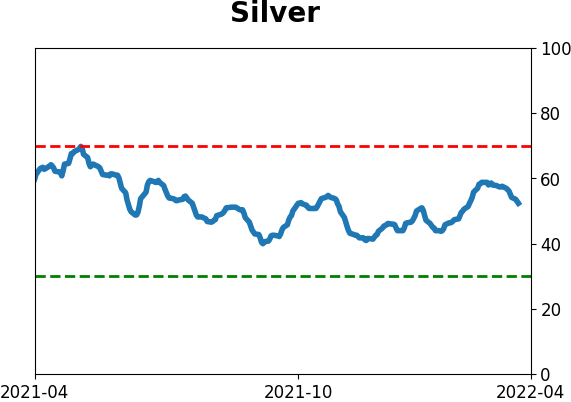
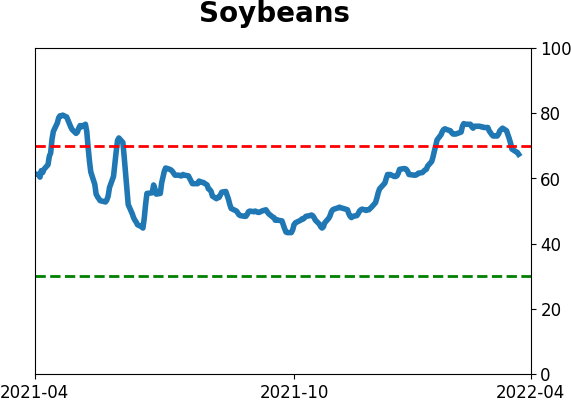
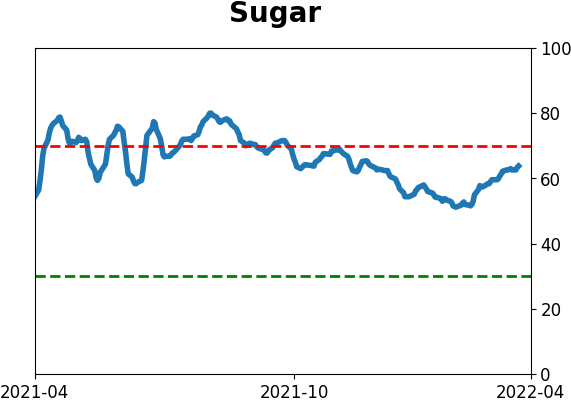
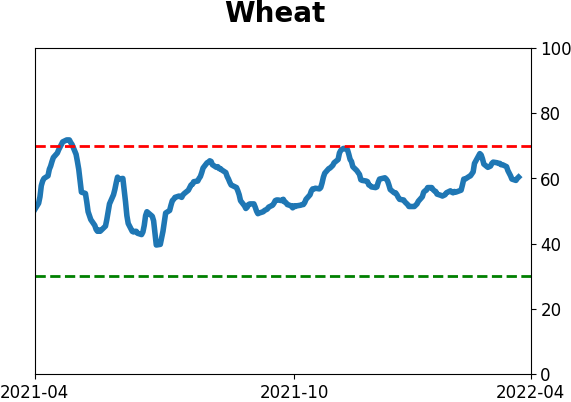
Agriculture

|
|
Research
By Jason Goepfert
BOTTOM LINE
Internal momentum in high-yield bonds has surged, with the McClellan Oscillator for that market rising to an extremely high +75. Similar readings led to weak returns in HYG, but strong medium- and long-term ones. It was the same for returns in high-beta stock funds like QQQ, while volatility tended to drop hard.
FORECAST / TIMEFRAME
HYG -- Down, Short-Term
|
Key points:
- The McClellan Oscillator for high-yield bonds has surged to an extremely high level
- Similar displays of internal momentum preceded weak short-term returns but strong medium-term ones
- High-beta funds like QQQ, IBB, and EEM also did well, as the VIX tended to drop hard
A surge in high-yield internal momentum
We've looked at breadth thrusts a lot in recent weeks, including surges in the McClellan Oscillator for the S&P 500 and the entire Nasdaq exchange.
It's not just in stocks; it's also happening in the high-yield bond market, an important development. We already saw that the market was oversold, with heavy and persistent selling. It has tried to recover over the last couple of weeks and has been relatively successful. While there are still fewer bonds rising to 52-week highs than falling to 52-week lows, a major no-no, there are some nascent signs of recovery.
As we saw in the S&P 500 and Nasdaq, the McClellan Oscillator for the high-yield bond market has surged. The indicator looks at the spread between short- and medium-term moving averages of the net number of advancing high-yield bonds each day. It just hit +75 for only the 3rd distinct time in the past 5 years.
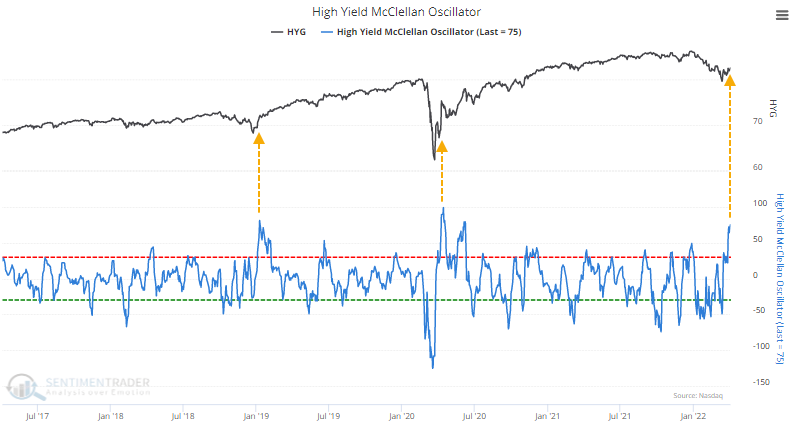
The Backtest Engine shows that since the inception of the data, which unfortunately is only 15 years ago, there have been 29 days when the Oscillator reached this high of a level. The iShares iBoxx High-Yield Corporate Bond Fund (HYG) showed consistently weak short-term returns as buyers took a breath. But by 2 months later, the momentum reasserted itself, and returns were exceptional in the months following. Granted, most of the study period was dominated by healthy market environments.

The high-yield bond market has a high correlation to the stock market. If we substitute the S&P 500 for HYG in the backtest, we can see similar behavior in that index. The S&P struggled in the short-term but showed impressive medium to long-term returns.

High-beta funds tended to do well, volatility funds not so much
According to Bloomberg calculations on a list of popular ETFs and indexes, the most positive 3-month correlations to HYG are mostly higher-beta stock funds. Funds with a correlation higher than +0.65 include popular ones like QQQ, IBB, and EEM.

Using the Backtest Engine to test surges in the high-yield Oscillator against the QQQ Nasdaq 100 tech fund, returns were very weak short-term but exceptional from 3-months and beyond.

We can see similar behavior in biotechnology funds like IBB.

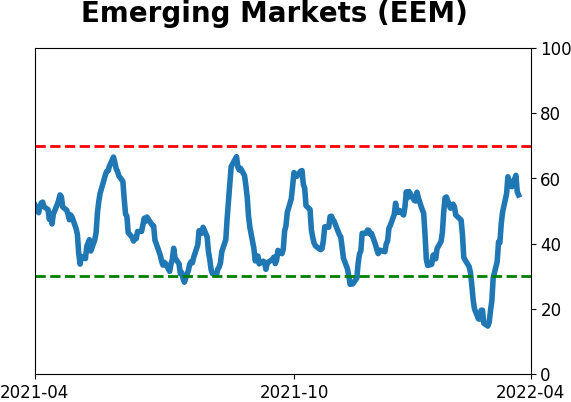
Emerging markets also had a high positive correlation. While EEM didn't suffer as much short-term, medium- and long-term returns were fantastic.

The table below shows funds with the most negative 3-month correlations to HYG. It's dominated by volatility funds, which struggle even in the best of times, but when stocks rally, volatility tends to contract, and these funds burn money.

Indeed, the VIX performed very poorly. Only a single day out of 38 total managed a positive return 6 months later, and that was a low 2%.

What the research tells us...
It's important for stock investors to see positive momentum in the high-yield bond market. We've witnessed the first signs of that, but that has typically preceded a short-term pullback as buyers retrench. While history is limited, other times we've seen this kind of surge among high-yield bonds, any short-term retracement tended to be a strong buying opportunity for medium- to long-term investors in funds like HYG, SPY, QQQ, IBB, and EEM.
Active Studies
| Time Frame | Bullish | Bearish | | Short-Term | 4 | 0 | | Medium-Term | 25 | 3 | | Long-Term | 17 | 5 |
|
Indicators at Extremes
Portfolio
| Position | Description | Weight % | Added / Reduced | Date | | Stocks | 21.6% RSP, 5.1% IEMG | 26.7 | Added 5.3% | 2022-03-18 | | Bonds | 32.7% BND, 7.1% SCHP | 40.1 | Added 8.3% | 2021-10-26 | | Commodities | GCC | 2.4 | Reduced 2.1%
| 2020-09-04 | | Precious Metals | GDX | 4.6 | Reduced 4.2% | 2021-05-19 | | Special Situations | 7.6% KWEB, 4.9% XBI, 3.7% XLE, 1.8% PSCE | 18.0 | Added 4.6% | 2022-02-24 | | Cash | | 7.9 | | |
|
Updates (Changes made today are underlined)
We had a volatile few weeks into mid-March, and it was enough to trigger a number of extremes. Most of the studies we've looked at have had a clear bullish edge over a multi-month time frame. I'd typically be more proactive instead of reactive with changes in positions, adding exposure into weakness instead of strength, but during an unhealthy environment like we're in, I tend to be more conservative. I did add some exposure to emerging markets, choosing a fund with the least exposure to China, since I already have exposure there with KWEB. It's still heavily weighted to that market. The only other times the MSCI Emerging Markets Index has had a weekly reversal like this week were October 2008, October 2011, and August 2015, all leading to long-term gains. RETURN YTD: -0.3% 2021: +8.7%, 2020: +8.1%, 2019: +12.6%, 2018: +0.6%, 2017: +3.8%, 2016: +17.1%, 2015: +9.2%, 2014: +14.5%, 2013: +2.2%, 2012: +10.8%, 2011: +16.5%, 2010: +15.3%, 2009: +23.9%, 2008: +16.2%, 2007: +7.8%
|
|
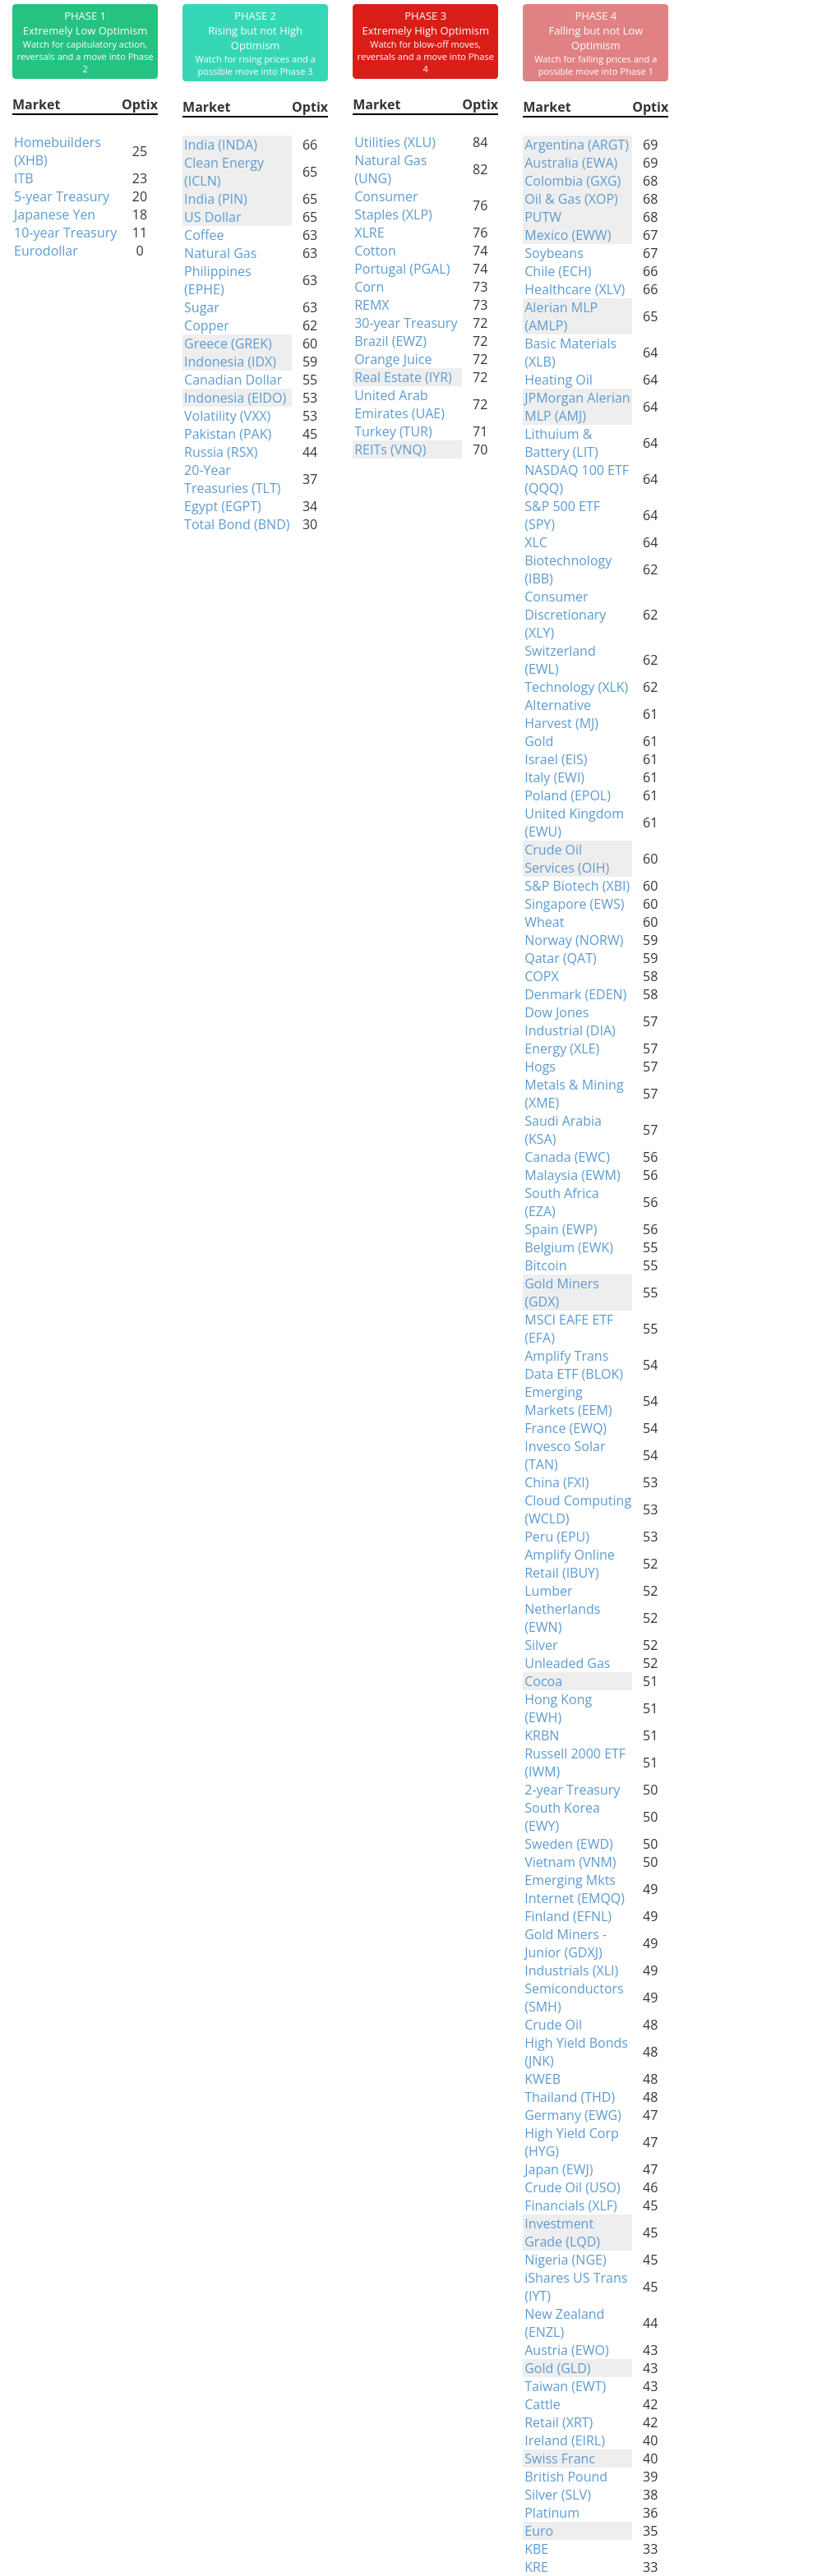
Phase Table
Ranks
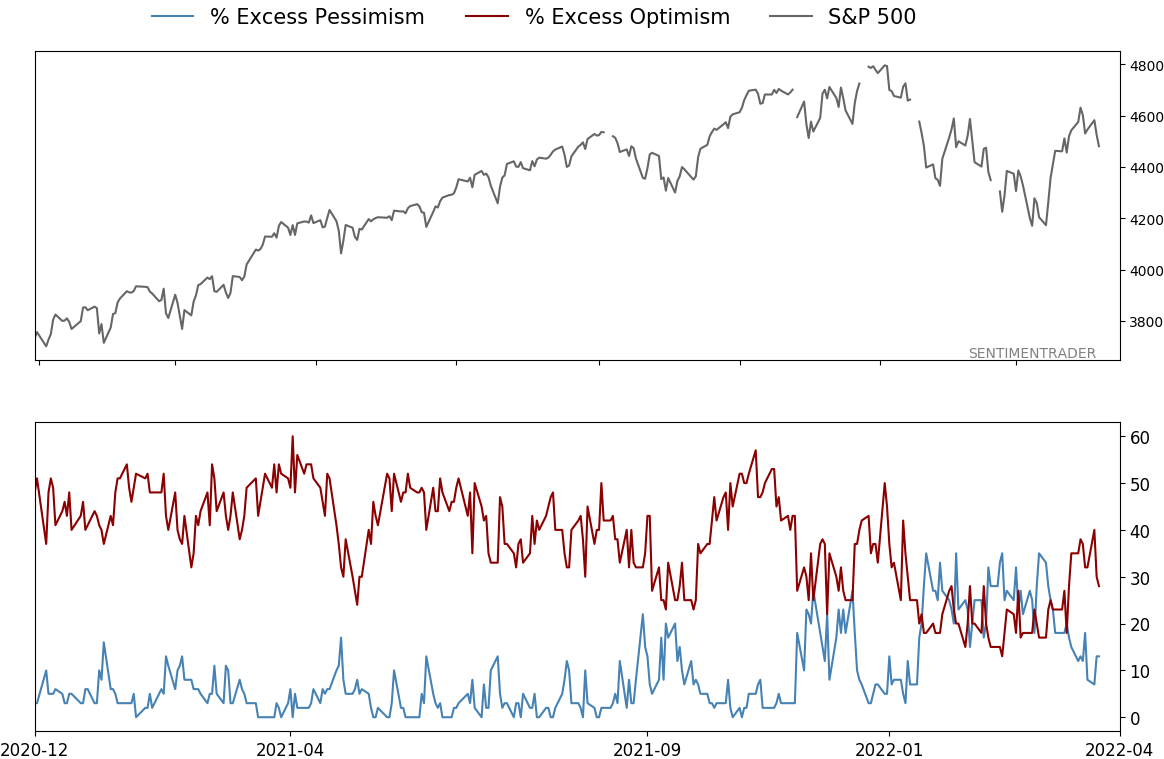
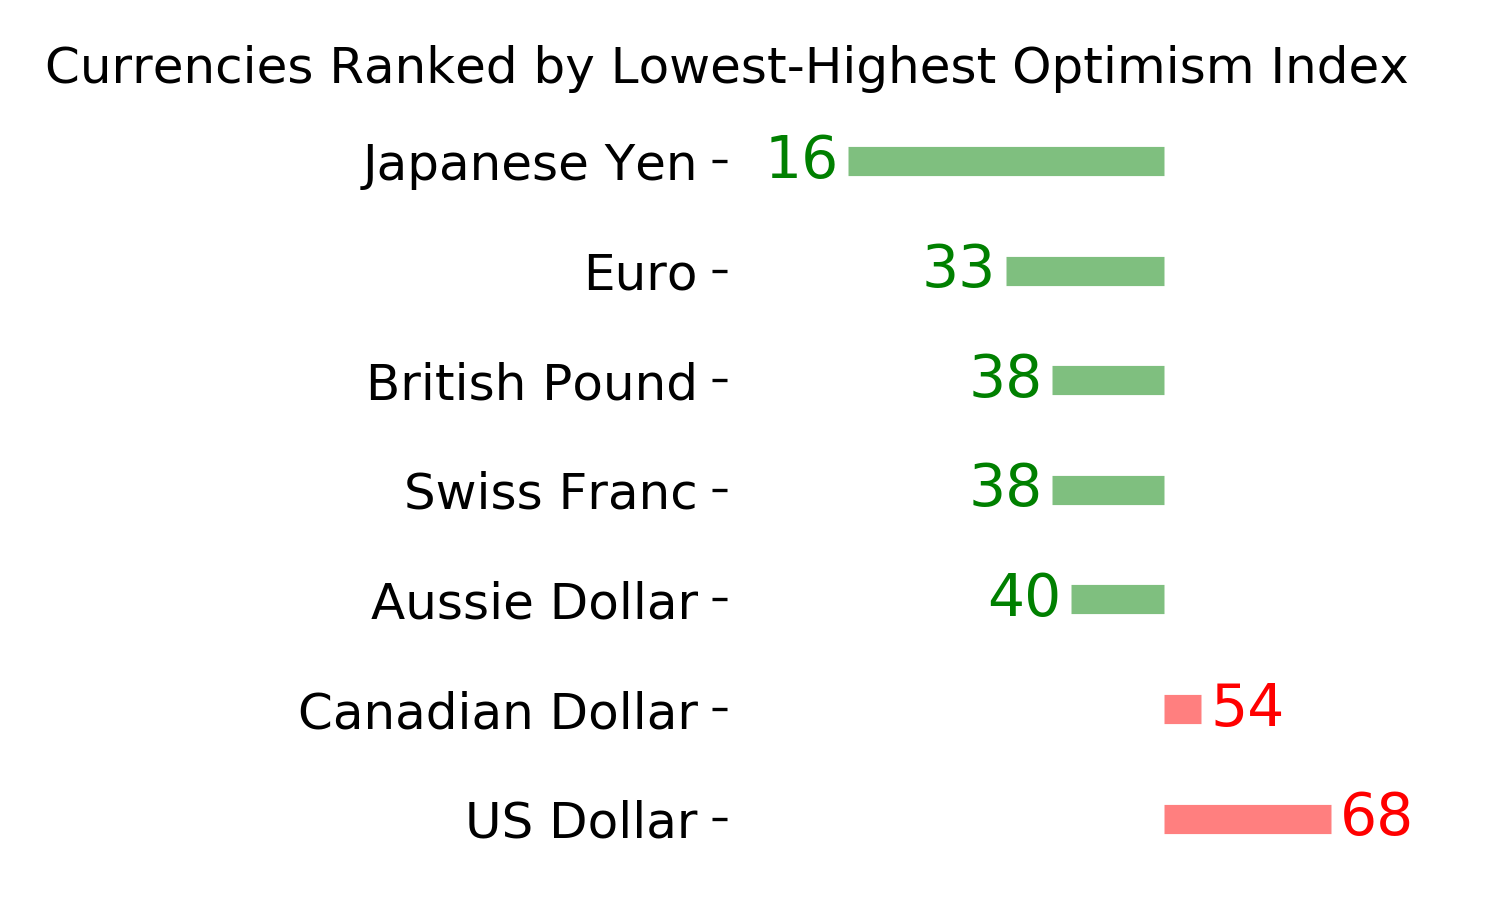
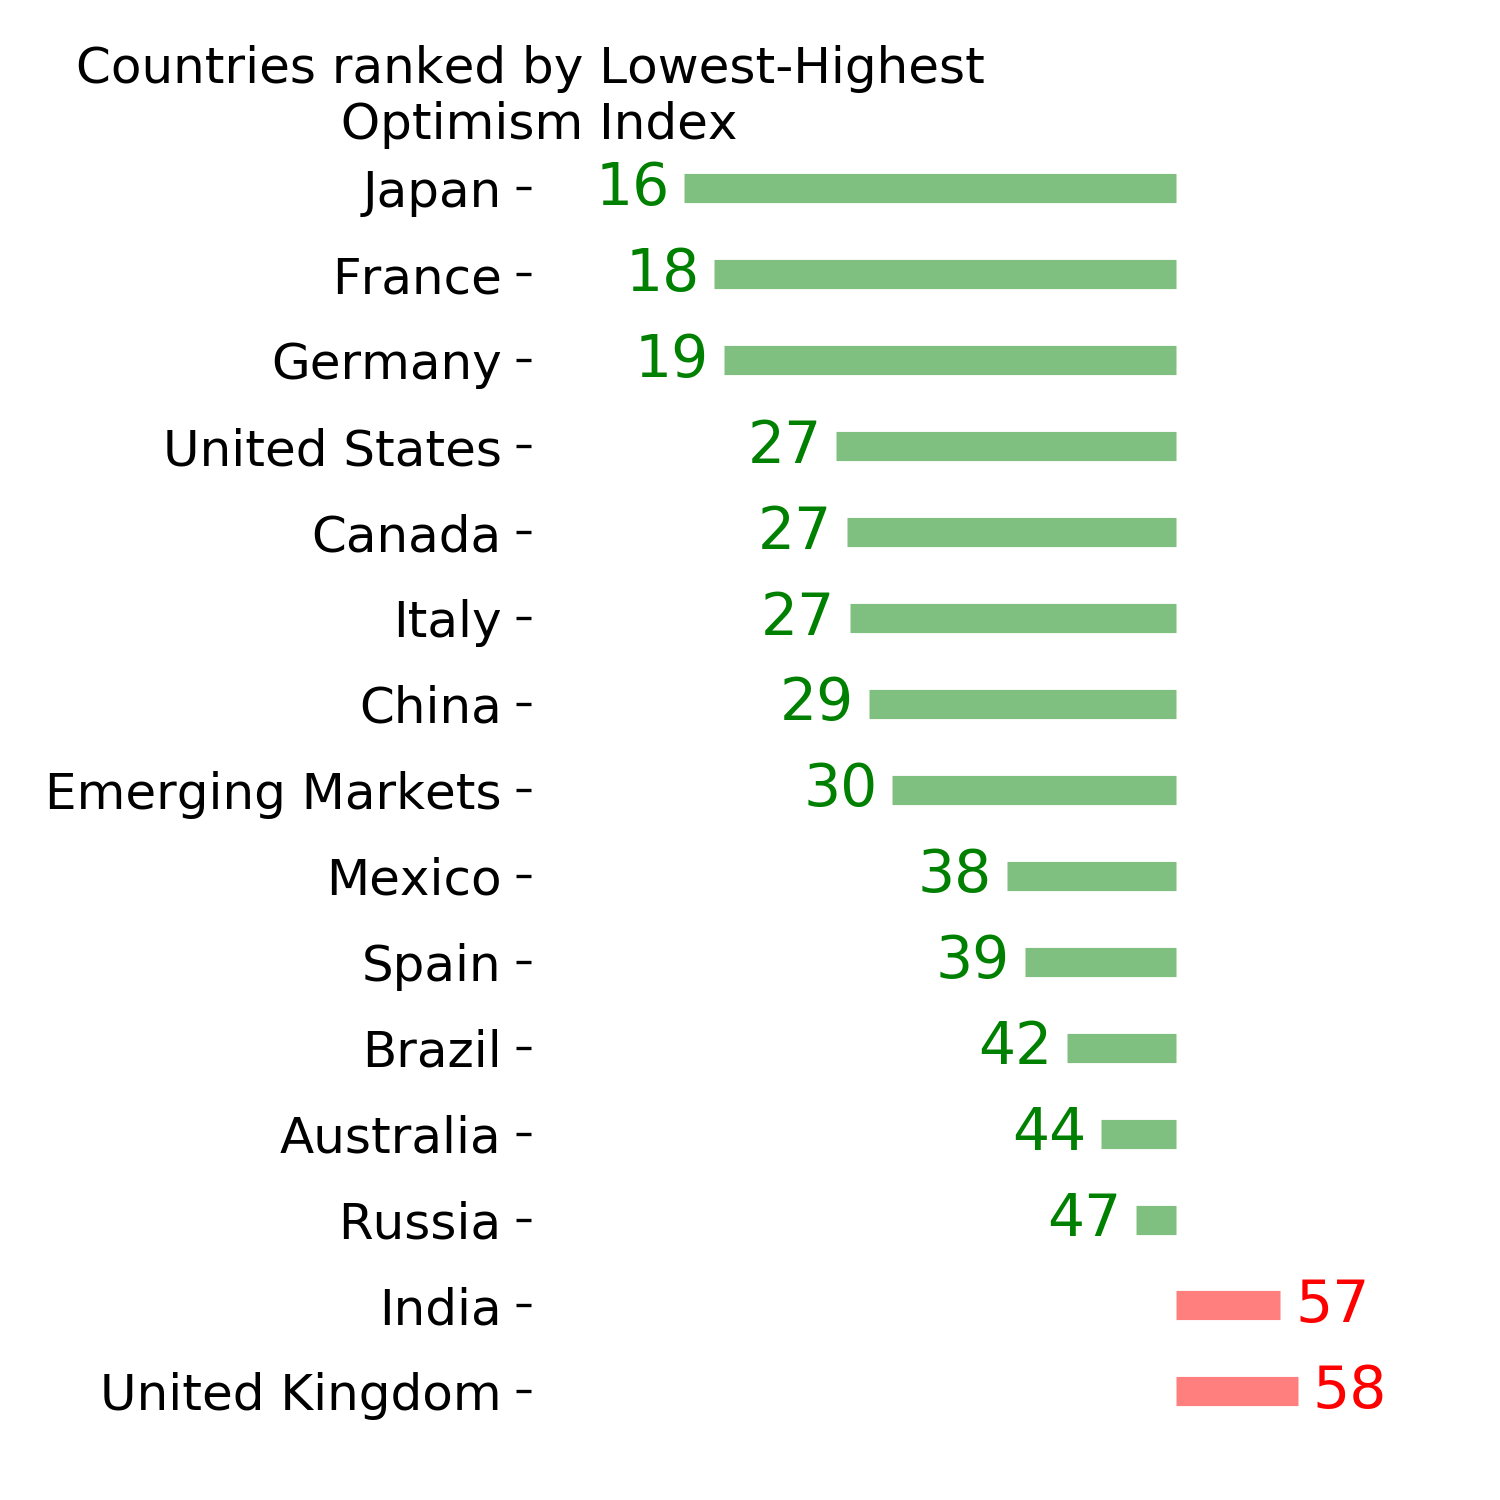
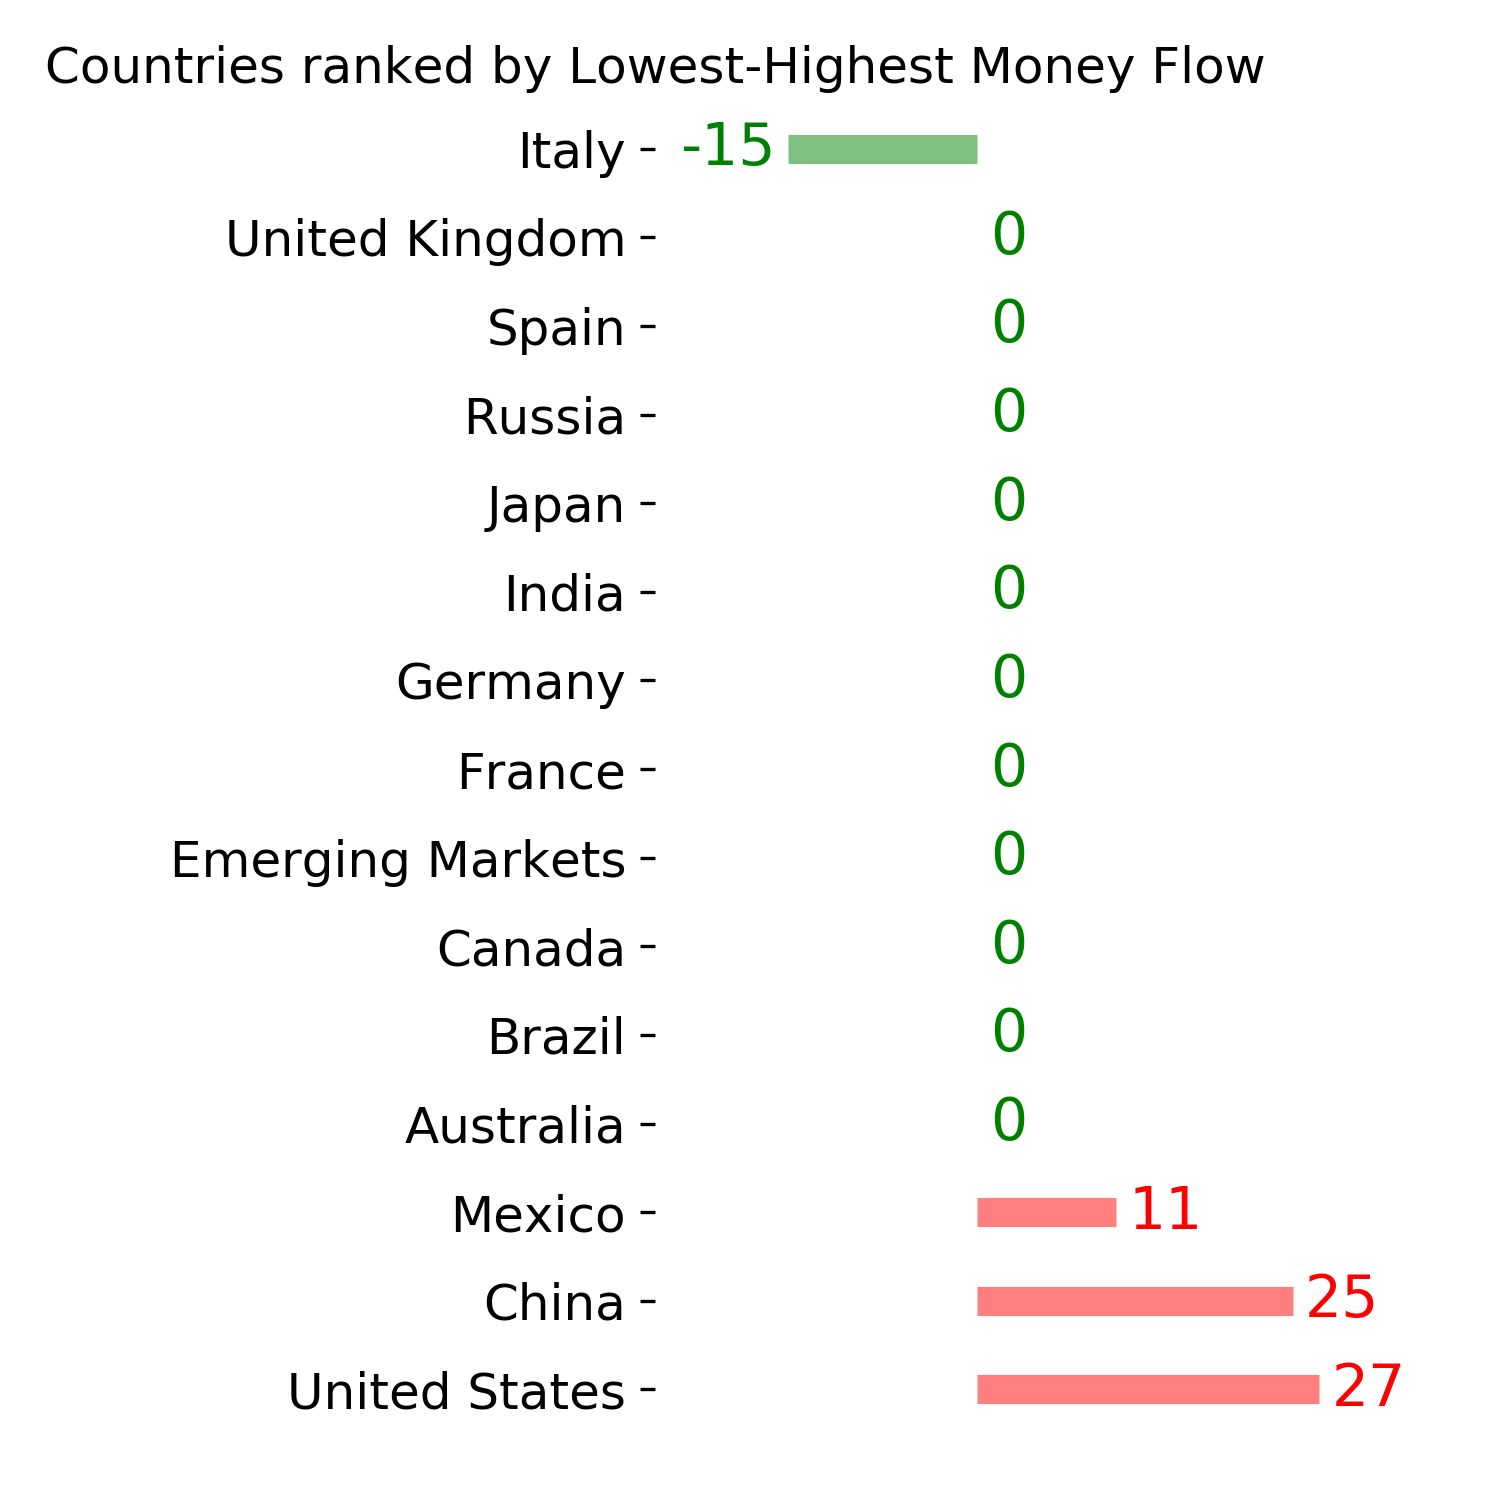
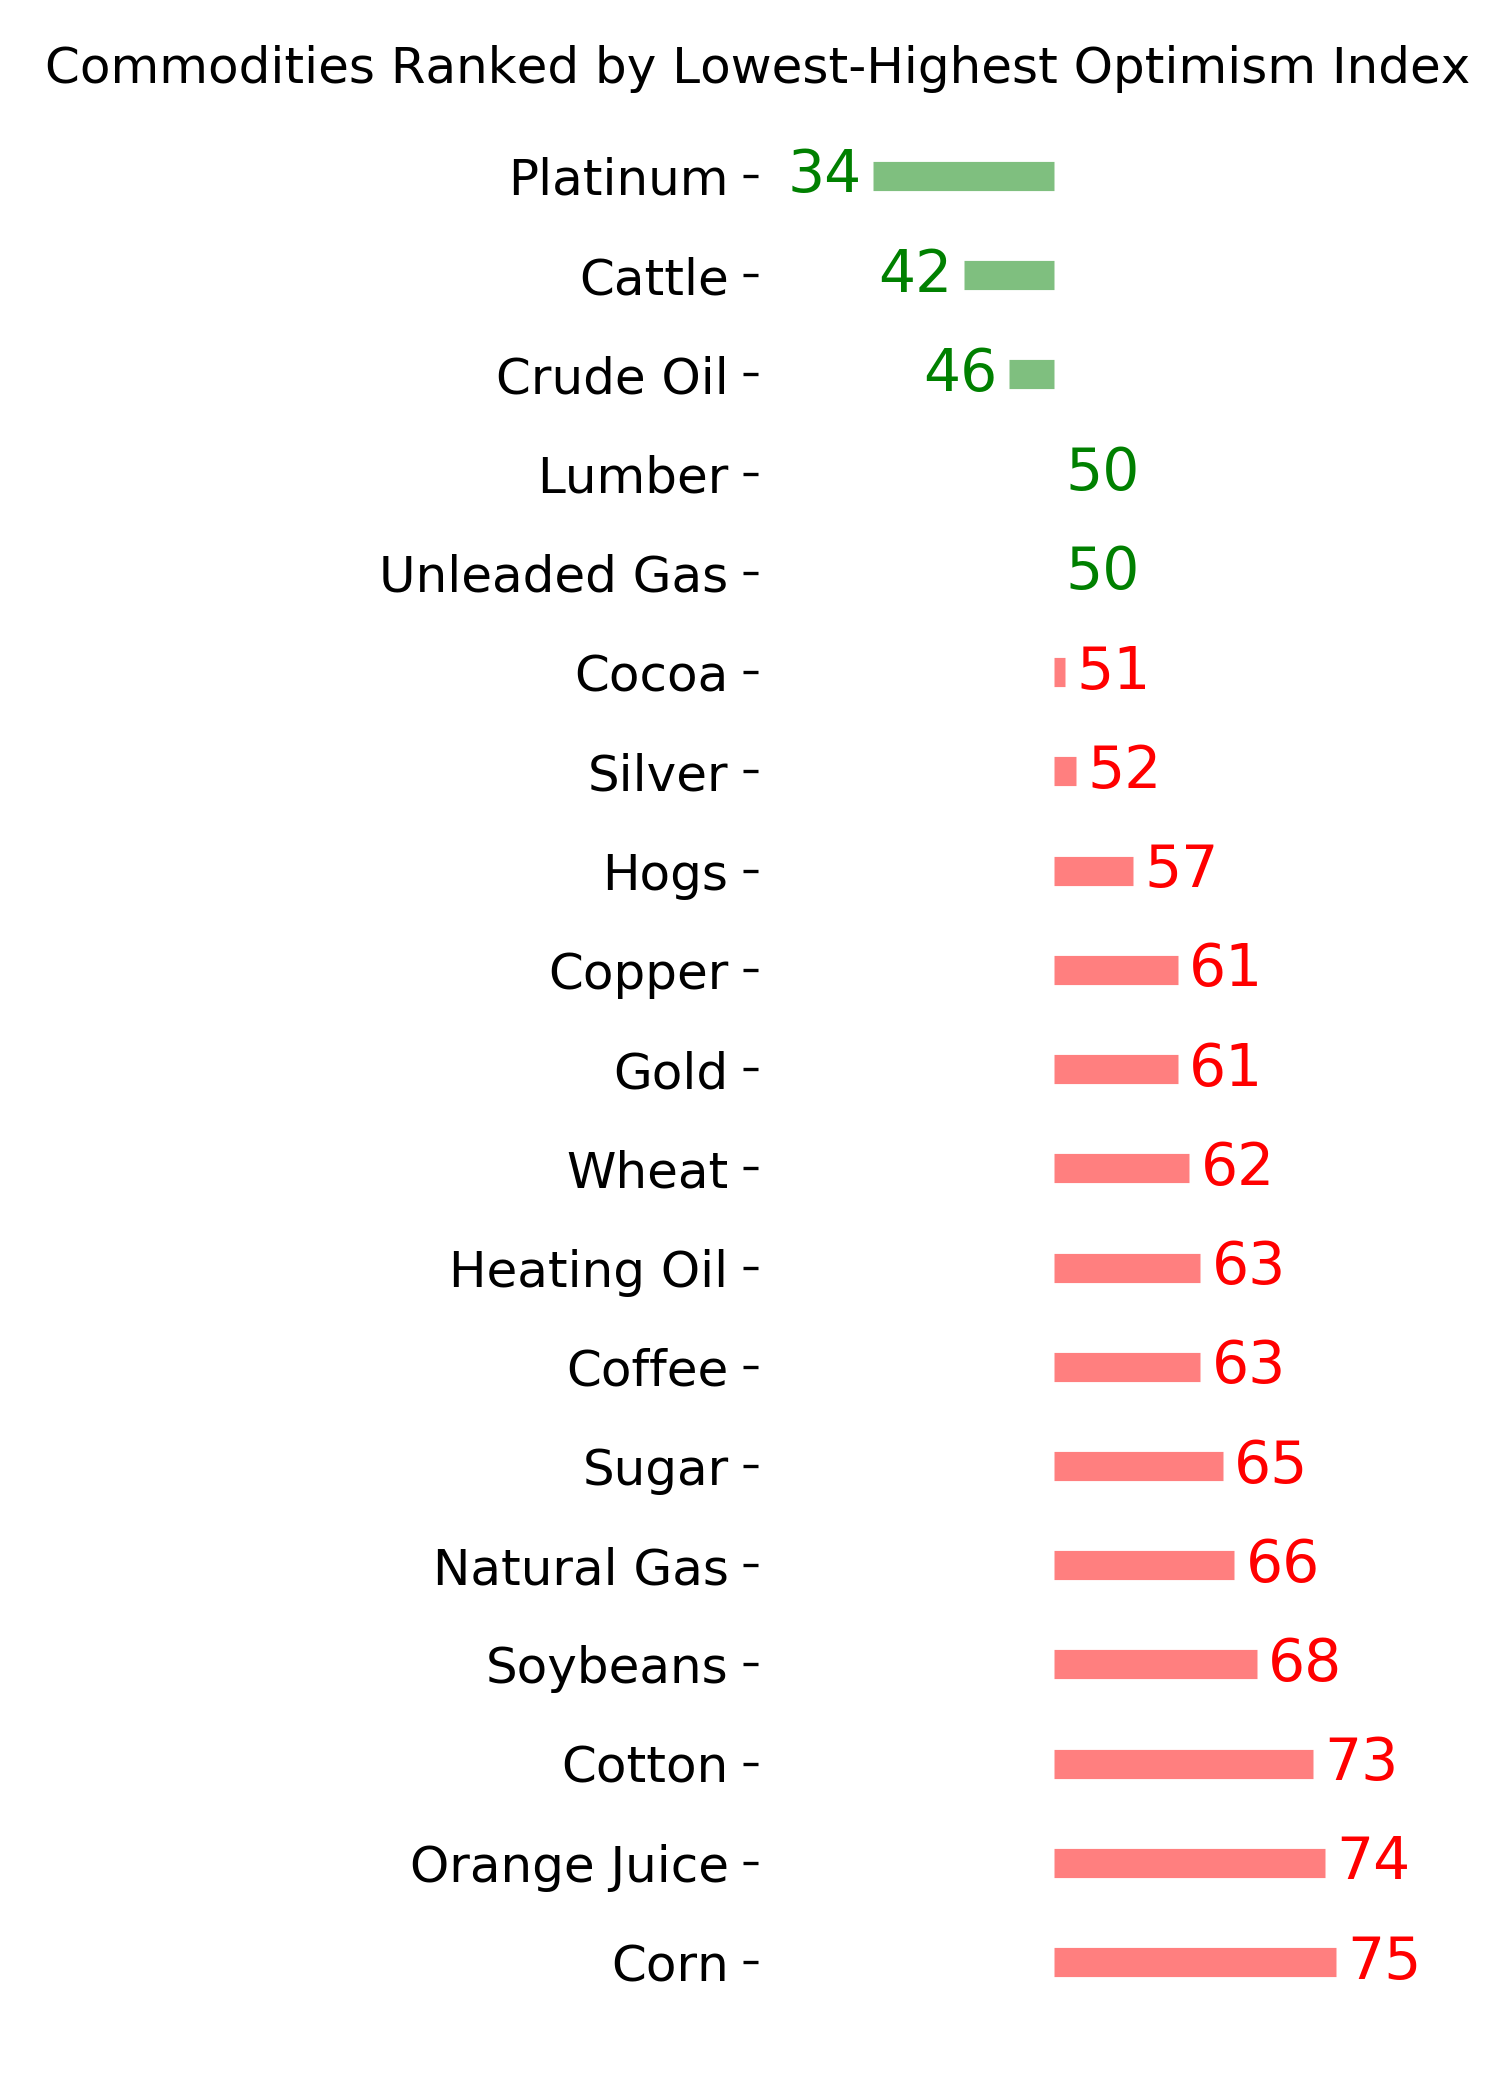
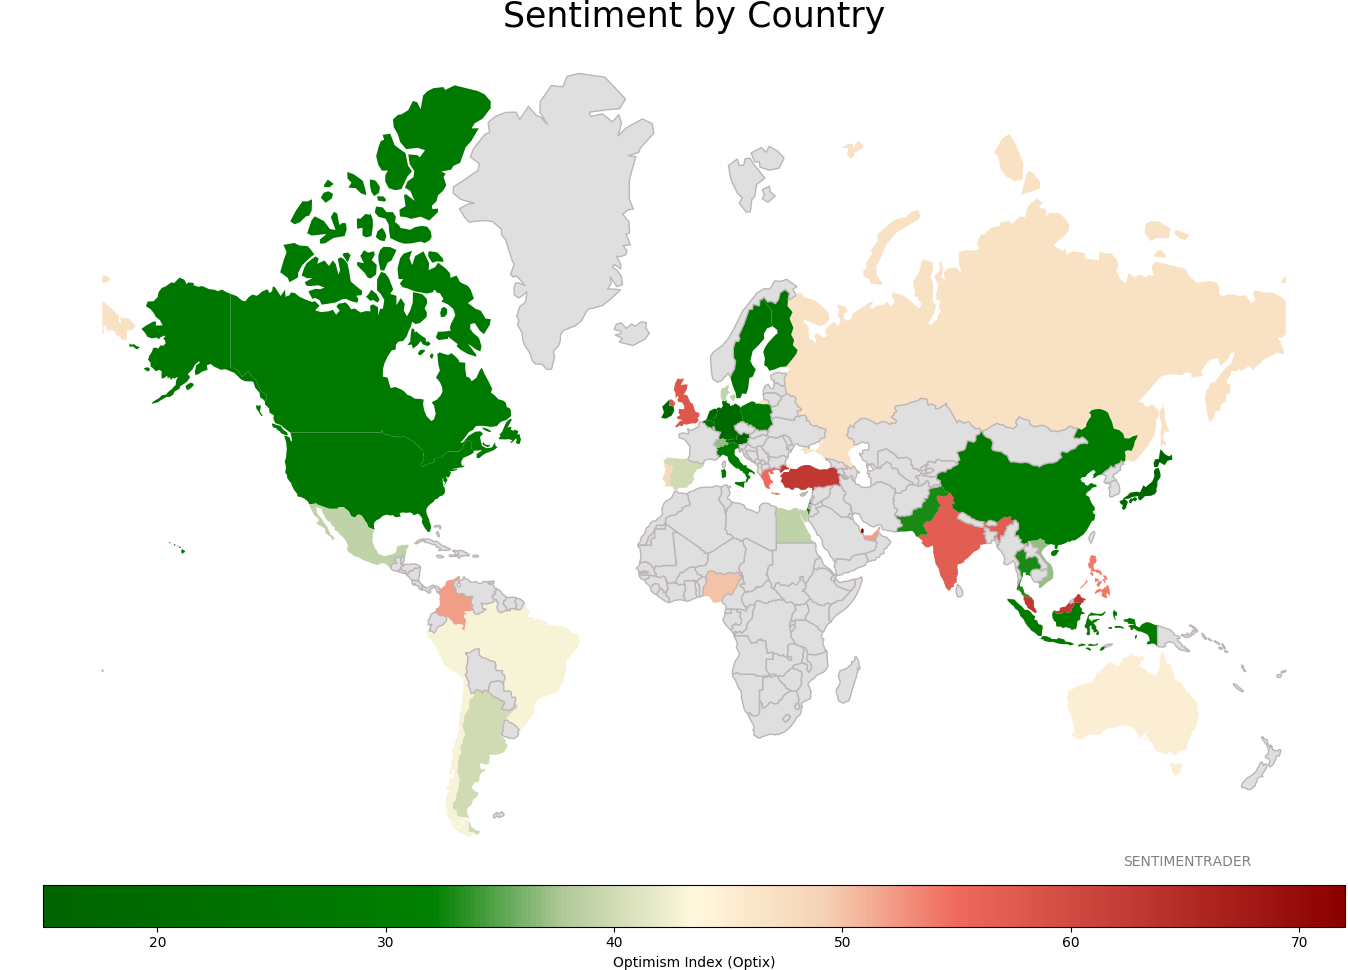
Sentiment Around The World
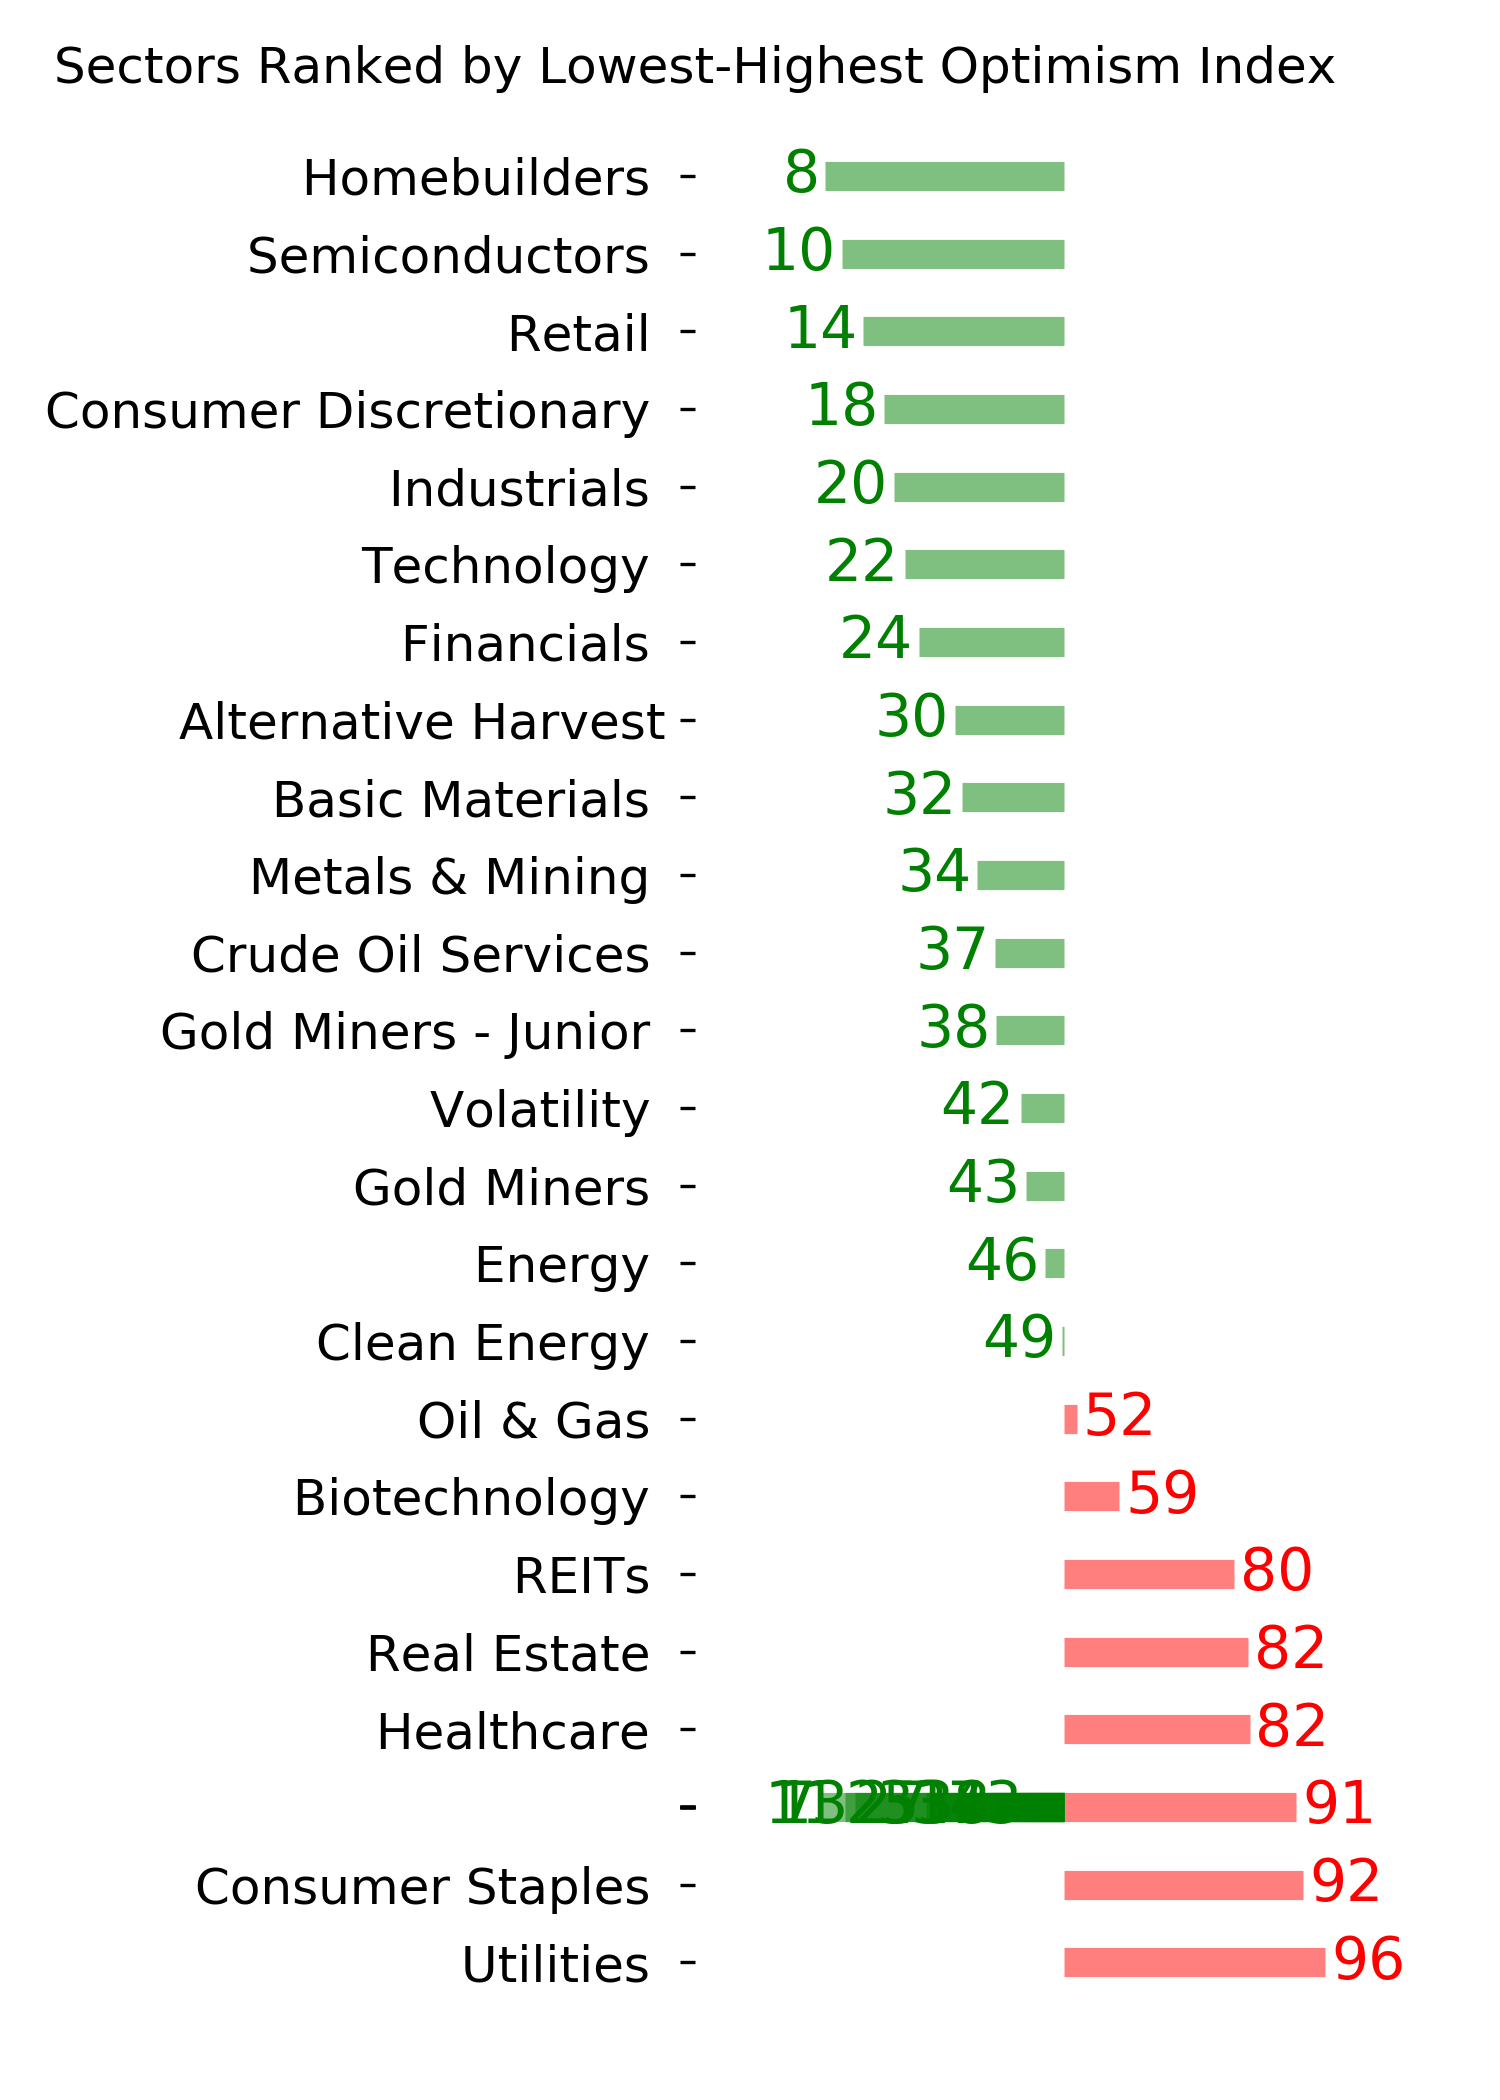
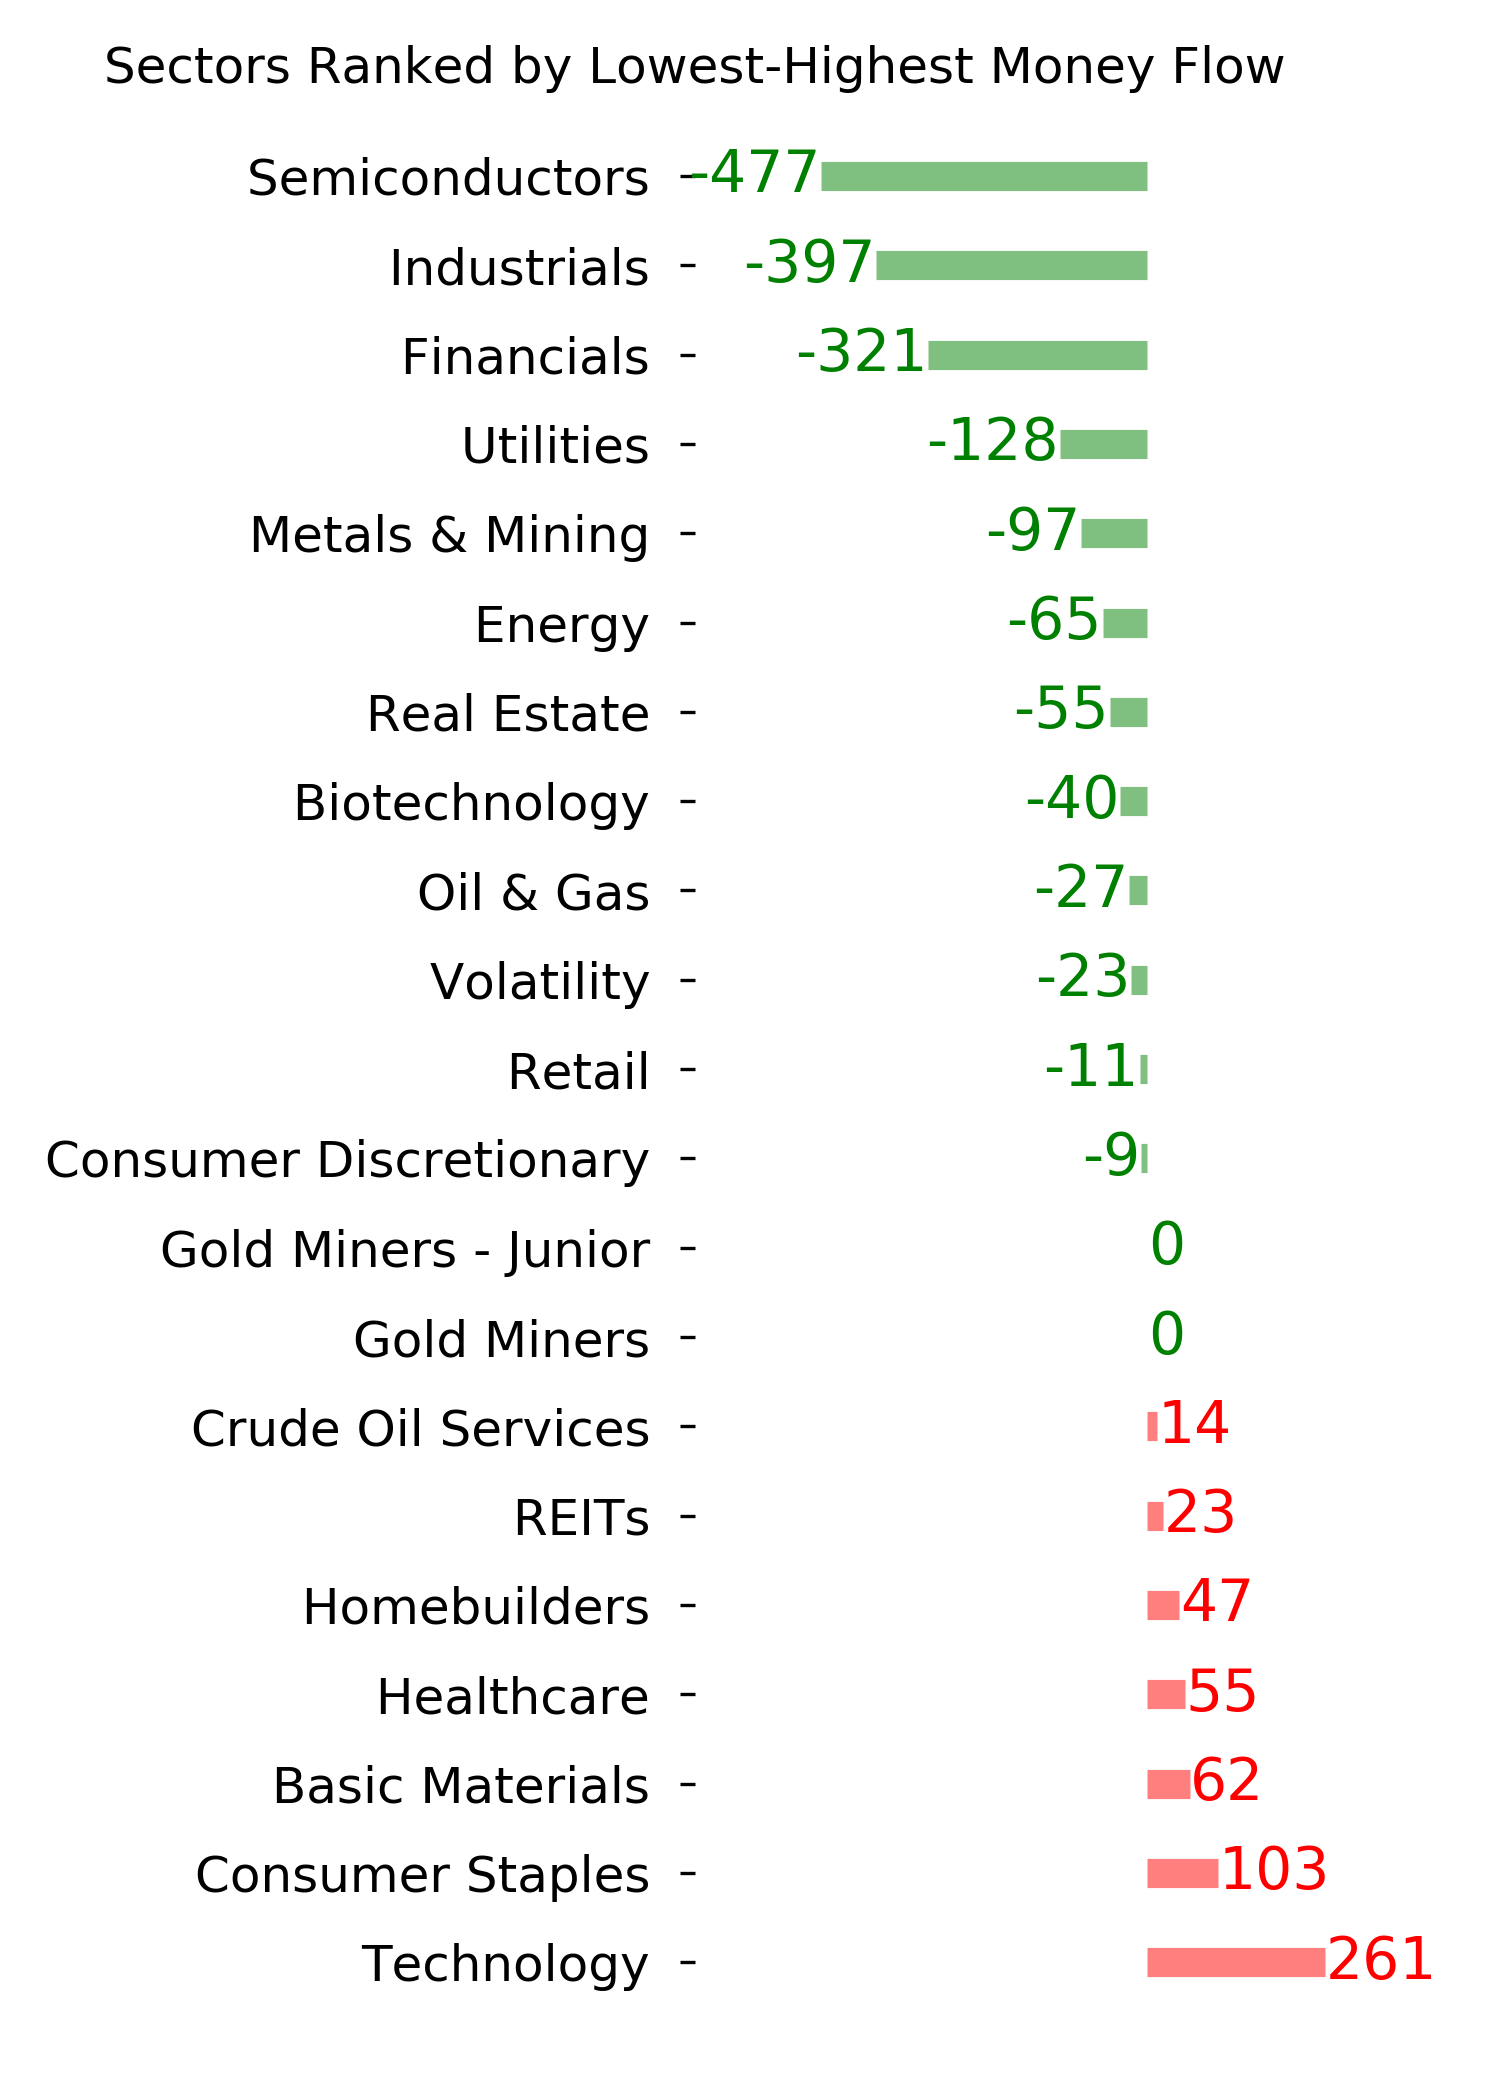
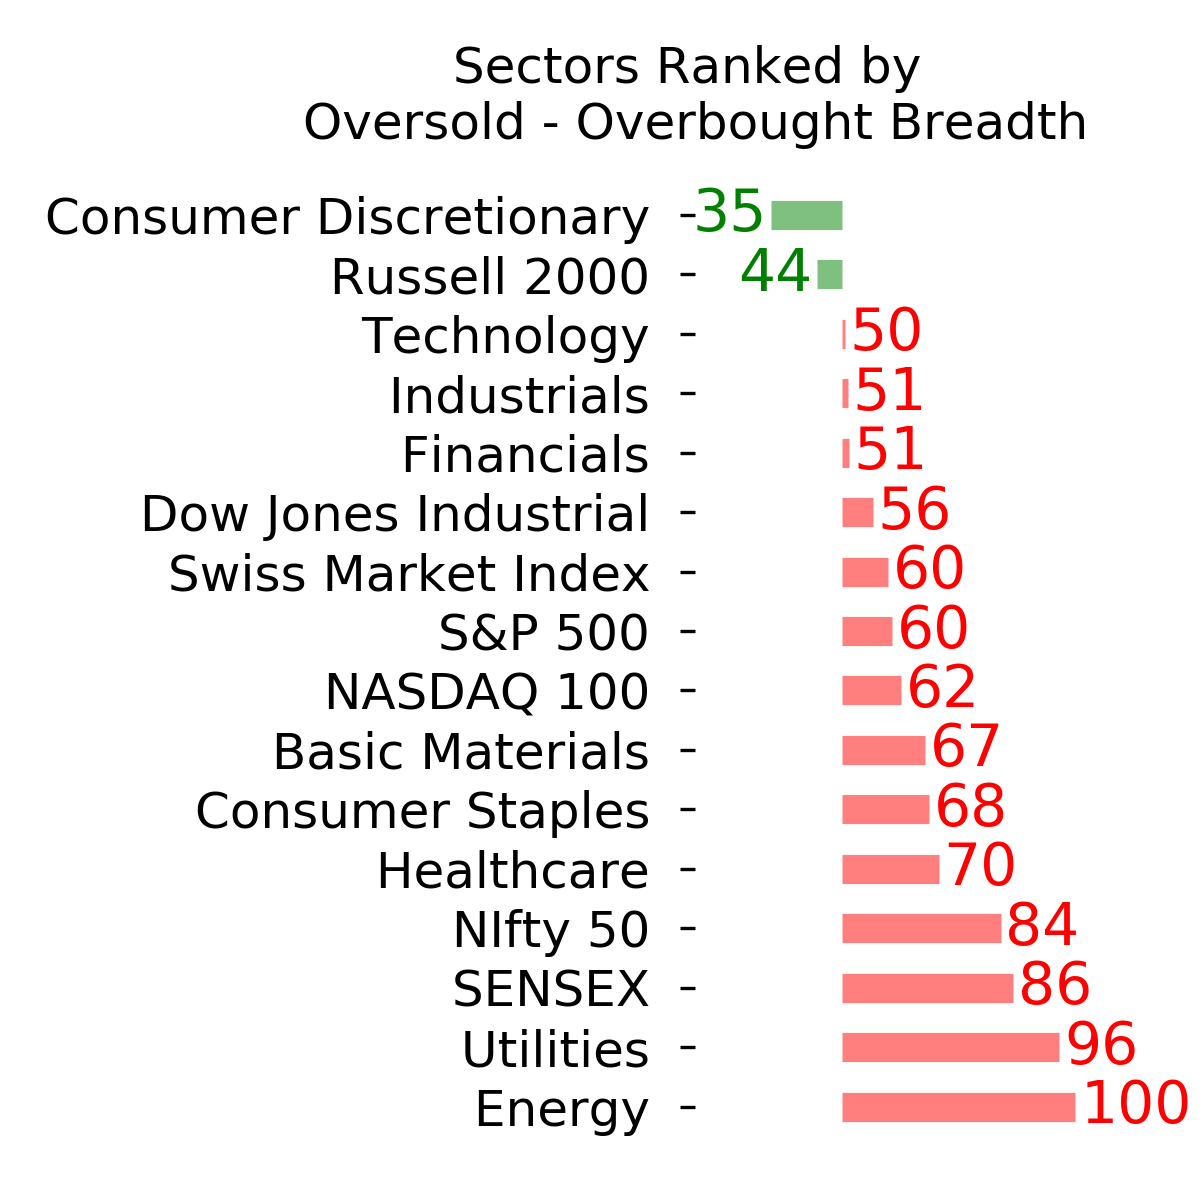
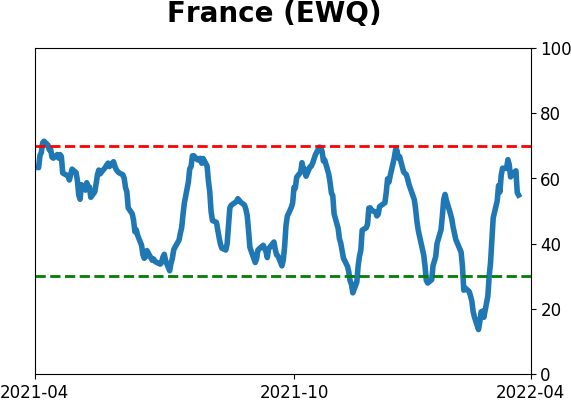
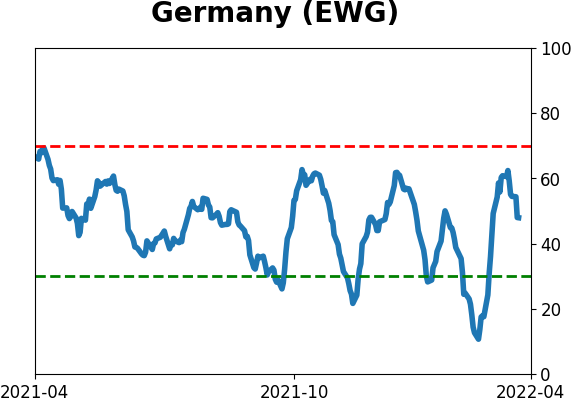
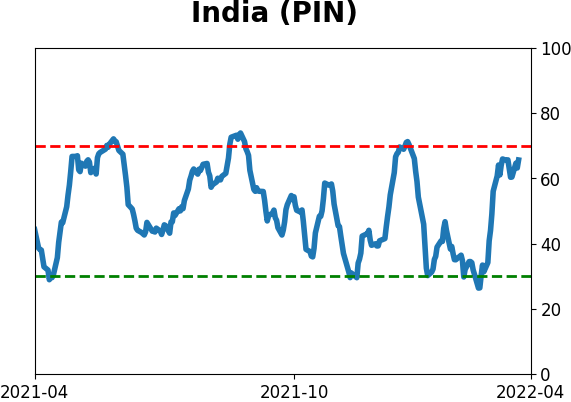
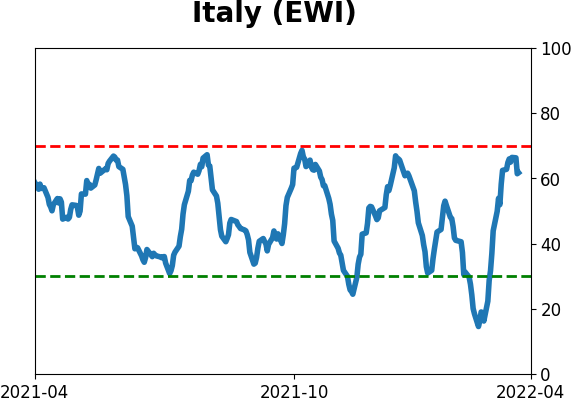
Optimism Index Thumbnails
|
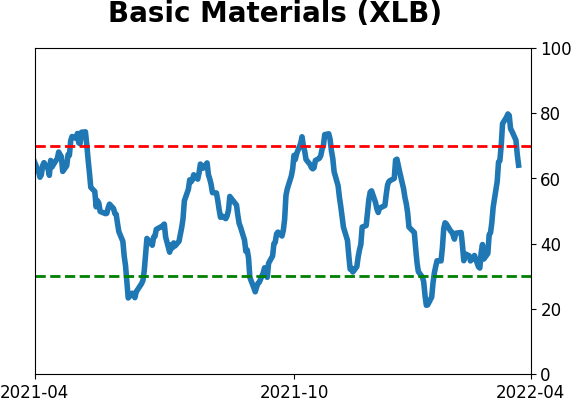
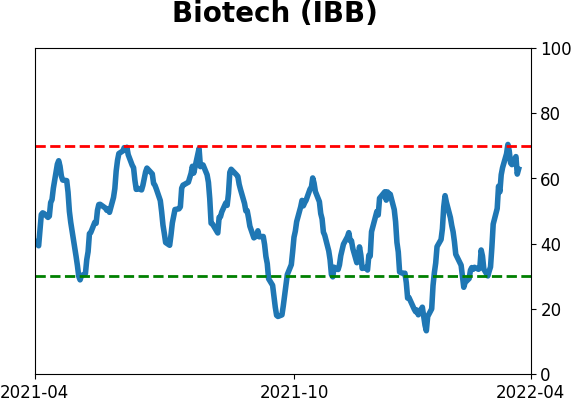
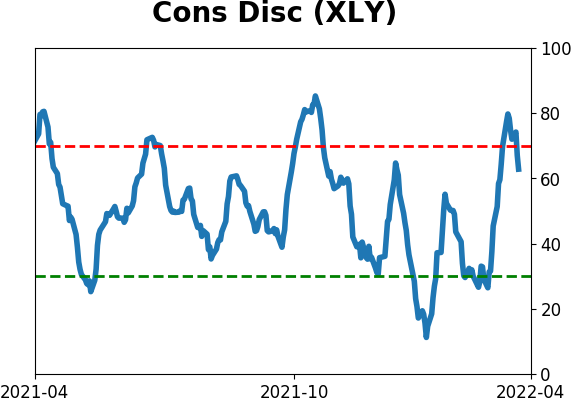
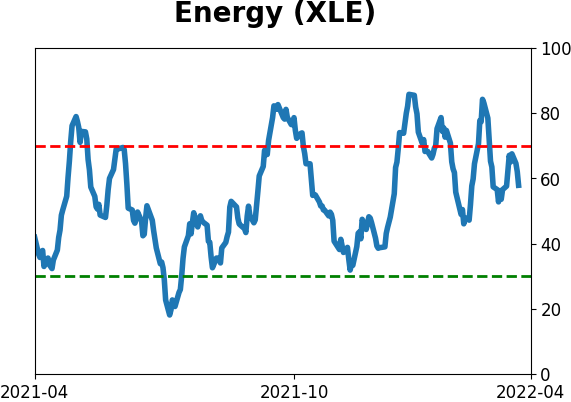
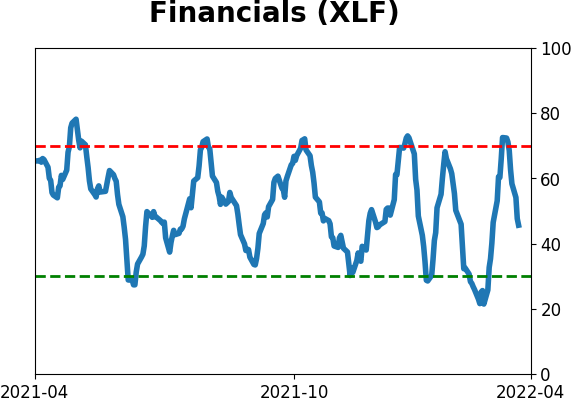
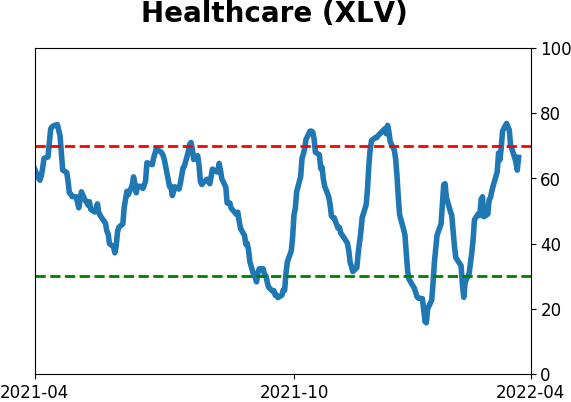
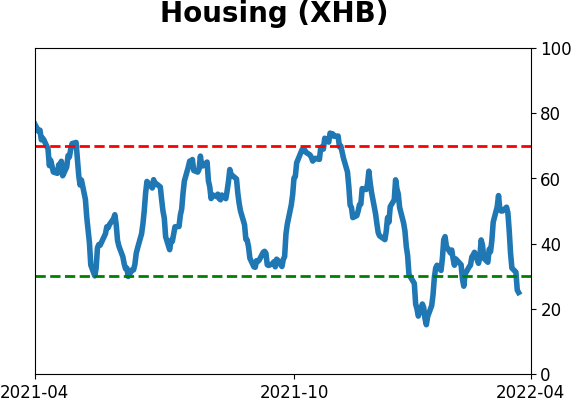
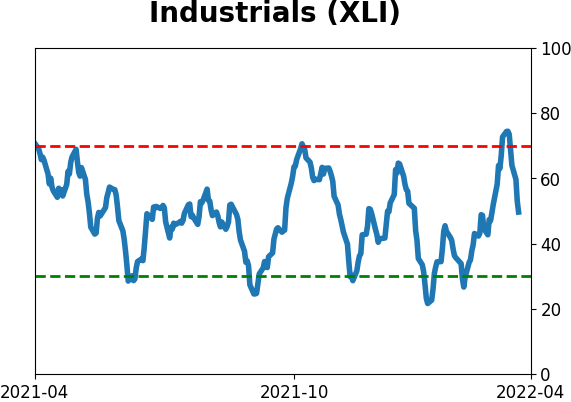
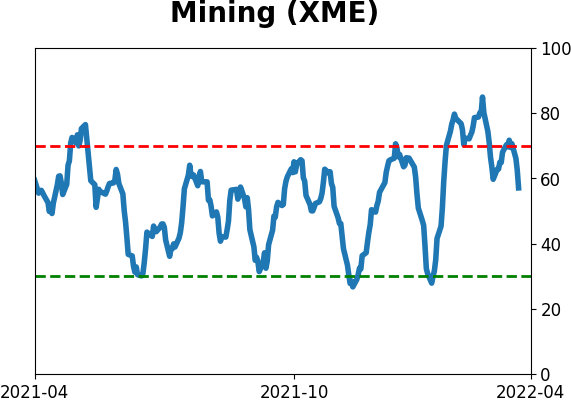
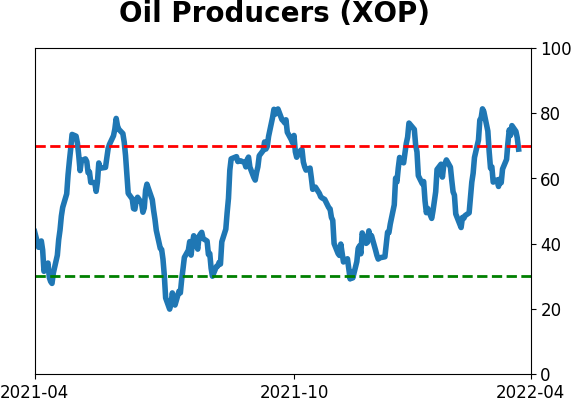
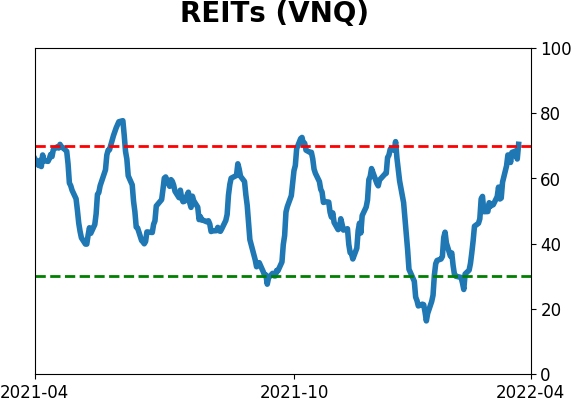
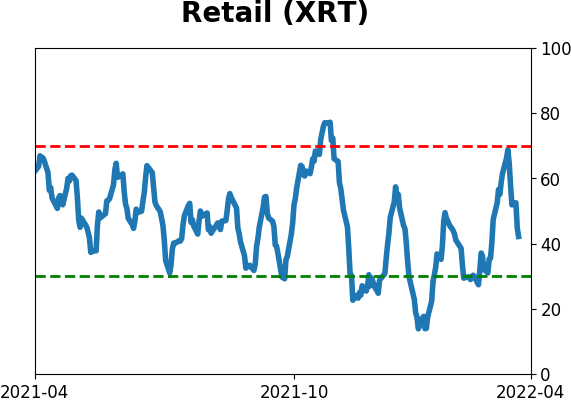
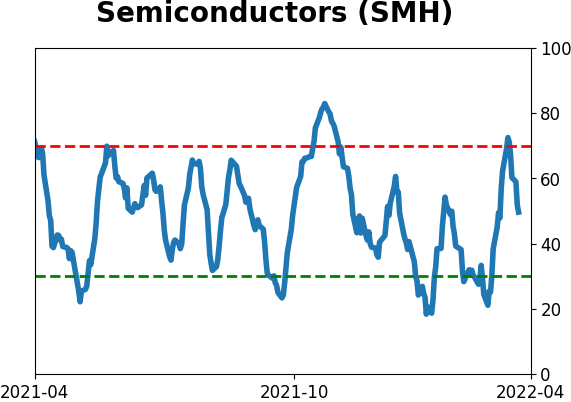
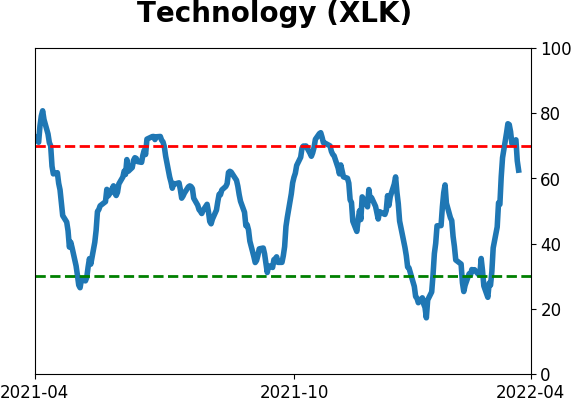
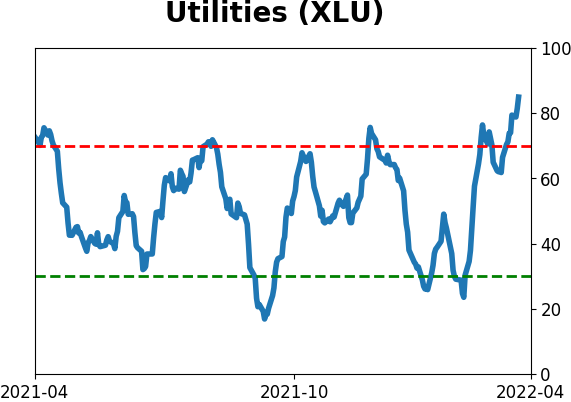
Sector ETF's - 10-Day Moving Average
|
|
|
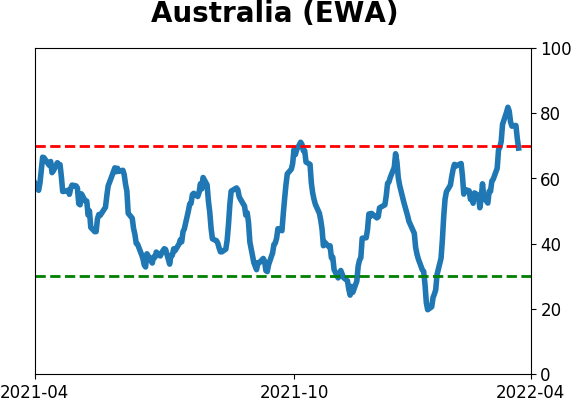
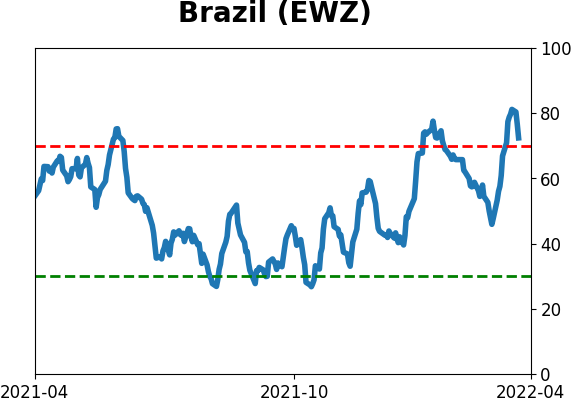
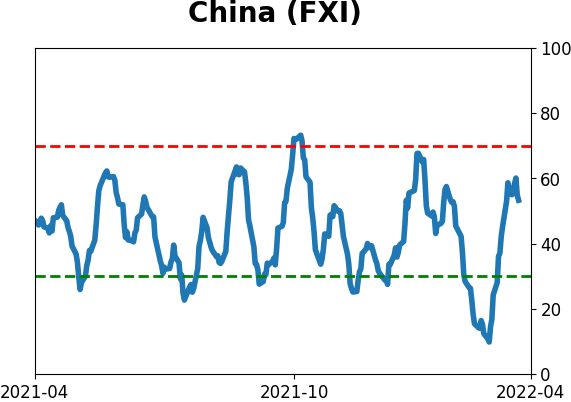
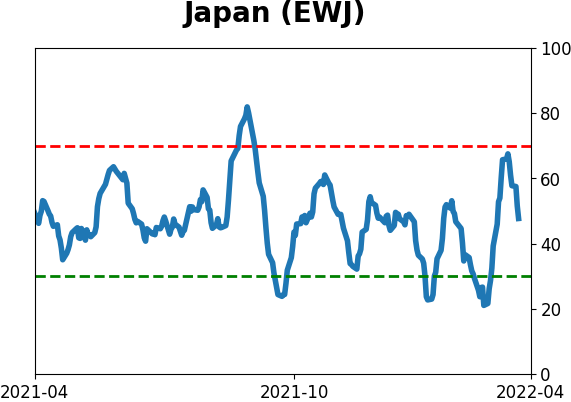
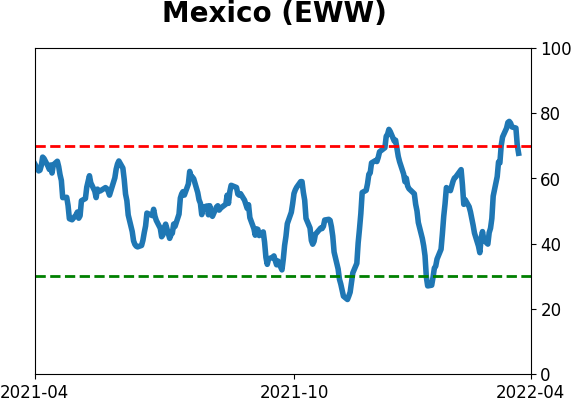
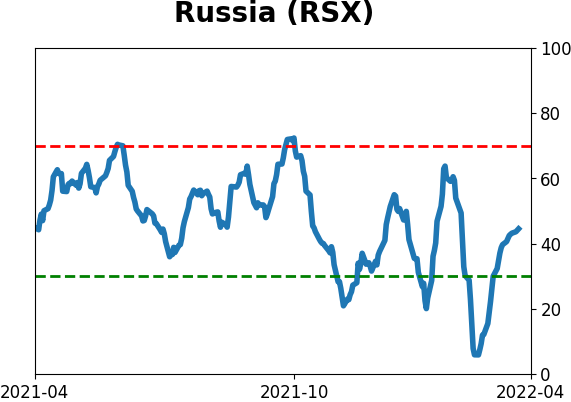
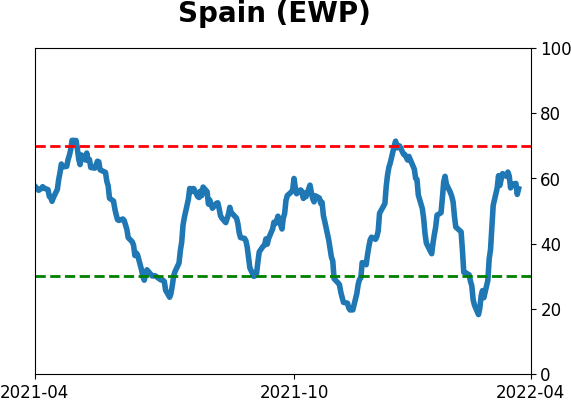
Country ETF's - 10-Day Moving Average
|
|
|
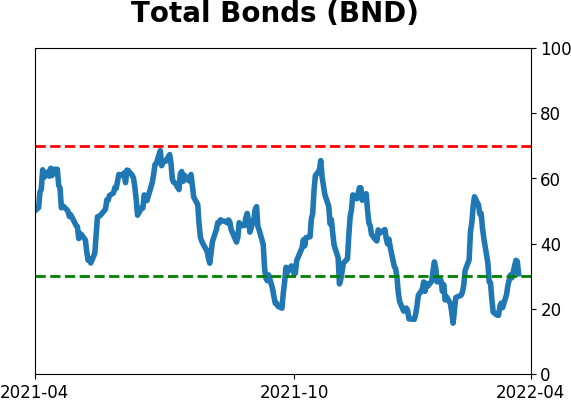
Bond ETF's - 10-Day Moving Average
|
|
|
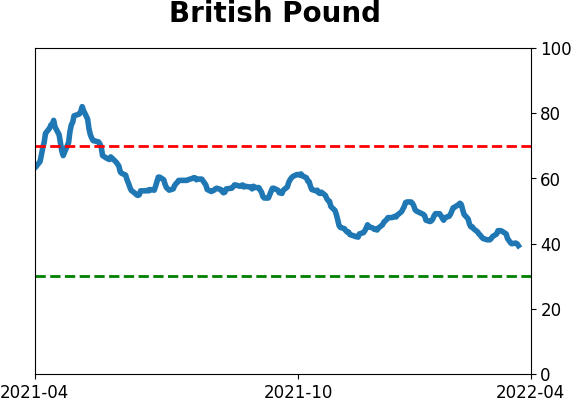
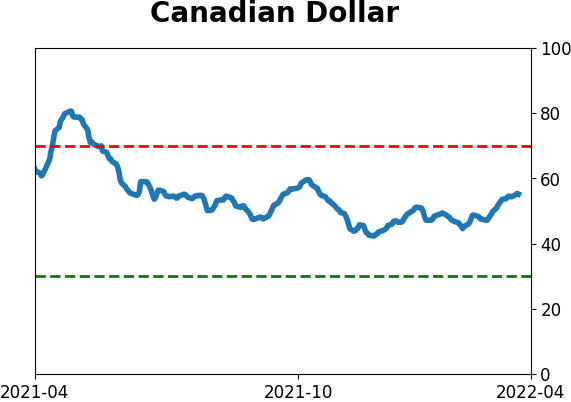
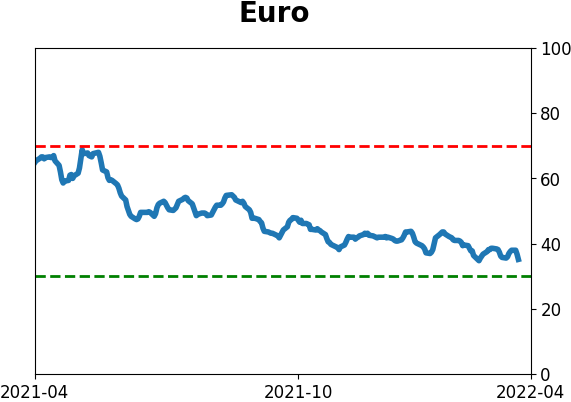
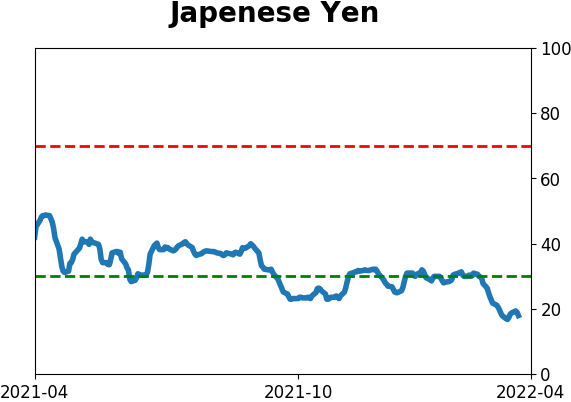
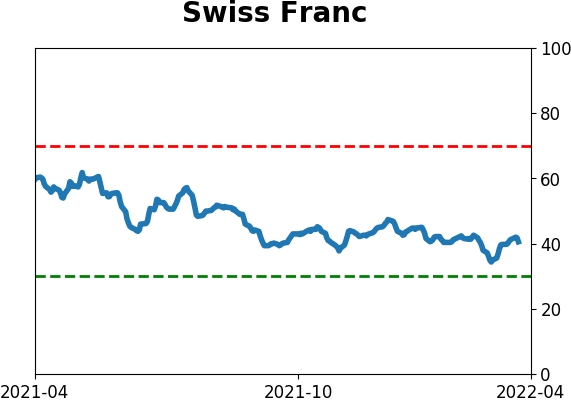
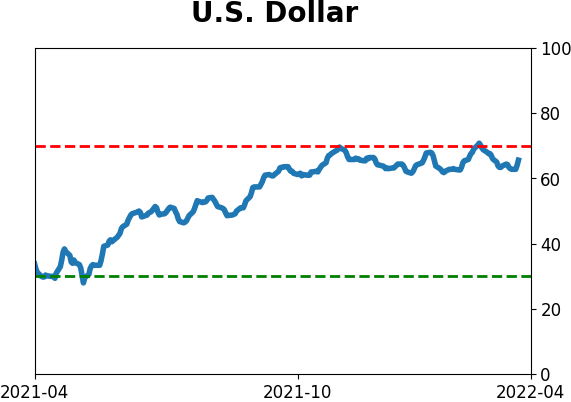
Currency ETF's - 5-Day Moving Average
|
|
|
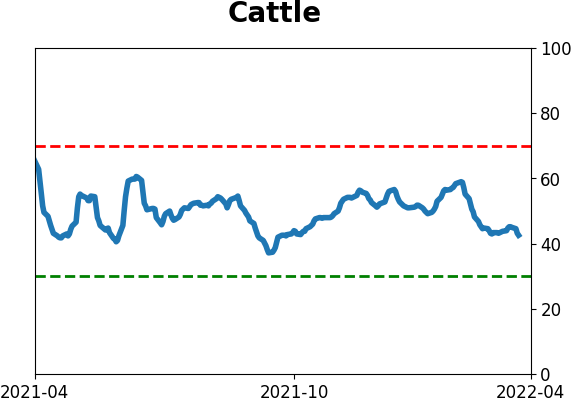
Commodity ETF's - 5-Day Moving Average
|
|