Daily Report : TradingEdge Weekly for Apr 5 - Remarkable momentum, optimistic consumers, good energy

| View/Print a PDF version of this Report |
Headlines
|
TradingEdge Weekly for Apr 5 - Remarkable momentum, optimistic consumers, good energy: This week, we saw that momentum in the S&P 500 in recent months has been historically remarkable. Similar performance showed a strong tendency to keep going. Consumers are buying into it, with high expectations. Energy stocks are breaking out, though there are some warning signs. Cyclical sectors are hitting relative highs. |
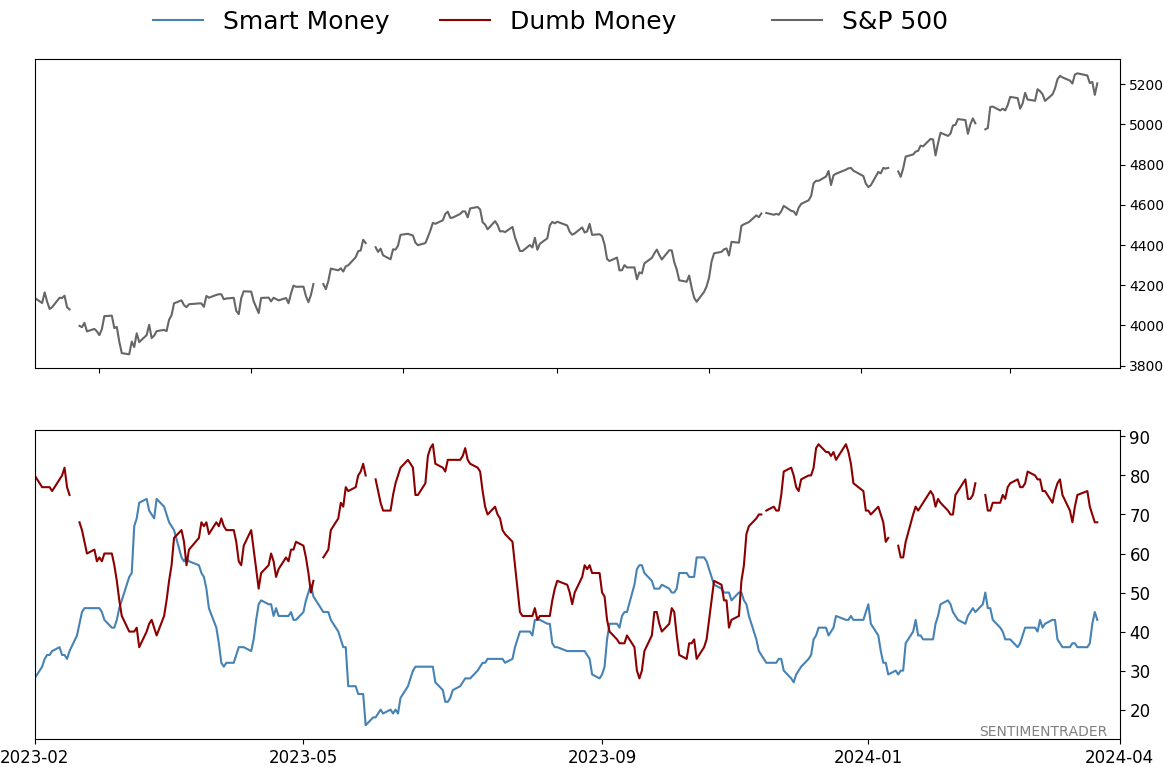
Smart / Dumb Money Confidence
|
|
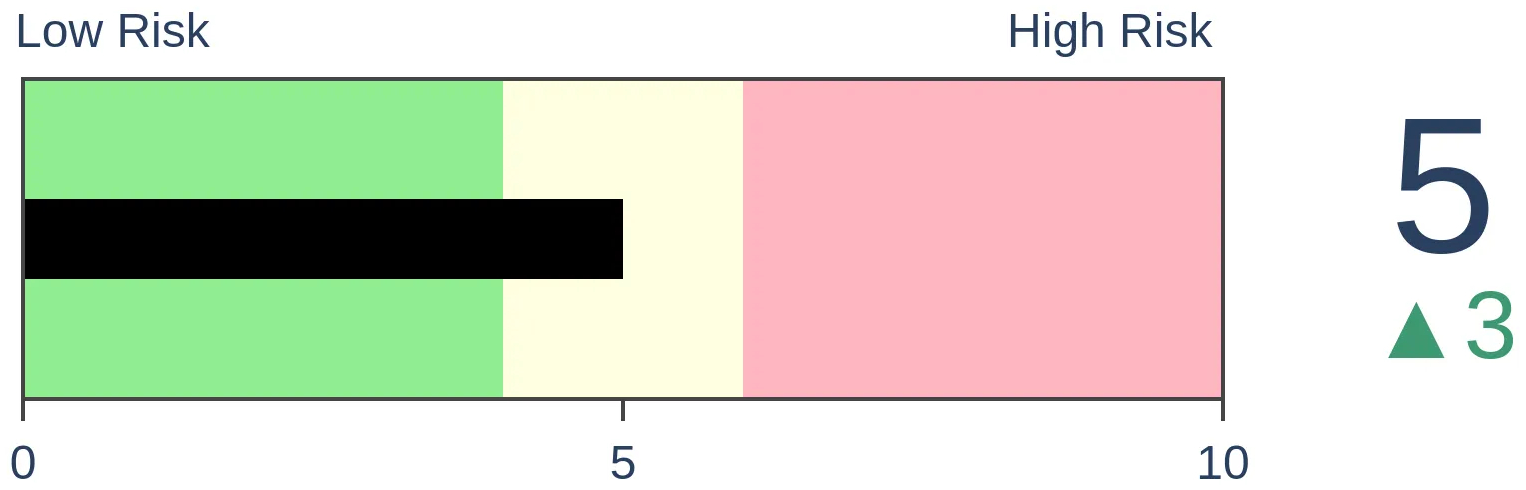
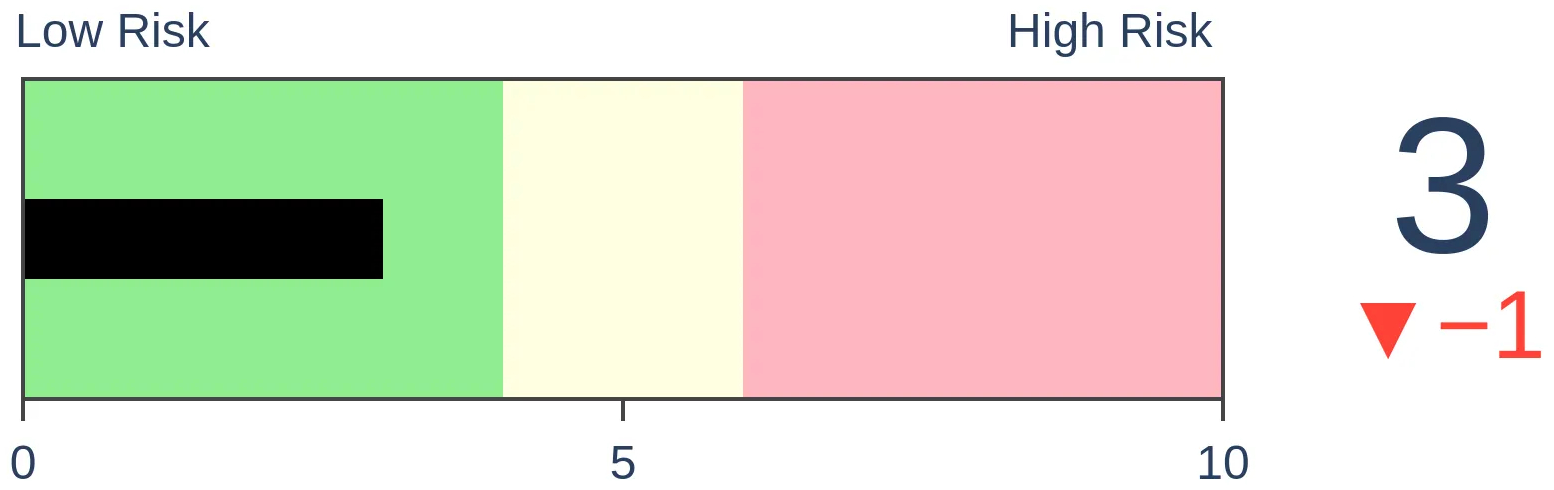
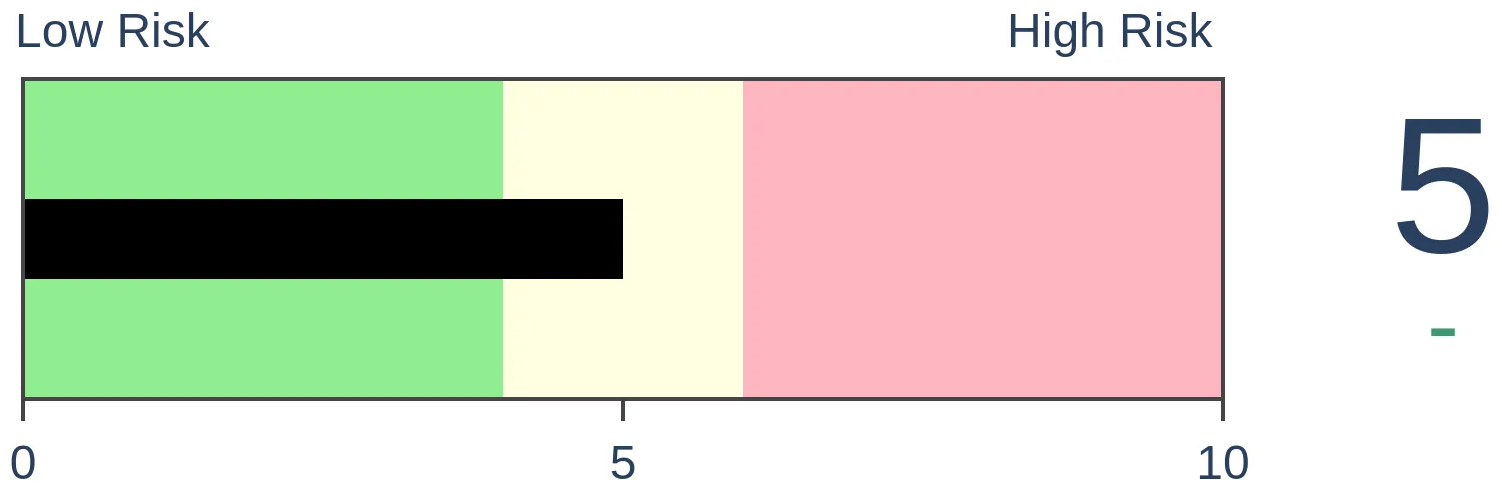
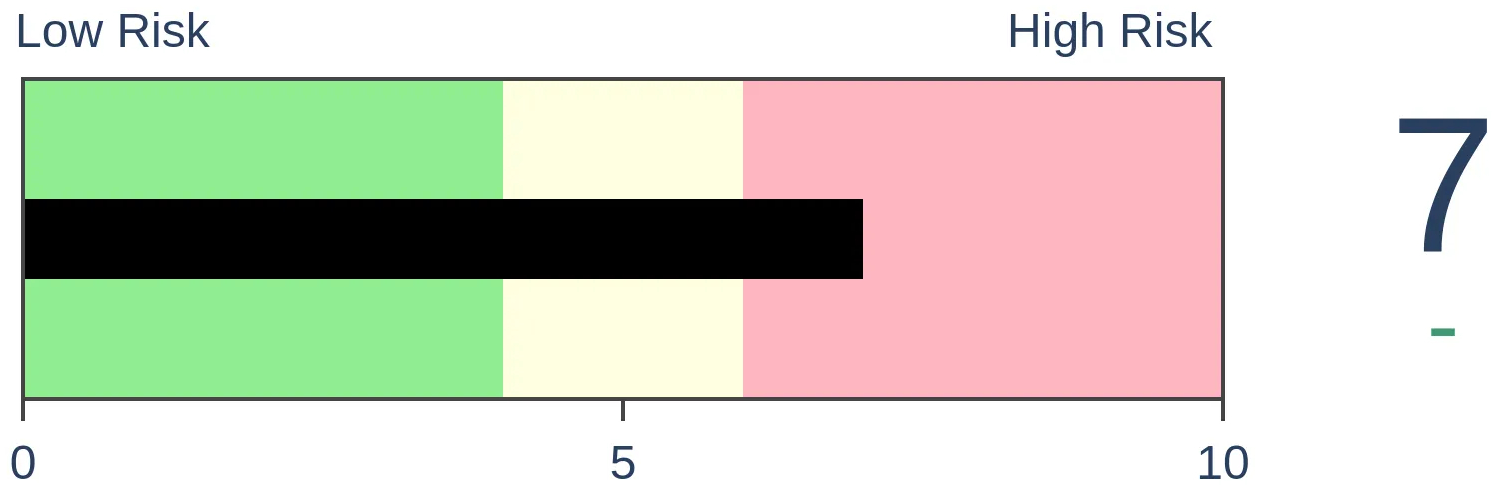
Risk Levels
|

|
|

Research
TradingEdge Weekly for Apr 5 - Remarkable momentum, optimistic consumers, good energyBy Jason GoepfertBOTTOM LINEThis week, we saw that momentum in the S&P 500 in recent months has been historically remarkable. Similar performance showed a strong tendency to keep going. Consumers are buying into it, with high expectations. Energy stocks are breaking out, though there are some warning signs. Cyclical sectors are hitting relative highs. FORECAST / TIMEFRAME |
Key points:
- S&P 500 price momentum has been remarkable
- When combining momentum studies, long-term results were consistently favorable
- Consumers are jumping on the momentum by expecting even higher prices
- Investors are leveraging their investments
- Volatility on up days has been much higher than on down days
- Cyclical sectors are showing positive relative trends
- Energy stocks have broken out
- Energy also has a positive seasonal window but a couple of indicators are triggering warnings
- A trading strategy has flipped out of bonds and into cash
- When things go right in silver
Momo monster
Momentum is an important factor in the stock market.
And right now, that's a good sign for bulls. Jay noted that the recent multi-month surge triggered two more momentum signals at the end of March.
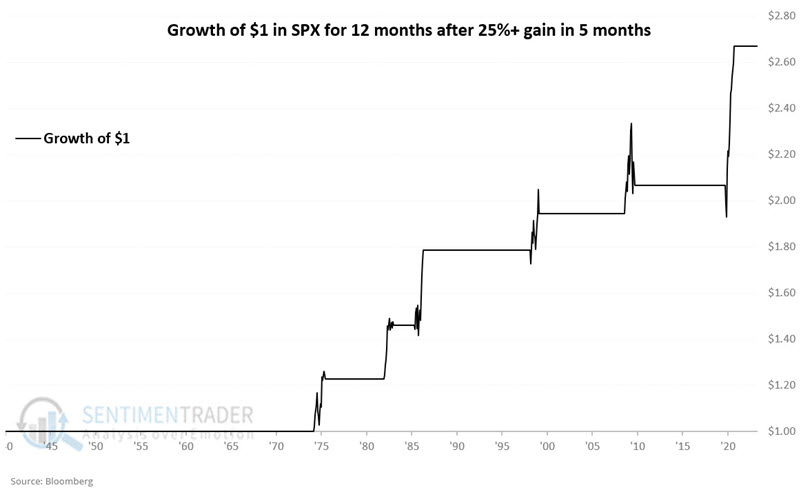
The S&P 500 Index closed March with a five-month gain of +25.3%. Let's apply a systematic approach to trading this event using the following rules:
- If the S&P 500 closes any month 25% or more above its monthly closing price five months ago, we buy and hold the index for twelve months
- If another signal occurs within the initial twelve months, we extend the holding period another twelve months
The chart below displays an equity curve showing the hypothetical growth of $1 invested in the S&P 500 using the rules above since 1941.
It also closed January with a 3-month gain of +15.5%. Let's apply the same systematic rules for this signal as we used above:
- If the S&P 500 closes any month 15% or more above its monthly closing price three months ago, we buy and hold the index for twelve months
- If another new signal occurs within the initial twelve months, we extend the holding period another twelve months
The chart below displays an equity curve showing the hypothetical growth of $1 invested in the S&P 500 using the rules above since 194.
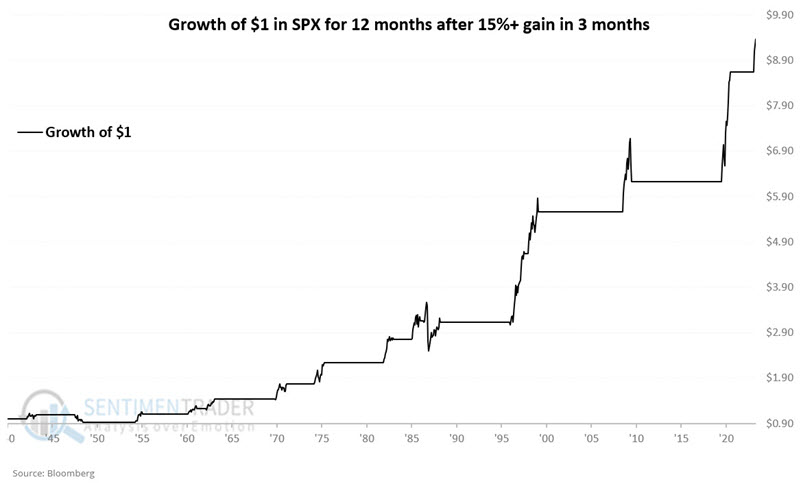
In the first two months since the 2024-01-31 signal, the S&P 500 has already gained +8.4%.
Combining studies
Jay further noted that a variety of momentum signals were rated as favorable for stocks. Here, we look at the history of stock market performance depending on whether one or more of these signals are in force.
He combined a variety of signals discussed lately into one strategy. The rules are that we buy and hold the S&P 500 Index for twelve months if any of the below generates a new signal. We extend the holding period another twelve months if there is another signal within the first twelve months.
- If the S&P closes higher for five straight months OR
- If the S&P closes a month with a 3-month gain of 15% or more, OR
- If the S&P closes a month with a 5-month gain of 25% or more
The chart below displays the hypothetical growth of $1 invested in the S&P 500 Index using the rules above since 1941 (log scale).
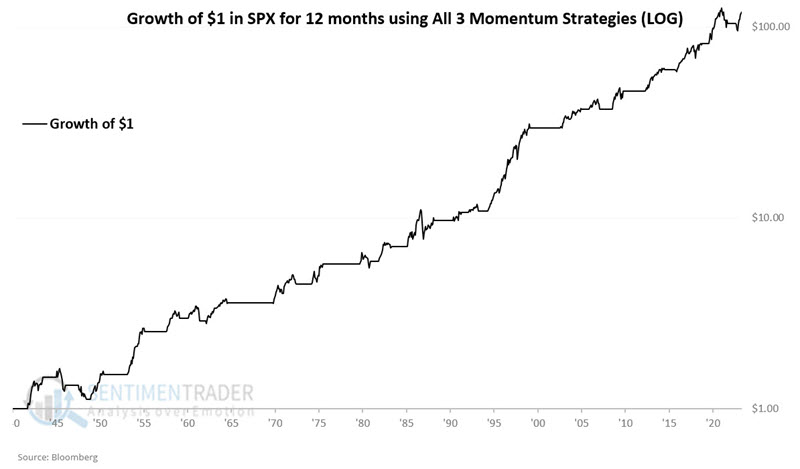
The results are far from perfect (long during the late 1940's decline, the Crash of '87, and much of the 2022 decline), but the equity curve's long-term "lower left to upper right" nature is undeniable. This particular model will be rated as "favorable" at least through March of 2025.
The chart below displays the hypothetical growth of $1 invested in the S&P 500 when NONE of the signals are active.
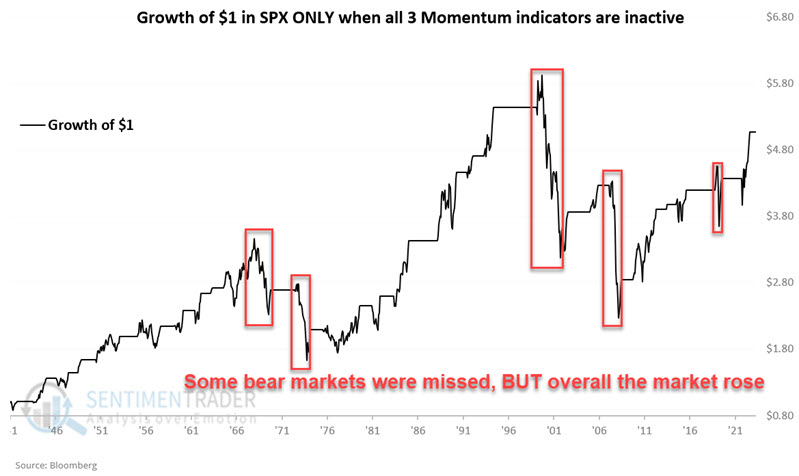
As you can see, while systematically avoiding the stock market during zero readings avoided significant losses during several bear markets, the stock market gained ground overall in the long run.
Consumers are jumping on that momentum
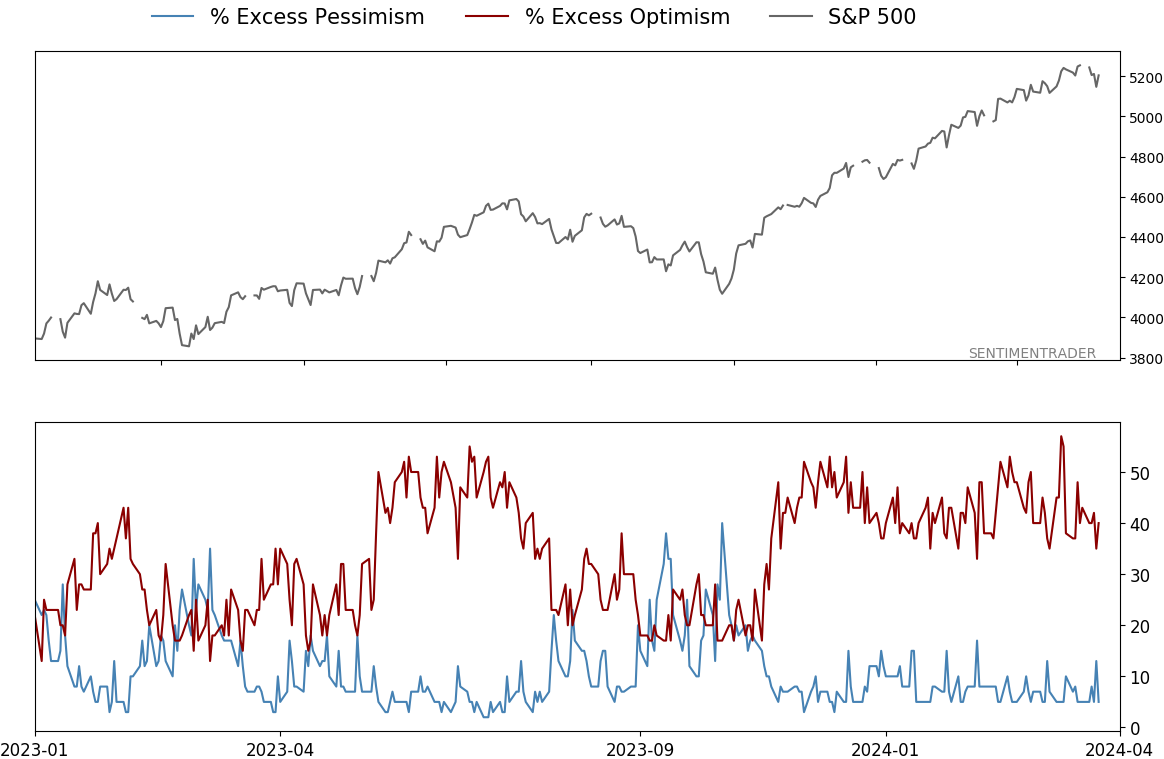
During some of the worst pessimism in the summer of 2022, we looked at consumers' plunging confidence in a stock market rally. Now, consumer expectations have rebounded in a huge way.
The percentage of consumers expecting stocks to rise has jumped to the 2nd-highest in history. The net percentage (bulls minus bears) has jumped above +20% after plunging below -15% in 2022.
Most peaks are preceded by declining, not rising, confidence. There is no divergence now since expectations are still rising.
Using version 2.0 of the Backtest Engine, we can look for other times when consumers' net expectation of a rising stock market cycled from less than -15% to greater than +20%. There were only three other instances, so the usual caveat of tiny sample sizes applies. Still, we can see from the returns after each signal that they were consistent and robust.
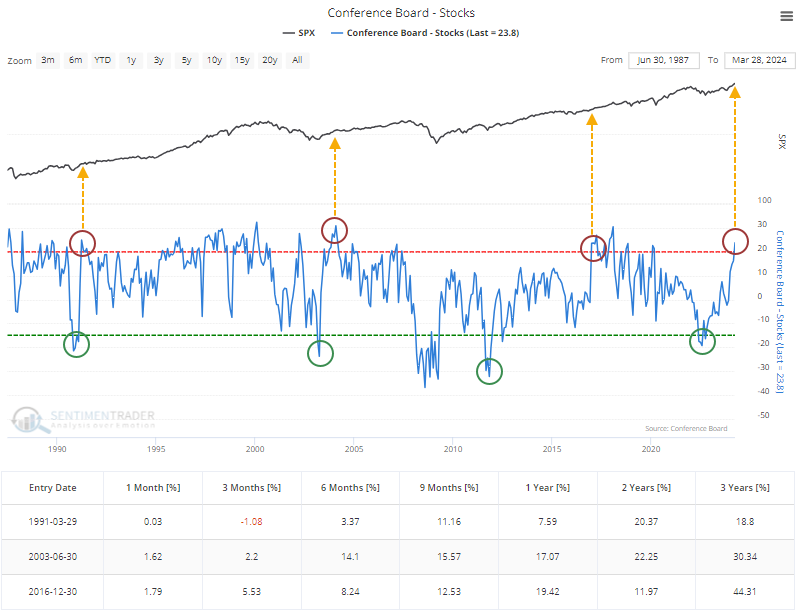
In the results from the test, you can click the new tab for maximum losses and gains across each time frame. Again, the results were consistent: losses were minimal (using monthly closes), while gains were remarkable.
Investors are levering up but not as much as usual
Investors' risk appetite is returning, and they're feeling more comfortable leveraging their equity holdings.
Oddly, it hasn't picked up much as expected despite gangbuster moves in many stocks and indexes. The S&P 500 has reached record highs, yet margin debt is still more than 20% off its own high.
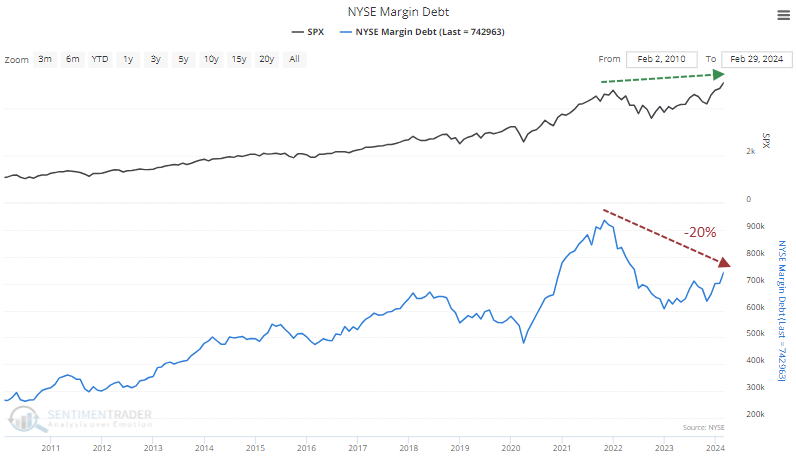
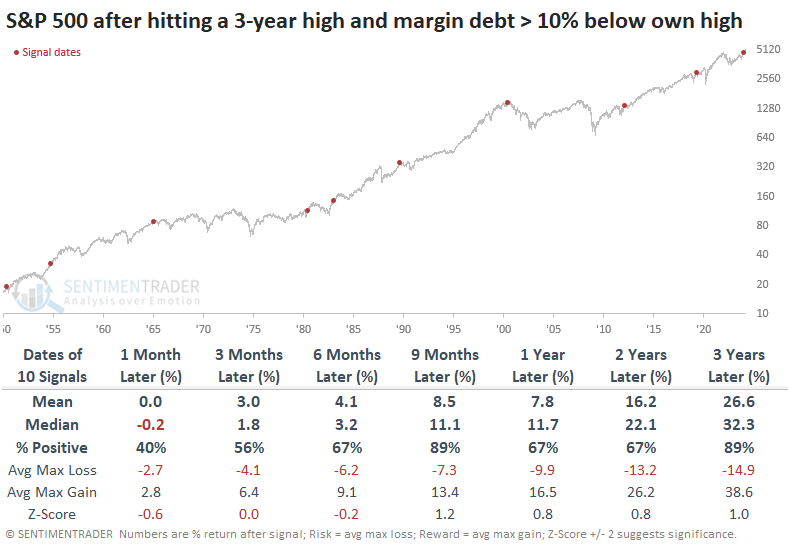
This is not a common situation. The table below looks at the first time in two years when the S&P 500 closed at a 3-year high, but margin debt was at least 10% below its own high.
This triggered near the high in 2000 and before the 1990 recession, which were not good times to be a long-only investor over the following year. However, the others showed gains and overall returns were mostly well above random.
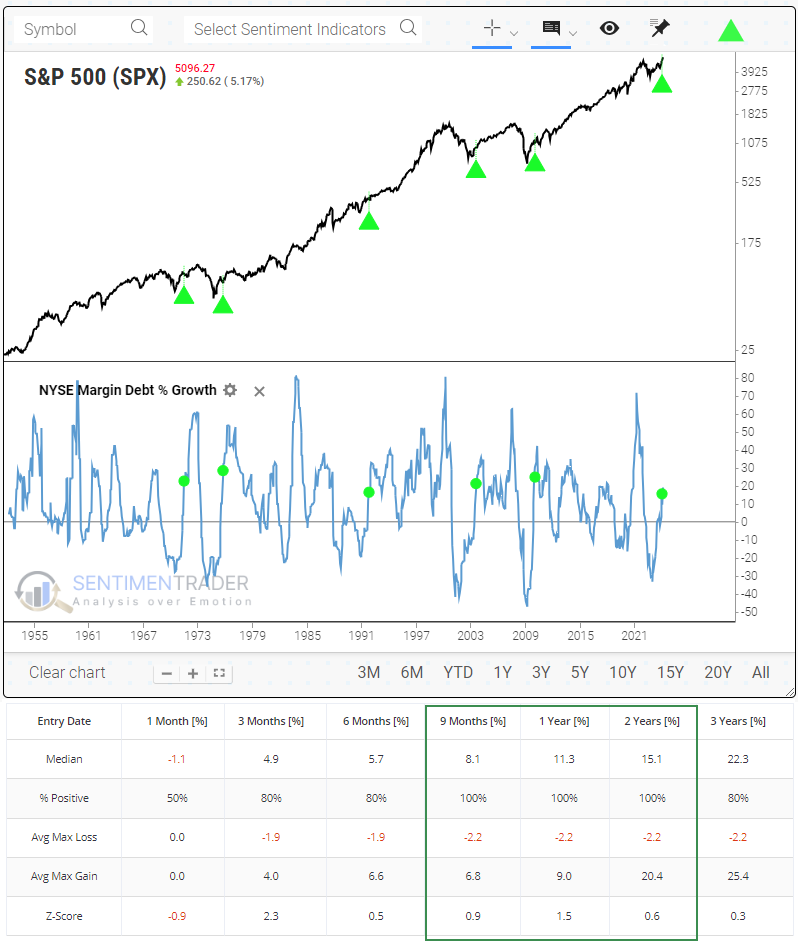
Even though debt is well below its high, it has grown significantly over the past year. The Margin Debt % Growth chart shows that it has jumped 19% over the past year after having plunged by more than a third during 2022.
The S&P rose over the next 9-24 months all five times there was a similar cycle, with returns that were above random and with low risk relative to reward.
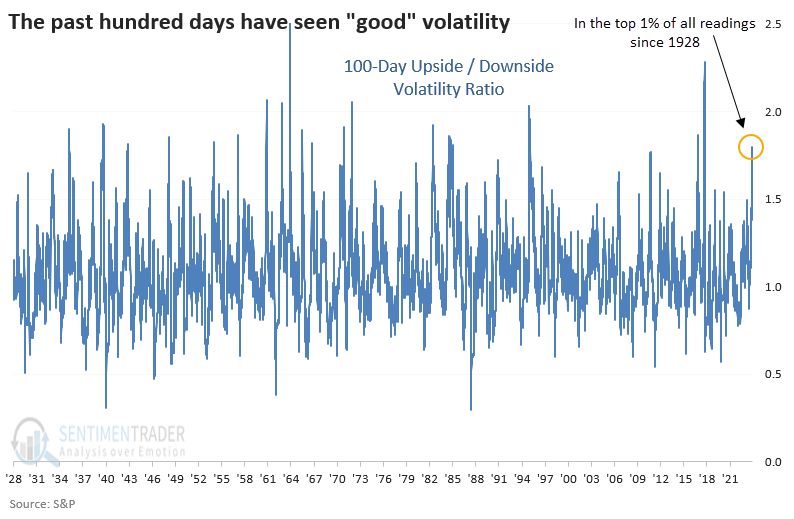
100 days of good volatility
Stocks enjoyed a tremendous push during the first hundred days off the October 2023 bottom. While the rally was relatively calm, it hides an unusual twist - volatility on positive days has been significantly higher than on negative days.
In the past hundred days, the S&P averaged a gain of +0.61% on its positive days and -0.42% on its negative days. Also, the positive days have been more volatile than the negative ones. The chart below shows the ratio between volatility on up and down days; the current ratio is in the top 1% of all days since 1928.
The table below shows returns in the S&P 500 after its upside volatility crossed 1.75 times downside volatility. Theoretically, we could expect that these were instances of FOMO (Fear Of Missing Out) and sure to end in tears for bulls late to the party. The results don't support that theory, however. While there were some sizable losses, they were the exception. Over the past 50 years, all the signals resulted in further gains over the next six months.
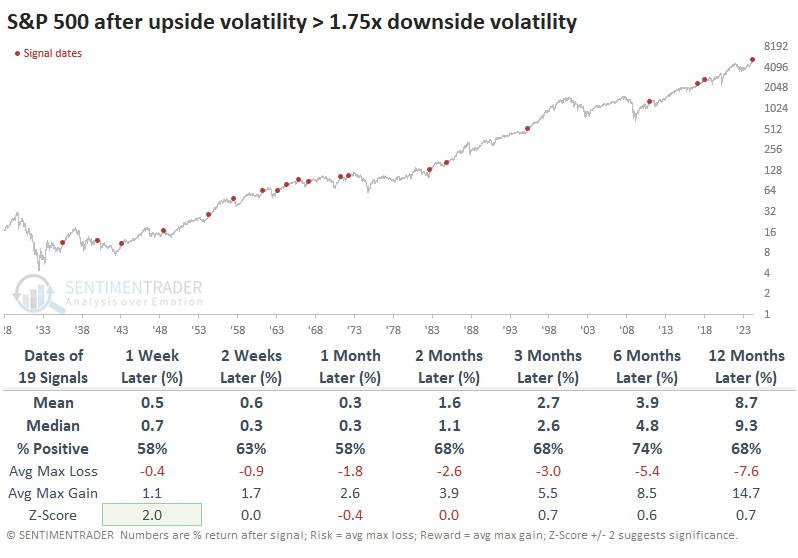
The table of maximum gains and losses across time frames shows that within the next three months, only one signal (in 1957) resulted in a double-digit loss. Over that time frame, 14 out of 19 signals showed a larger maximum gain than maximum loss.
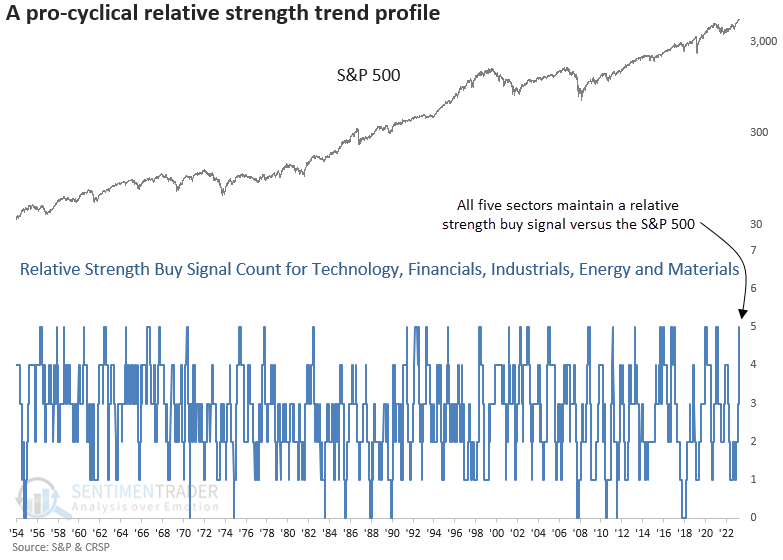
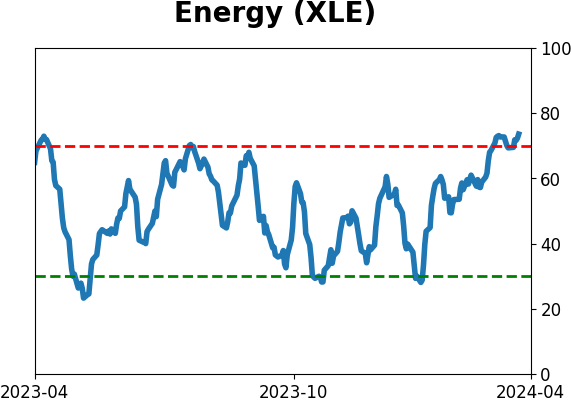
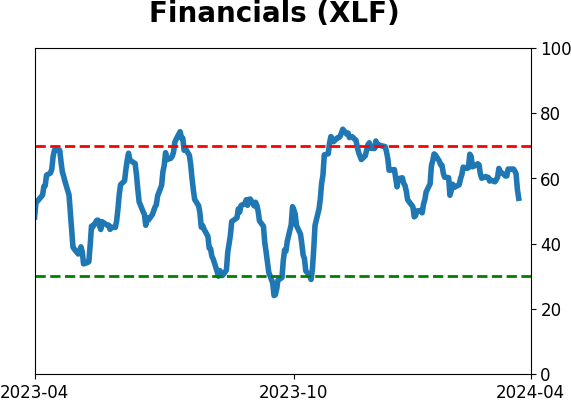
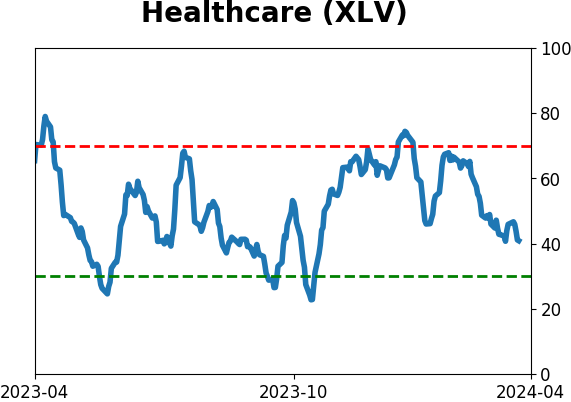
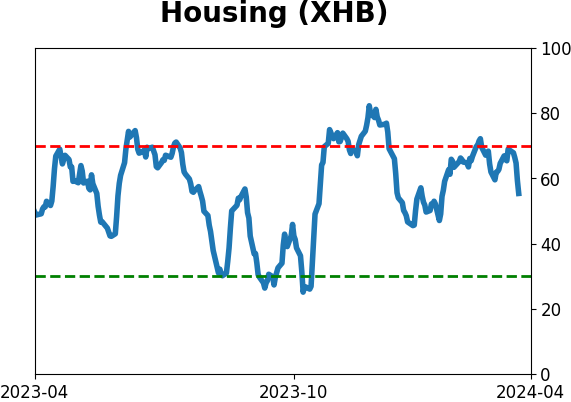
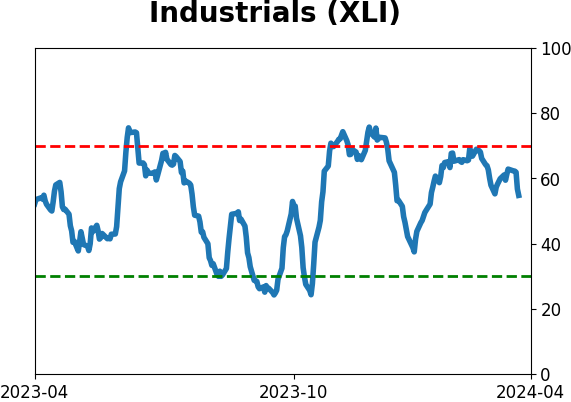
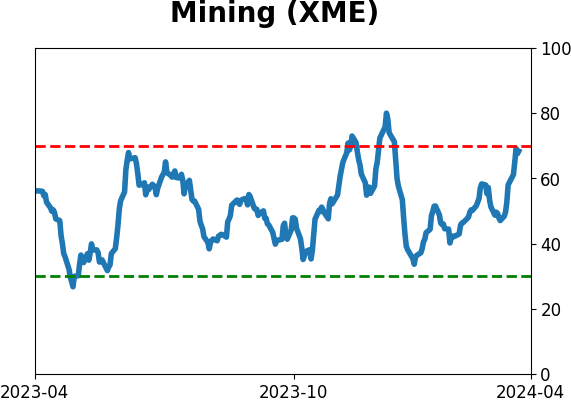
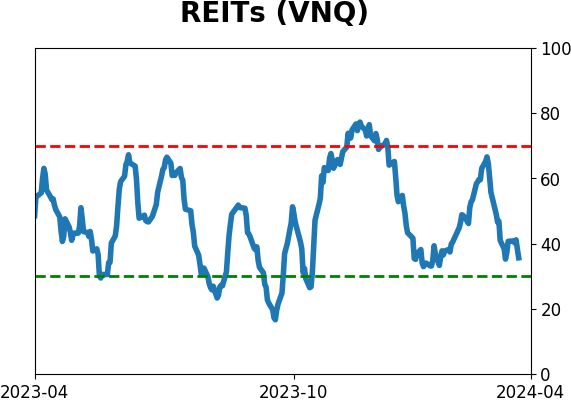
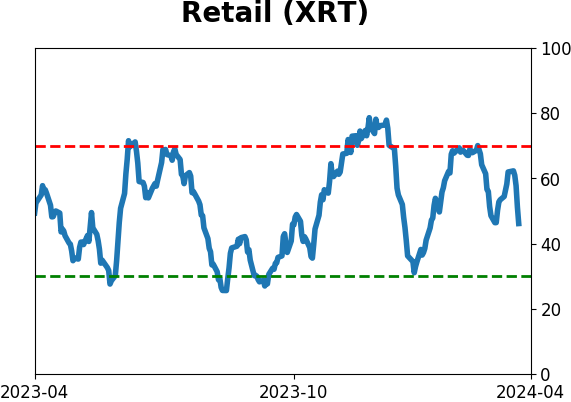
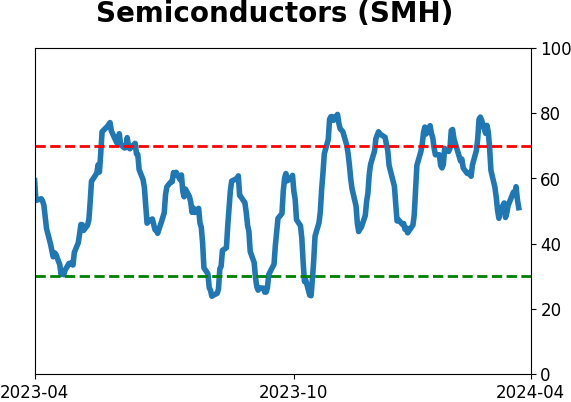
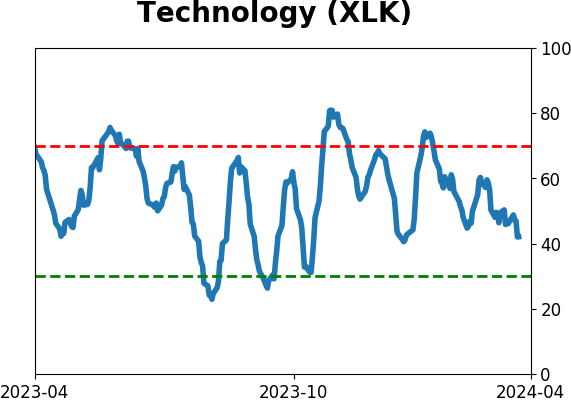
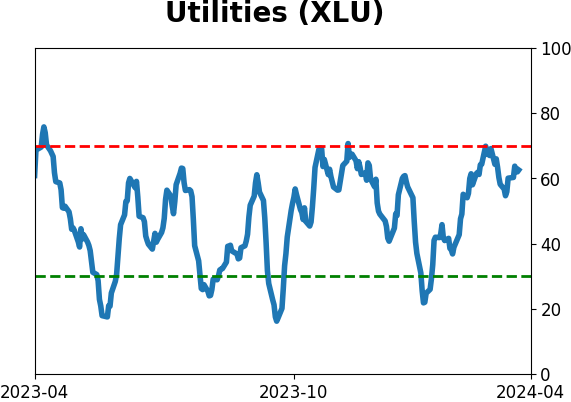
Positive cyclical trends
Communication Services, Technology, Financials, Industrials, Energy, and Materials display positive trends, which Dean showed led to the S&P 500 delivering impressive returns.
Earlier this week, Dean noted a relative strength buy signal for the energy sector. One day later, Materials triggered an alert, bringing the number of groups on a buy signal to six.
Since 1957, this relative trend configuration has transpired on numerous occasions. However, several precedents occurred with the S&P 500 significantly below an all-time high. Therefore, to provide context similar to now, we will require the large-cap index to hover within 5% of that peak.
While the sample size is small, when several cyclical sectors maintain a positive relative trend profile, with the S&P 500 near an all-time high, the world's most benchmarked index performed exceptionally well, especially over the following six and twelve months. No precedent exceeded a maximum loss of more than -7% over the following year.
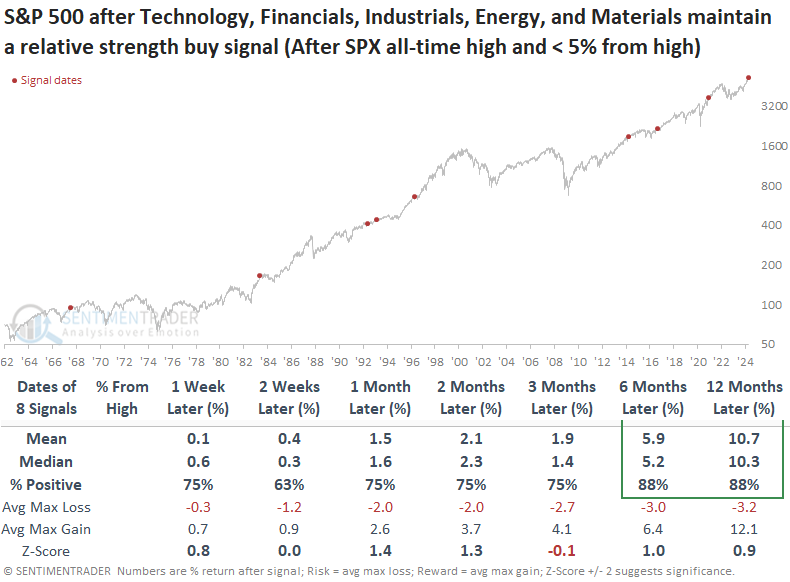
Over the subsequent year, every single cyclical sector on a relative strength buy signal outperformed the S&P 500, with Financials displaying the best return.
Even without the all-time high condition, the world's most benchmarked index still displayed solid returns, notwithstanding a head fake in 2002. Not once before a market correction surpassing 15% or a bear market did a relative strength buy signal count maintain a level of five, like now.
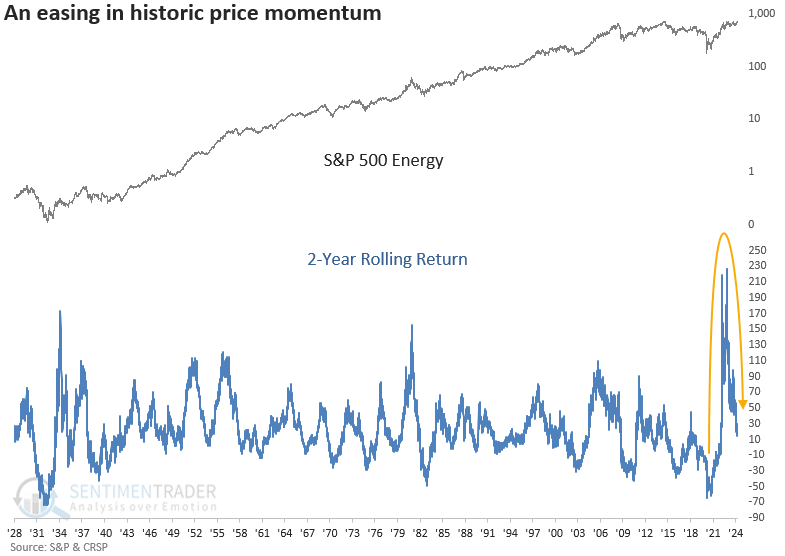
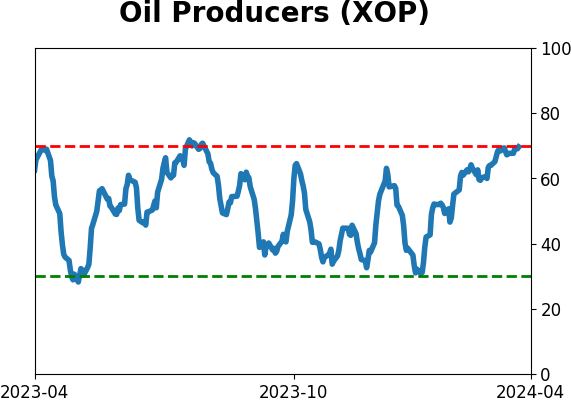
Energy breakout
The S&P 500 Energy sector closed at a new 9-year high. Dean showed that after similar breakouts, the group was higher at some point over the ensuing six months every time.
The new high in the energy sector is not all that surprising, given the recent breadth thrust and advance-decline line breakout, suggesting the potential for a fresh peak.
Once the S&P 500 Energy sector attained a 9-year high for the first time, the group tended to rise over the following 12 months. The likelihood of a false breakout appears low, with only one signal, 1947, showing a meaningful pullback over the ensuing two months.
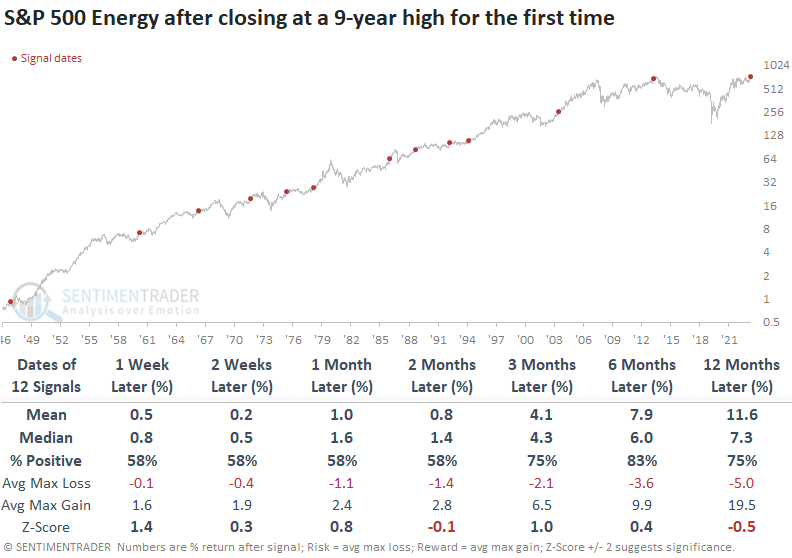
Long-term breakouts in the energy sector, like now, suggest the group outperforms the S&P 500 and other sectors over the following year.
It's worth mentioning that the S&P 500's annual return of 2.8% and win rate of 58% notably lagged behind the study period's outcomes of 7.5% and 73%. So, one could make the case that transitioning to an energy-led bull market impacts the broad market.
However, this single event contradicts the findings from numerous recent studies we've discussed, which suggested that the weight of the evidence is still overwhelmingly bullish for the world's most benchmarked index.
Energy is in a good spot, but...
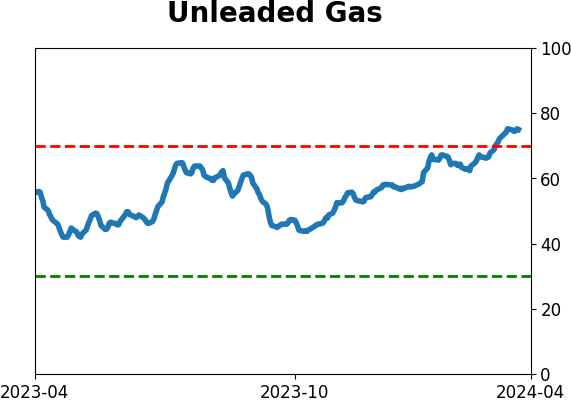
Both crude oil and unleaded gas are trending higher within a favorable seasonal period. However, Jay showed that some indicators are flashing clear warning signs for these markets.
The energy markets are highly cyclical in nature. The annual seasonal trend for crude oil futures shows a currently positive window. The chart below displays the hypothetical growth of $1 in crude oil (based on percentage price changes) if held from Trading Day of the Year (TDY) #64 through TDY #188 every year since 1985.
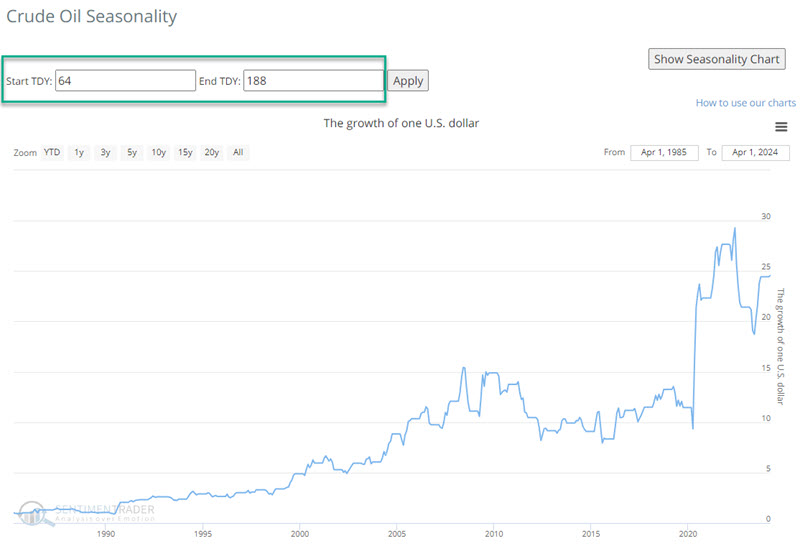
There were years when significant losses accrued. However, the "lower-left-to-upper-right" nature of the equity curve is critical to note. As long as price action remains favorable within this annual period, traders are encouraged to give the bullish case the benefit of the doubt.
We see something similar with unleaded gas.
However, a warning comes from the futures market. The term structure of crude oil futures shows the relationship of the near-term futures contract to a further-out contract. If it is above 1.00, the near-term contract is priced higher than the further-out contract, called backwardation.
The chart below highlights those dates in the last 15 years when the Crude Oil Term Structure crossed above 1.05 for the first time in 21 days. The most recent signal occurred on 2024-04-01.
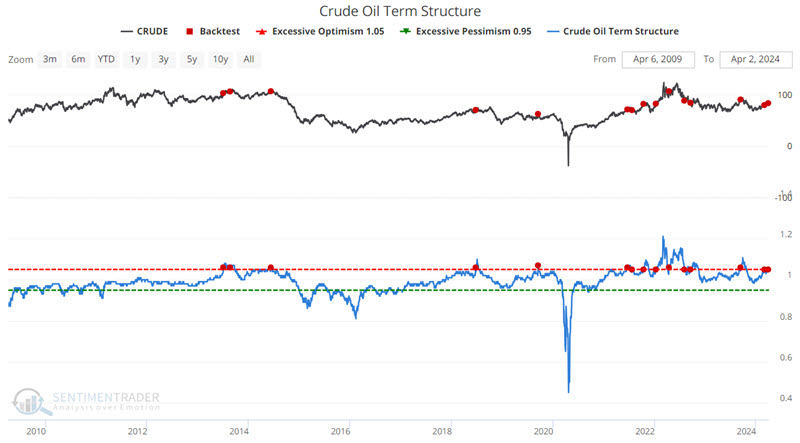
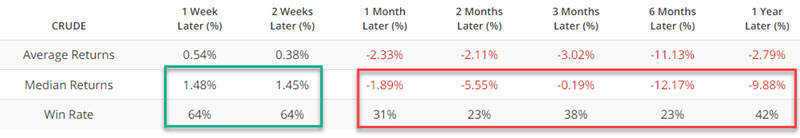
Note the strong tendency for weakness two months and six months after a signal. Results are similar for unleaded gas.
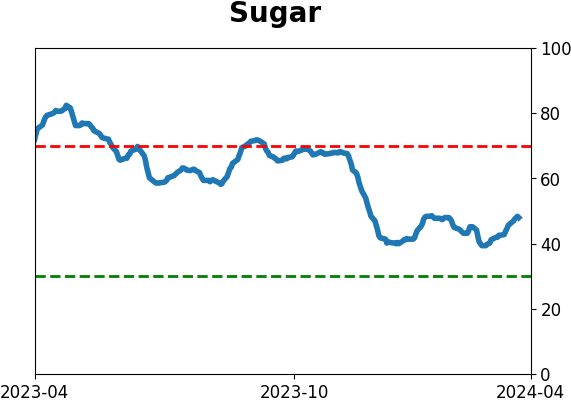
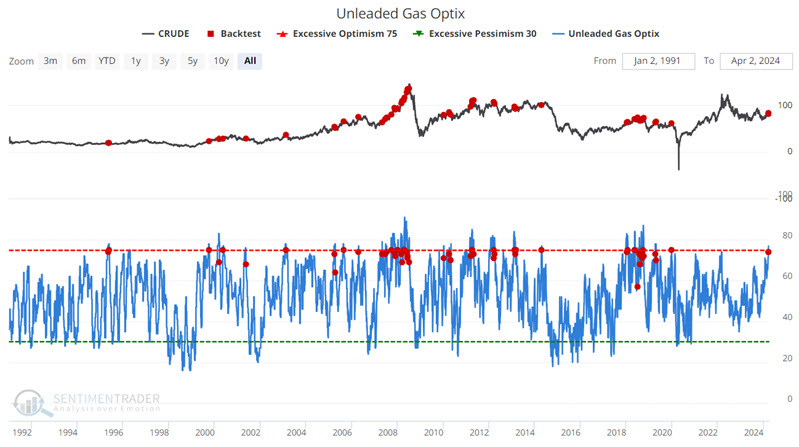
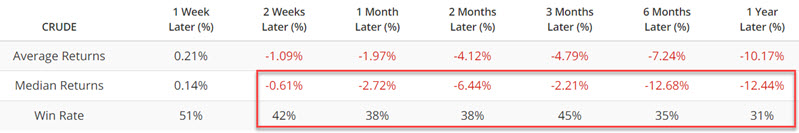
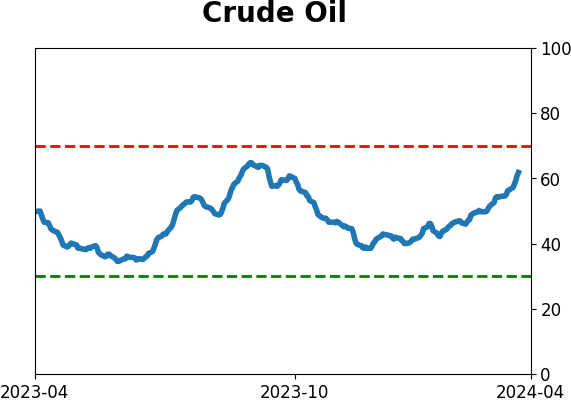
Optimism is also quite high in both unleaded gas and crude oil. Like the previous indicator, a signal does not necessarily accompany an exact market top. But overall, the historical results are troubling. The chart and table below display Crude Oil futures performance following a cross below 75% for the Unleaded Gas Optix indicator.
Back to cash
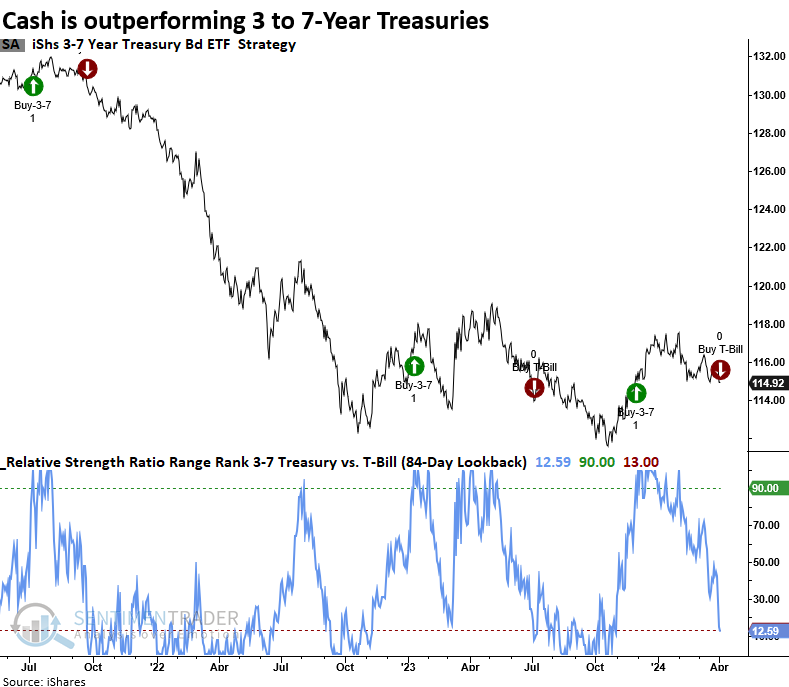
A relative strength timing model comparing 3 to 7-year Treasury bonds to cash rotated in favor of cash. Dean noted that similar rotations preceded falling prices for a medium-term Treasury bond ETF over the subsequent three months.
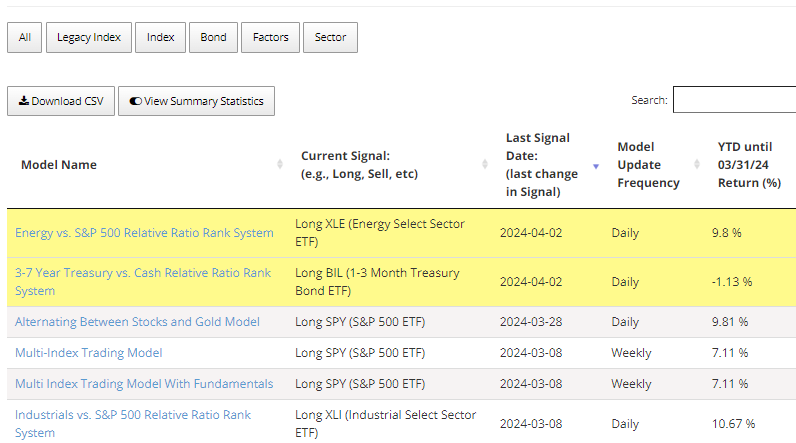
Two of the website's newly introduced relative strength timing models triggered a rotation signal at the close of trading on Tuesday. As the table below shows, new signals are highlighted in yellow on the strategies page to assess model changes efficiently. With the economy remaining resilient and inflation sticky, the 3 to 7-year Treasury relative strength timing model rotated away from the medium-term Treasury bond ETF (IEI) in favor of the 1 to 3-month T-Bill ETF (BIL), a proxy for cash.
Following the shift to cash in July 2023, the 3-to 7-year Treasury bond ETF declined, resulting in higher yields. This shift coincided with the peak in stock indexes, contributing to the 10% drop in the S&P 500.
Should the equity market take a breather from the torrid pace over the previous five months, a backup in yields could be the culprit.
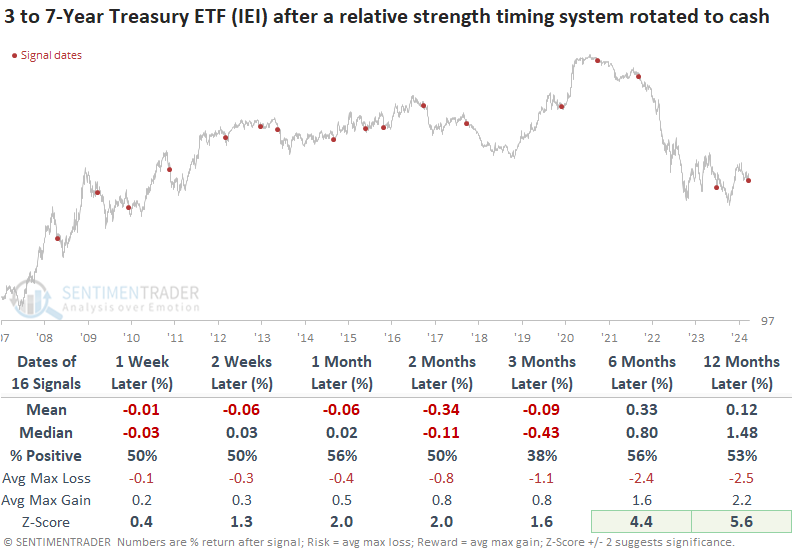
Once the 3-to 7-year Treasury relative strength timing model shifted in favor of a cash proxy, the medium-term Treasury bond ETF (IEI) struggled over the ensuing three months. That was especially the case with signals since 2016, with every precedent showing a loss at some point over that same period.
While long-term results look okay, we must remember that most instances occurred in a bullish uptrend for bond prices.
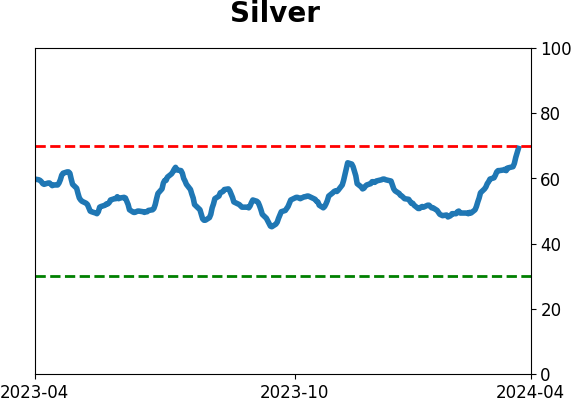
When things go right in silver
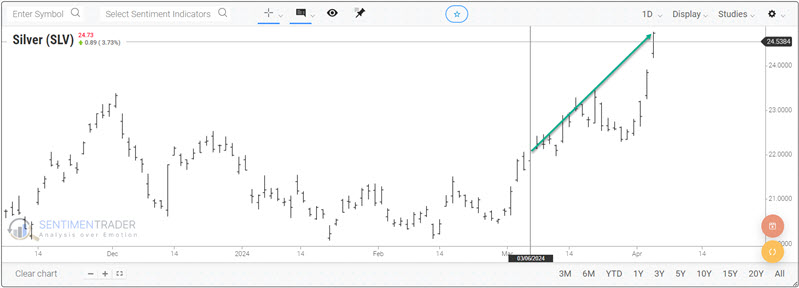
The iShares Silver Trust (ticker SLV) has soared, and an example trade from early March shows an open profit. Jay discussed some choices - and the critical tradeoffs - that a trader might make now.
In an article about a month ago, Jay noted an example option trade - a "strangle" dated 2024-03-06 using options on ticker SLV. The trade was intended as cheap speculation that silver would break out decisively in one direction or the other. The good news is that SLV has moved decisively higher, and the example strangle is sitting with a decent open profit.
At this point, a trader holding the SLV 20-25 strangle must decide whether to take a profit, let it ride, or adjust the original trade. There are pros and cons to be considered for each.
The figures below display the status of this position at the close on 2024-04-03 after SLV rallied from $22.10 a share to $24.72.
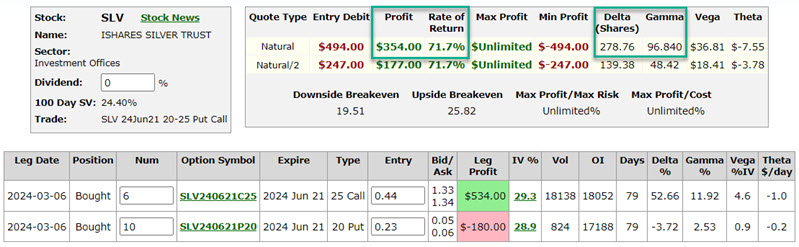
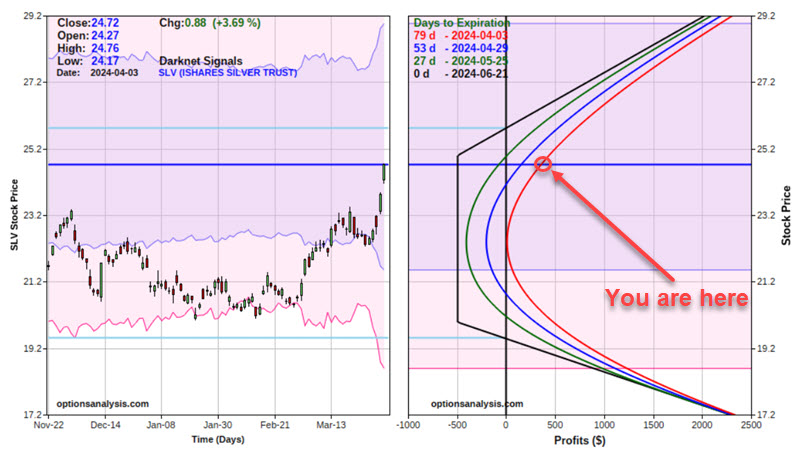
A roughly 12% move in the price of SLV has generated an open profit of almost 72% using options on SLV. At this point, the trade shows an open profit of 71.7%, and several choices are on the table. The critical thing to note is that there are no right or wrong answers, only answers that make sense for an individual trader.
- Cash out
- Let it ride
- Adjust the trade
A third possibility is to exit or adjust the original trade and attempt to lock in a profit while allowing for further upside potential. The reality is there are essentially a limitless number of potential adjustments. The one detailed below is merely an example.
For our example, we will completely exit the original Jun21 20-25 strangle trade and establish a new Jun21 30-35 bull call spread to lock in profit but still leave the potential for some further upside.
The legs of the adjustment now are:
- Sell 6 SLV Jun21 25 calls @ $1.33 (exit original position Leg #1)
- Sell 10 SLV Jun21 20 puts @ $0.05 (exit original position Leg #2)
- Buy 10 SLV Jun21 30 calls @ $0.35 (enter bull call spread Leg #1)
- Sell 10 SLV Jun21 35 calls @ $0.13 (enter bull call spread Leg #2)
The particulars for the full trade after adjustments appear below.
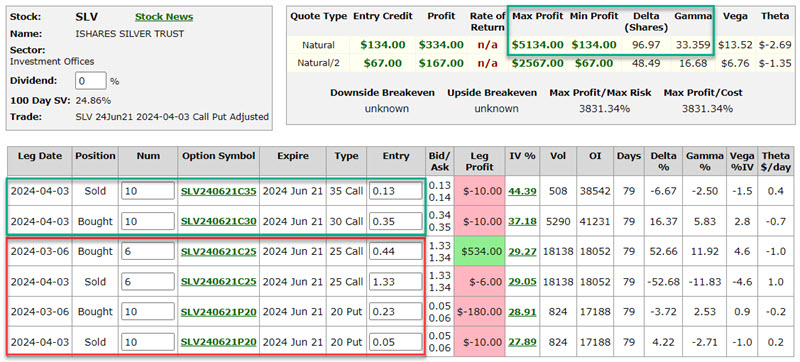
If SLV fails to rally, the existing open profit will decline. However, the worst case is a profit of $134 - a trader is now playing with "house money" betting on a continued rally in SLV. The maximum profit potential is now $5,134. Note that the delta of 96.97 and gamma of 33.36 indicate that this adjusted position has significantly less upside potential than the original trade.
About TradingEdge Weekly...
The goal of TradingEdge Weekly is to summarize some of the research published to SentimenTrader over the past week. Sometimes there is a lot to digest, and this summary highlights the highest conviction or most compelling ideas we discussed. This is NOT the published research; rather, it pulls out some of the most relevant parts. It includes links to the published research for convenience, and if you don't subscribe to those products, it will present the options for access.
Indicators at Extremes
|
|
|
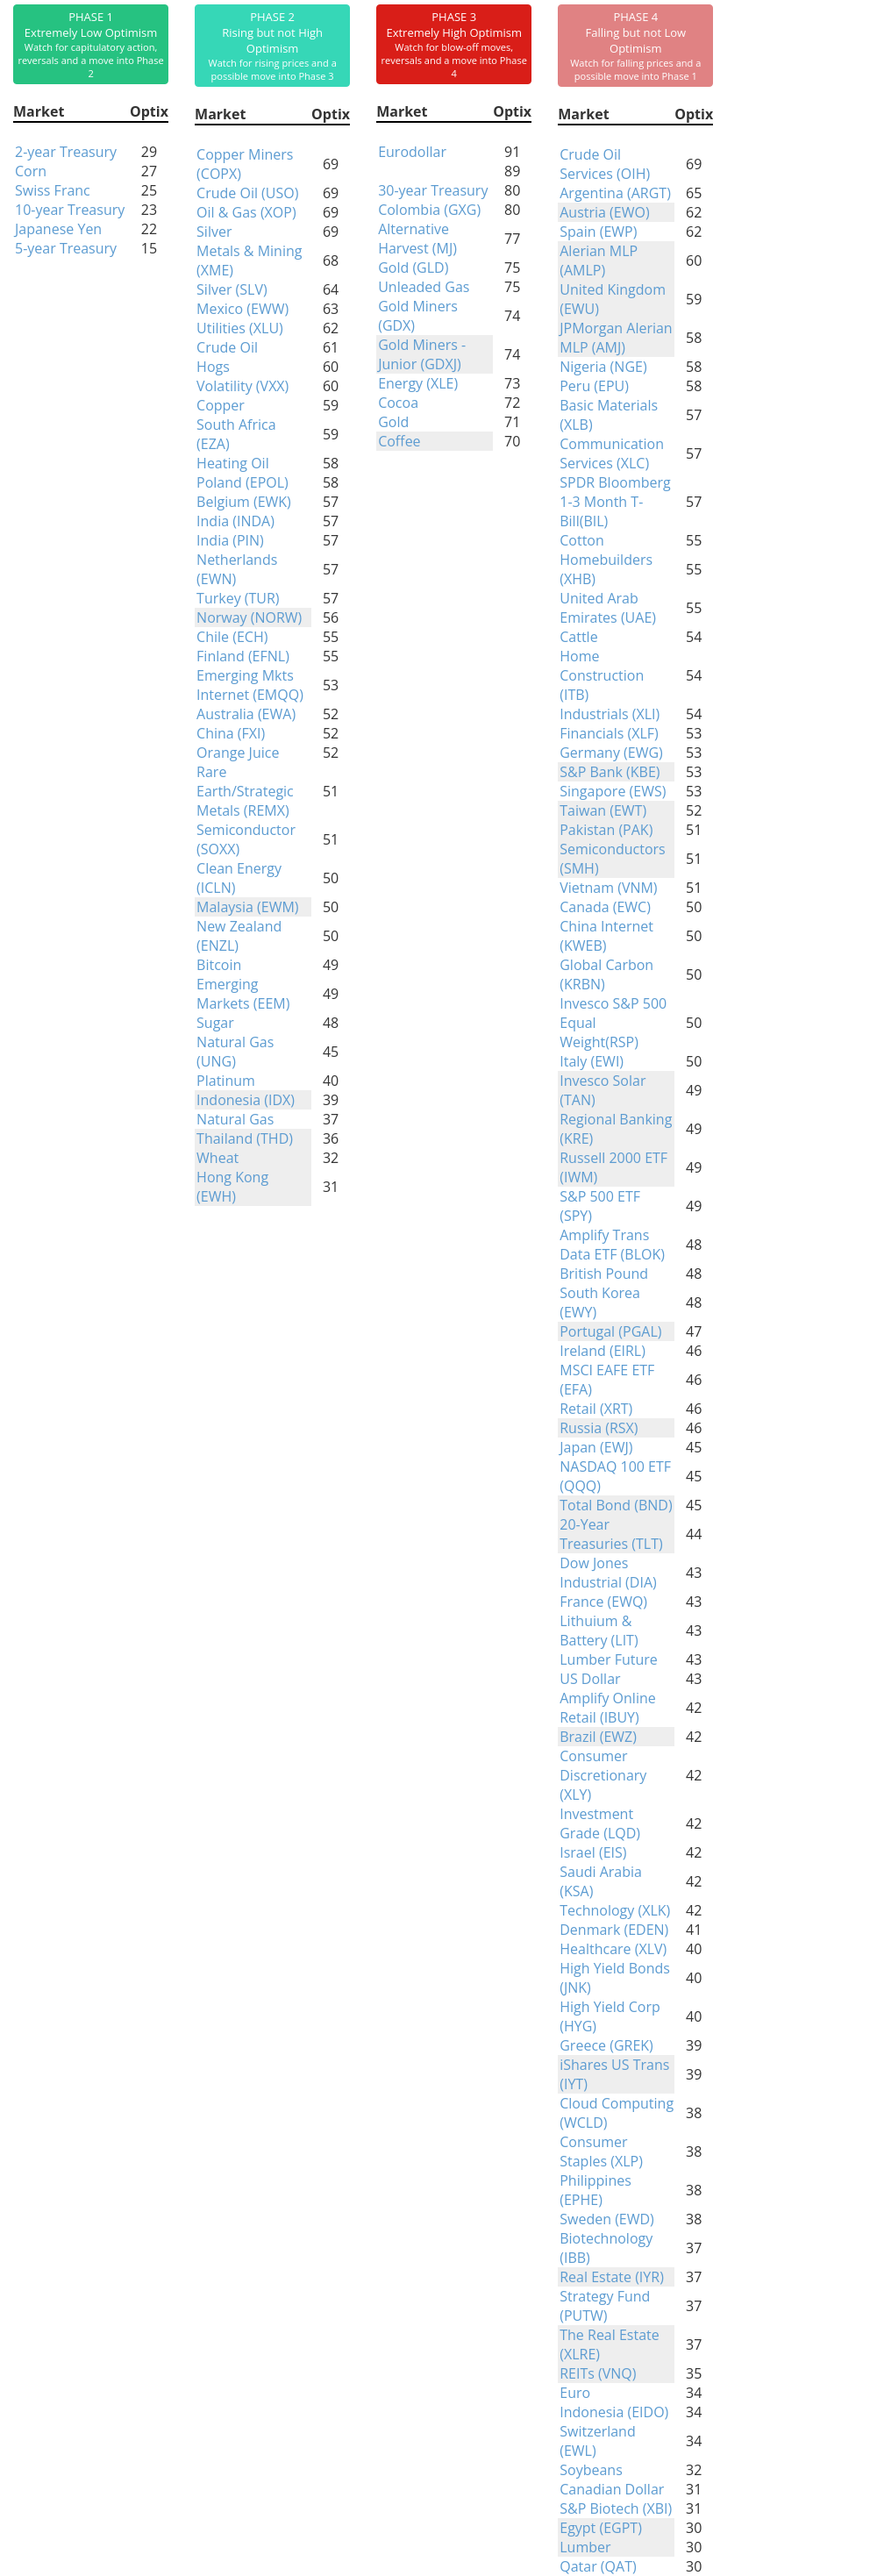
Phase Table
|
|
|
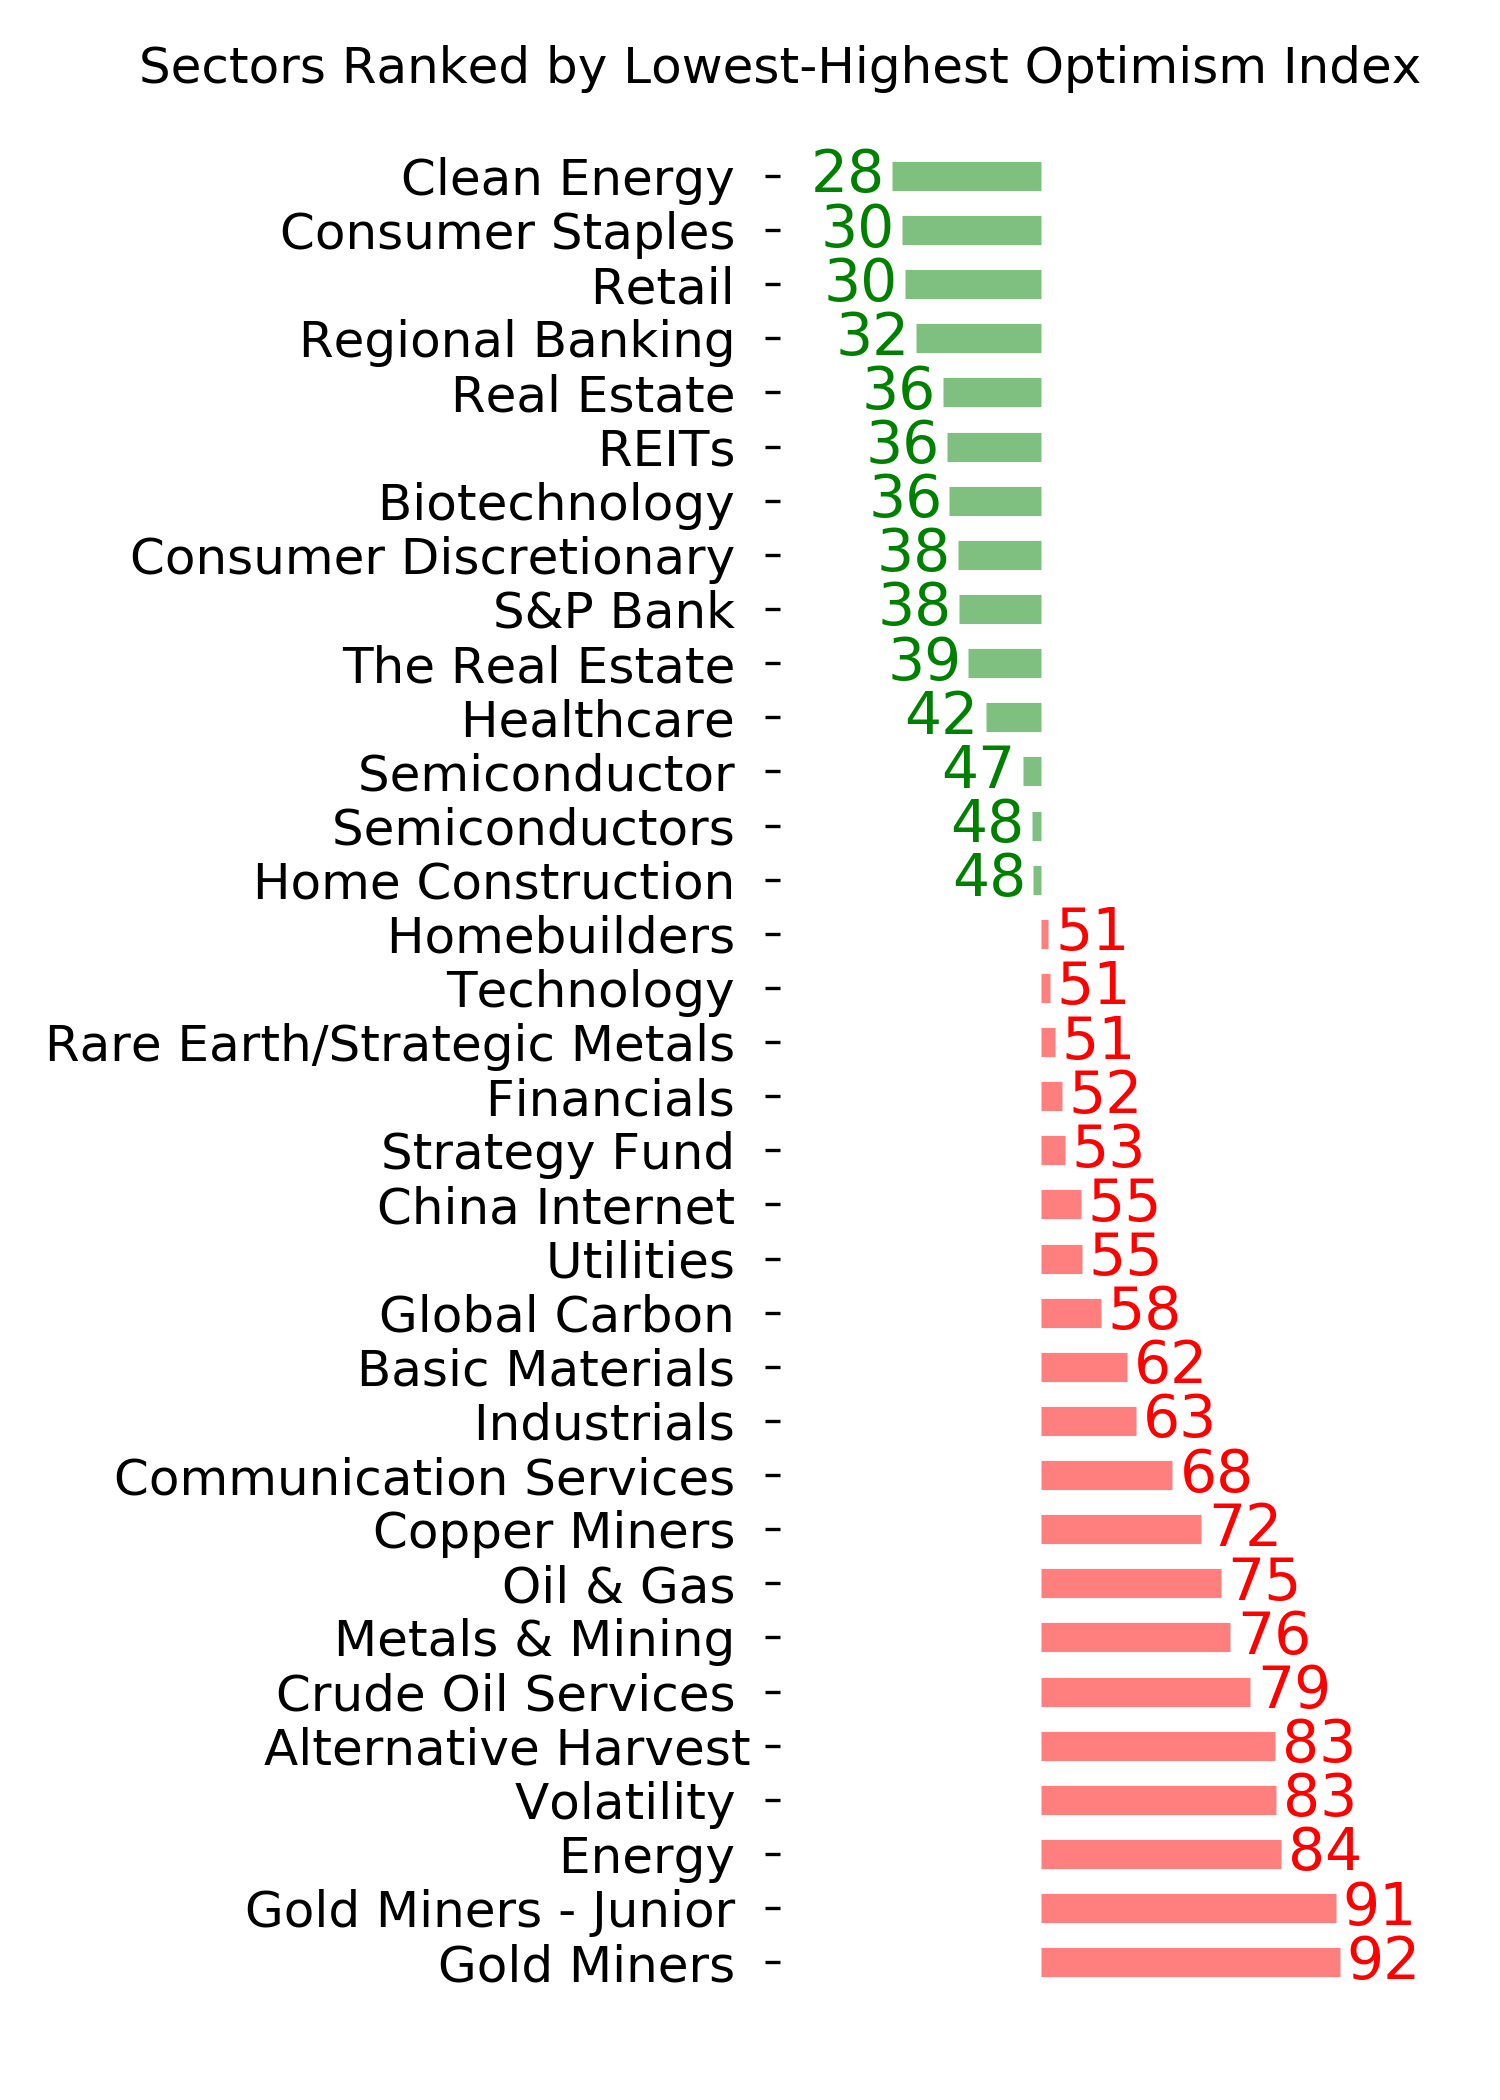
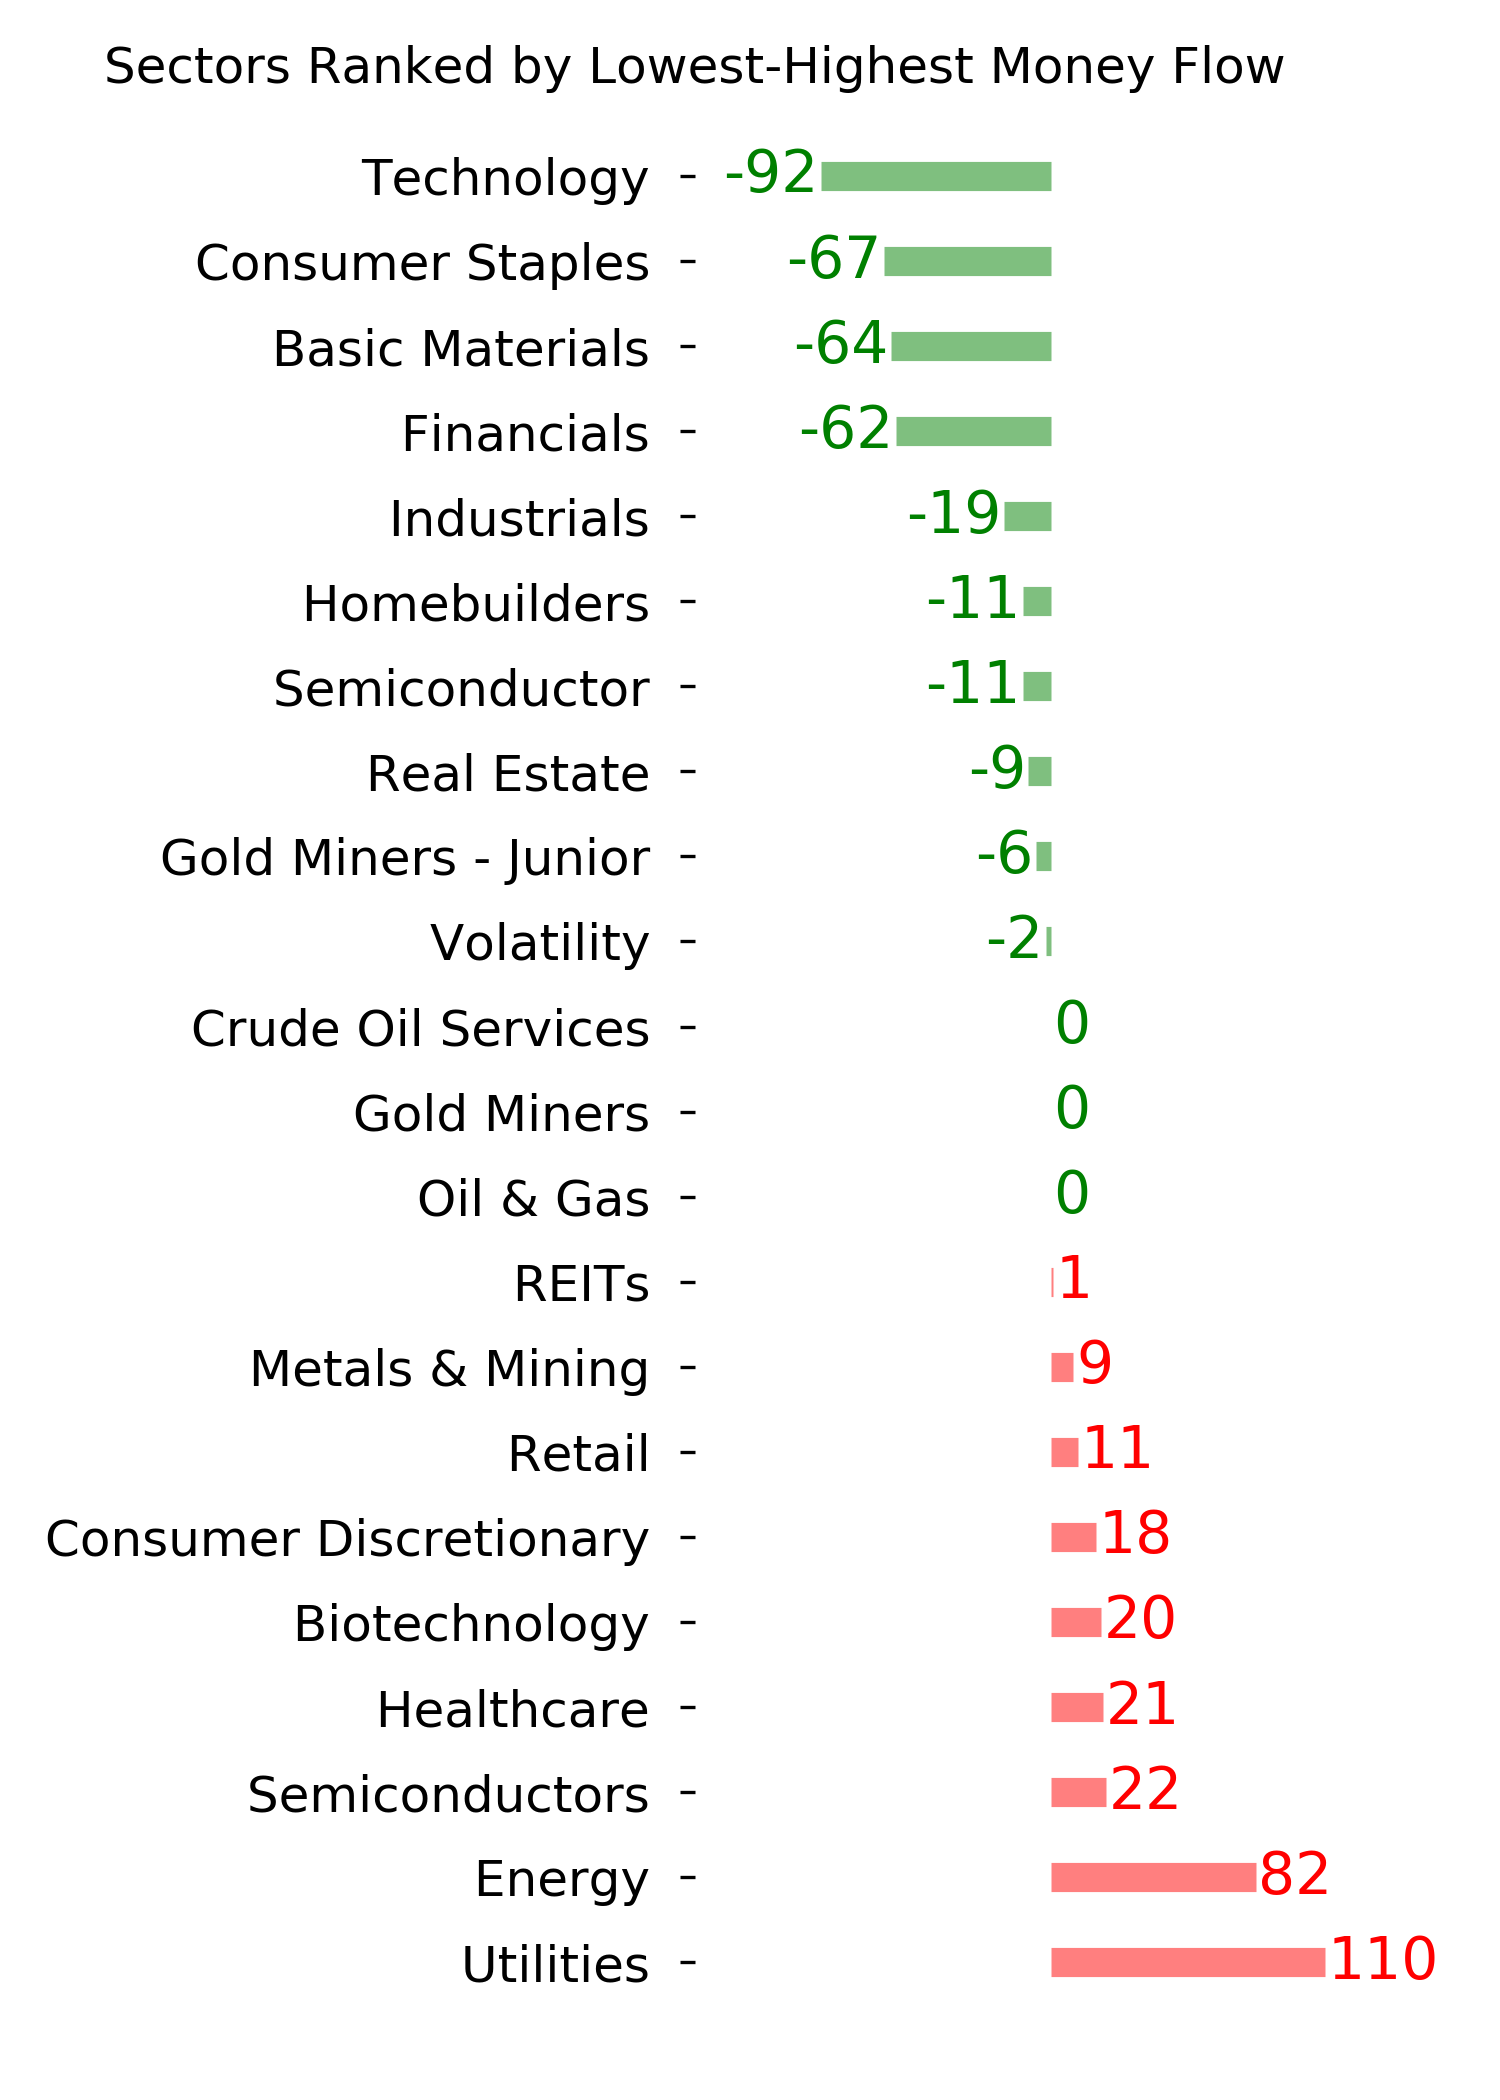
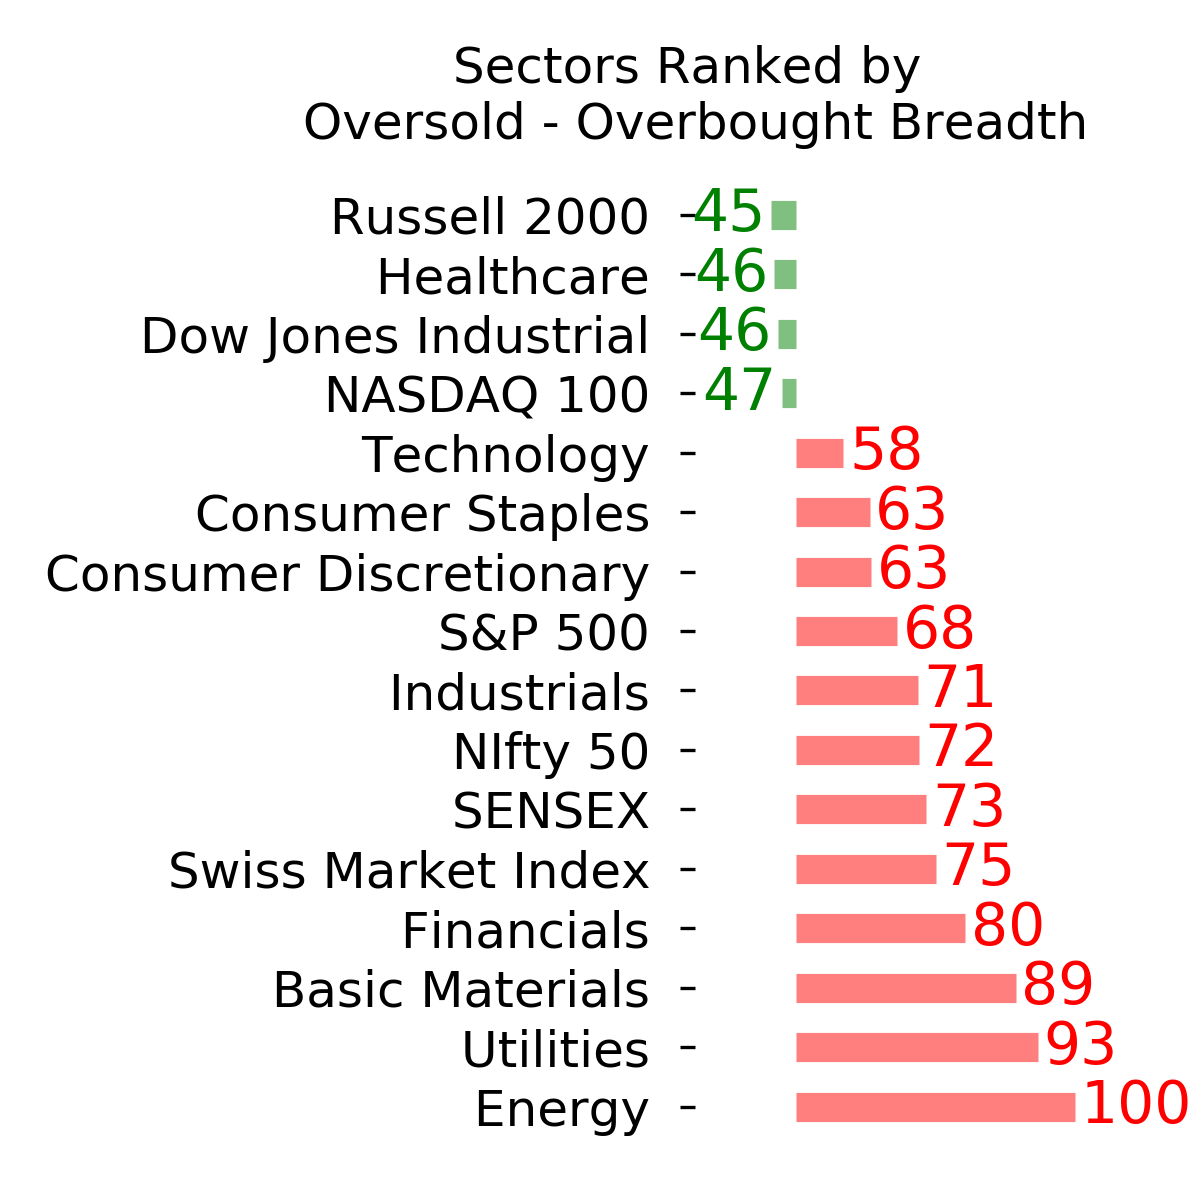
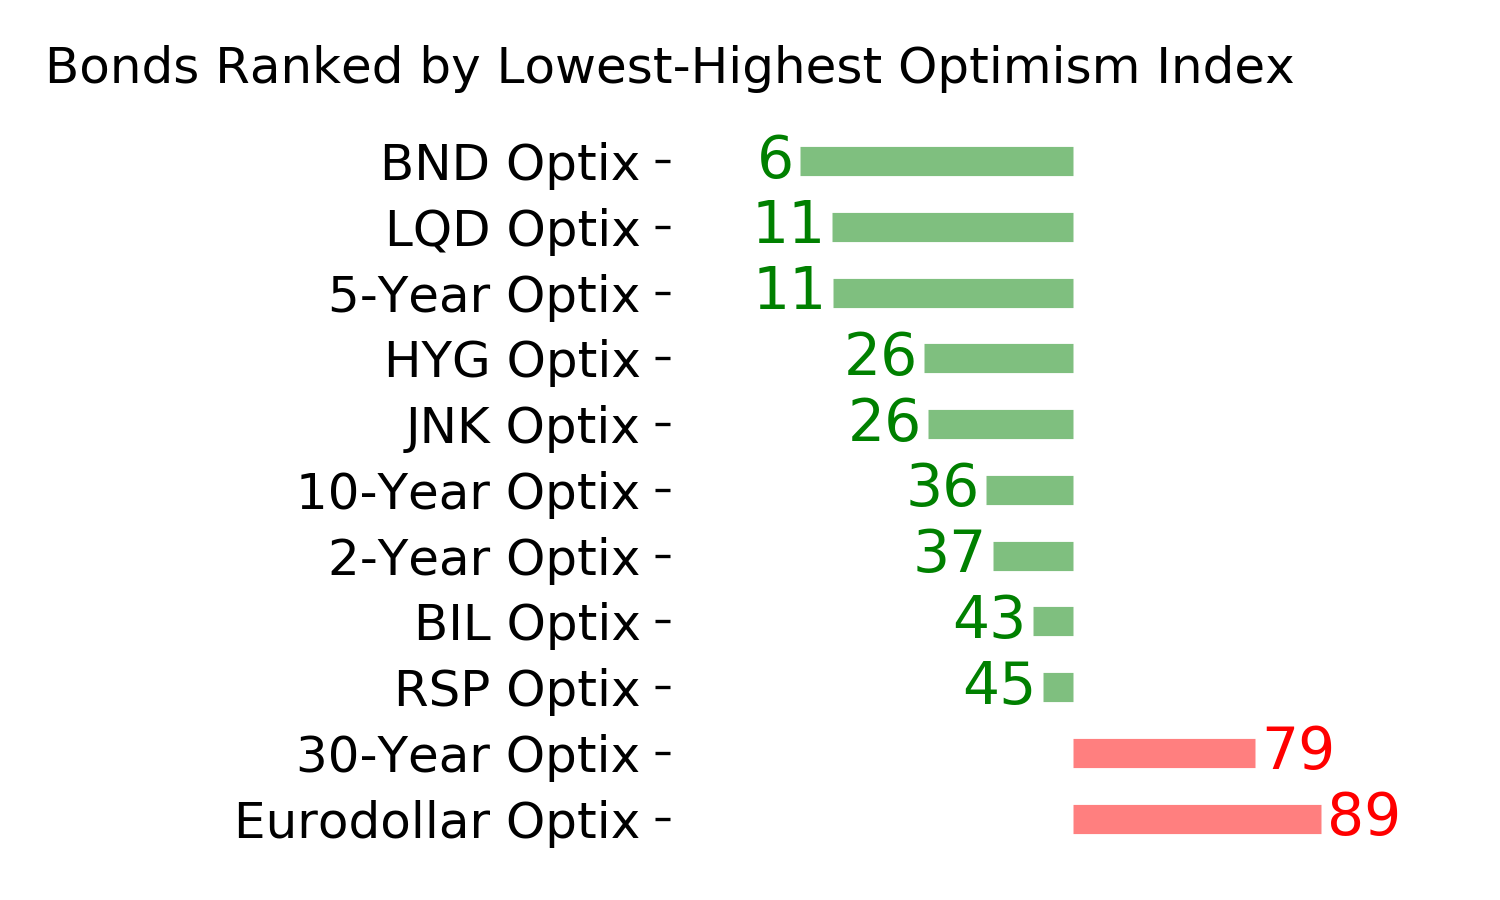
Ranks
|
|
|
|
|
|
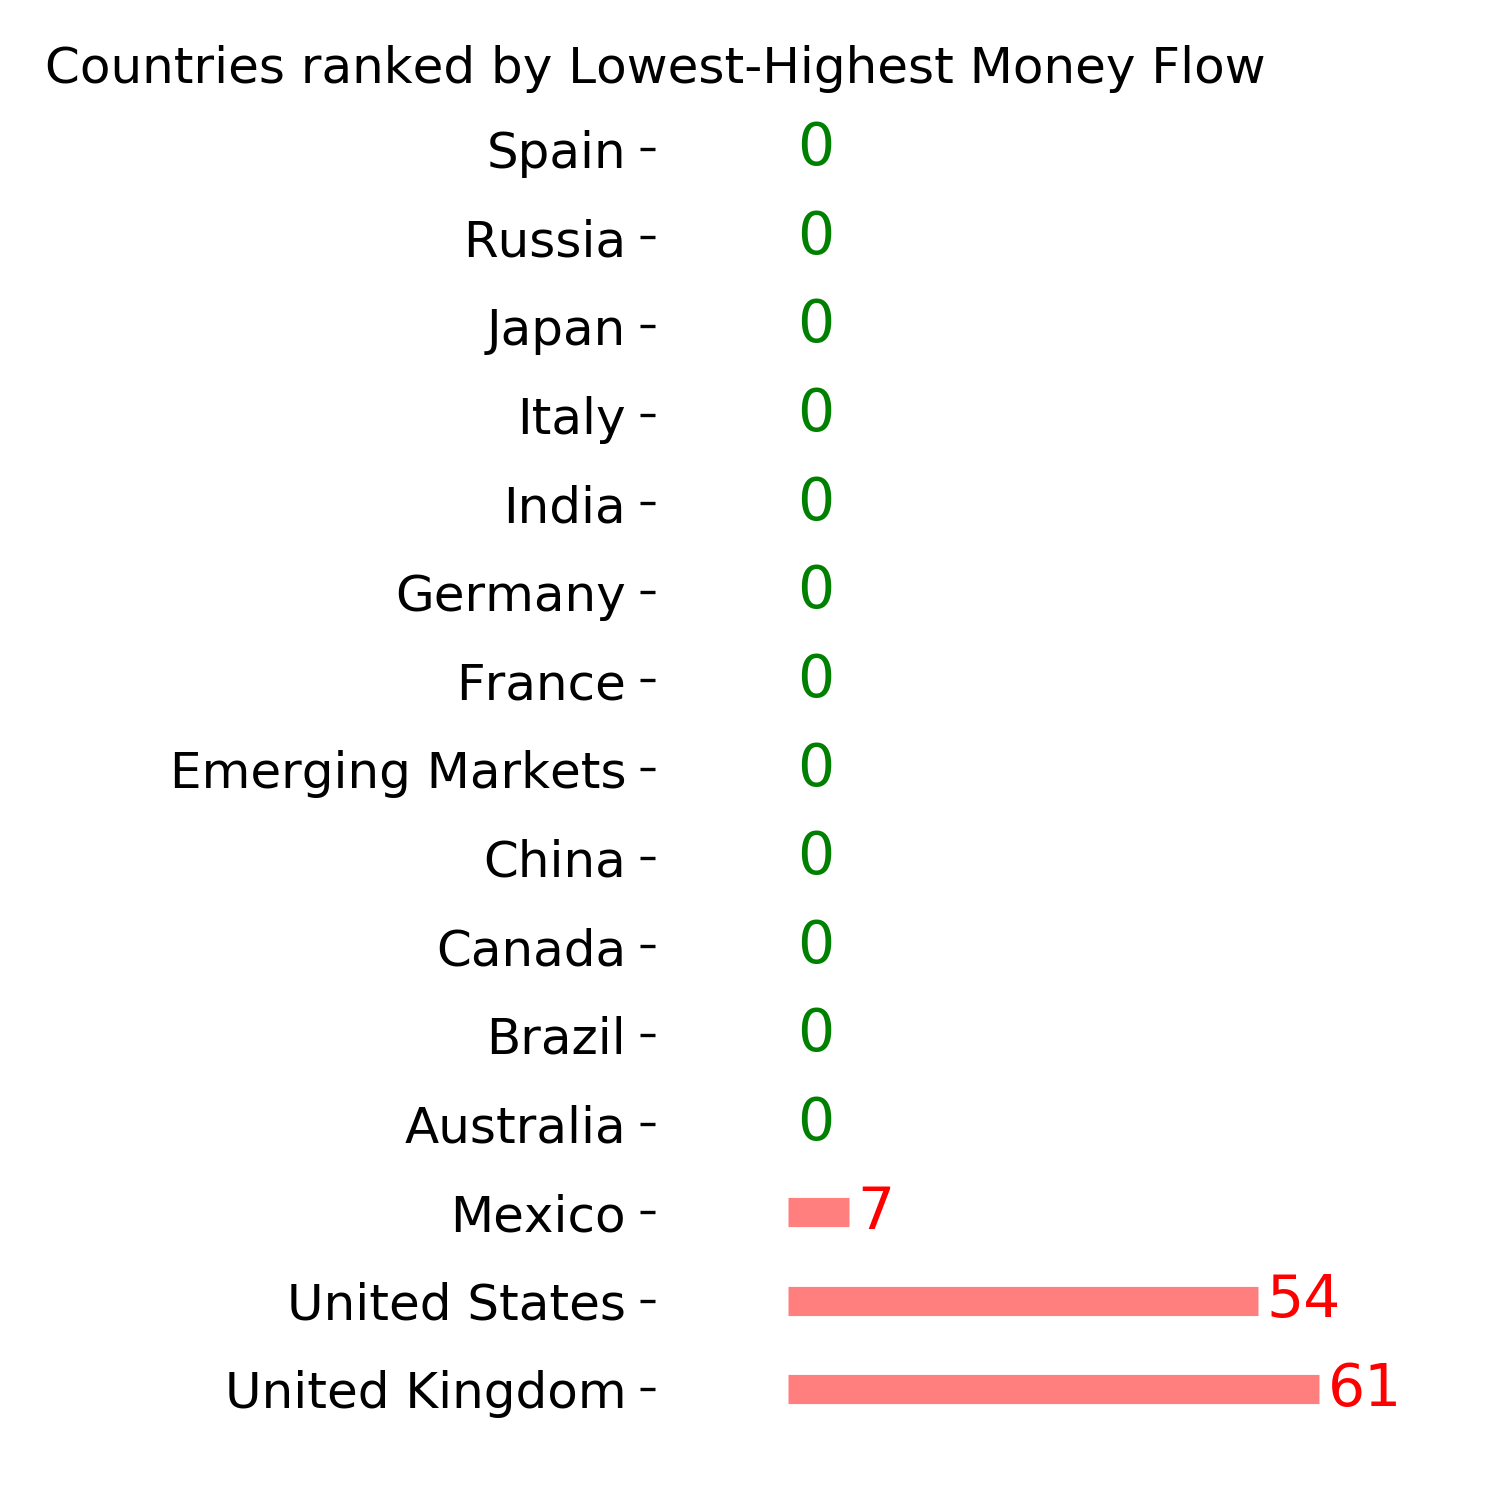
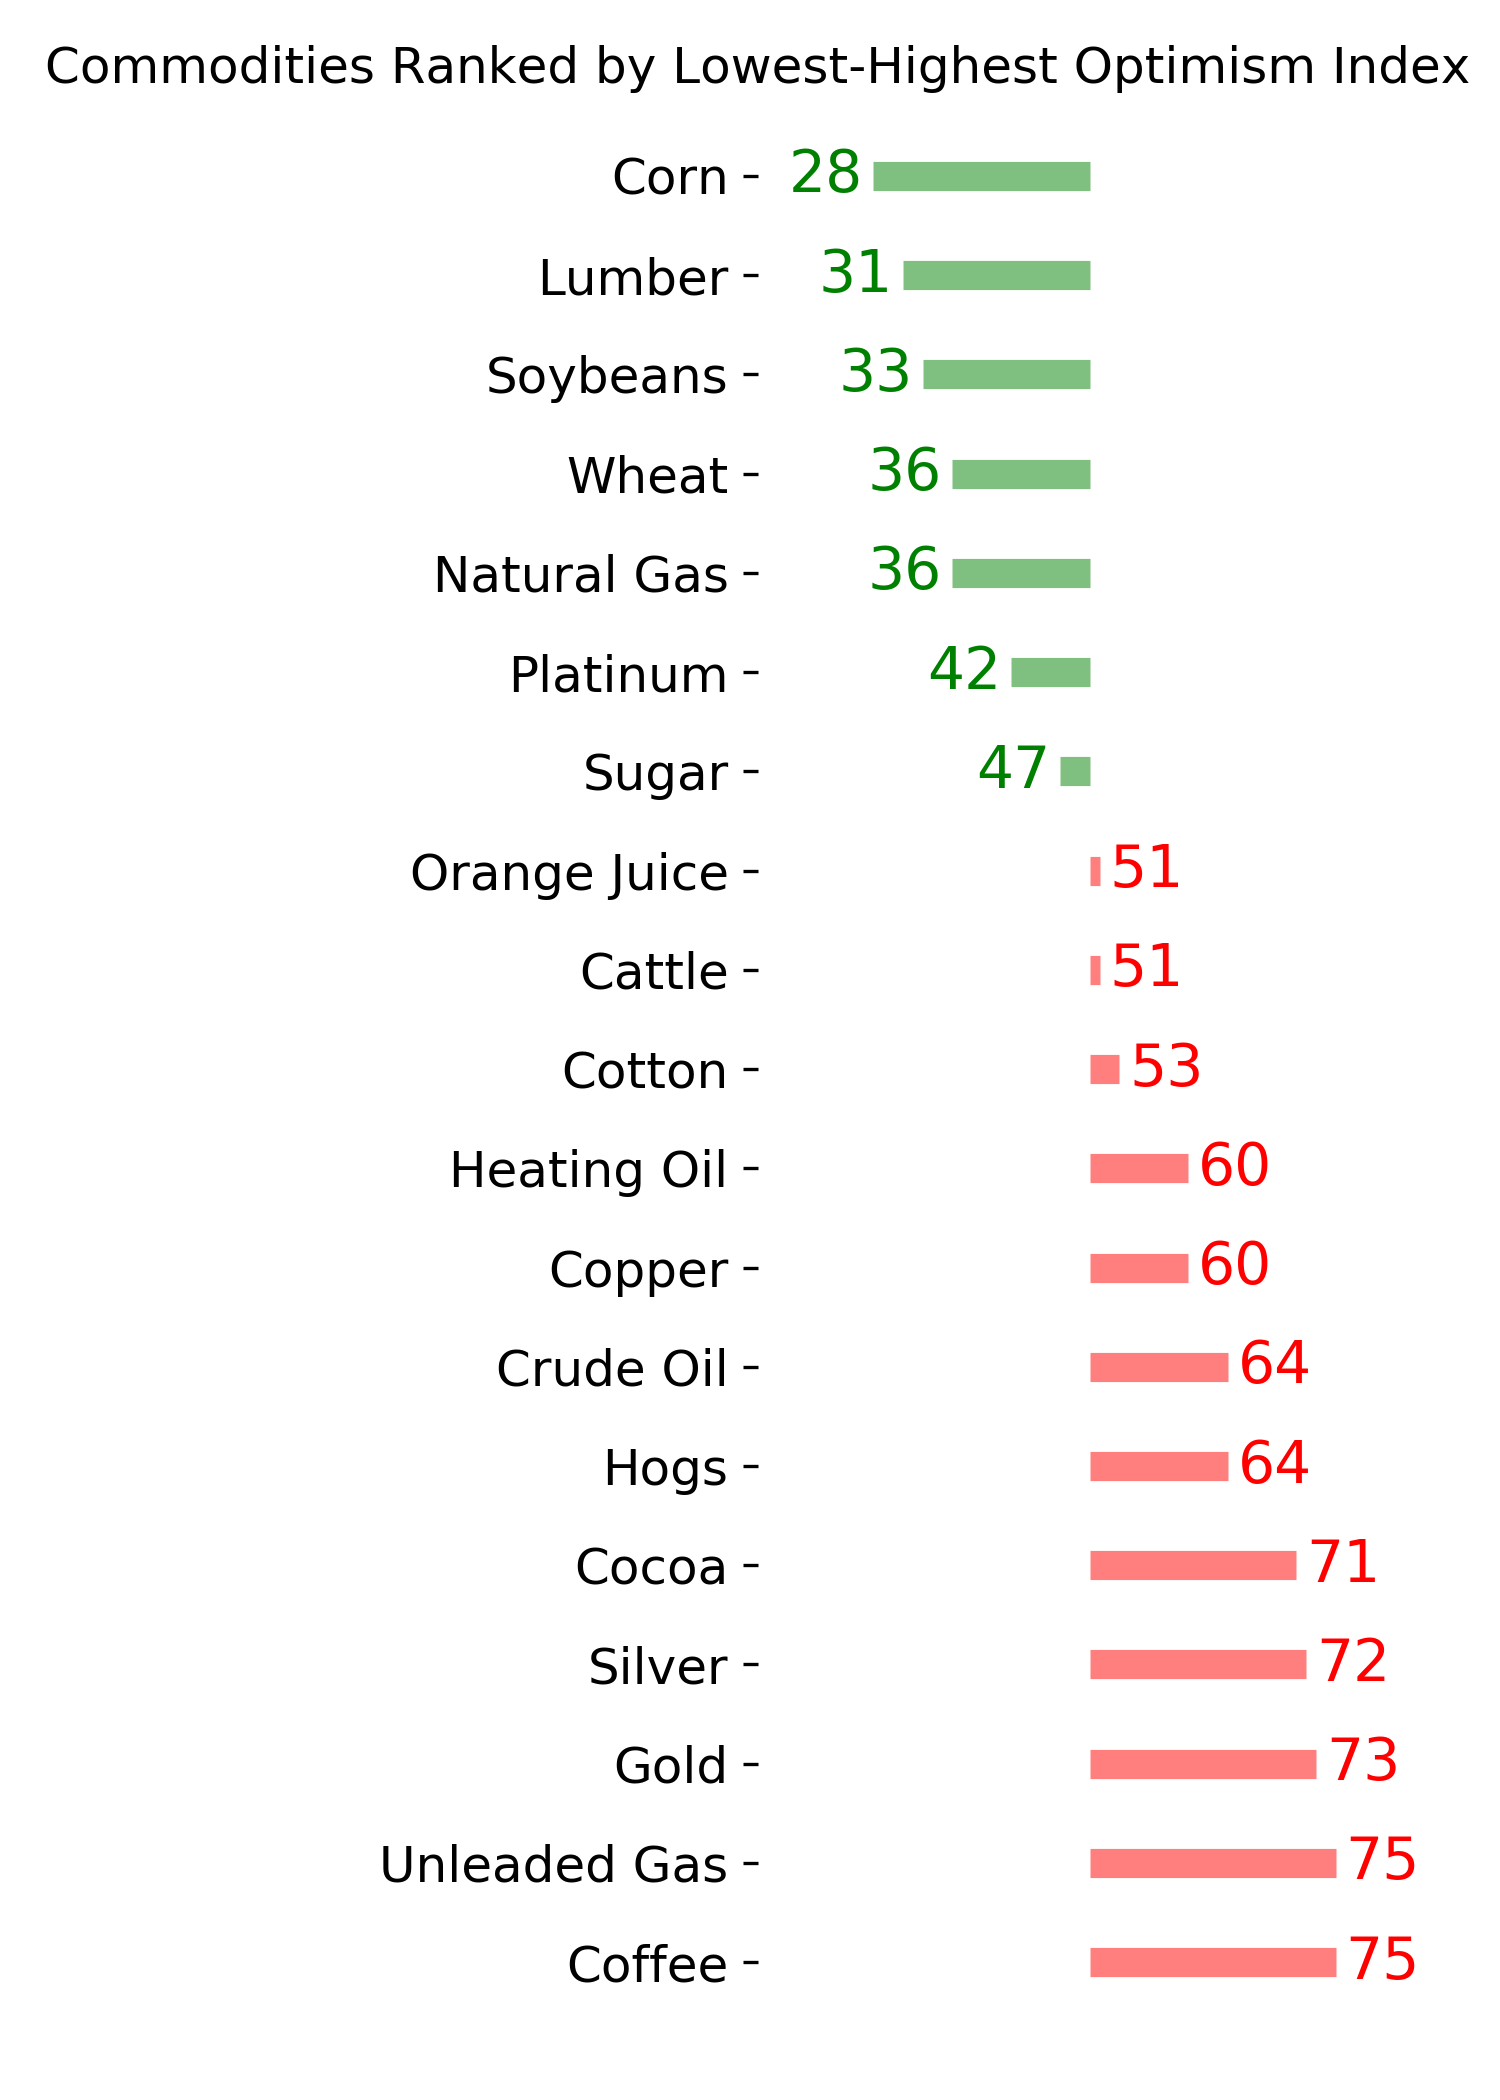
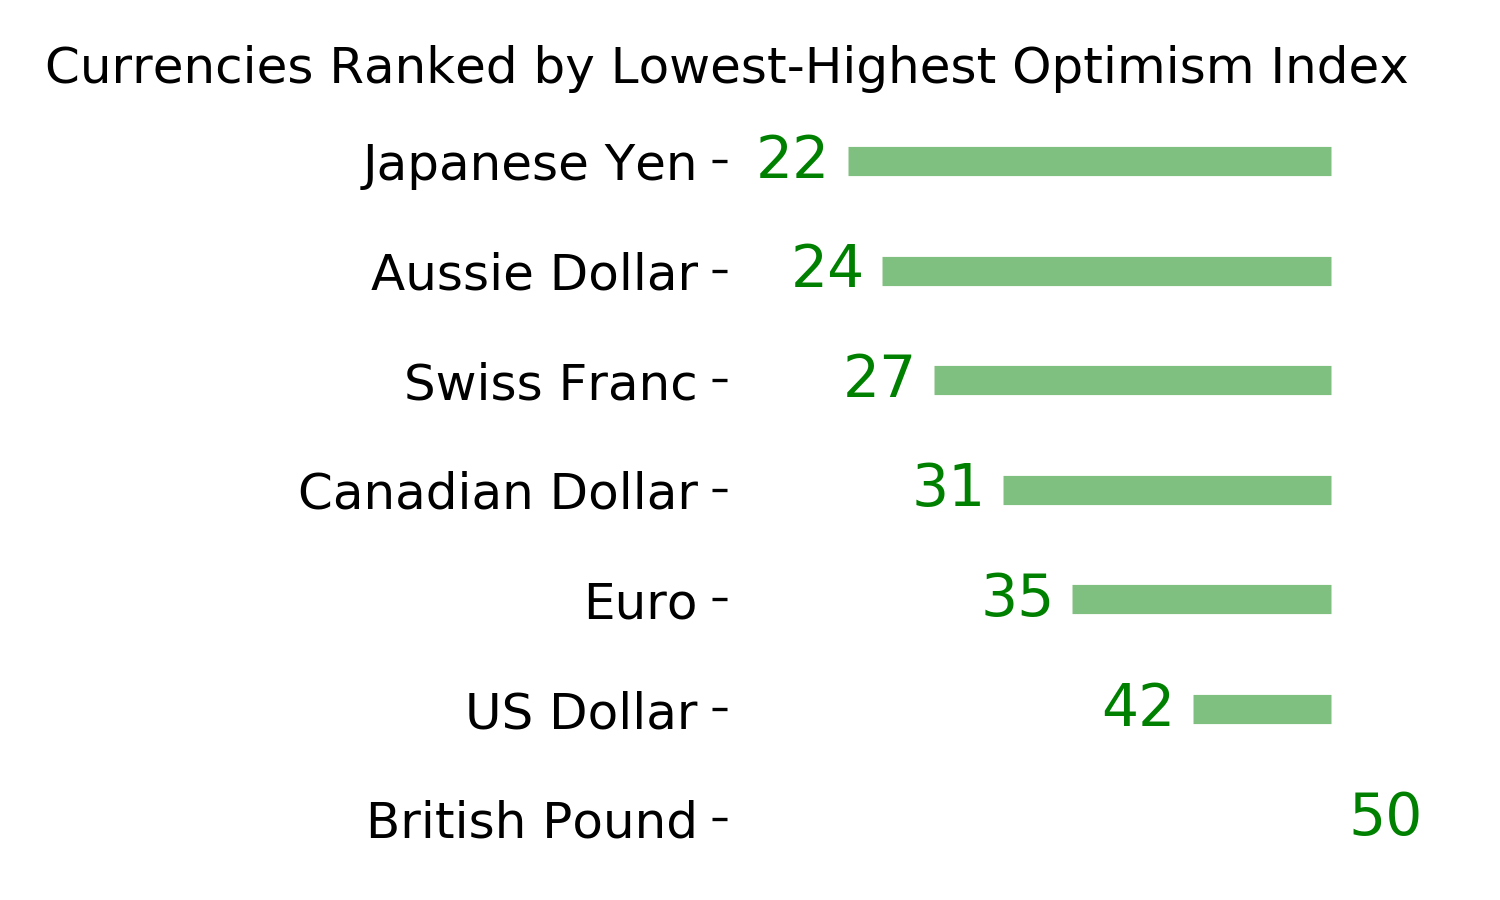
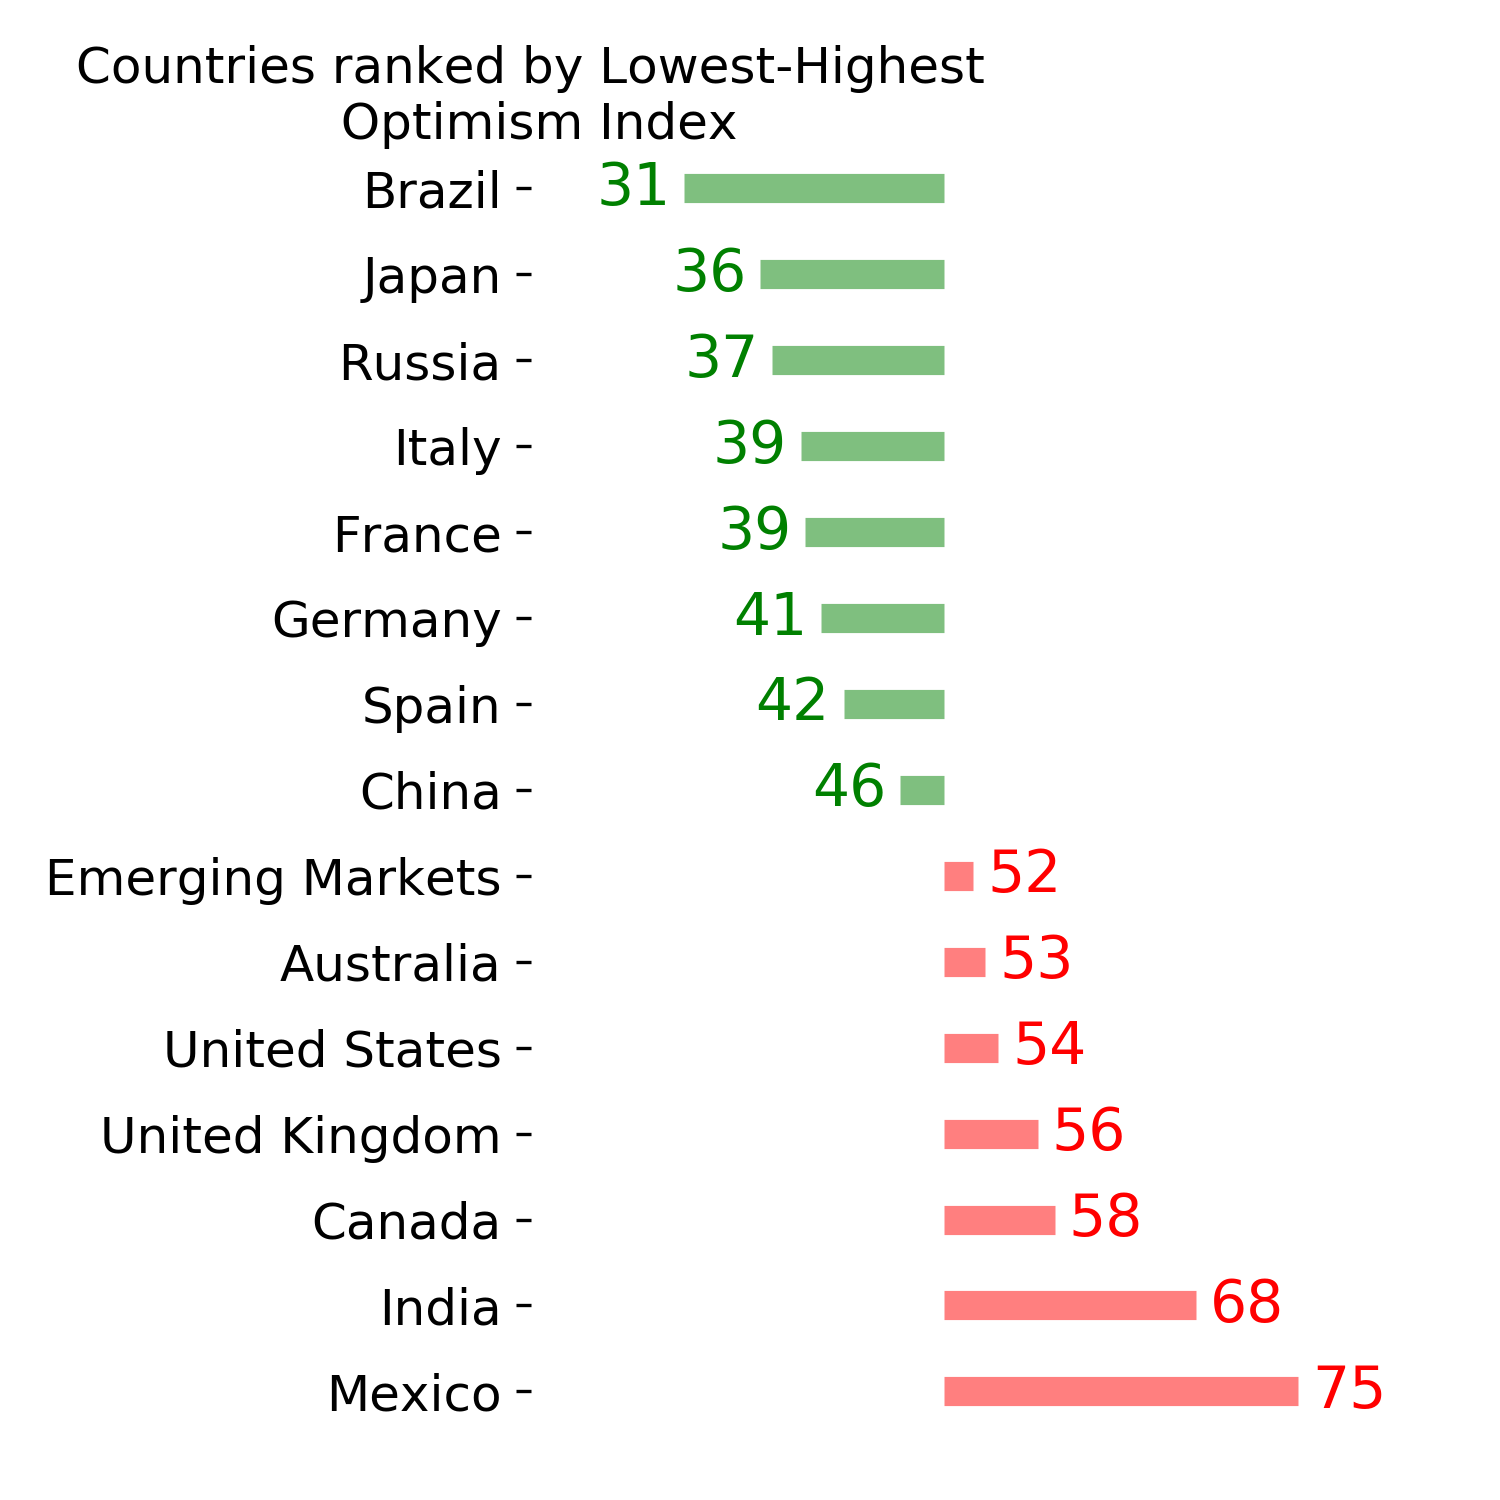
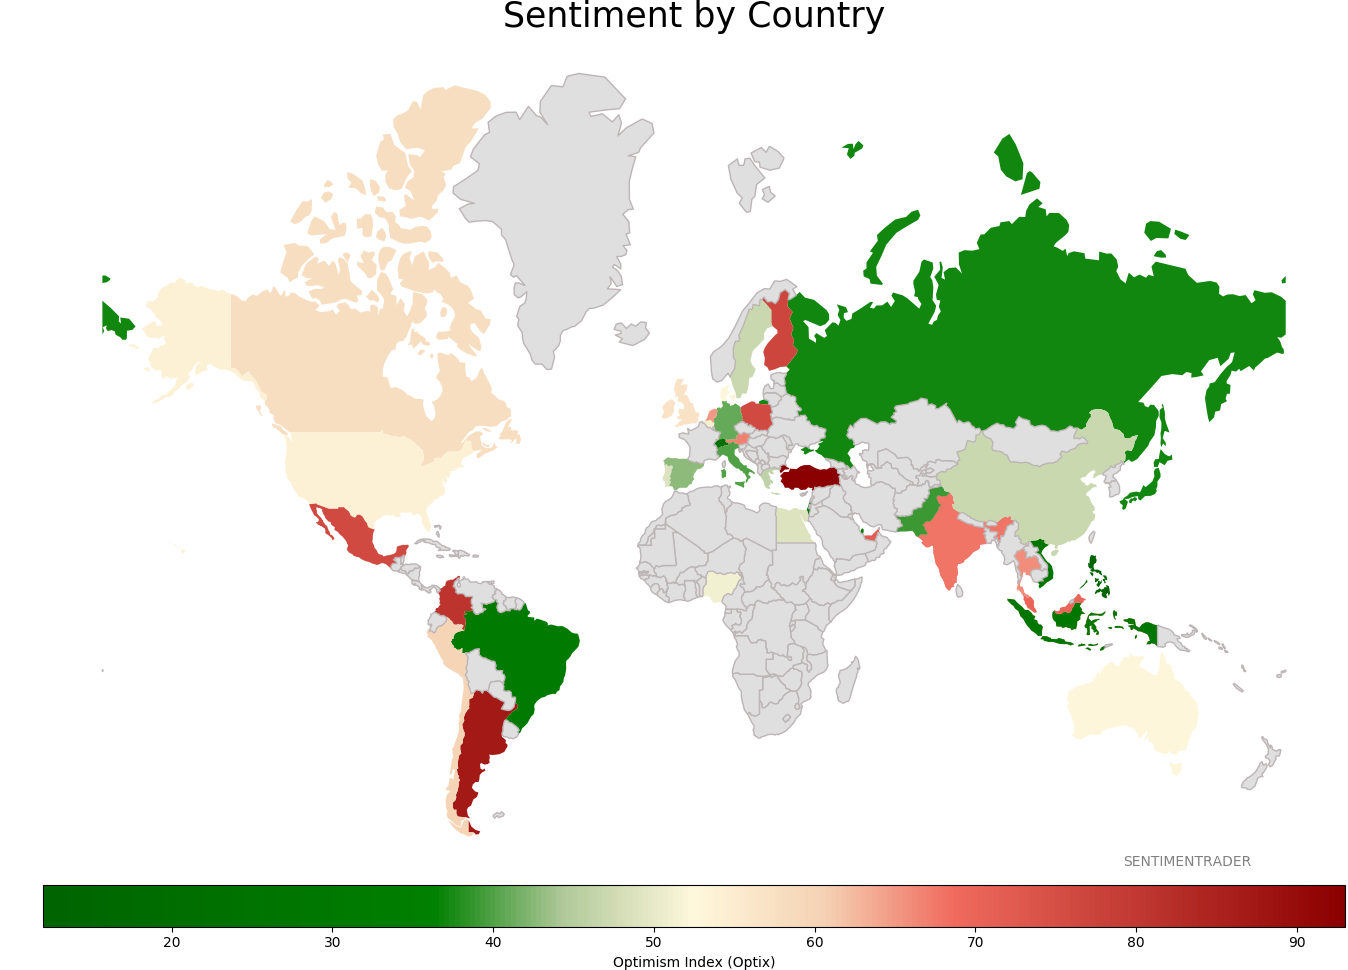
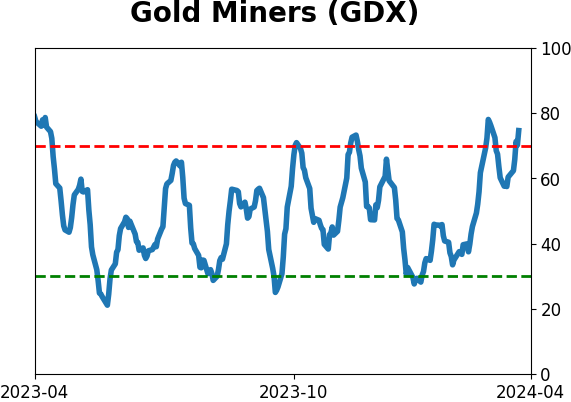
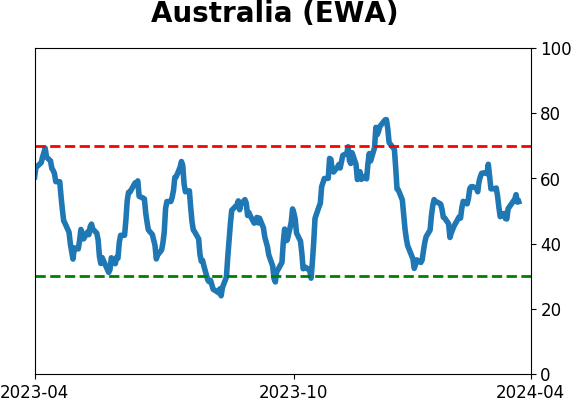
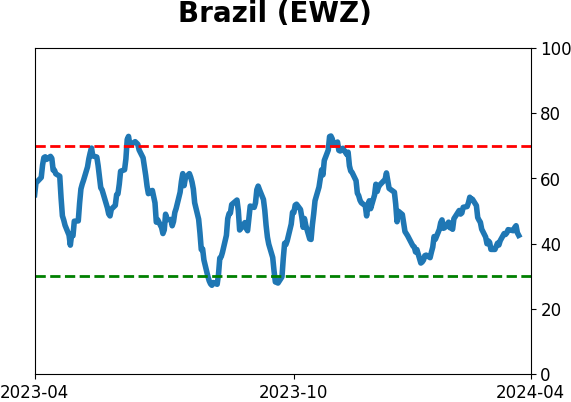
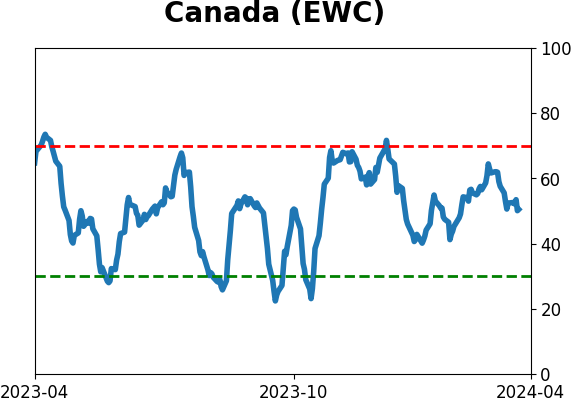
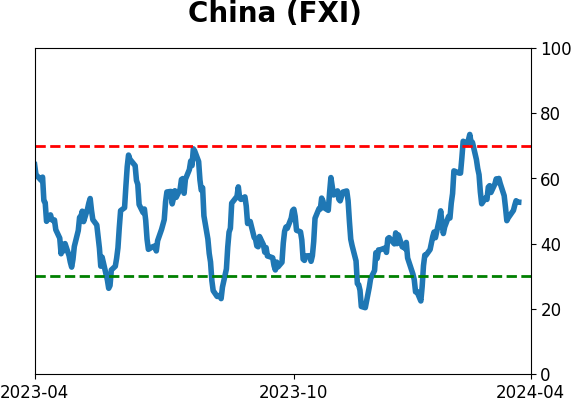
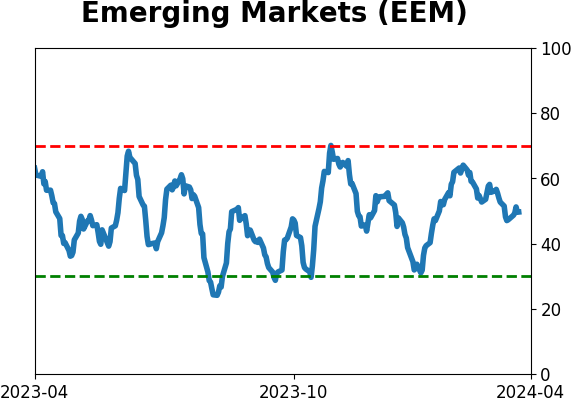
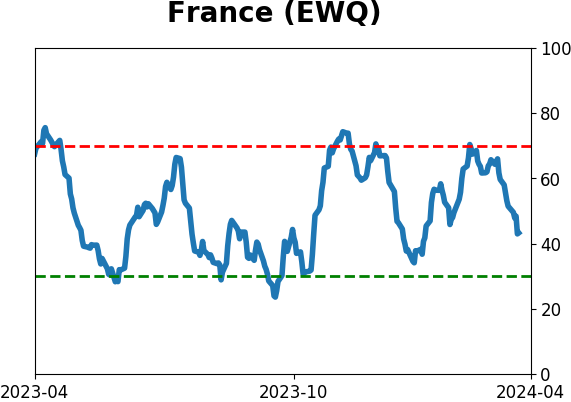
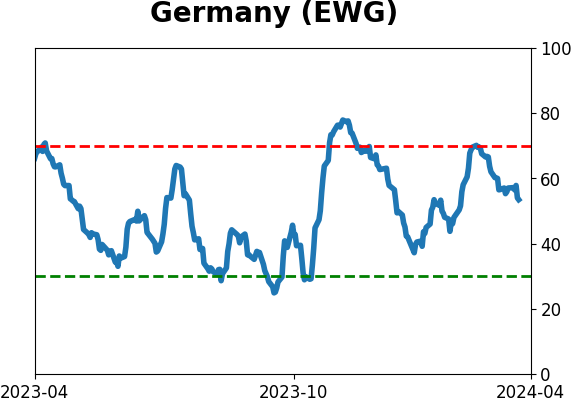
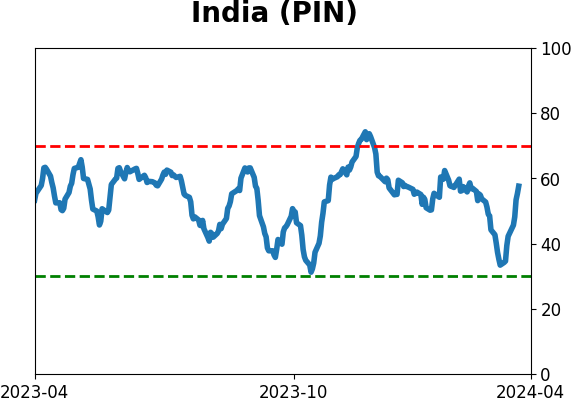
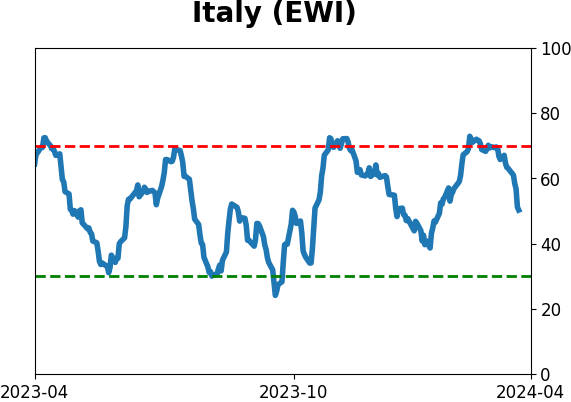
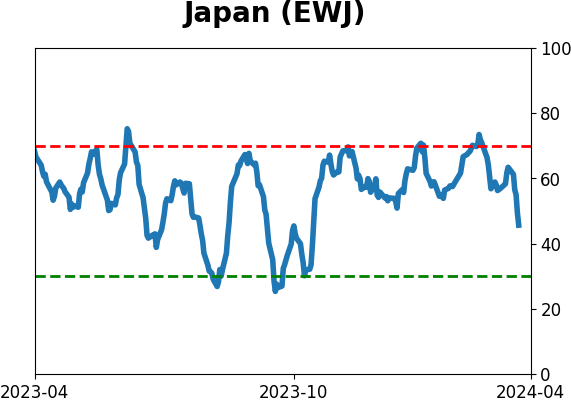
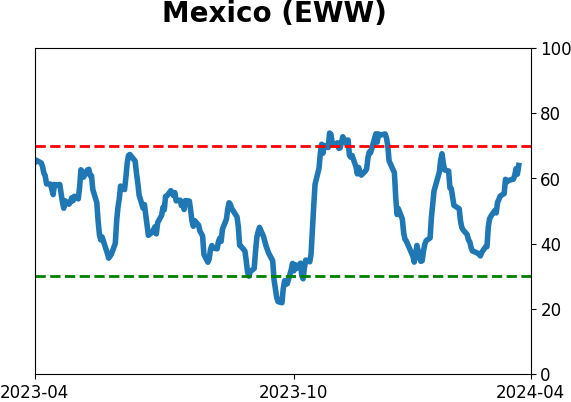
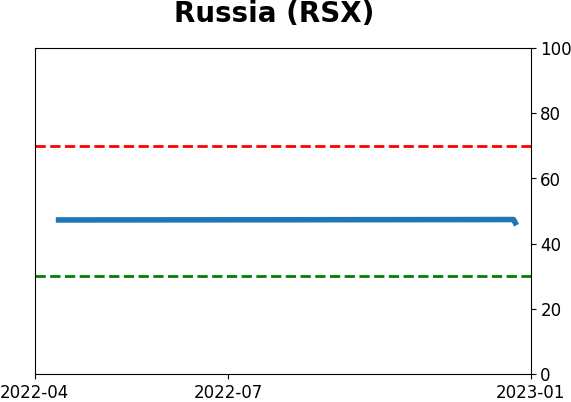
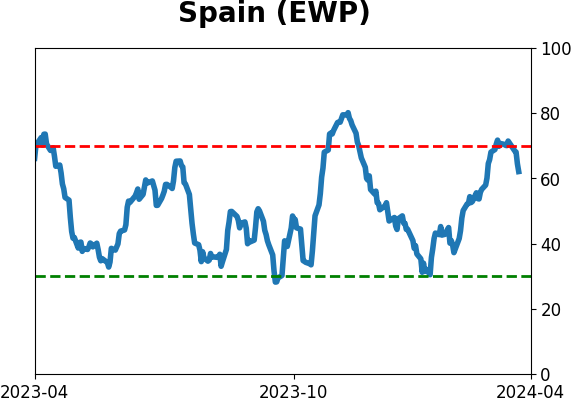
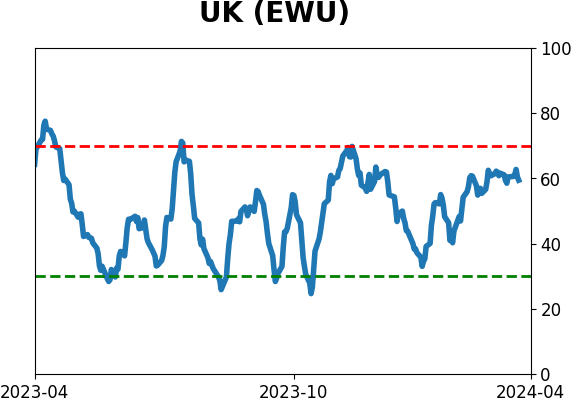
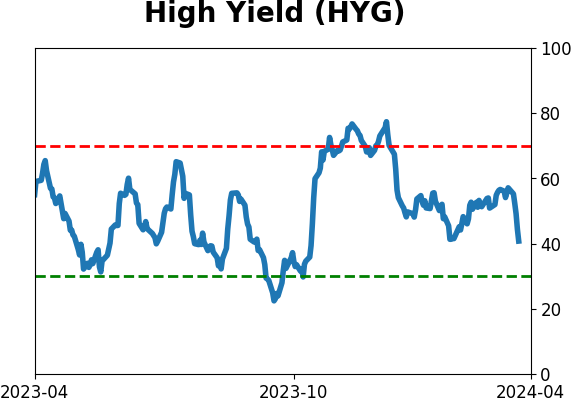
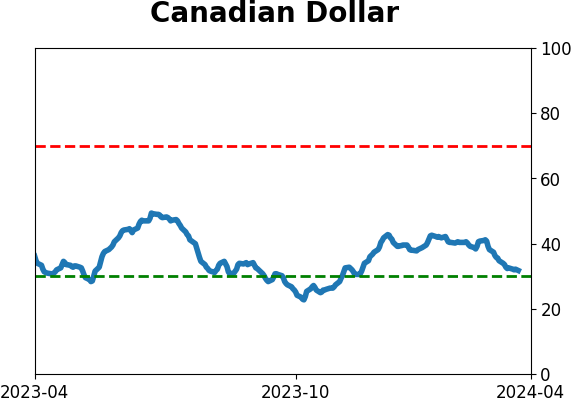
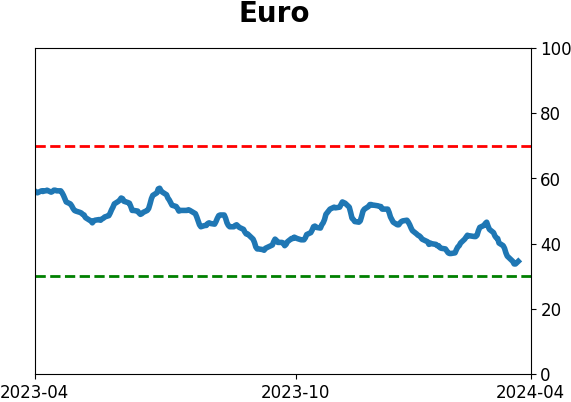
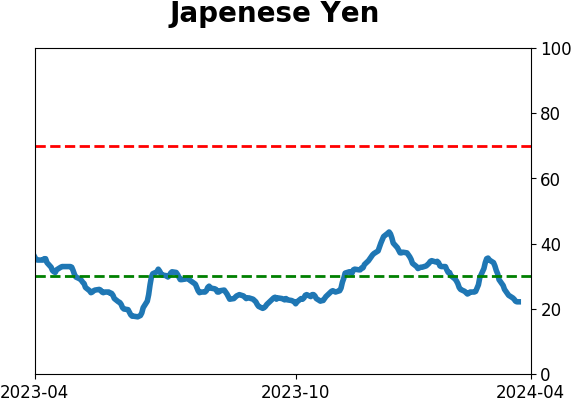
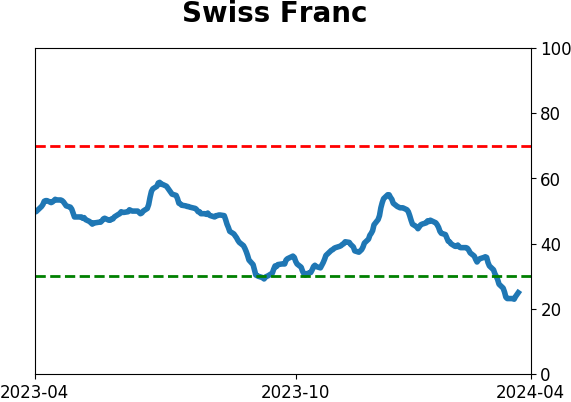
Sentiment Around The World
|
|
|
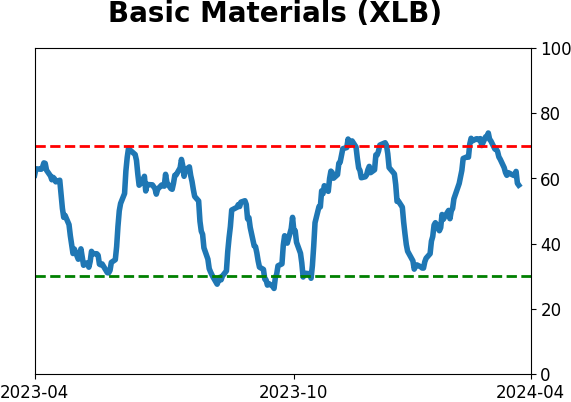
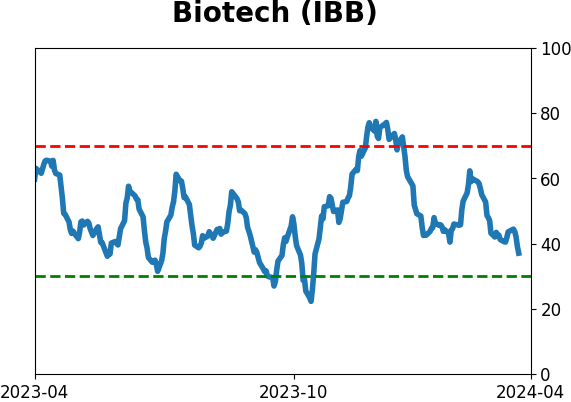
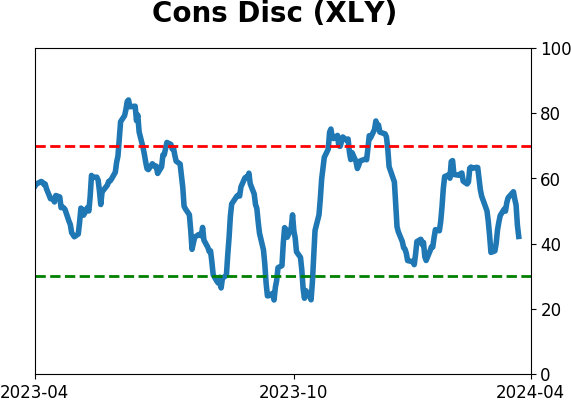
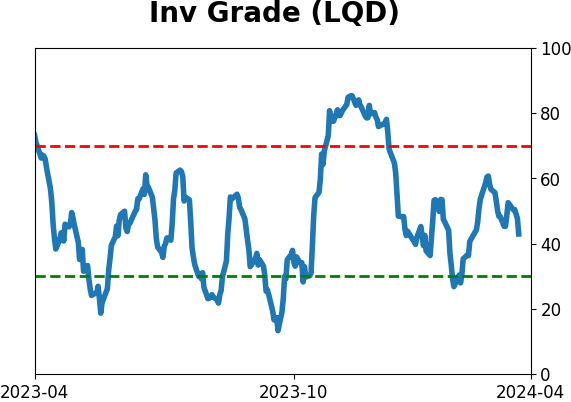
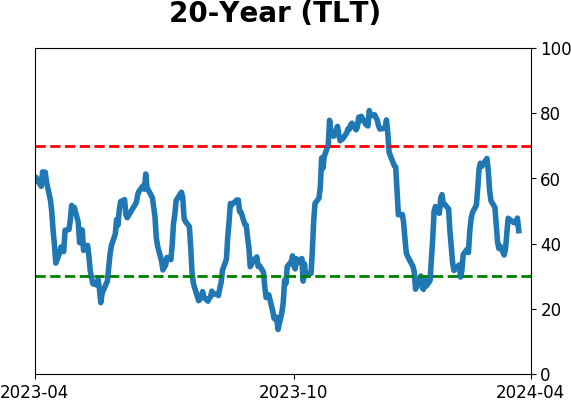
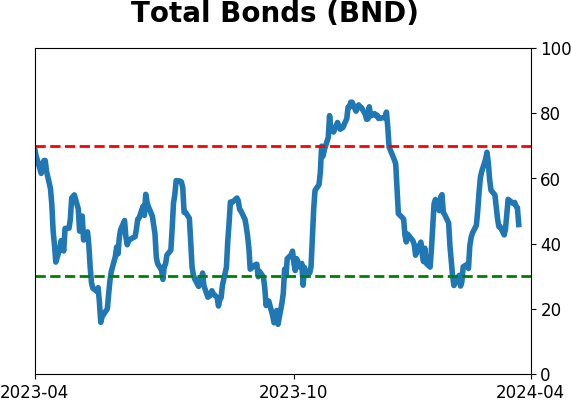
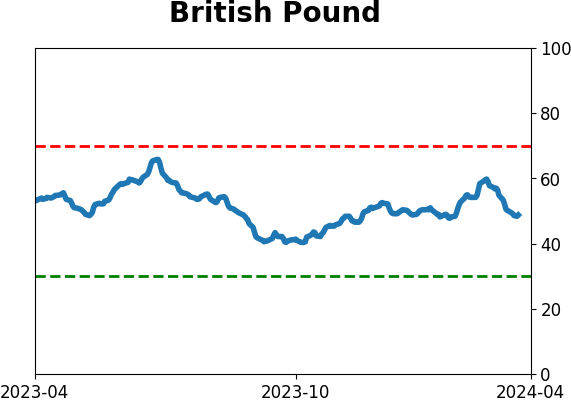
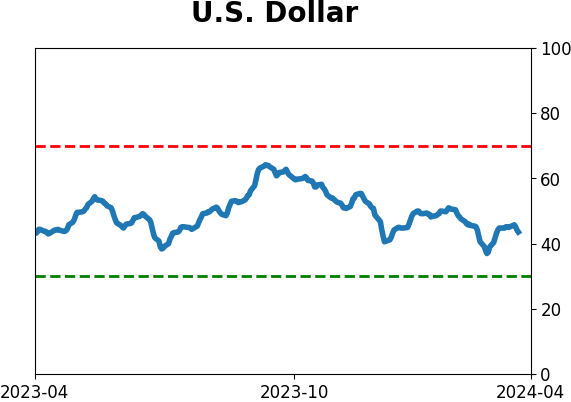
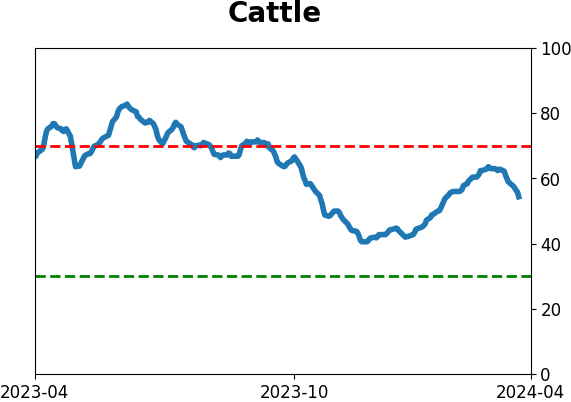
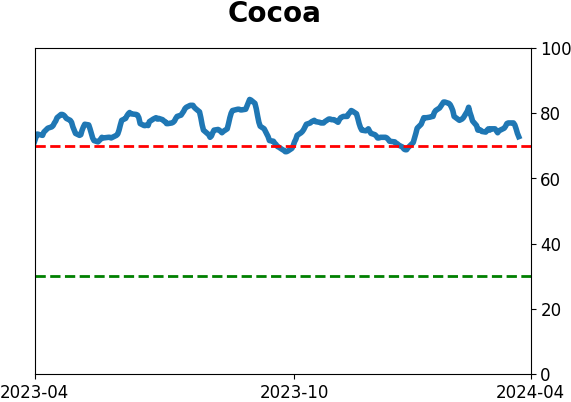
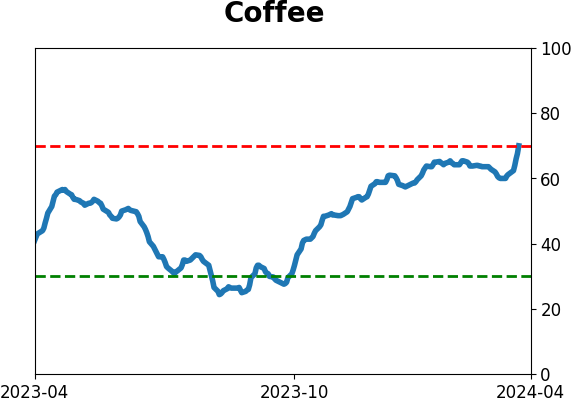
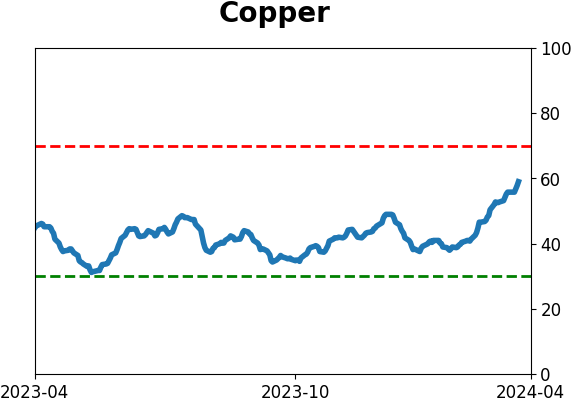
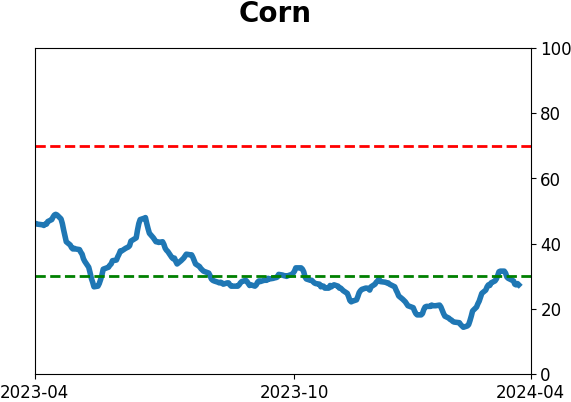
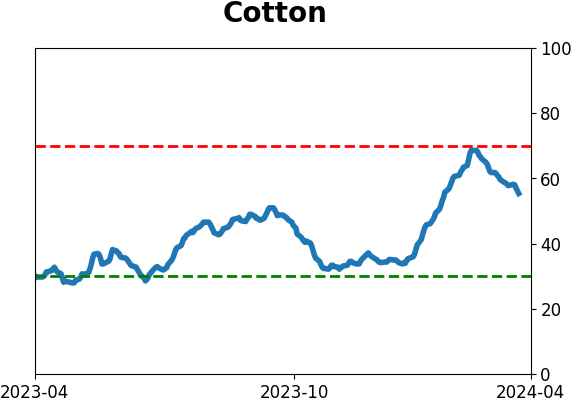
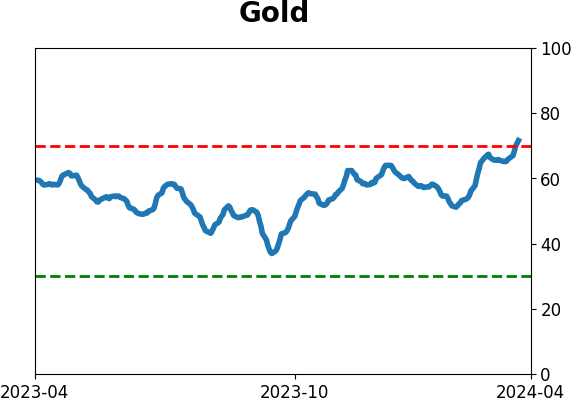
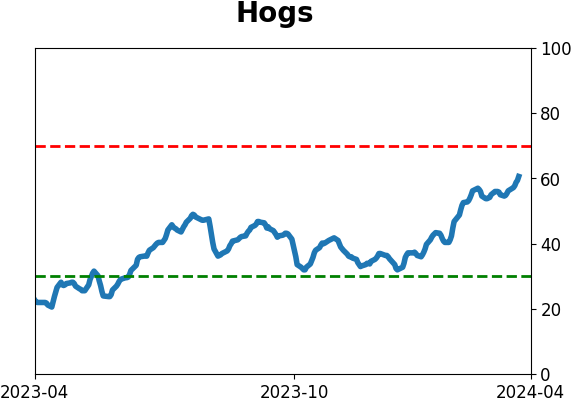
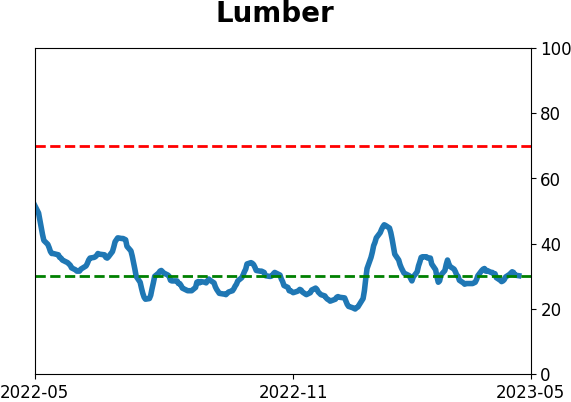
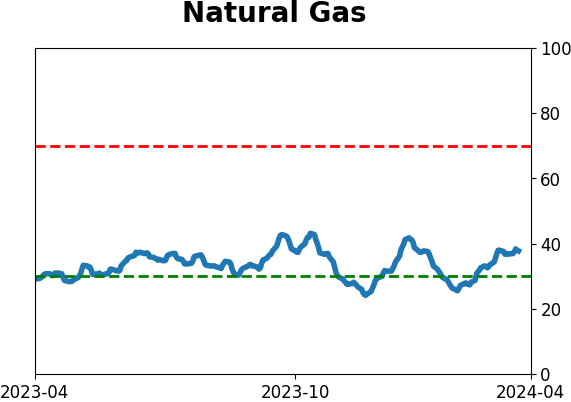
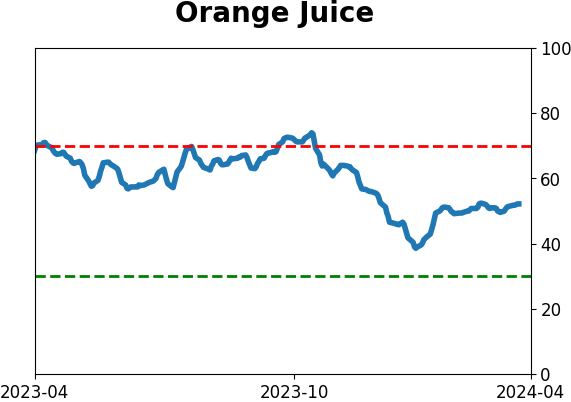
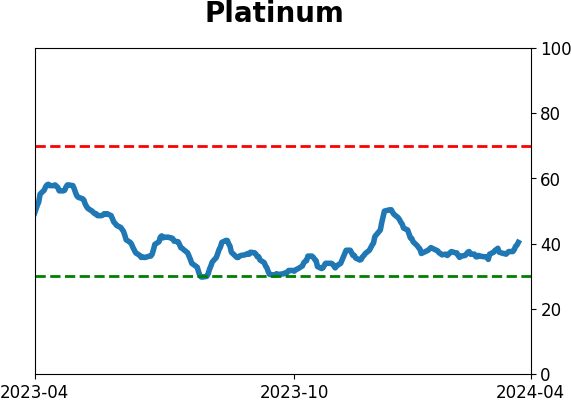
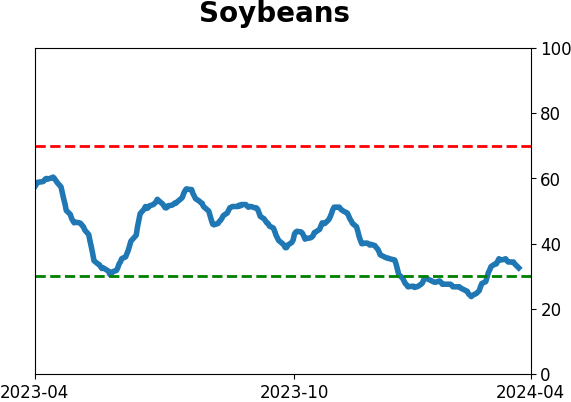
Optimism Index Thumbnails
|
|
|
|
|
|
|
|
|
|
|
|
|
|
|
|
|
|
|

|
|