Headlines
|
|
It's (still) the retracement that counts:
The Nasdaq Composite has already clawed back more than 50% of its decline in only 15 days from its latest 52-week low. Such swift and significant retracements have a strong tendency to lead to further gains. Most bear market rallies fail when the index retraced less than 25% of its decline in the first 15 days.
|
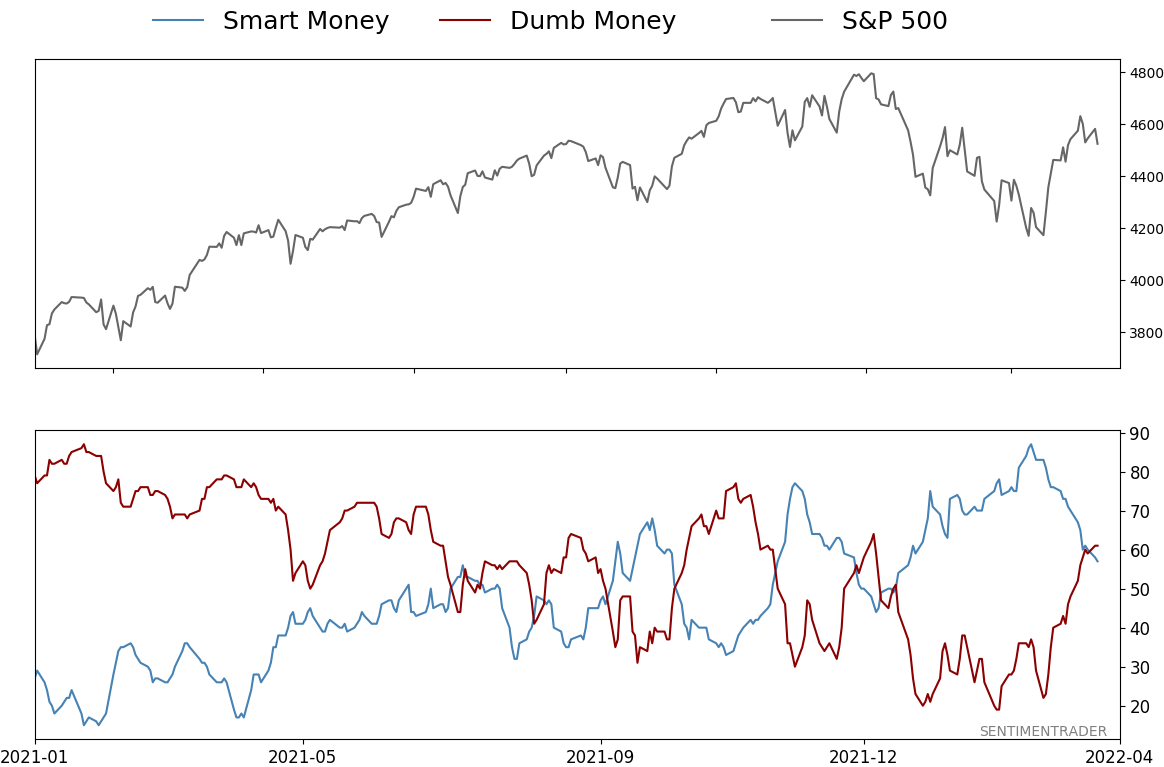
Smart / Dumb Money Confidence
|
Smart Money Confidence: 57%
Dumb Money Confidence: 61%
|
|
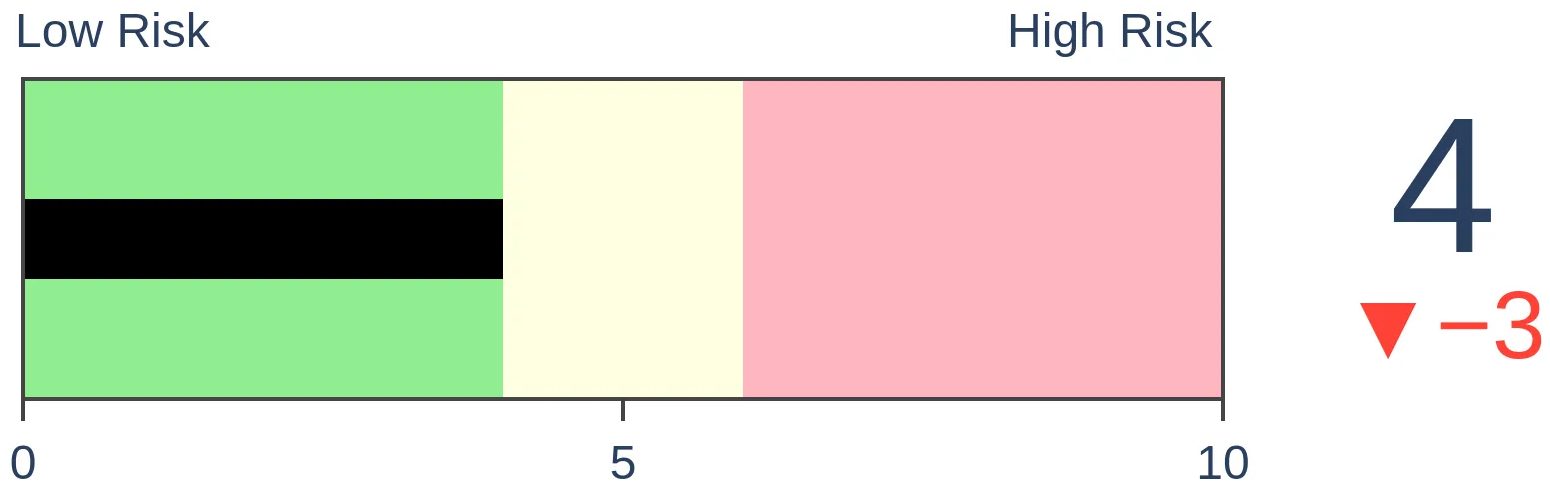
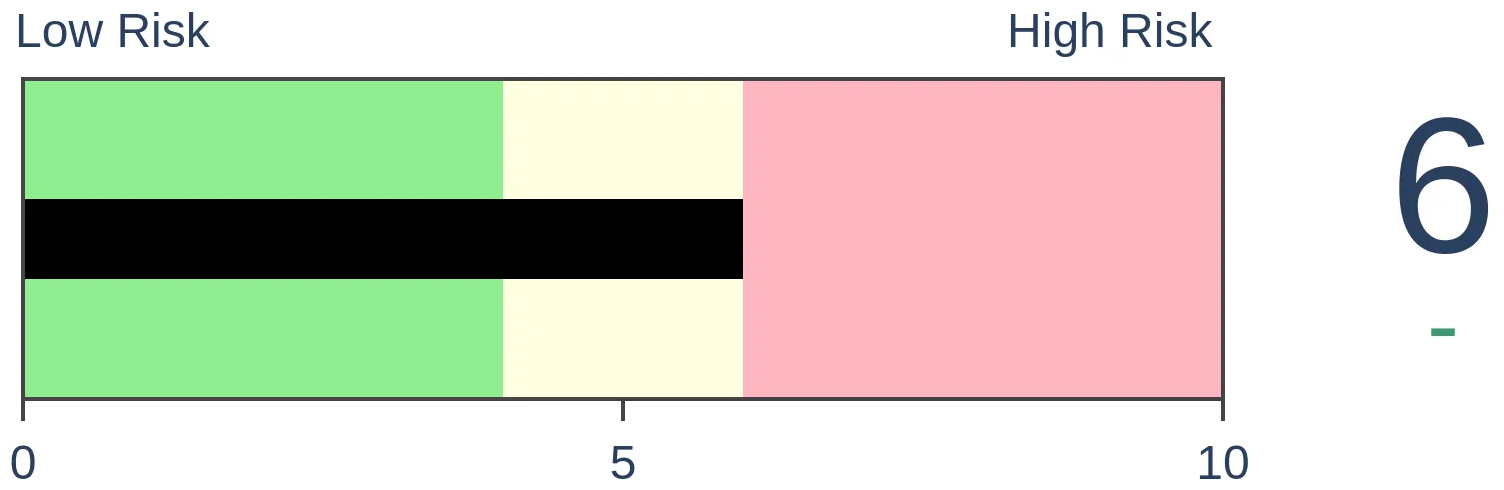
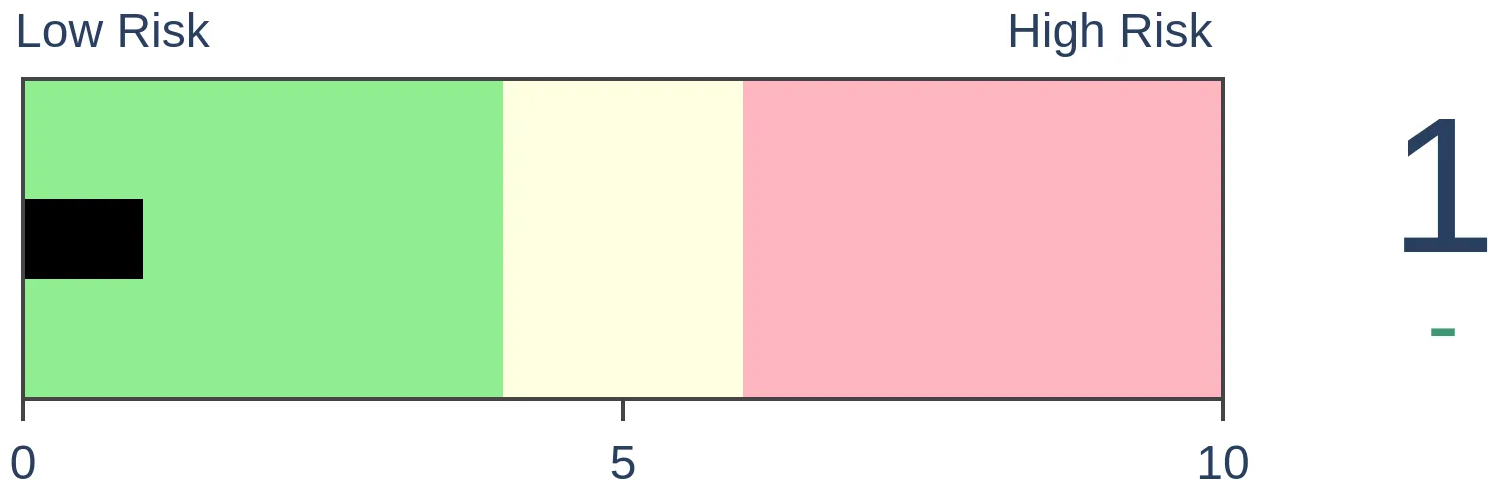
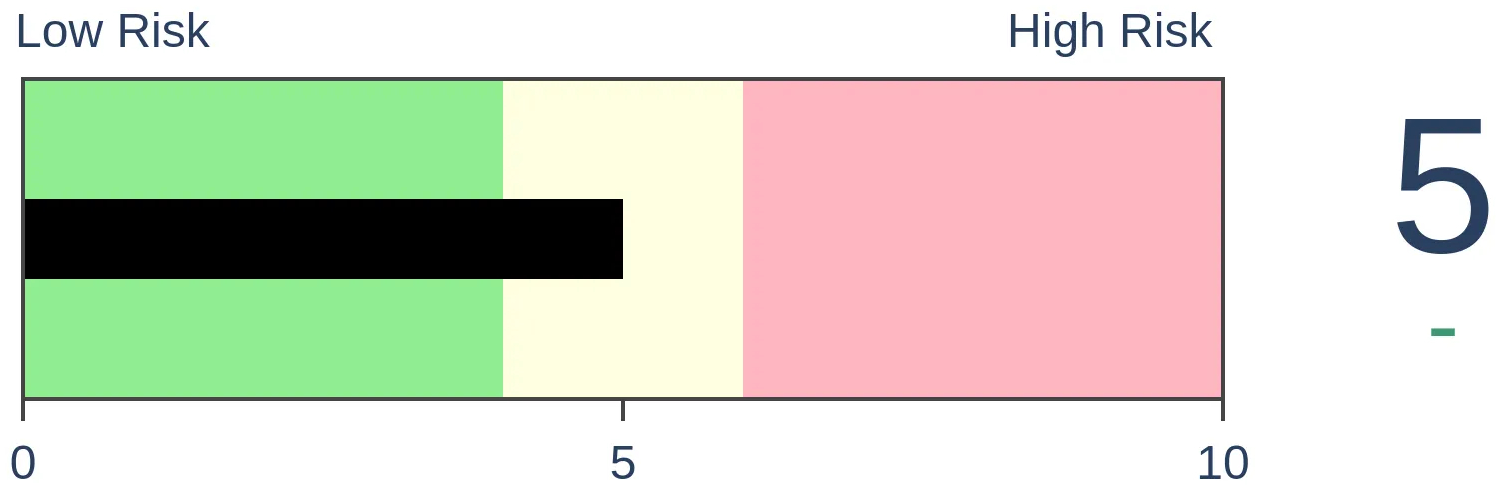
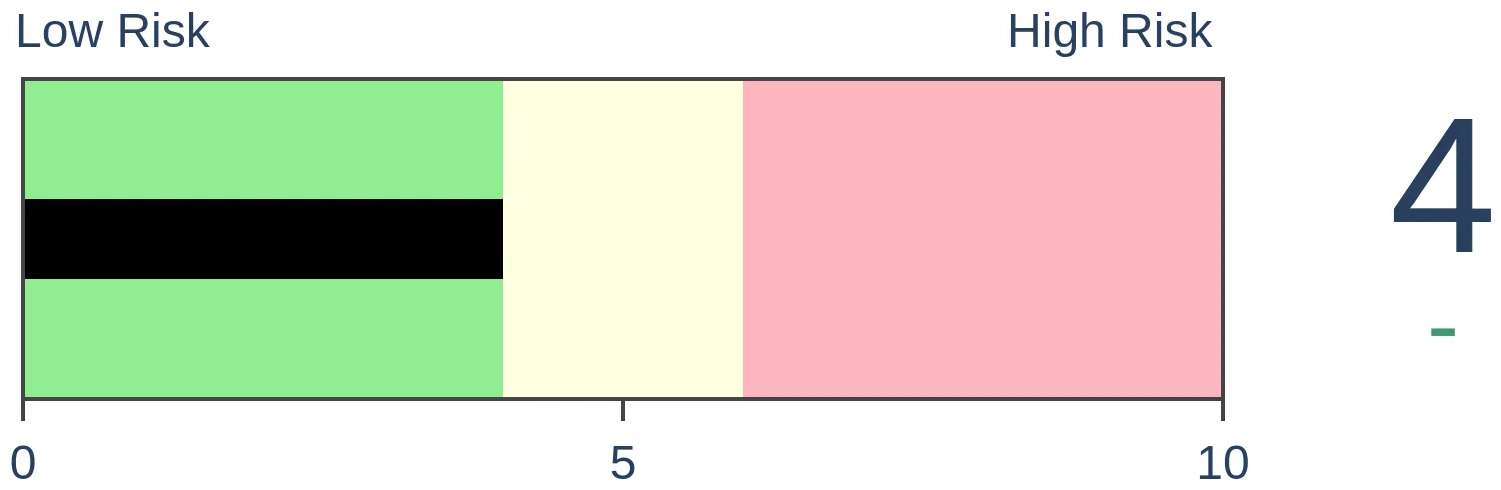
Risk Levels
Stocks Short-Term
|
Stocks Medium-Term
|
|
Bonds
|
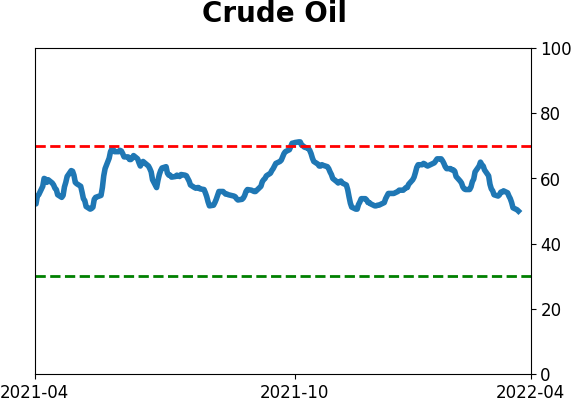
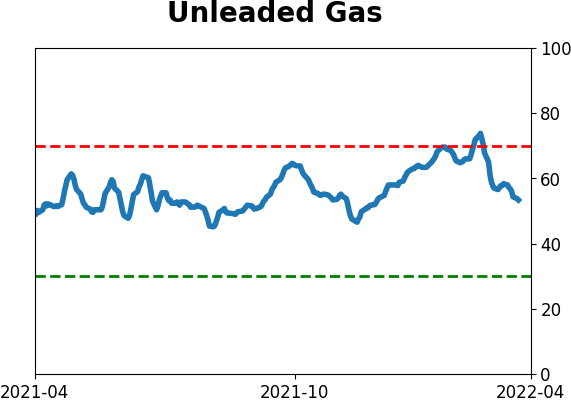
Crude Oil

|
|
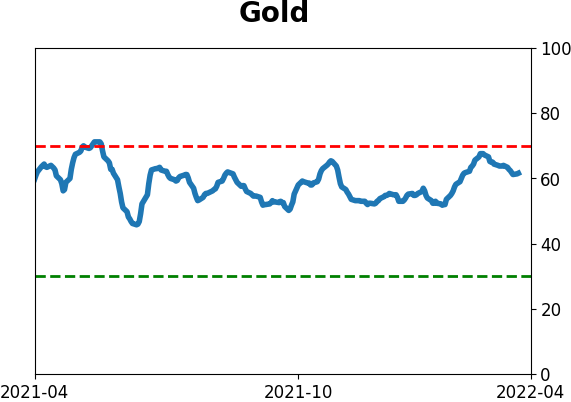
Gold
|
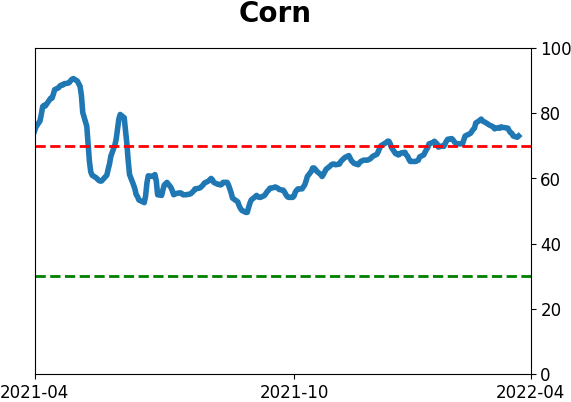
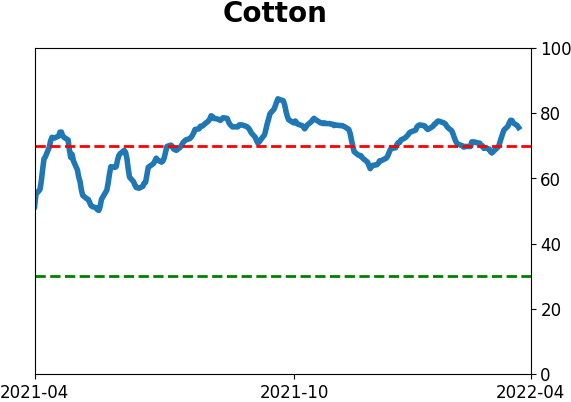
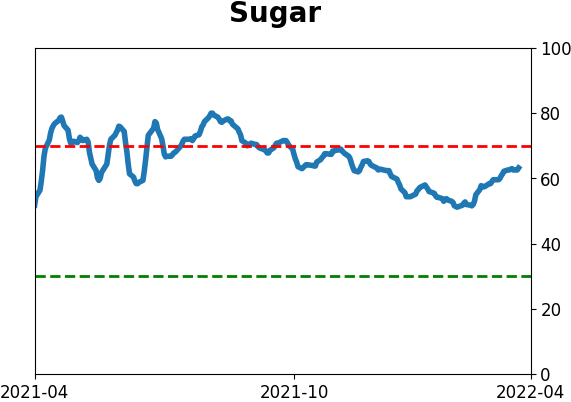
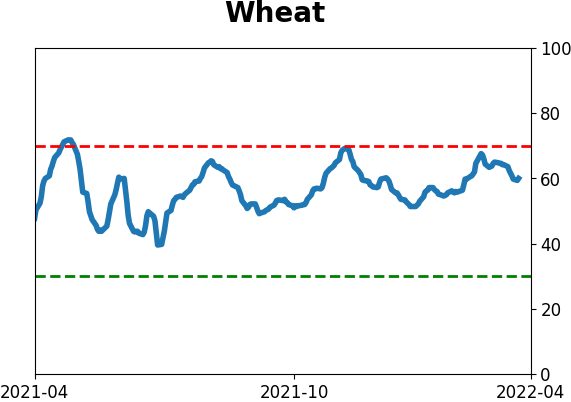
Agriculture
|
|
Research
By Jason Goepfert
BOTTOM LINE
The Nasdaq Composite has already clawed back more than 50% of its decline in only 15 days from its latest 52-week low. Such swift and significant retracements have a strong tendency to lead to further gains. Most bear market rallies fail when the index retraced less than 25% of its decline in the first 15 days.
FORECAST / TIMEFRAME
ONEQ -- Up, Medium-Term
|
Key points:
- The Nasdaq Composite has retraced more than 50% of its decline in only 15 days
- Such swift and significant retracements have a strong tendency to lead to further gains
- Bear market rally failures tend to occur with retracements less than 25%
Another swift, significant retracement
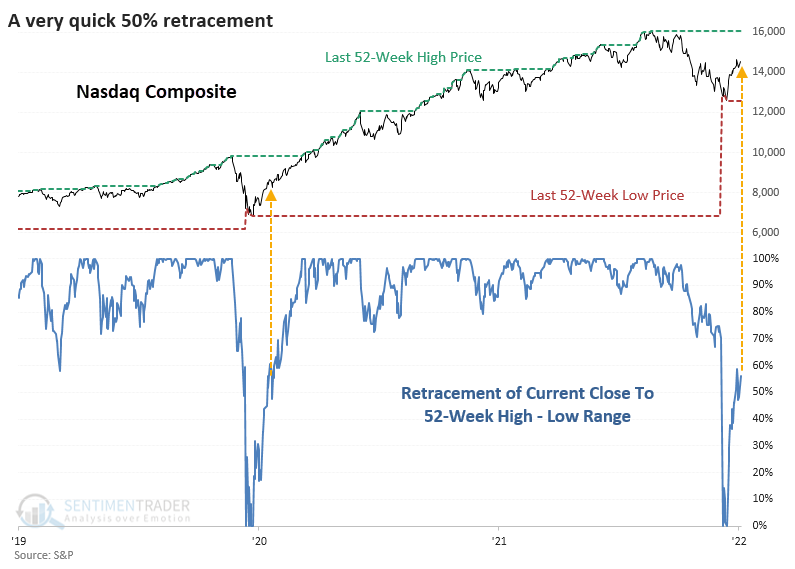
In April 2020, we looked at the idea that it's the retracements that matter. At the time, technicians were griping about so-called Fibonacci retracements and the mystic fantasy that auction markets driven by semi-rational actors adhere to a cosmic sense of proportion. They don't.
During bear markets, there typically is not a strong impulse among buyers, and stocks have a hard time retracing much of their decline. That is most certainly what did NOT happen in April/May 2020, and it's not what's happening right now.
Only 15 days from its latest 52-week low, the Nasdaq Composite has already retraced 56% of its decline.
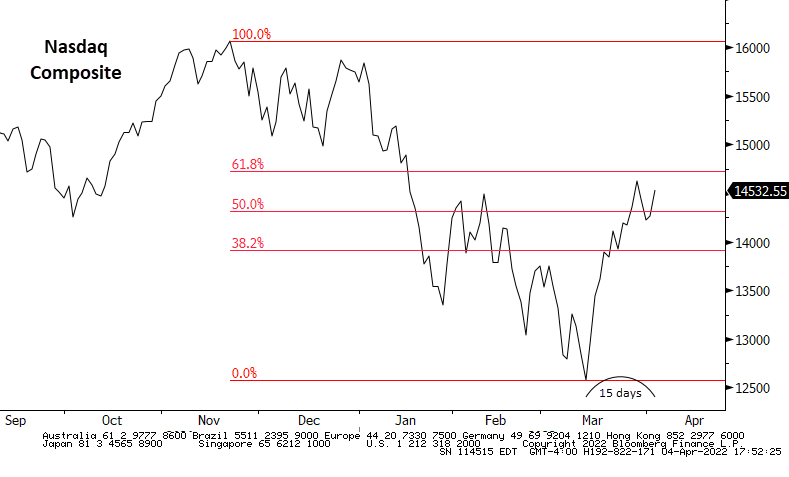
That's almost exactly the same retracement the Nasdaq clawed back in the first 15 days of the rally in 2020.
Big retracements rarely lead to failure
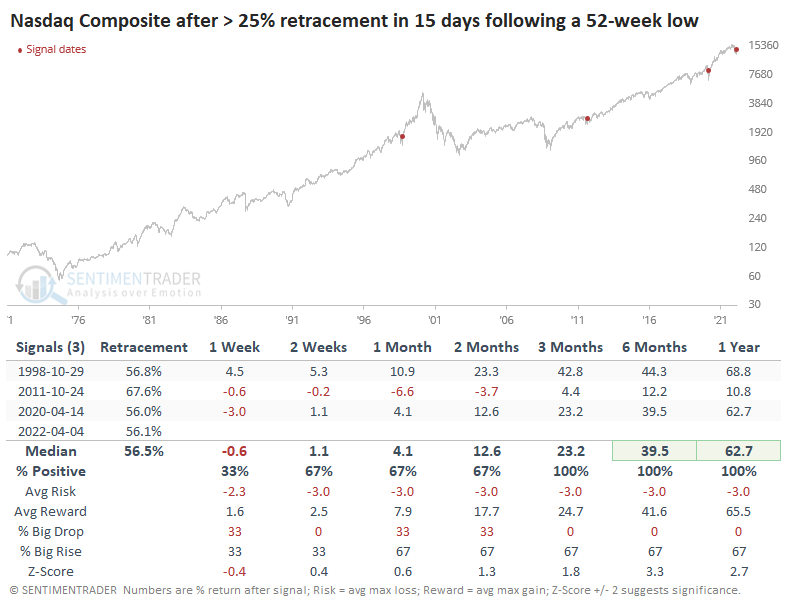
As we saw 2 years ago, swift and significant retracements of declines between an index's latest 52-week high and low have a strong tendency to occur at meaningful troughs.
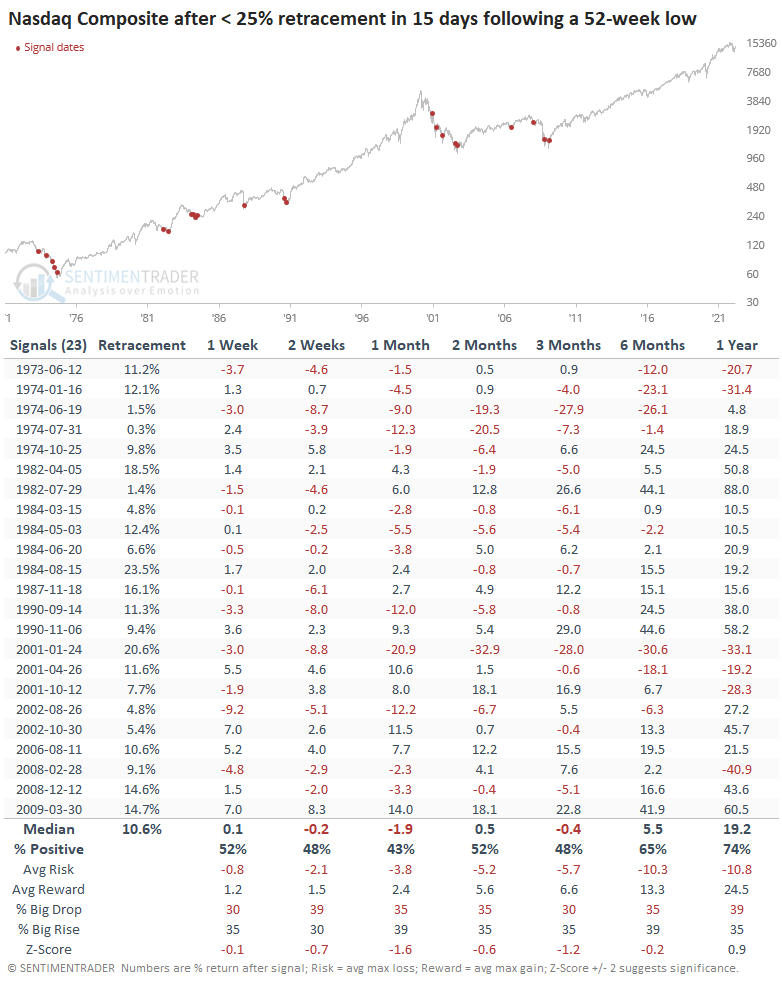
The table below shows the only times in the Nasdaq Composite's history when it clawed back at least 50% of its decline in the first 15 days of a rally. Each time, the index went on to substantial further gains.
It's hard to rely on a sample size of 3, so the table below shows retracements of 25% or greater. Still a small sample, but the conclusion was the same. There were a couple of fakeouts, with 1-year losses in 1973 and 2008. But over the next 2 months, there was only a single loss, and the risk/reward was massively skewed to the upside.
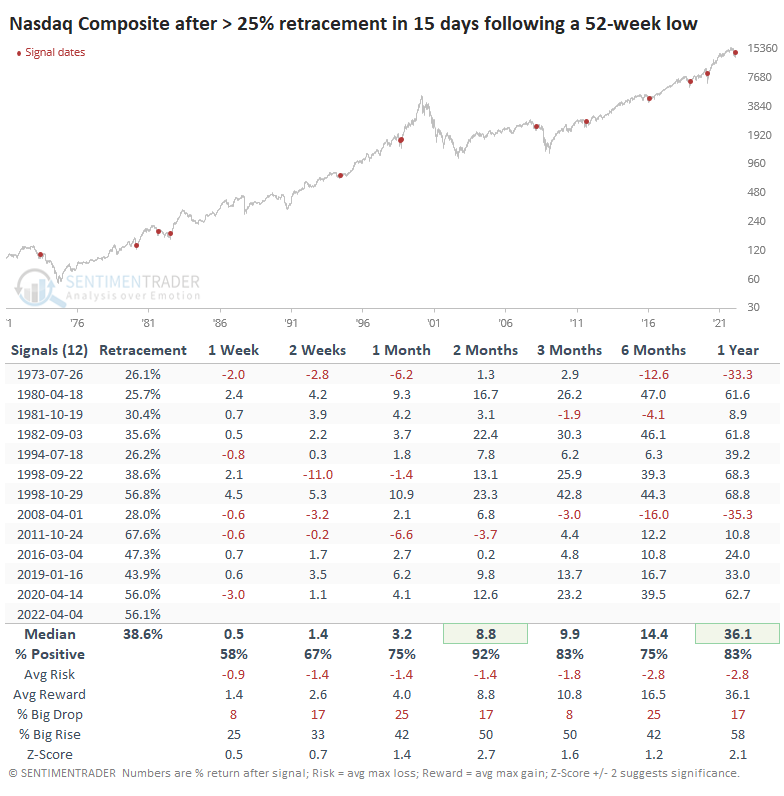
Contrast that to rallies that retraced less than 25% of their decline in the first 15 days. This was twice as common, and most of these ended up failing, leading to losses and lower lows. Bear markets tend to see weak buying pressure that falters quickly.
What the research tells us...
There have been ample signs of thrusts in the major indexes and individual stocks over the past few weeks. Essentially every study we've published about them have shown a significant bullish edge over a medium-term time frame. The thrusts have enabled the Nasdaq to claw back more than half its losses, only 3 weeks removed from its 52-week low. Behavior like this has consistently shown a positive edge in the weeks and months ahead.
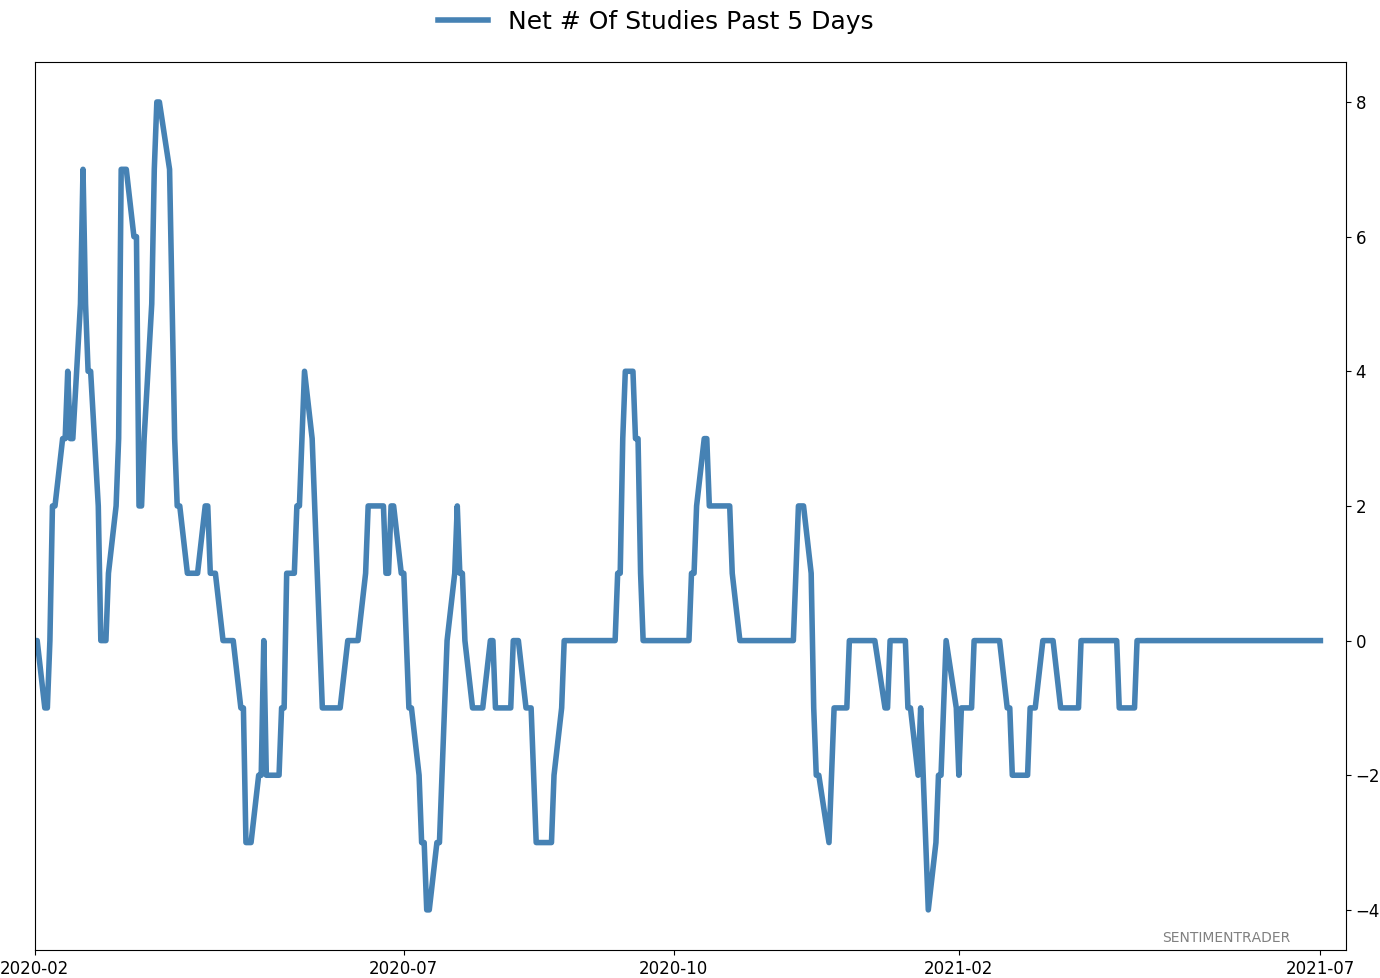
Active Studies
| Time Frame | Bullish | Bearish | | Short-Term | 4 | 0 | | Medium-Term | 25 | 2 | | Long-Term | 17 | 5 |
|
Indicators at Extremes
Portfolio
| Position | Description | Weight % | Added / Reduced | Date | | Stocks | 21.6% RSP, 5.1% IEMG | 26.7 | Added 5.3% | 2022-03-18 | | Bonds | 32.7% BND, 7.1% SCHP | 40.1 | Added 8.3% | 2021-10-26 | | Commodities | GCC | 2.4 | Reduced 2.1%
| 2020-09-04 | | Precious Metals | GDX | 4.6 | Reduced 4.2% | 2021-05-19 | | Special Situations | 7.6% KWEB, 4.9% XBI, 3.7% XLE, 1.8% PSCE | 18.0 | Added 4.6% | 2022-02-24 | | Cash | | 7.9 | | |
|
Updates (Changes made today are underlined)
We had a volatile few weeks into mid-March, and it was enough to trigger a number of extremes. Most of the studies we've looked at have had a clear bullish edge over a multi-month time frame. I'd typically be more proactive instead of reactive with changes in positions, adding exposure into weakness instead of strength, but during an unhealthy environment like we're in, I tend to be more conservative. I did add some exposure to emerging markets, choosing a fund with the least exposure to China, since I already have exposure there with KWEB. It's still heavily weighted to that market. The only other times the MSCI Emerging Markets Index has had a weekly reversal like this week were October 2008, October 2011, and August 2015, all leading to long-term gains. RETURN YTD: +0.2% 2021: +8.7%, 2020: +8.1%, 2019: +12.6%, 2018: +0.6%, 2017: +3.8%, 2016: +17.1%, 2015: +9.2%, 2014: +14.5%, 2013: +2.2%, 2012: +10.8%, 2011: +16.5%, 2010: +15.3%, 2009: +23.9%, 2008: +16.2%, 2007: +7.8%
|
|
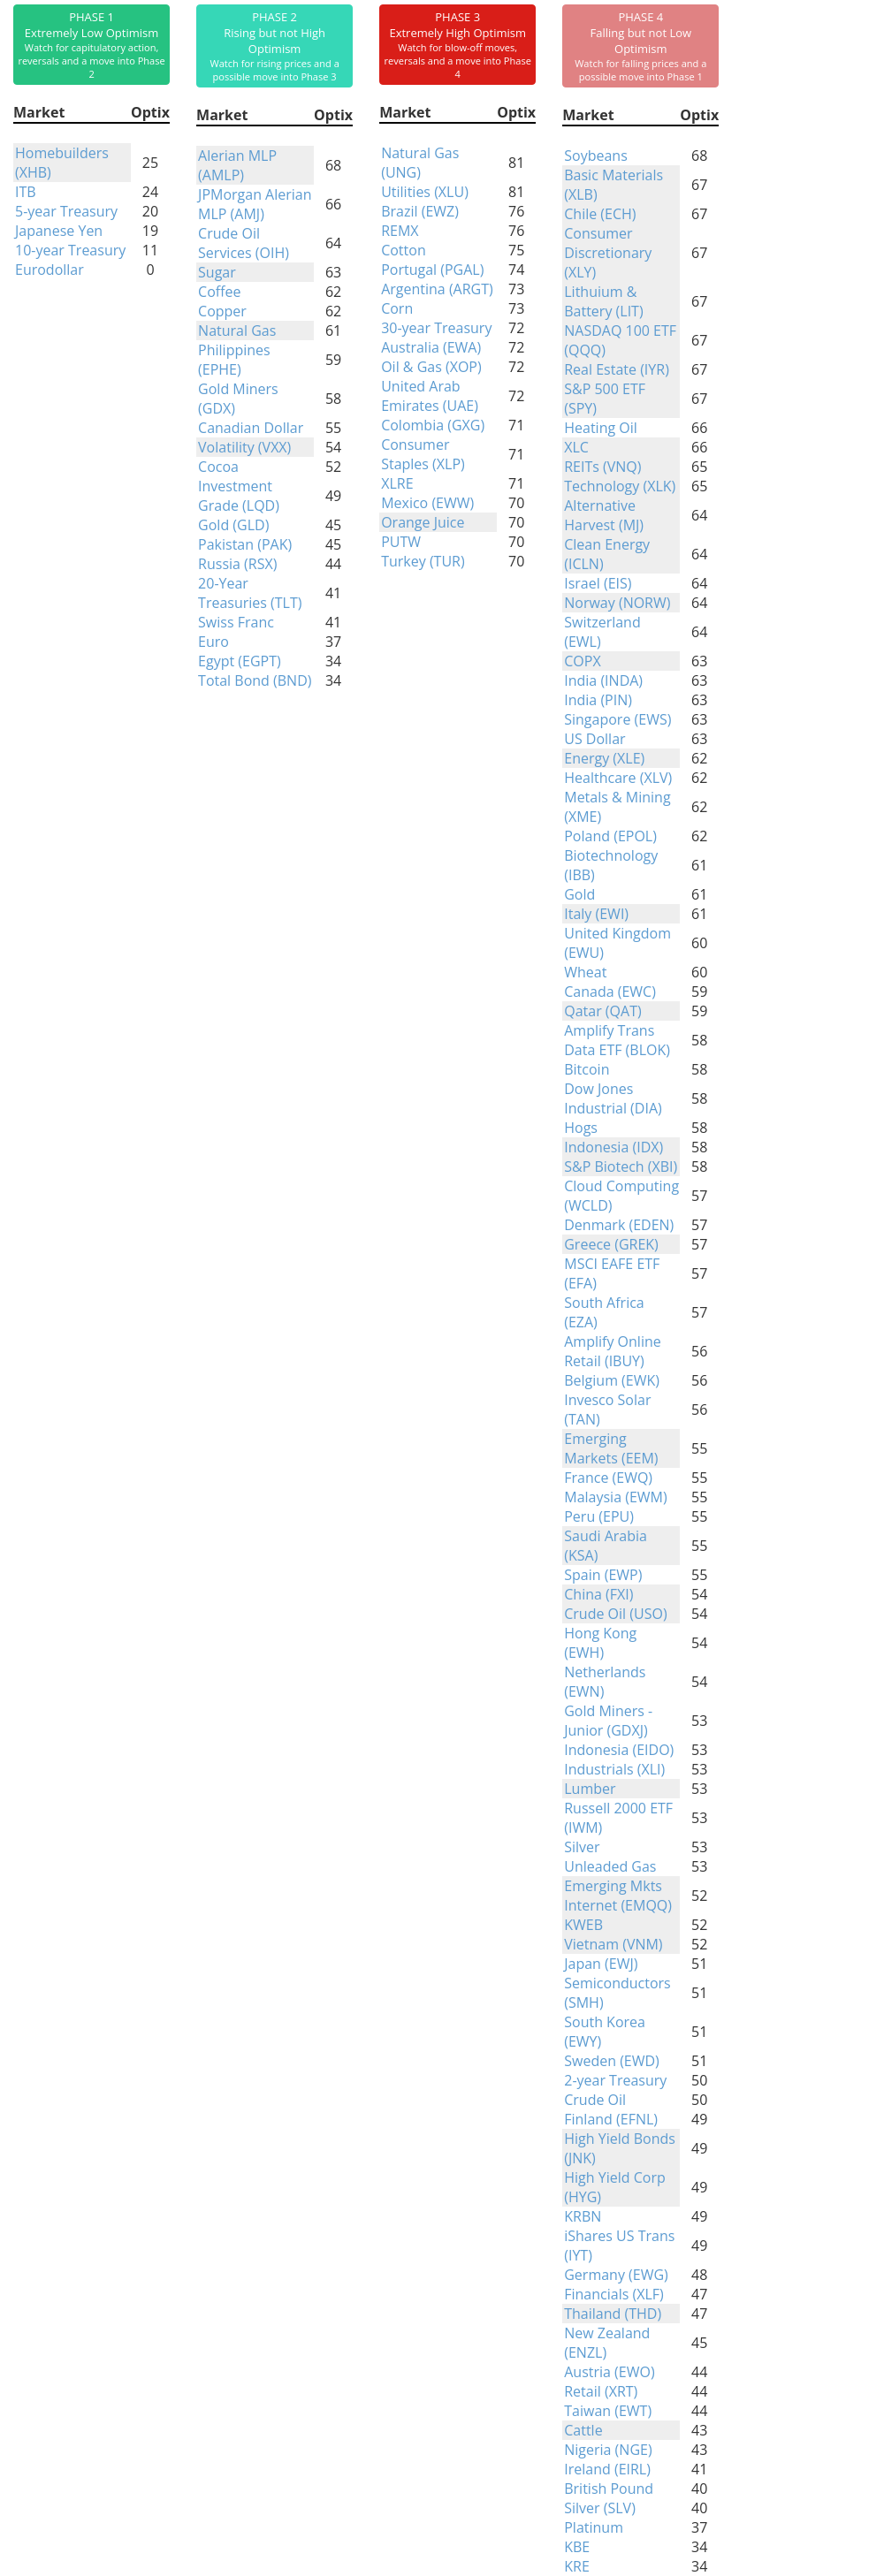
Phase Table
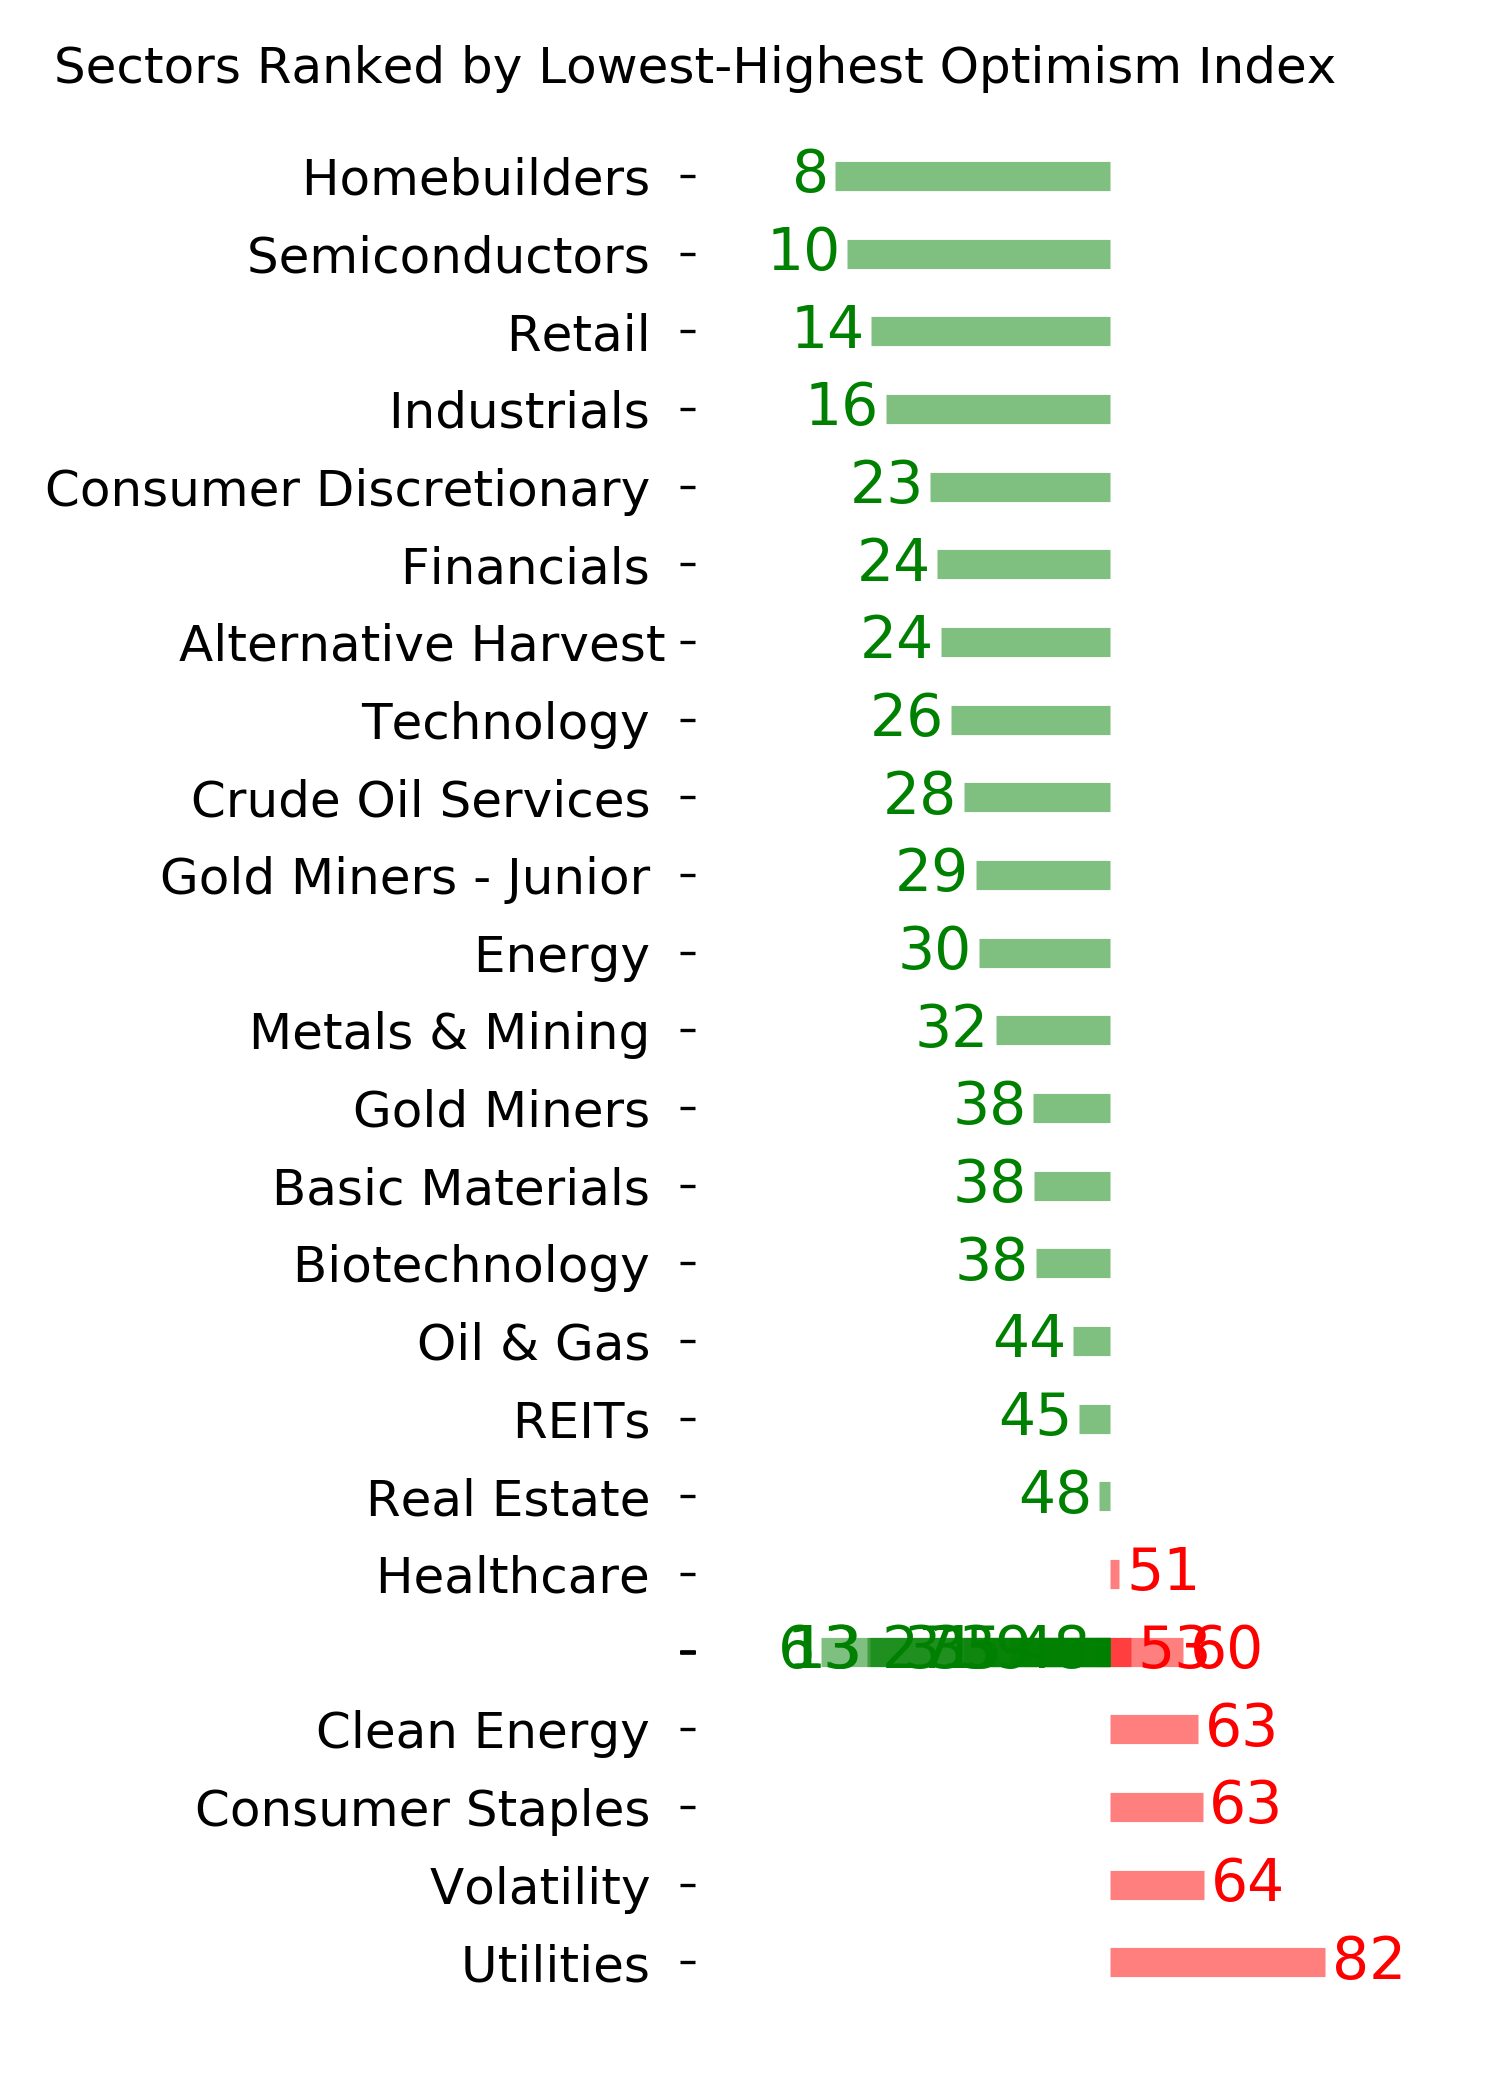
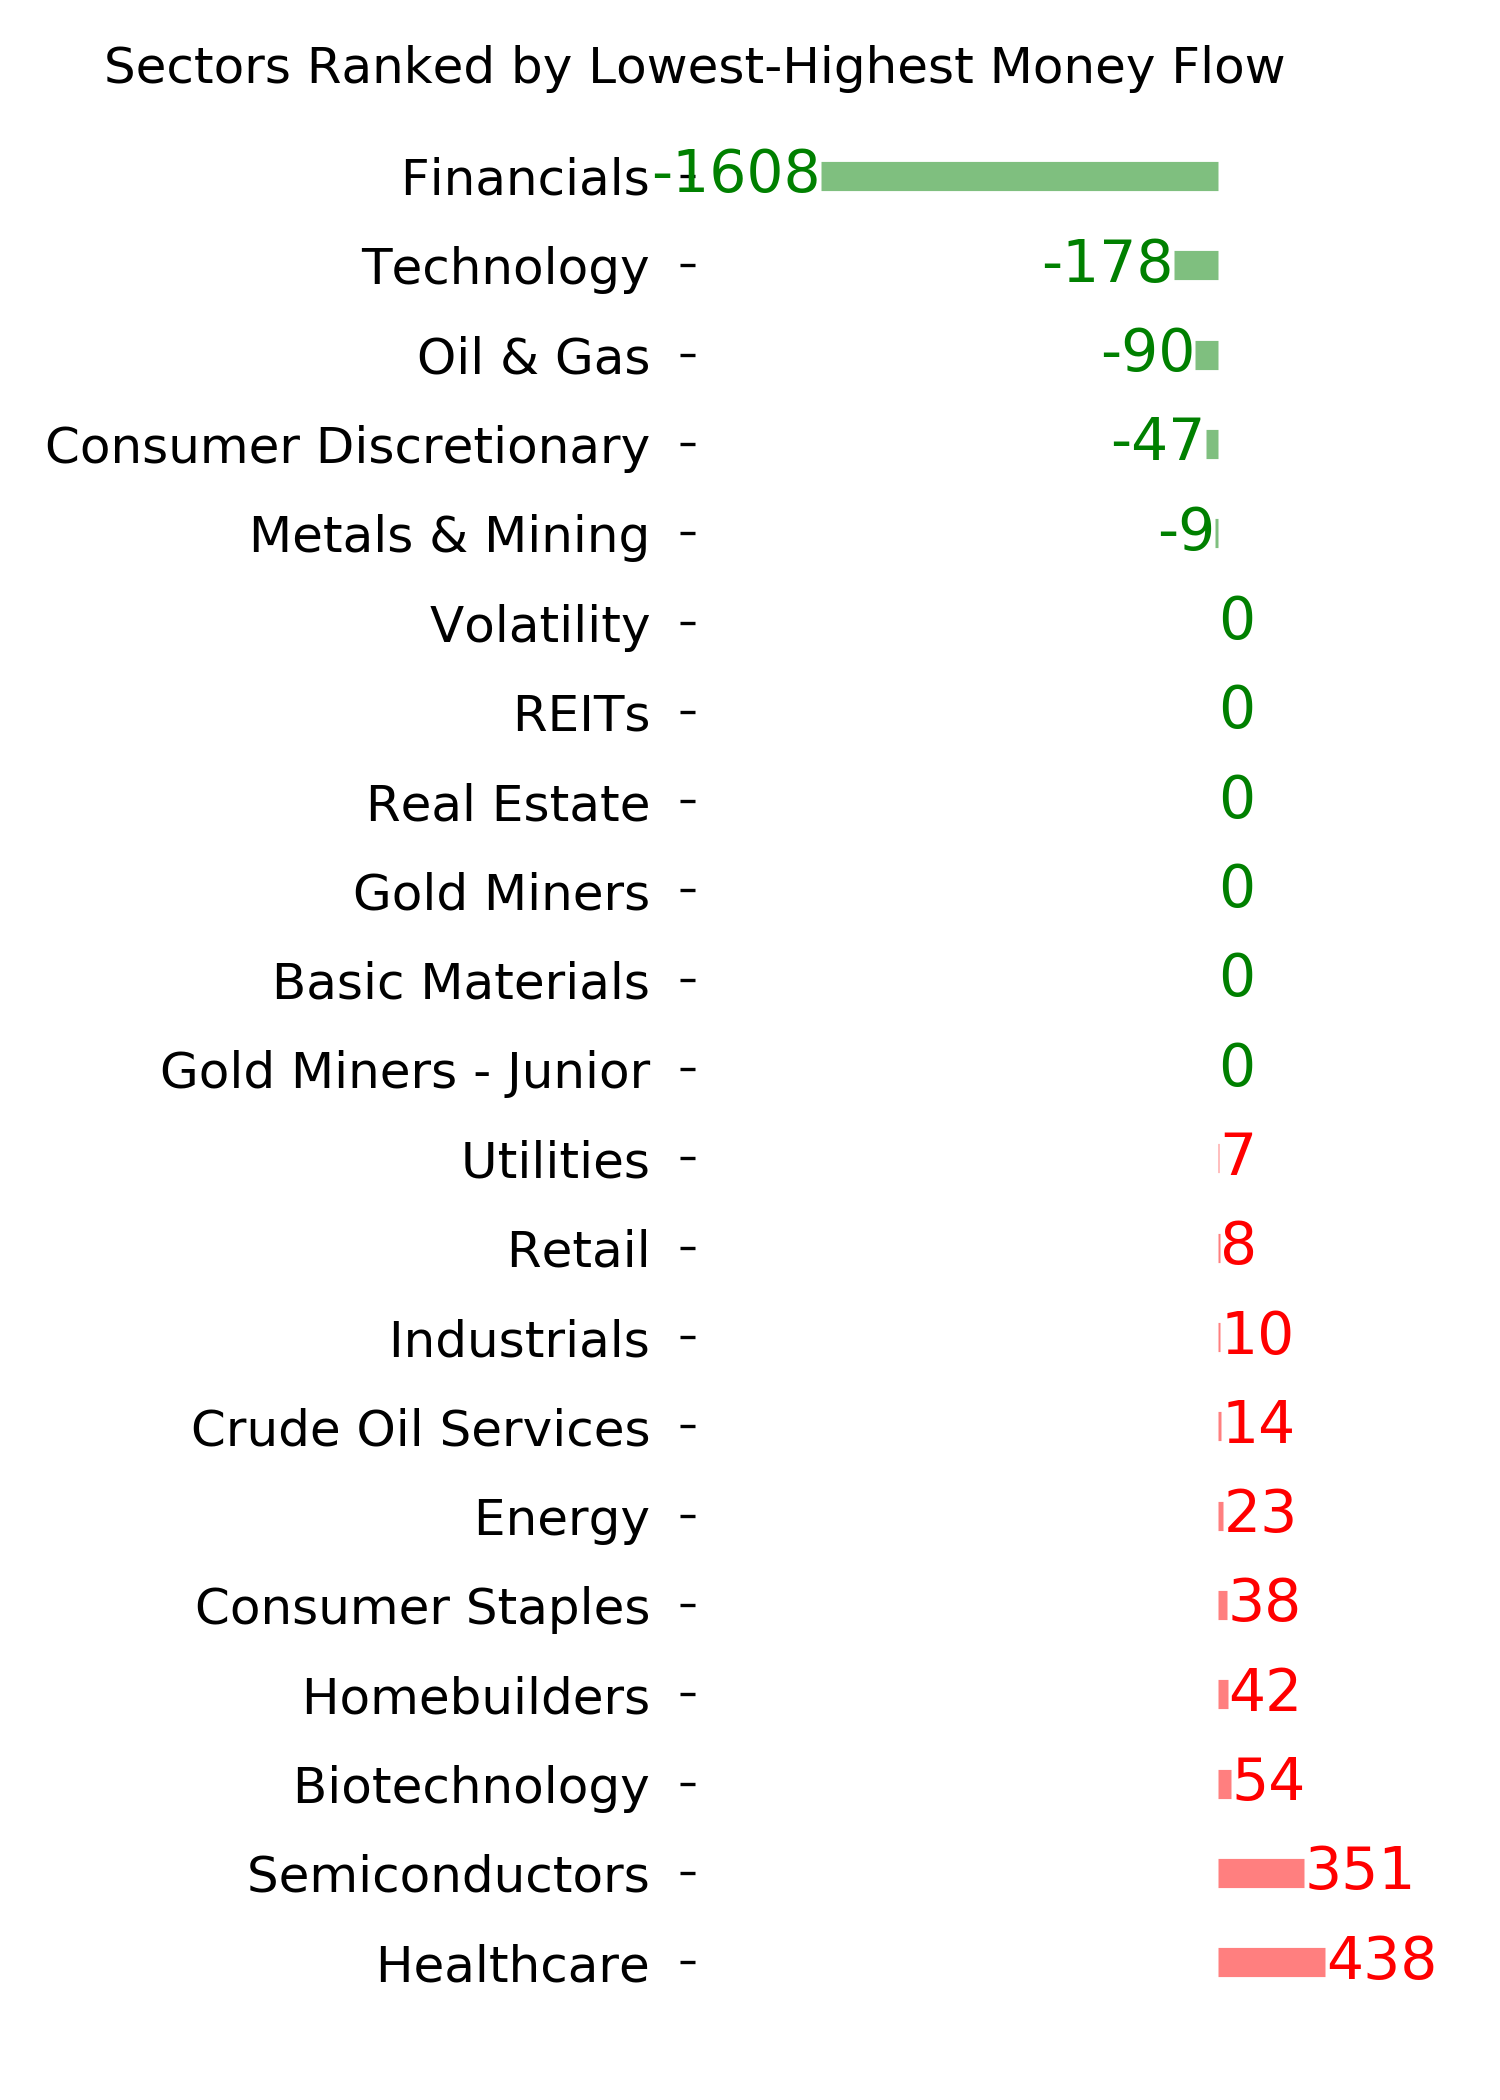
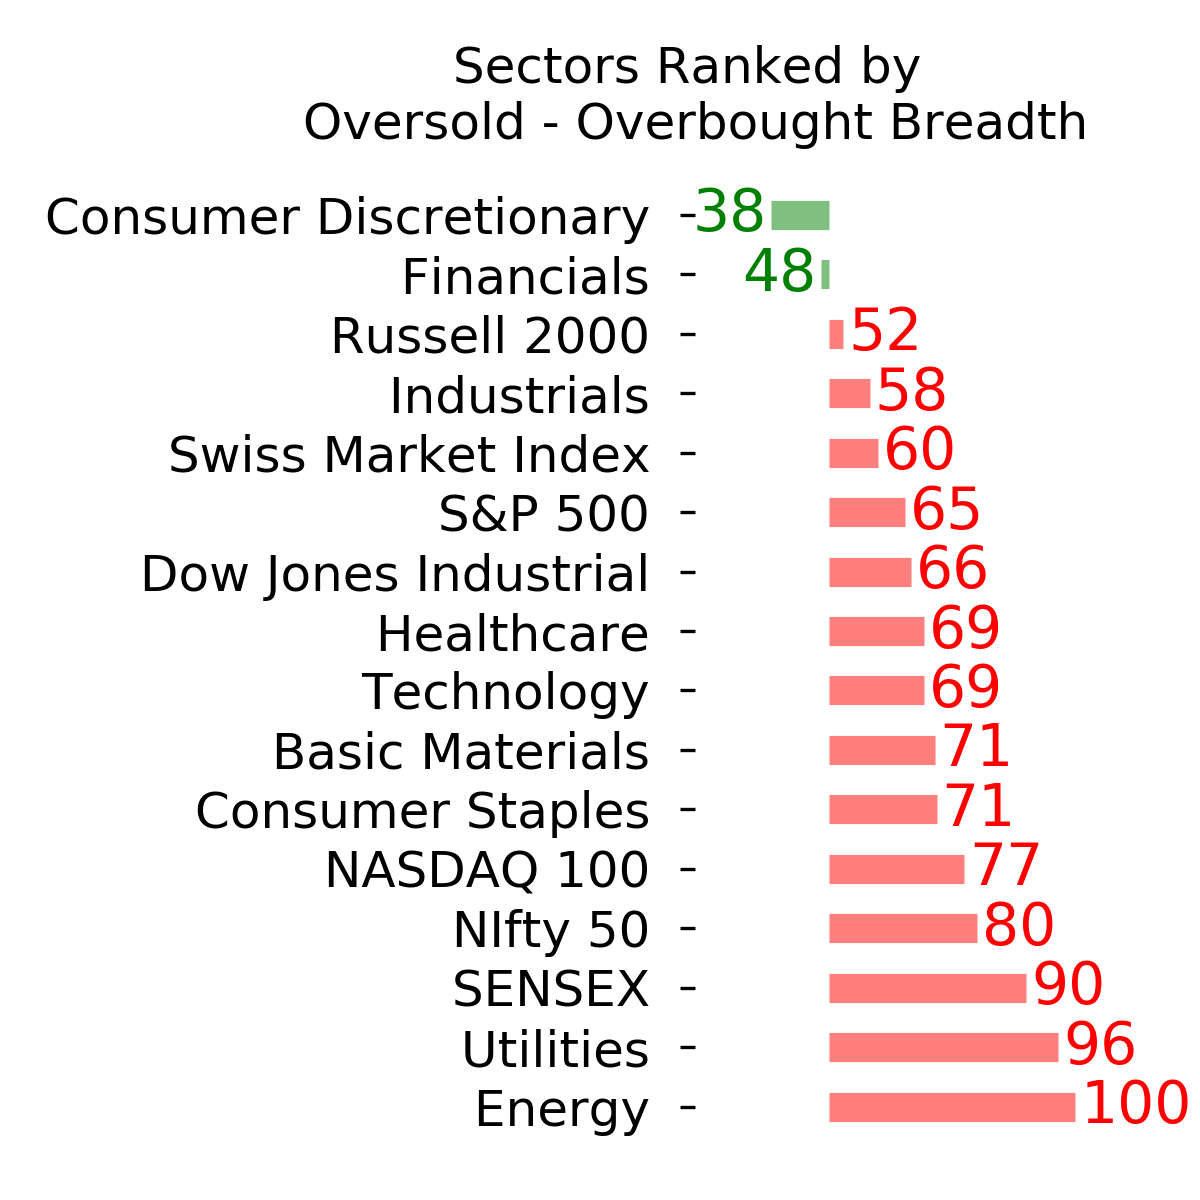
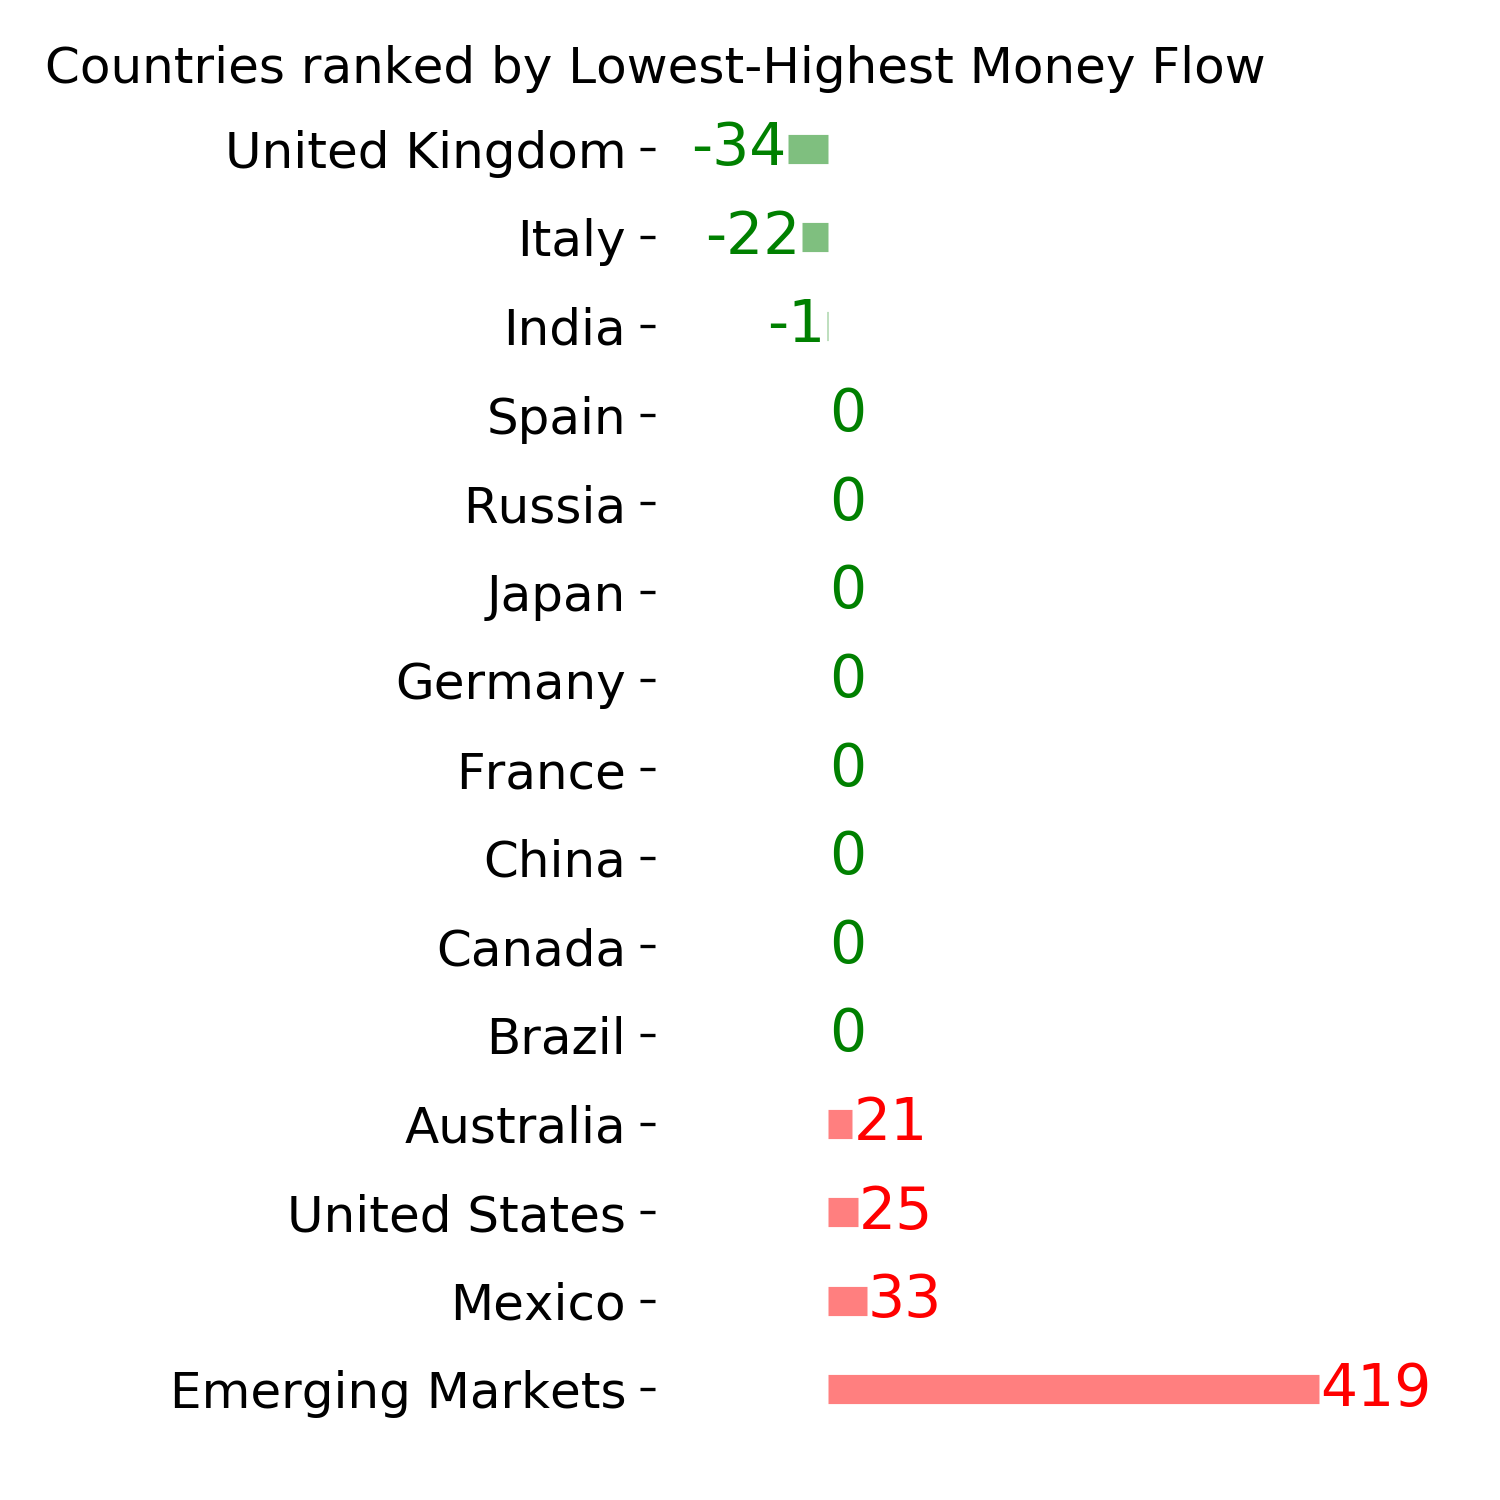
Ranks
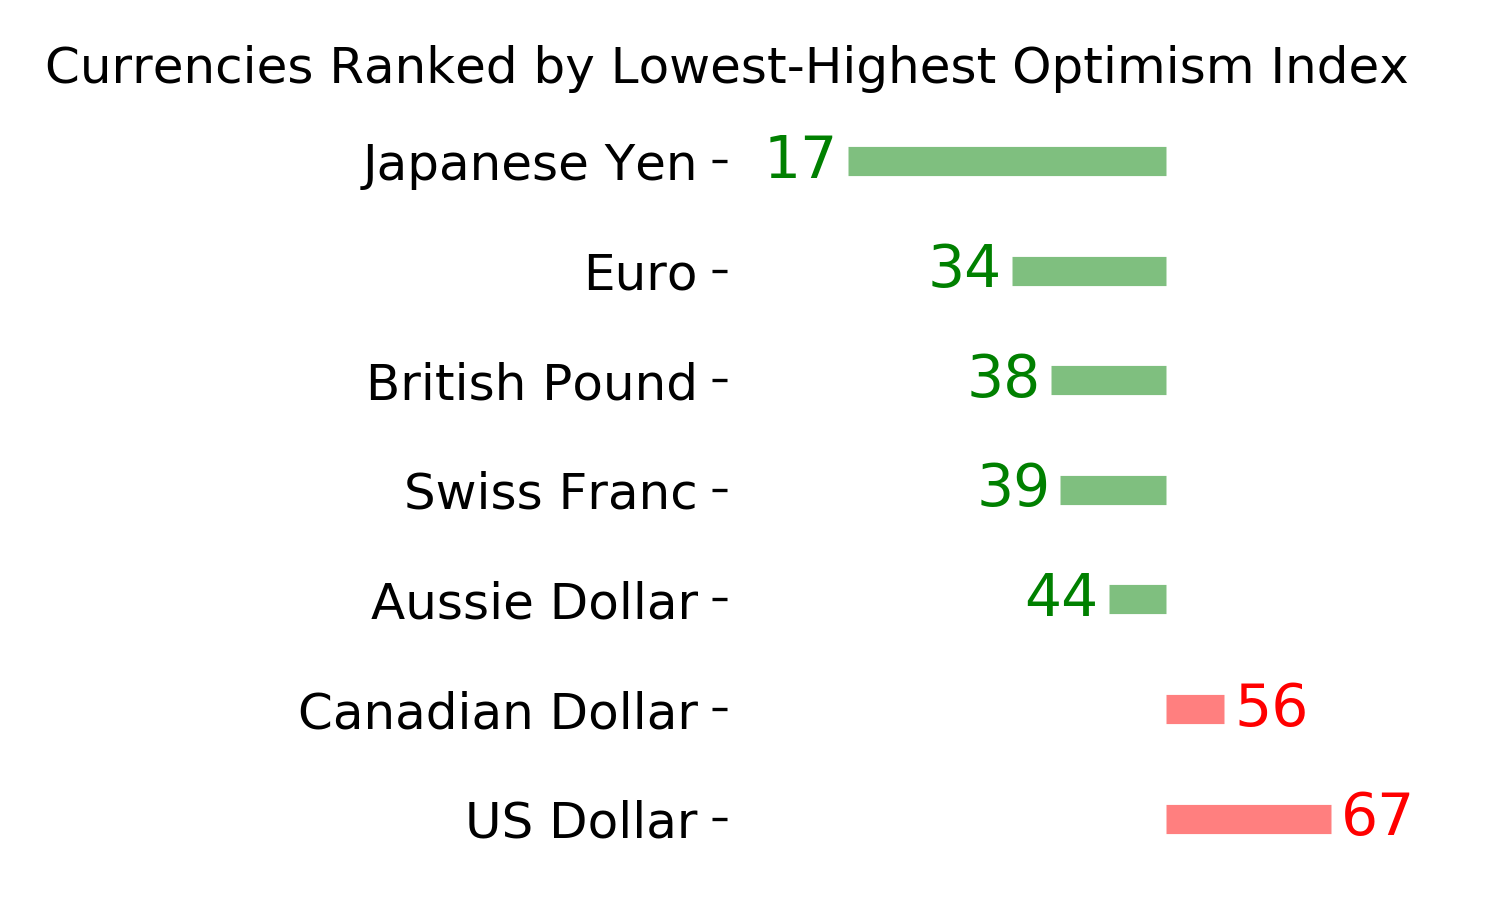
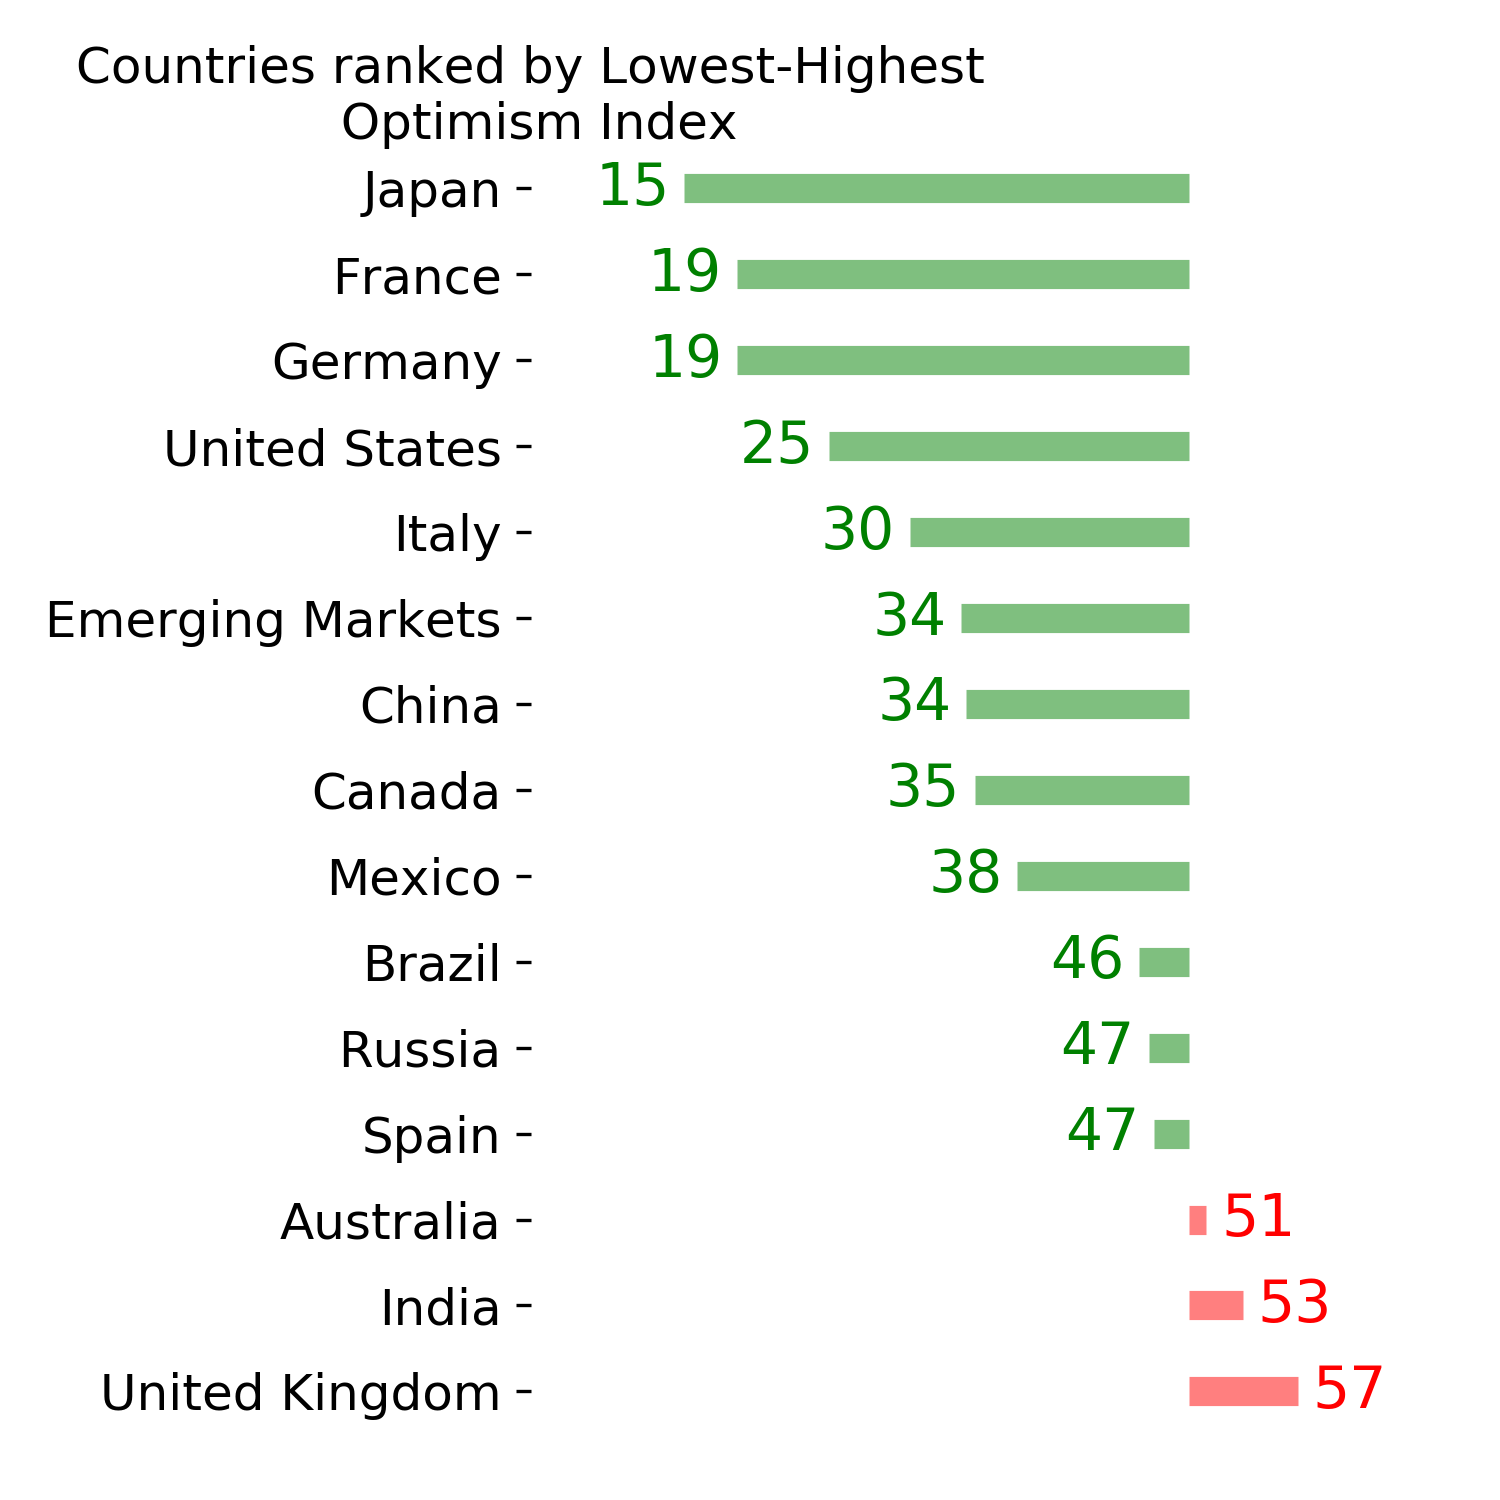
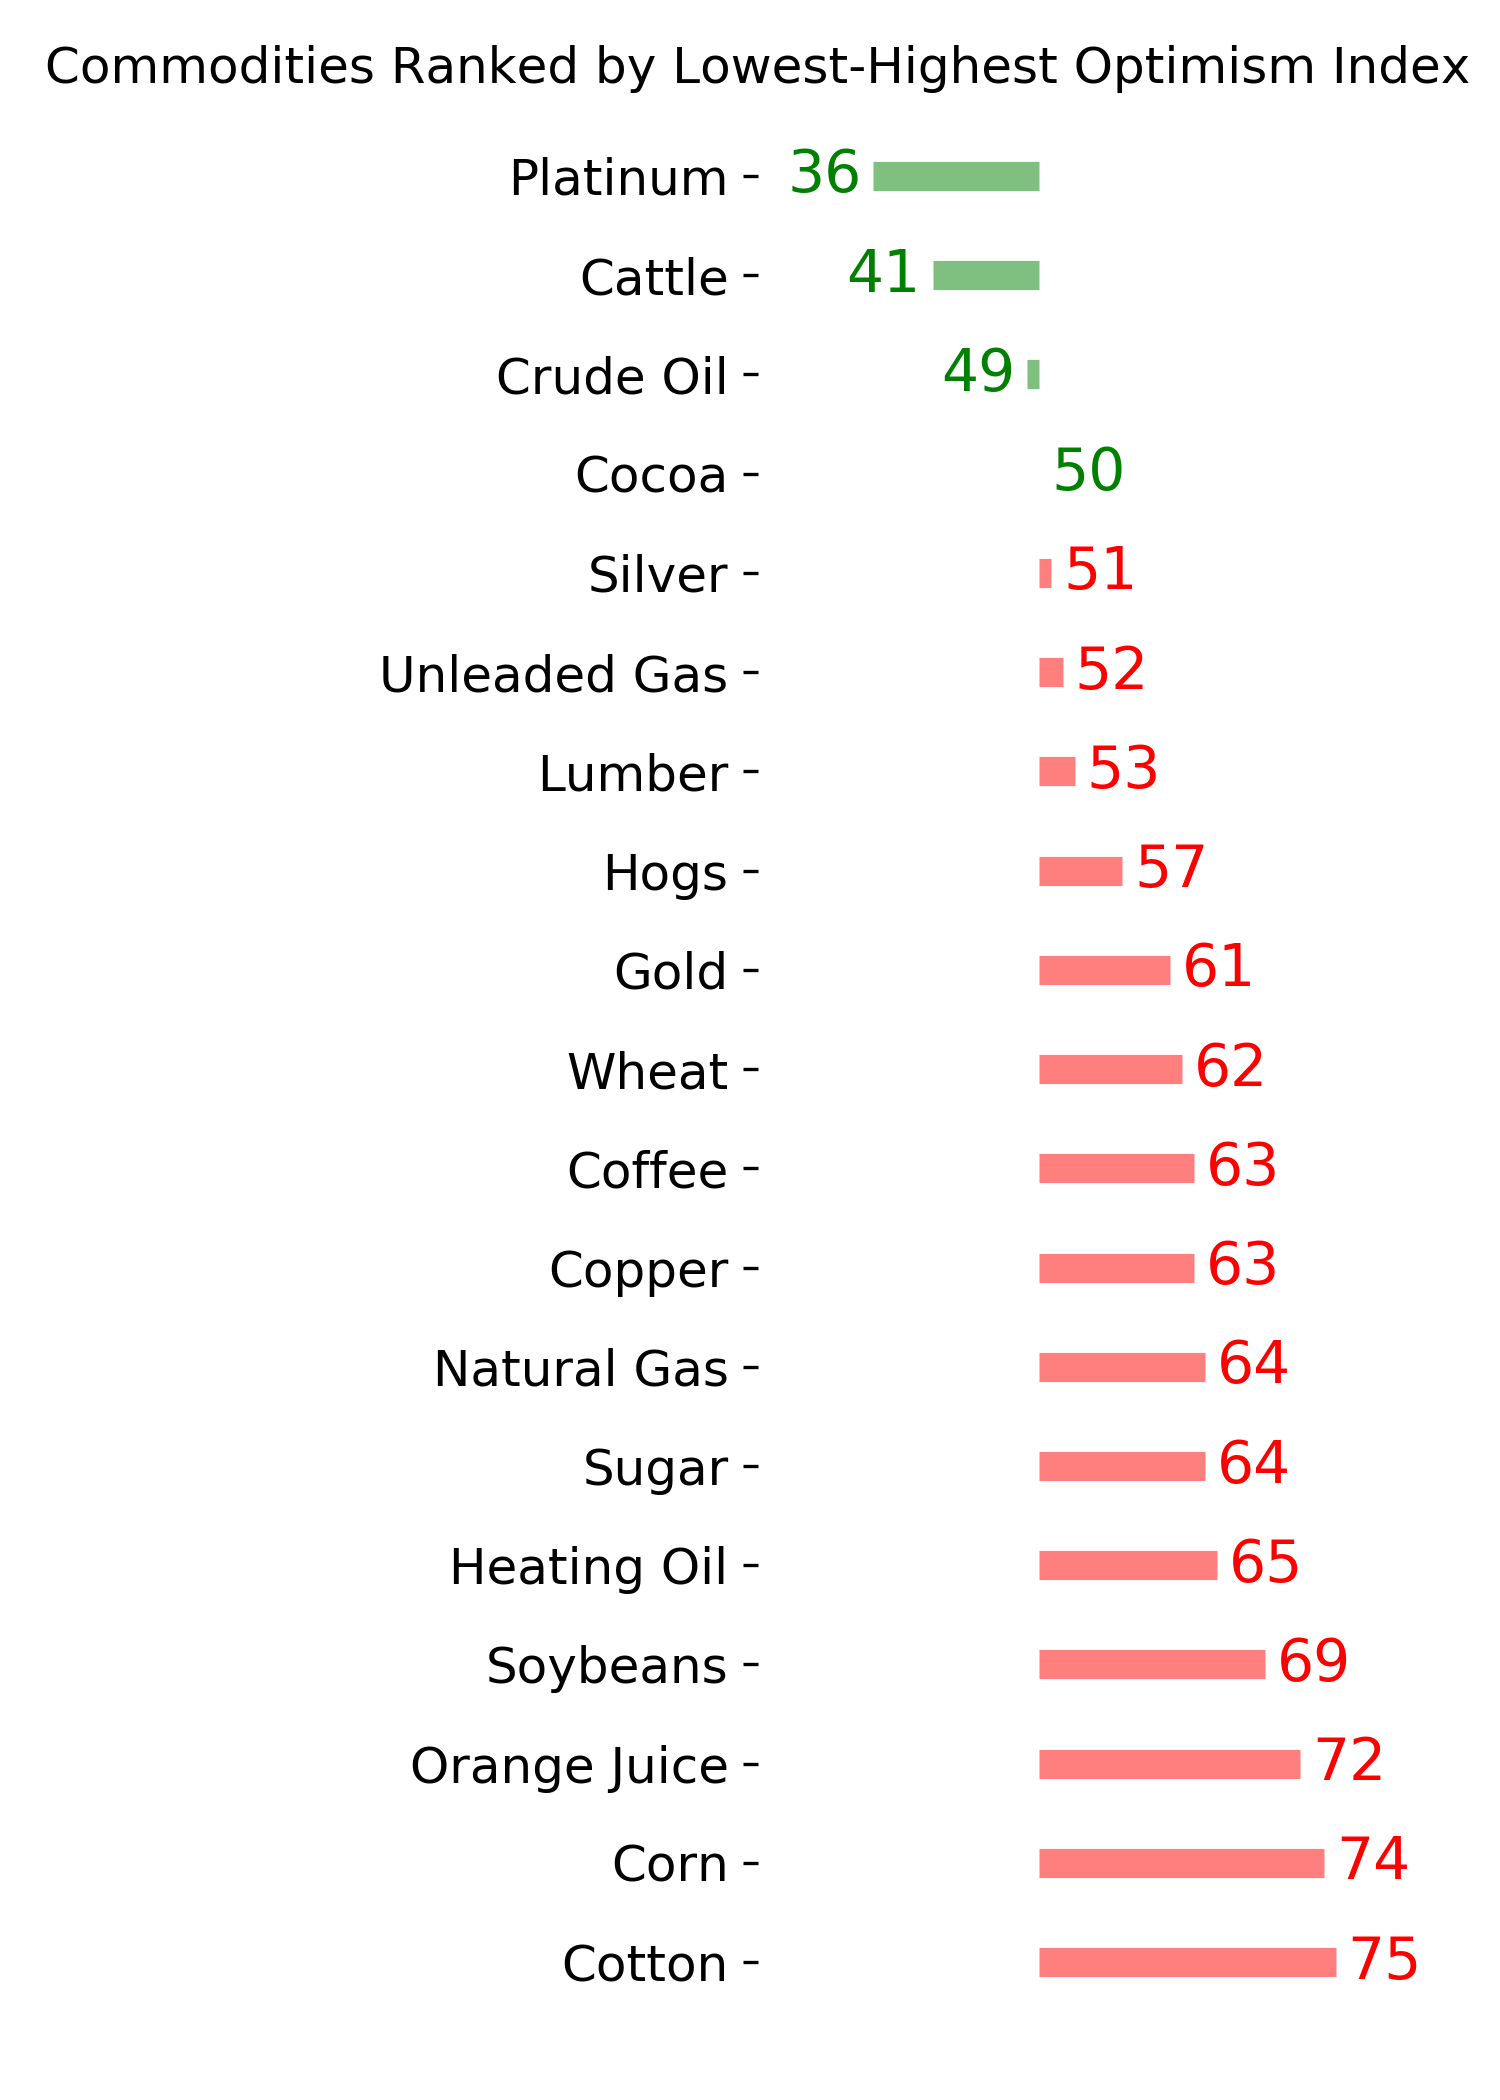
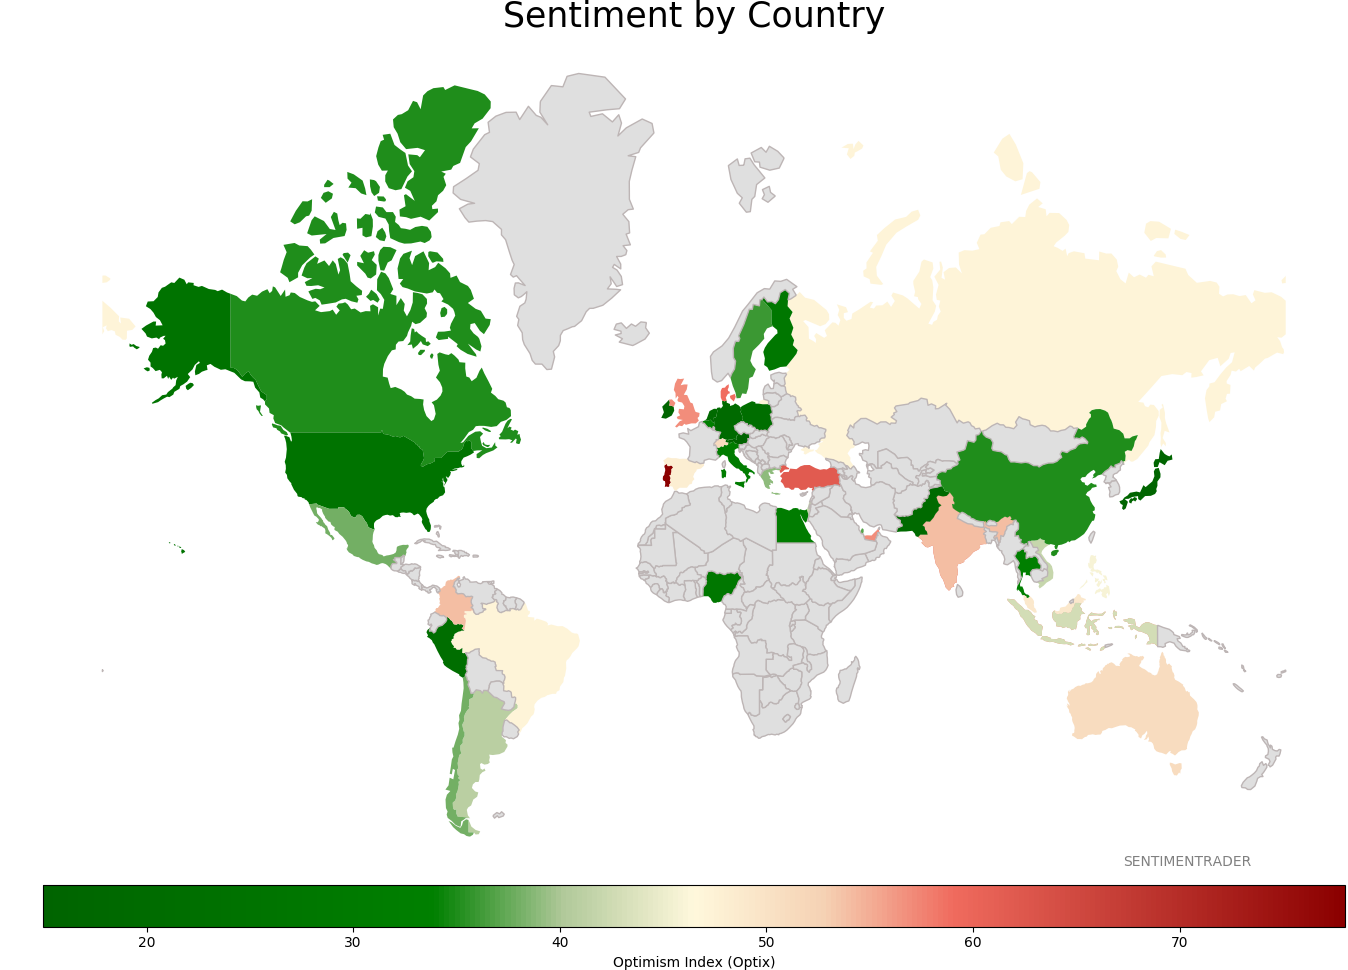
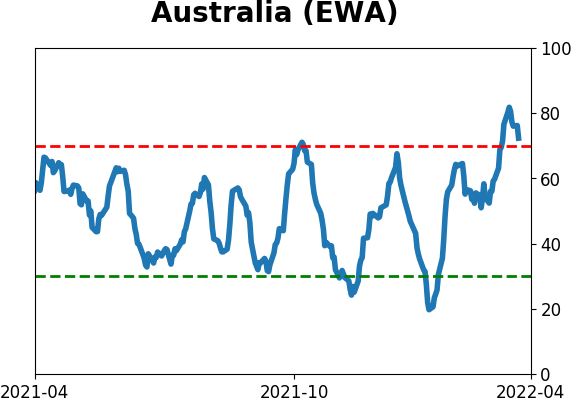
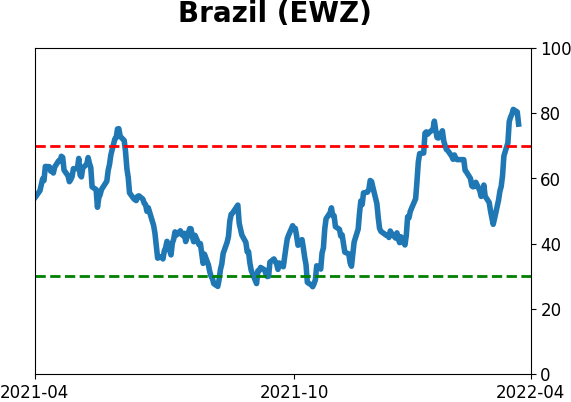
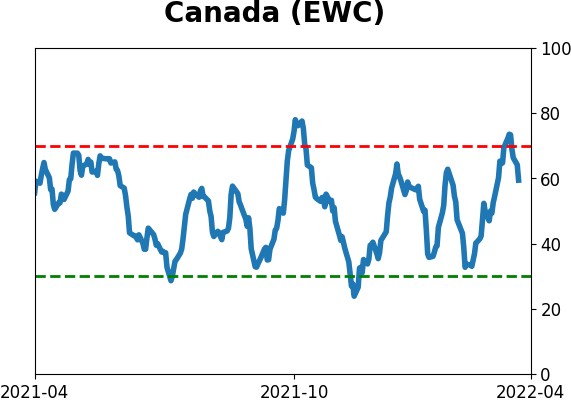
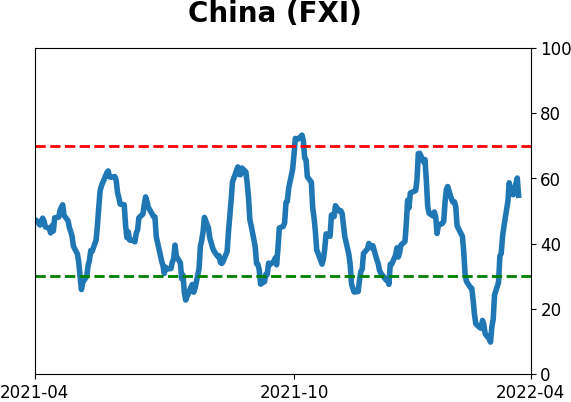
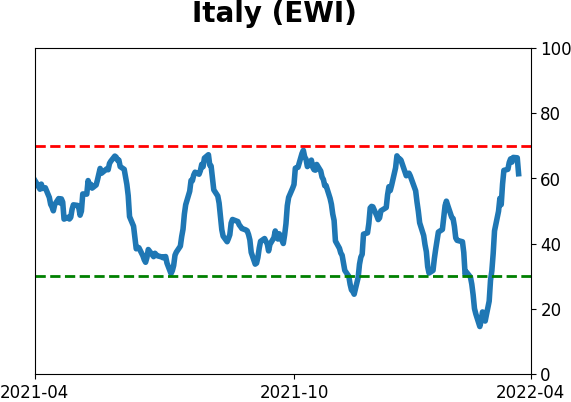
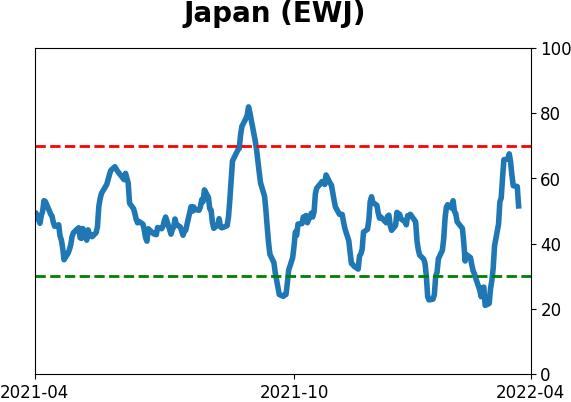
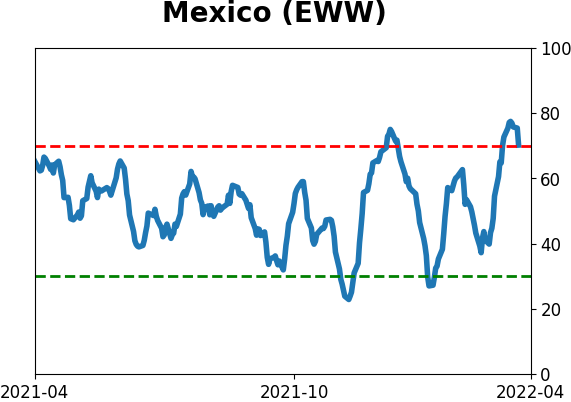
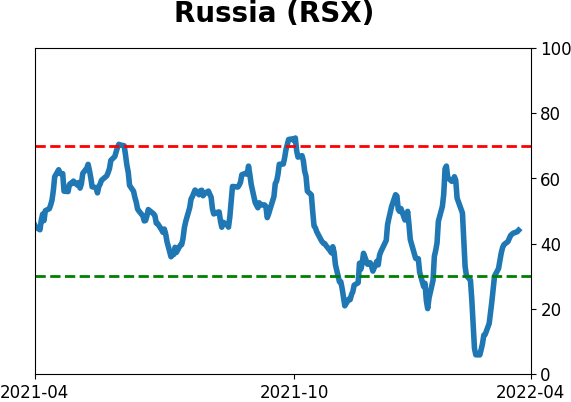
Sentiment Around The World
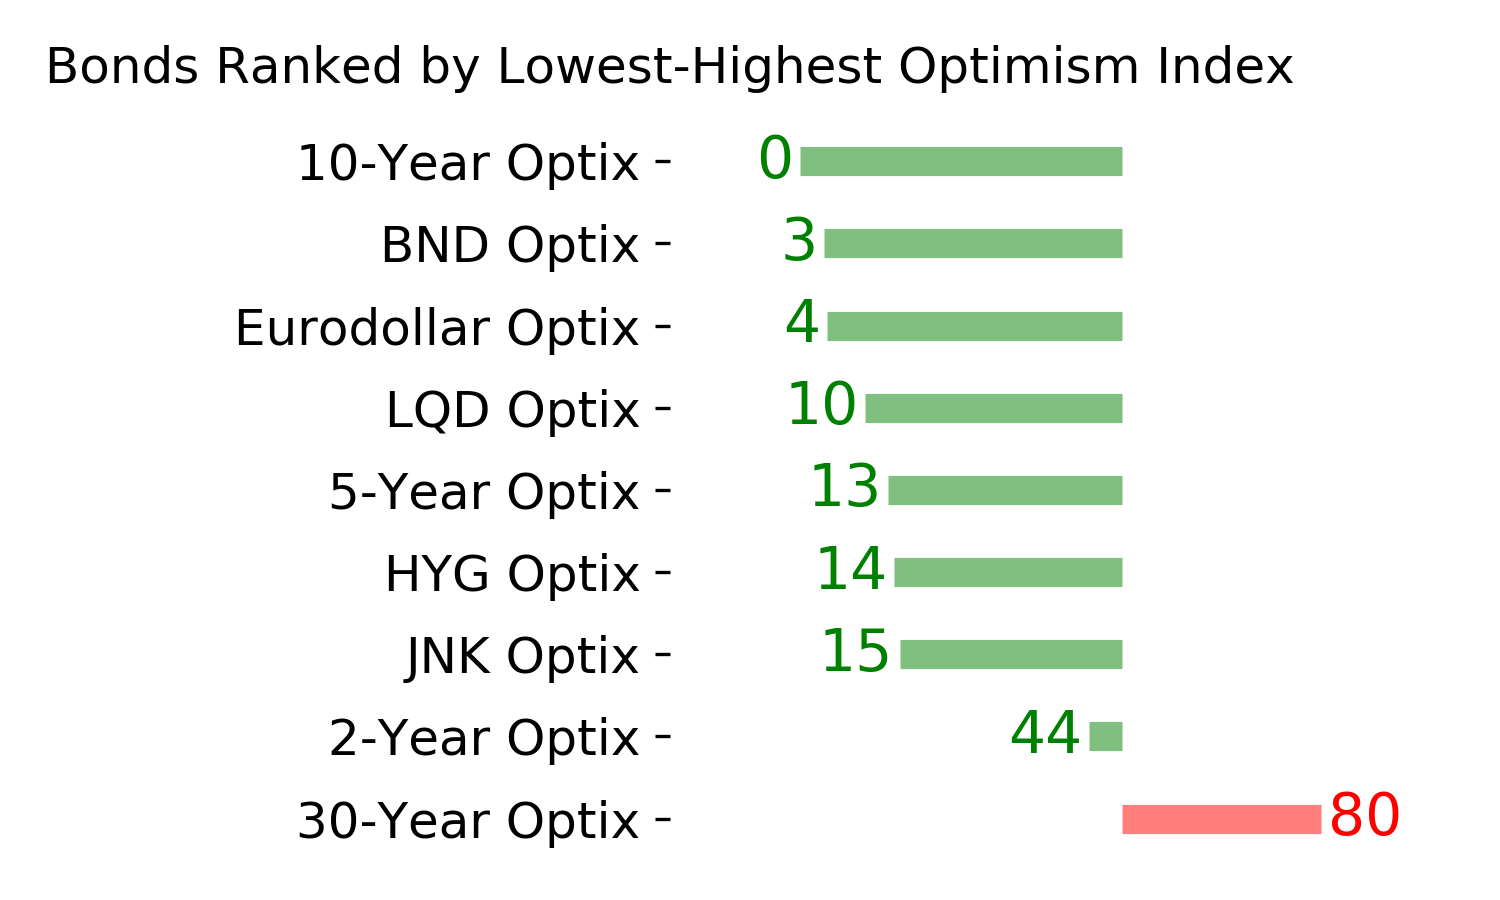
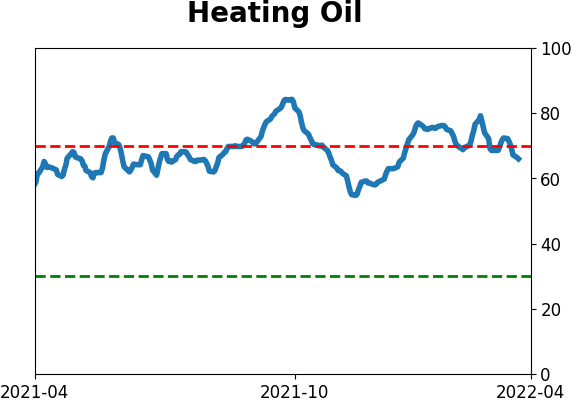
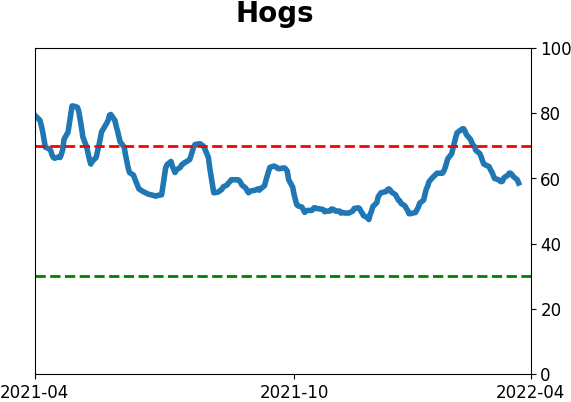
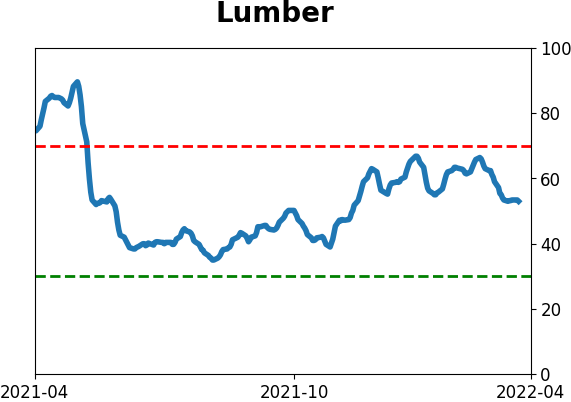
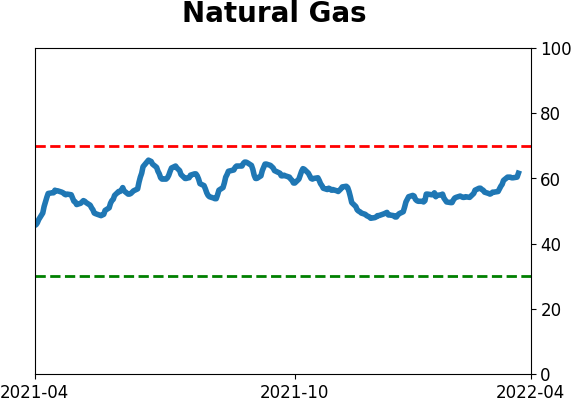
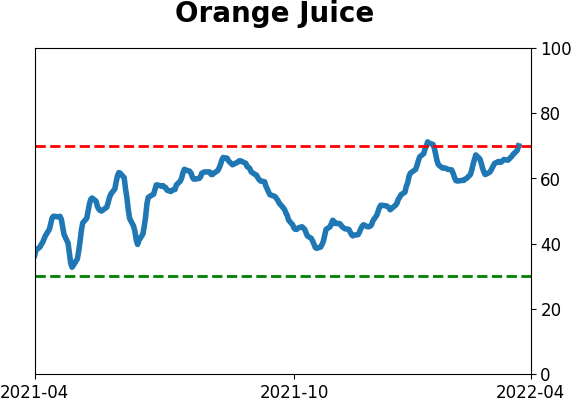
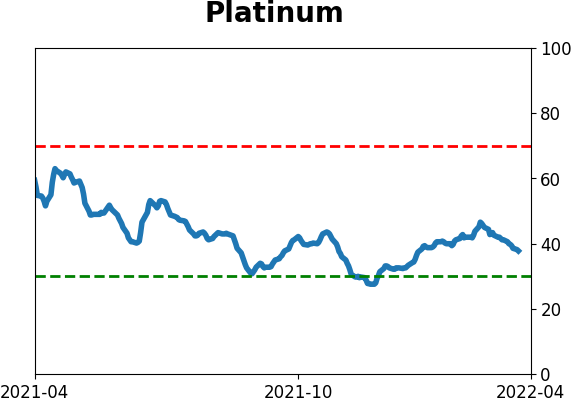
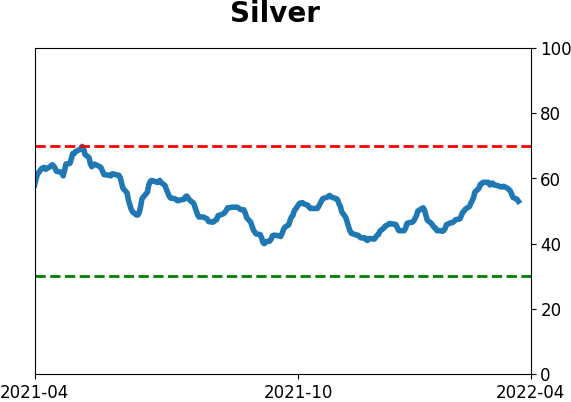
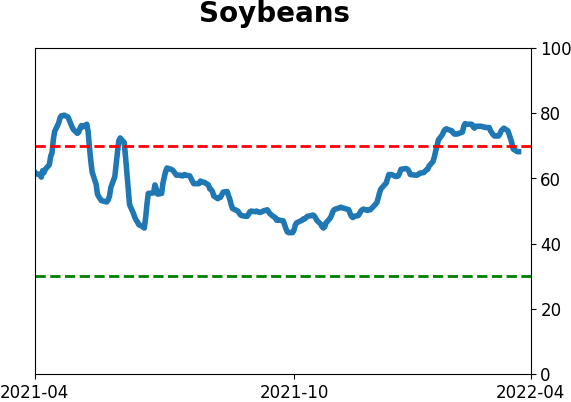
Optimism Index Thumbnails
|
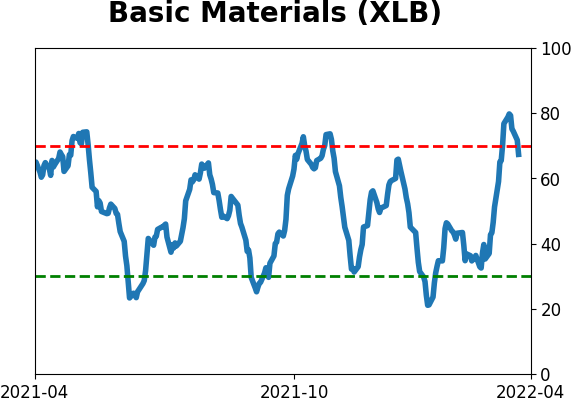
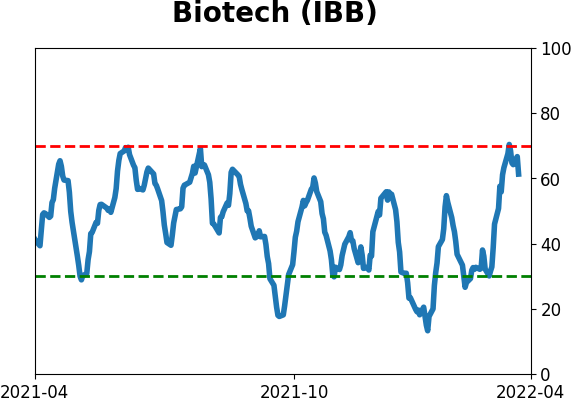
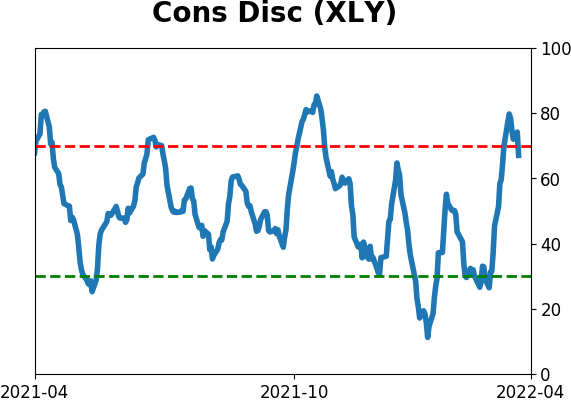
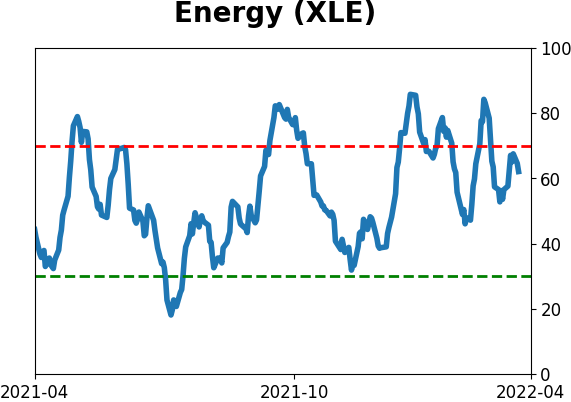
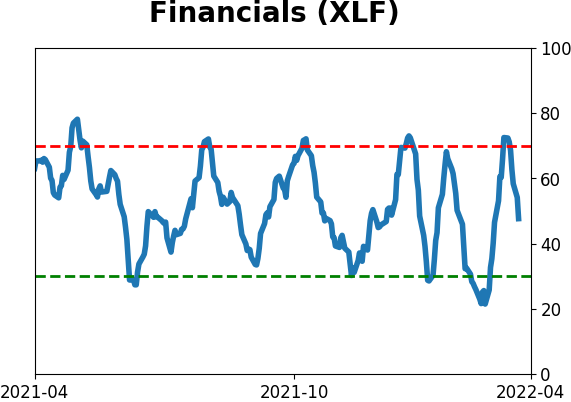
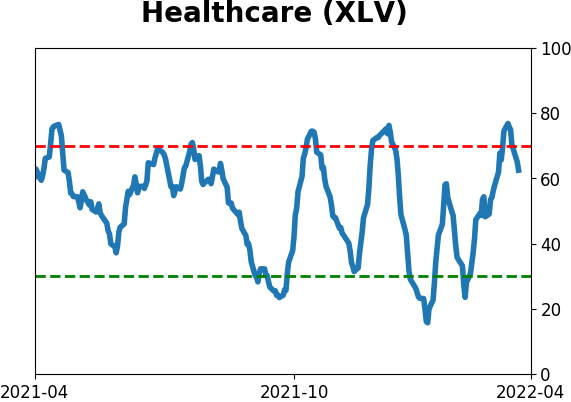
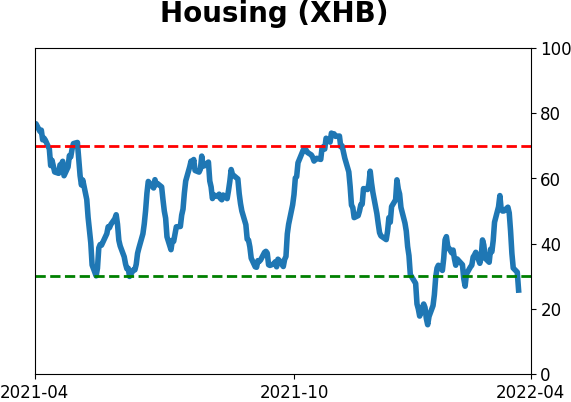
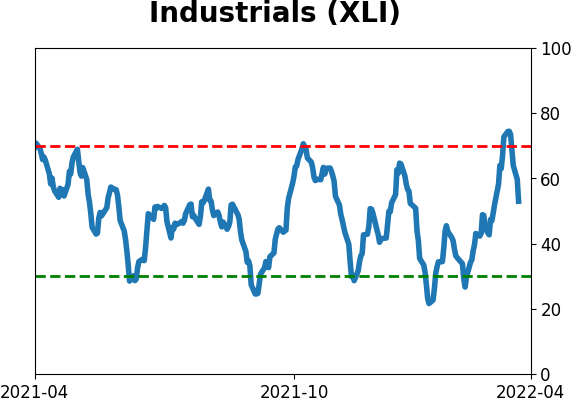
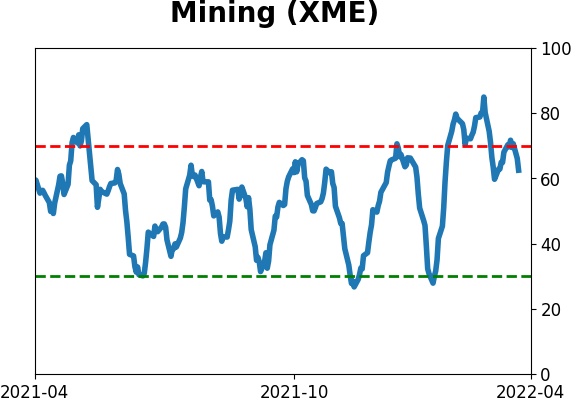
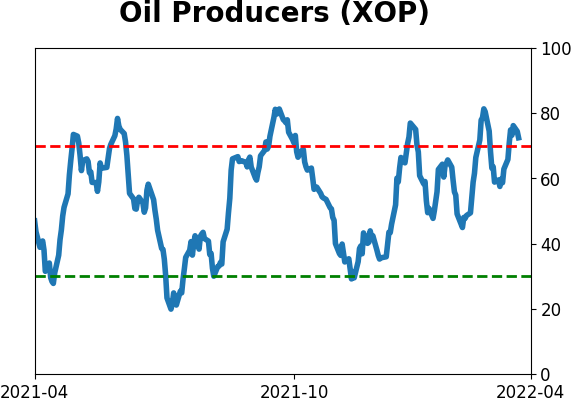
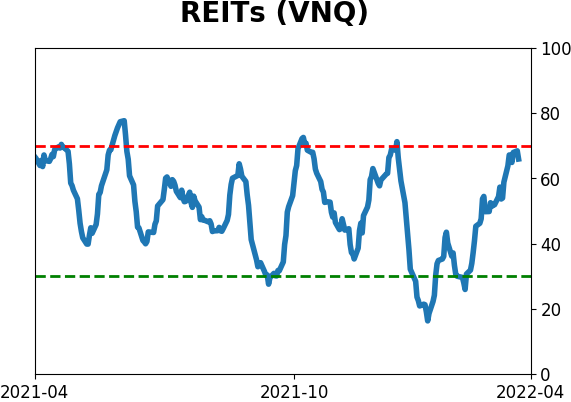
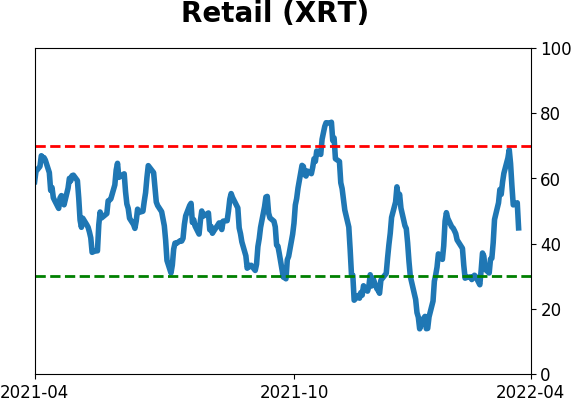
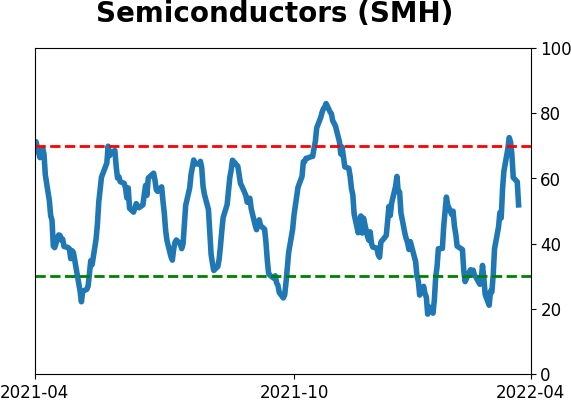
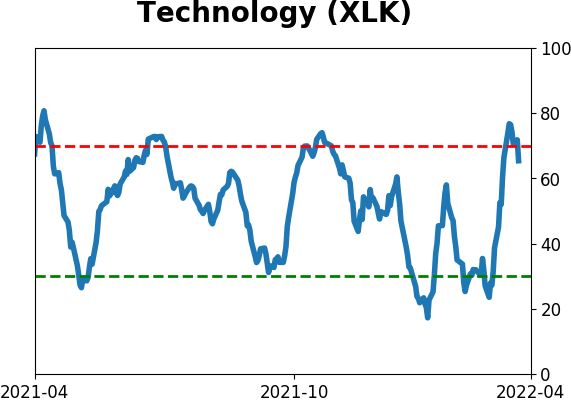
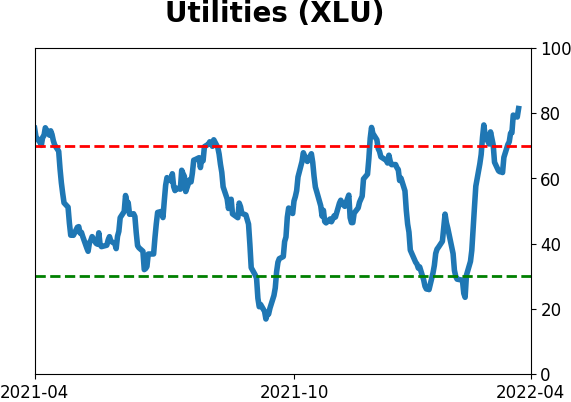
Sector ETF's - 10-Day Moving Average
|
|
|
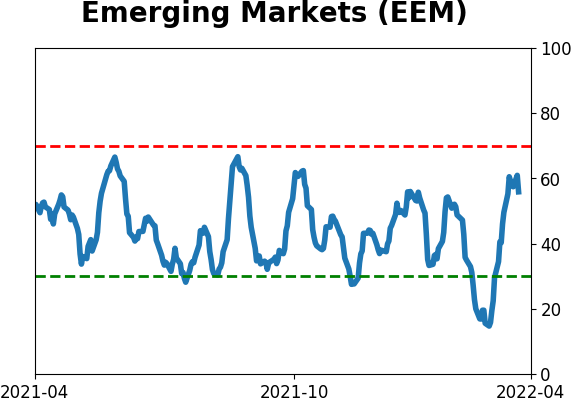
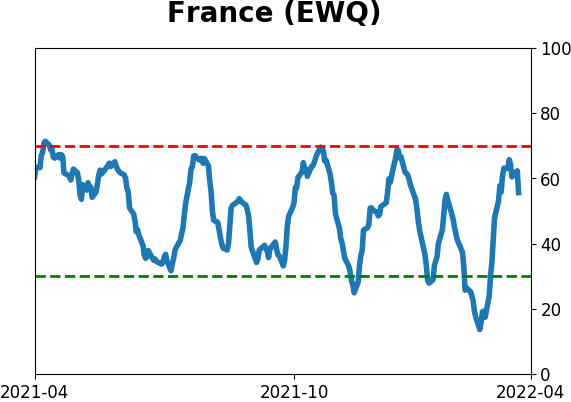
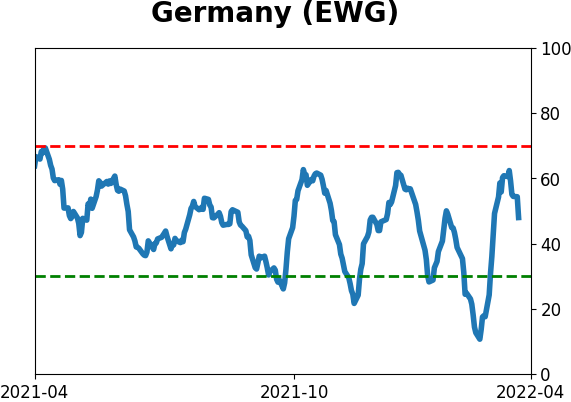
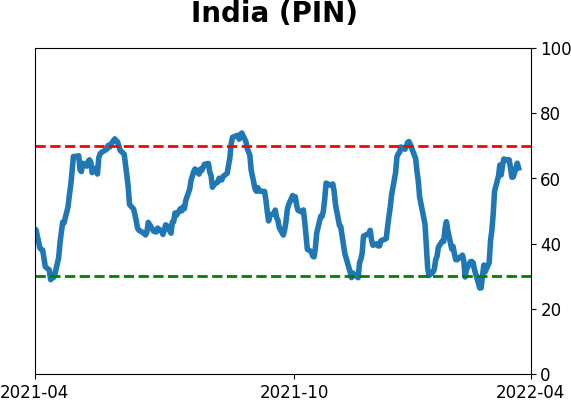
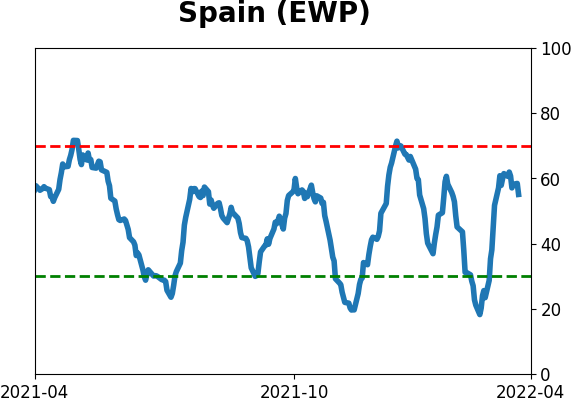
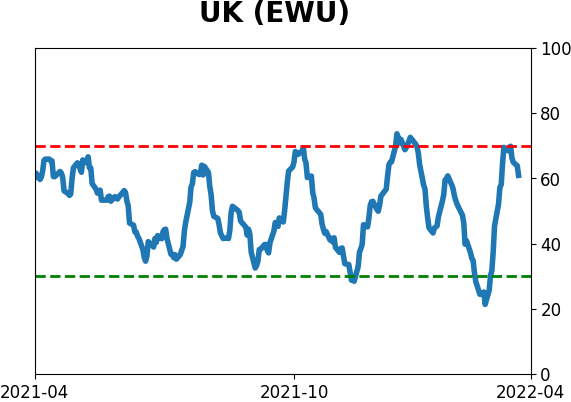
Country ETF's - 10-Day Moving Average
|
|
|
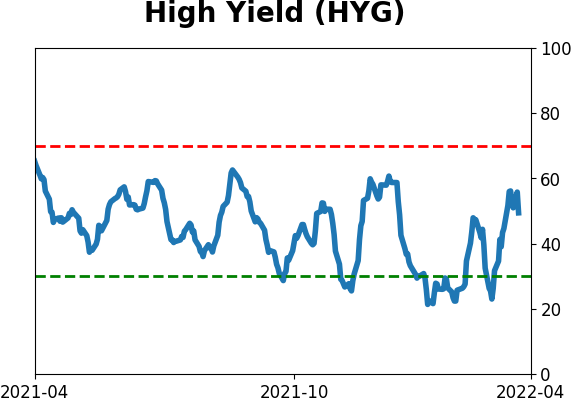
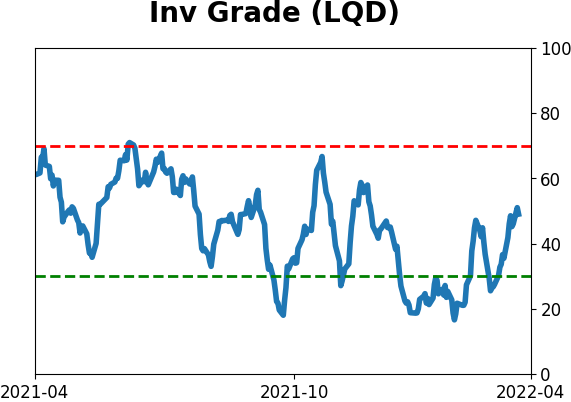
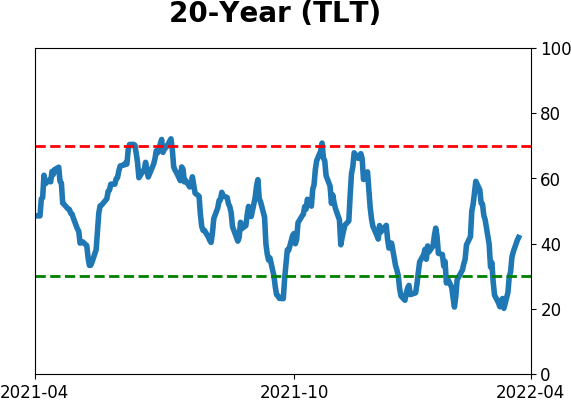
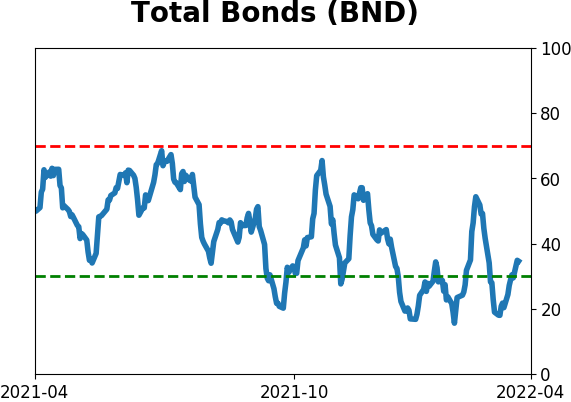
Bond ETF's - 10-Day Moving Average
|
|
|
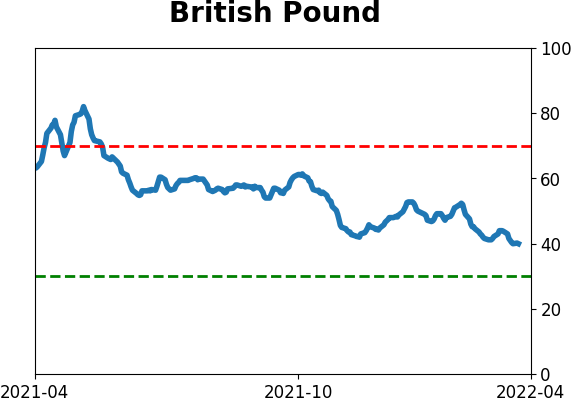
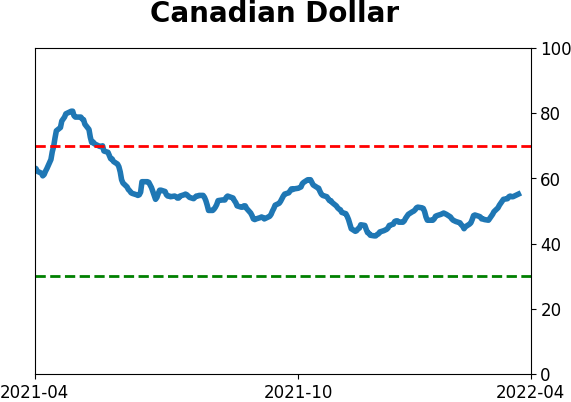
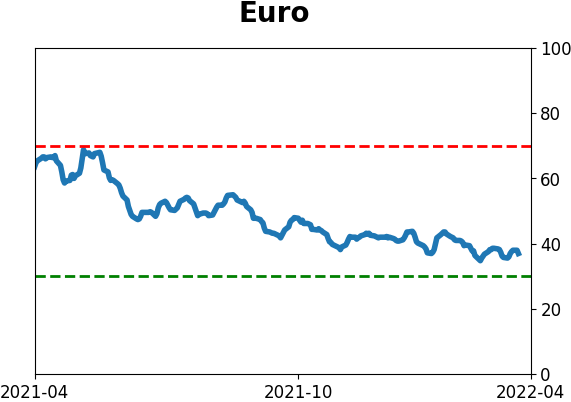
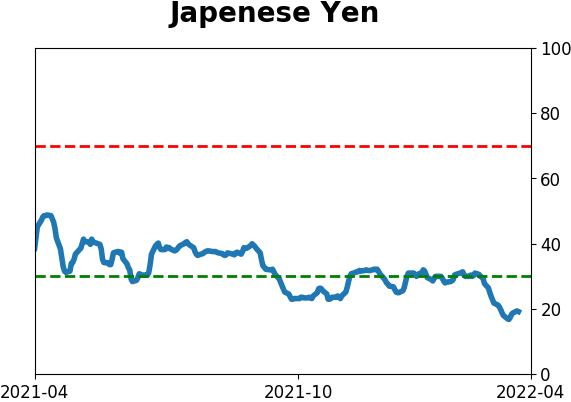
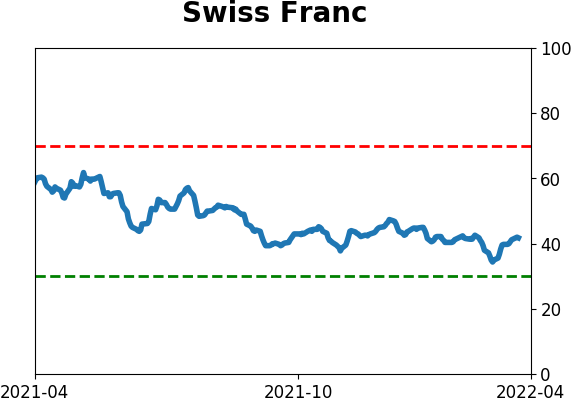
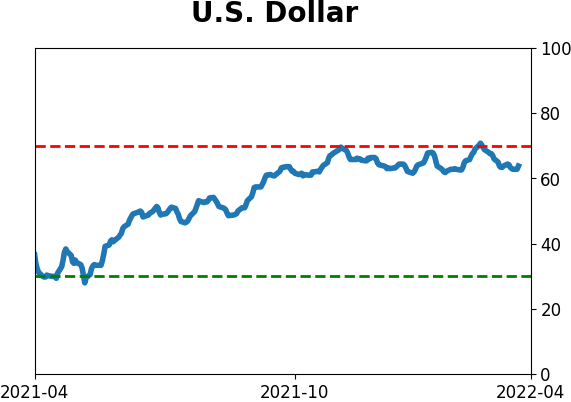
Currency ETF's - 5-Day Moving Average
|
|
|
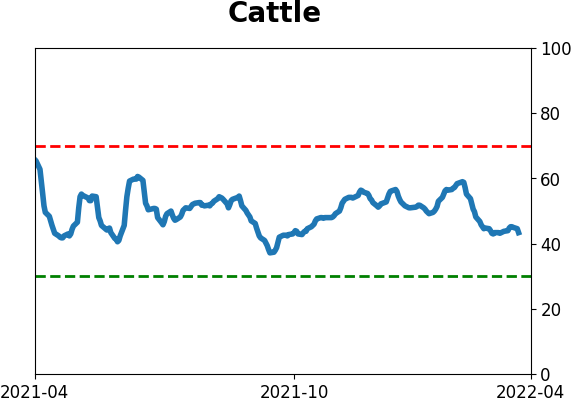
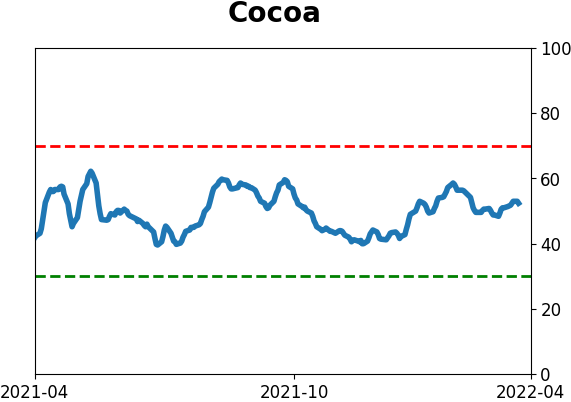
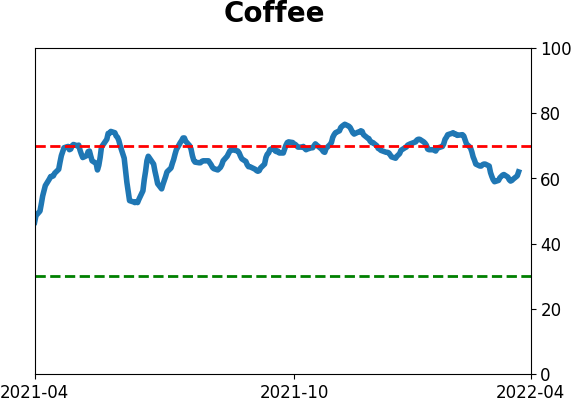
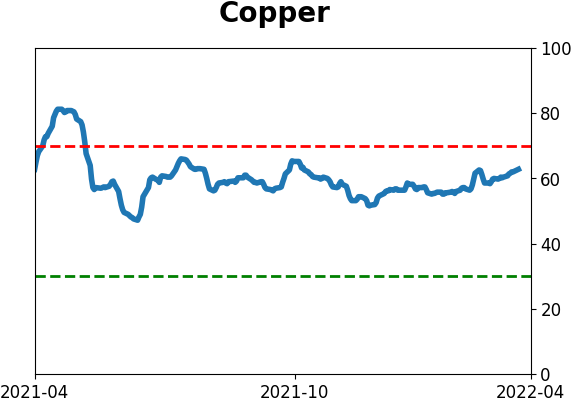
Commodity ETF's - 5-Day Moving Average
|
|