Headlines
|
|
Investors are aggressively buying the dip:
The first quarter of 2023 saw one of the best-ever buy-the-dip reactions. The S&P 500 rebounded an average of more than 0.3% following a down day. Years when investors had a buy-the-dip (BTFD) mentality significantly outperformed those years when investors tended to sell dips.
|
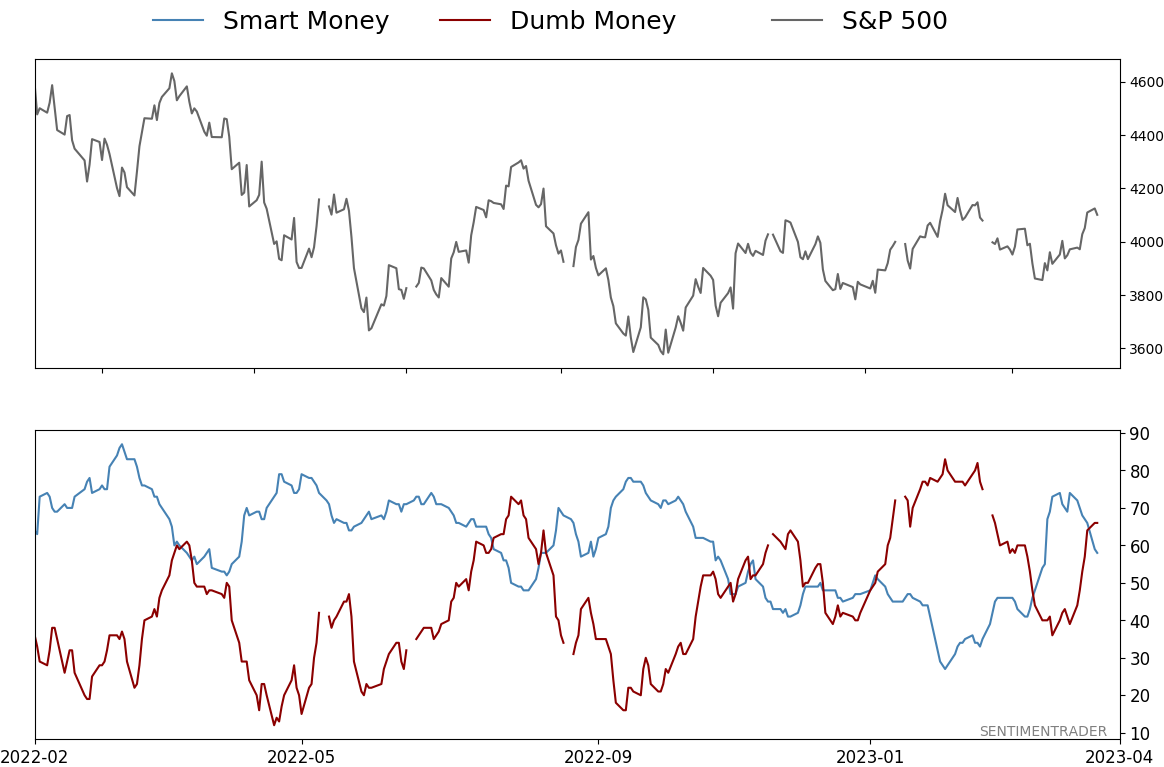
Smart / Dumb Money Confidence
|
Smart Money Confidence: 58%
Dumb Money Confidence: 66%
|
|
Risk Levels
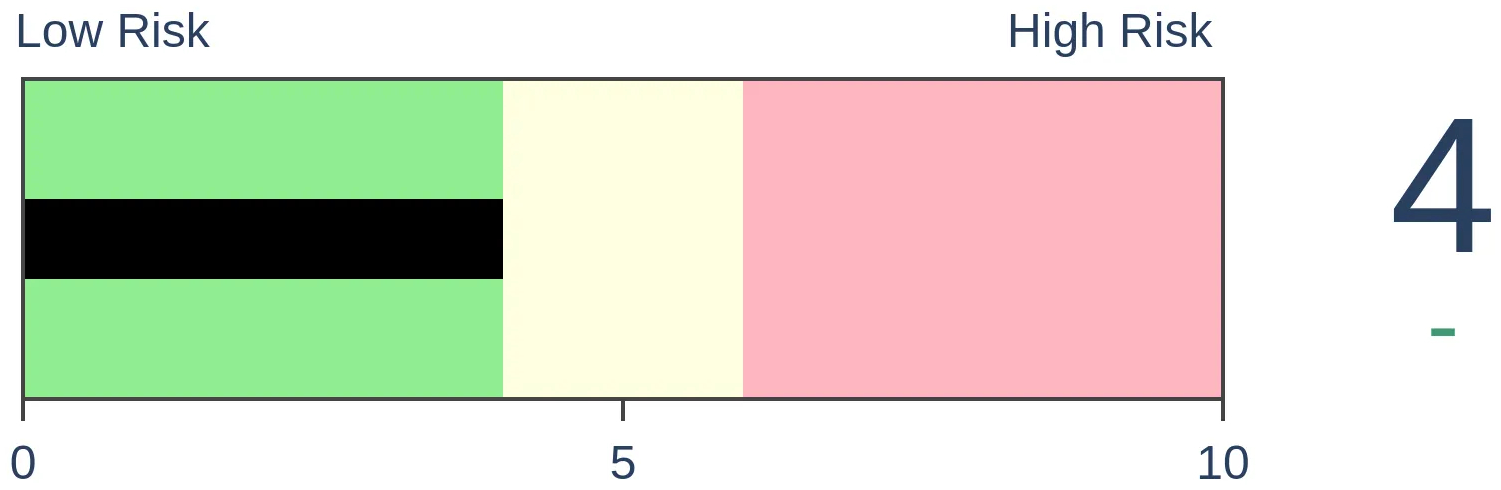
Stocks Short-Term
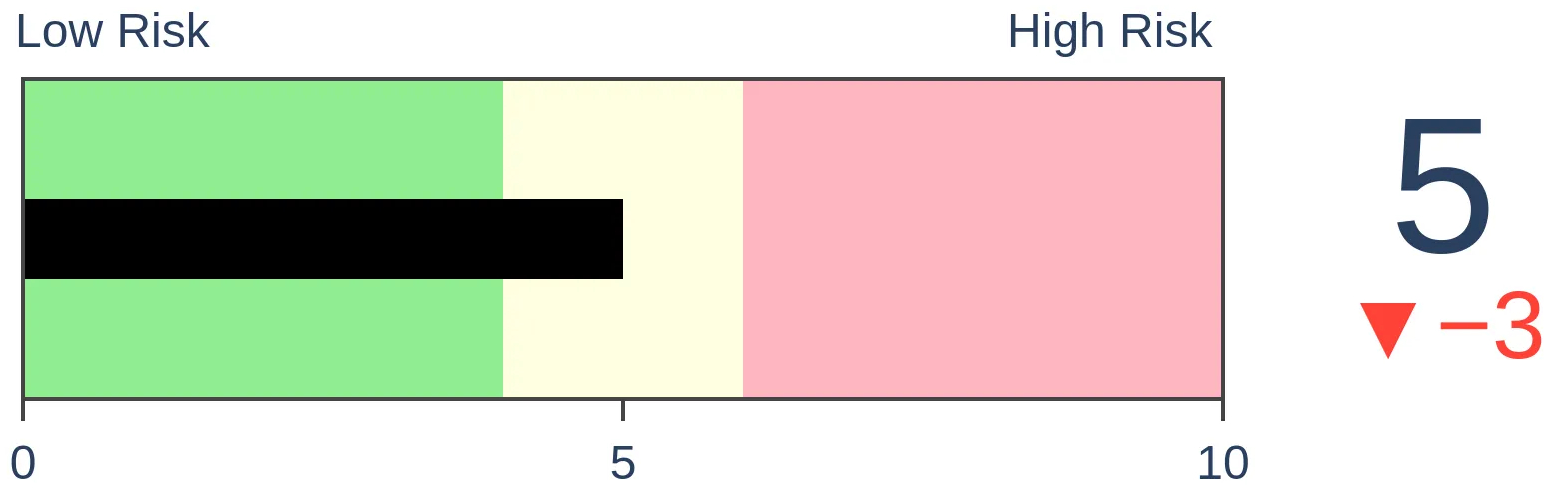
|
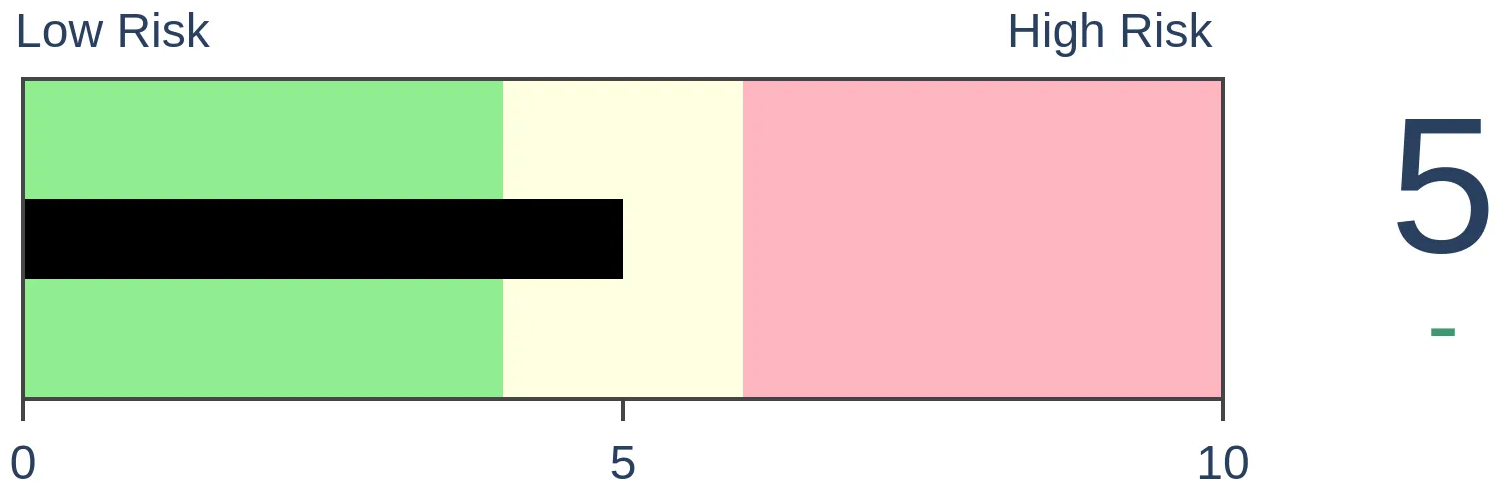
Stocks Medium-Term
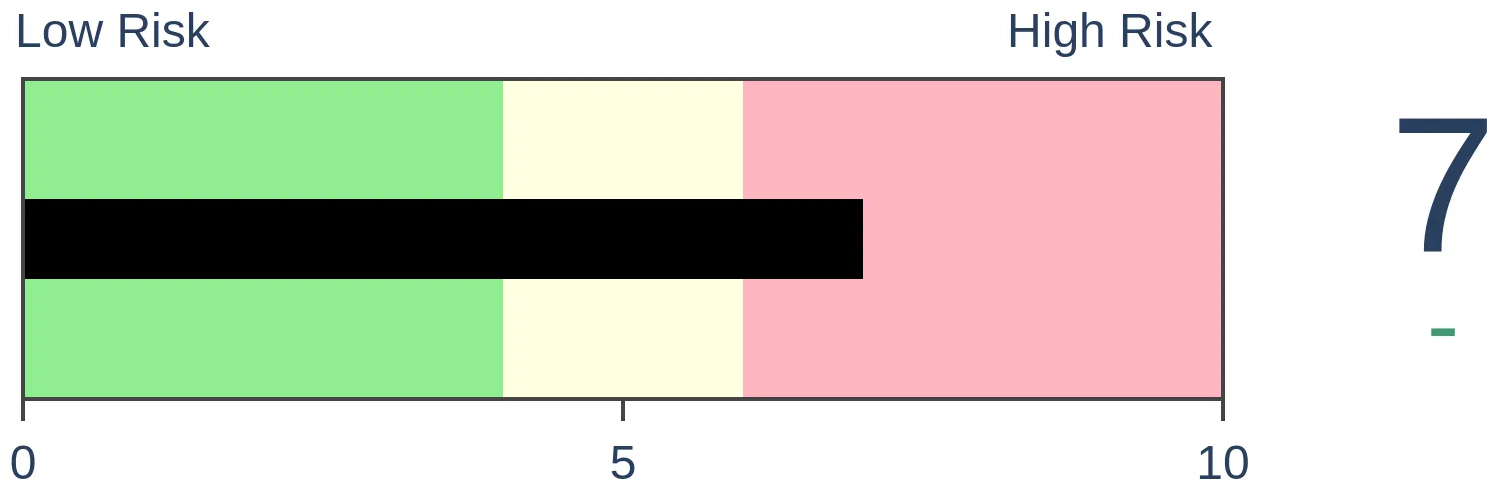
|
|
Bonds

|
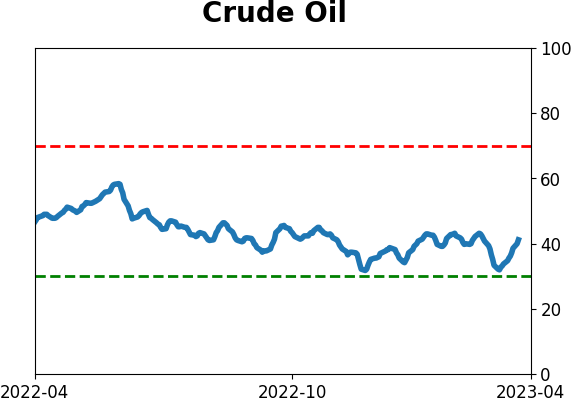
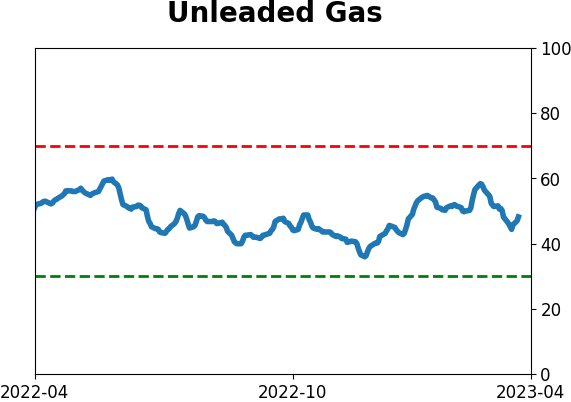
Crude Oil

|
|
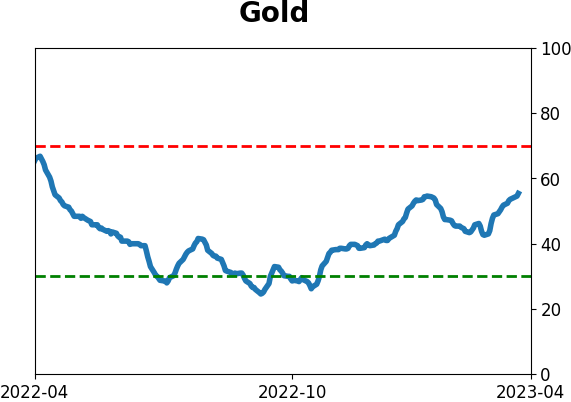
Gold
|
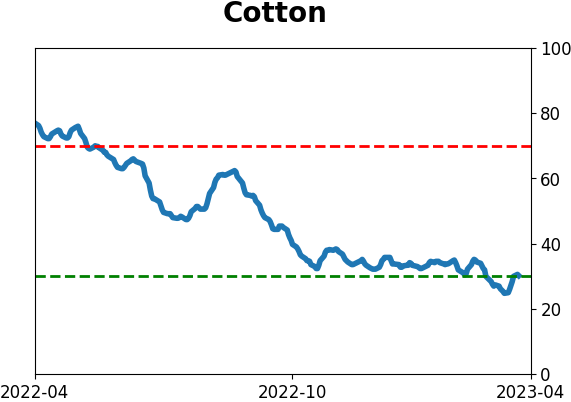
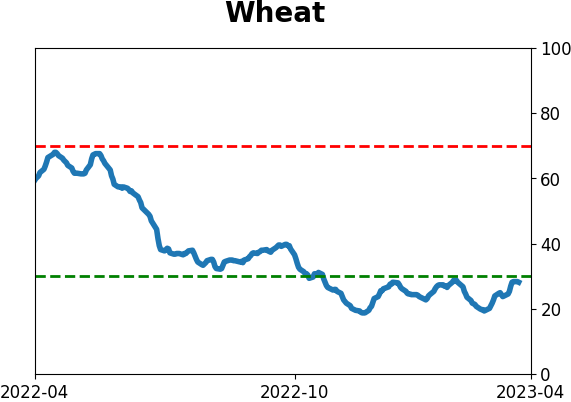
Agriculture
|
|
Research
By Jason Goepfert
BOTTOM LINE
The first quarter of 2023 saw one of the best-ever buy-the-dip reactions. The S&P 500 rebounded an average of more than 0.3% following a down day. Years when investors had a buy-the-dip (BTFD) mentality significantly outperformed those years when investors tended to sell dips.
FORECAST / TIMEFRAME
None
|
Key points:
- The first quarter of 2023 has been one of the best ever for buying the dip
- The S&P 500 returned an average of more than 0.3% the day following a down day
- Years with a heavy buy-the-dip mentality in Q1 significantly outperformed years when that behavior was absent
One of the best first quarters ever for buying the dip
According to a Bloomberg article, investors in 2023 have been among the most willing ever to buy stocks after a down day. Indeed they have, as this year ranks as the 7th-best ever for BTFD (Buy The F*cking Dip).
The chart below shows the average next-day return in the S&P 500 after it suffered a daily decline. The average is from the first trading day of the year through the end of March for each year. So far this year, the S&P has snapped back by an average of 0.32%. That's the 4th-best during modern markets.
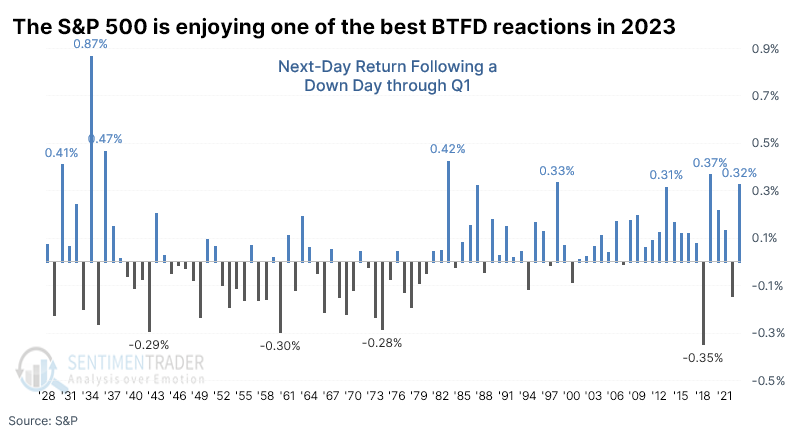
The key is whether it means anything. Bulls will suggest that it's a return to optimism, which is necessary for stocks to continue higher. Bears will scream that it's irrational exuberance (Don't you know banks are melting down?! There is a new cold war?! Society is crumbling?!).
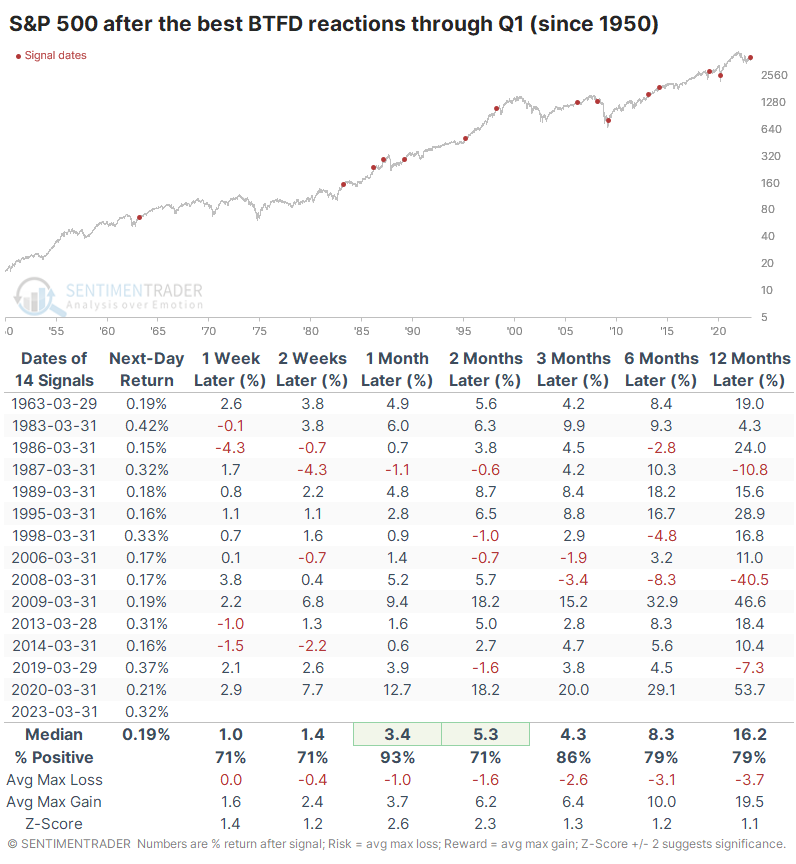
Whatever the narrative, the table below shows how the index performed after the best BTFD reactions through Q1 since 1928.
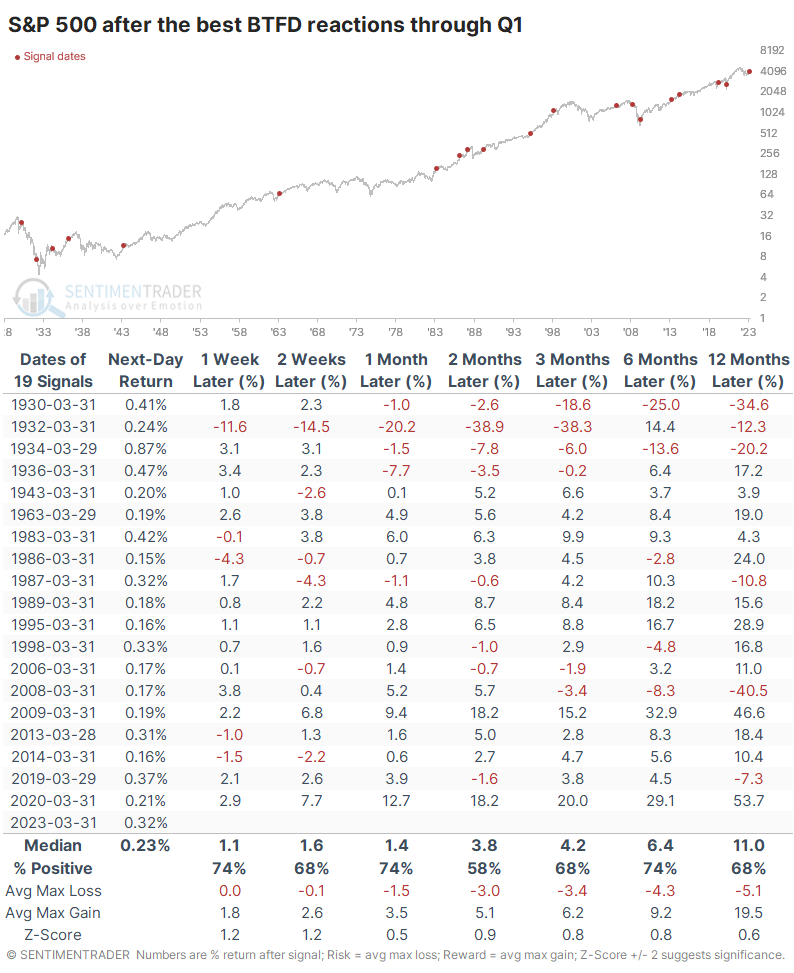
Most of the worst returns occurred during the 1930s. If we look at modern markets, years since 1950, returns improved significantly. April tended to be a fantastic month, with only a single slight loss. The month averaged a gain of +3.4%, with nearly a 4-to-1 reward-to-risk ratio.
The worst failure over the medium- to long-term was in 2008 when the S&P gained nearly 6% over the next two months, then completely crapped out and suffered a massive loss. This also triggered in 1987, leading to the October crash, but for the most part, it led to consistently positive years.
What happens when investors avoid BTFD
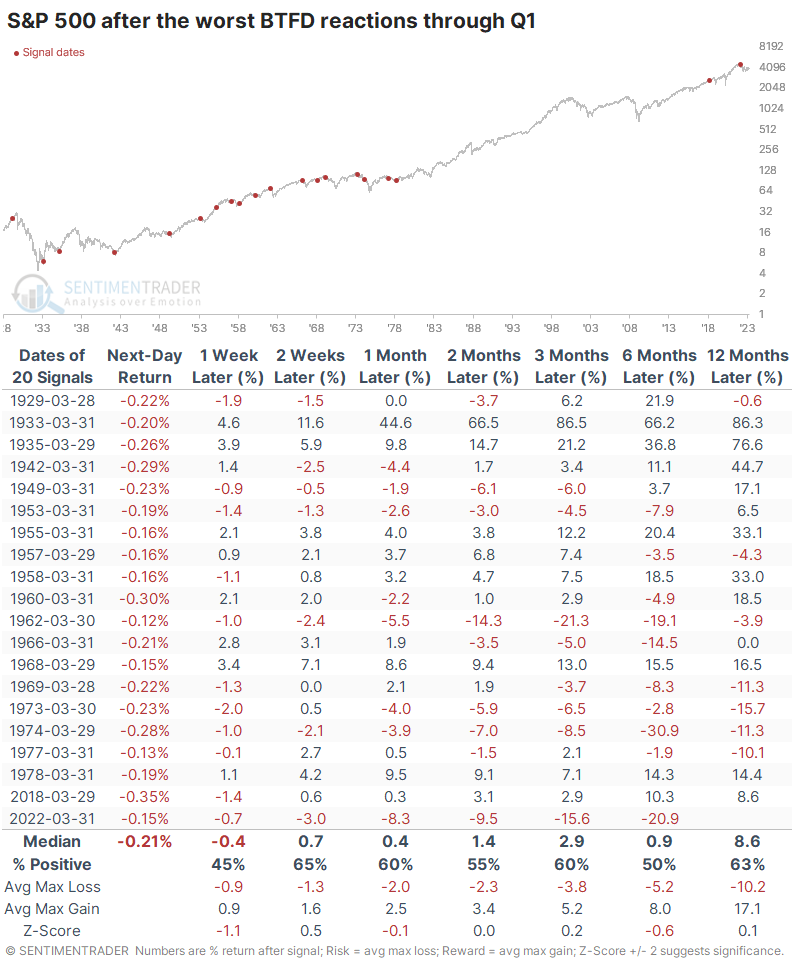
We like to look at counter-examples to see if there might be something more to the data. The table below shows the opposite years, those when investors were the least interested in buying the dip. Through the first quarter, the S&P averaged a next-day return of -0.21% following a down day.
These years had more of a tendency to see further weakness. Over the next year, the maximum loss exceeded -10%, compared to only -3.7% in the table above. The S&P's average returns and win rate were also significantly lower.
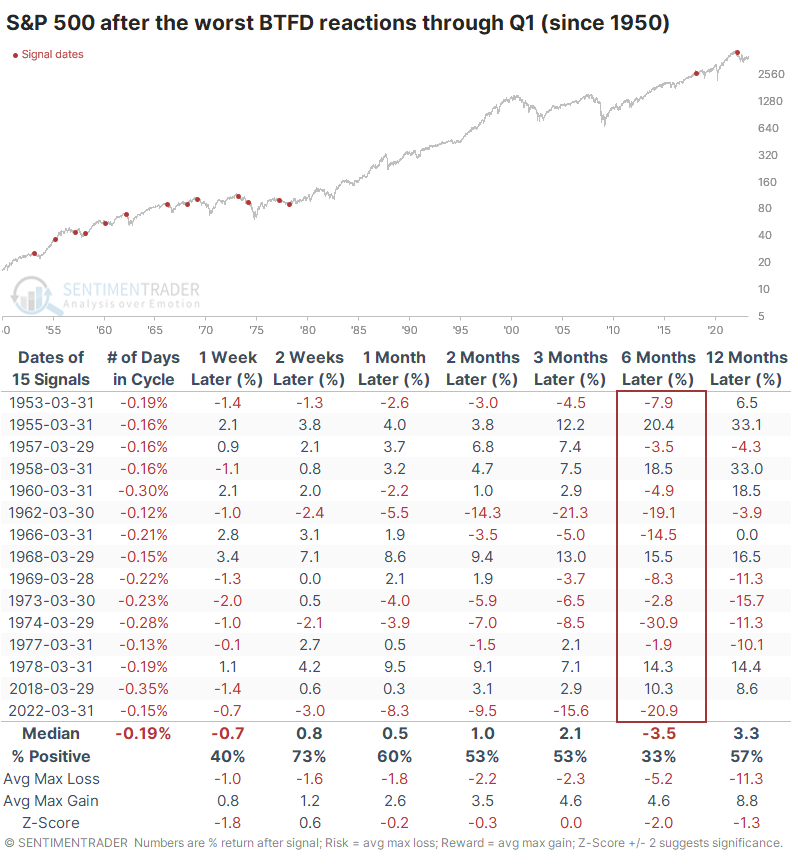
Ironically, the results would be even worse if we only focused on modern markets, precisely the opposite of the above. Over the next six months, the S&P sported a positive return only 33% of the time, averaging a wretched -3.5%.
What the research tells us...
After a cycle like the last two years, when we had to endure the hubris of free-money geniuses followed by spectacular flameouts in the most speculative issues, there is a tendency to see the next bogeyman around every corner. Investors start to see the specter of excessive optimism in any stock that has the gall to rally for more than a few days. And when there is a phenomenon like months with a BTFD mentality, well, then, we're clearly back in the throes of a speculative frenzy.
That's demonstrably not the case, but even if we focus solely on that BTFD behavior, it has not consistently been a warning sign. Over the past 70 years, it has been a much better sign for stocks than if investors avoided BTFD behavior.
Indicators at Extremes
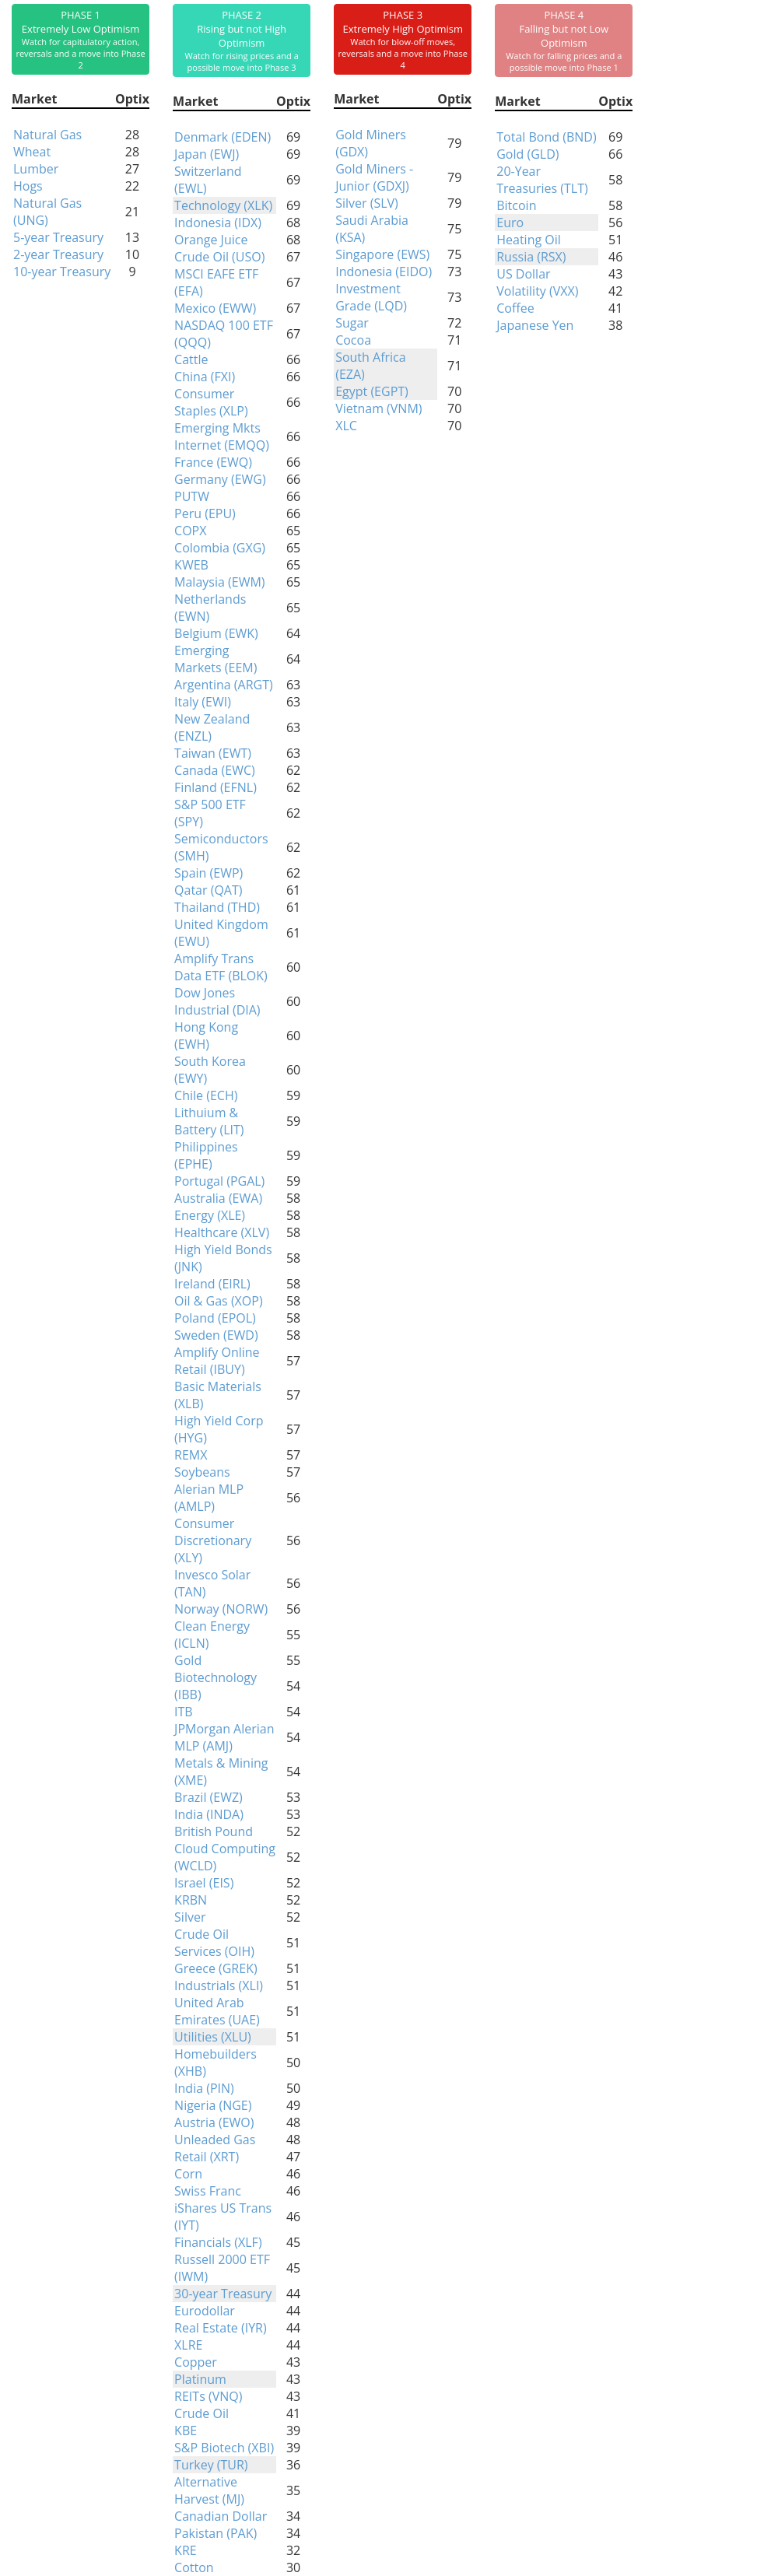
Phase Table
Ranks
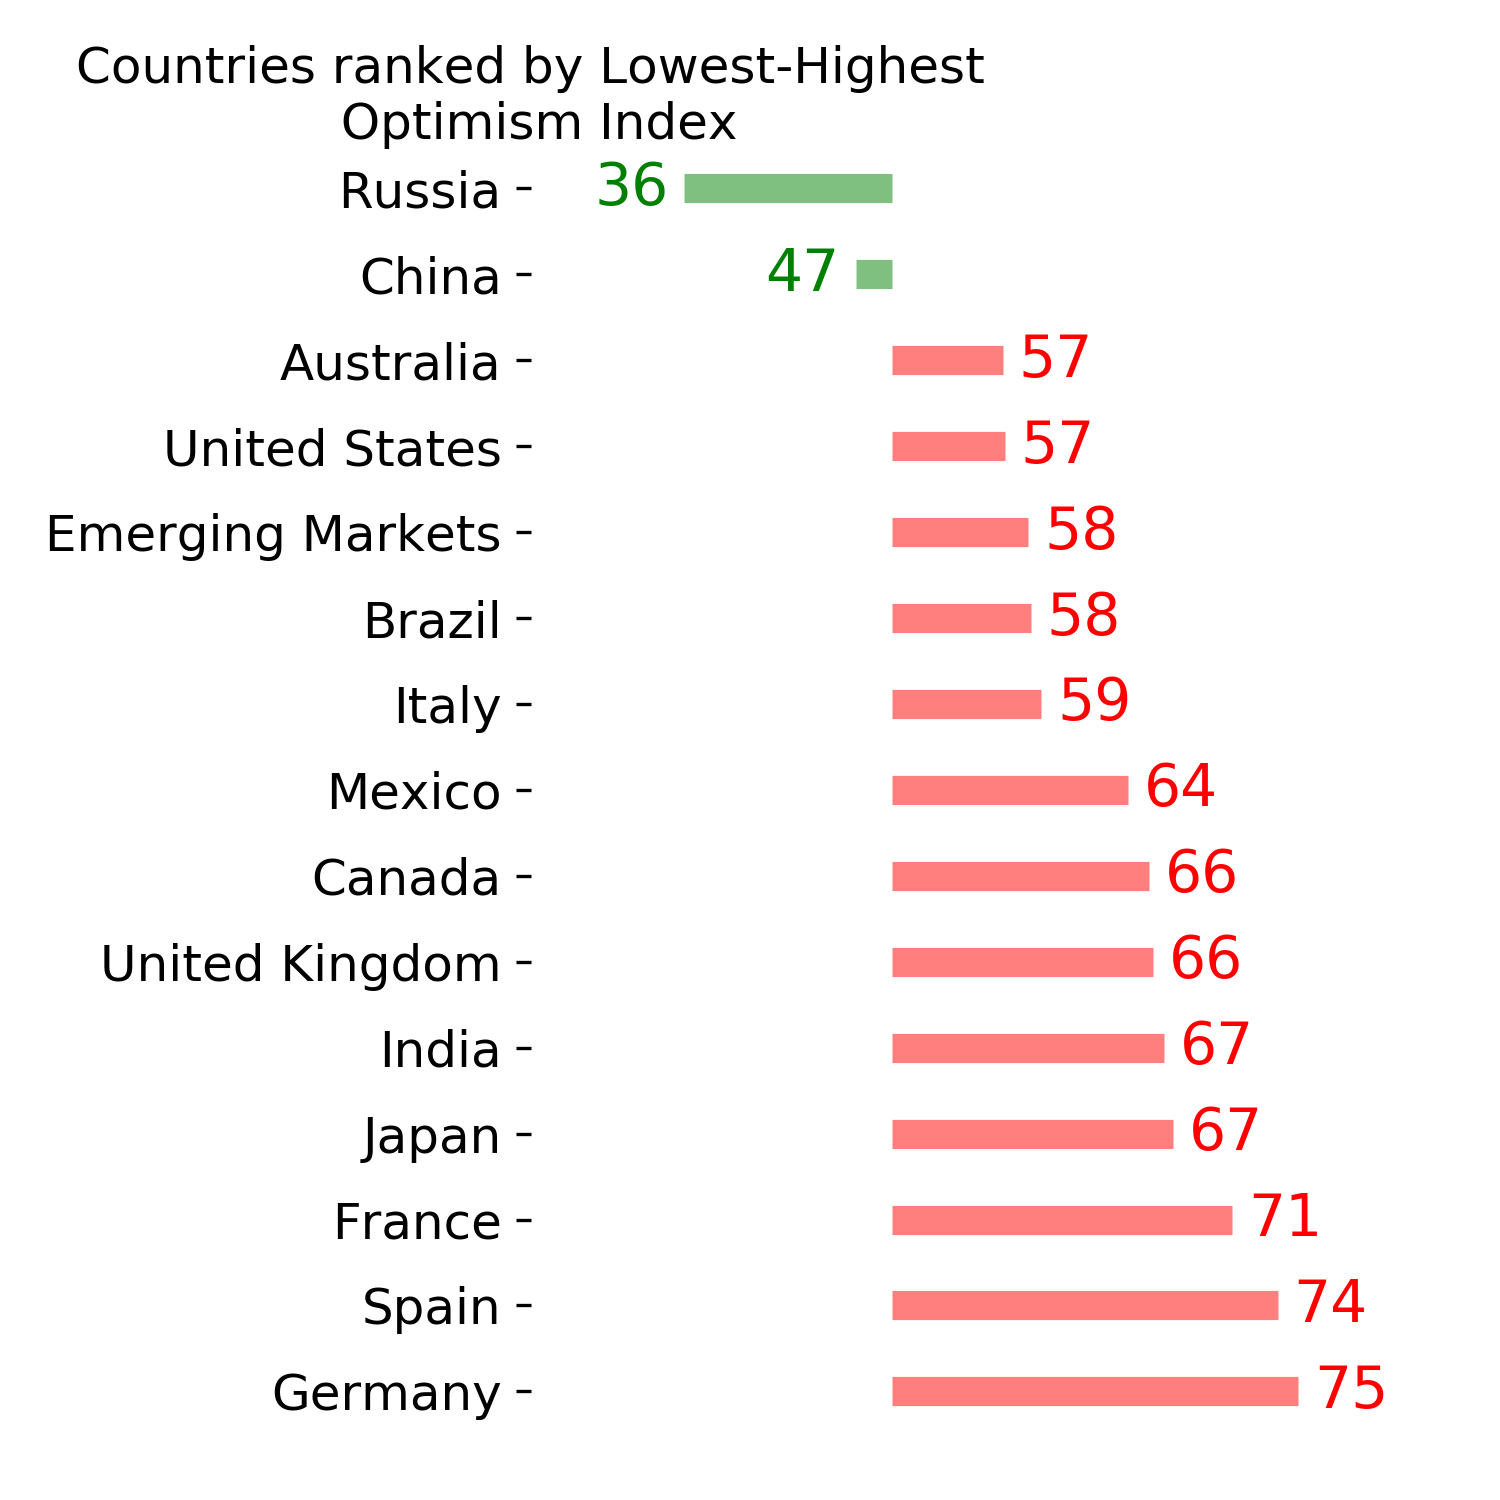
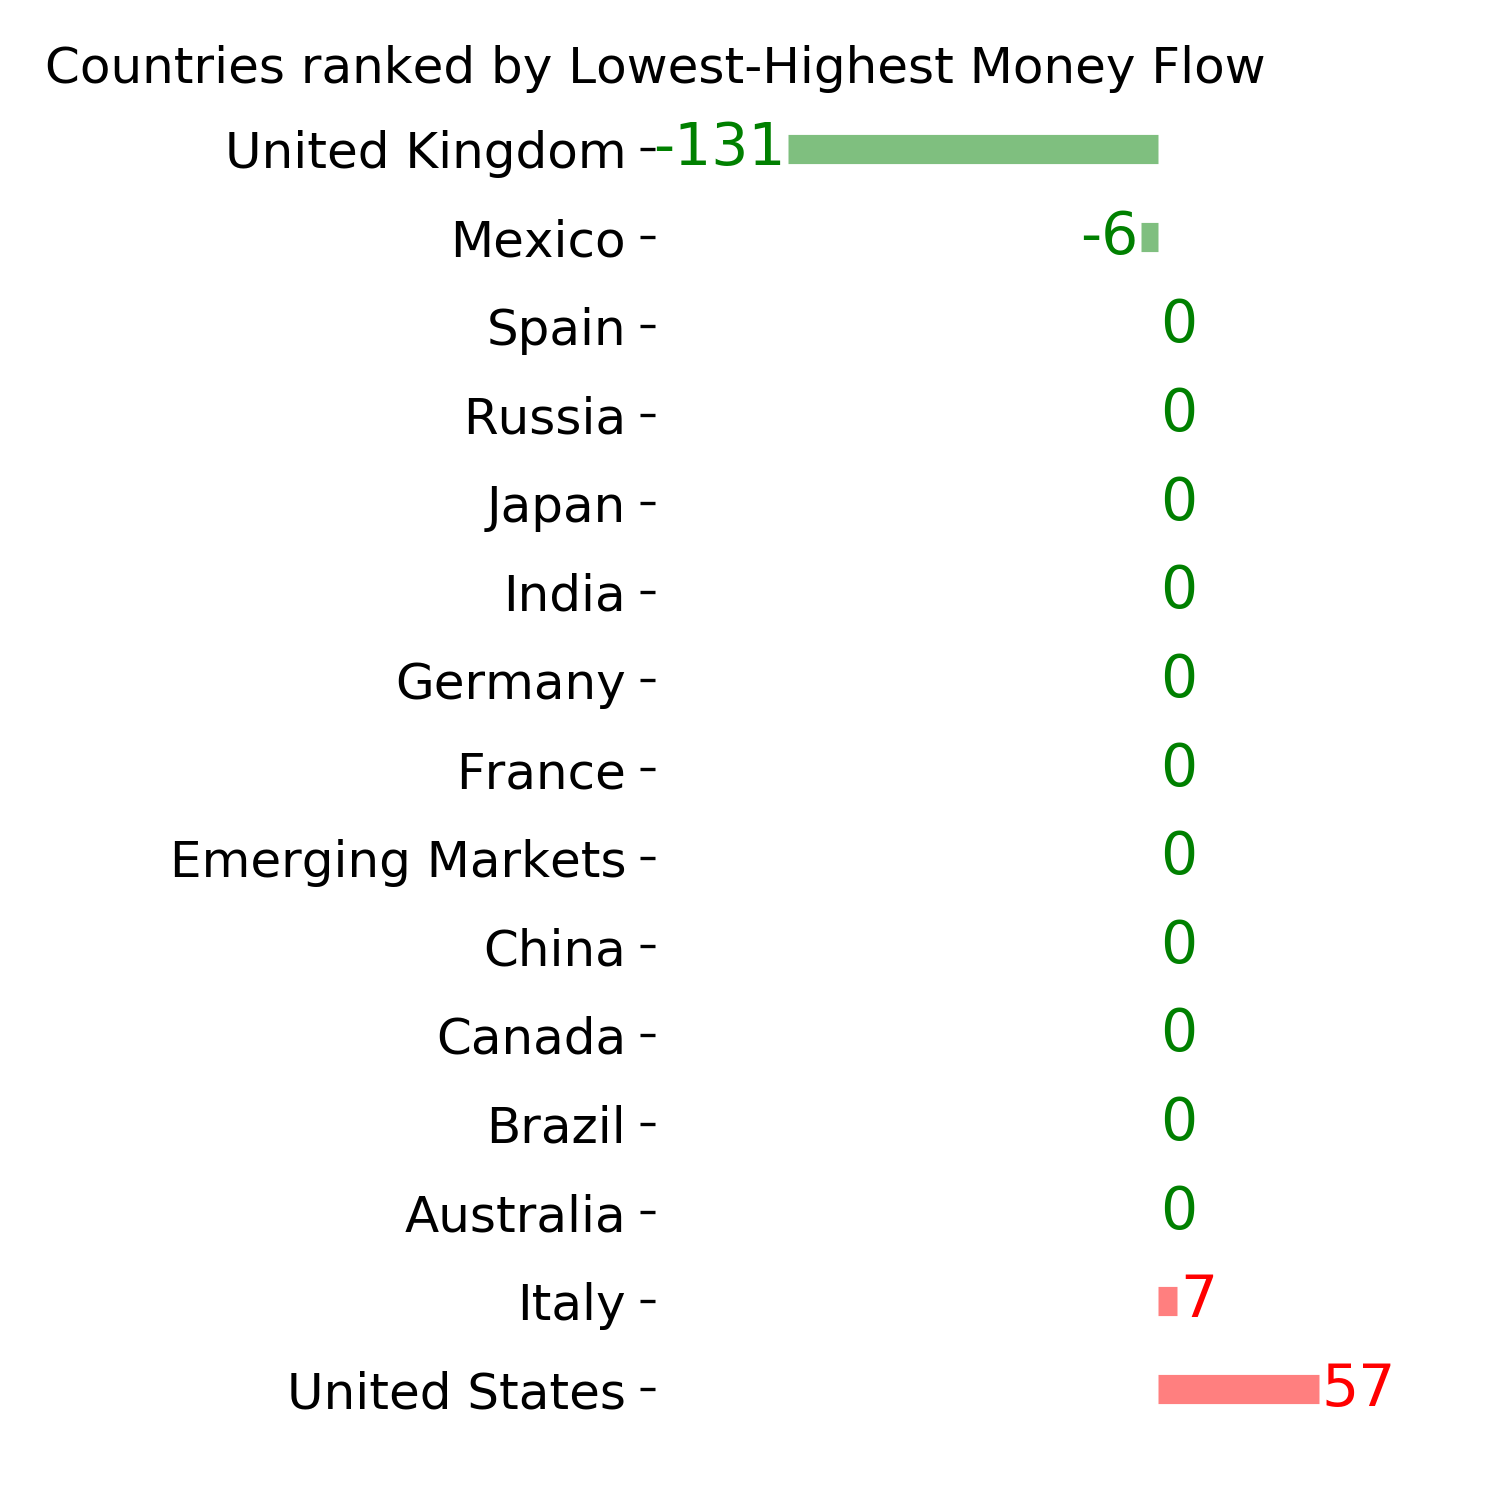
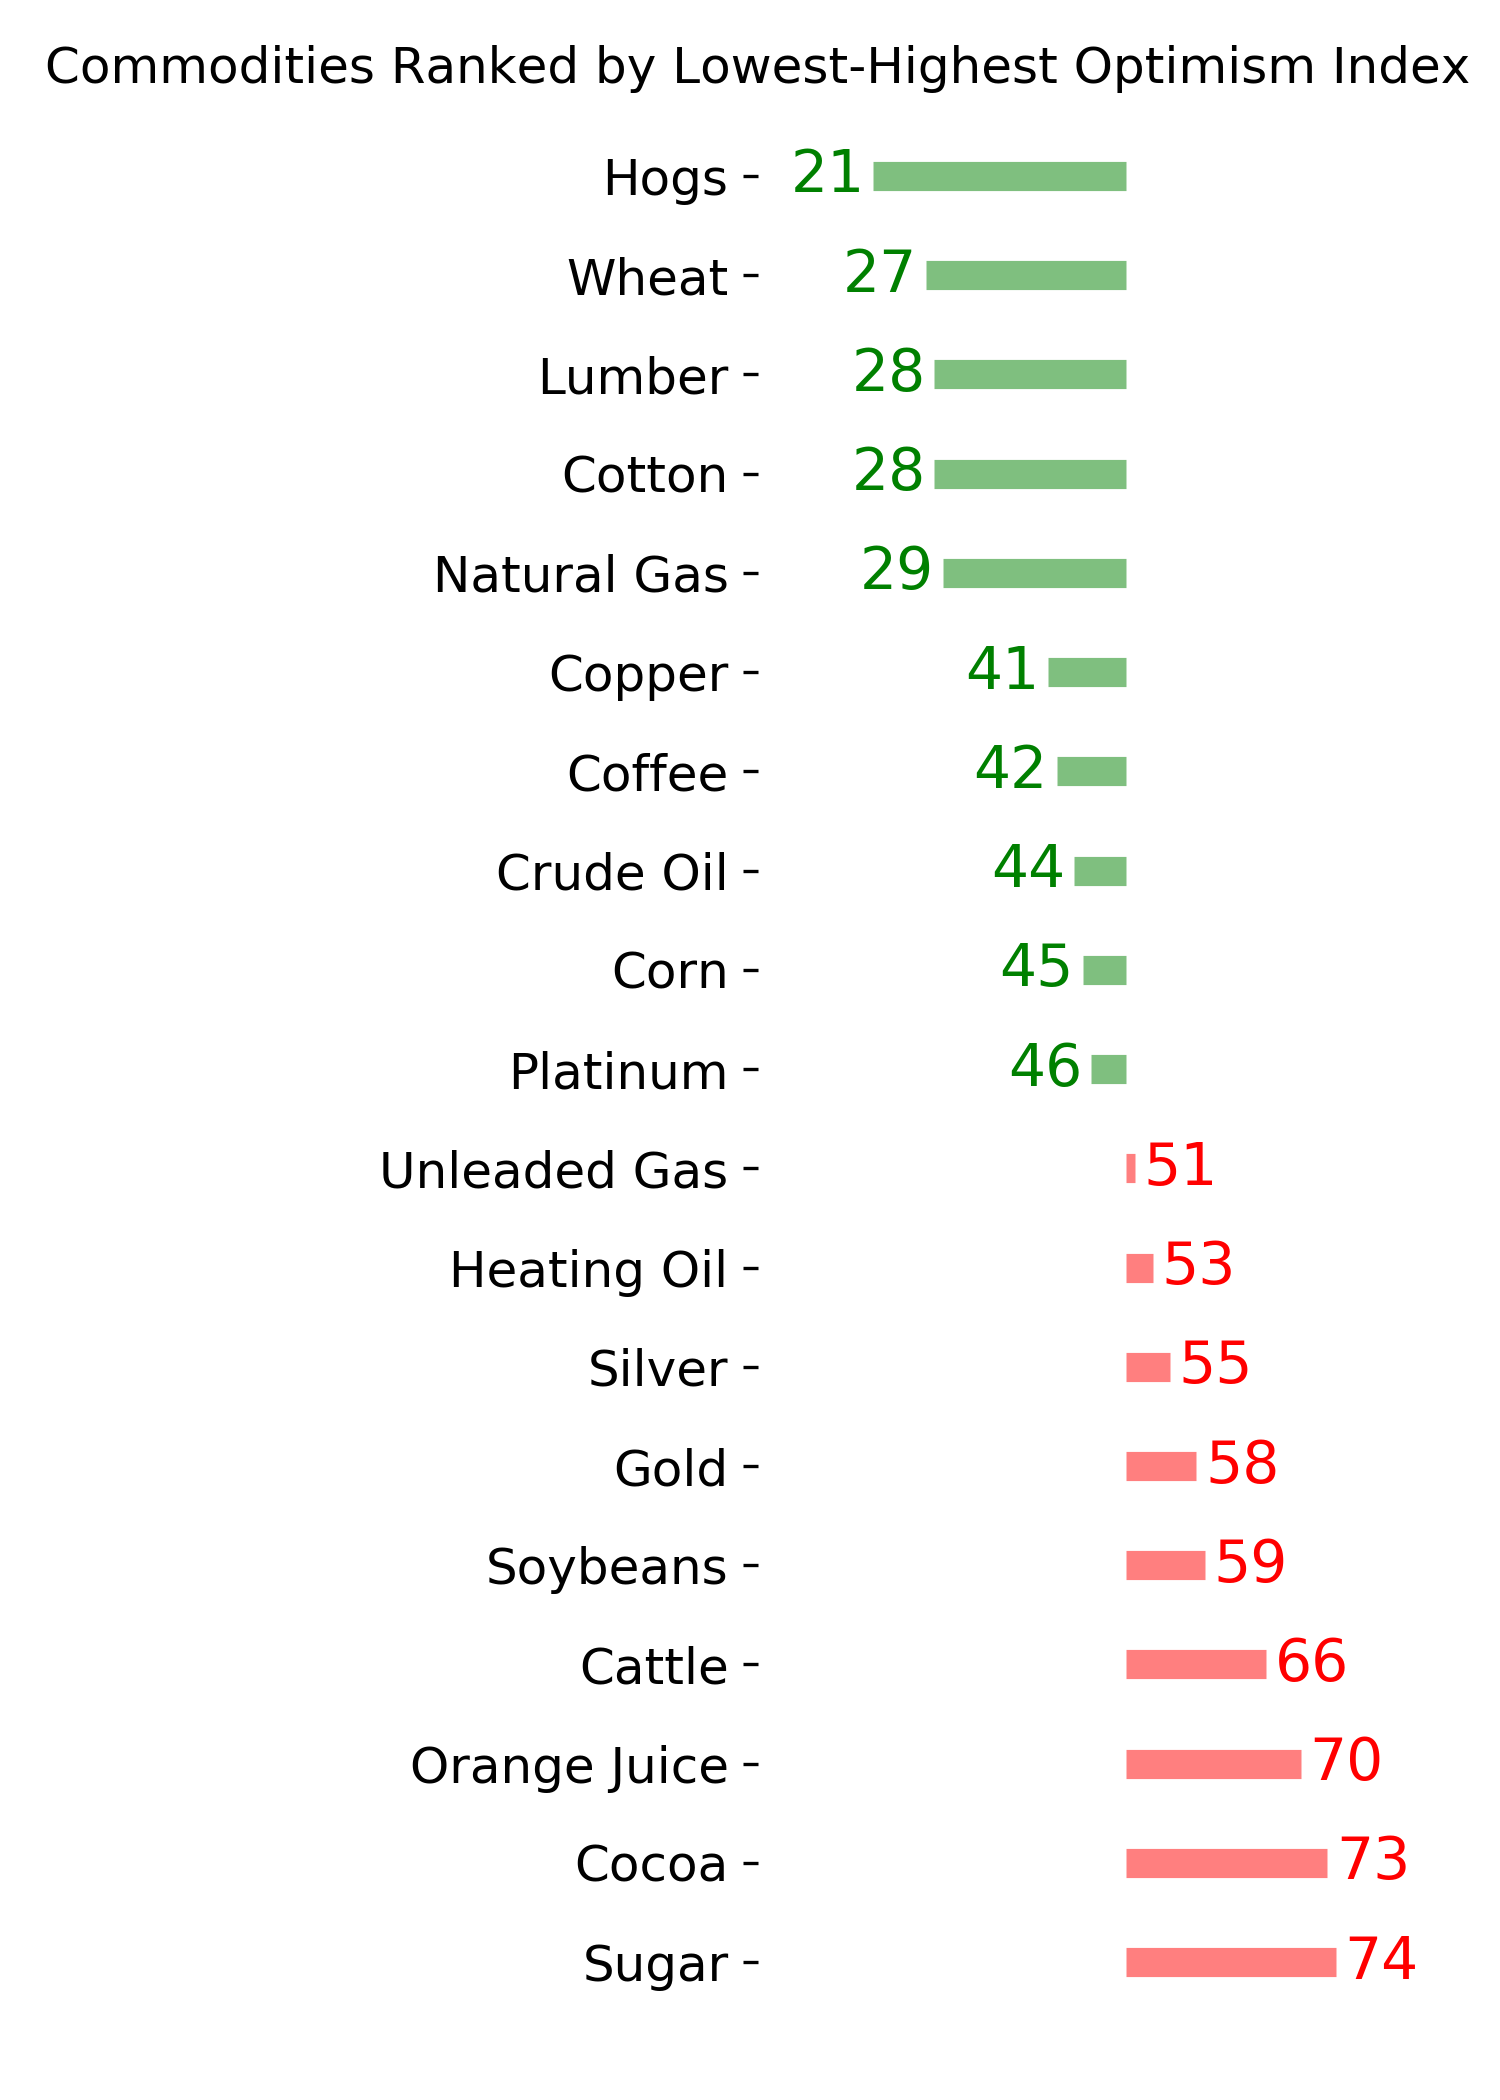
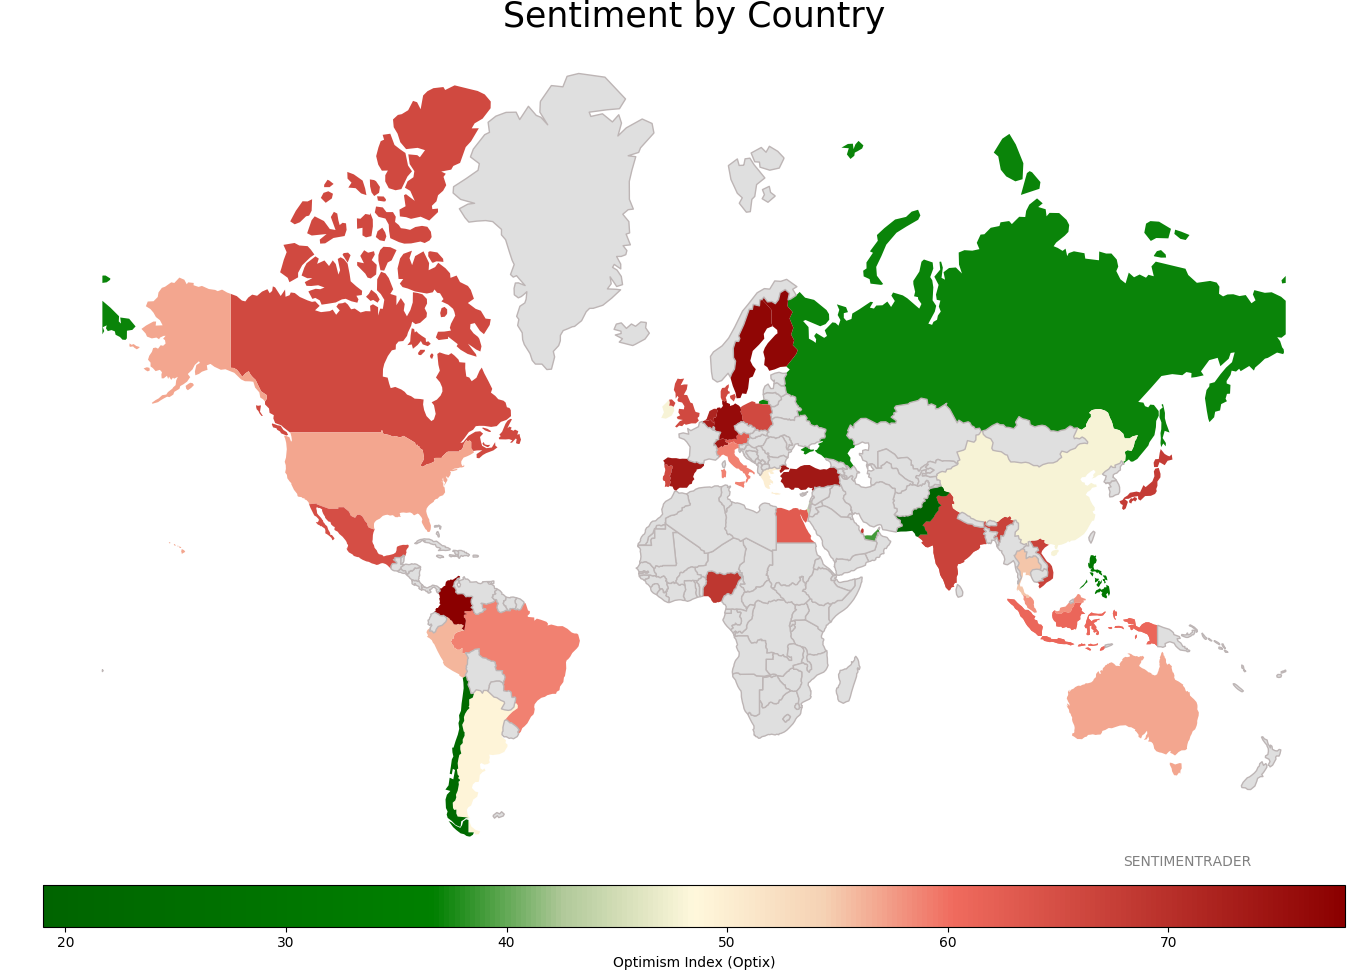
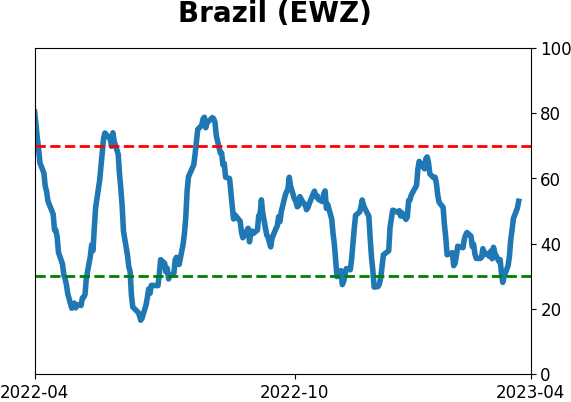
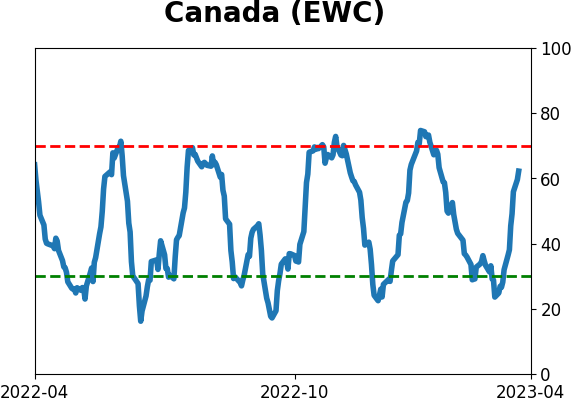
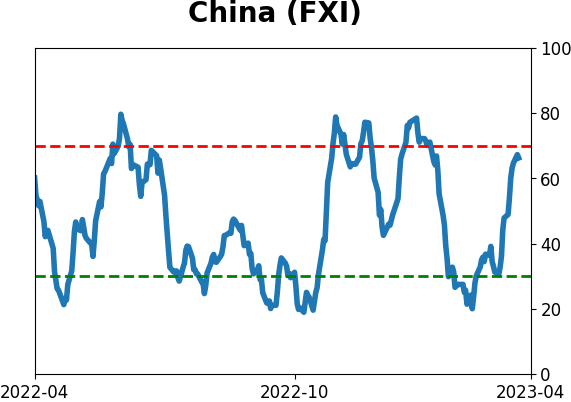
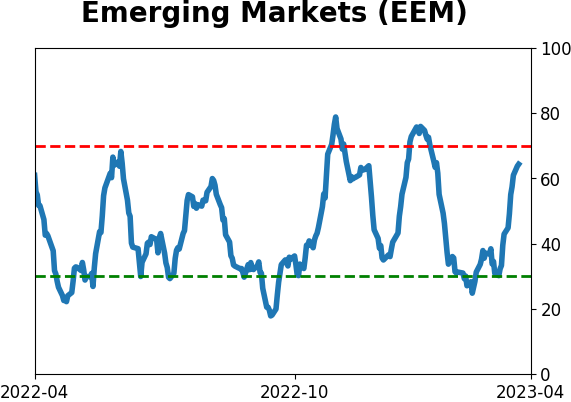
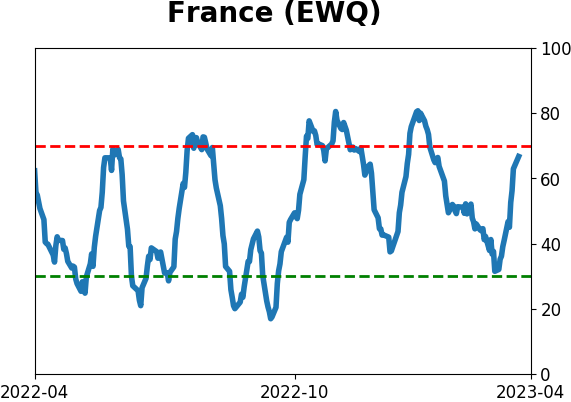
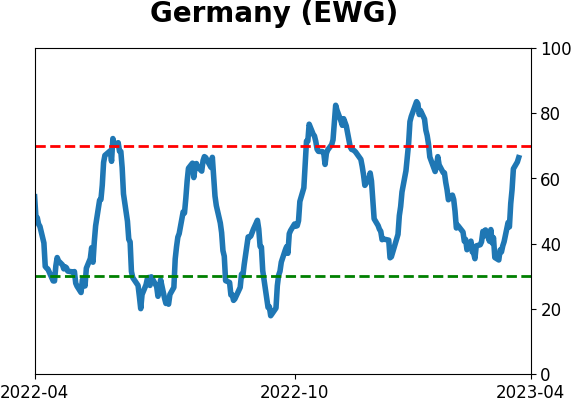
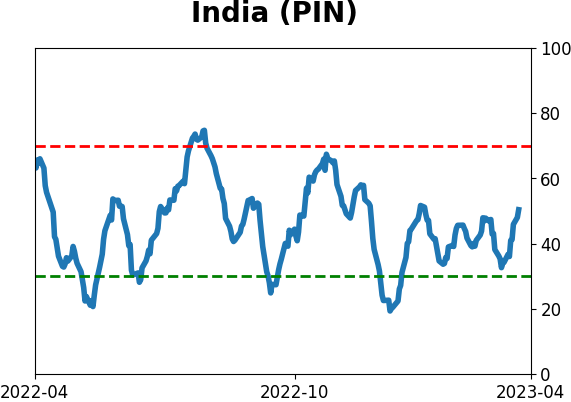
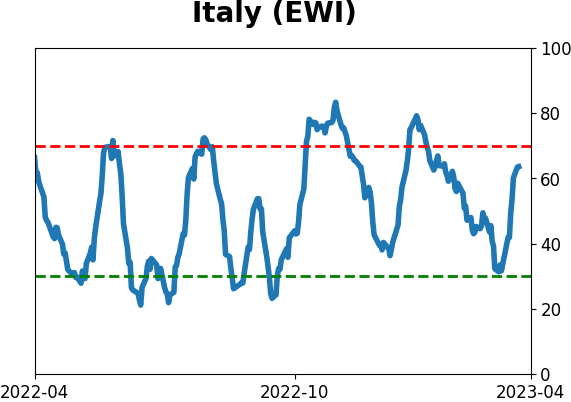
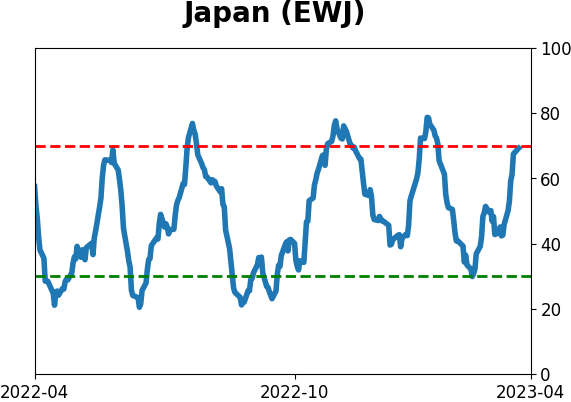
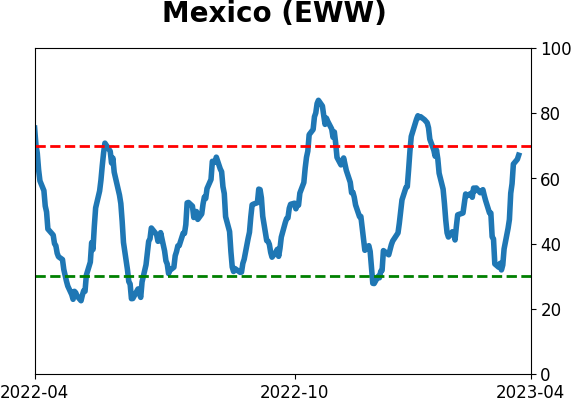
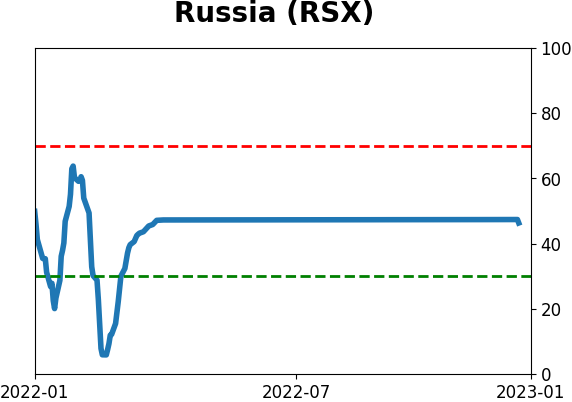
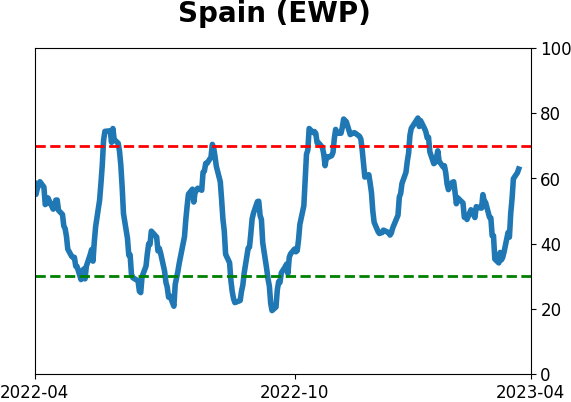
Sentiment Around The World
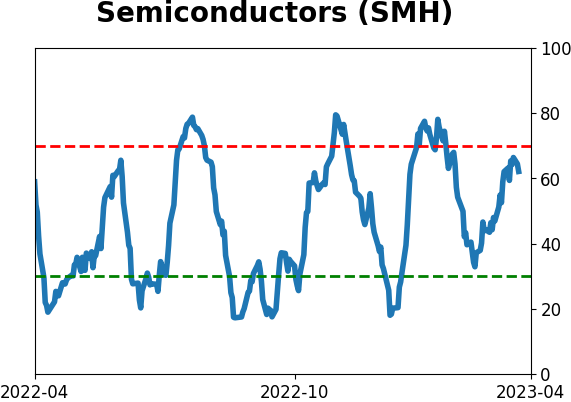
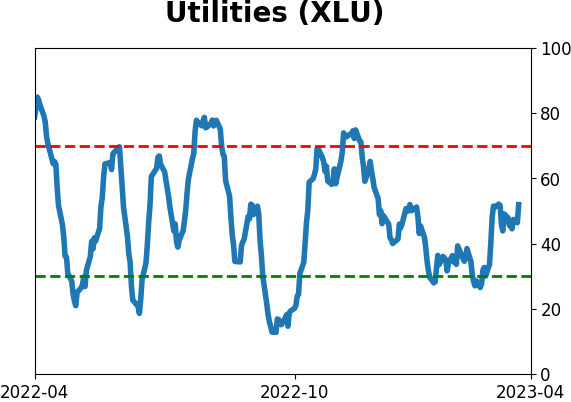
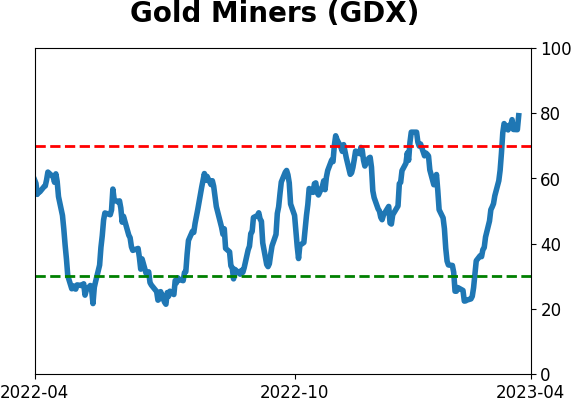
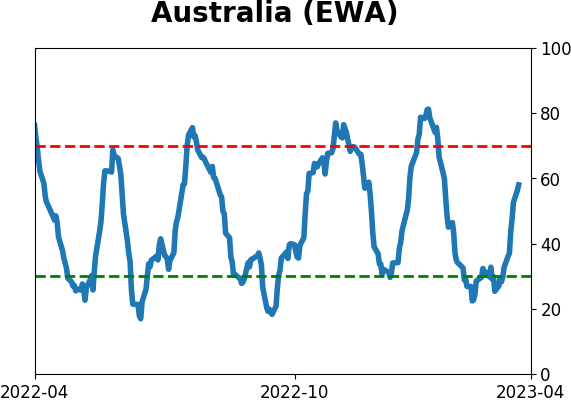
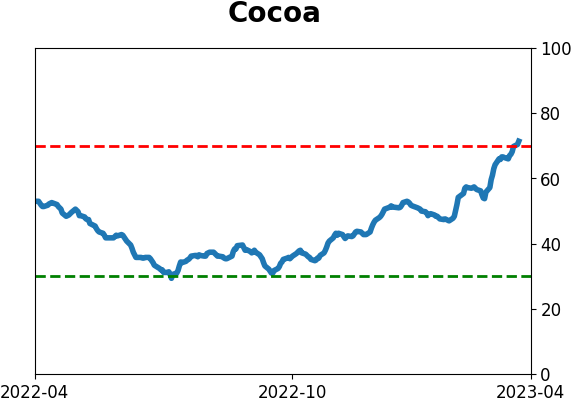
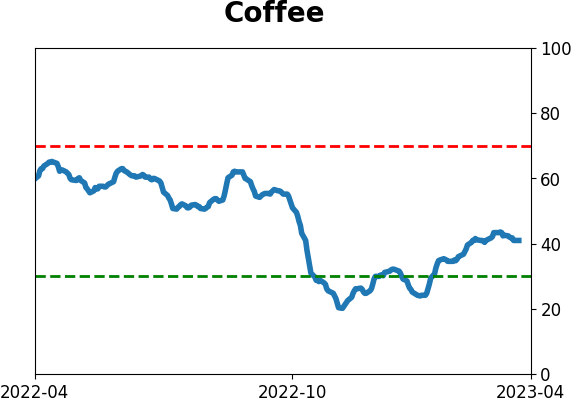
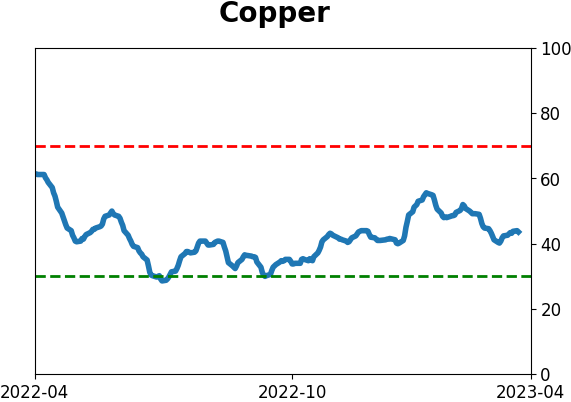
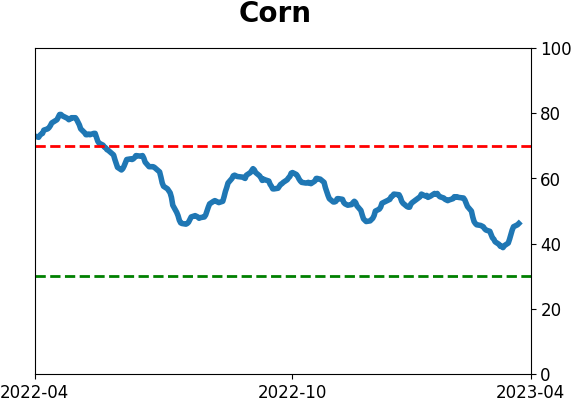
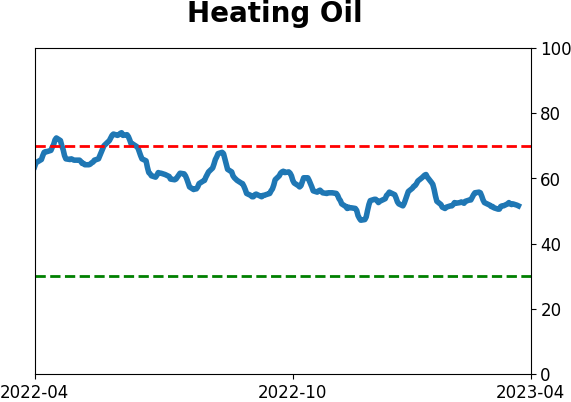
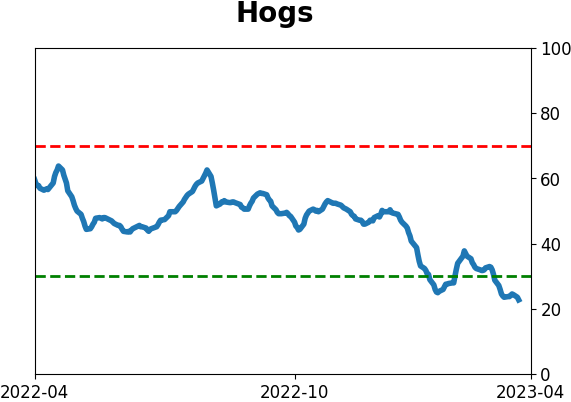
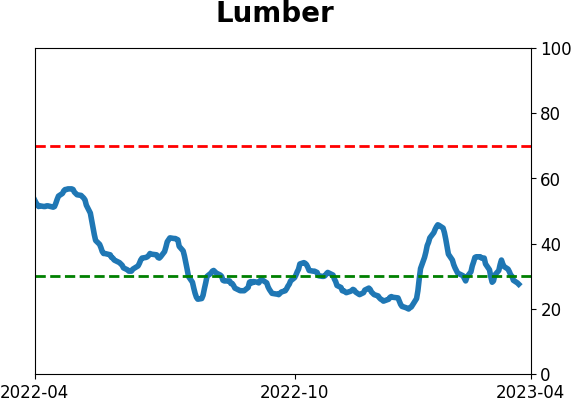
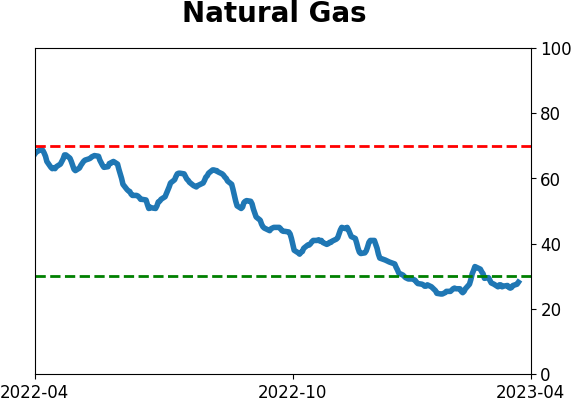
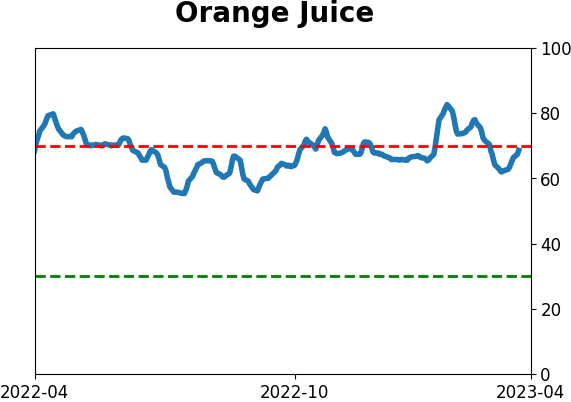
Optimism Index Thumbnails
|
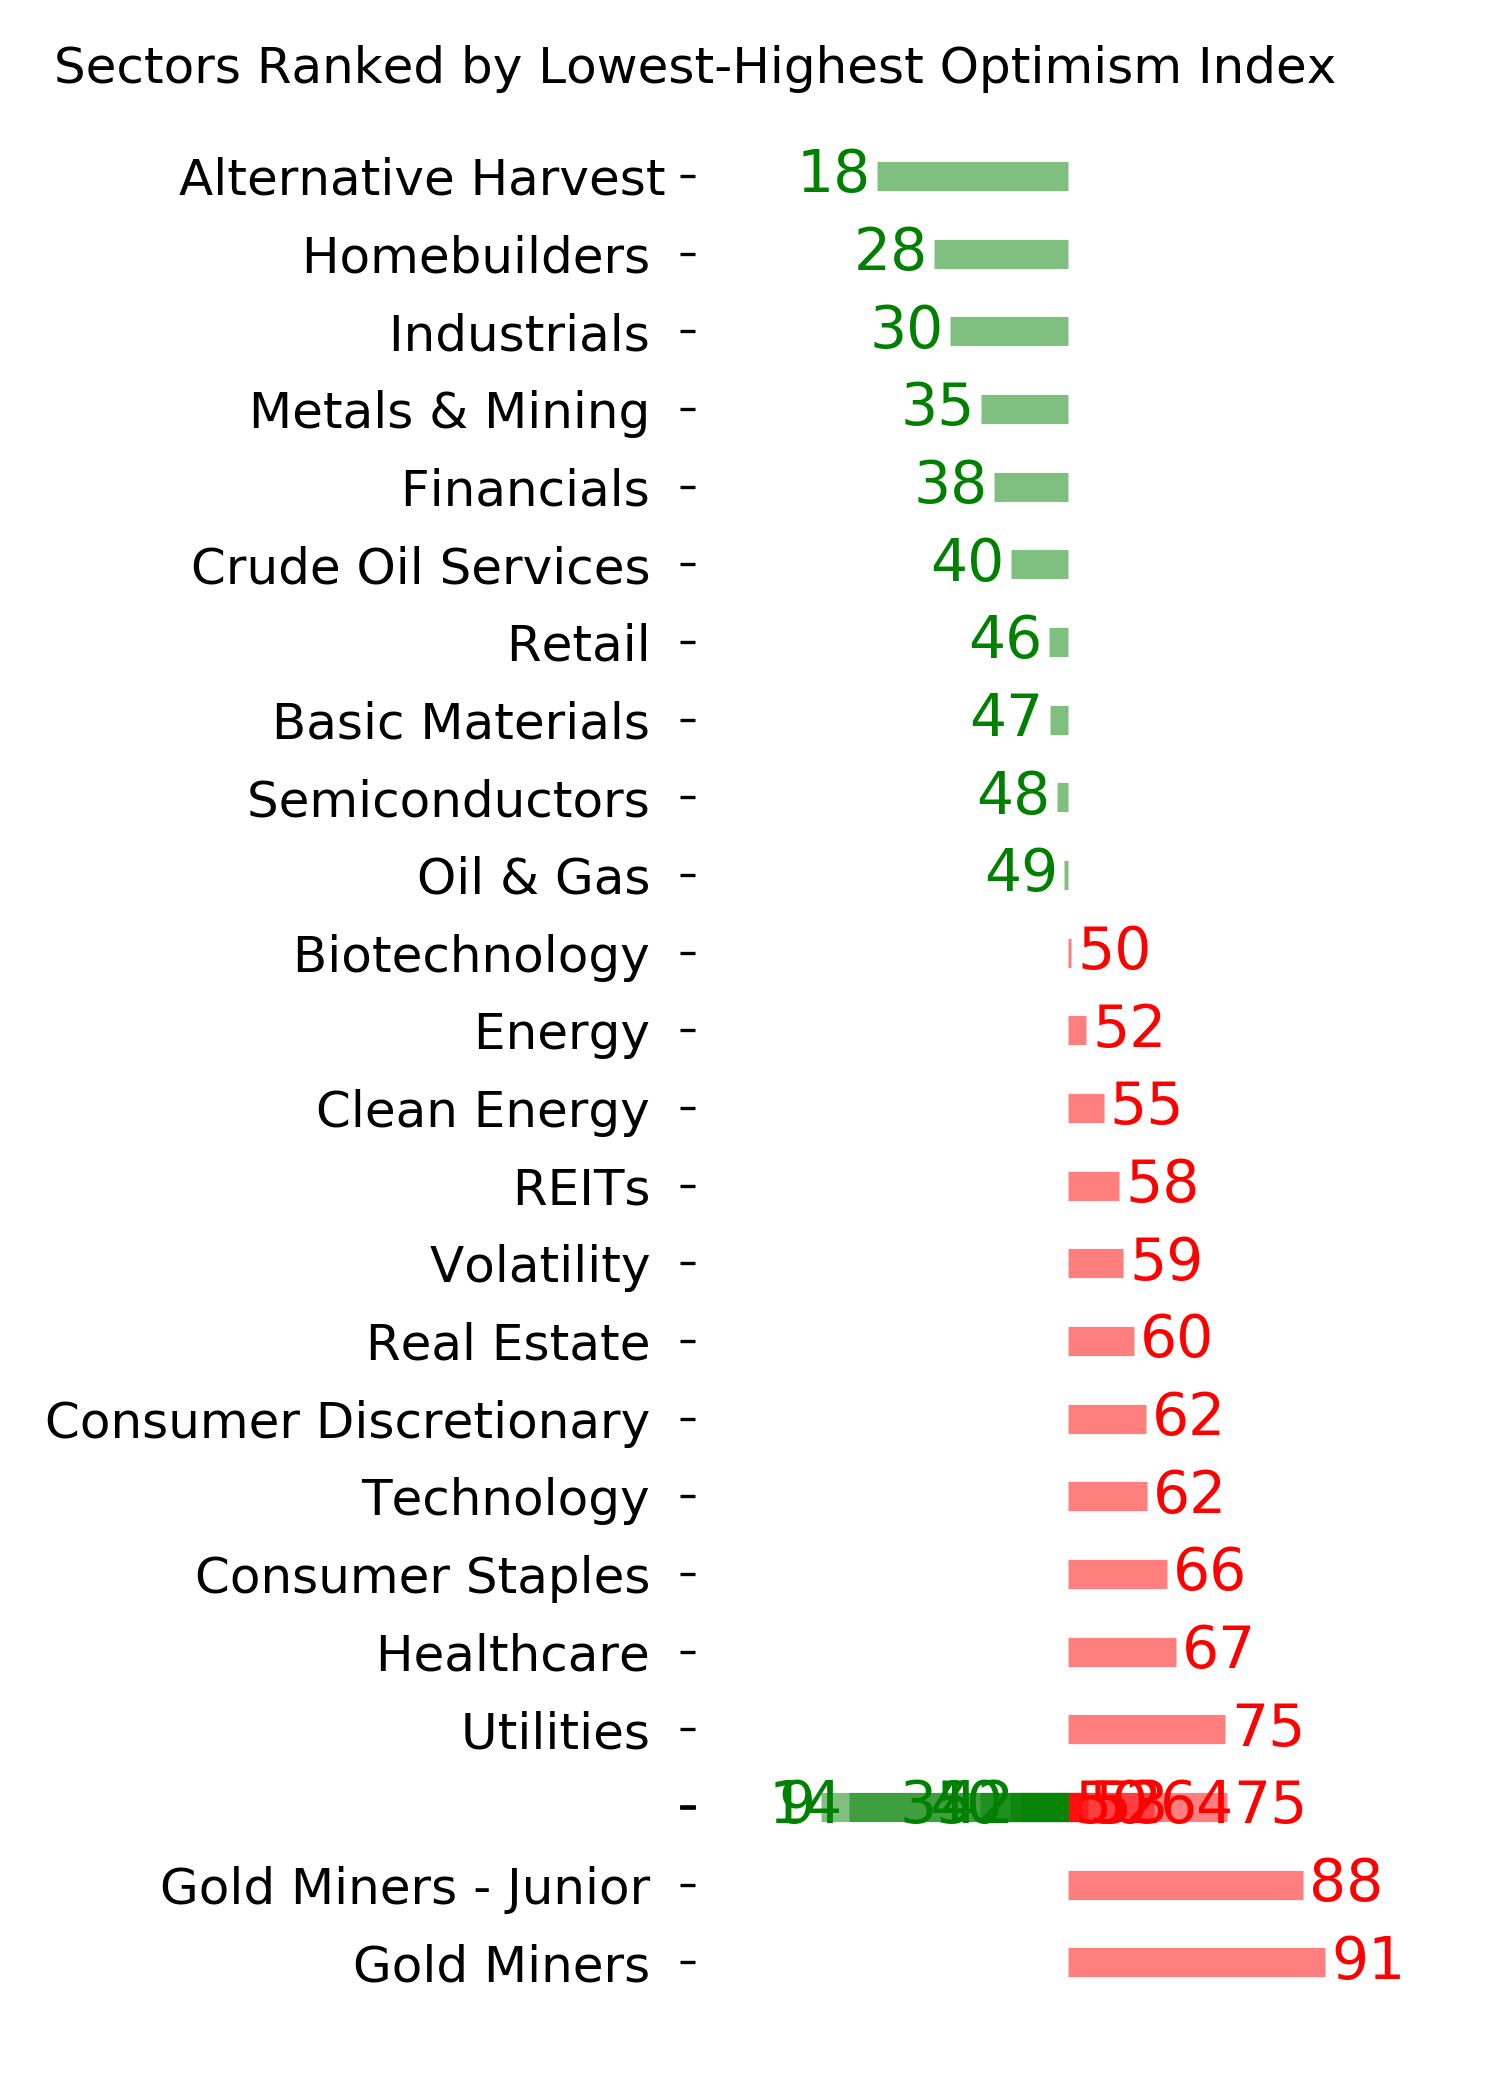
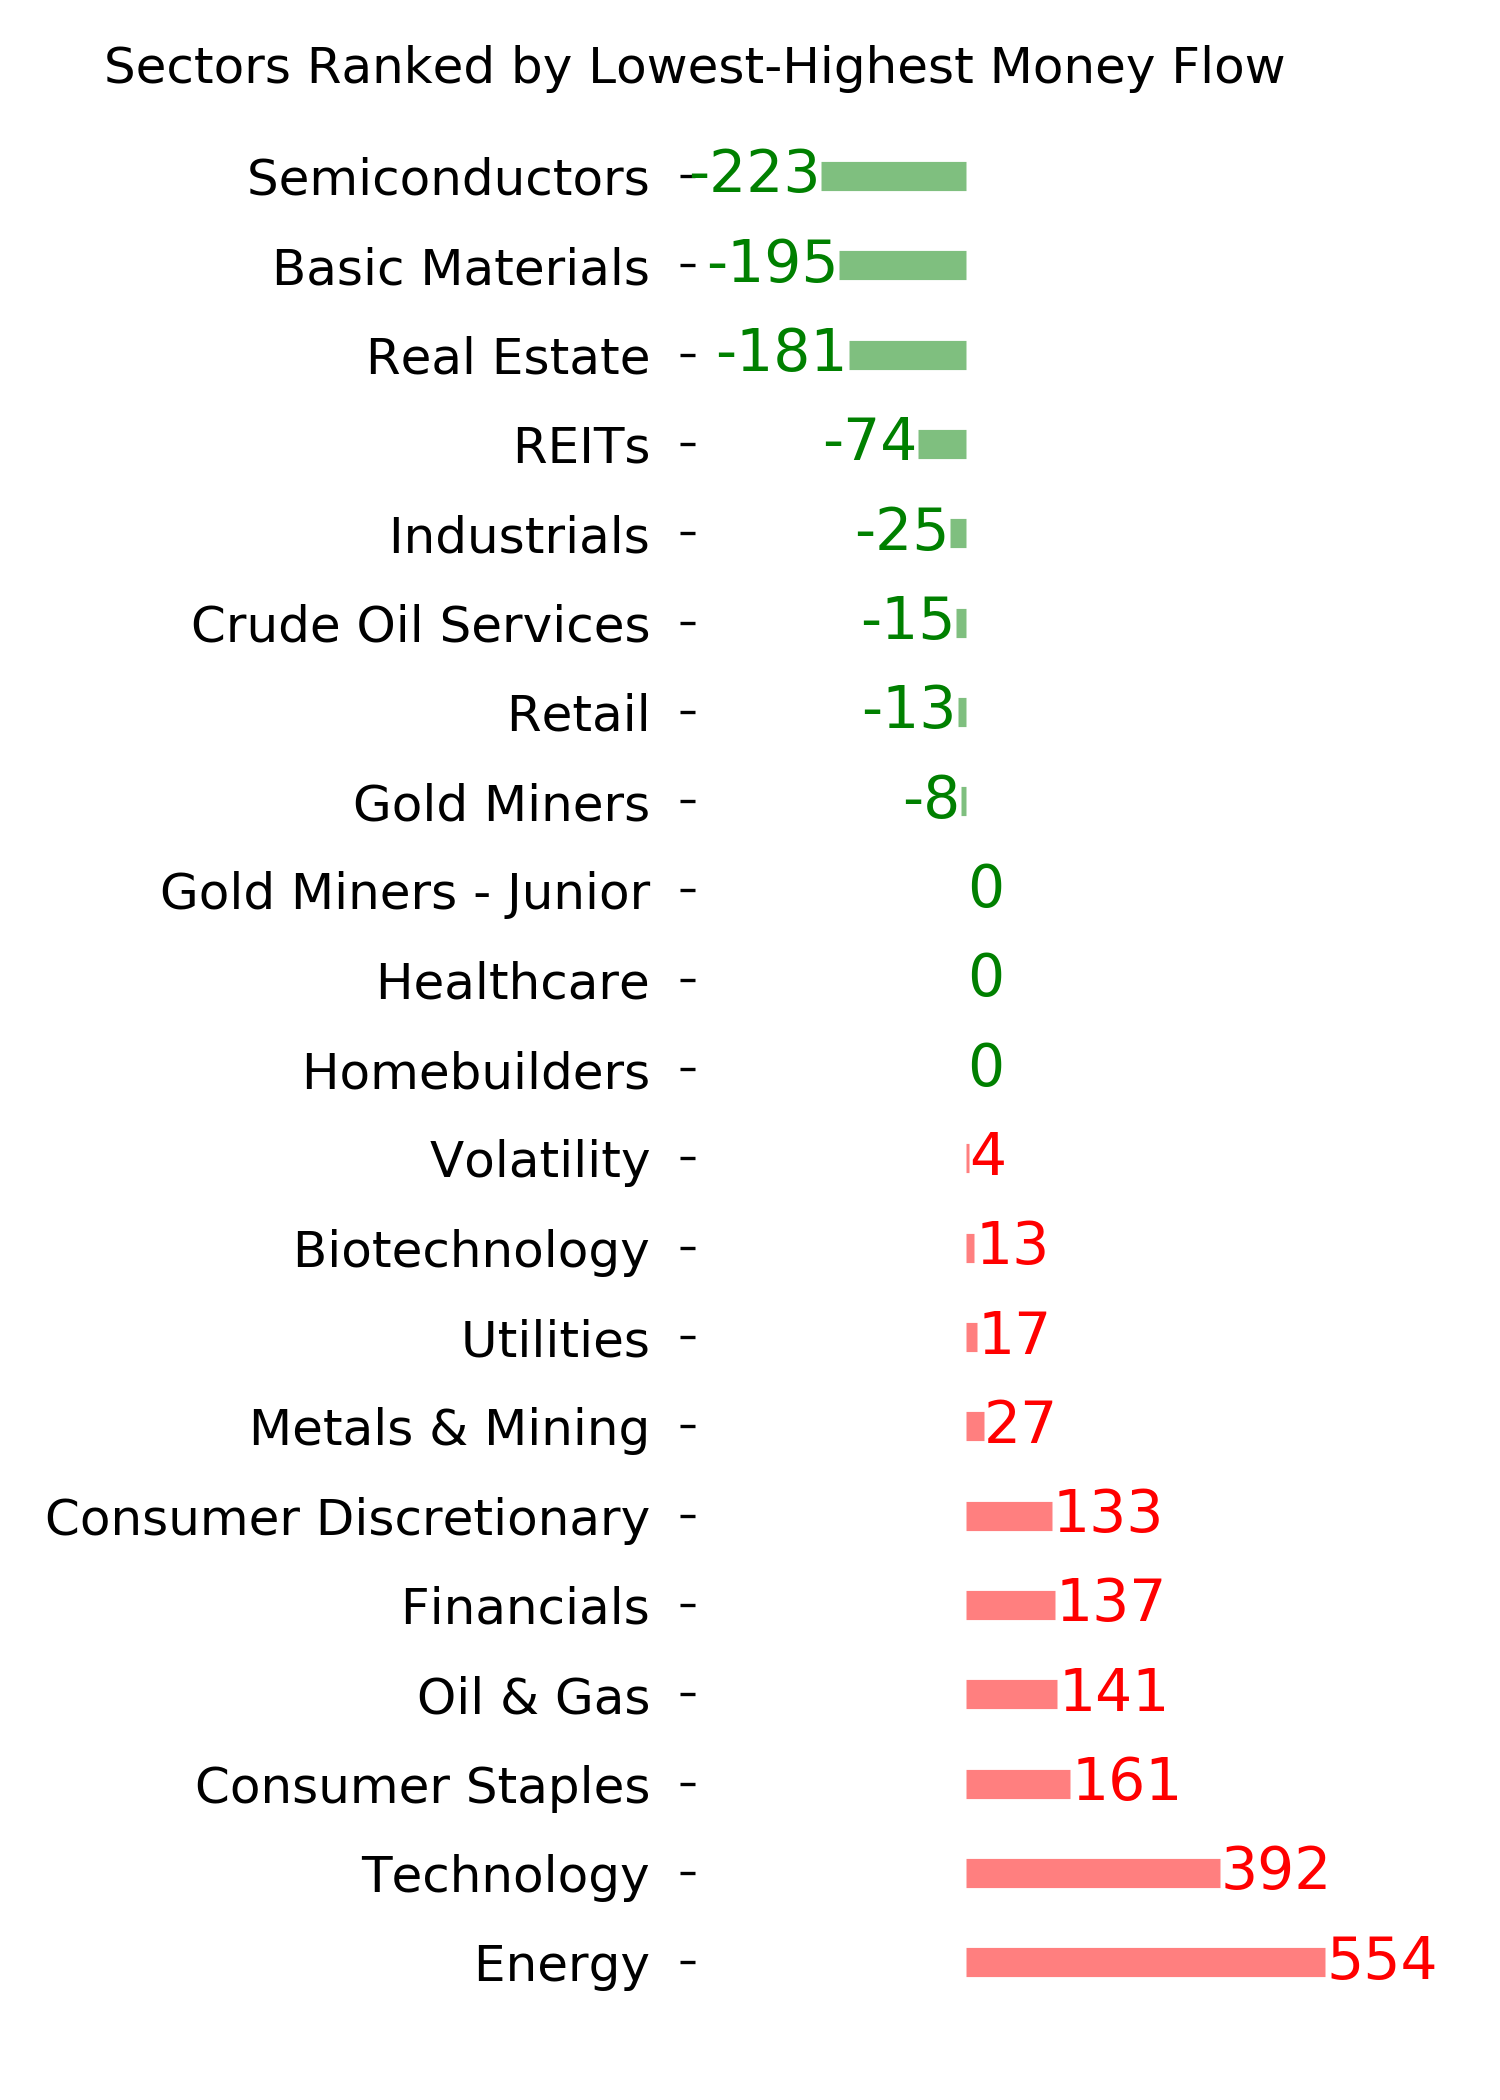
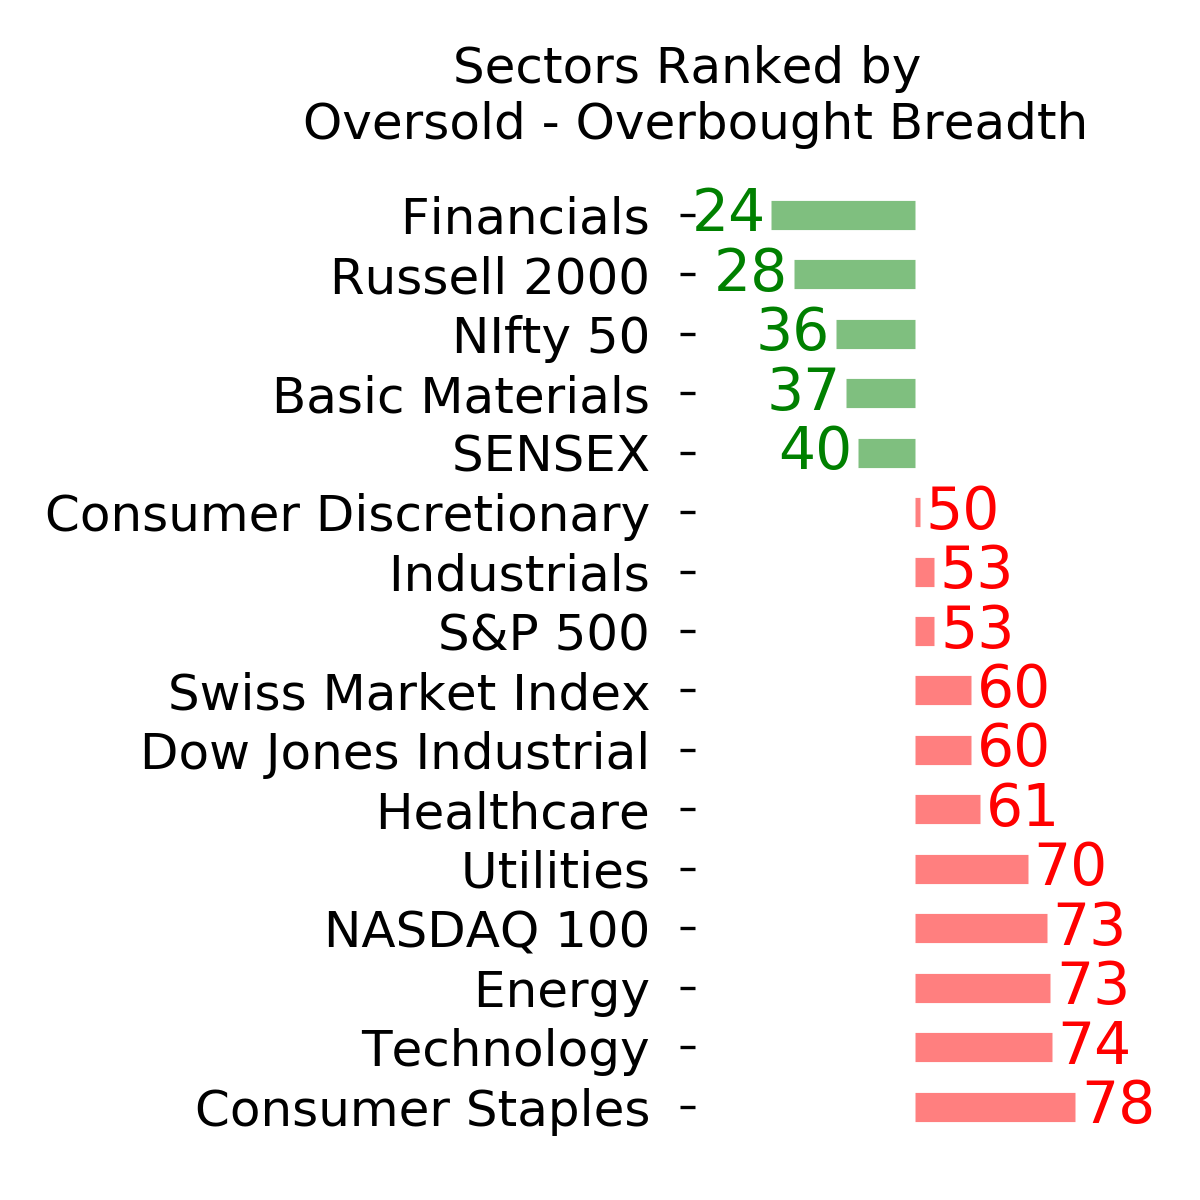
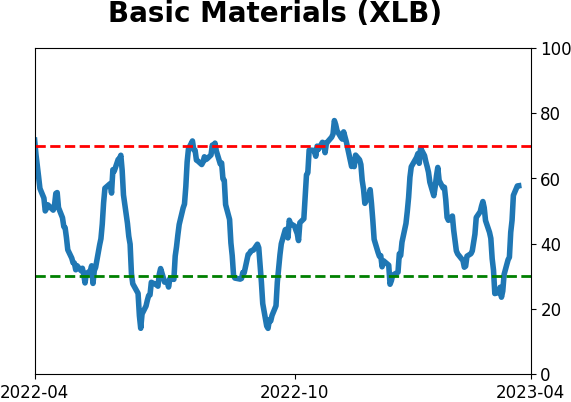
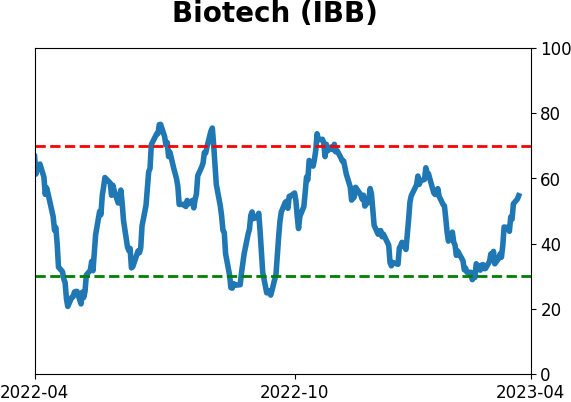
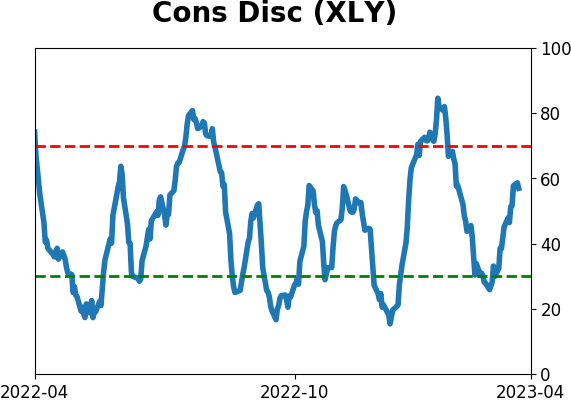
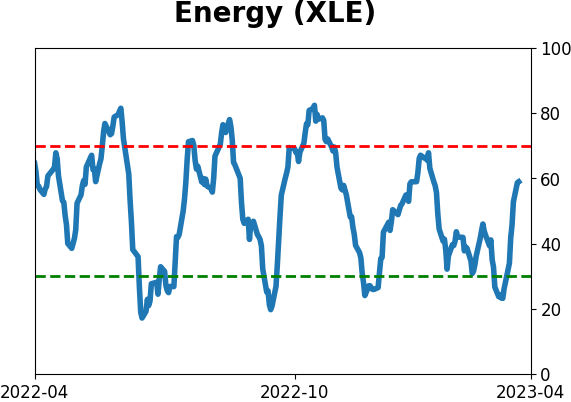
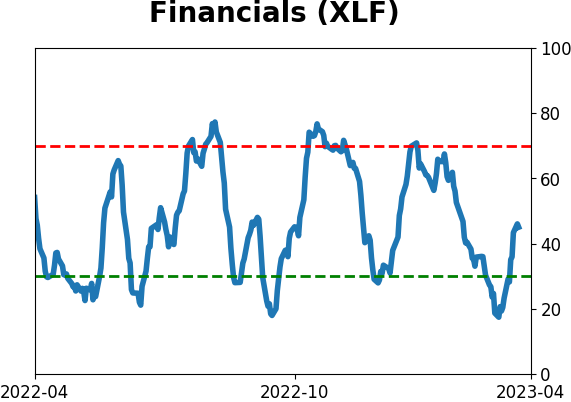
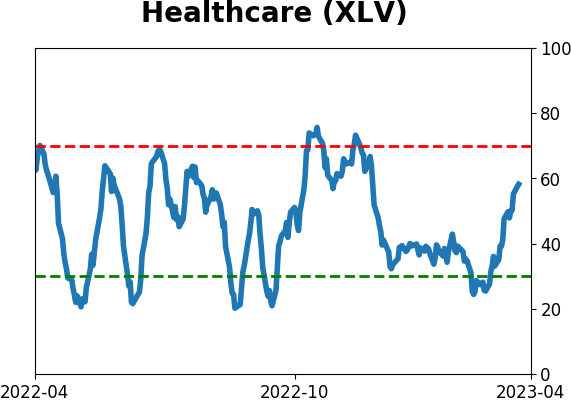
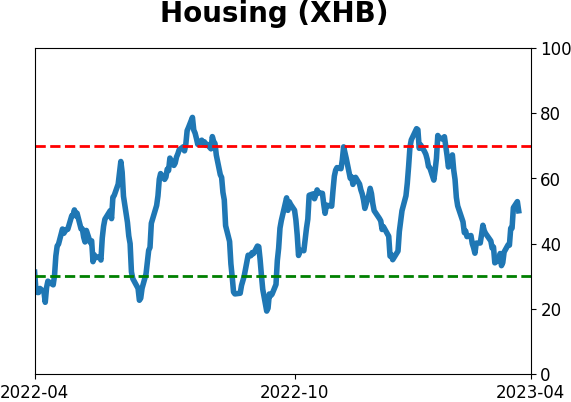
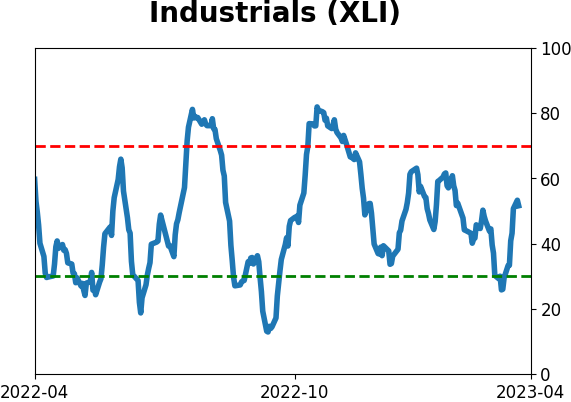
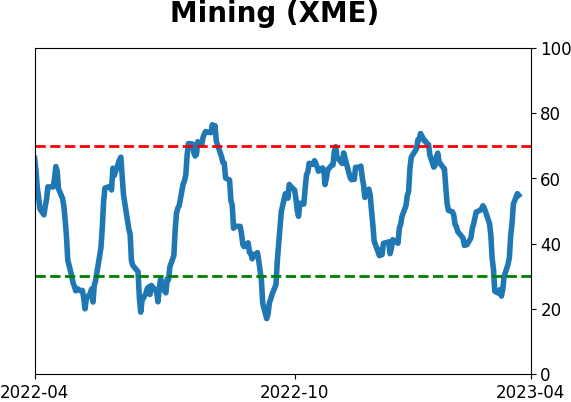
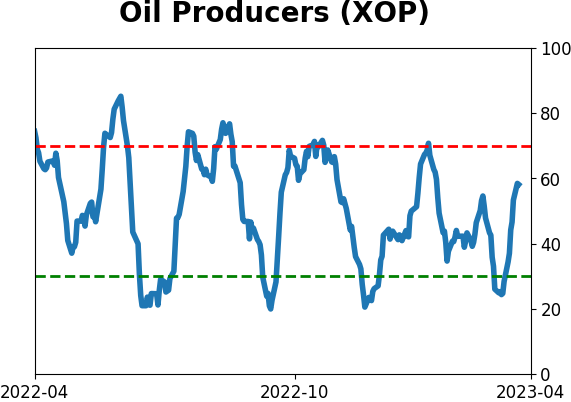
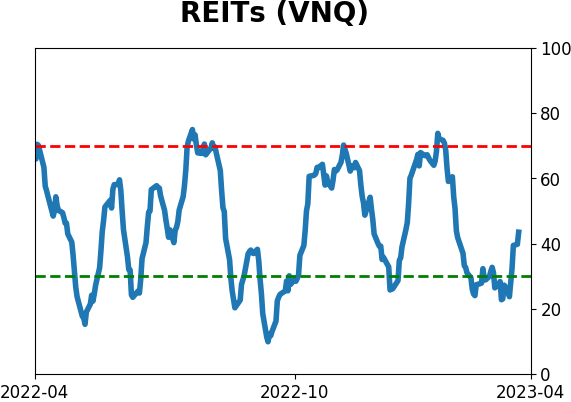
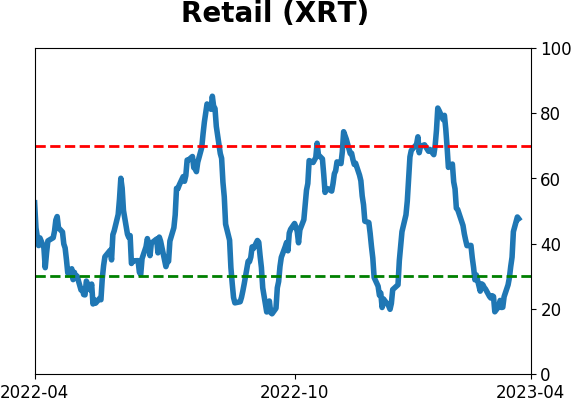
Sector ETF's - 10-Day Moving Average
|
|
|
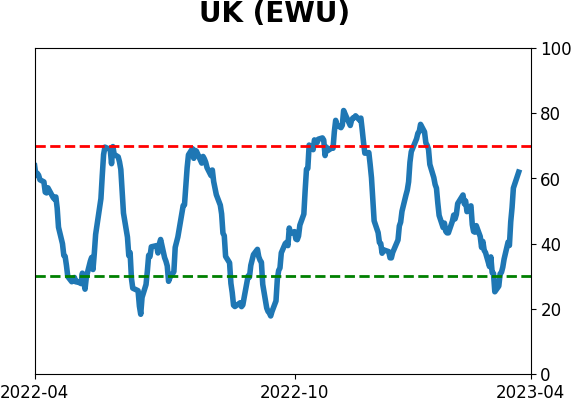
Country ETF's - 10-Day Moving Average
|
|
|
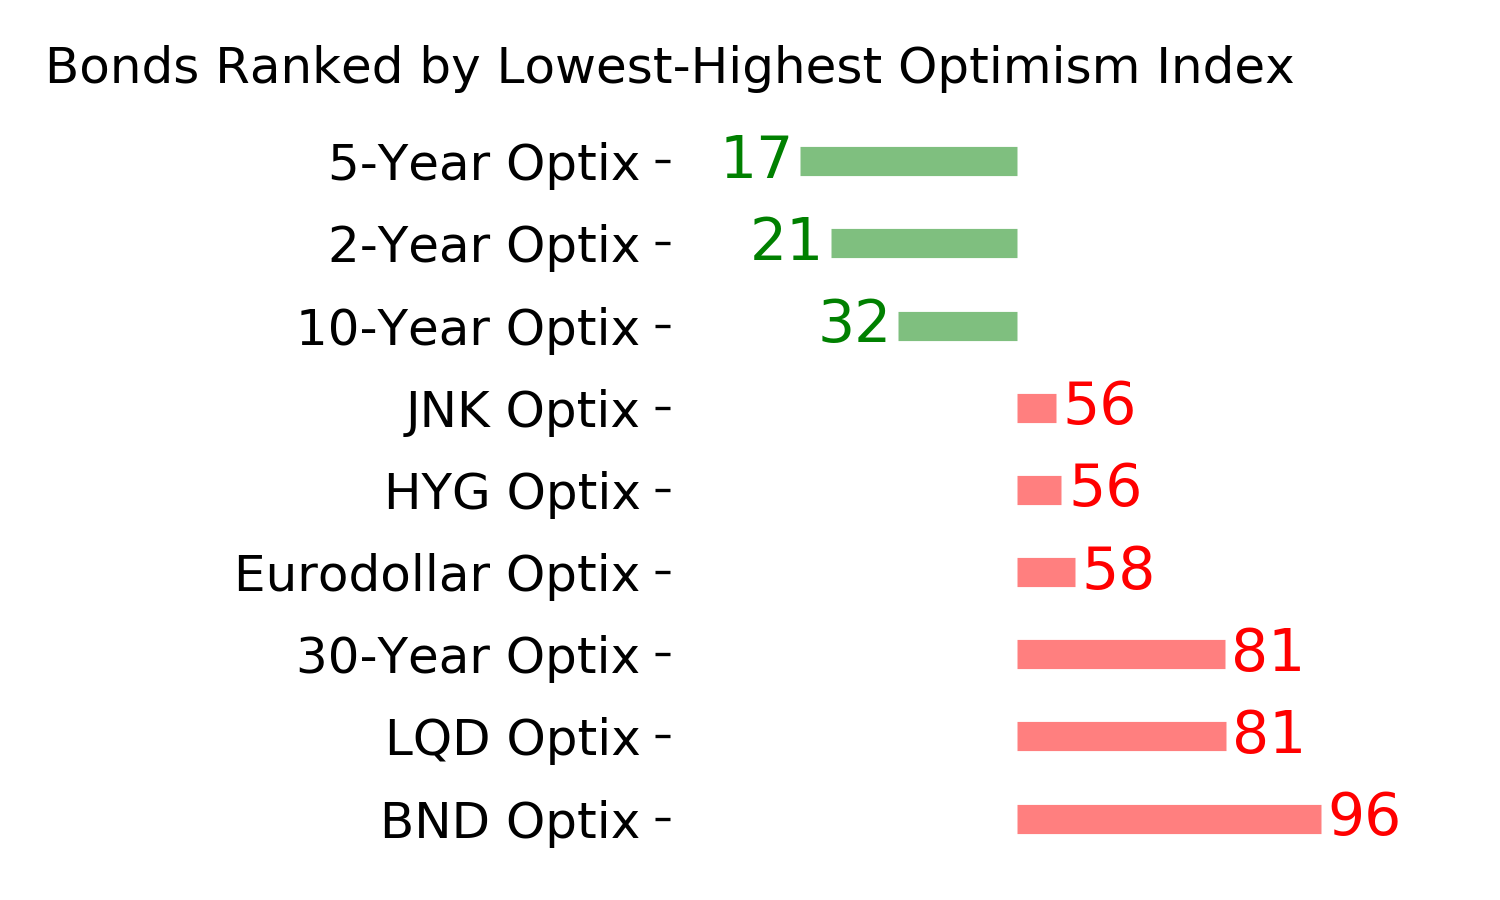
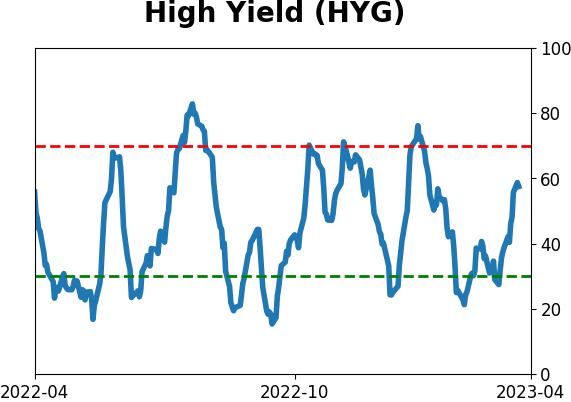
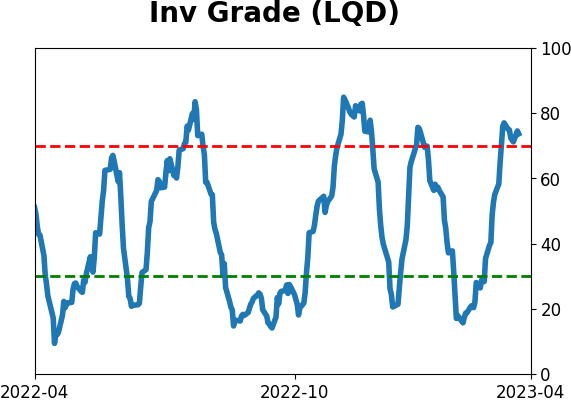
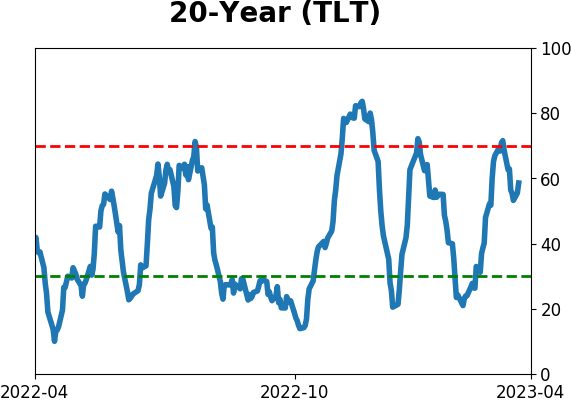
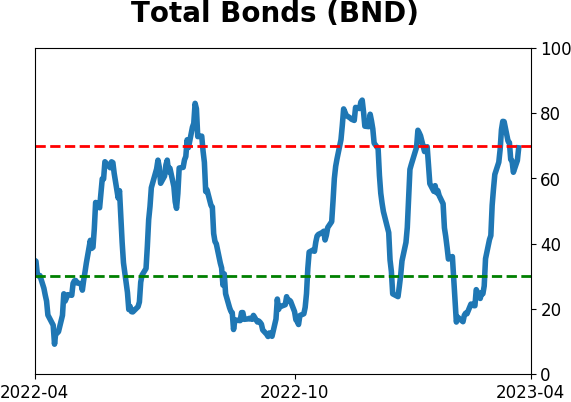
Bond ETF's - 10-Day Moving Average
|
|
|
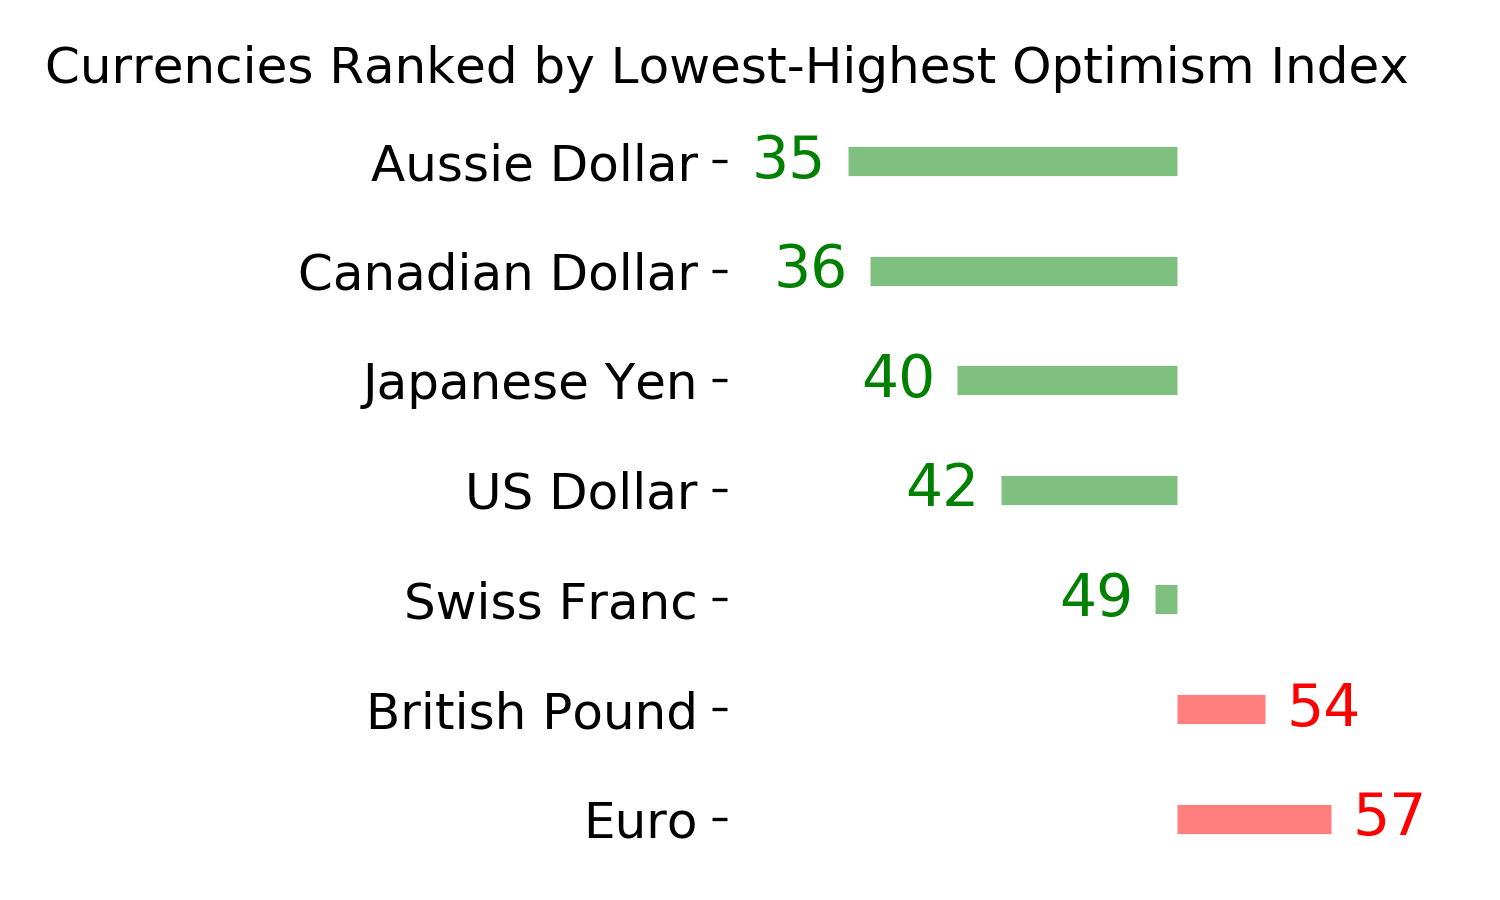
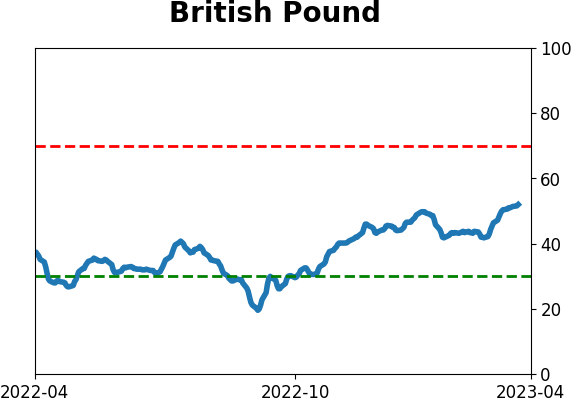
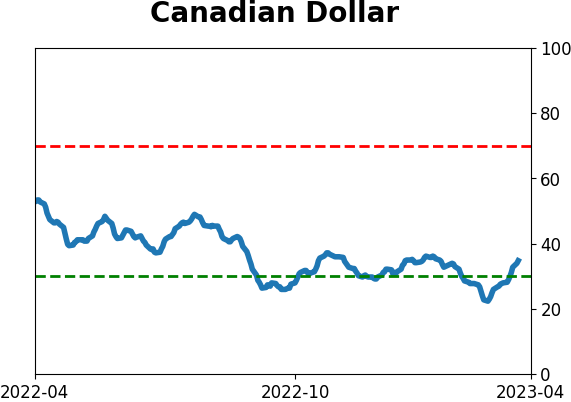
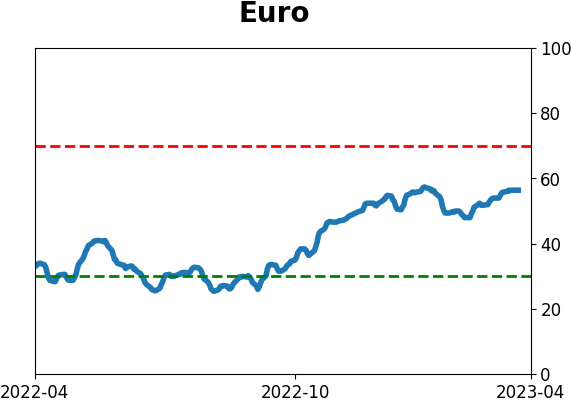
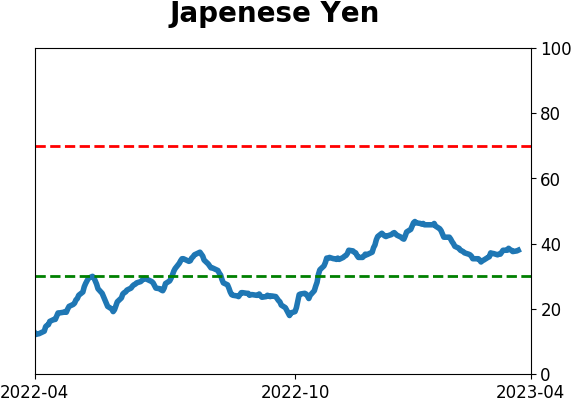
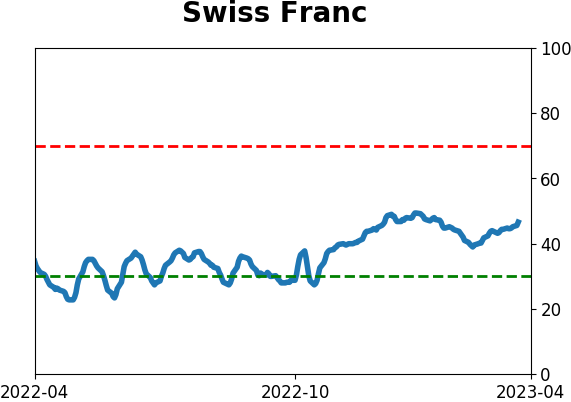
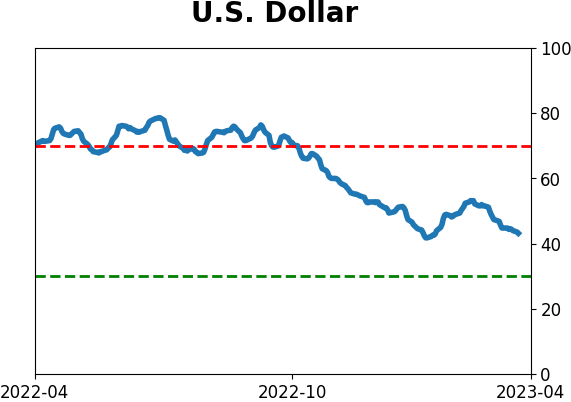
Currency ETF's - 5-Day Moving Average
|
|
|
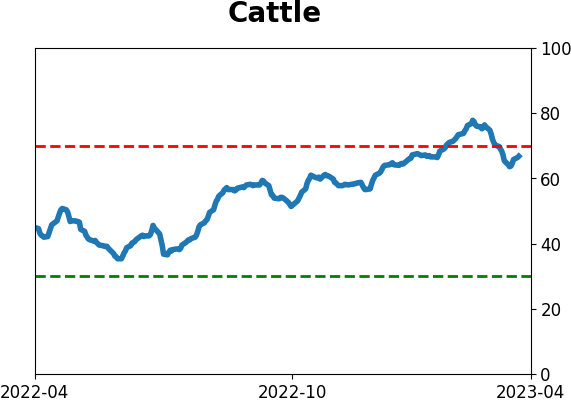
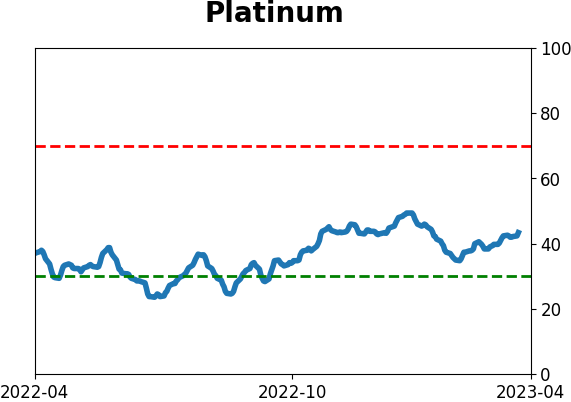
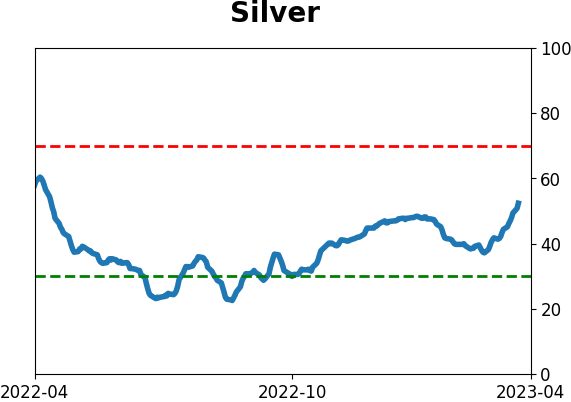
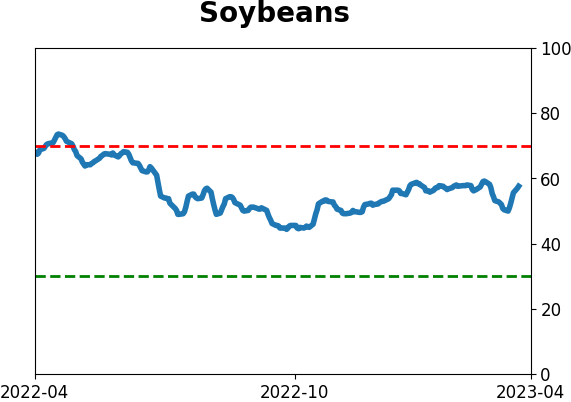
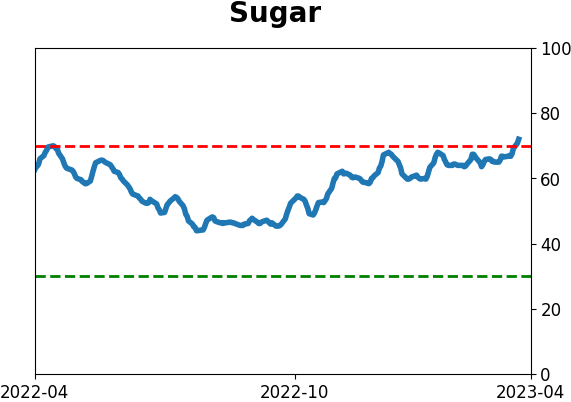
Commodity ETF's - 5-Day Moving Average
|
|