Headlines
|
|
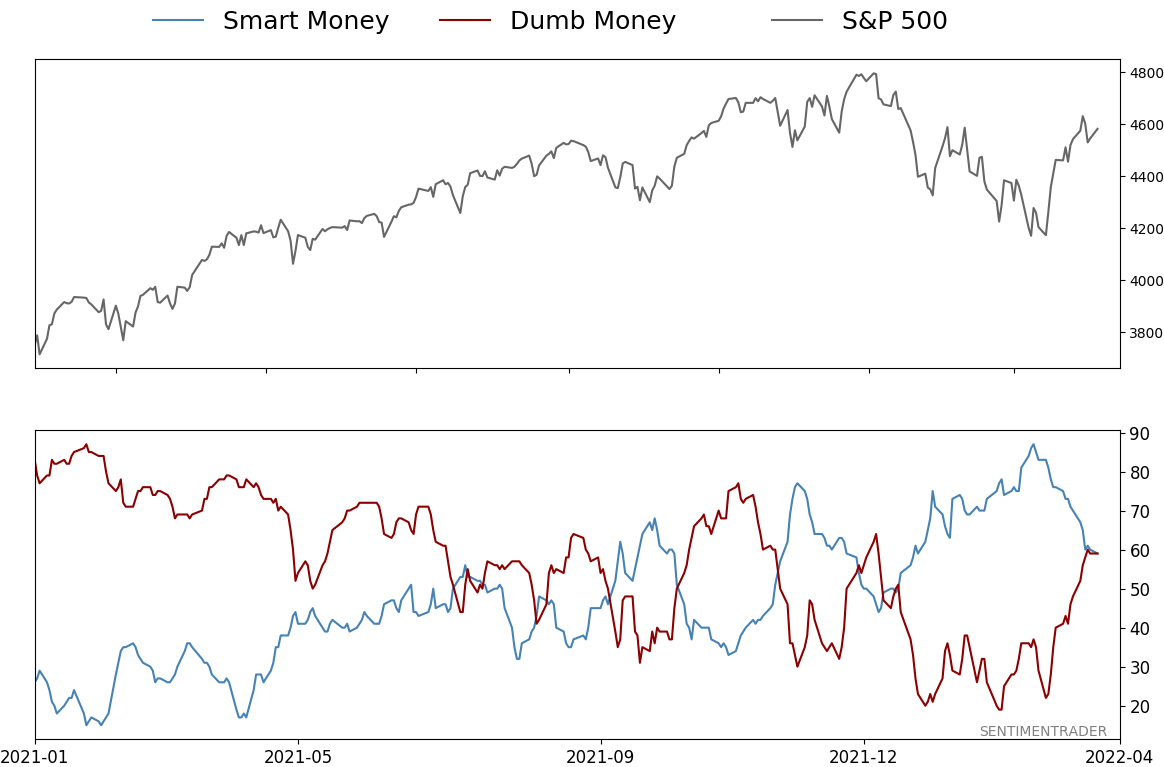
For the first time in months, Dumb Money takes control:
For the first time in more than 50 days, Dumb Money Confidence is about to exceed Smart Money Confidence. Similar recoveries in sentiment have typically led to medium-term gains, but taking a closer look at the failures gives us warning signs to watch.
|
Smart / Dumb Money Confidence
|
Smart Money Confidence: 59%
Dumb Money Confidence: 59%
|
|
Risk Levels
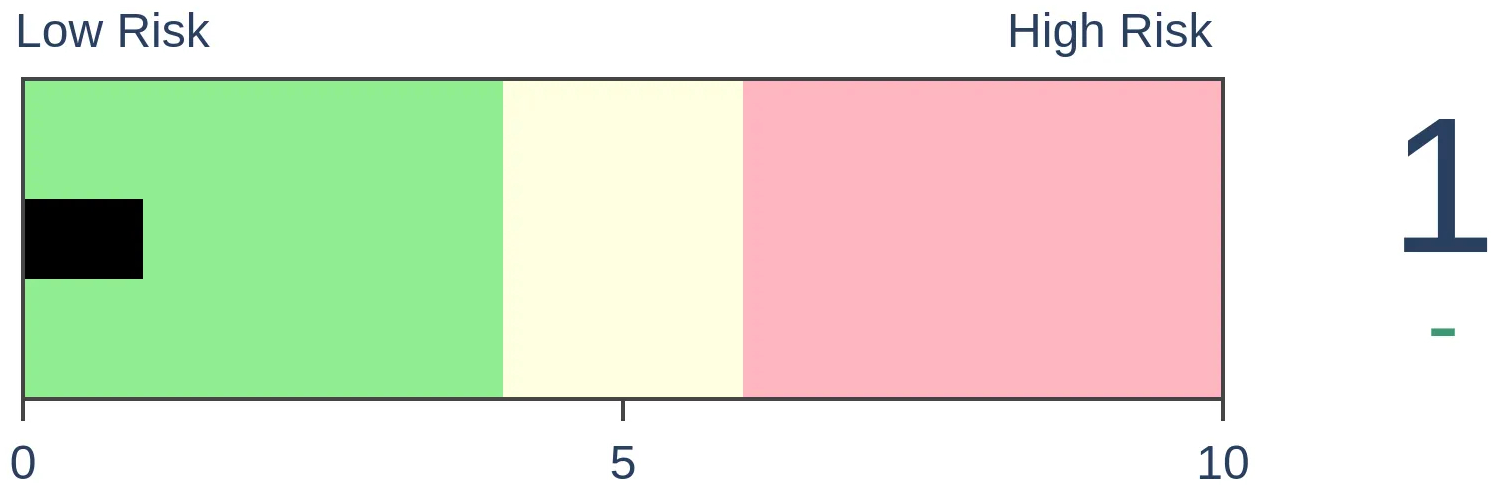
Stocks Short-Term
|
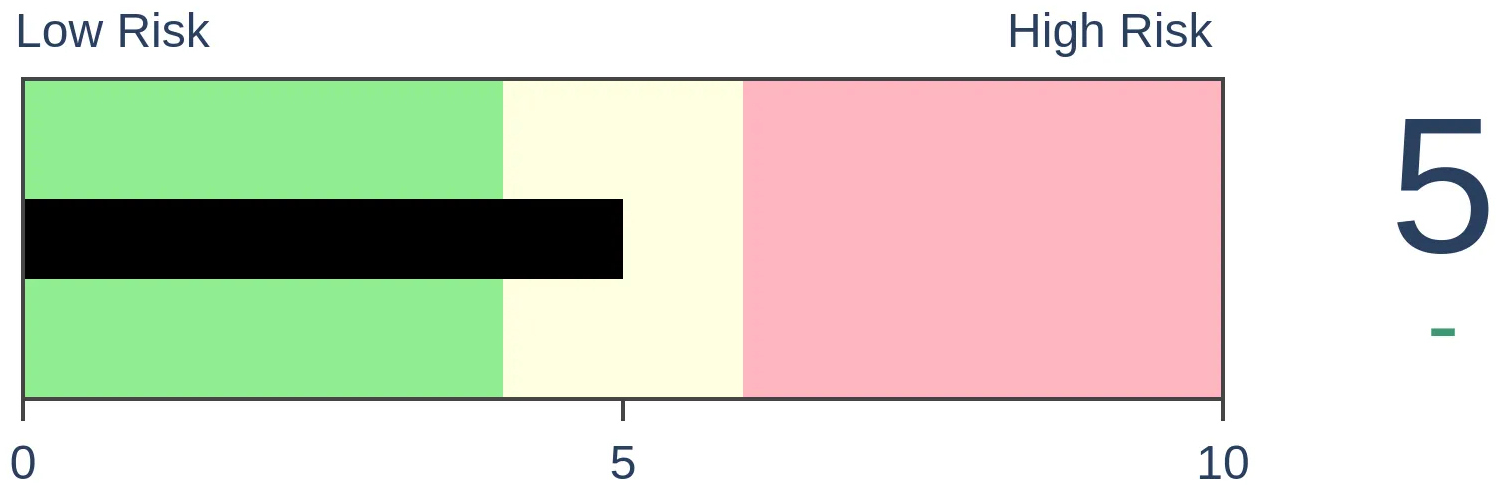
Stocks Medium-Term
|
|
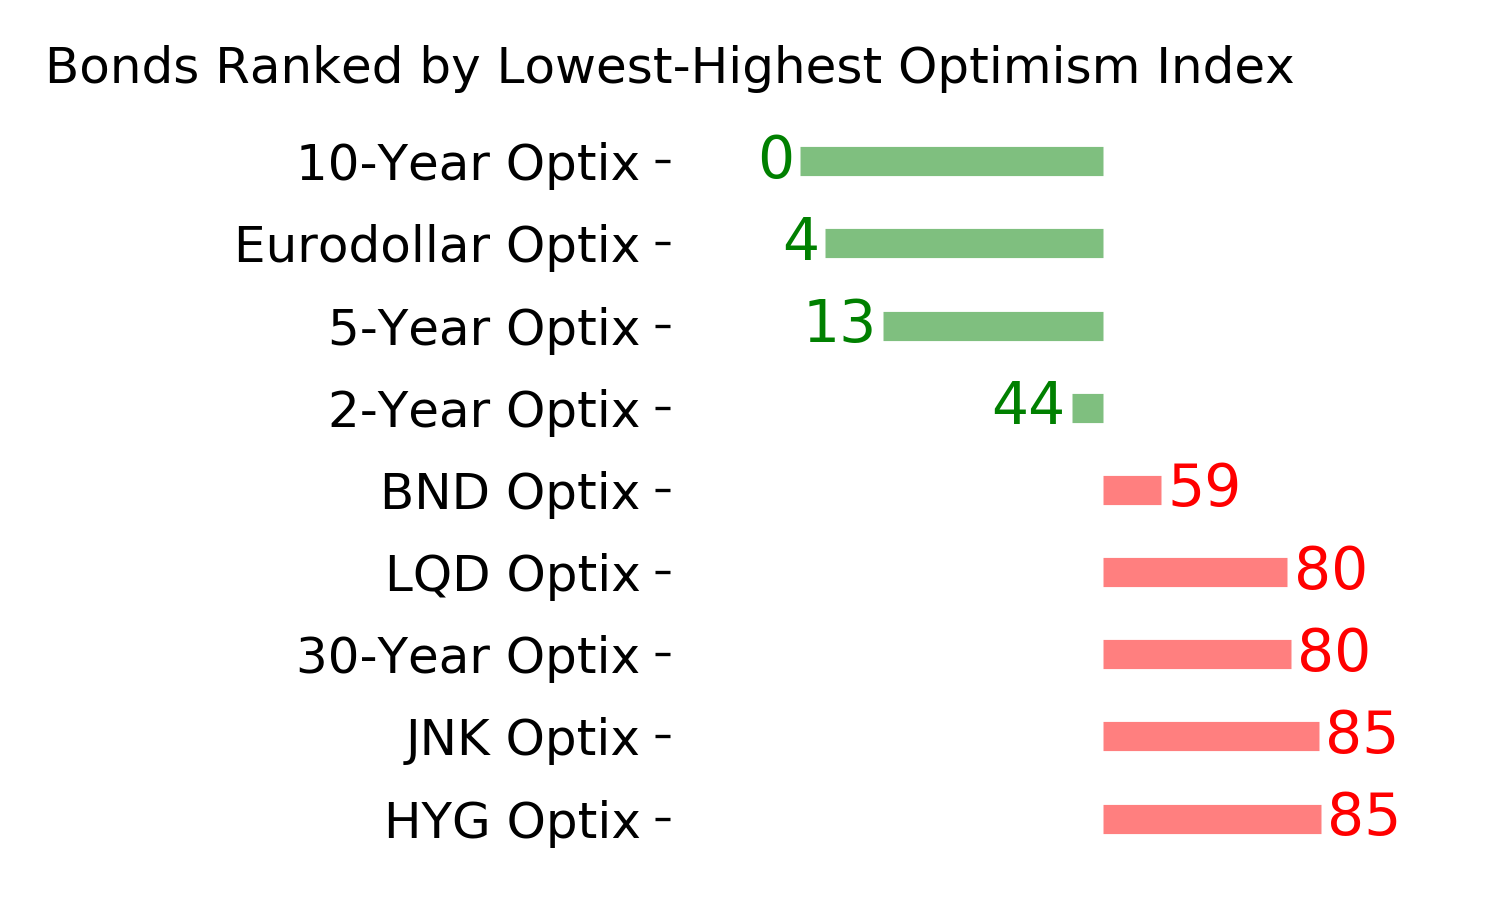
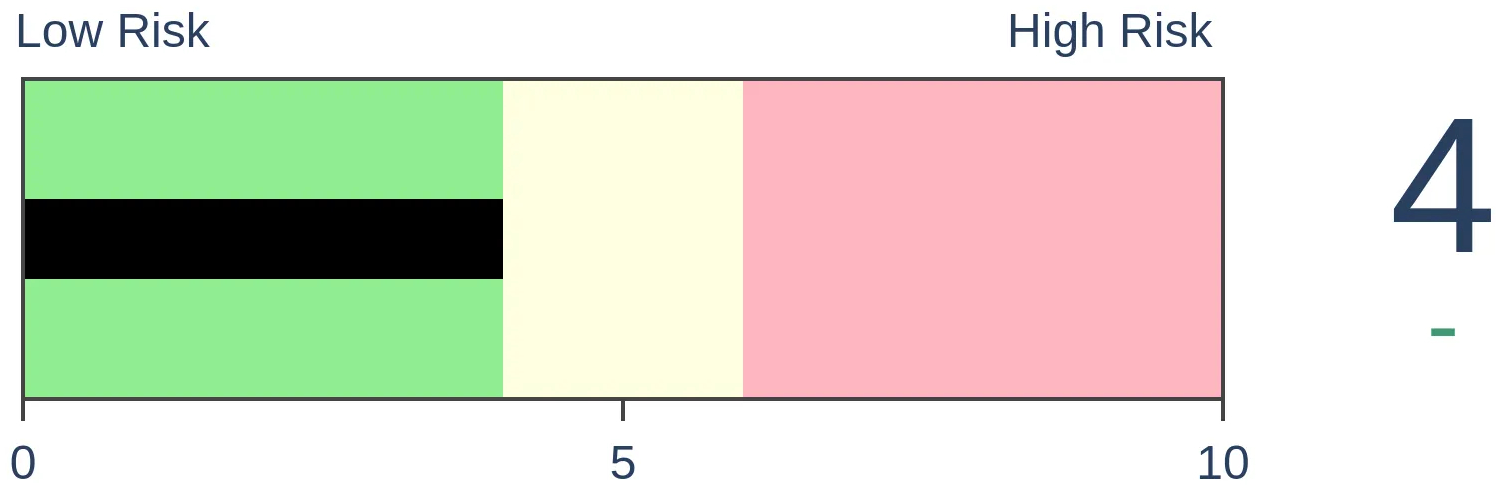
Bonds
|
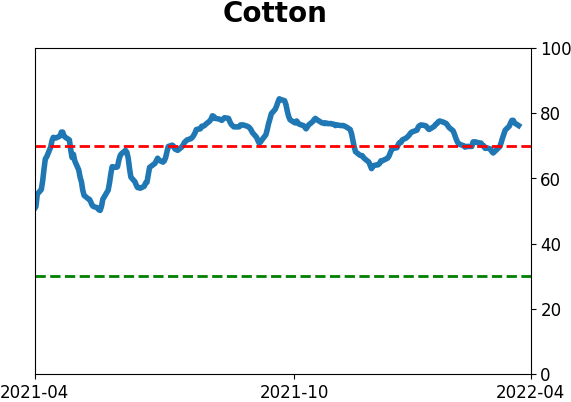
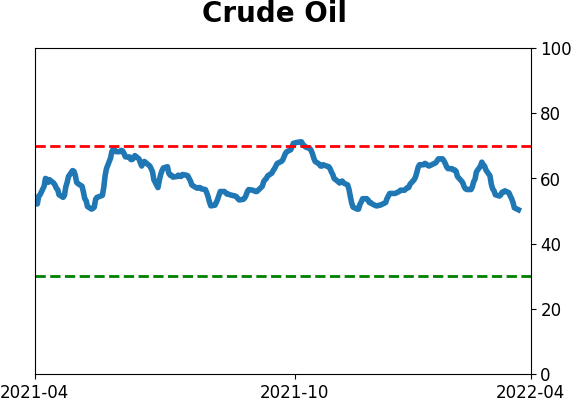
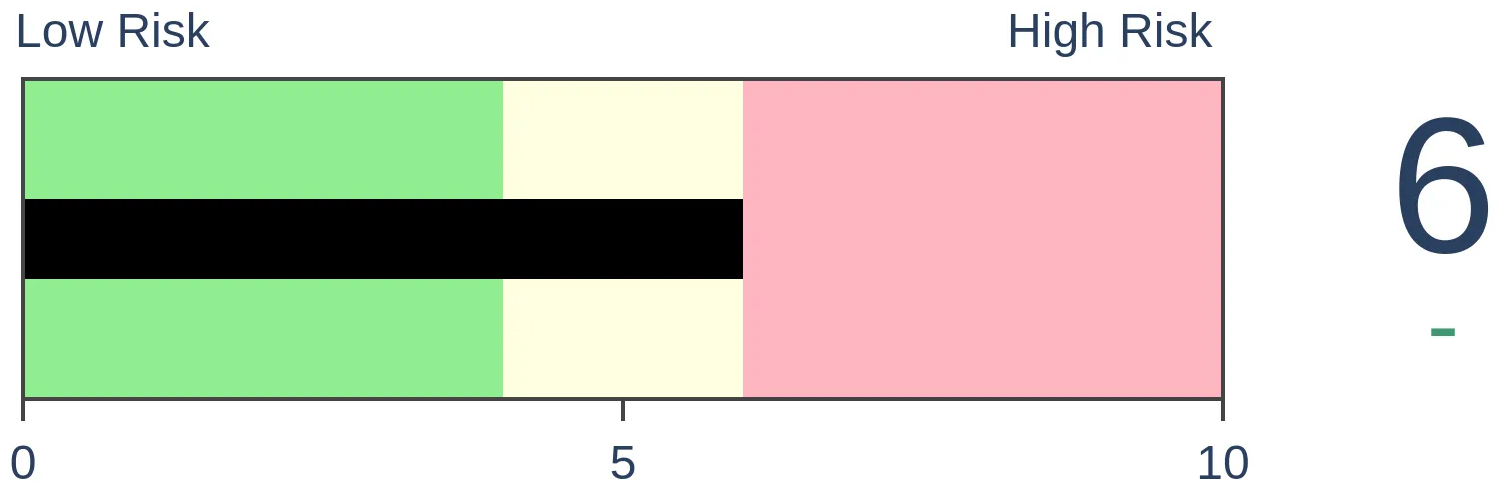
Crude Oil

|
|
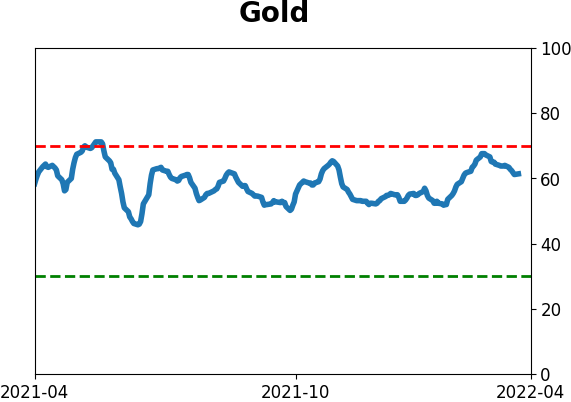
Gold
|
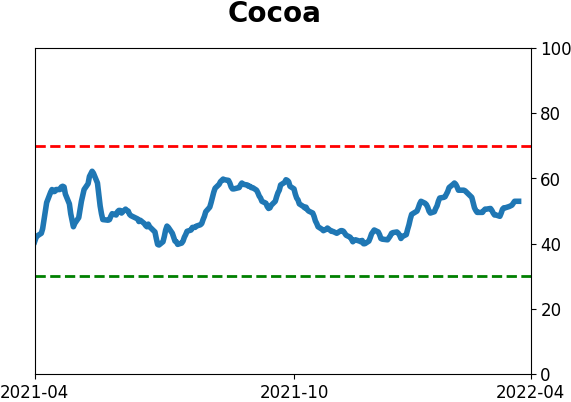
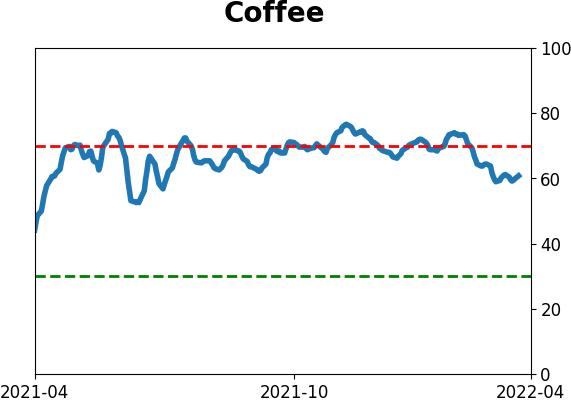
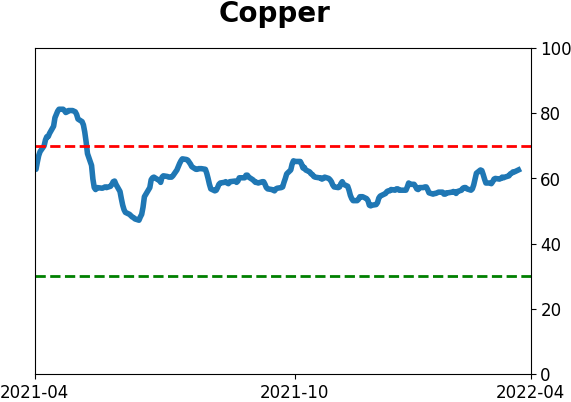
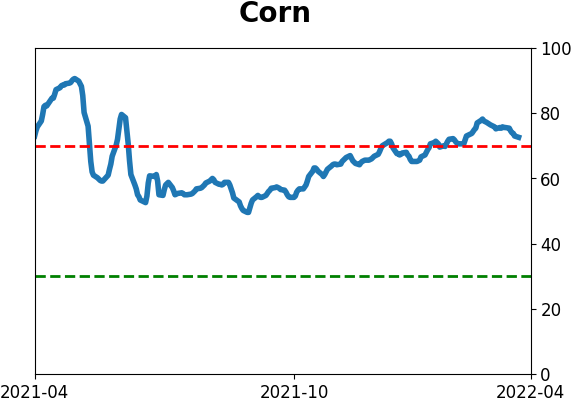
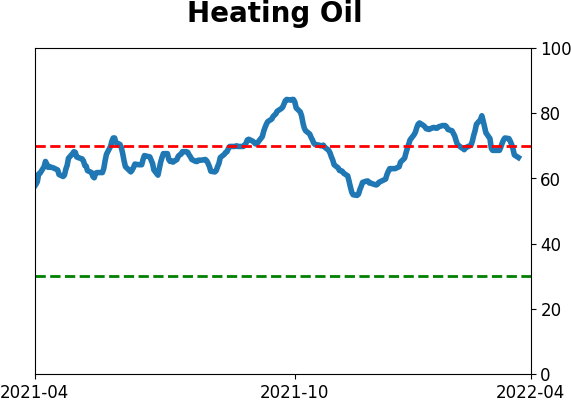
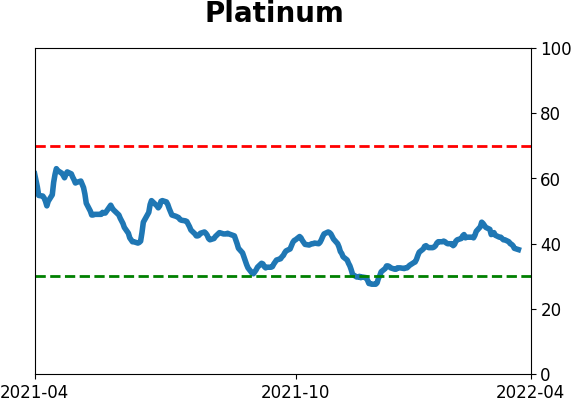
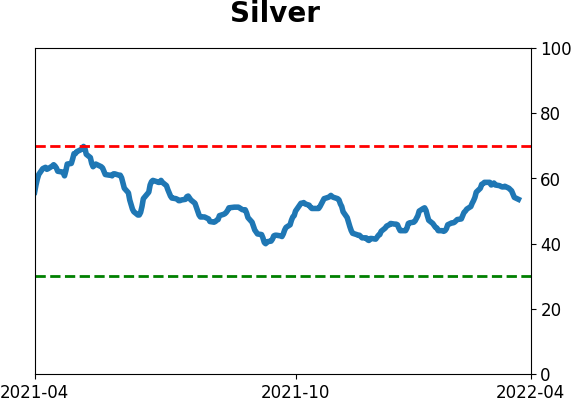
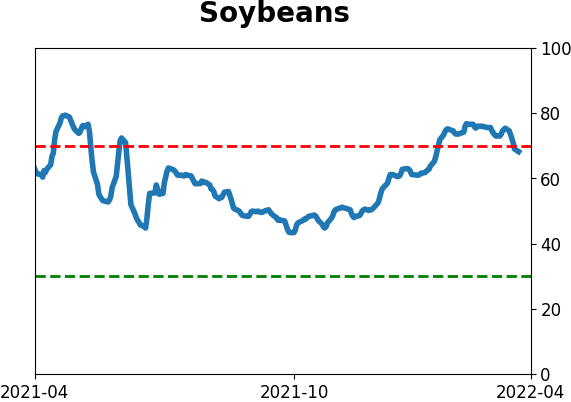
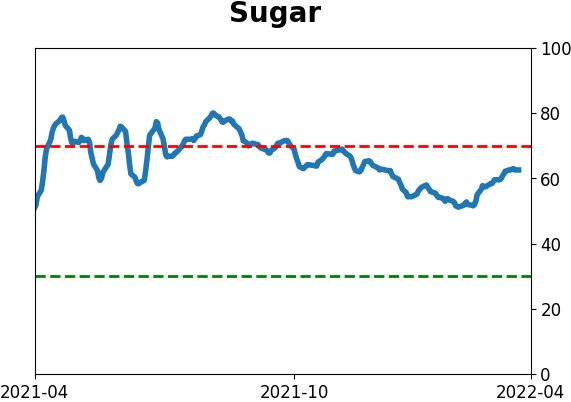
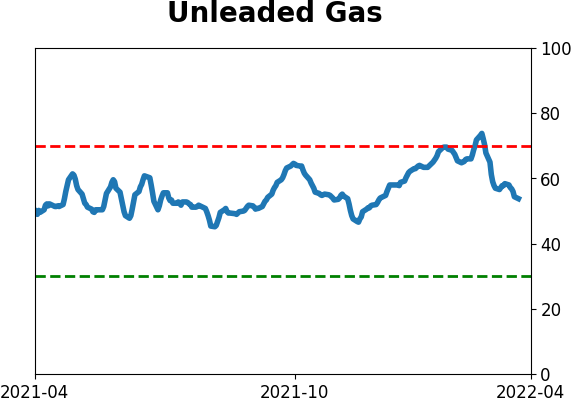
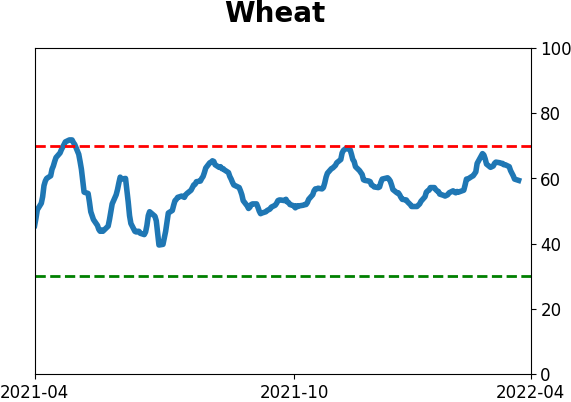
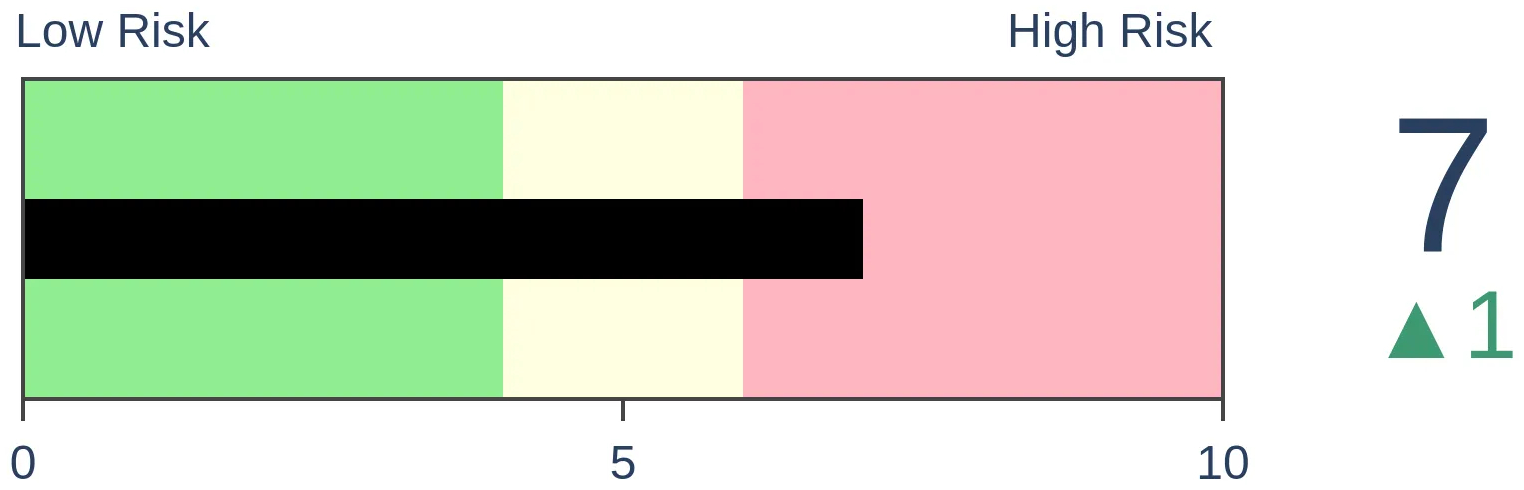
Agriculture
|
|
Research
By Jason Goepfert
BOTTOM LINE
For the first time in more than 50 days, Dumb Money Confidence is about to exceed Smart Money Confidence. Similar recoveries in sentiment have typically led to medium-term gains, but taking a closer look at the failures gives us warning signs to watch.
FORECAST / TIMEFRAME
None
|
Key points:
- For the first time in months, Dumb Money Confidence is about to exceed Smart Money Confidence
- Similar recoveries preceded mostly positive returns for stocks, but with caveats
- Choppy gains in the weeks and months ahead that can't be sustained will be a major warning sign
A recovery in Confidence
For the first time in months, Dumb Money is about to be more confident than Smart Money that stocks will rally.
Starting in late February, Dumb Money Confidence was well below Smart Money Confidence, and the spread between them exceeded 50%. Essentially, that suggests that investors who tend to be most net long near market troughs were 50% more confident that stocks would rally over the next several months. The Backtest Engine shows that this does, indeed, happen about 82% of the time.
Over the past 5 years, the spread has gone back to neutral after a reading of 50% or great only twice.
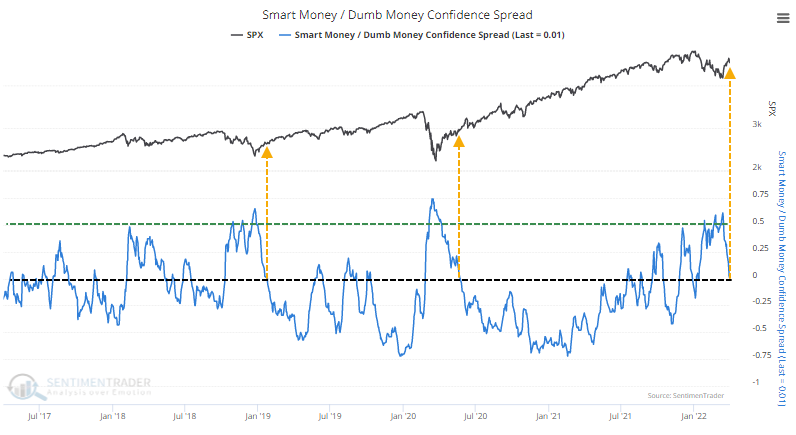
The table below shows every time the spread fell below 0 for the first time in at least 50 days. It almost always exceeded 50% at some point during those stretches, so these rebounds in sentiment are equivalent to what we've witnessed in recent weeks.
Returns going forward were decent, but nothing exceptional. There were several outright failures or times when stocks corrected hard before recovering again.
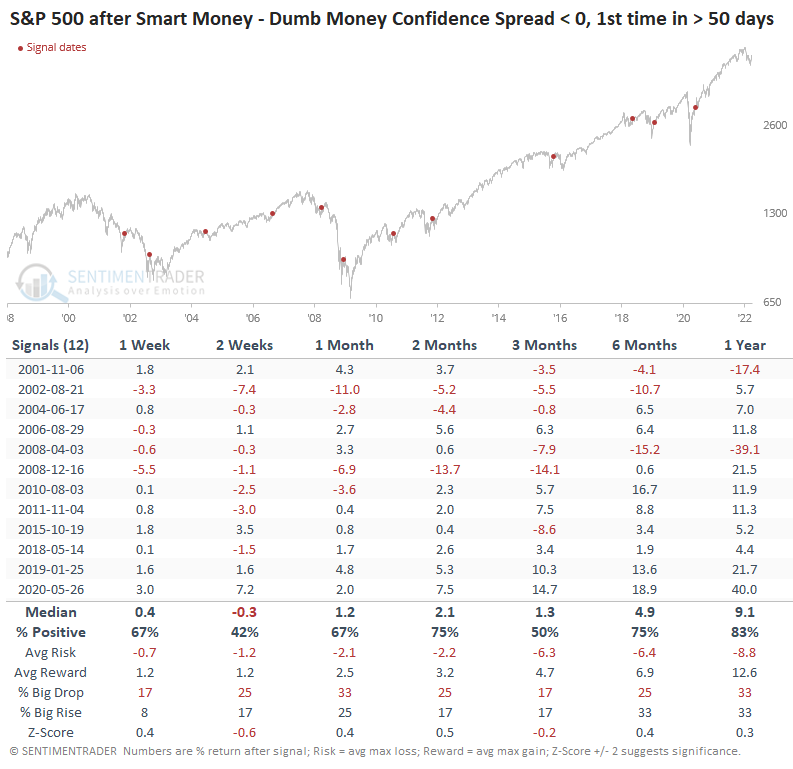
There were 4 signals that had substantial risk relative to reward. If we look at those, we might be able to glean some insights about what to look for now.
The failures showed similar characteristics
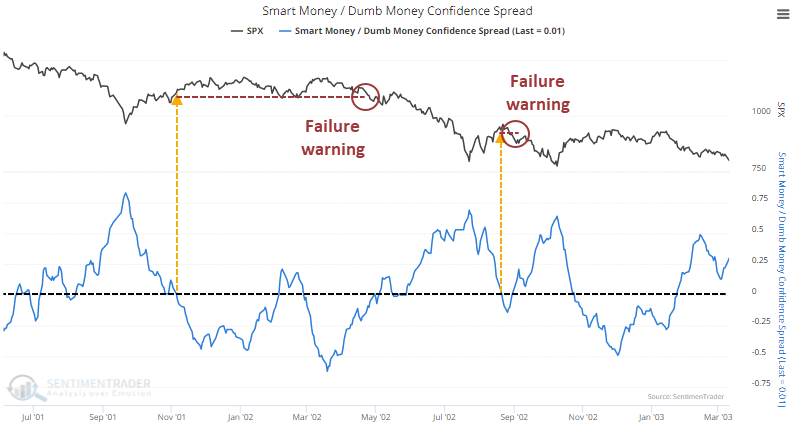
During the 2001-02 bear market, 2 signals ended up leading to significant losses. The biggest clue that the recovery in sentiment was not going to take was a lower low after a recovery rally. In 2002, we didn't even get that as sellers returned immediately and in force.
During the financial crisis, 2 signals preceded significant losses. Earlier in the year, stocks rallied for a couple of months, then failed to hold those gains, leading to the depths of the crisis. Sentiment recovered again in the fall, only to fail almost immediately.
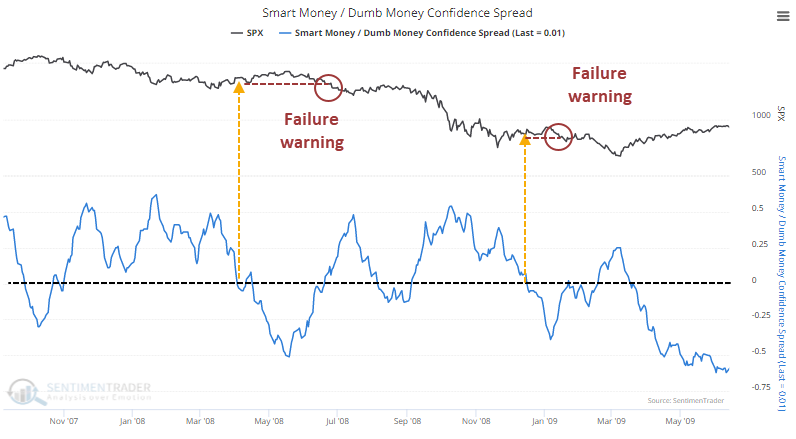
Maybe it's reading too much into those periods, but it's worth noting that during both of the worst bear markets of the past 30 years, sentiment recovered from extreme pessimism early in the year, failed during the summer, then tried again in the fall.
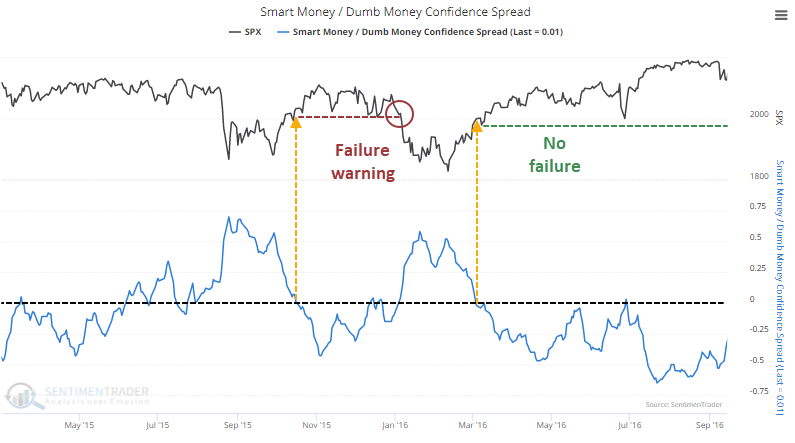
In 2015, the recovery in sentiment led to some quick follow-through, then prices chopped around for over a month before falling to a lower low and some quick selling pressure. That triggered another signal in the spring of 2016, which didn't witness a failure.
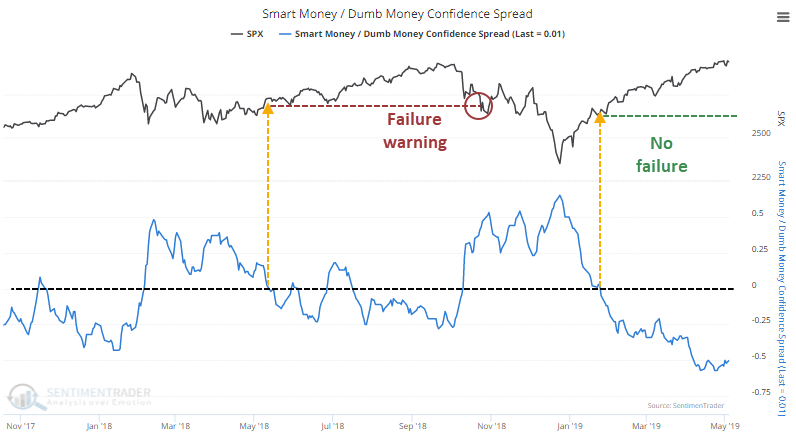
A similar thing happened in 2018-19. The recovery in the spring of 2018 led to months of gains, but a lower low indicated that something was amiss. That triggered another signal, which saw no failure and preceded more gains.
What the research tells us...
We try not to predict the future and how investors might react. Instead, we look at how they've behaved historically under similar conditions and whether they're staying true to those behavioral patterns. So far, they've acted in line with other significant recoveries from extreme pessimism. As we saw above, an essential part of the recovery will be what happens in the weeks and months ahead. If we see the S&P 500 start to stall and set lower lows in shorter time frames, it will raise serious doubts about the sustainability of this recovery.
Active Studies
| Time Frame | Bullish | Bearish | | Short-Term | 4 | 0 | | Medium-Term | 25 | 2 | | Long-Term | 17 | 5 |
|
Indicators at Extremes
Portfolio
| Position | Description | Weight % | Added / Reduced | Date | | Stocks | 21.6% RSP, 5.1% IEMG | 26.7 | Added 5.3% | 2022-03-18 | | Bonds | 32.7% BND, 7.1% SCHP | 40.1 | Added 8.3% | 2021-10-26 | | Commodities | GCC | 2.4 | Reduced 2.1%
| 2020-09-04 | | Precious Metals | GDX | 4.6 | Reduced 4.2% | 2021-05-19 | | Special Situations | 7.6% KWEB, 4.9% XBI, 3.7% XLE, 1.8% PSCE | 18.0 | Added 4.6% | 2022-02-24 | | Cash | | 7.9 | | |
|
Updates (Changes made today are underlined)
We had a volatile few weeks into mid-March, and it was enough to trigger a number of extremes. Most of the studies we've looked at have had a clear bullish edge over a multi-month time frame. I'd typically be more proactive instead of reactive with changes in positions, adding exposure into weakness instead of strength, but during an unhealthy environment like we're in, I tend to be more conservative. I did add some exposure to emerging markets, choosing a fund with the least exposure to China, since I already have exposure there with KWEB. It's still heavily weighted to that market. The only other times the MSCI Emerging Markets Index has had a weekly reversal like this week were October 2008, October 2011, and August 2015, all leading to long-term gains. RETURN YTD: +1.3% 2021: +8.7%, 2020: +8.1%, 2019: +12.6%, 2018: +0.6%, 2017: +3.8%, 2016: +17.1%, 2015: +9.2%, 2014: +14.5%, 2013: +2.2%, 2012: +10.8%, 2011: +16.5%, 2010: +15.3%, 2009: +23.9%, 2008: +16.2%, 2007: +7.8%
|
|
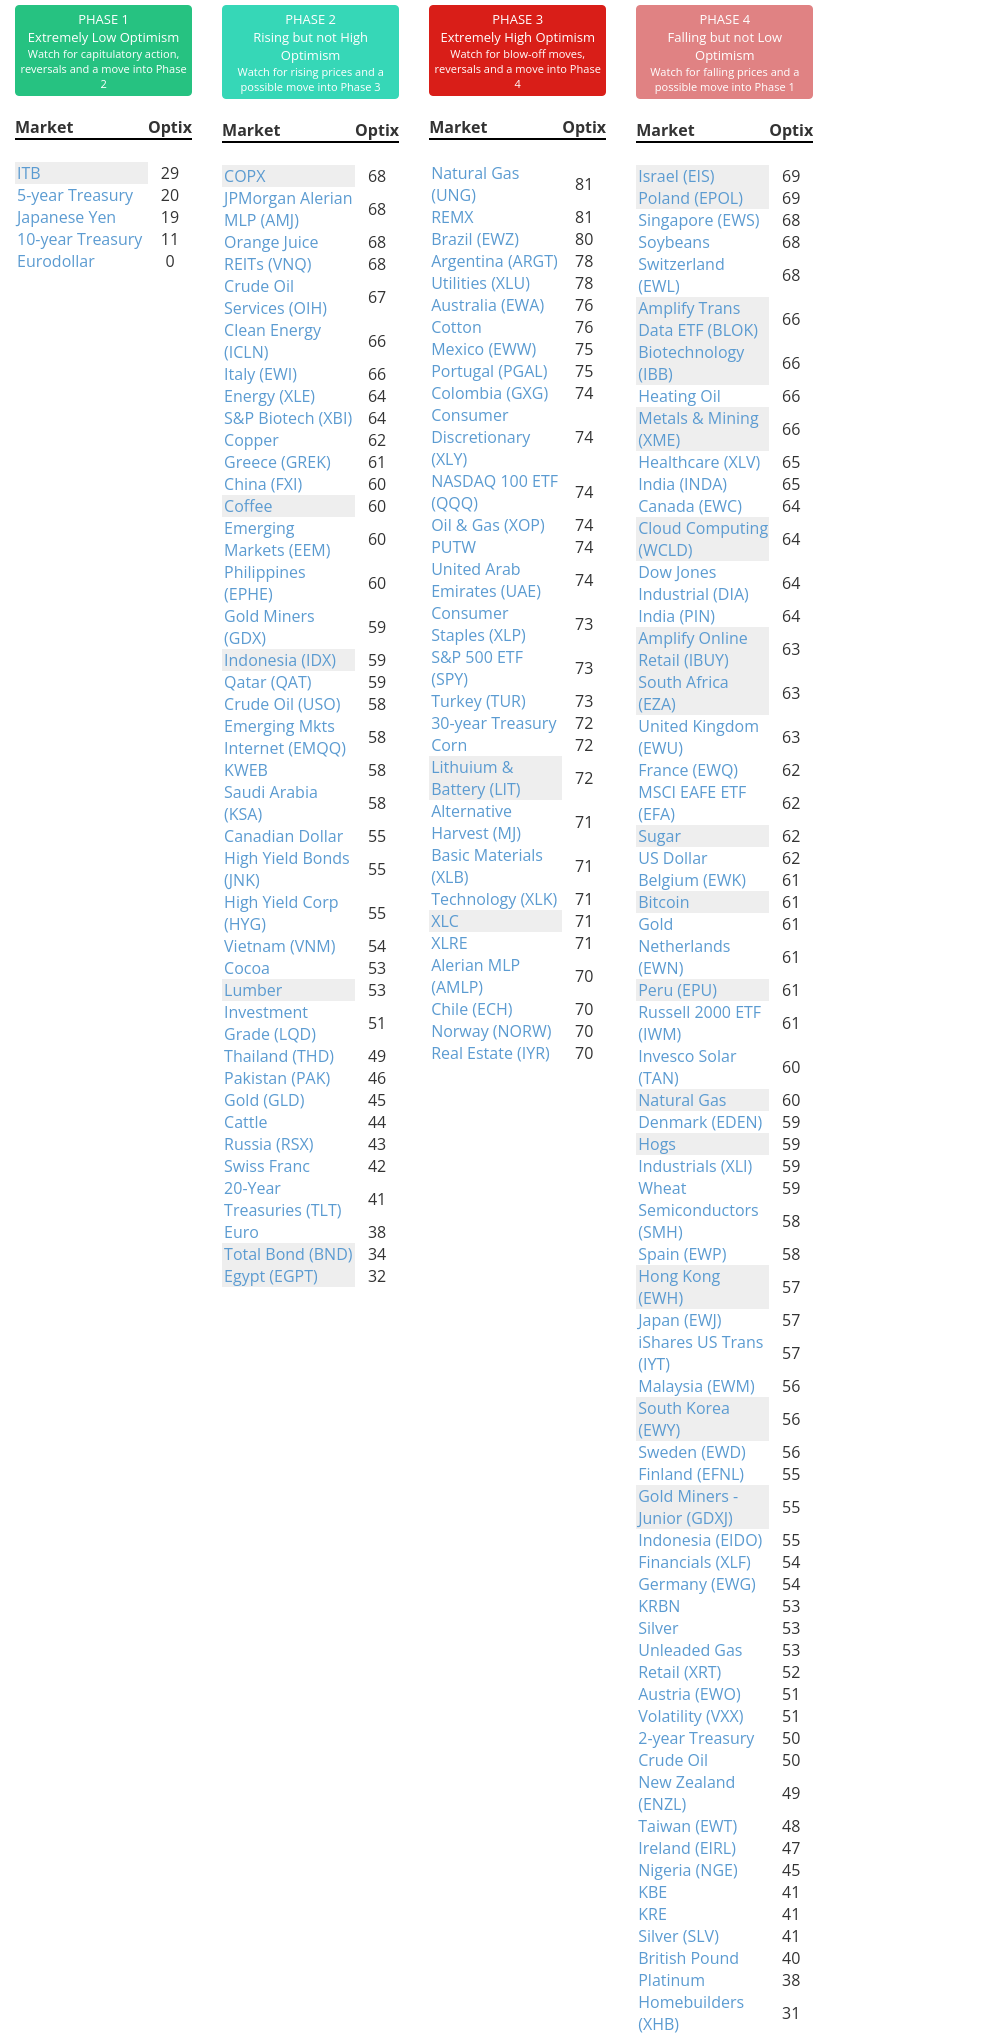
Phase Table
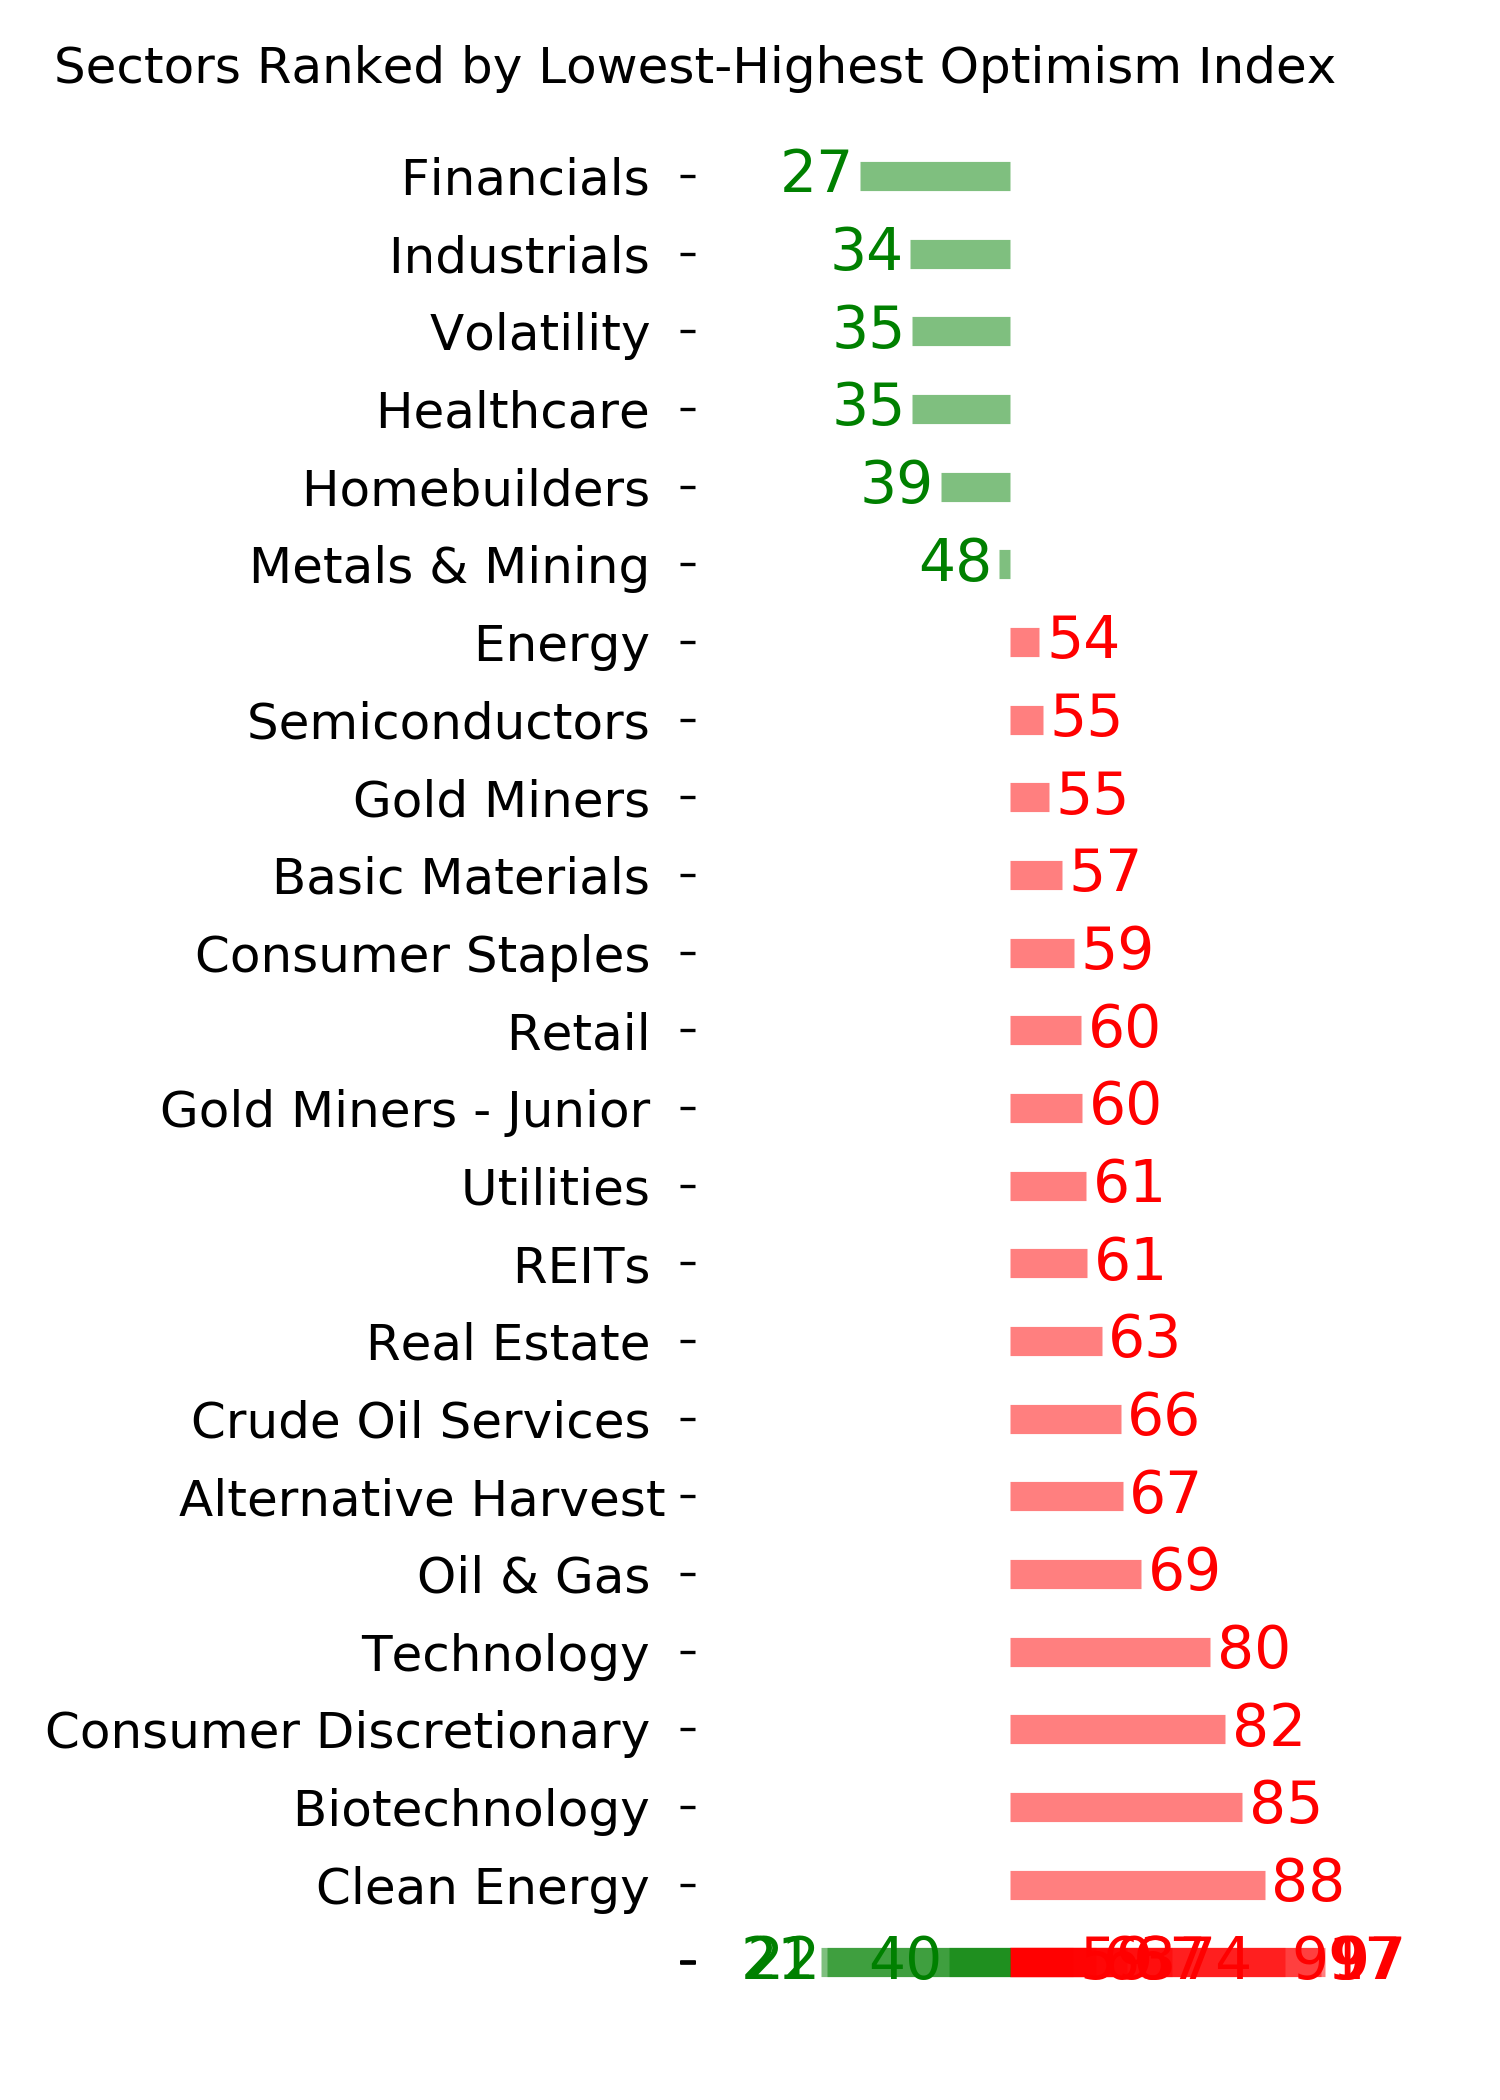
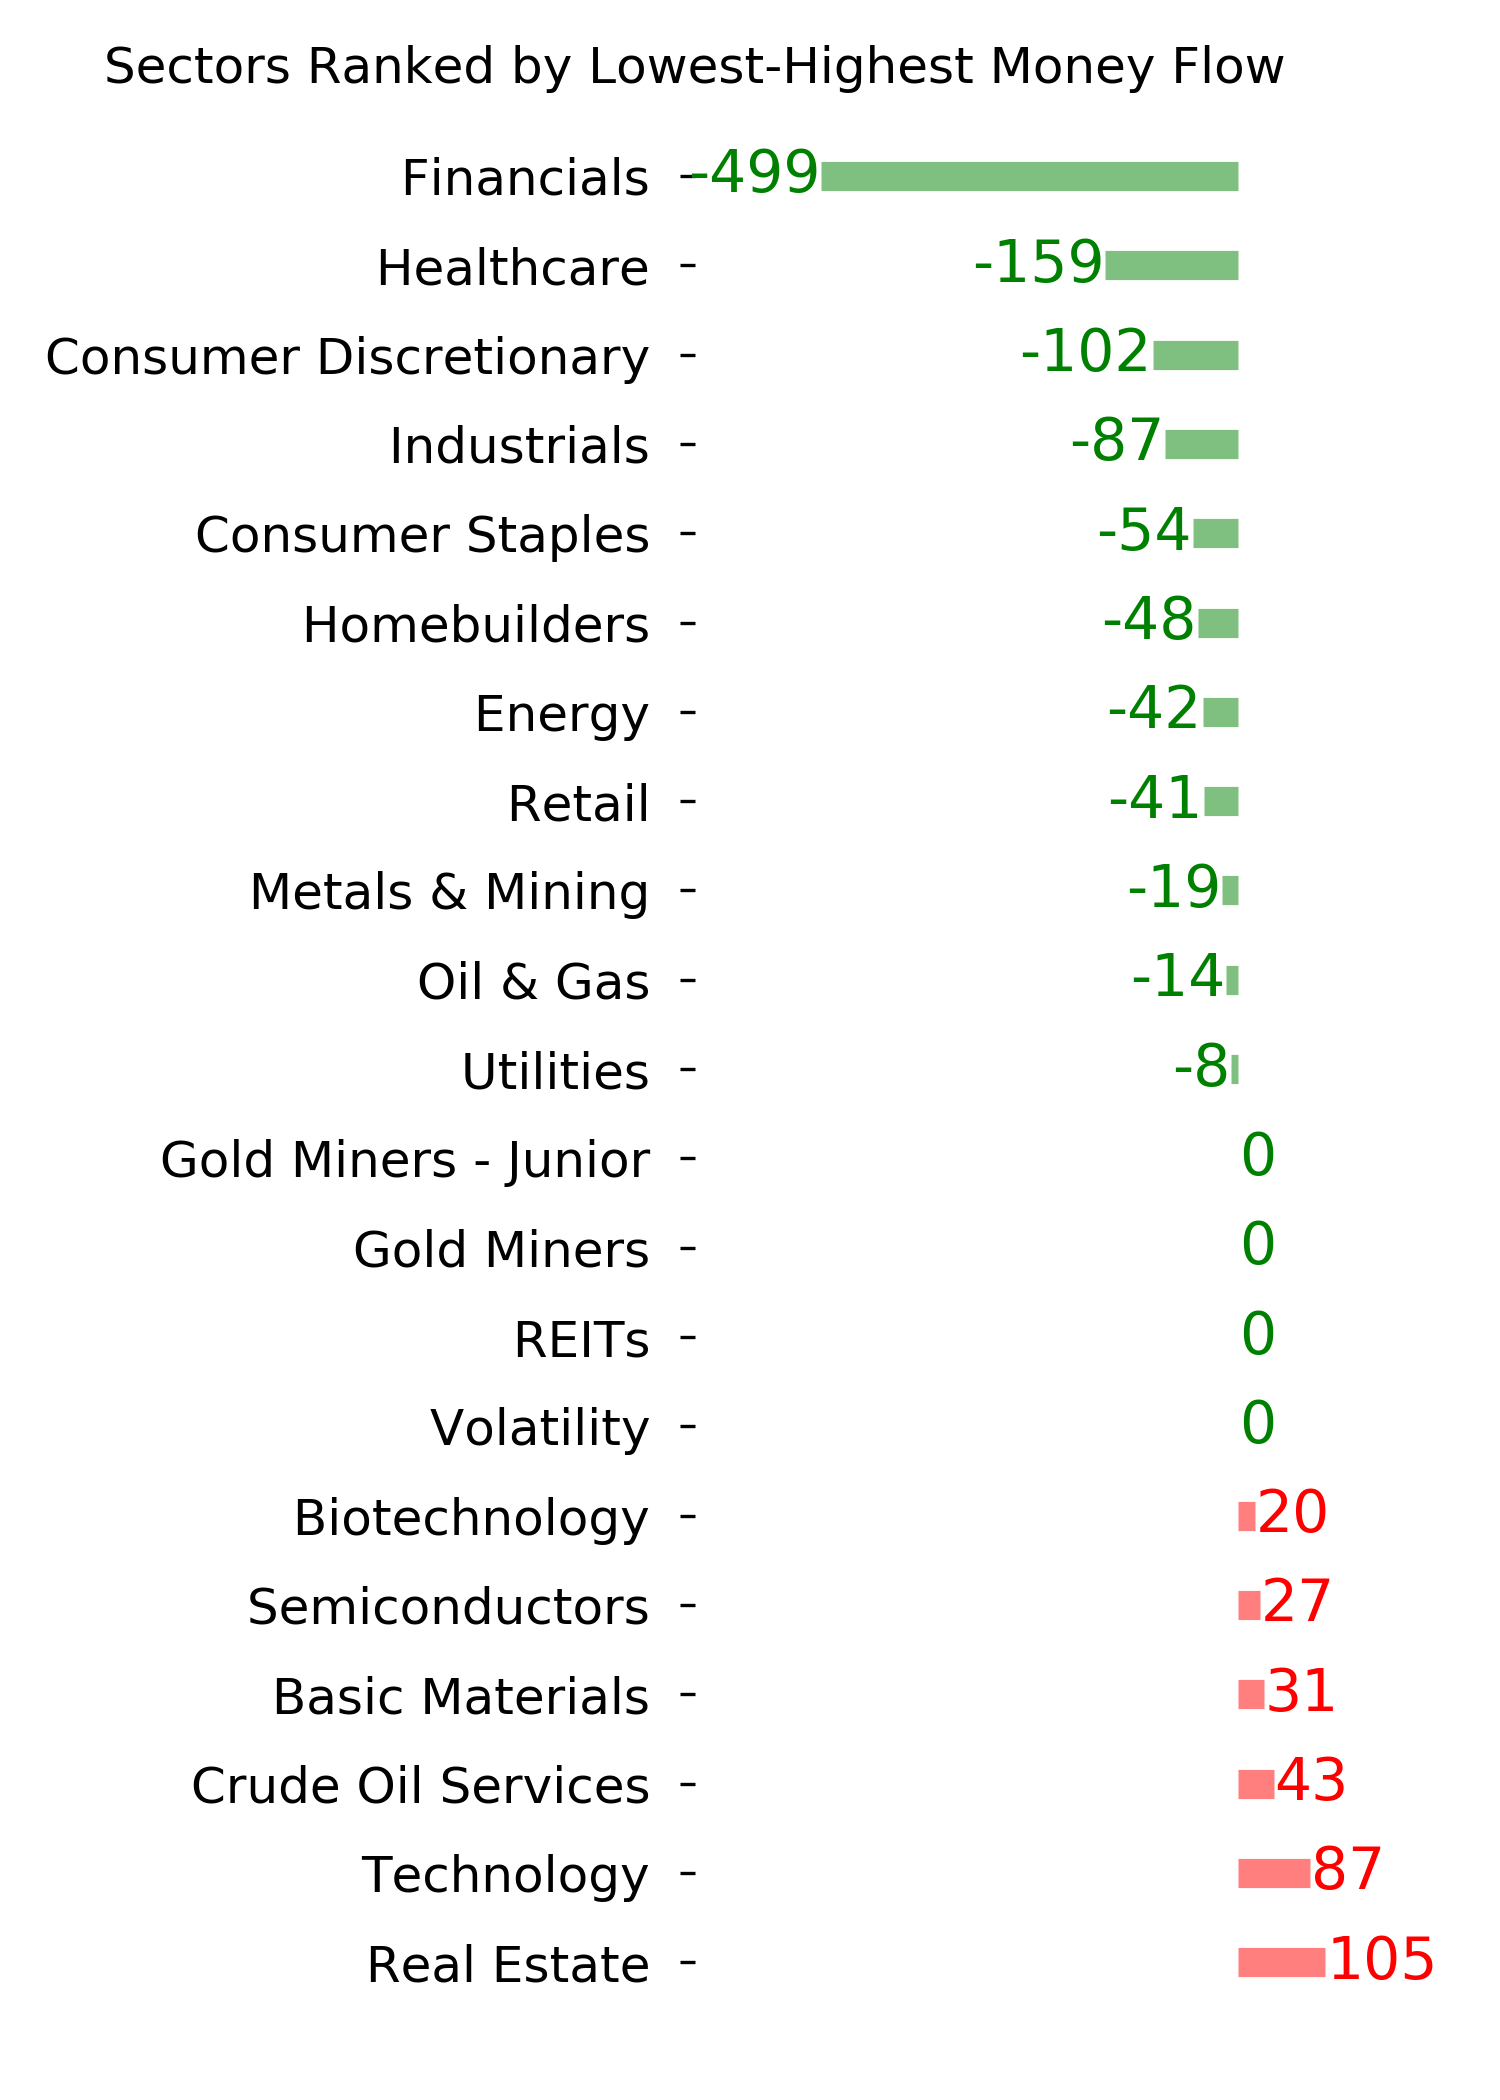
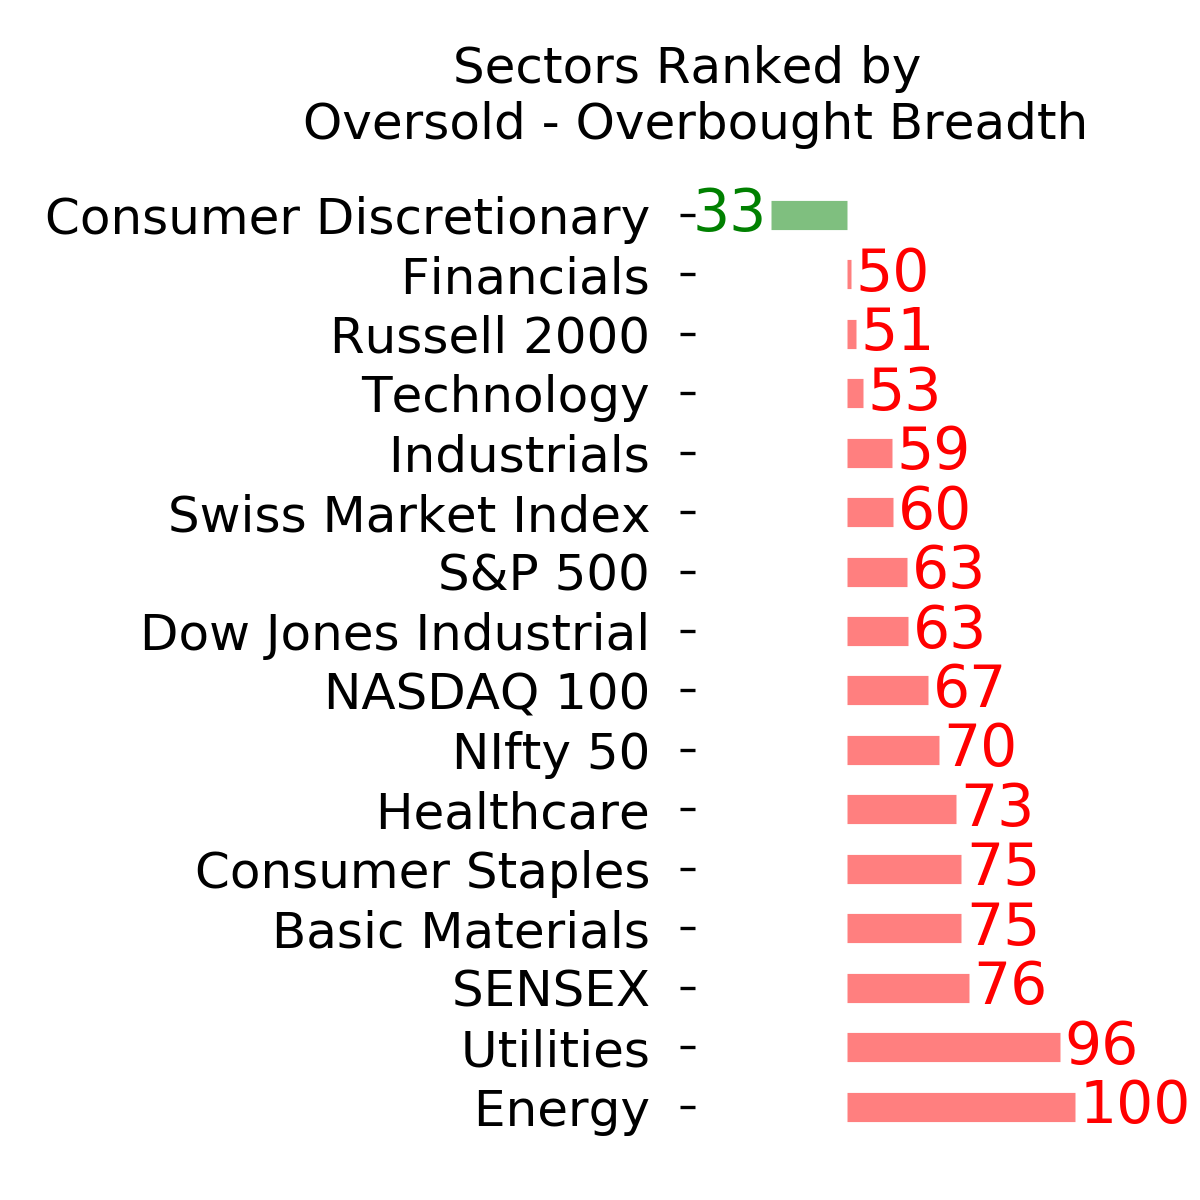
Ranks
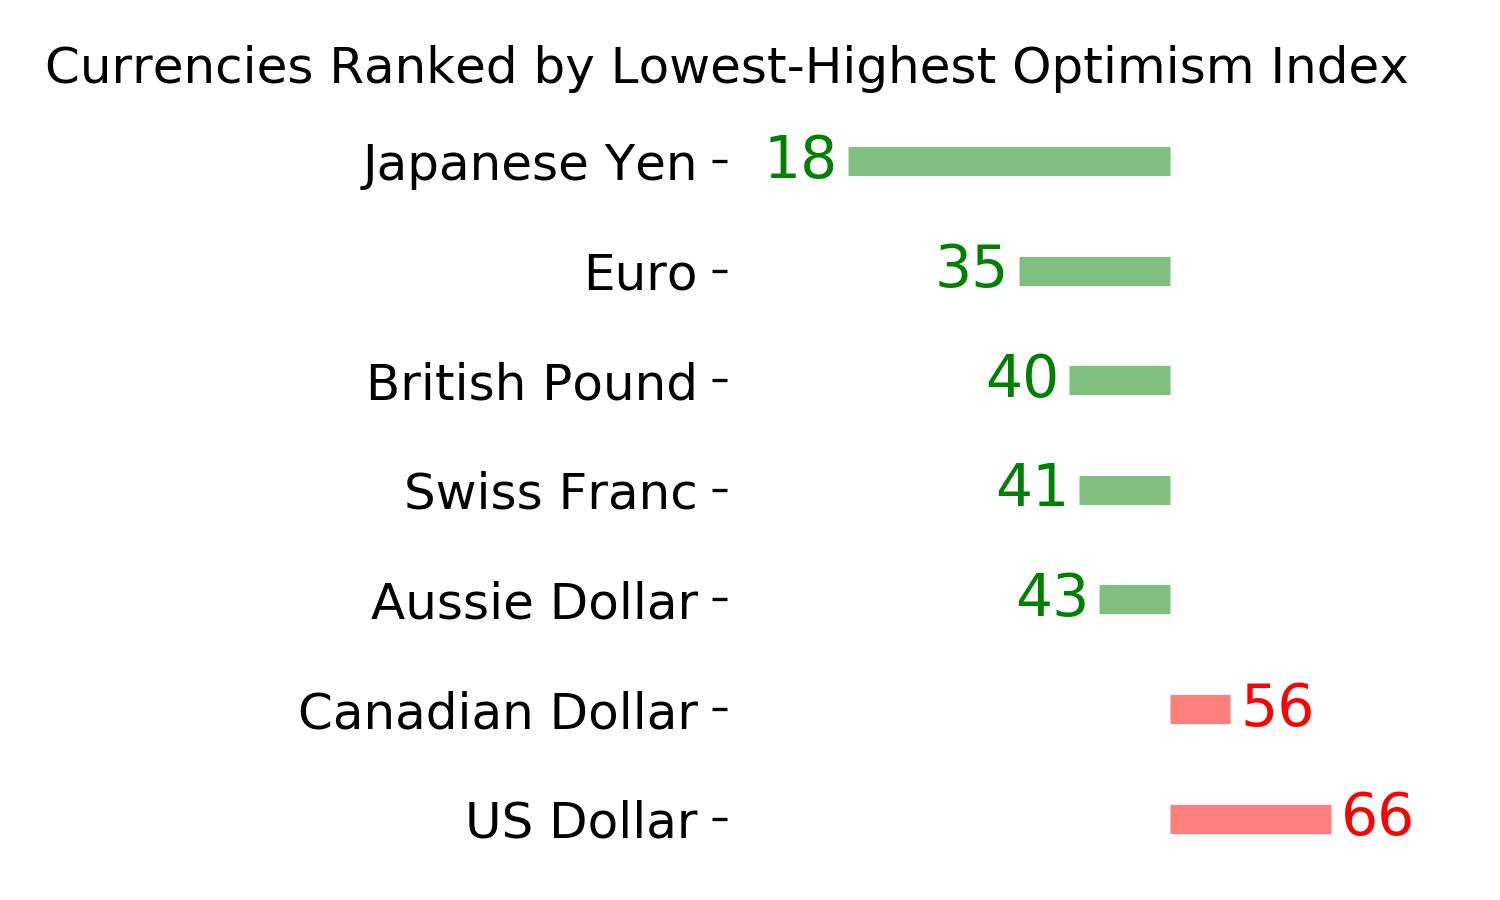
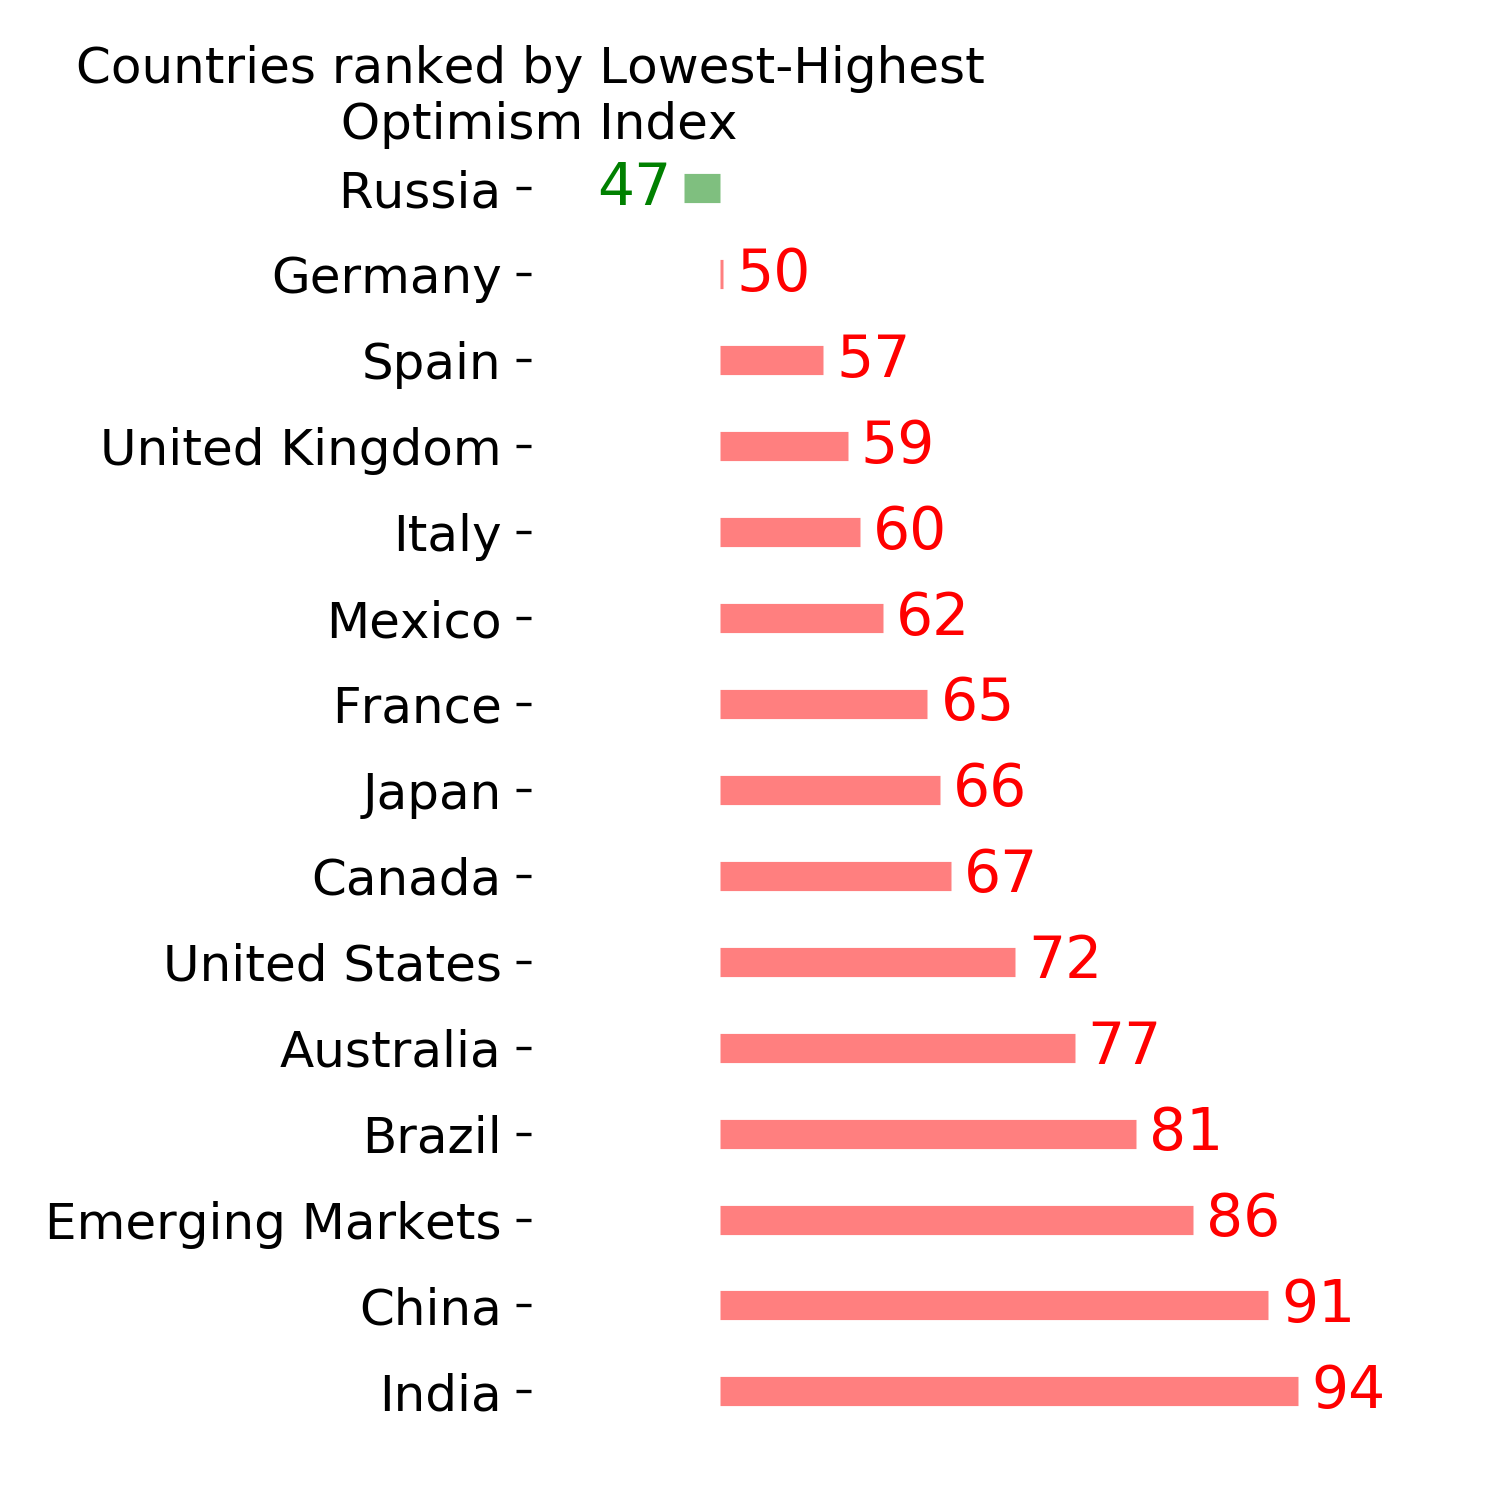
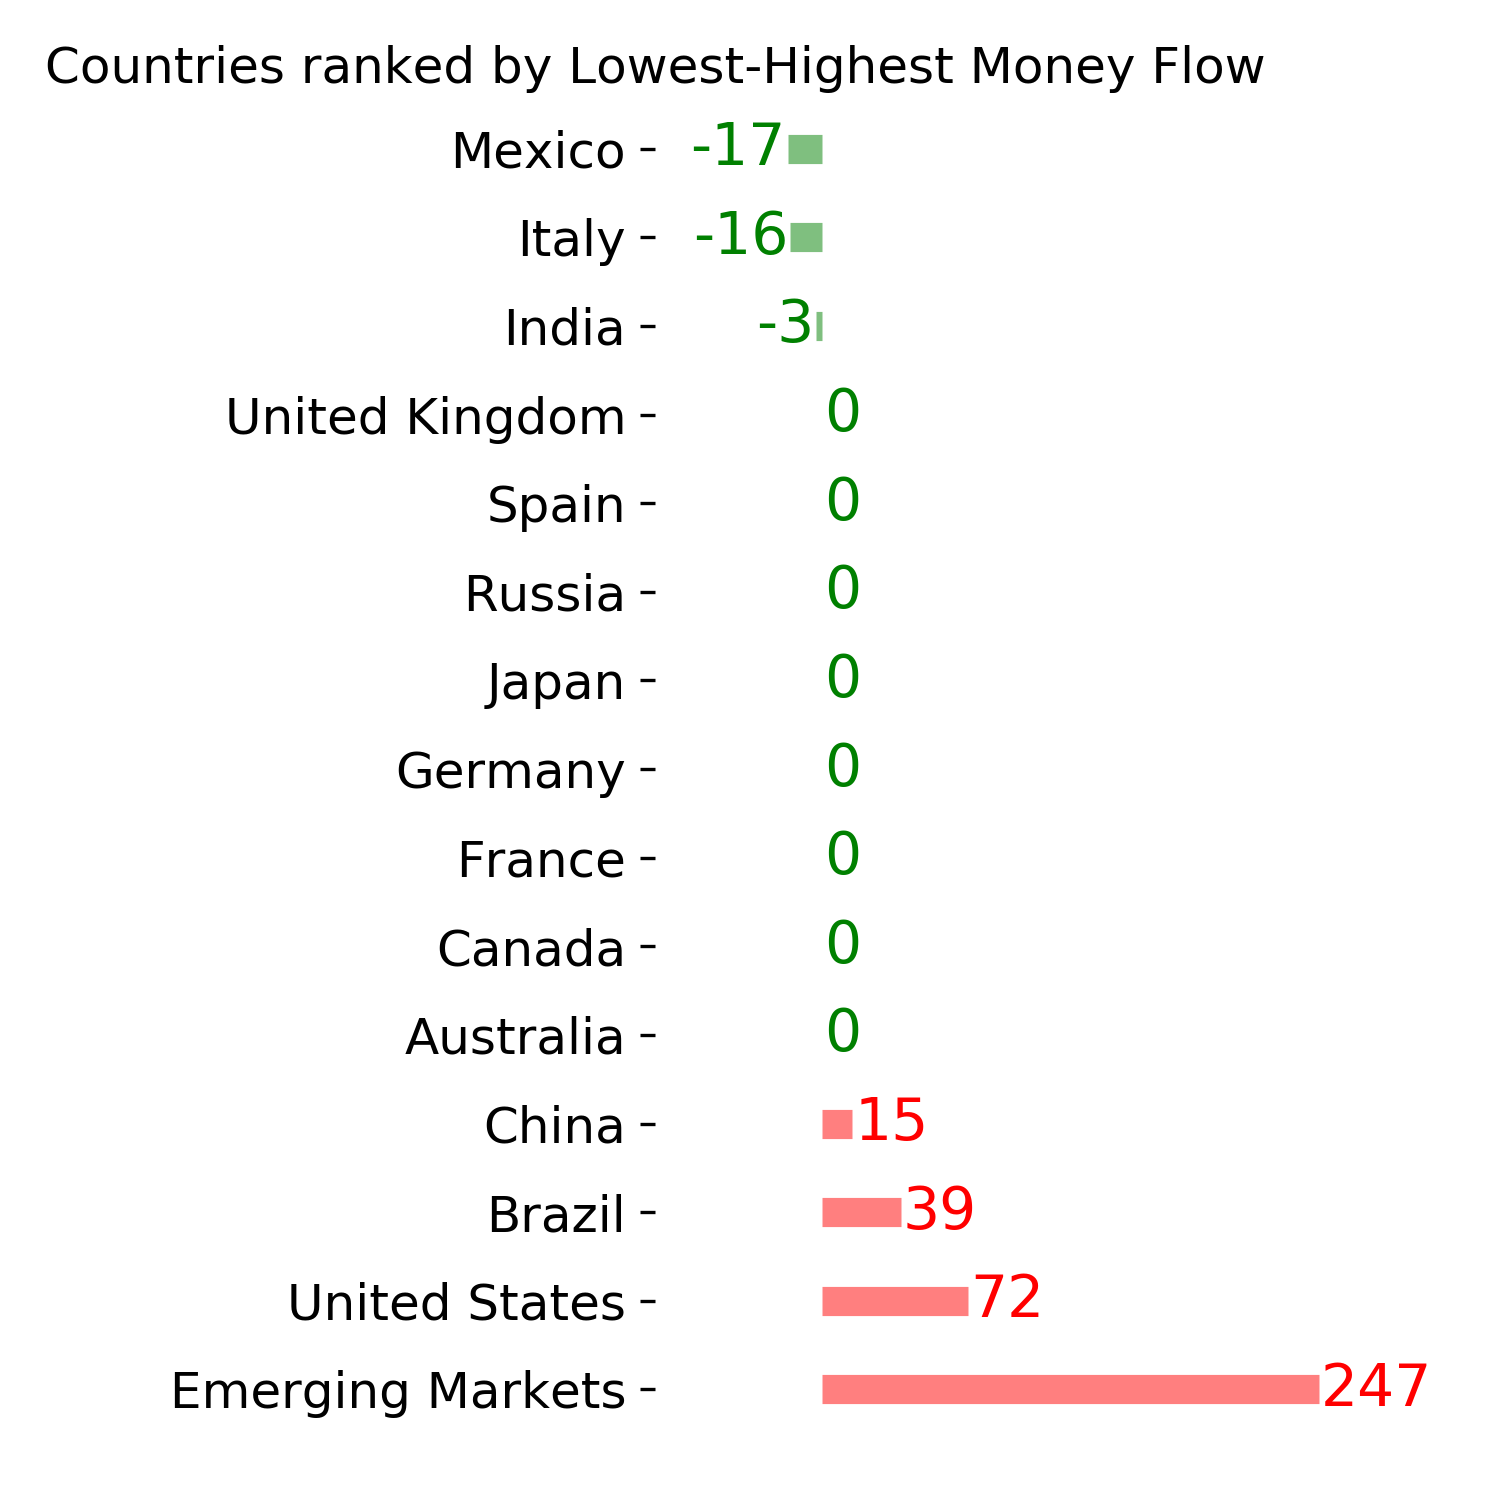
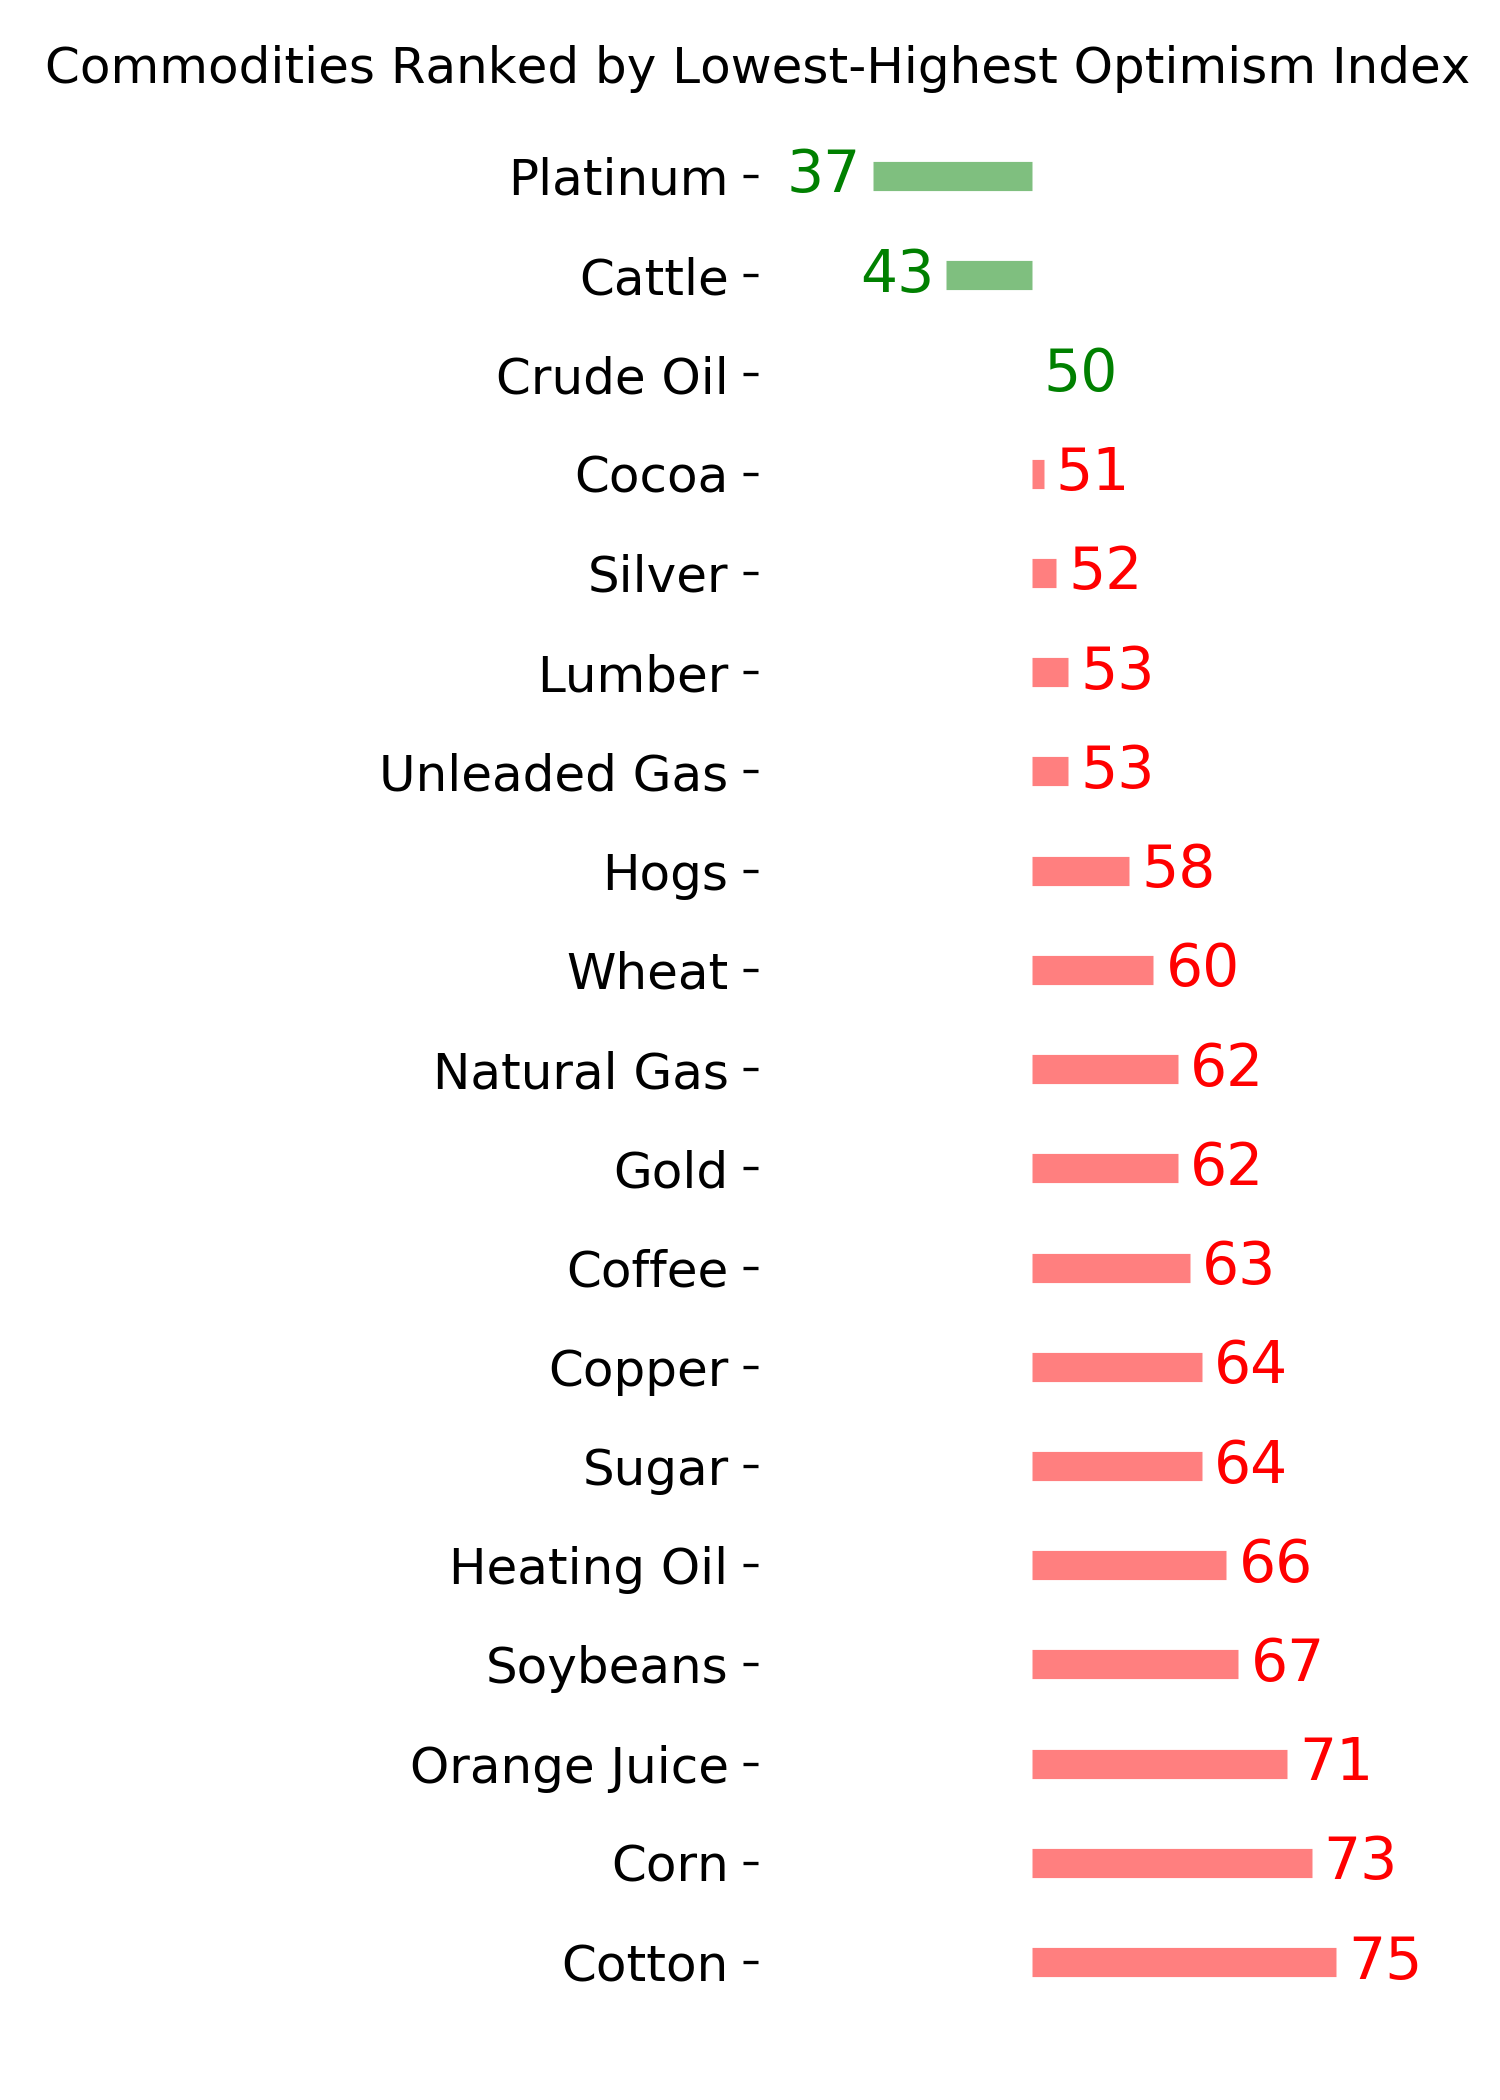
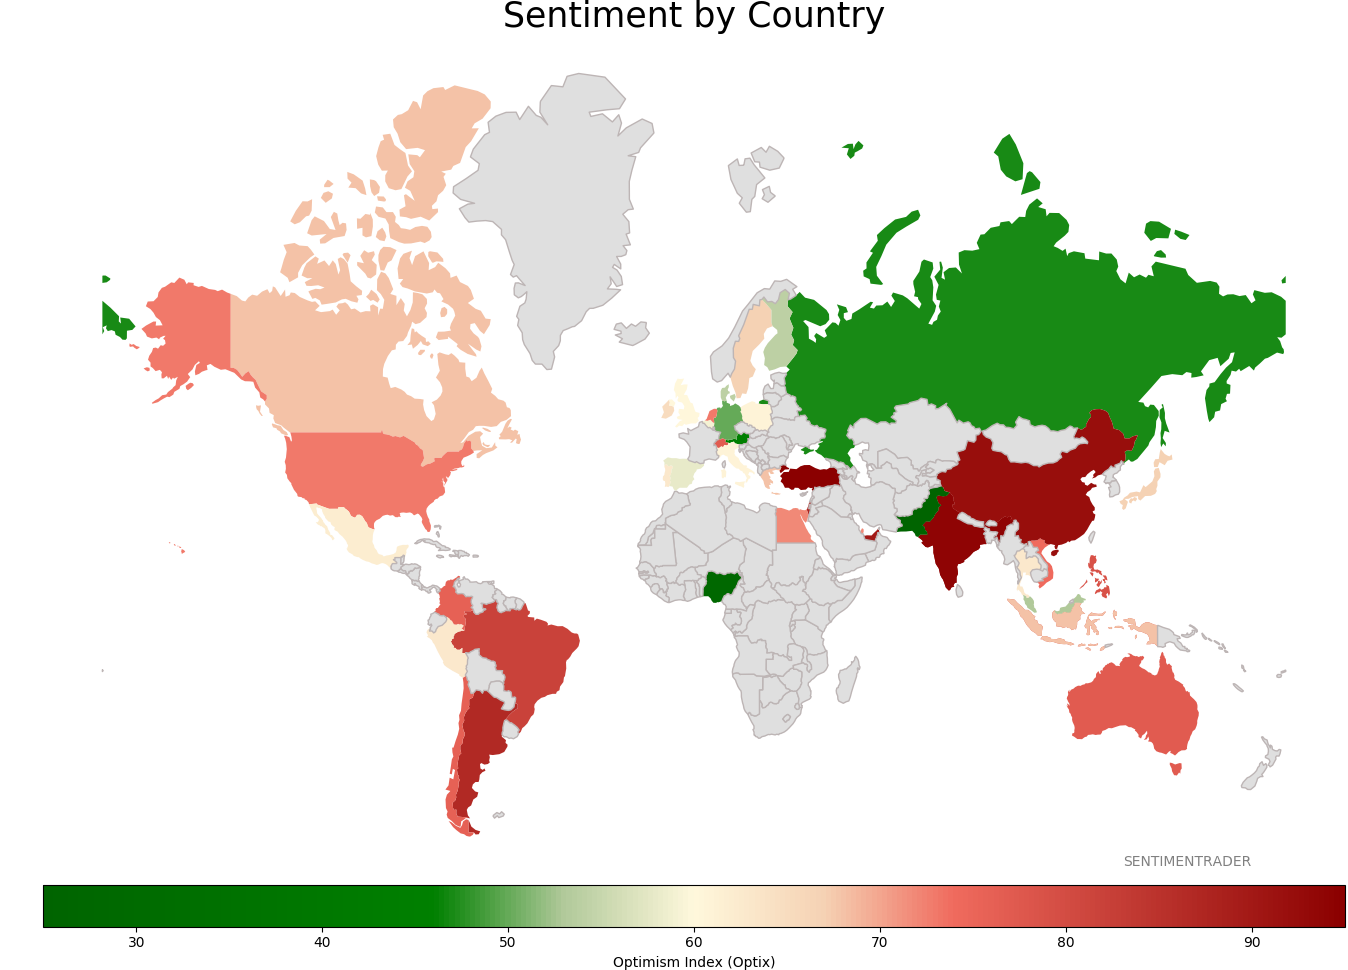
Sentiment Around The World
Optimism Index Thumbnails
|
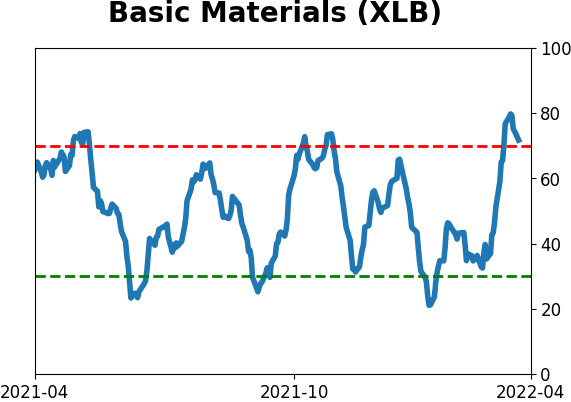
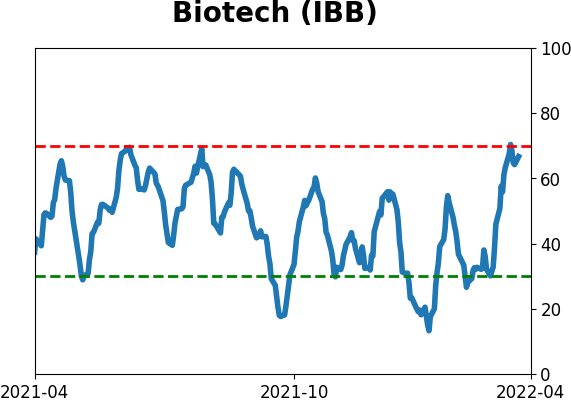
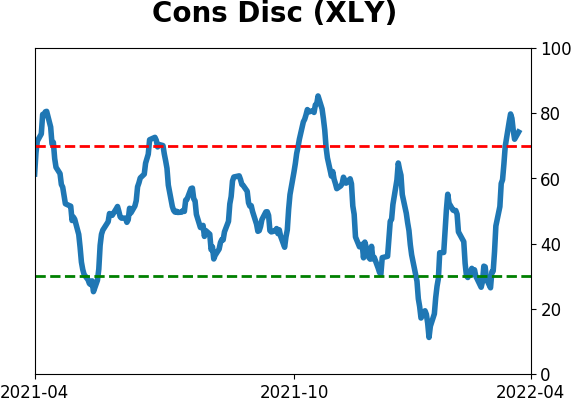
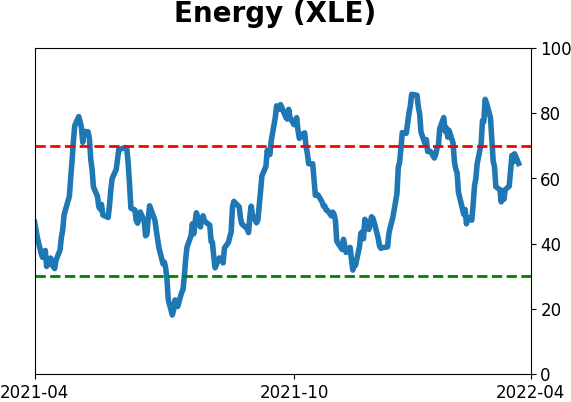
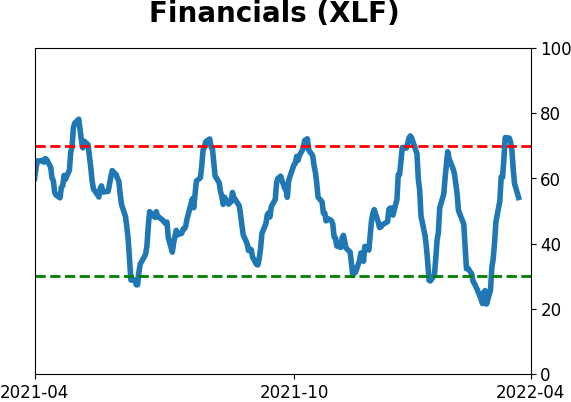
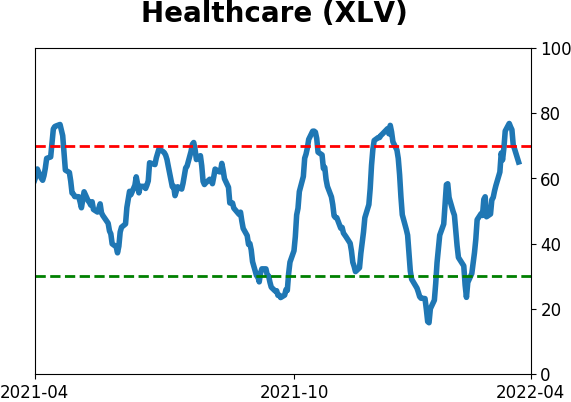
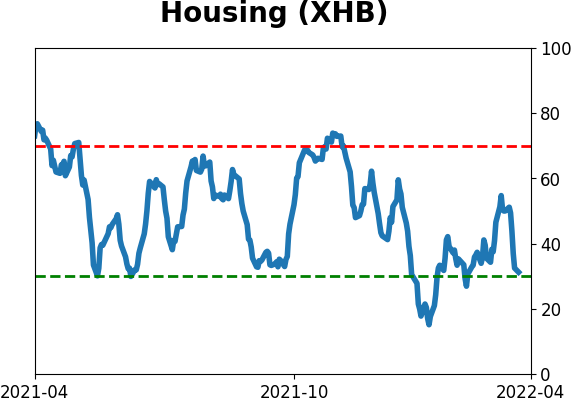
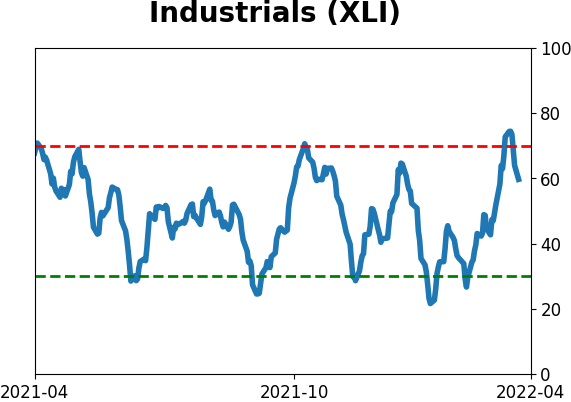
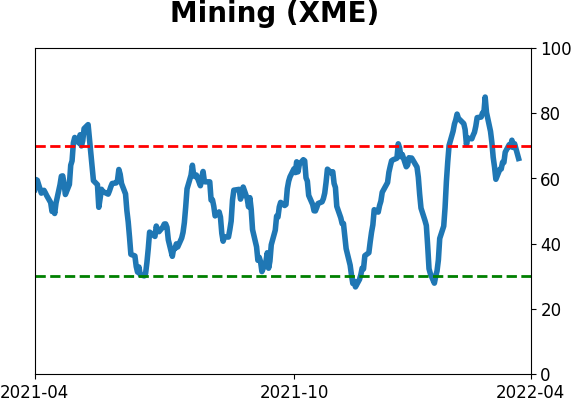
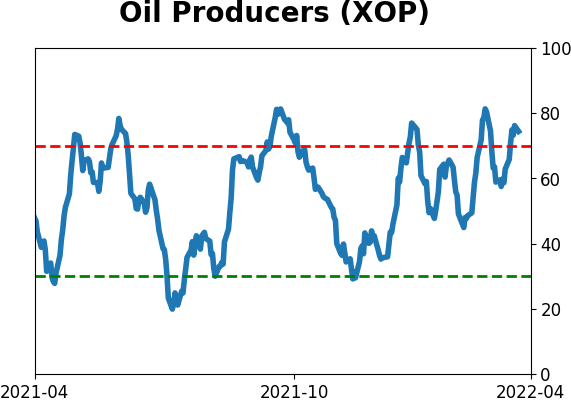
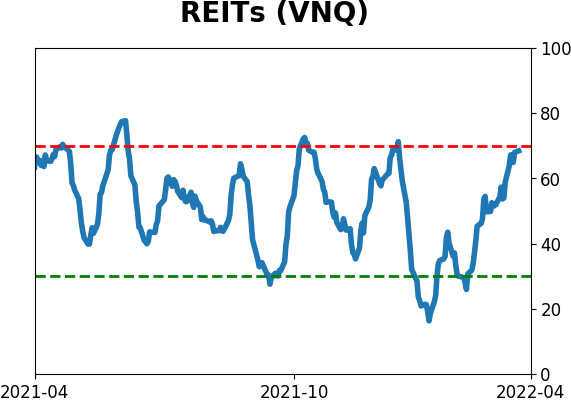
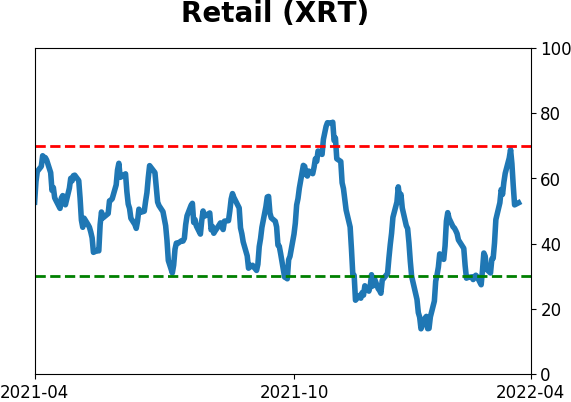
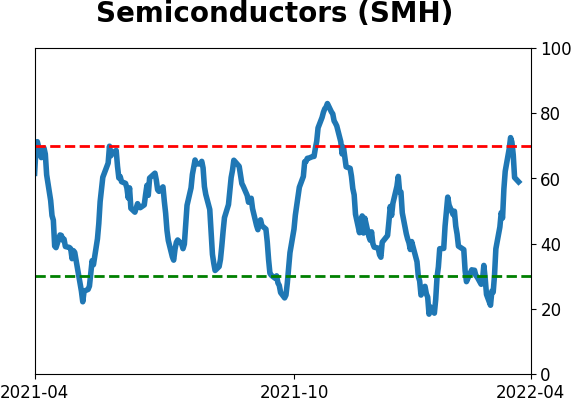
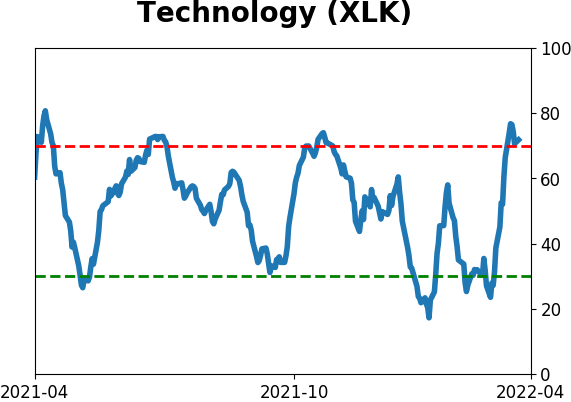
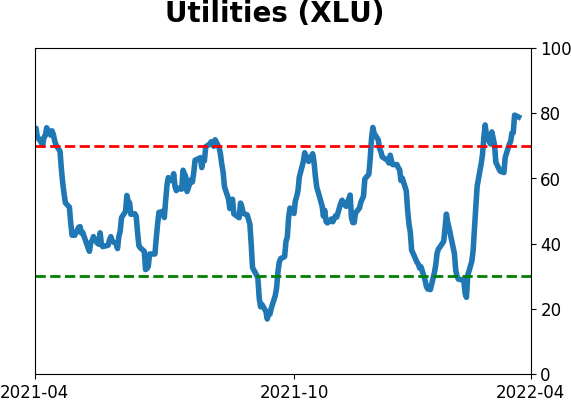
Sector ETF's - 10-Day Moving Average
|
|
|
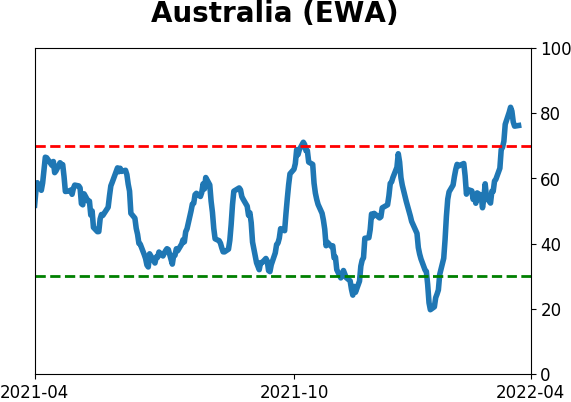
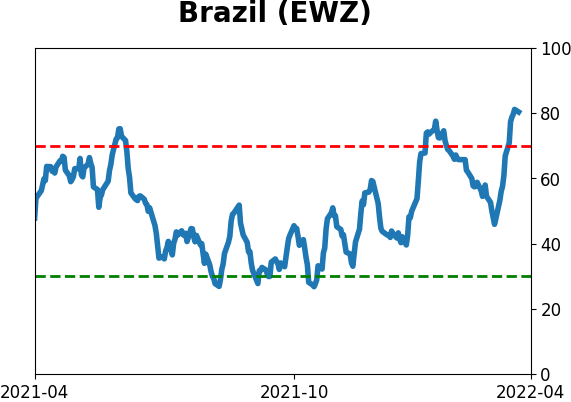
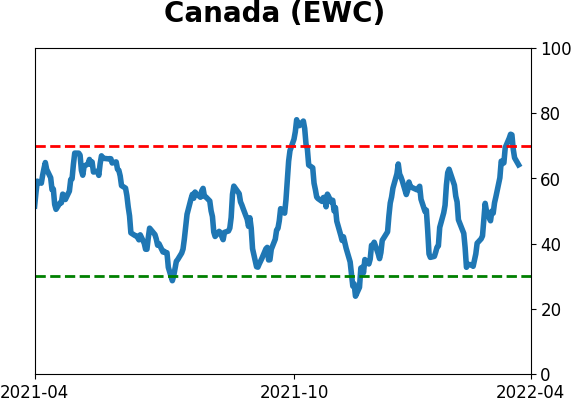
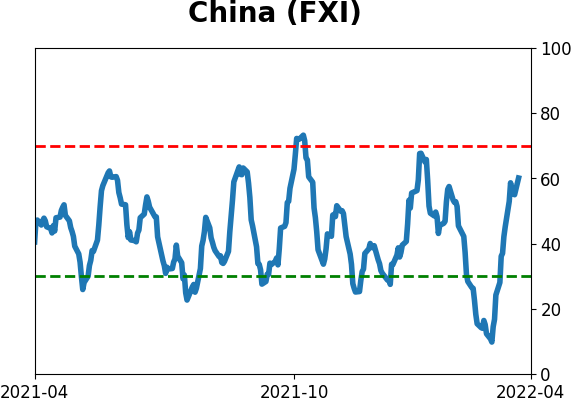
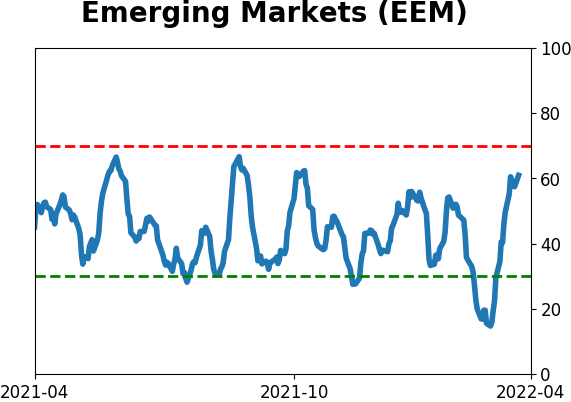
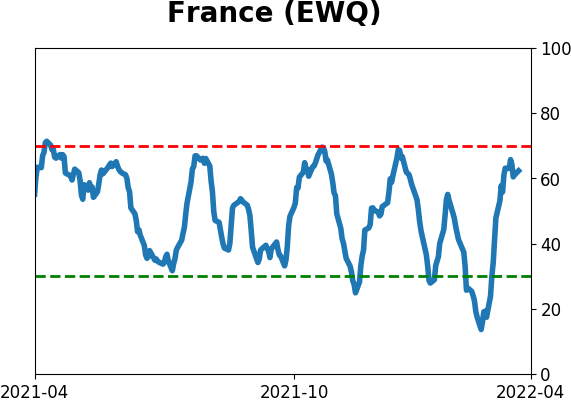
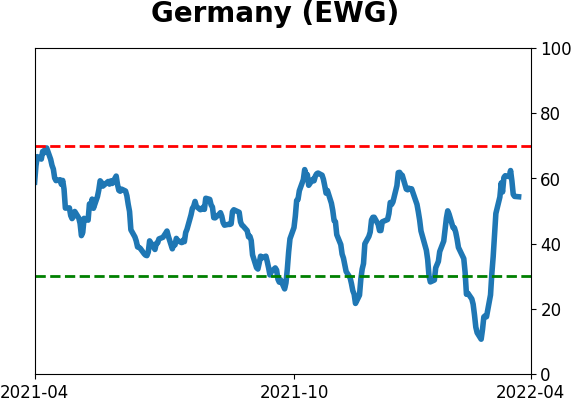
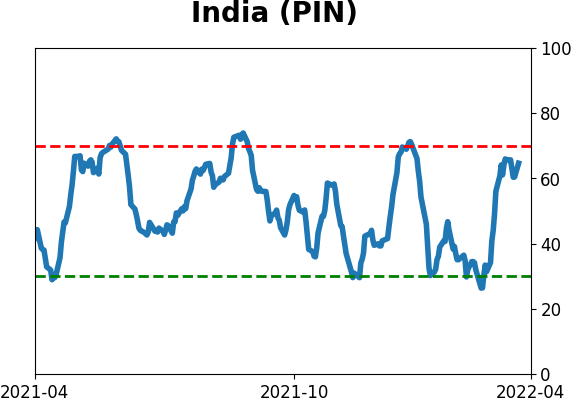
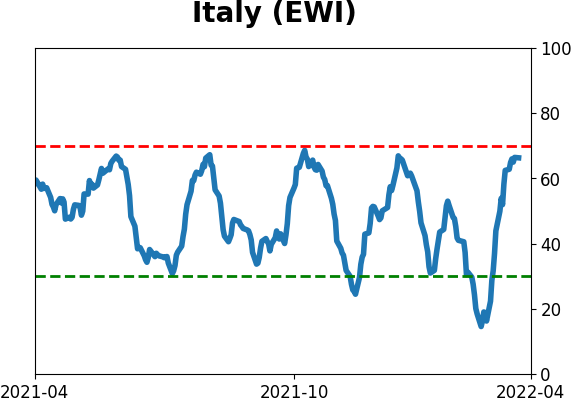
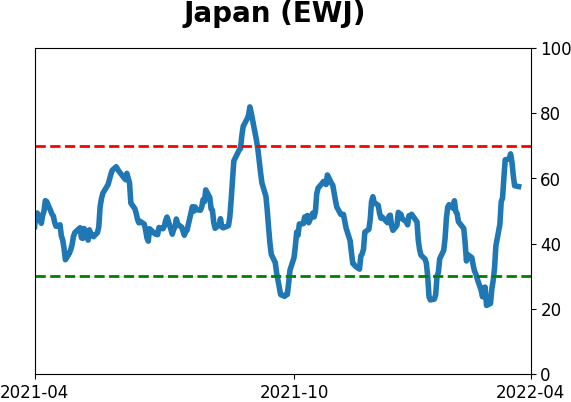
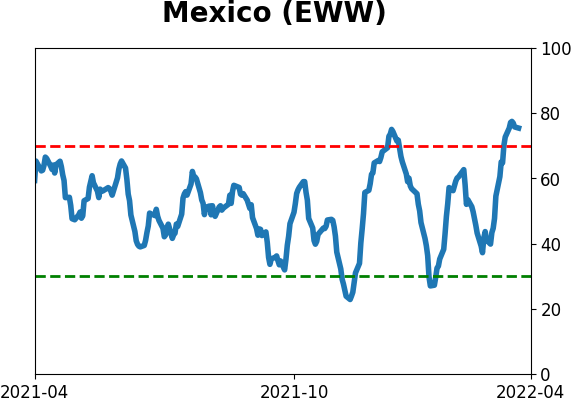
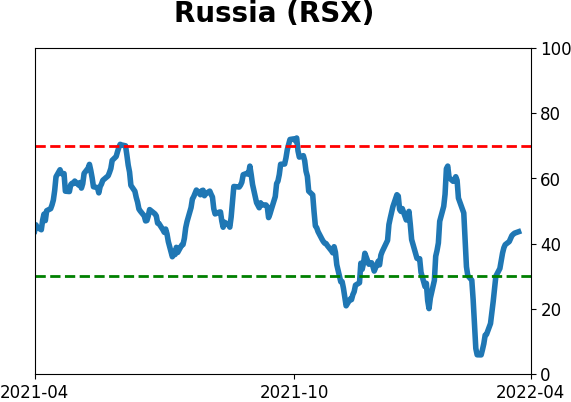
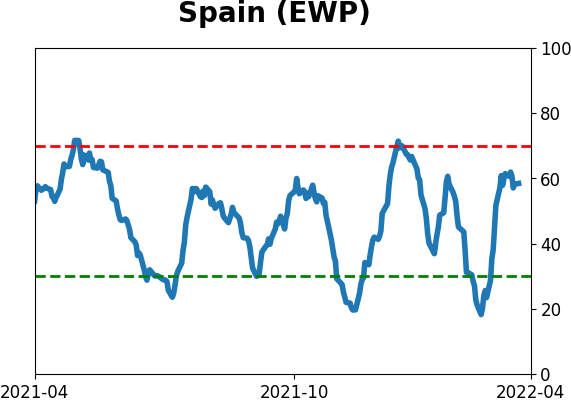
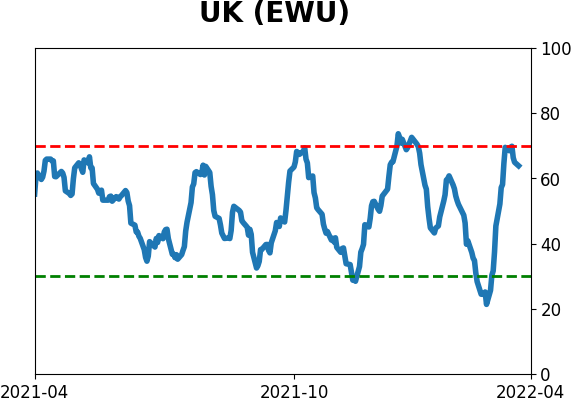
Country ETF's - 10-Day Moving Average
|
|
|
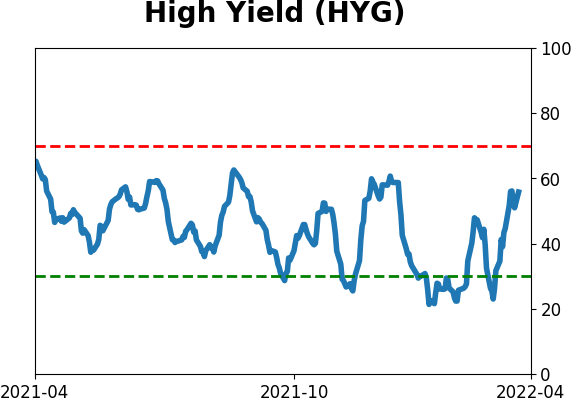
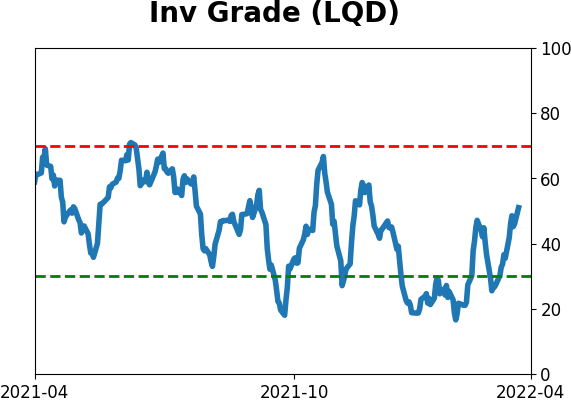
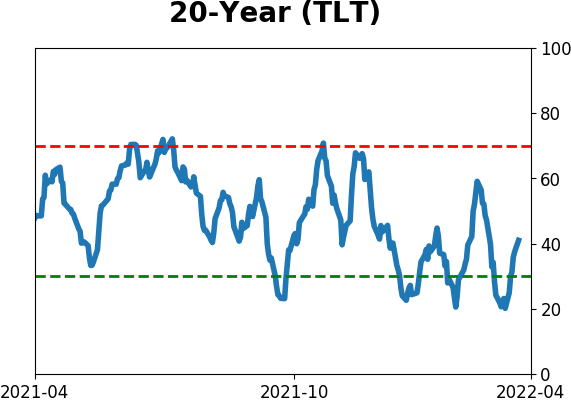
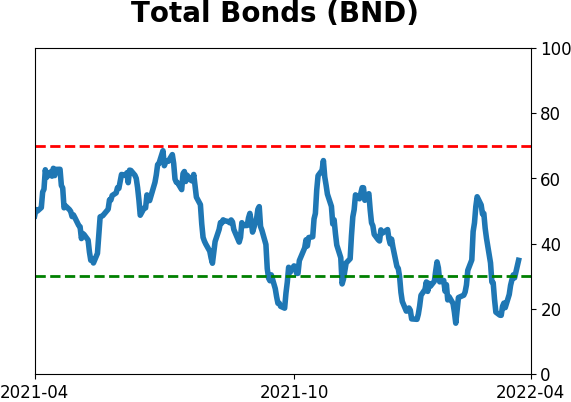
Bond ETF's - 10-Day Moving Average
|
|
|
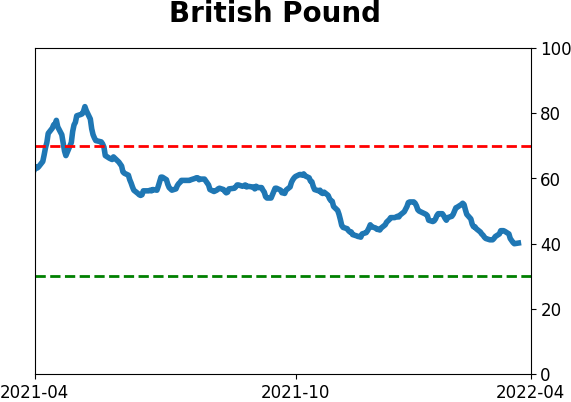
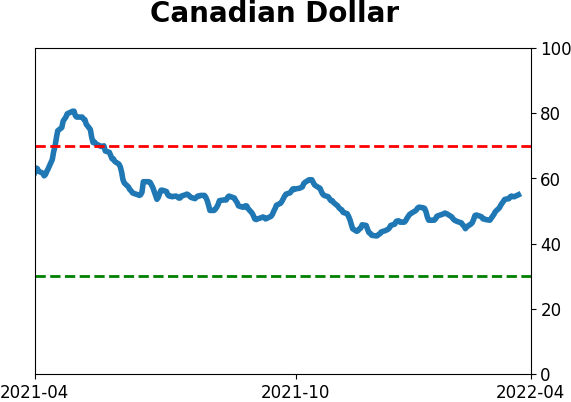
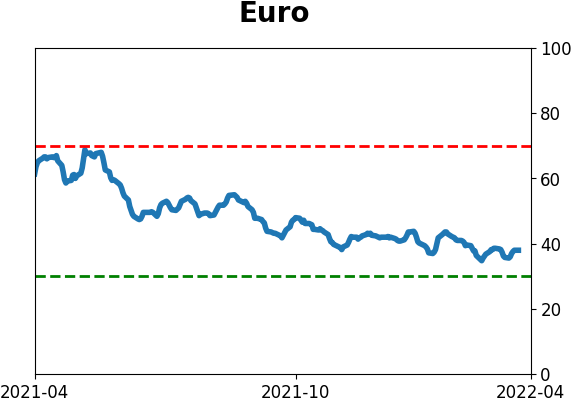
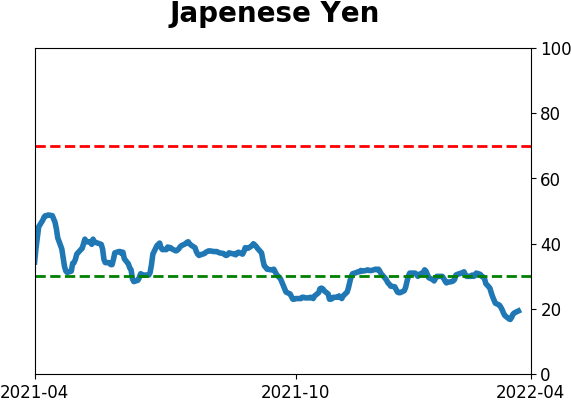
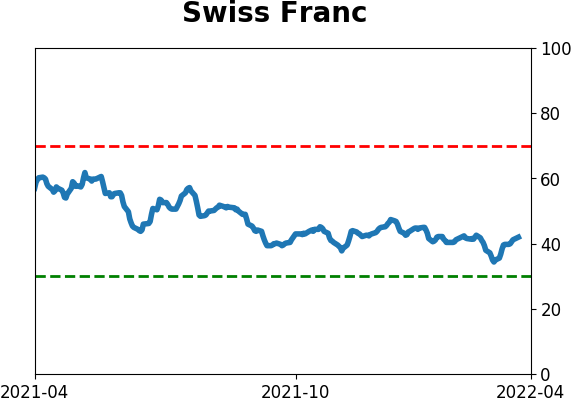
Currency ETF's - 5-Day Moving Average
|
|
|
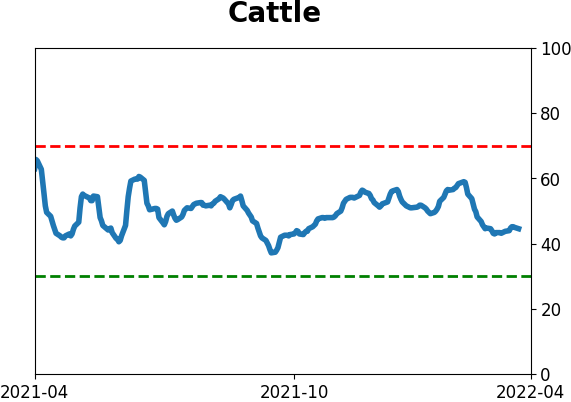
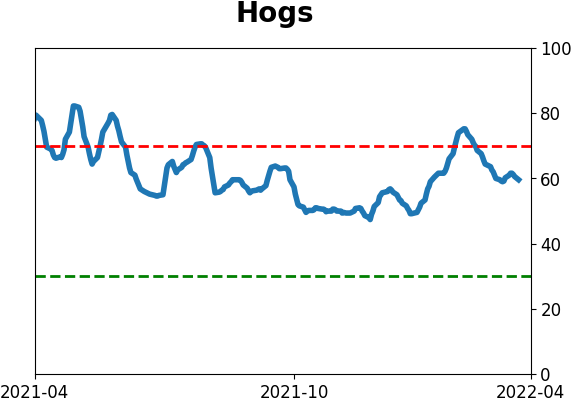
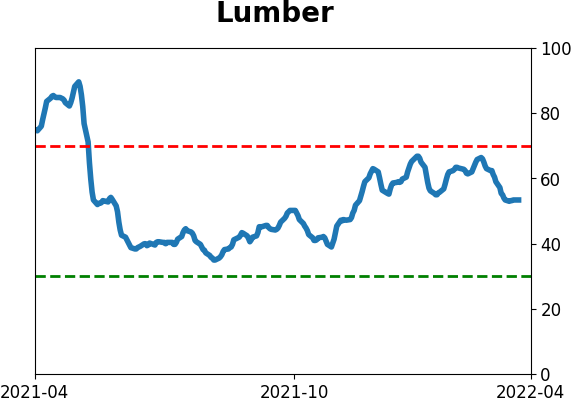
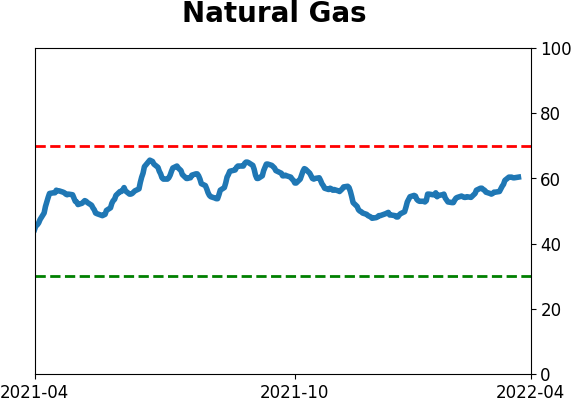
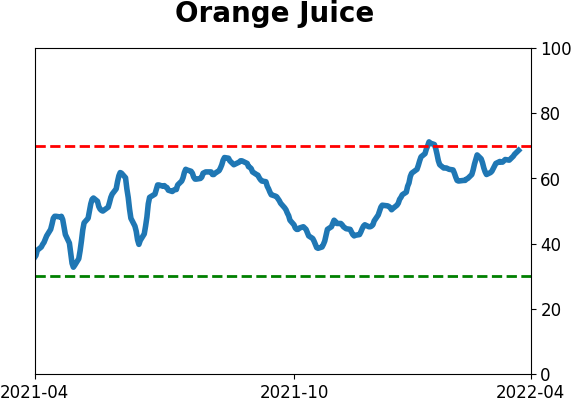
Commodity ETF's - 5-Day Moving Average
|
|