Headlines
|
|
The holy grail of breadth thrusts has triggered:
A Zweig Breadth Thrust was triggered for NYSE issues on Friday. Going back six decades, this has a perfect record at preceding further gains in the S&P 500, along with most sectors and factors. A signal also triggered using volume, an extremely rare combination. The McClellan Oscillator also triggered a historic reversal.
|
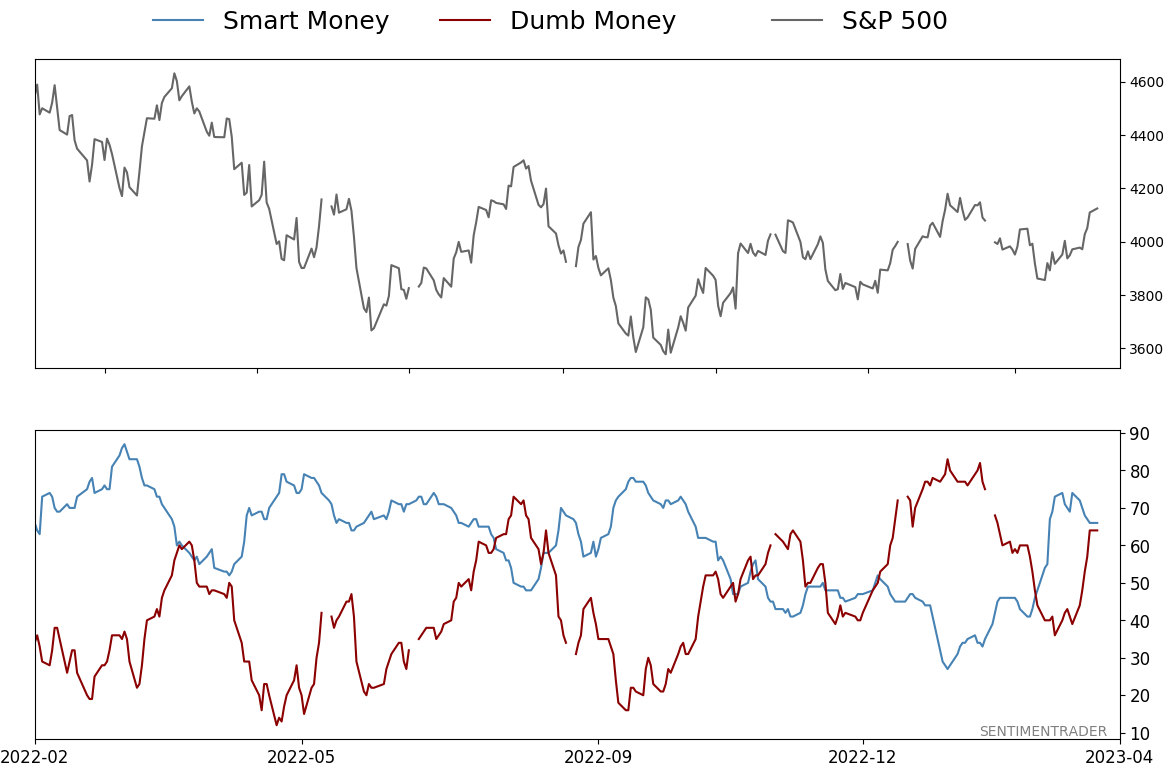
Smart / Dumb Money Confidence
|
Smart Money Confidence: 66%
Dumb Money Confidence: 64%
|
|
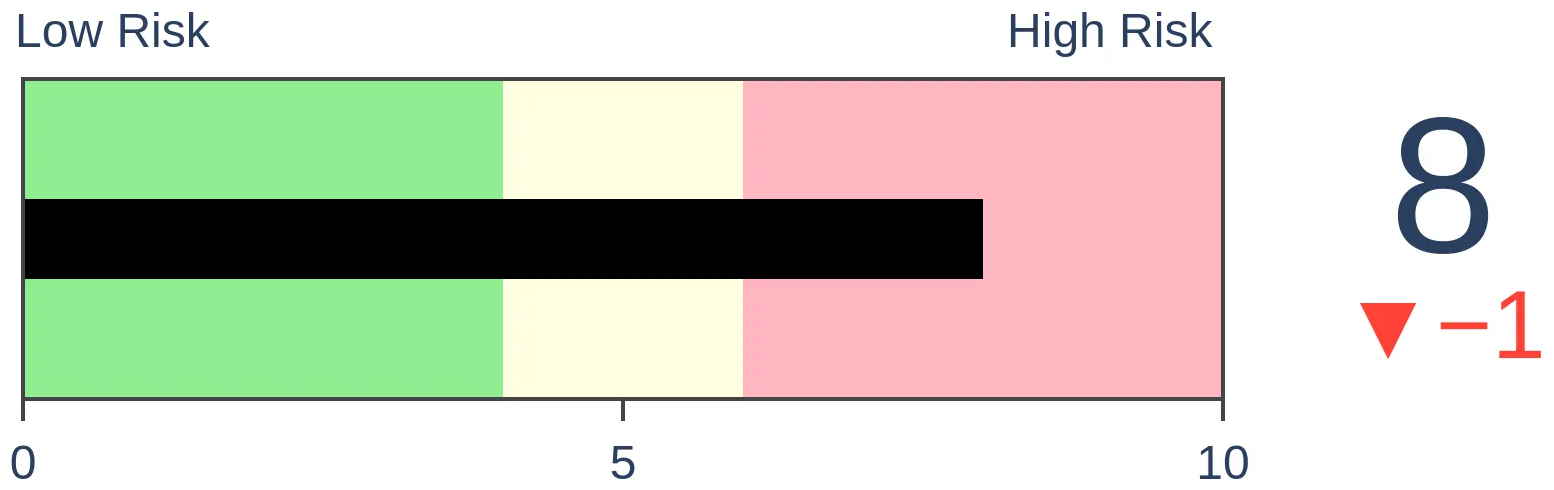
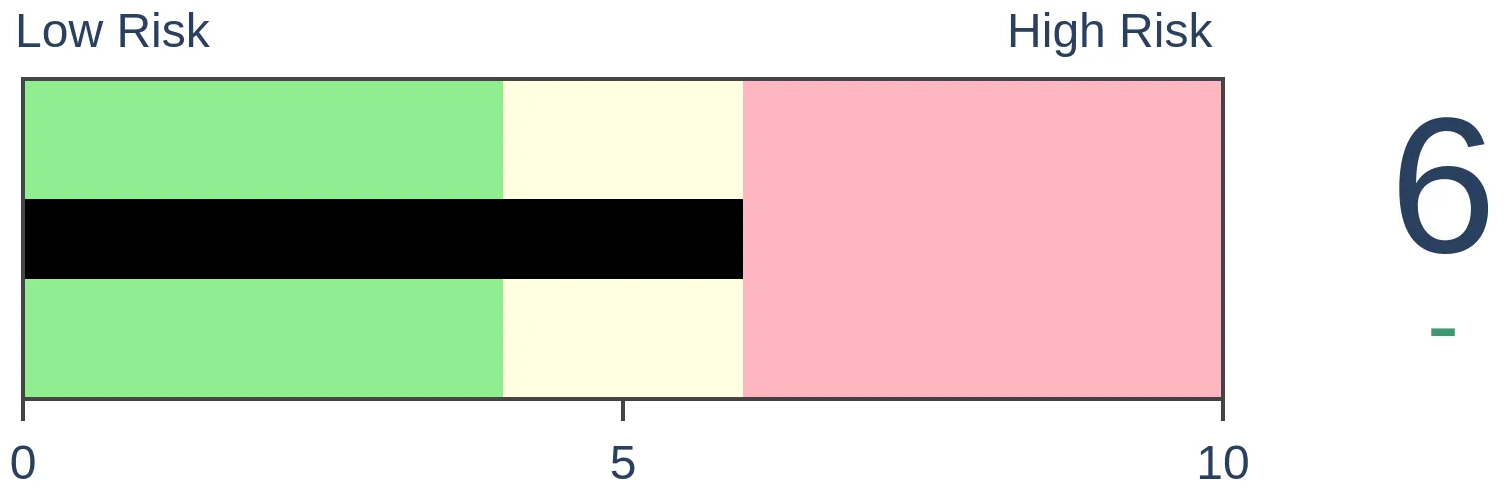
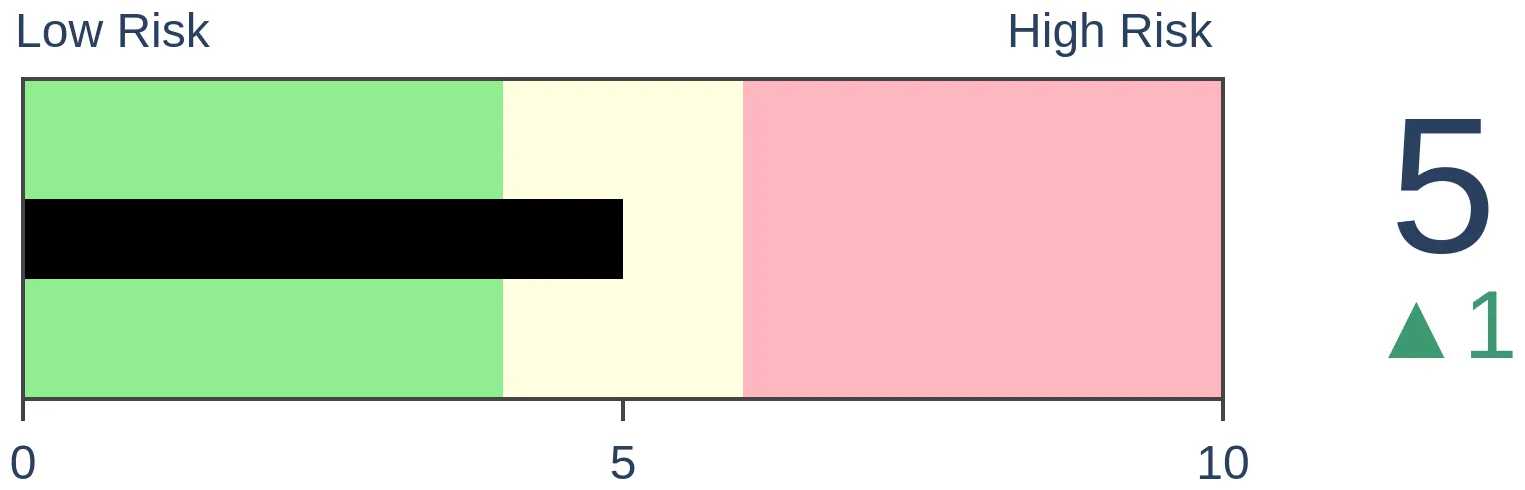
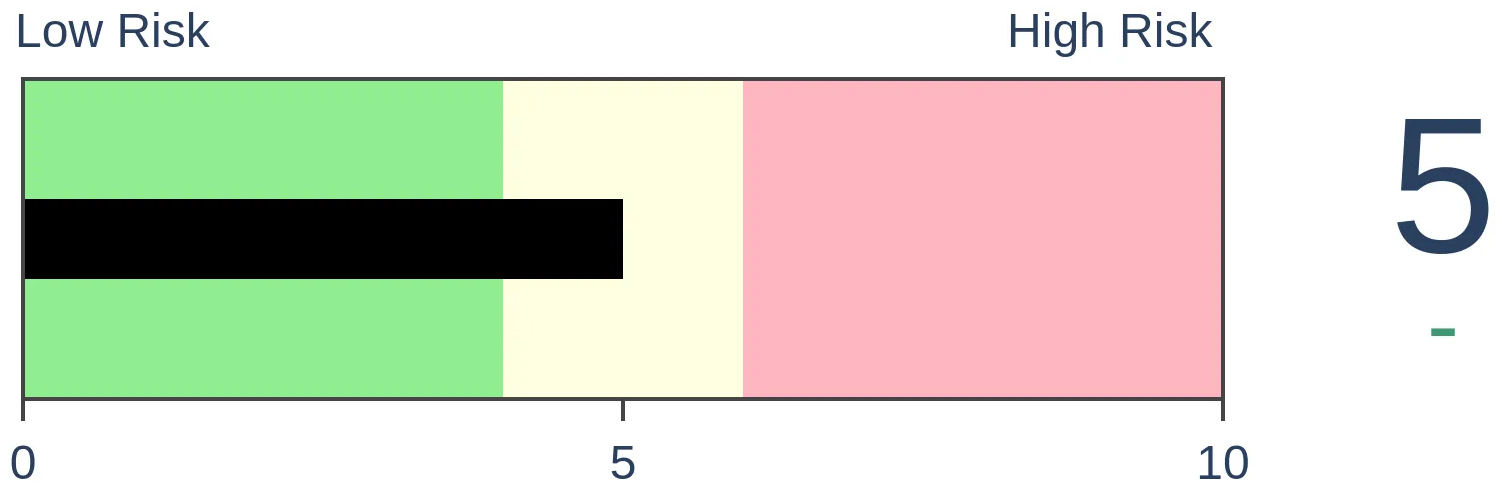
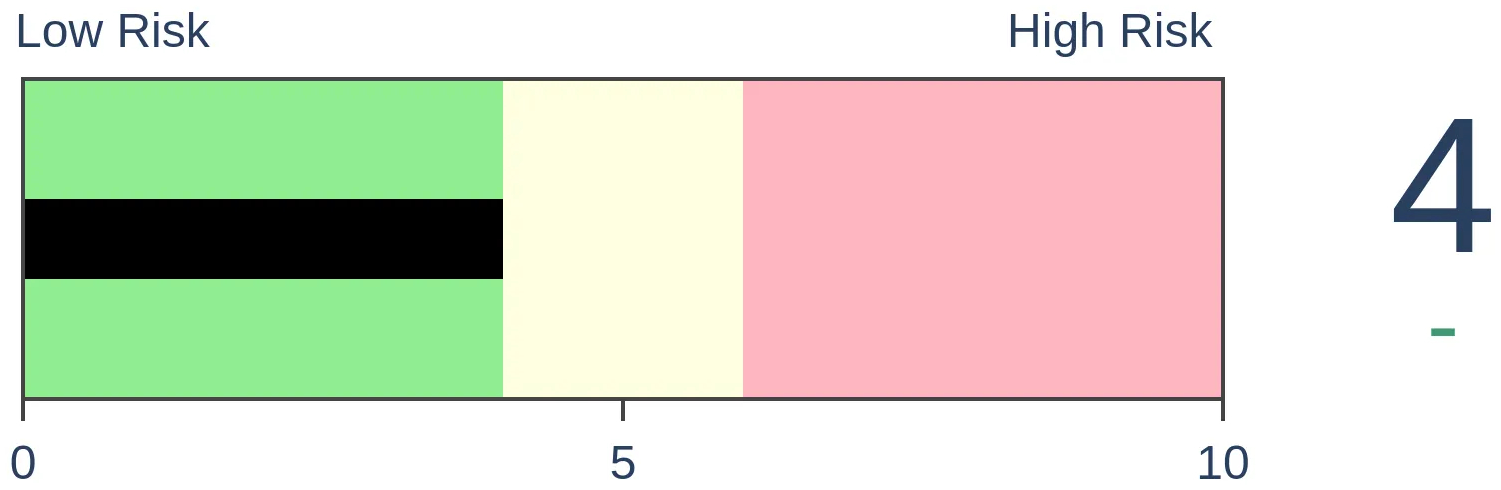
Risk Levels
Stocks Short-Term
|
Stocks Medium-Term
|
|
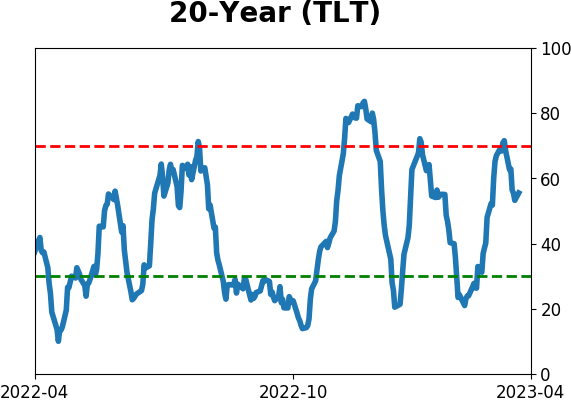
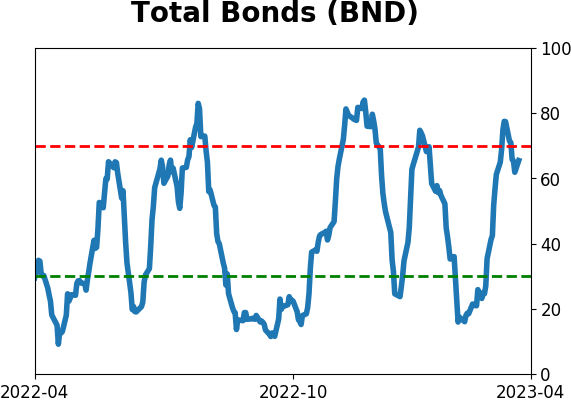
Bonds
|
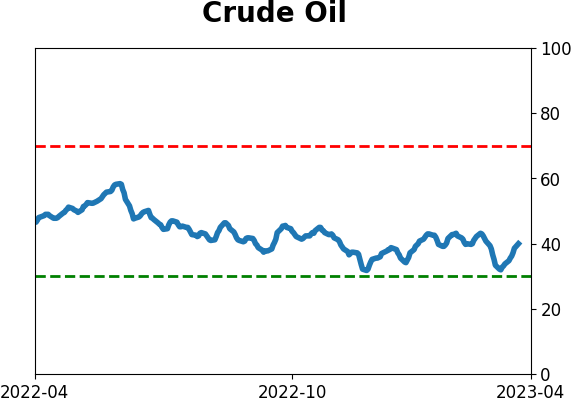
Crude Oil
|
|
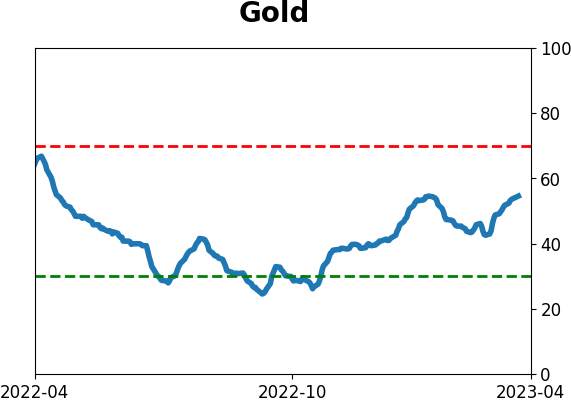
Gold
|
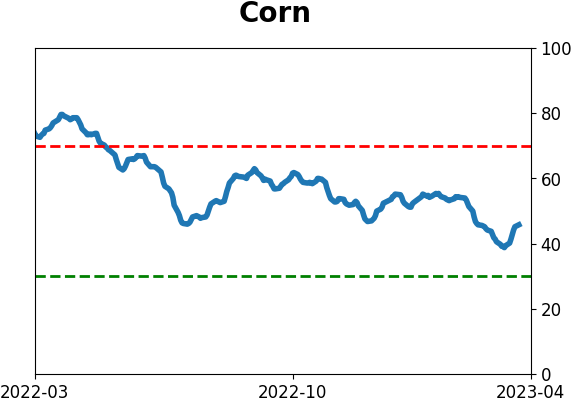
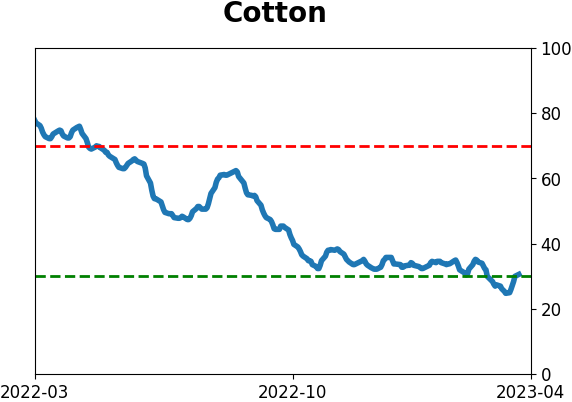
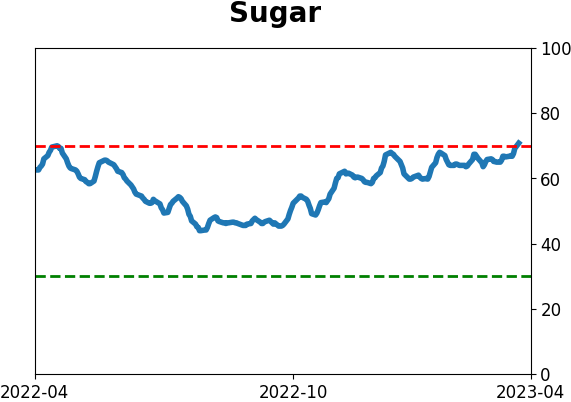
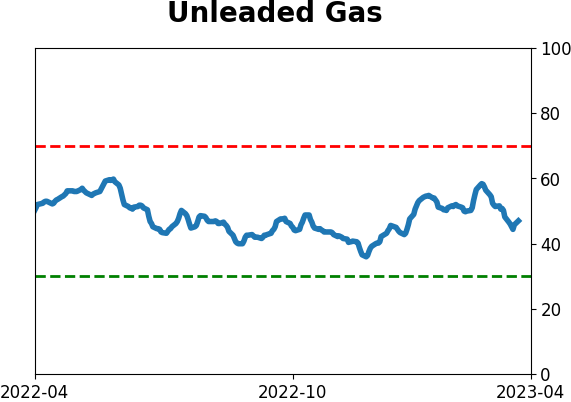
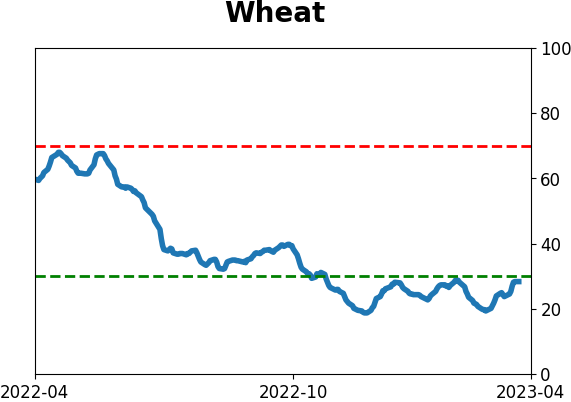
Agriculture

|
|
Research
By Jason Goepfert
BOTTOM LINE
A Zweig Breadth Thrust was triggered for NYSE issues on Friday. Going back six decades, this has a perfect record at preceding further gains in the S&P 500, along with most sectors and factors. A signal also triggered using volume, an extremely rare combination. The McClellan Oscillator also triggered a historic reversal.
FORECAST / TIMEFRAME
None
|
Key points:
- A Zweig Breadth Thrust triggered using NYSE issues on Friday
- A thrust also triggered using volume data, an exceptionally rare signal
- The McClellan Oscillator has also given a reversal buy signal
The holy grail of breadth thrusts
There are no rules when it comes to auction markets. There are many theories, heuristics, and mystical projections, but no actual rules. There cannot be when human emotions are involved.
Regarding technicals and breadth, the closest analysts have come to cementing a rule is the Zweig Breadth Thrust, named after the late money manager Marty Zweig. According to Investopedia:
The Breadth Thrust Indicator is a technical indicator used to ascertain market momentum. It is computed by calculating the number of advancing issues on an exchange, such as the New York Stock Exchange (NYSE), divided by the total number of issues (advancing + declining) on it, and generating a 10-day moving average of this percentage.
The indicator signals the start of a potential new bull market when it moves from a level of below 40% (indicating an oversold market) to a level above 61.5% within any 10-day period. This is a rarely occurring sentiment, which carries tremendous import with market watchers.
The chart below shows the indicator and the last triggered signal in January 2019. It didn't trigger during the March 2020 pandemic relief rally because it took a few days too long to unfold.

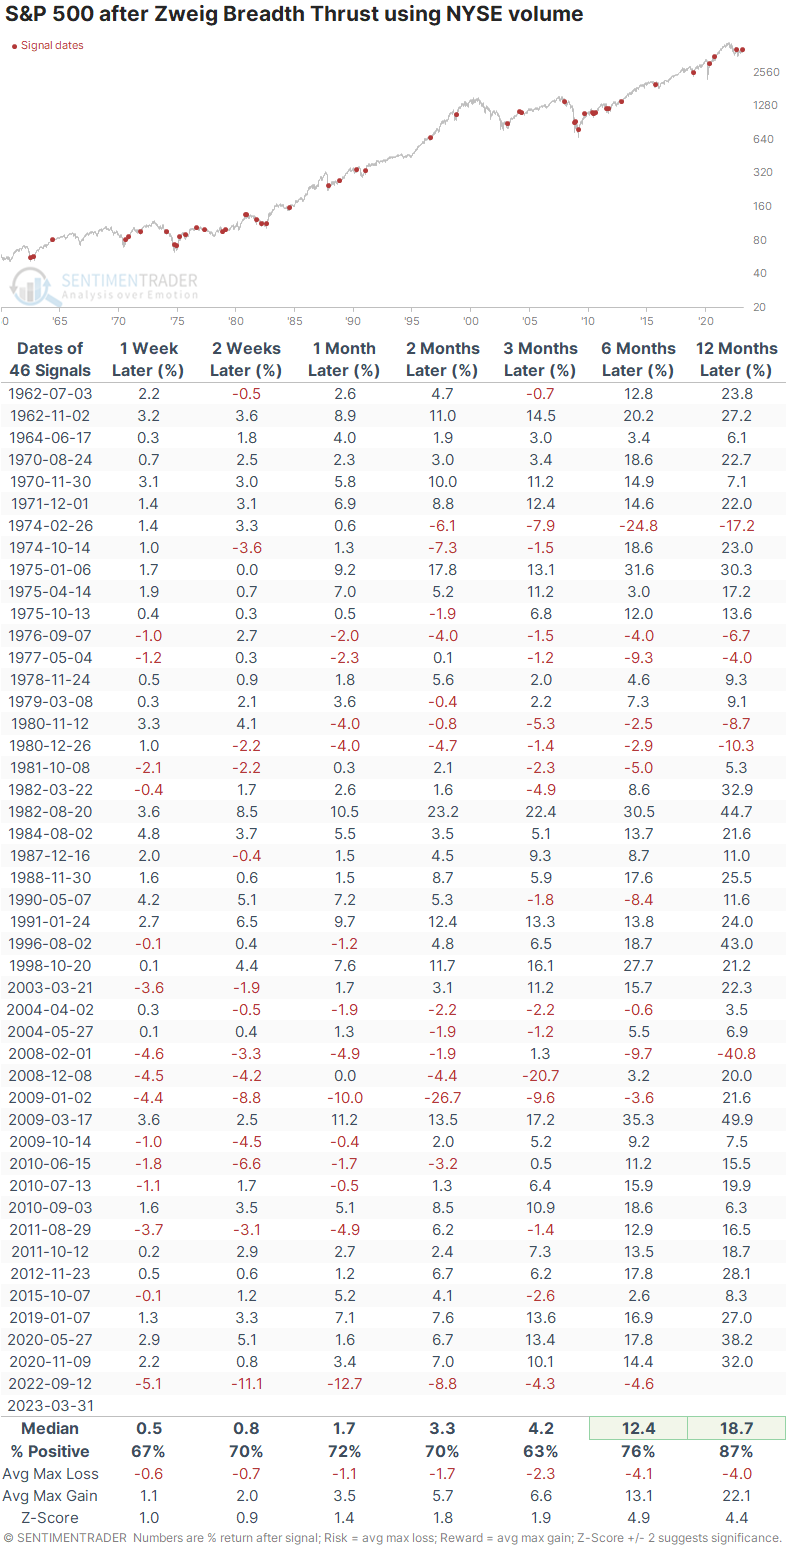
Our most reliable NYSE breadth data began in 1962, so the table below shows all similar signals from that date. There were no losses of any magnitude across any time frame after any signal.
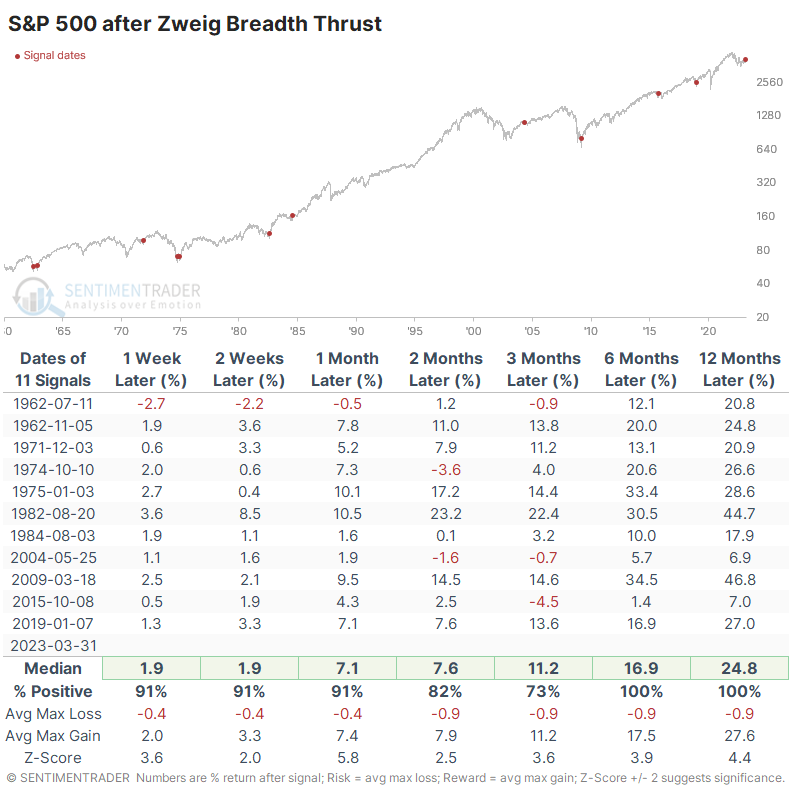
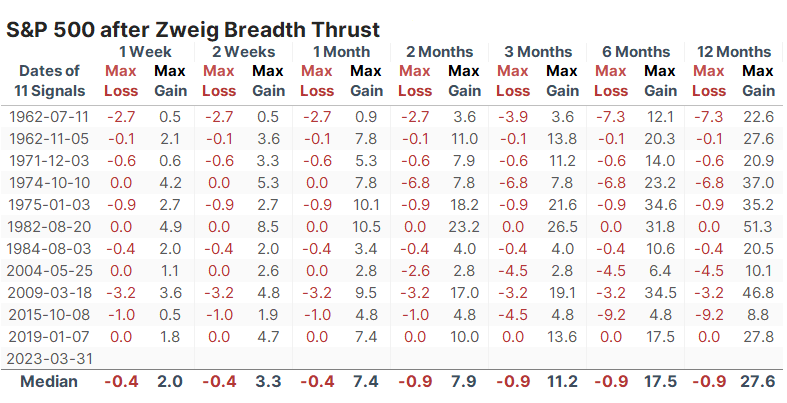
The table of maximum losses and gains across each time frame shows how bullish these signals have been for the S&P 500. Even up to a year later, no signal suffered more than a 9.2% pullback. Even a 5% pullback was rare within the following year.
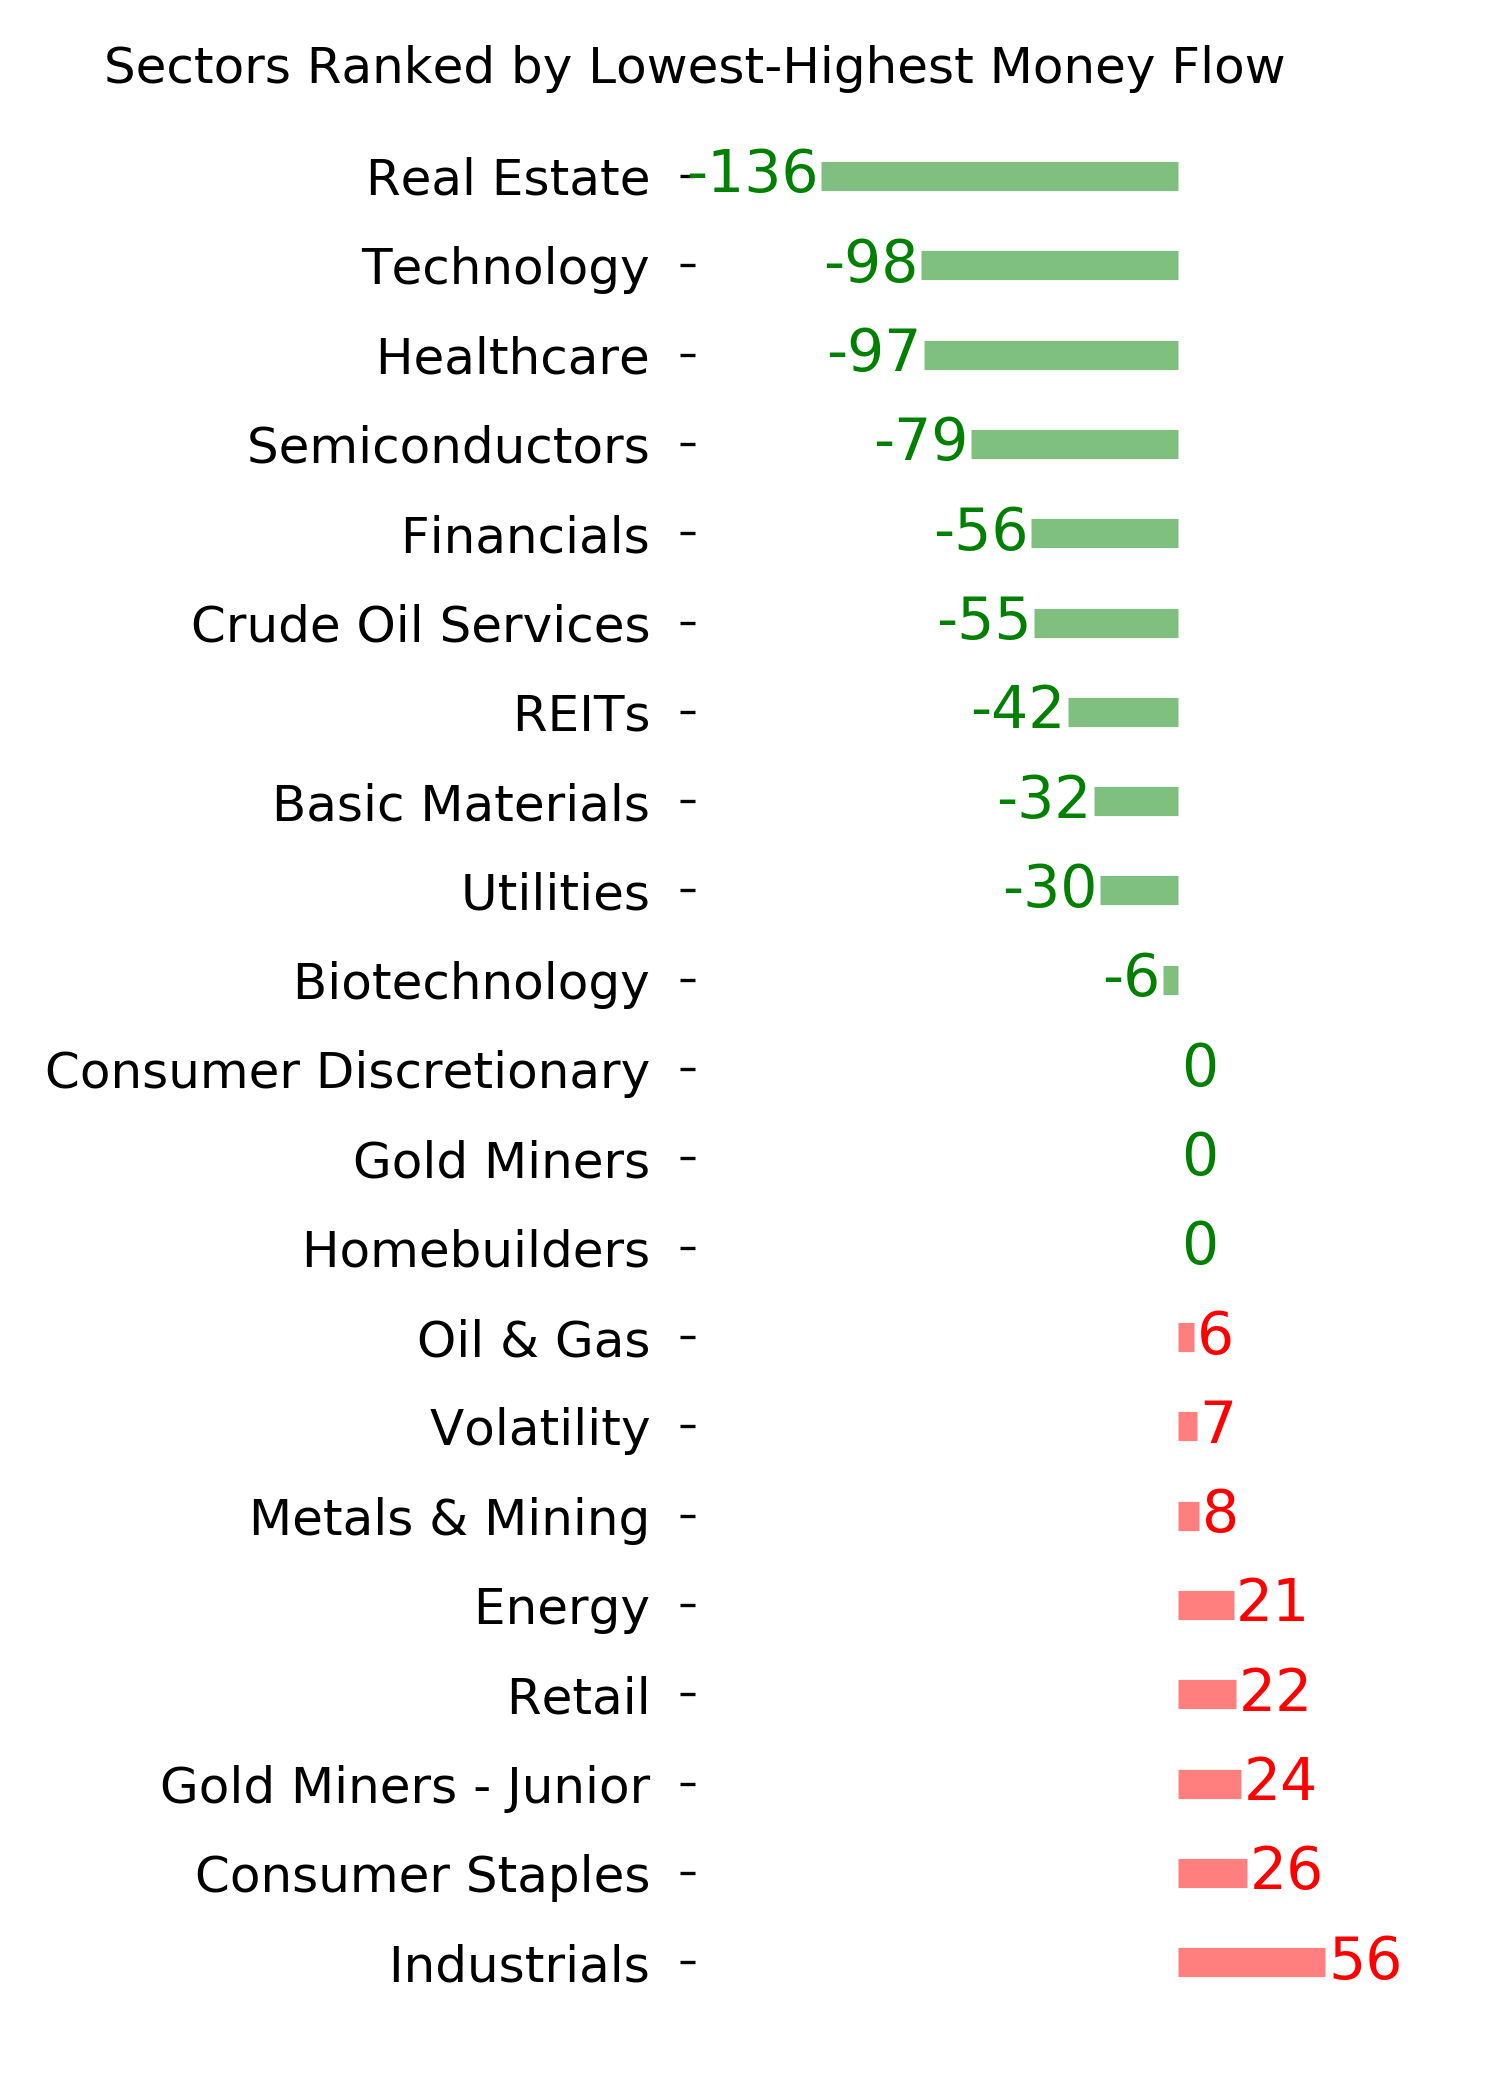
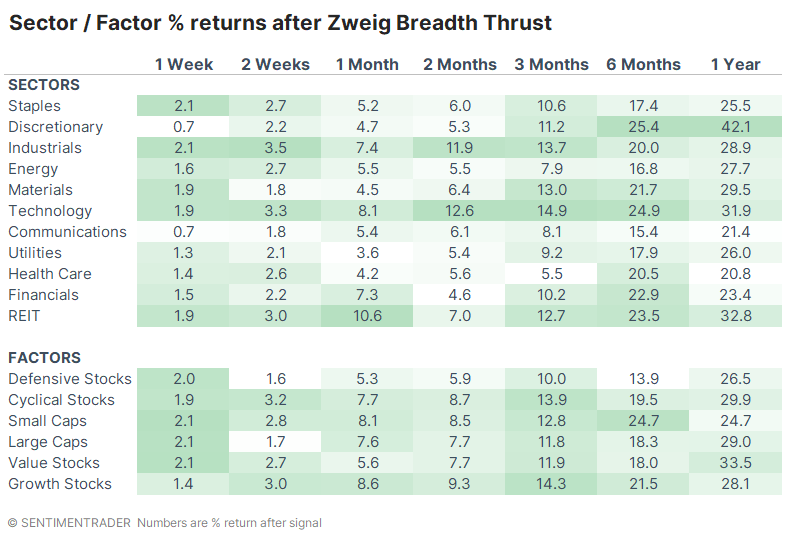
Among sectors, it was a sea of green, which isn't a big surprise. It's also not shocking that Discretionary, Industrials, and Technology showed among the strongest returns. Over the medium term, Small-Caps and Growth enjoyed the best returns.
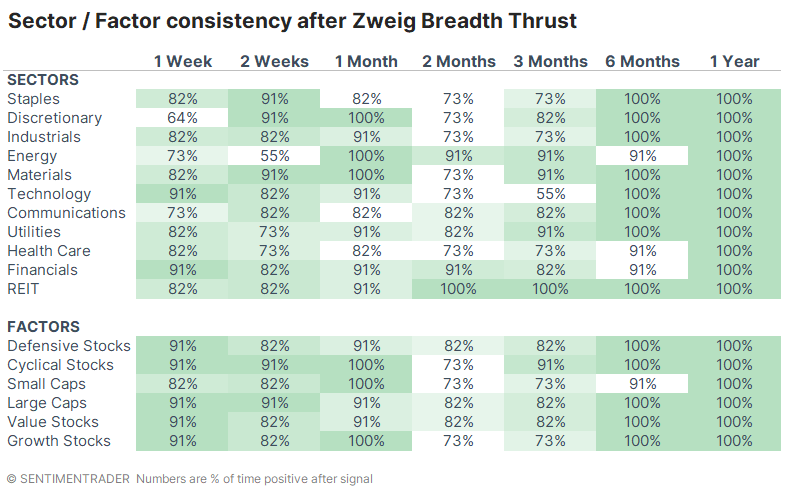
The following table shows the win rate for each sector and factor across time frames. Losses were rare to nonexistent.
Volume-based thrust also triggered
Because volume figures are more volatile than issues, there were many more signals using volume. And that included some false positives, with double-digit losses over the next 6-12 months. Even so, the S&P sported an average return of nearly +19% and an 87% win rate over the next year.
The current signal is one of the few times in history that the thrust triggered using both issues and volume. There were only two other dates when this occurred - the great 1982 bull market kickoff and 2019 following the Christmas Eve panic.
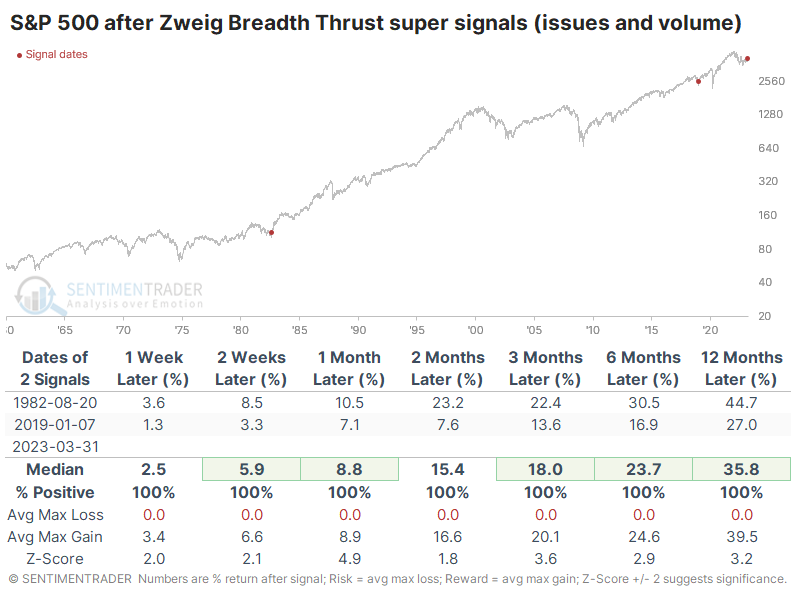
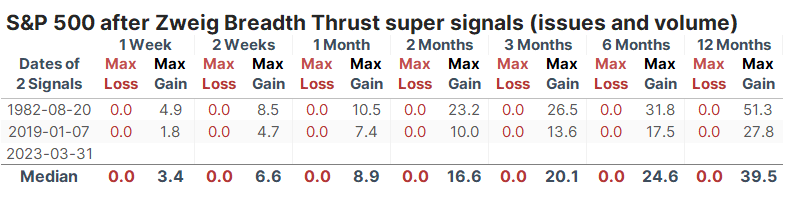
For grins and giggles, the table of maximum gains and losses shows none of the latter. The S&P never looked back after either signal.
The Oscillator also triggered a reversal signal
The impressive thrust in the number of rising stocks also triggered a rapid about-face in the NYSE McClellan Oscillator. Fewer than three weeks ago, the Oscillator was in deeply oversold territory; by Friday, it rocketed well into the overbought zone.
When the Oscillator has been above +85 since 1962, the S&P 500 returned an annualized -3.0%, so there was usually some short-term backing and filling after such high readings.
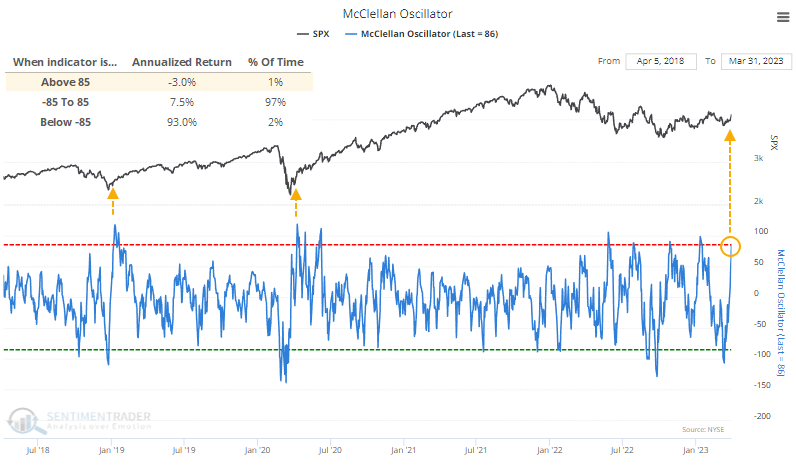
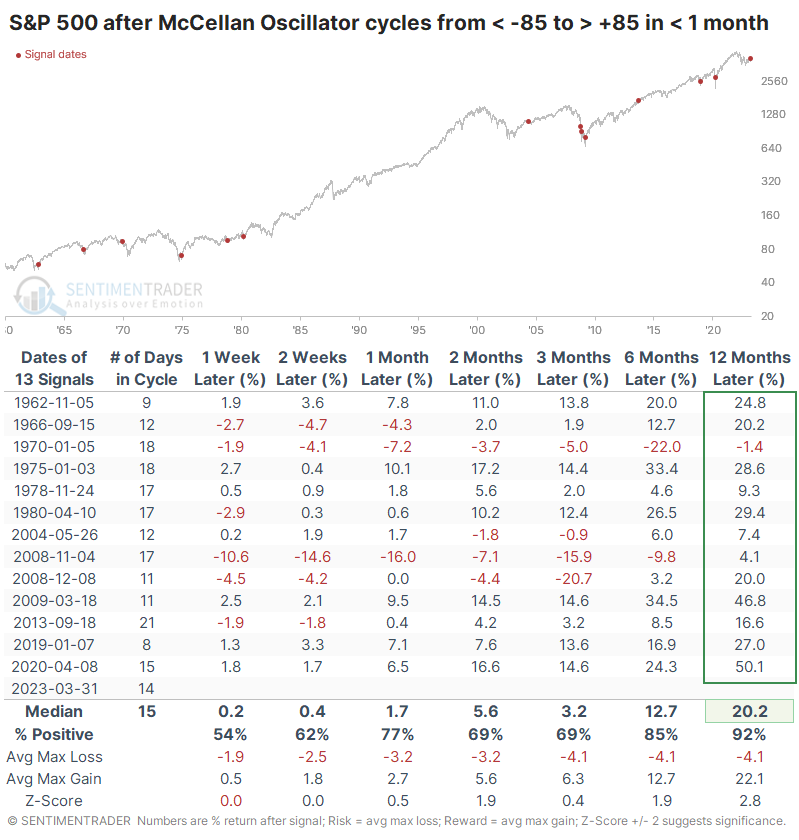
Context is critical, and the context of the current overbought reading is that it occurred soon after an equivalent oversold reading. The table below shows every time the Oscillator cycled from below -85 to above +85 within a month.
It didn't prevent some indigestion within the next few months - three signals suffered larger than 20% drawdowns - but all but one signal showed a gain over the next year, and the sole loser was negligible.
What the research tells us...
Over the past year, we've noted multiple times that breadth-based data has become ubiquitous and may become less reliable as a signal. There was some evidence that could be the case in 2022, with some failed signals, but it has worked well since last fall. The closest analysts interested in breadth have come to a holy grail is the Zweig Breadth Thrust, a rare and impressive signal that has worked for decades with no actual failures. After the multitude of bullish signals since October, the fact that it and other reliable breadth-based thrusts have triggered again is another good sign.
Indicators at Extremes
Phase Table
Ranks
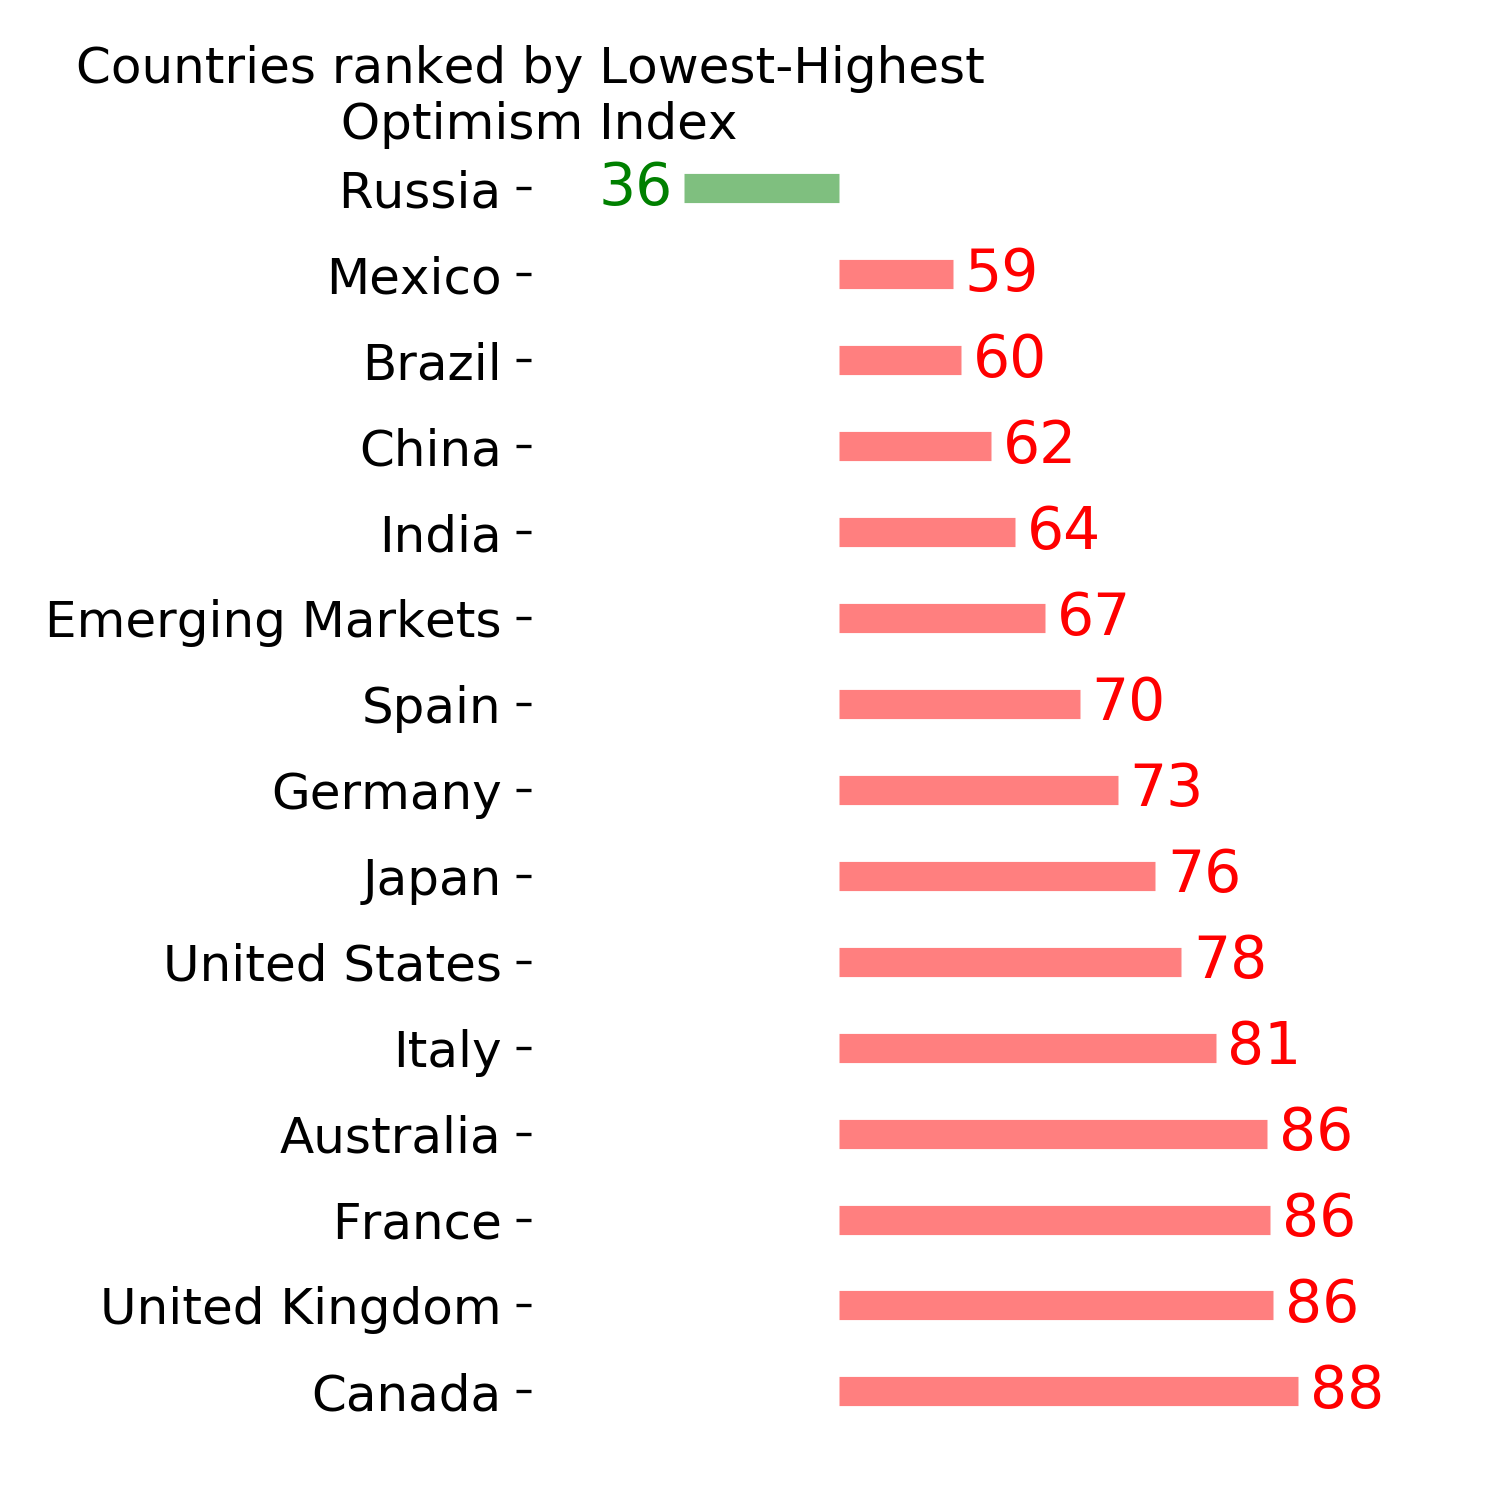
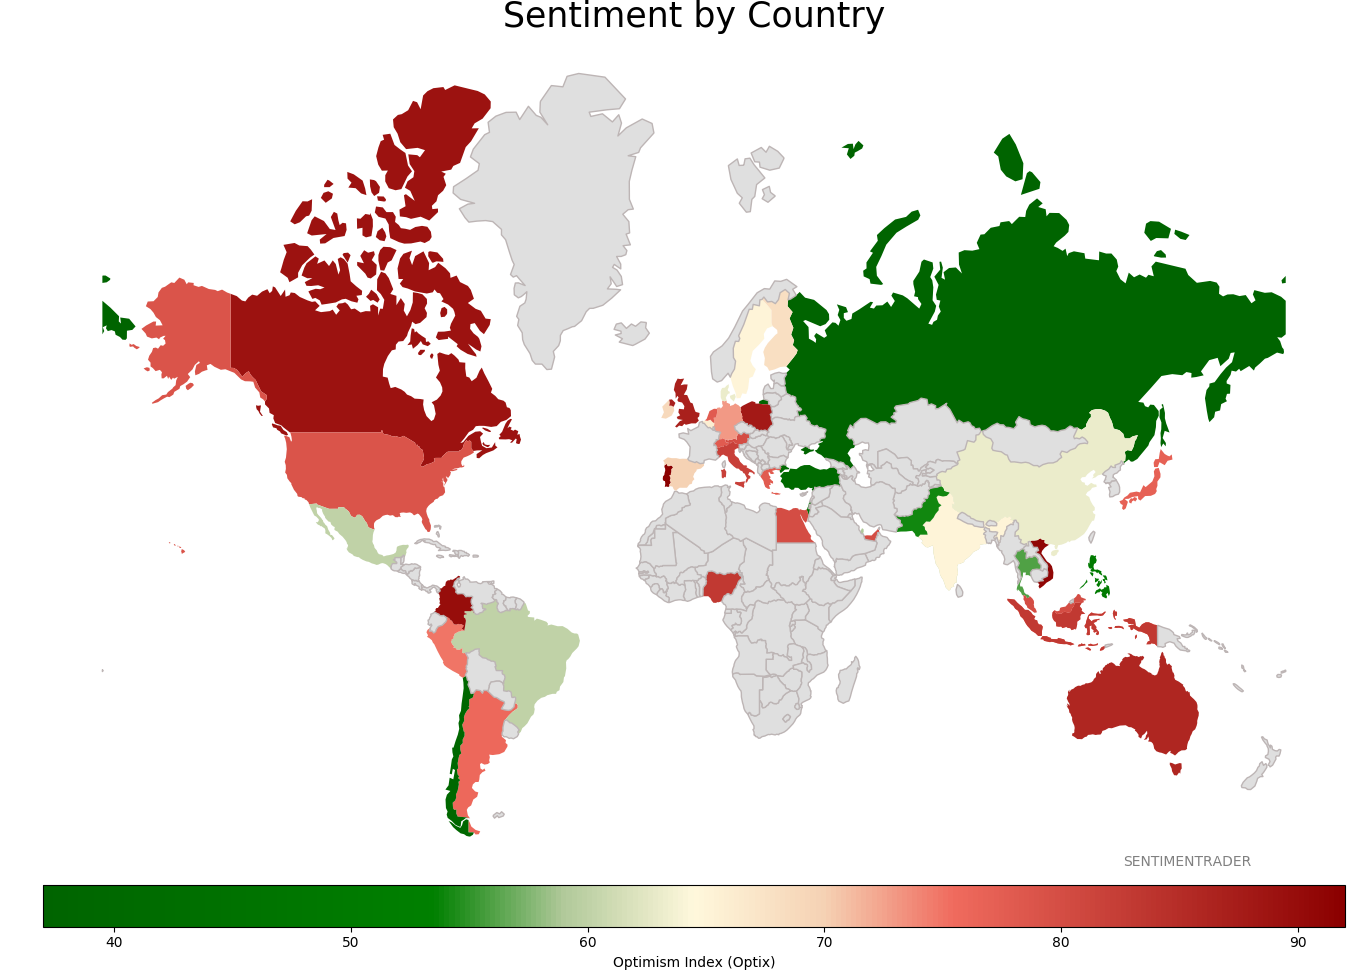
Sentiment Around The World
Optimism Index Thumbnails
|
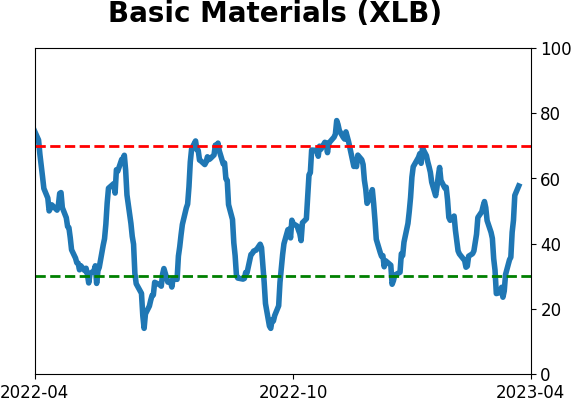
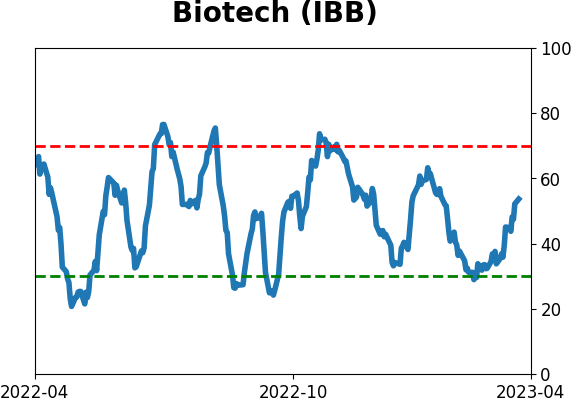
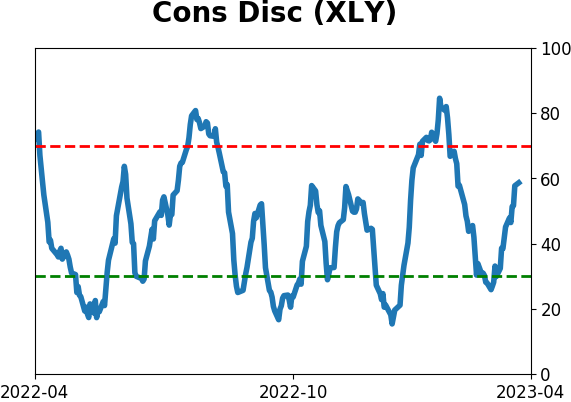
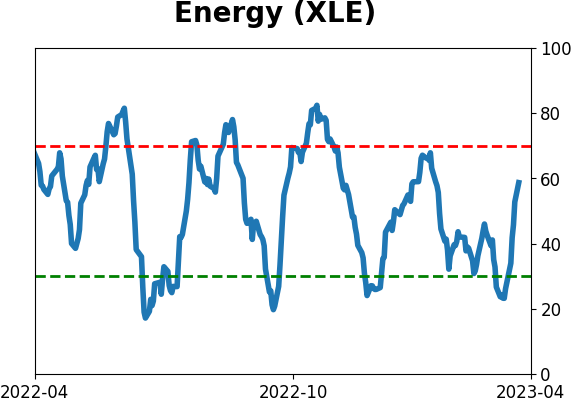
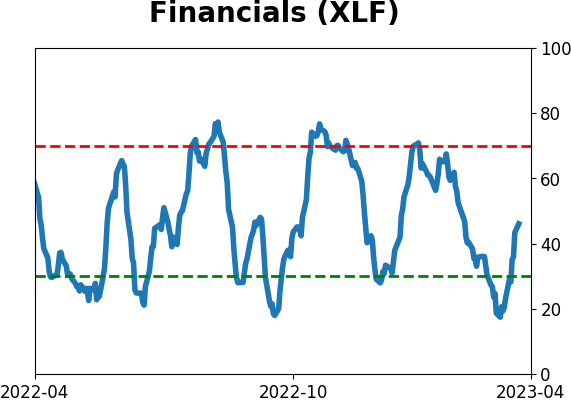
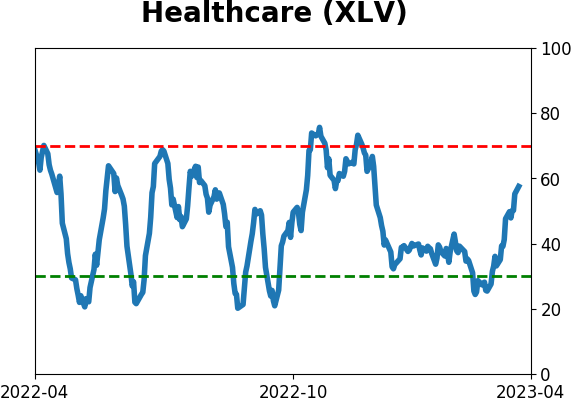
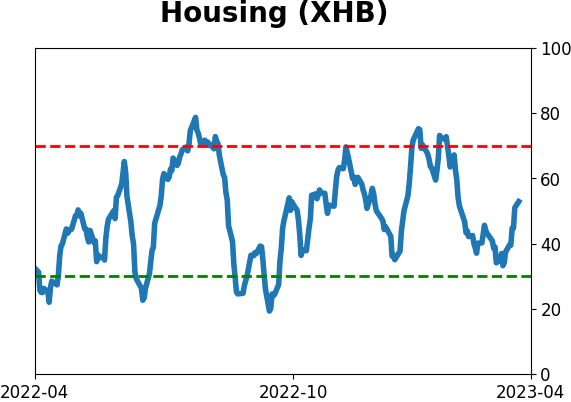
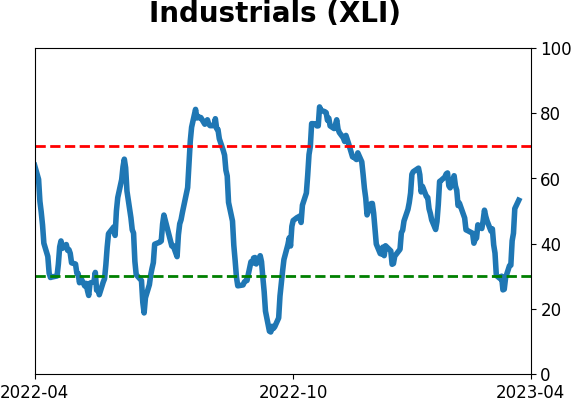
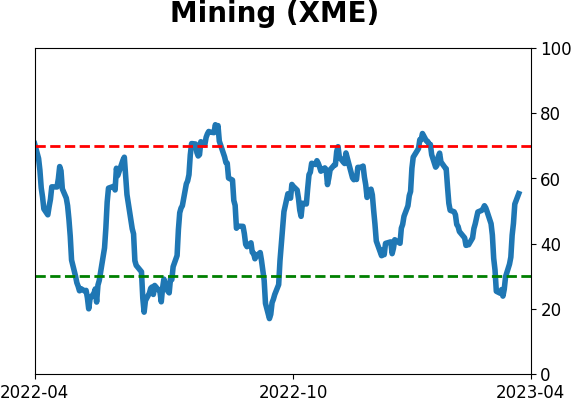
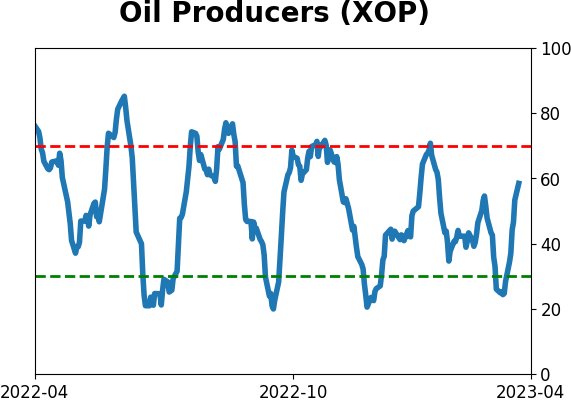
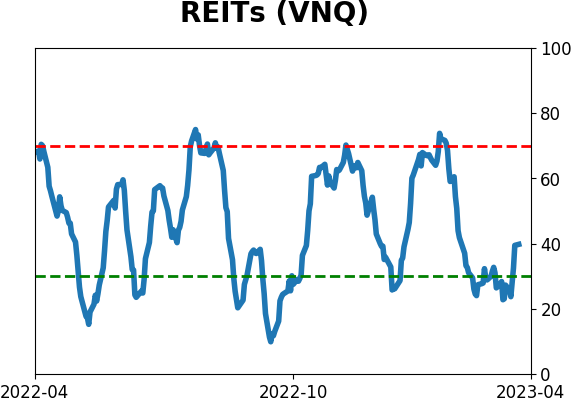
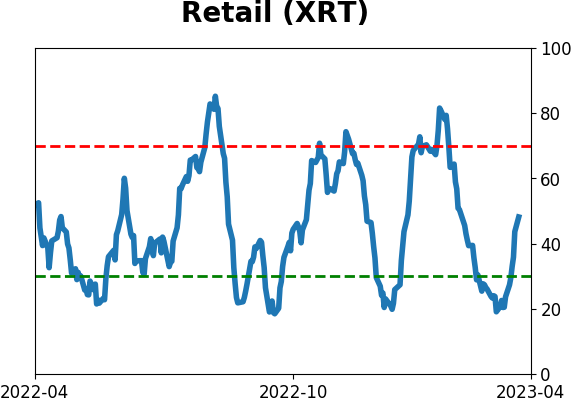
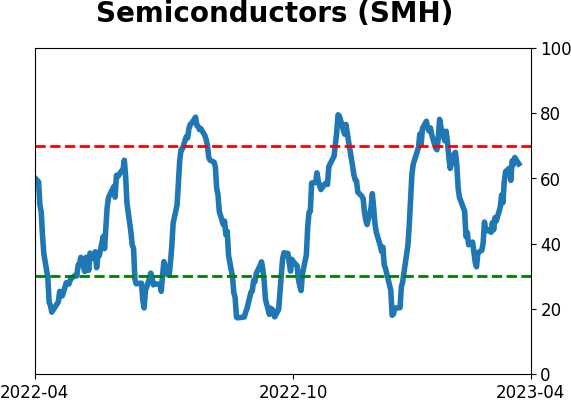
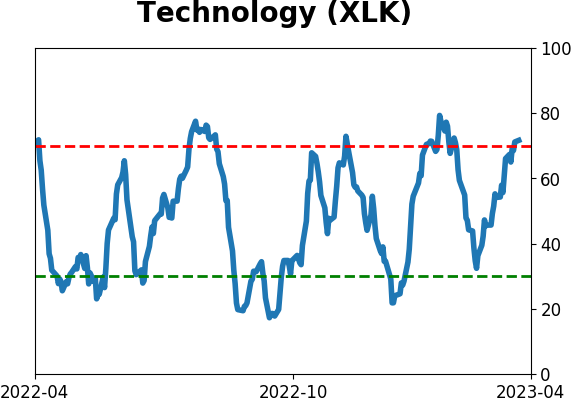
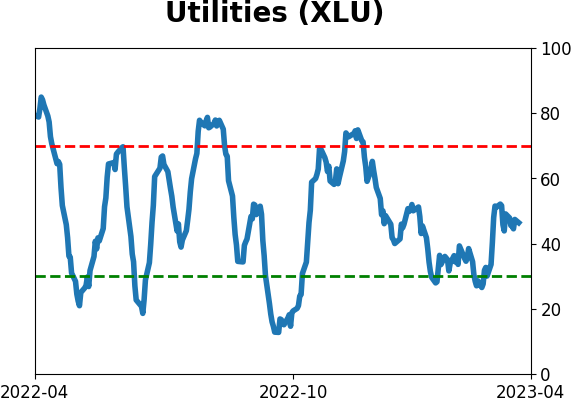
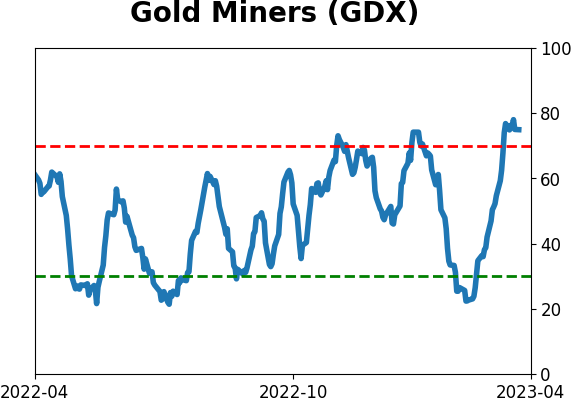
Sector ETF's - 10-Day Moving Average
|
|
|
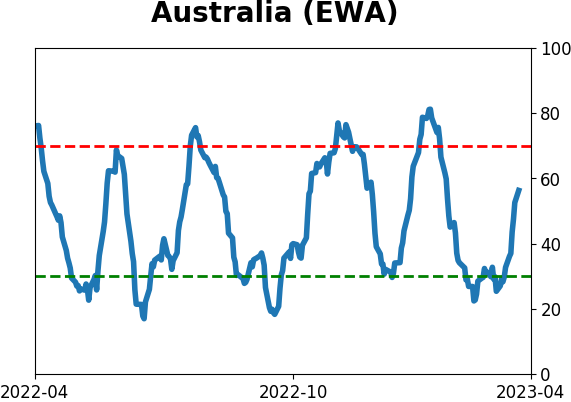
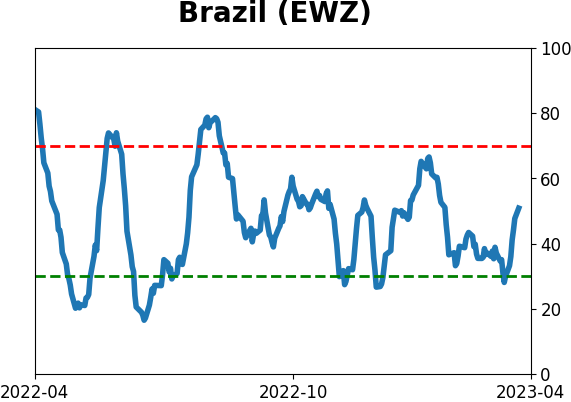
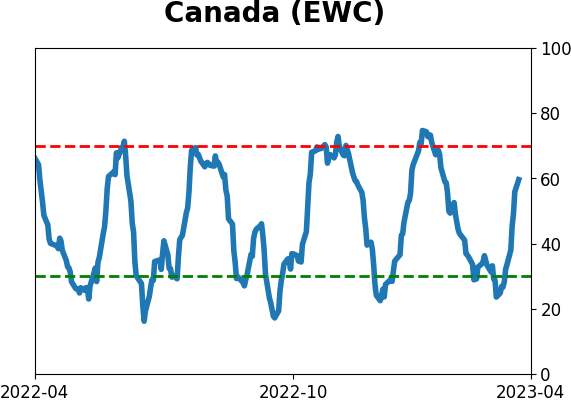
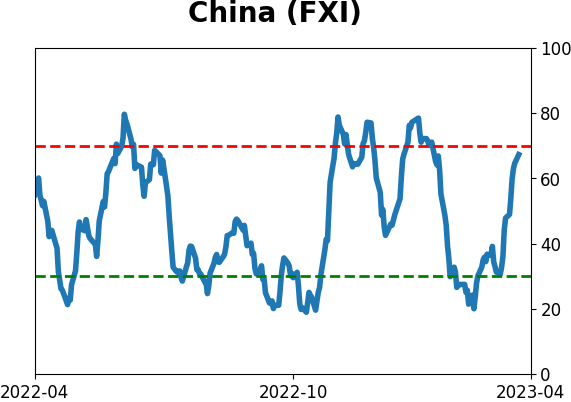
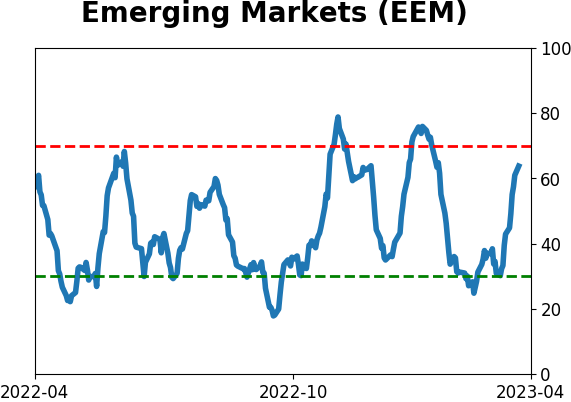
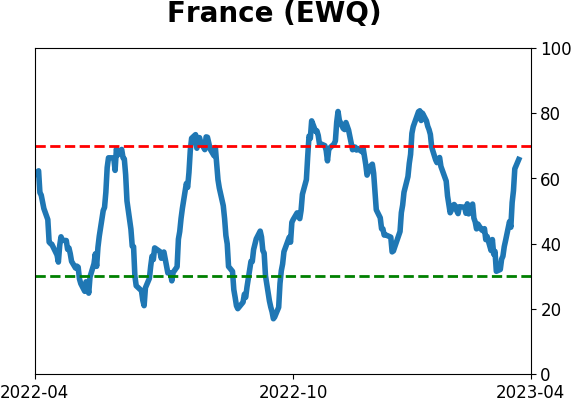
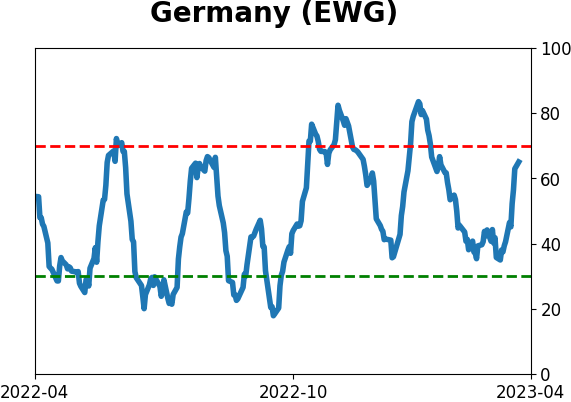
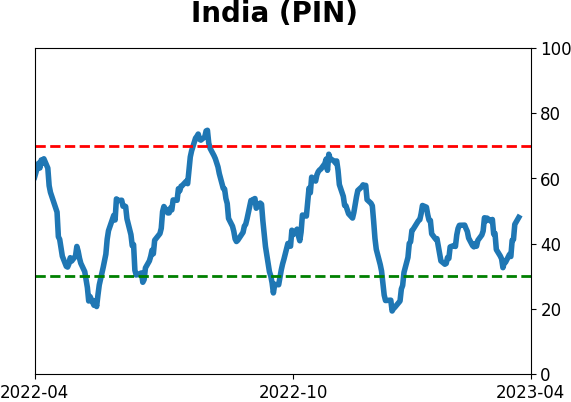
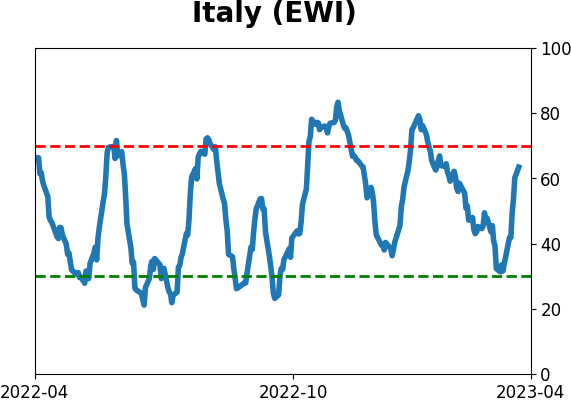
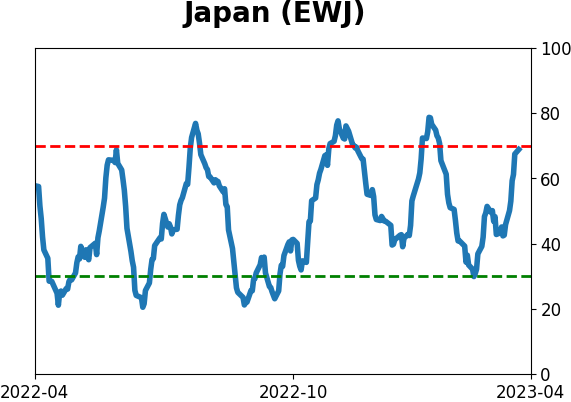
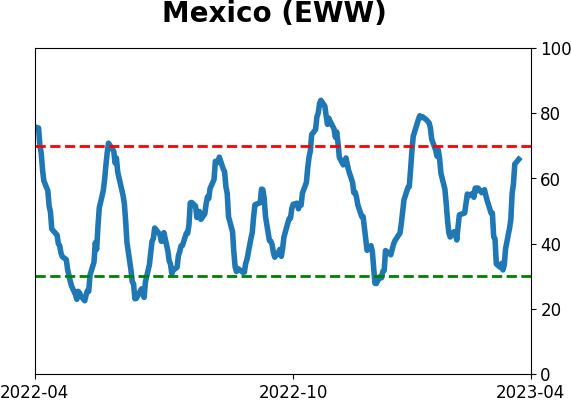
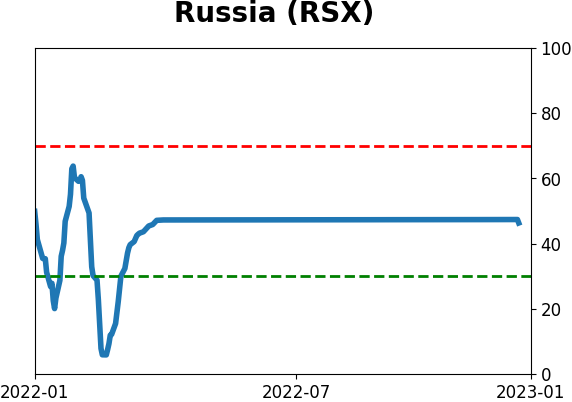
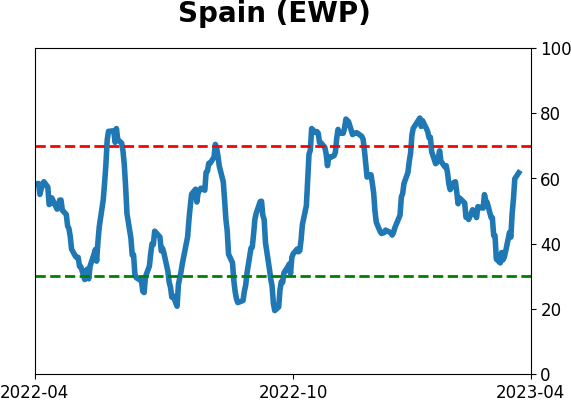
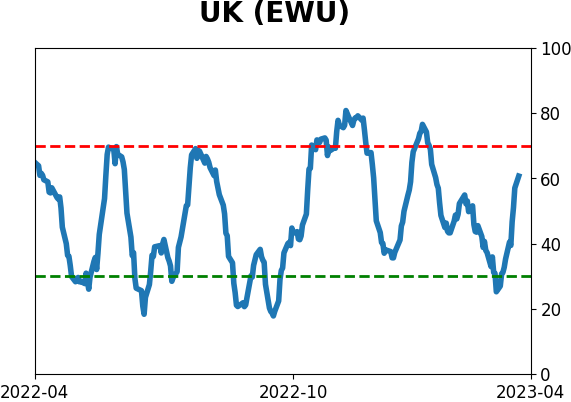
Country ETF's - 10-Day Moving Average
|
|
|
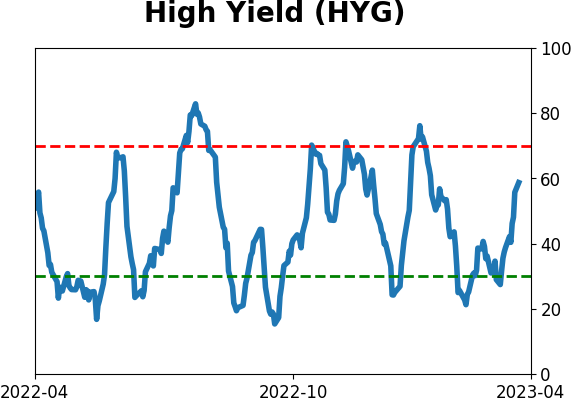
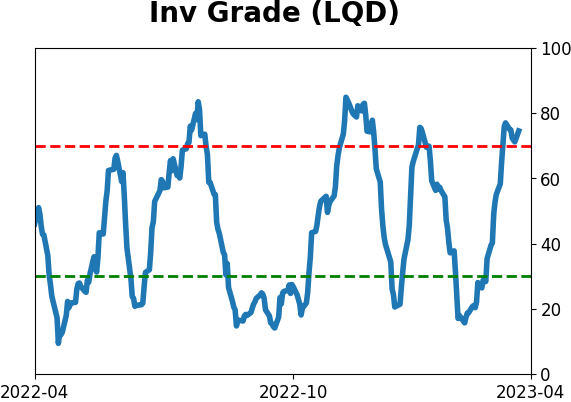
Bond ETF's - 10-Day Moving Average
|
|
|
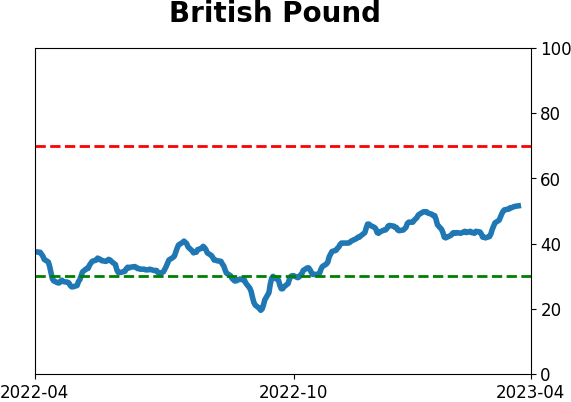
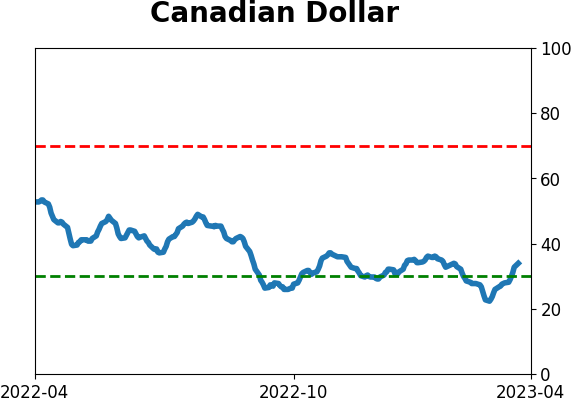
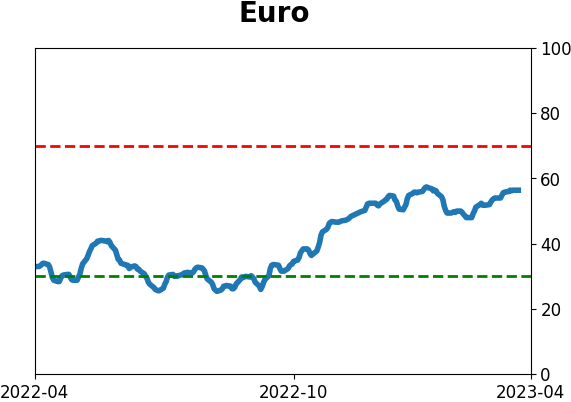
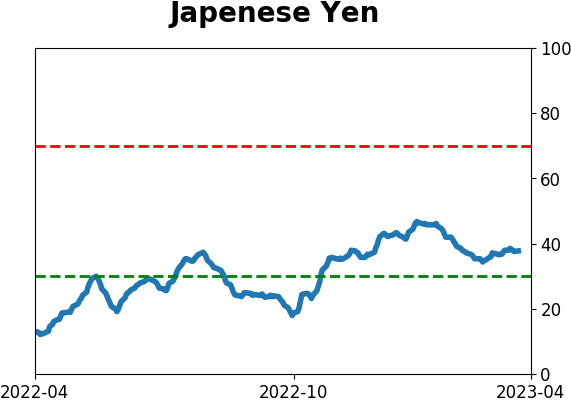
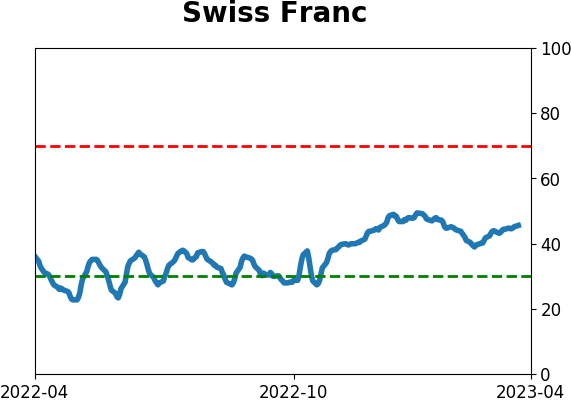
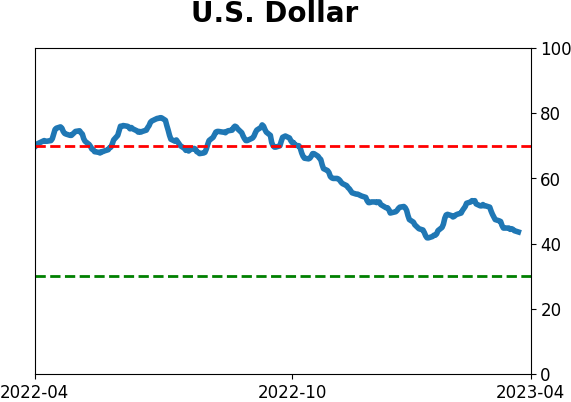
Currency ETF's - 5-Day Moving Average
|
|
|
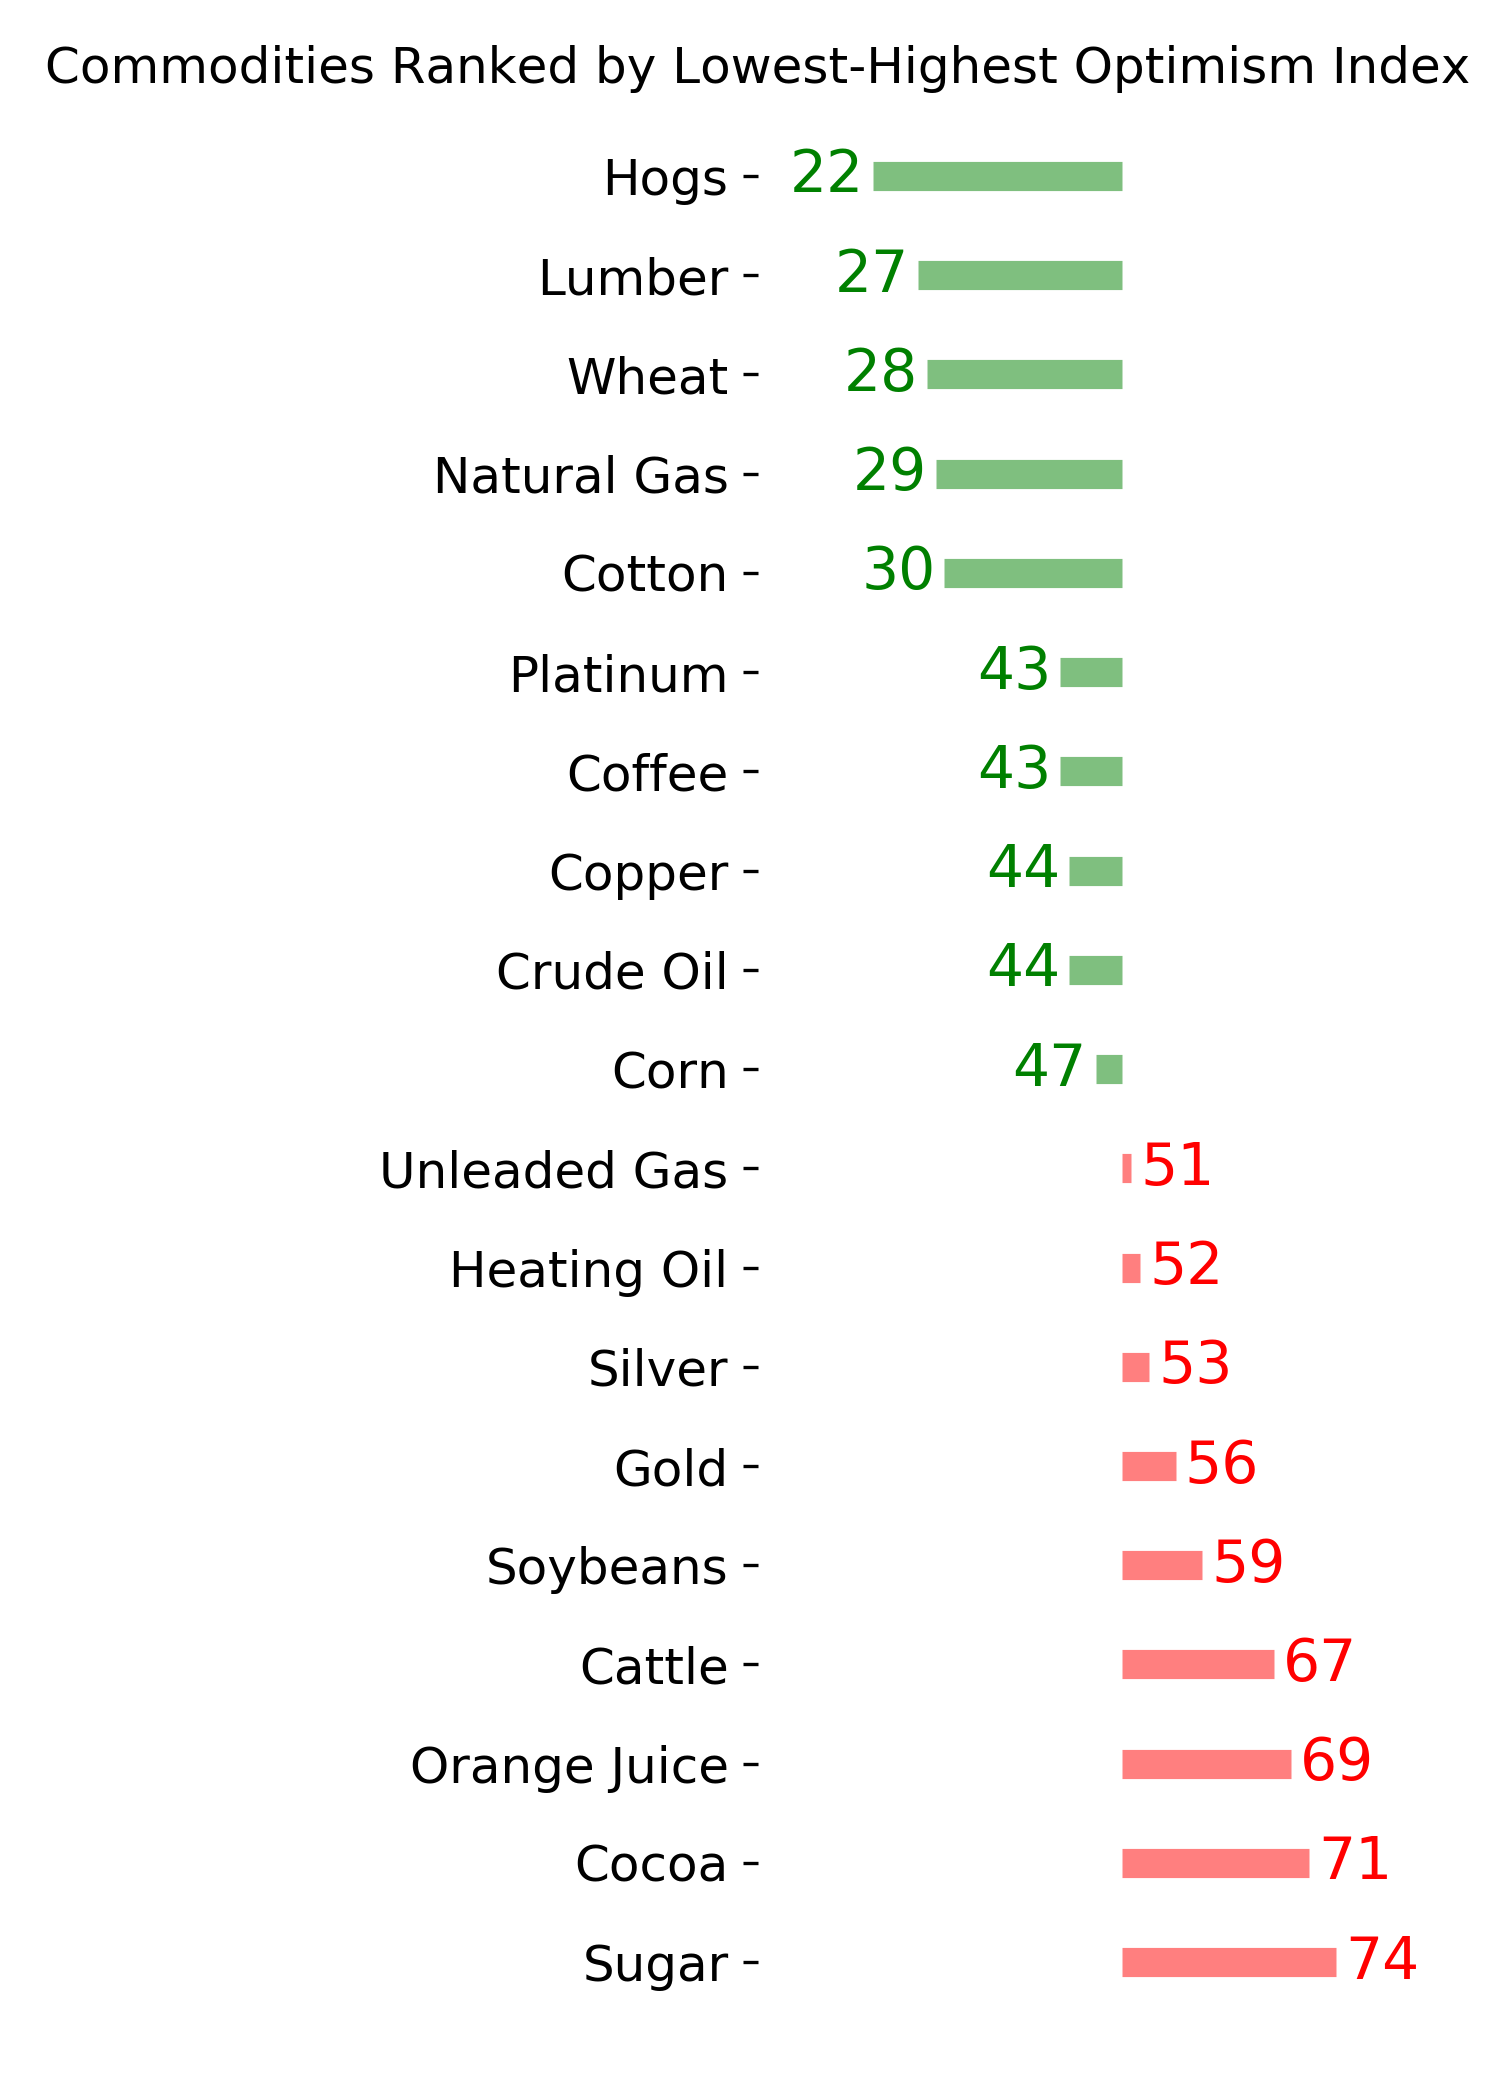
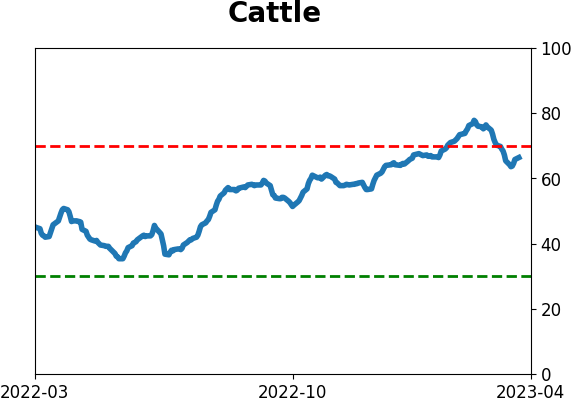
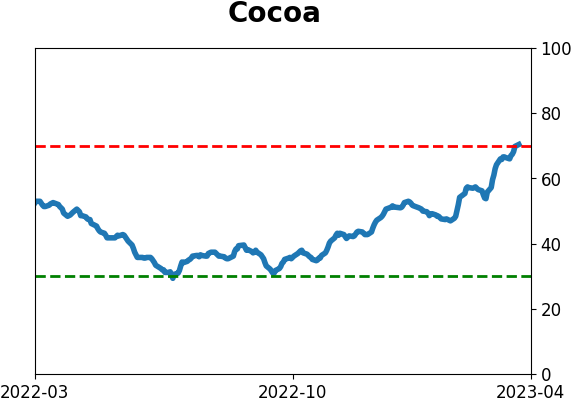
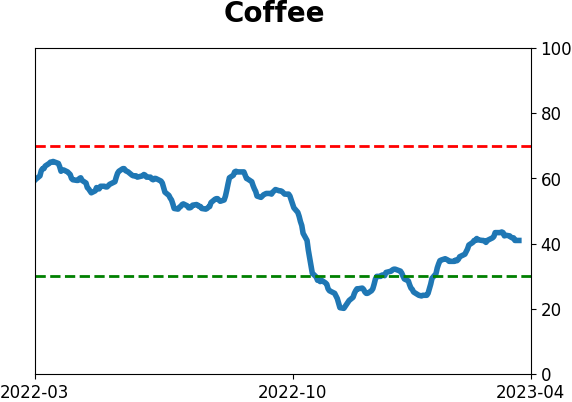
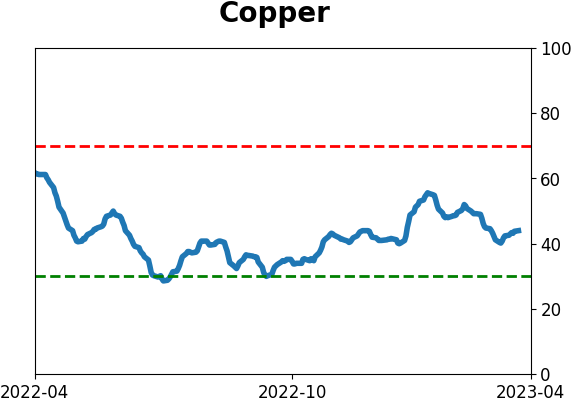
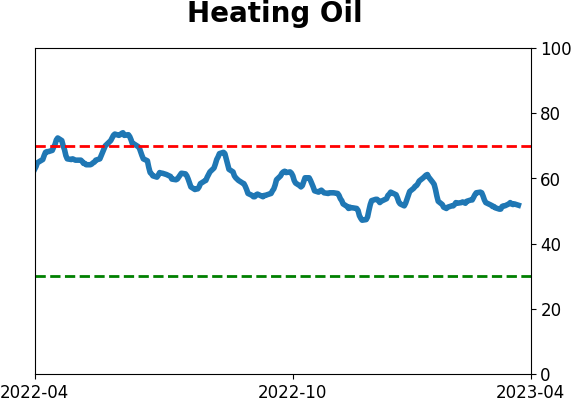
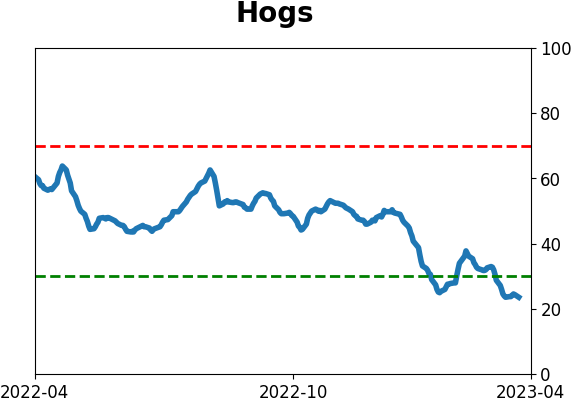
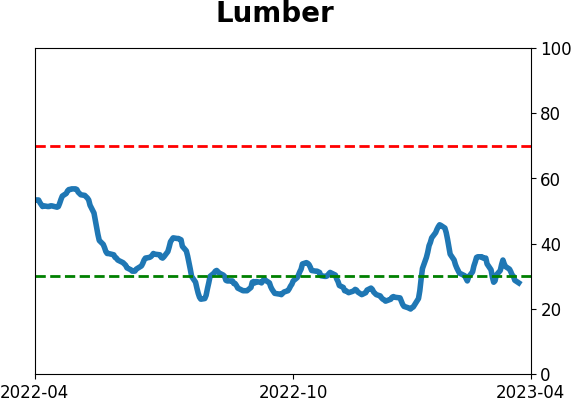
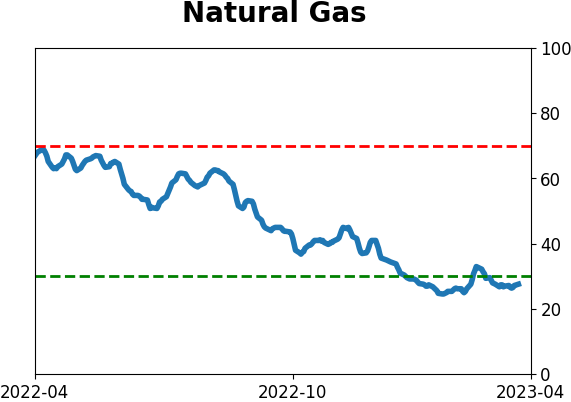
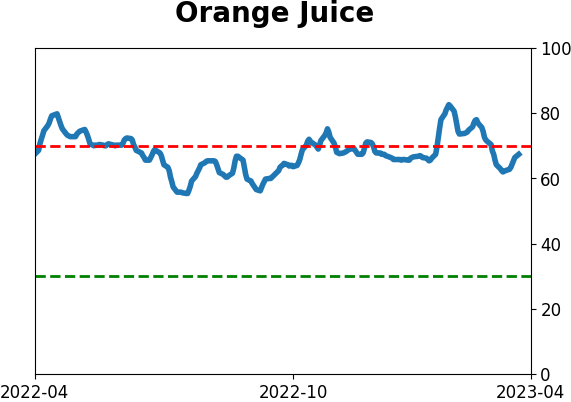
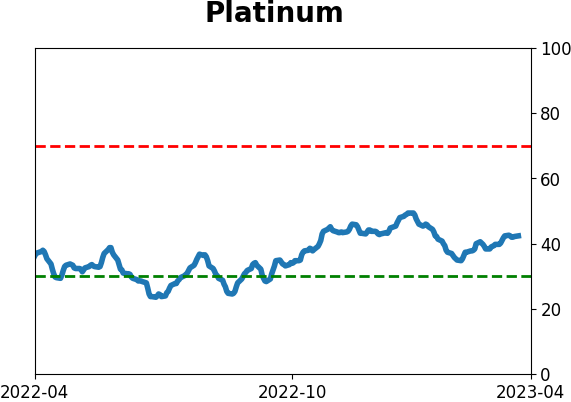
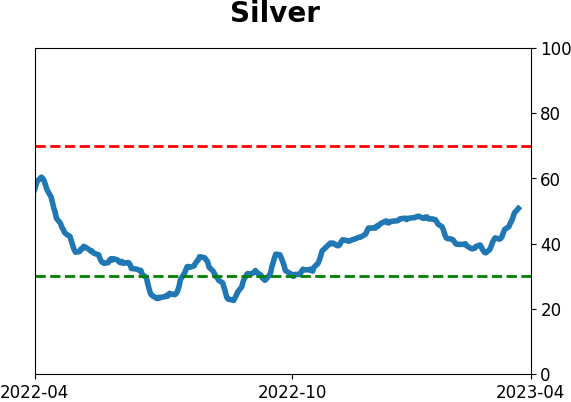
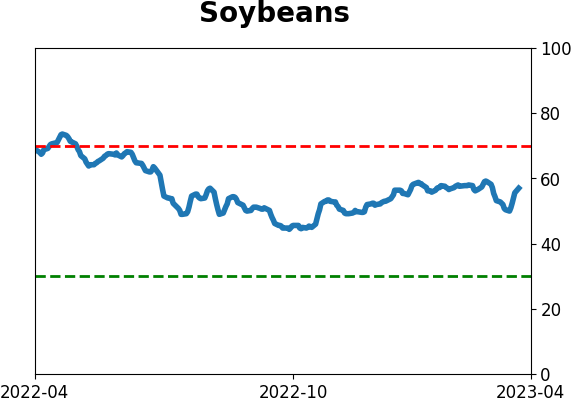
Commodity ETF's - 5-Day Moving Average
|
|