Daily Report : TradingEdge Weekly for Mar 31 - A good quarterly sign, industry momentum, seasonal sectors

| View/Print a PDF version of this Report |
Headlines
|
TradingEdge Weekly for Mar 31 - A good quarterly sign, industry momentum, seasonal sectors: This week, we saw that implied volatility for stocks has tanked relative to bonds. That's due in part to an S&P 500 index that has been rangebound on multiple time frames, even though it held above its December low all quarter. Seasonal windows are positive for major indexes and sectors. Retail traders, however, have established large bearish bets. In Financials, insiders are buying while everyone else is selling. |
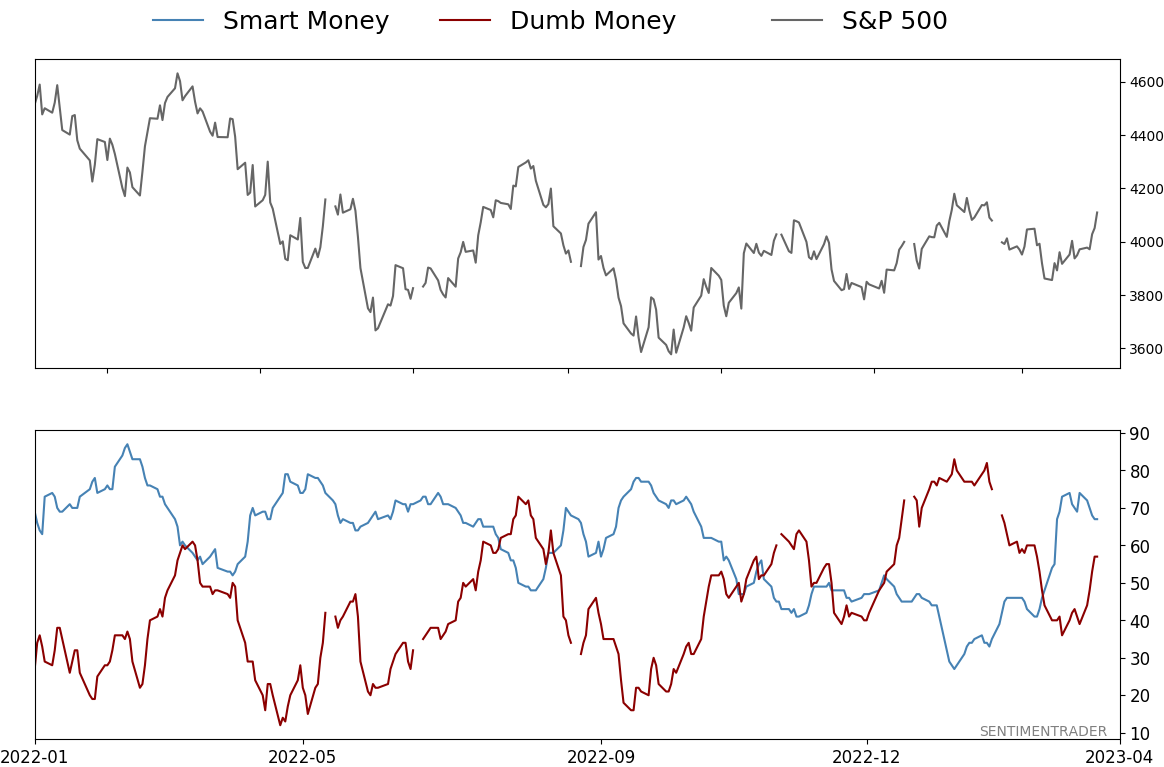
Smart / Dumb Money Confidence
|
|
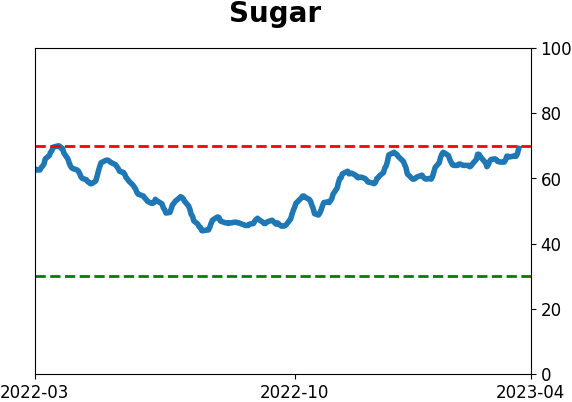
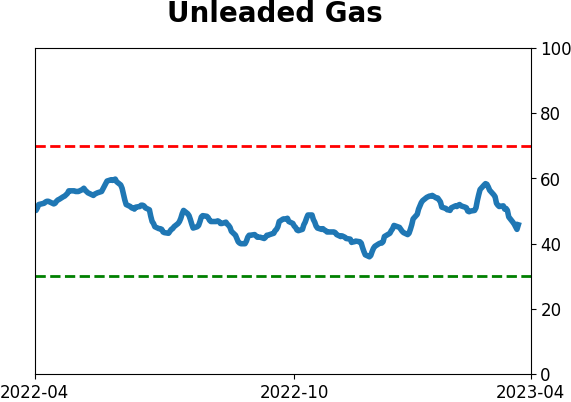
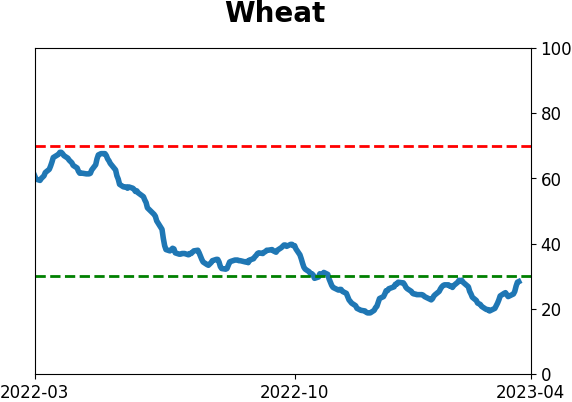
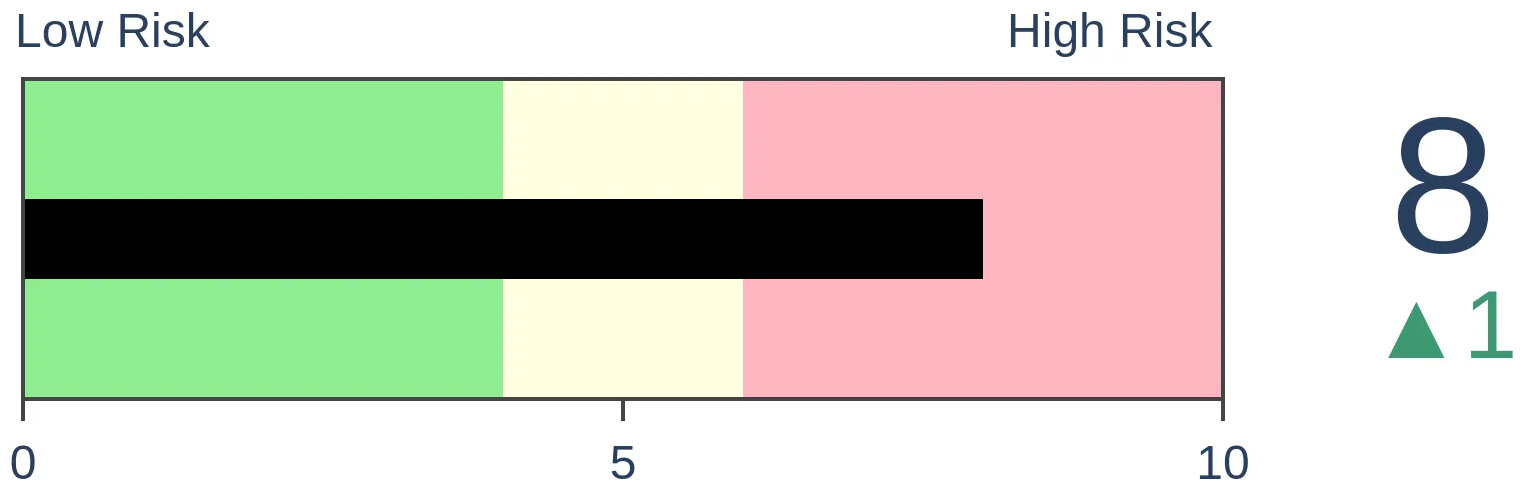
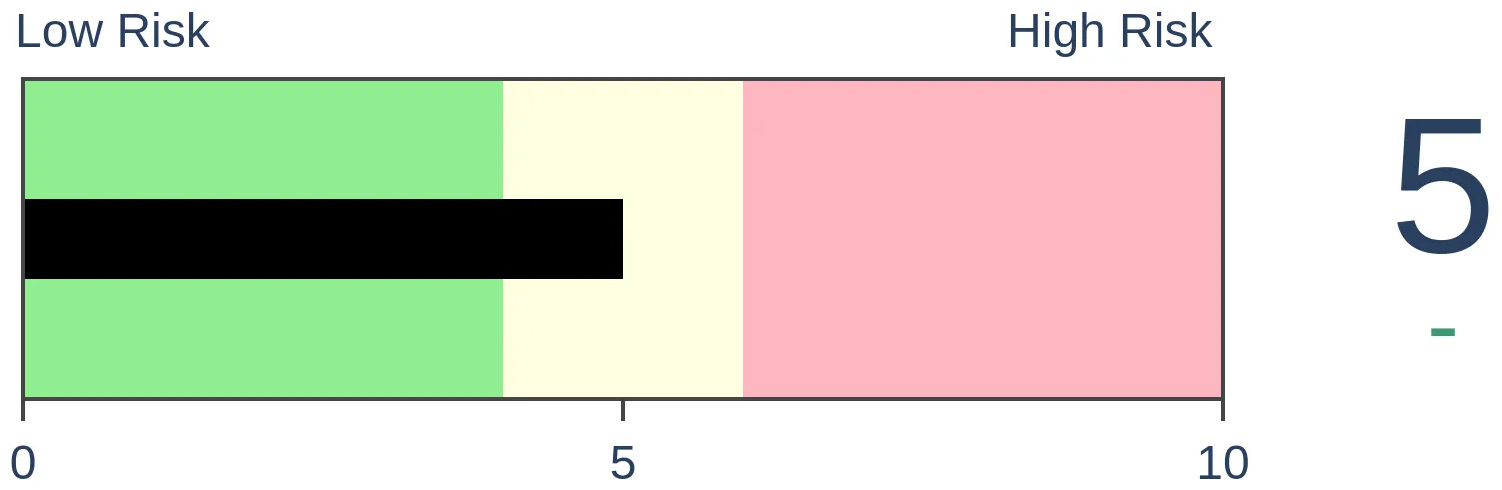
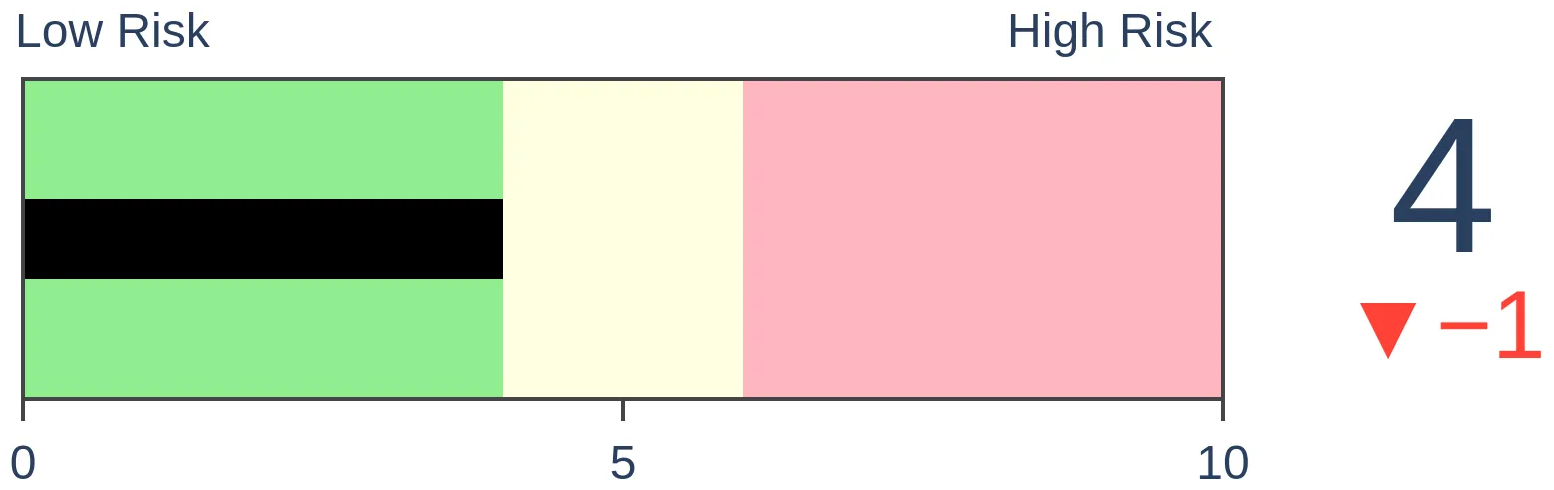
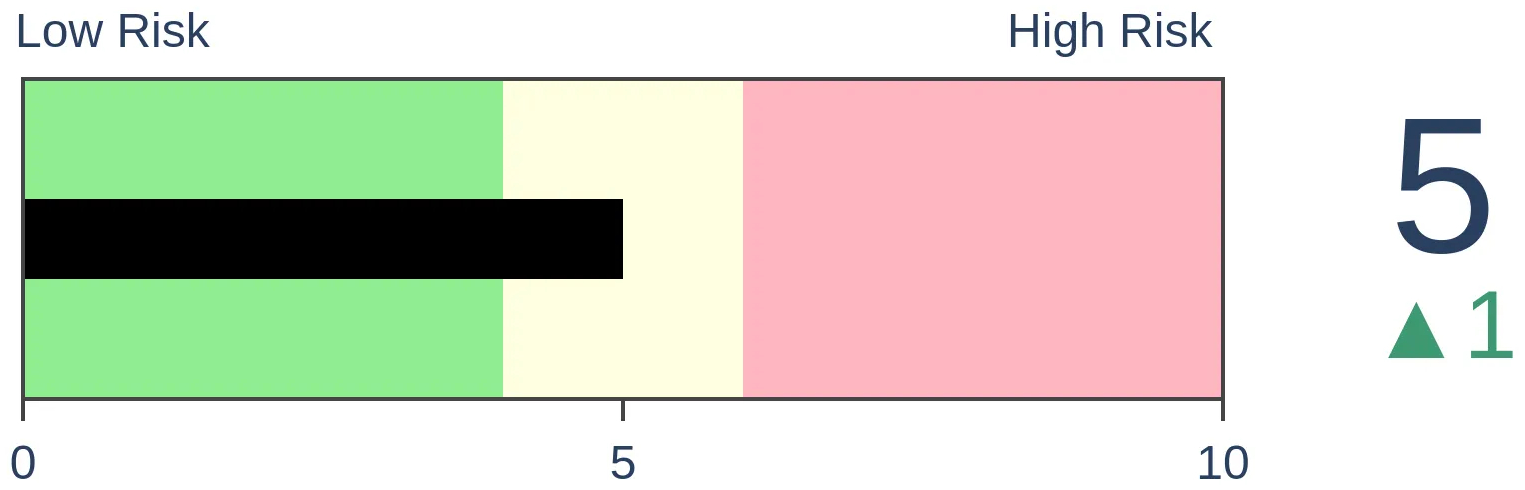
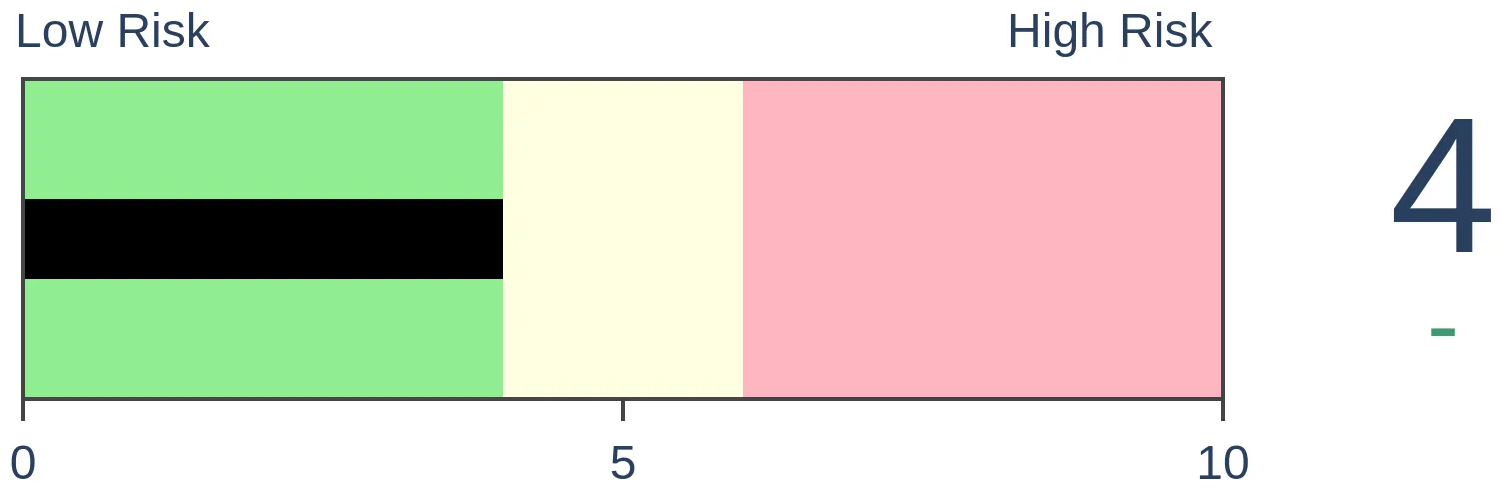
Risk Levels
|
|
|

Research
TradingEdge Weekly for Mar 31 - A good quarterly sign, industry momentum, seasonal sectorsBy Jason GoepfertBOTTOM LINEThis week, we saw that implied volatility for stocks has tanked relative to bonds. That's due in part to an S&P 500 index that has been rangebound on multiple time frames, even though it held above its December low all quarter. Seasonal windows are positive for major indexes and sectors. Retail traders, however, have established large bearish bets. In Financials, insiders are buying while everyone else is selling. FORECAST / TIMEFRAME |
Key points:
- The S&P 500 held above its December low during the 1st quarter, a good sign
- Stock traders are pricing in much lower volatility than bond traders
- The S&P 500 has been rangebound over multiple time frames
- Many industries are showing positive 6-month returns, but not 12-month returns
- Now would be a good seasonal time for the major equity indexes to break out
- Retail traders aren't buying any bullish narratives in the futures and options markets
- A Technology sector signal with a perfect track record
- Tech stocks have accomplished relative and absolute breakouts
- In Financial stocks, insiders are buying while everyone else is selling
- Certain sectors tend to perform best during the current positive seasonal window
- Real estate stocks are still trying to follow through on a couple of bullish prompts
First-quarter gains bode well
During the first quarter of the year, the stock market offers a valuable clue regarding the remaining nine months. Jay suggested that the key is comparing the lowest S&P 500 closing price during the first quarter to the lowest close recorded during the previous December.
For this test, on March 31 each year, we will look at the lowest daily closing price for the S&P 500 Index during the first three months of the year. We will then compare that value to the lowest closing price recorded during December of the previous year.
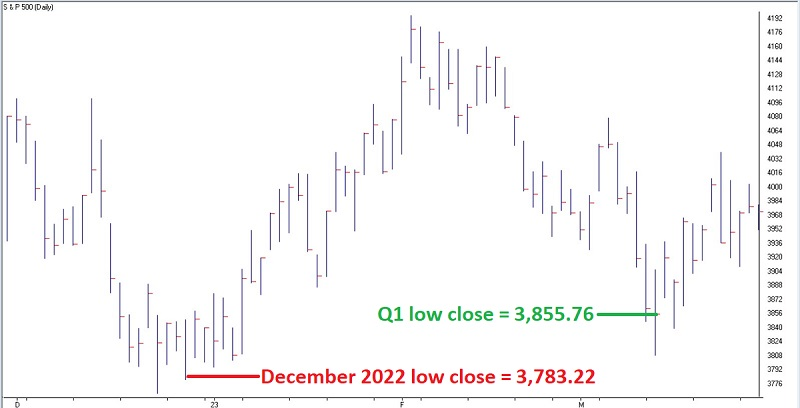
The chart below (courtesy of AIQ TradingExpert) displays the performance of the S&P 500 since December 2022. Note that the lowest close for SPX during December 2022 was 3,7783.22. The lowest close so far in 2023 was 3,855.76 on 2023-03-13.
To get a sense of overall performance, The chart below displays the cumulative growth of $1 invested in the S&P 500 Index only during April through December of favorable years.
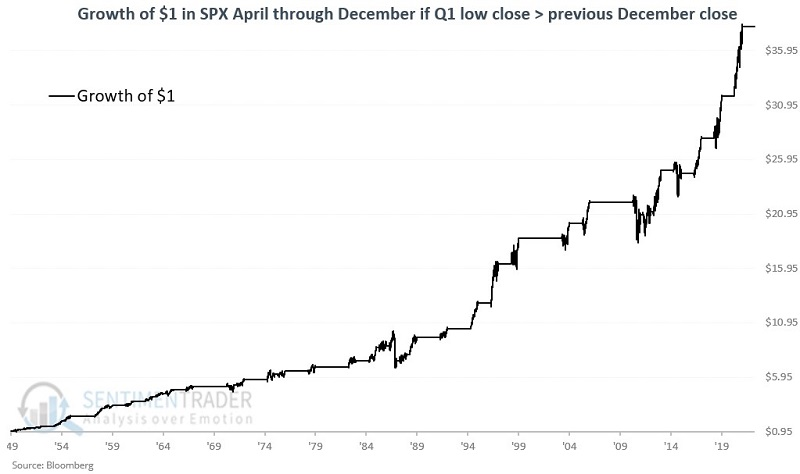
When the first quarter's low was above the prior December's low, the April through December period showed a gain 92% of the time, 33 out of 36 years. The average gain was about double the average loss, and the S&P rose more than 10% during 17 of the years while suffering a loss of more than -10% only once.
Besides the ill-fated year of 1987, three favorable years (1971, 1986, and 2012) witnessed April through December gains of less than +2%. The good news is that the S&P 500 enjoyed full-year gains of over +10% during these years. The bad news is that most of those gains were achieved in the year's first quarter, and the rest of the year mostly involved the market chopping around in a broad trading range.
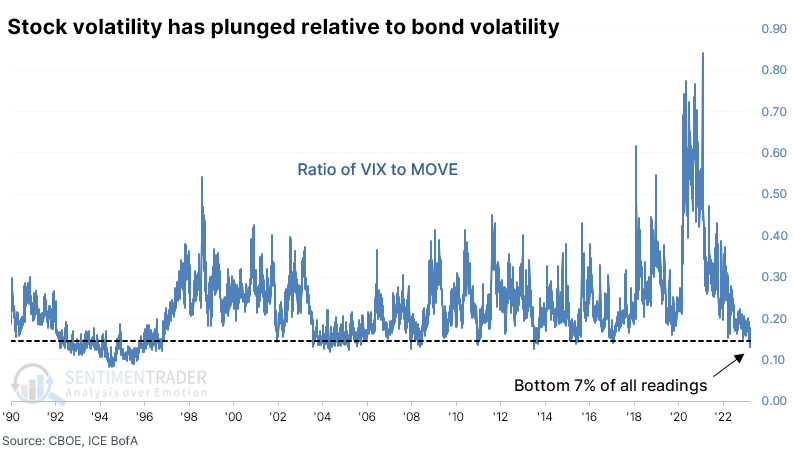
Stock volatility tanks relative to bonds
Thanks to the issues that all of us are hyper-aware of by now, volatility in the bond market has skyrocketed to one of the highest levels in 30 years. Options traders are pricing in further dramatic swings in bond prices, but not so in stocks.
The MOVE index, which monitors implied volatility in various maturities of Treasuries, has therefore become uncoupled from the VIX, which monitors options traders' expectations on stock volatility. Because the VIX has remained subdued while MOVE has jumped, the ratio between them has plunged to one of the lowest readings in more than 30 years.
The table below shows future returns in the S&P 500 whenever the ratio between the VIX and MOVE drops below 0.145 for the first time in more than 200 sessions. While the S&P didn't show significant gains going forward, it also didn't decline consistently. Over the next three months, there was only a single loss of more than -0.3%.
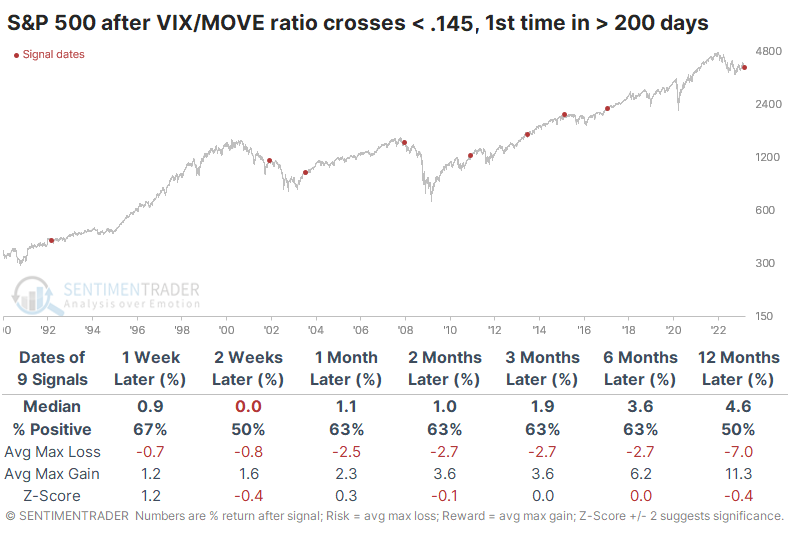
It was a more consistent signal for 10-year Treasury note prices. Across all time frames, that futures contract enjoyed higher-than-average returns with relatively low risk. More notable was the impact on bond volatility. It was virtually guaranteed to decline across almost every time frame. The MOVE index suffered consistent and heavy losses across the board.
According to Bloomberg calculations, the MOVE index has had a relatively high negative correlation with many non-U.S. ETFs. The 3-month correlation between MOVE and EWO, the Austria ETF, was -0.57. It was also strongly negative for virtually every major fund that tracks non-U.S. stock markets.
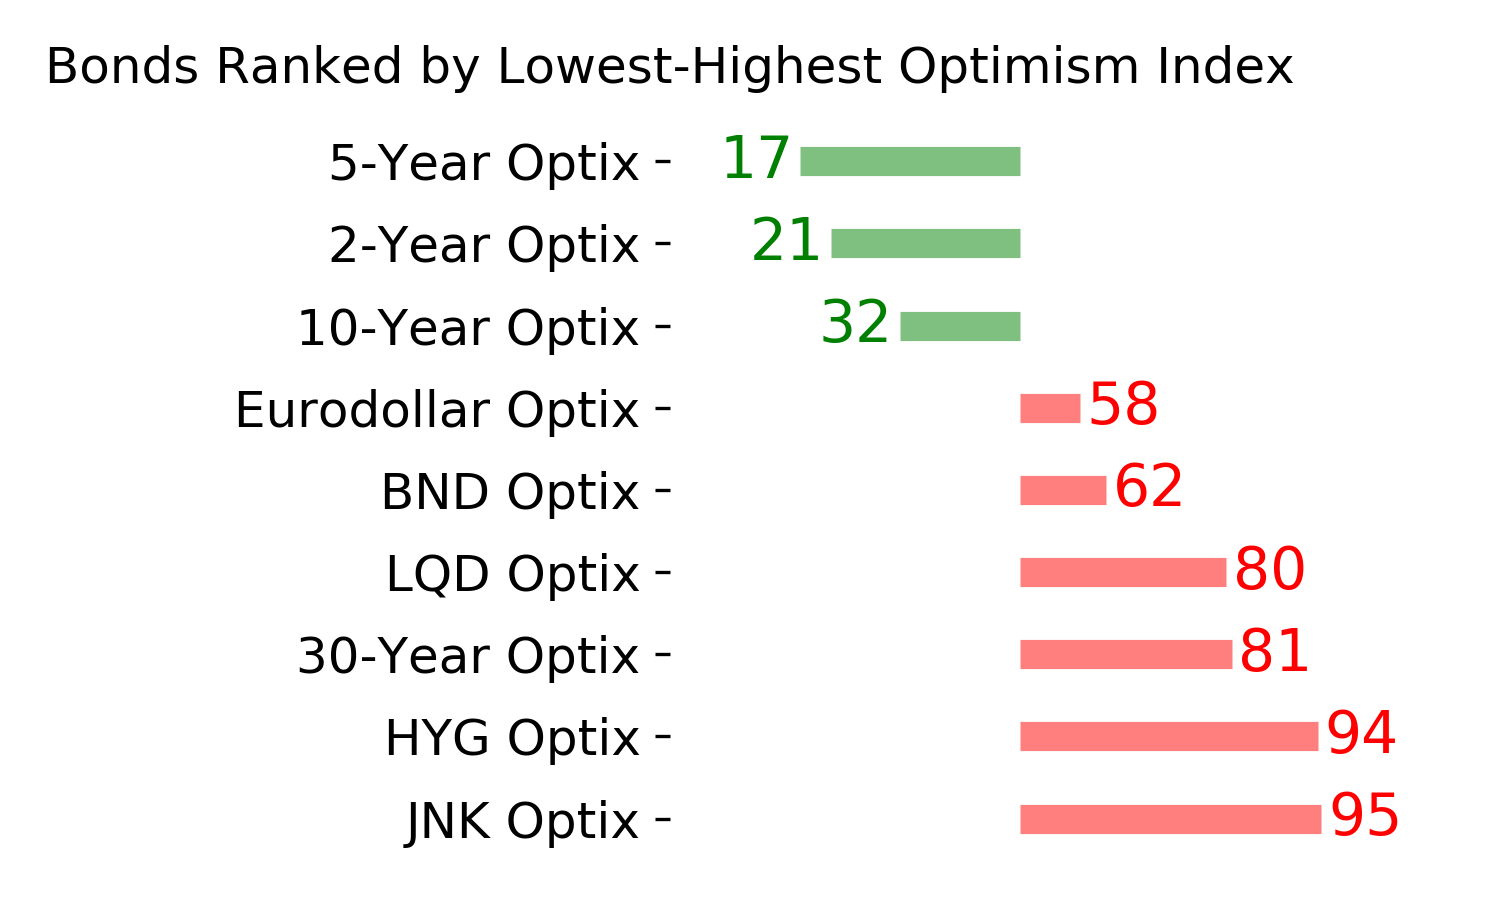
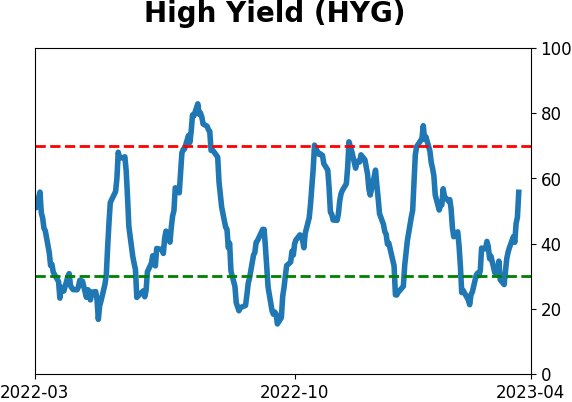
Among U.S.-based ETFs, it showed the highest negative correlation to Financials (XLF) and high-yield bonds (HYG, JNK).
A very, very rangebound market
The VIX is subdued because the S&P 500 has been
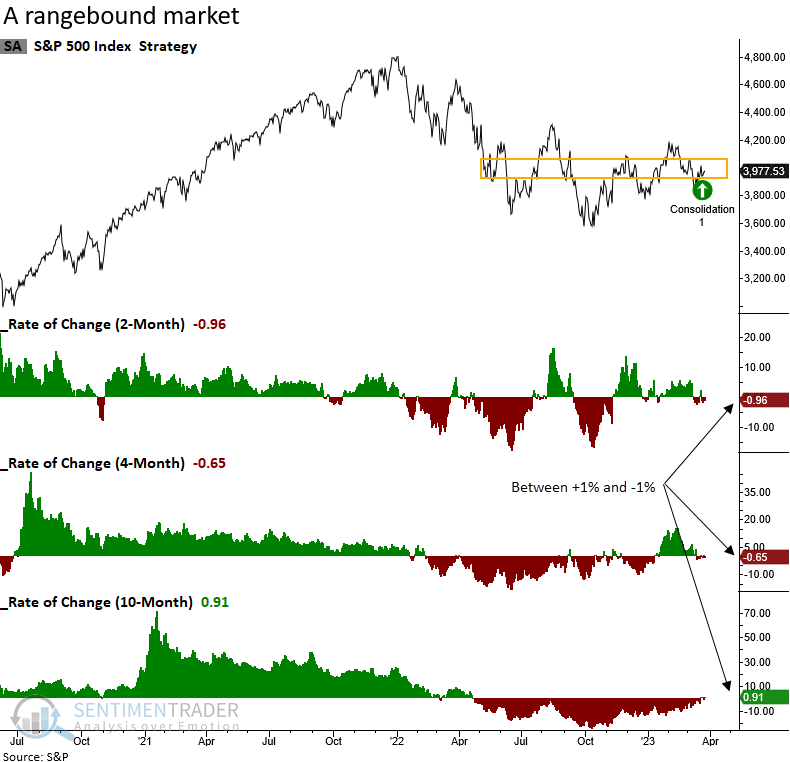
Dean noted that the S&P 500 remains rangebound across multiple time frames. After similar consolidations, the index made very little progress over the next three months.
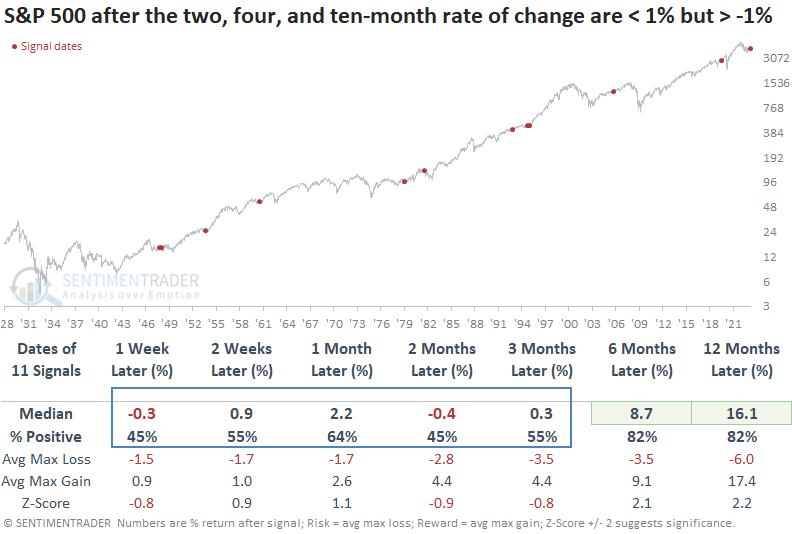
Over the last two, four, and ten months, the S&P 500 has gone nowhere. A trendless environment, like now, is rare. There were only 12 historical cases when the price change over those periods closed within a range of 1% to -1%. Usually, consolidations resolved themselves in the direction of the prior primary trend.
When the S&P 500 consolidates in a pattern identical to now, the odds of a sustainable breakout in either direction over the next three months are not great. While the long-term results look excellent, equity markets have an upward bias over time. So, consolidations usually resolve to the upside.
The consolidation pattern occurred during an FOMC tightening cycle in 7 out of 12 cases. Inflation and the S&P 500's distance from its 2-year high are two conditions that look most similar to the consolidation signals that occurred in the 1946-49 bear market.
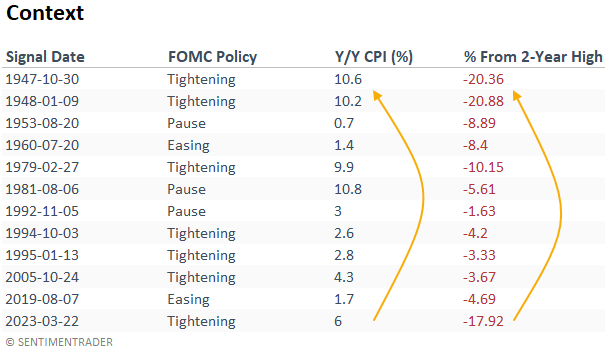
The S&P 500 declined from 1946 to 1949 by slightly less than -30%. If the current rangebound market is similar to that period, the bulk of the peak-to-trough drawdown could be over.
Industry momentum time frame divergence
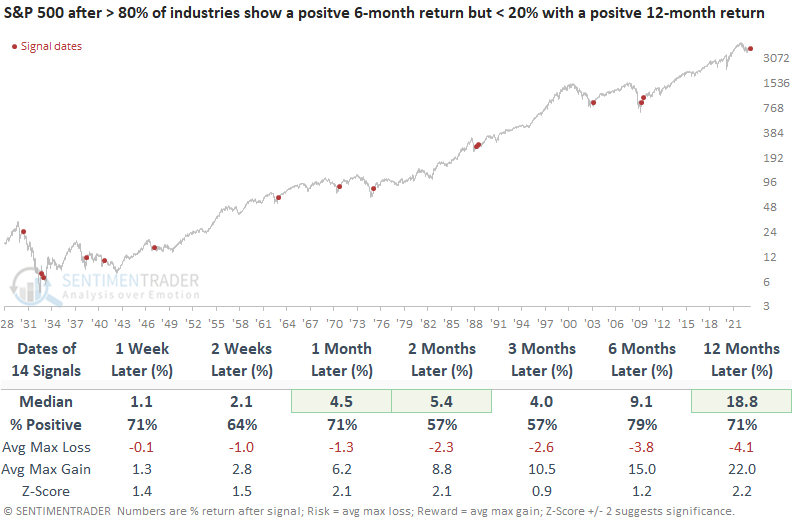
Dean showed that more than 80% of sub-industry groups show a positive 6-month return, but fewer than 20% of groups closed with a positive twelve-month return. The S&P 500 tends to resolve the divergence in price momentum in favor of the bulls.
While short to medium-term indicators gyrate up and down as the market encounters rolling corrections and rallies within a lengthy consolidation pattern, some long-term measures continue to improve. Let's assess the outlook for the S&P 500 when there were similar divergences between industry momentum of 6- and 12-month time frames.
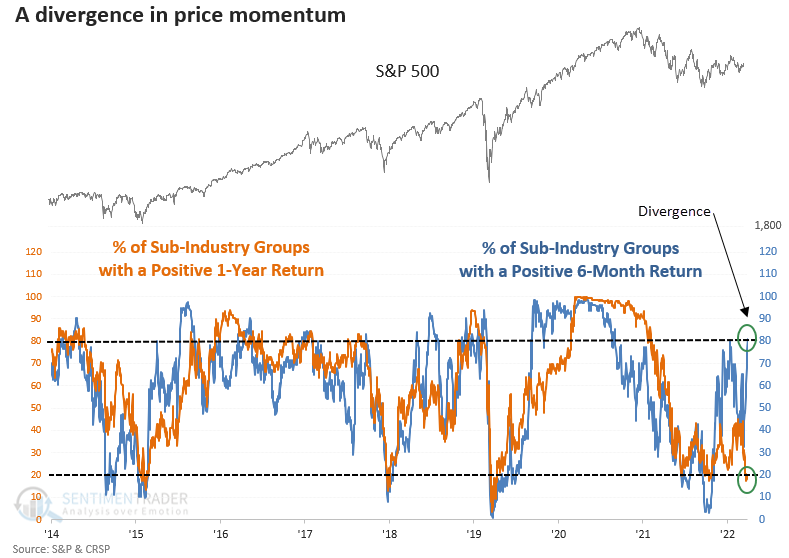
When price momentum for sub-industry groups over a six and twelve-month period are out of sync like now, the S&P 500 shows an excellent tendency to rally, especially since 1962. While the signals before 1950 were less favorable, 5 out of 6 precedents showed a profit at some point in the first two months. Since 1962, every signal showed a positive return from 3-12 months later.
A good time for that consolidation to break to the upside
Jay showed that the stock market has shown a tendency to advance during the late winter to early-spring period.
Specifically, we will refer to the period that extends from the closing on Trading Day of the Year (TDY) #56 through TDY #83. For 2023, this period extends from the close on March 23 through May 2. To analyze historical results, we will look at the performance of four stock index ETFs that track, respectively, the Dow Jones Industrial Average, the S&P 500 Index, the Russell 2000 Small-Cap Index, and the Nasdaq 100 Index.
The chart below displays the annual seasonal trend for ticker DIA, the primary ETF following the Dow Jones Industrial Average.
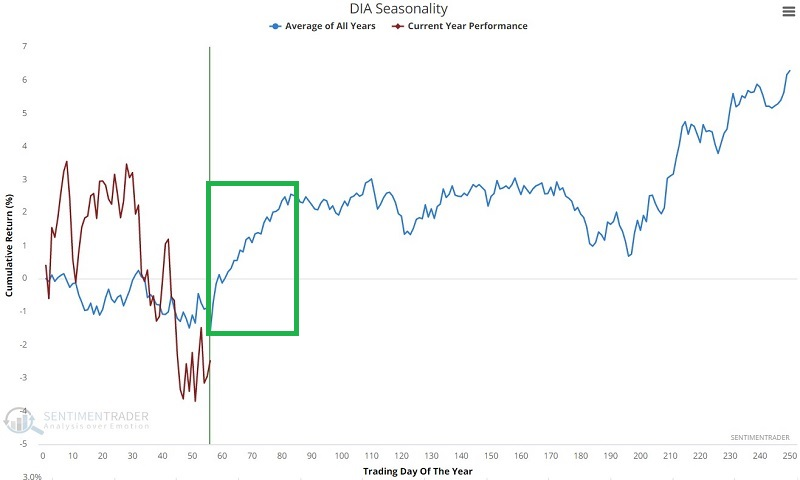
During the fund's history, it sported a gain 84% of the time during these seasonal windows, with seven years showing a gain larger than 5%, and no years suffering a loss that large.
Jay also showed data for the other major indexes. The chart and table below display the growth of $1 invested in ticker SPY (trading the S&P 500) only during these windows since its inception in 1993.
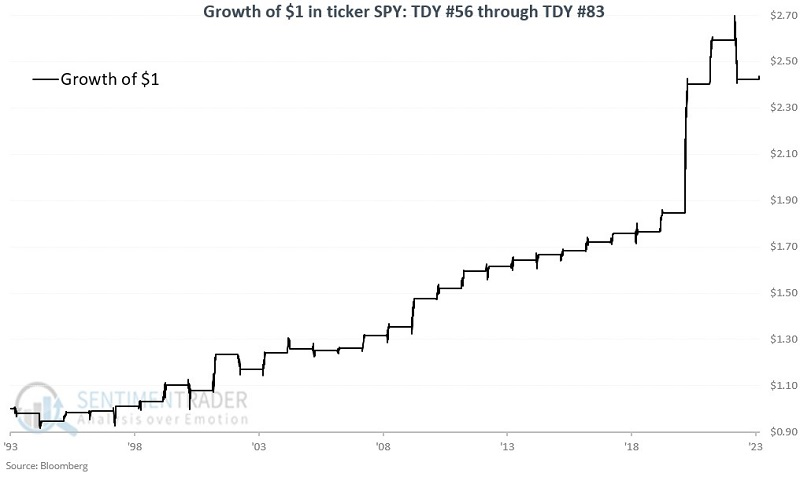
Results for IWM (Russell 2000) and QQQ (Nasdaq 100) were less consistent, but still showed a strong positive bias.
Retail traders are not buying the bullish story
Small traders are having none of it. Despite most major equity indexes holding well above their October lows, retail traders in the futures and options markets behave like lower lows are in store.
Small speculators have re-established near-record short positions against stocks in major equity index futures. It's a stark change from January when they flipped to net long.
In the options market, small traders have continued to focus heavily on buying put options to open while relatively shunning calls. Such heavy put activity relative to calls has pushed the ROBO Put/Call Ratio to an extreme. It is once again among the most extreme 5% of all readings in 23 years.
When we combine the two measures and look at their current level relative to their ranges over the past three years, both are at least in the most extreme 5% of readings. Extremes in these measures have profoundly impacted the S&P 500's future annualized return.
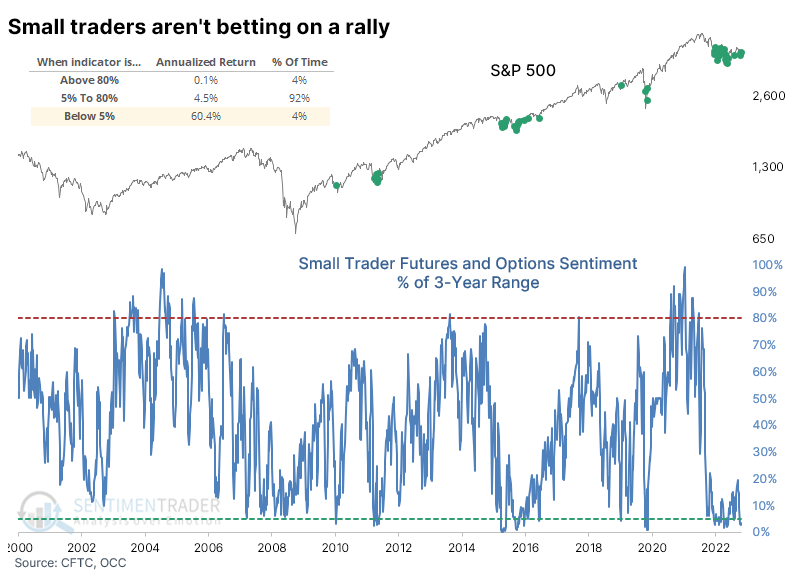
There was a remarkable amount of carnage under the surface of the indexes in 2022. Many of the most speculative issues that attracted the most attention and leverage were decimated. Even though most stocks bottomed five months ago, investors are still prone to quickly switch back to a bearish mentality, fearing that the destruction is only in the middle innings.
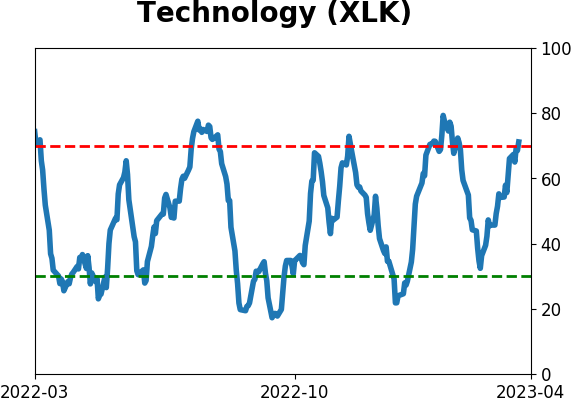
A Technology sector signal with a perfect track record
Dean noted that the percentage of S&P 500 Technology stocks with a rising 200-day average cycled from < 5% to > 75%. After similar reversals, Technology and the S&P 500 were higher a year later 100% of the time.
For only the eighth time since 1952, the percentage of S&P 500 Technology sector stock with a rising 200-day moving average cycled from less than 5% to greater than 75%. When this figure was above 75%, annualized forward returns were impressive.
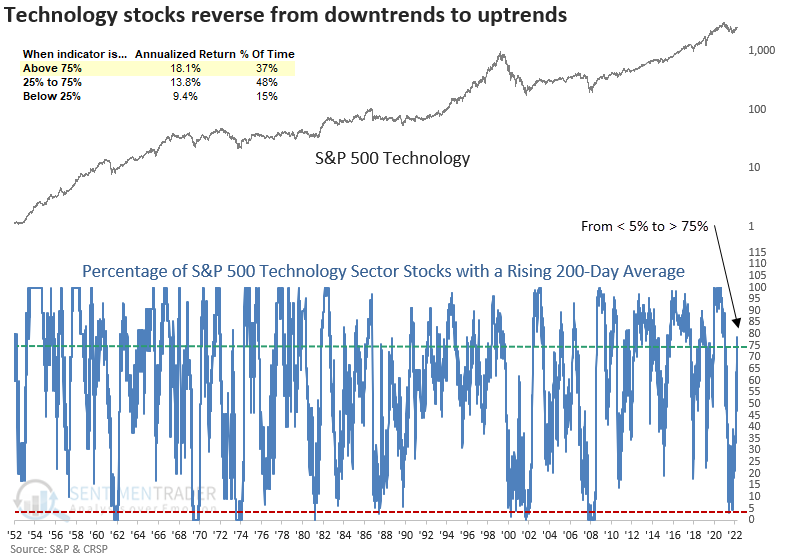
When Technology stocks transition from long-term downtrends to uptrends, the sector tends to take a pause that refreshes a bullish backdrop. A year later, the industry was higher 100% of the time.
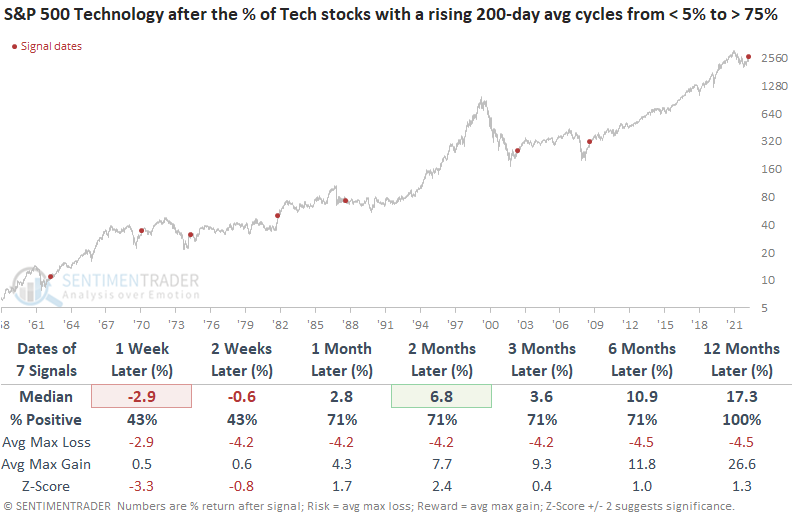
When applying the signals to the S&P 500, consistency was even better across all time frames. So, what's good for the Technology sector was good for the broad market.
The recent outperformance by the Big Eight, which Bianco Research noted on social media, pushed the percentage of S&P 500 members outperforming the S&P 500 index to the lowest level since March 2000. When the percentage of S&P 500 members outperforming the S&P 500 index falls below 26%, like now, the S&P 500 tends to rally over the next month. However, the 3-month time frame should be a friendly reminder that narrow markets eventually correct.
Tech stocks have been driving the market higher
In addition to good internal momentum, the S&P 500 Technology sector closed at a 6-month relative high vs. the S&P 500 in 10 out of 15 sessions, and Dean noted that after similar breakouts, the Technology sector showed excellent absolute and relative performance.
The stars could align for Technology stocks with management teams taking aggressive steps to cut costs and a potentially more favorable inflation/interest rate environment.
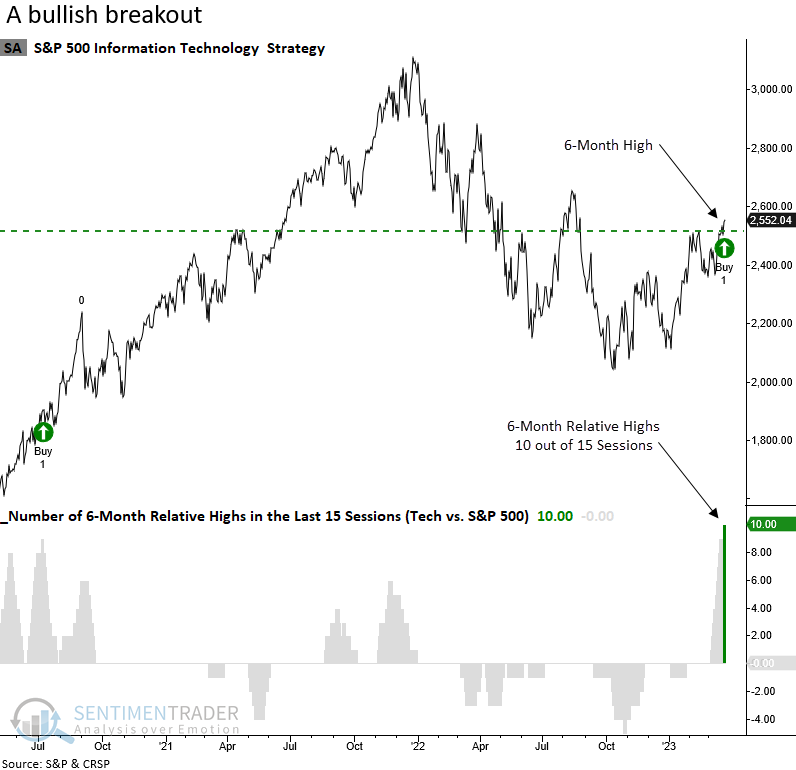
The Technology sector showed a strong tendency to rally further when the sector enjoyed similar breakouts. It's important to note that the breakout signal never occurred during the Dotcom bust, despite some significant bear market rallies. Six months later, the group was higher in all but one case, which occurred in 1957.
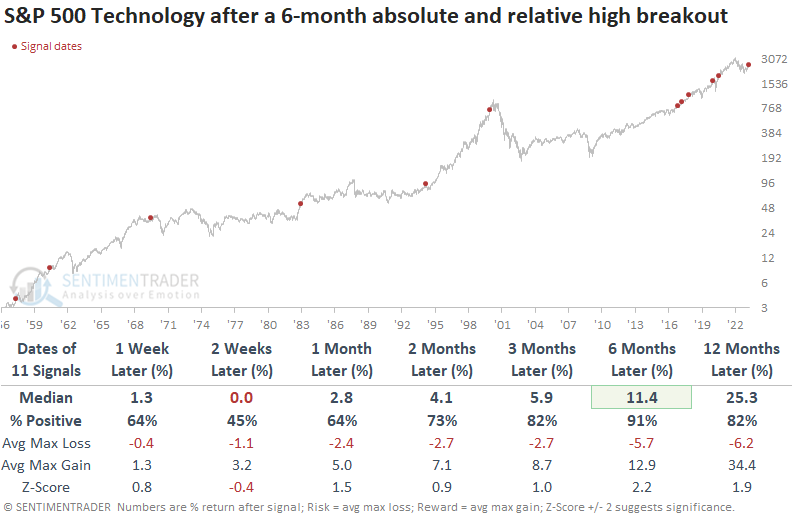
Relative outperformance by the S&P 500 Technology sector was excellent across all time frames, especially over the next six to twelve months when it outperformed the S&P after 9 out of 11 signals.
Technology maintains the highest relative trend score among all sectors. And it's the only sector with a rising 50 and 200-day moving average. So, absolute and relative price trends look bullish, especially compared to other groups.
In the Financials, insiders are buying while everyone else is selling
Last week, Jay noted that the latest decline in the Financial sector acted like catnip for insiders at those firms. Insiders tend to have a contrarian bent, buying as prices decline and selling as they rally.
At the same time that insiders were buying, everyone else was selling. Breadth in the Financial sector has been terrible, with an average of fewer than 8% of the stocks holding above their 50-day moving averages over the past two weeks.
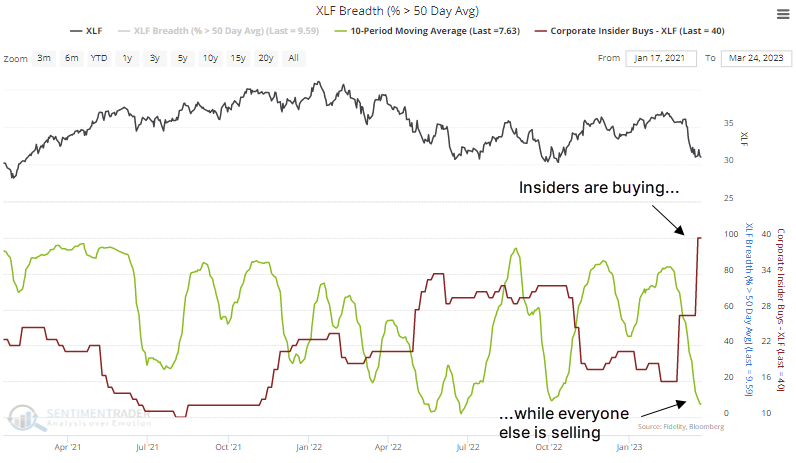
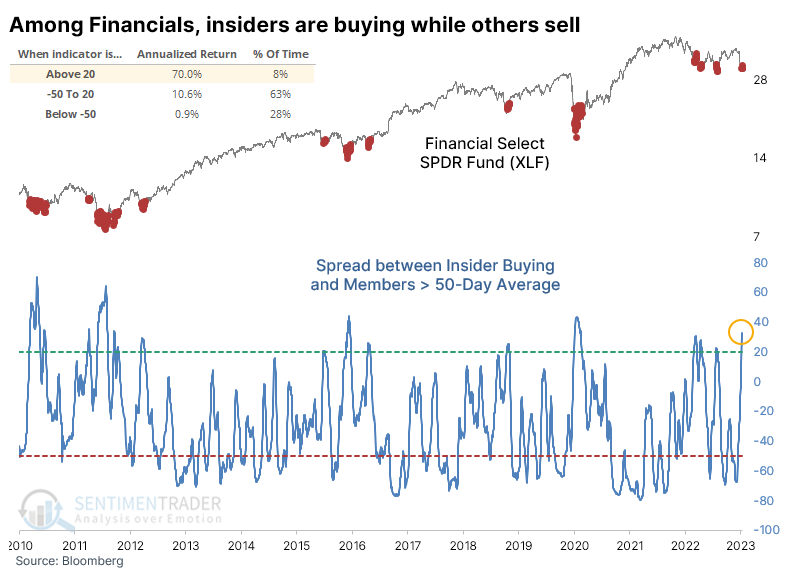
Let's look at the spread between insider buying and the average percentage of Financials trading above their 50-day average over the past couple of weeks. It is currently at the highest level since the spring of 2020. When the spread was this wide, the XLF fund returned an annualized +70%.
At the same time that insiders got a lot more interested in buying their own shares at Financial firms, insiders in Staples have shown little interest. At those companies, insider buying is only now coming off one of the most apathetic levels in 13 years.
We looked at the relative interest in insiders vs. everyone else in Financials versus Staples. In theory, the higher the spread, the more it should favor Financials over Staples. In practice, that was mostly the case. The ratio advanced at an annualized rate of nearly +19% when the spread was above 50 as it is now. The ratio returned an annualized -29.4% when it was at the opposite extreme.
Sectors for spring
As noted above, the stock market has shown a tendency to advance during the late winter to early-spring period. Jay showed that individual sectors have developed their unique tendencies over the year.
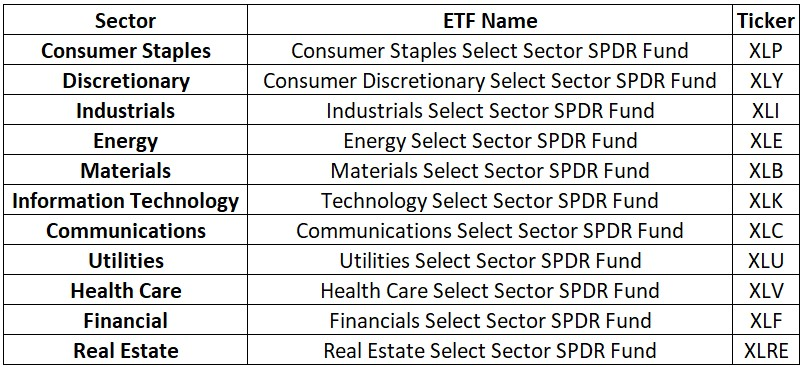
This piece will focus on the 11 S&P 500 Index sectors. For analysis purposes, we will use a sector index database that began in 1953. These sectors can be traded via ETFs, as shown in the table below.
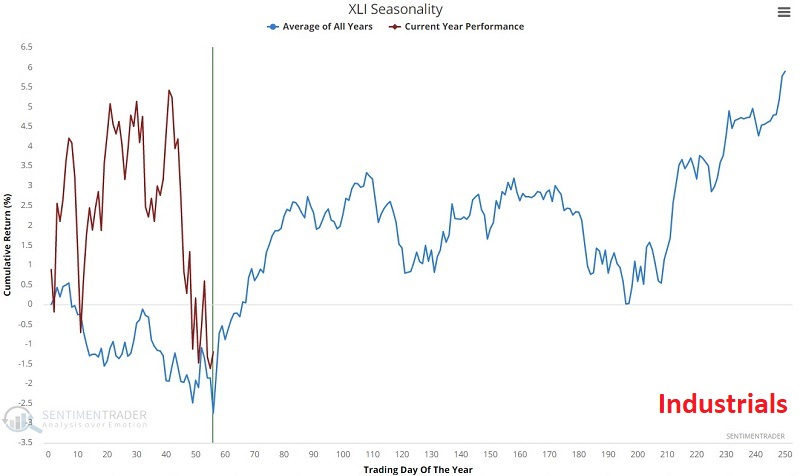
The seasonal chart for XLI is shown below. It has mostly followed its typical pattern so far in 2023, as have many of the other ETFs that Jay highlighted.
Now let's look at the cumulative performance for each sector during the TDY #56 through TDY #83 period since 1953 for the sectors listed. The table below summarizes performance.
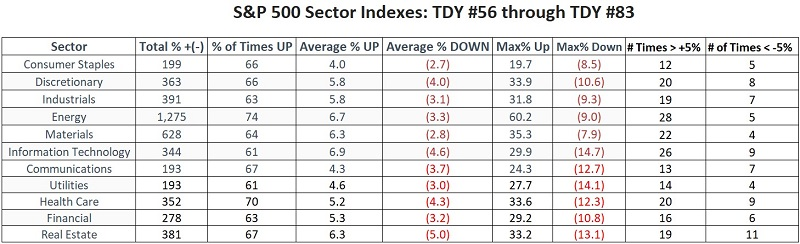
Energy has been the top overall performer by far, with a cumulative gain of +1,275%. Materials are a distant second, with a cumulative growth of +628%. Utilities and Communications bring up the rear with meager cumulative returns of +193%.
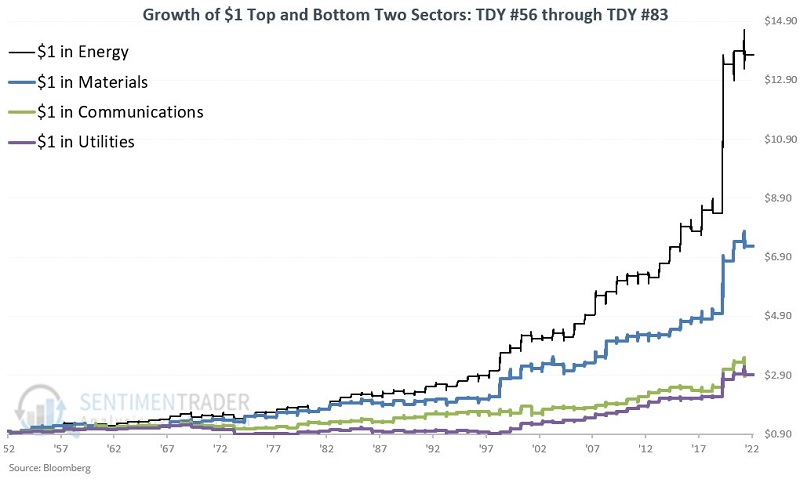
For perspective, the chart below displays the growth of $1 in the two top-performing (Energy and Materials) and bottom-performing (Communications and Utilities) sectors only during the TDY #56 through TDY #83 period from 1953 into 2023.
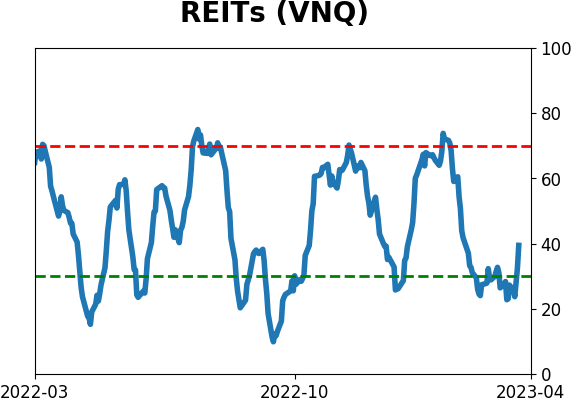
Real estate opportunity
Jay noted that the real estate sector has been pounded in recent months. Sentiment for this sector recently reached a contrarian extreme, and the sector is entering the most favorable seasonal period of the year.
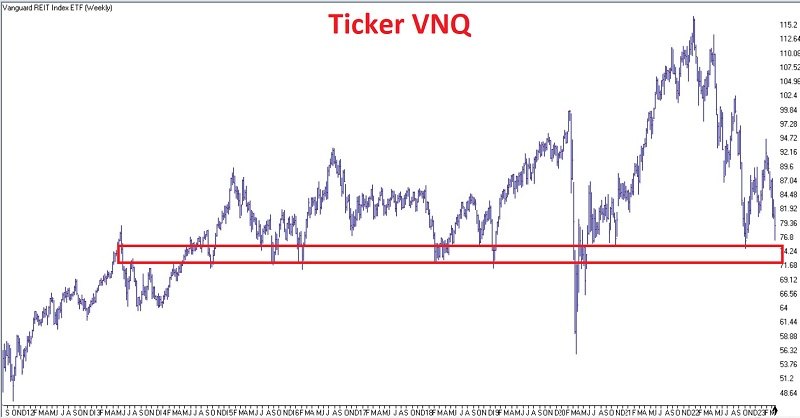
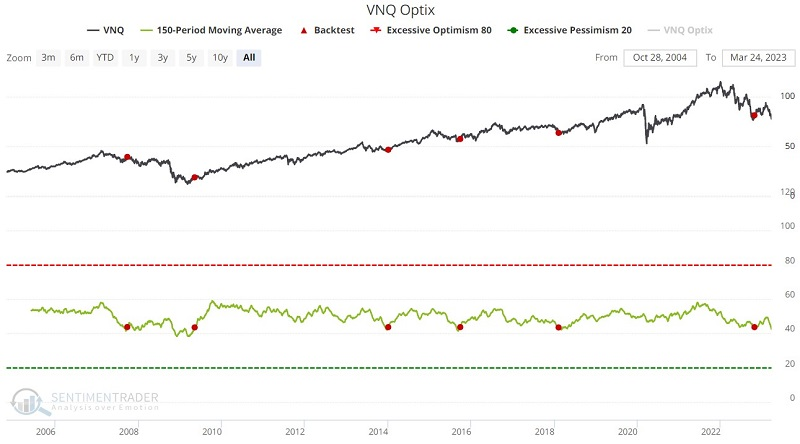
The chart below (courtesy of AIQ TradingExpert) shows that - despite an avalanche of lousy housing news in recent months - the Vanguard Real Estate ETF (ticker VNQ) still holds above its October 2022 low and is touching a significant area of support. Likewise, sentiment and seasonality are now tilting toward the favorable side.
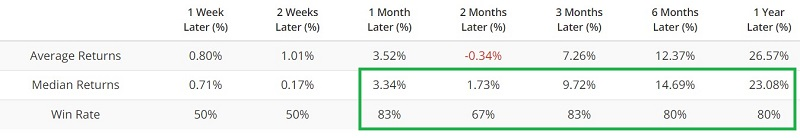
The chart below displays our Optix indicator for Vanguard Real Estate ETF (VNQ). The red dots highlight when the 150-day average for VNQ Optix crossed above 43.5 for the first time in 12 months.
The October 2007 signal was clearly too early as the housing bubble burst the following year, and VNQ fell -12.66%. Still, the following four signals saw the real estate sector rally strongly. Amid much talk of another real estate bubble, the indicator gave a signal on 2022-10-26. As you can see in the chart below, VNQ rallied +15% into early February 2023 before plunging over -17% since.
The chart below displays the annual seasonal trend for ticker VNQ and highlights the tendency for strength during the middle of the year.
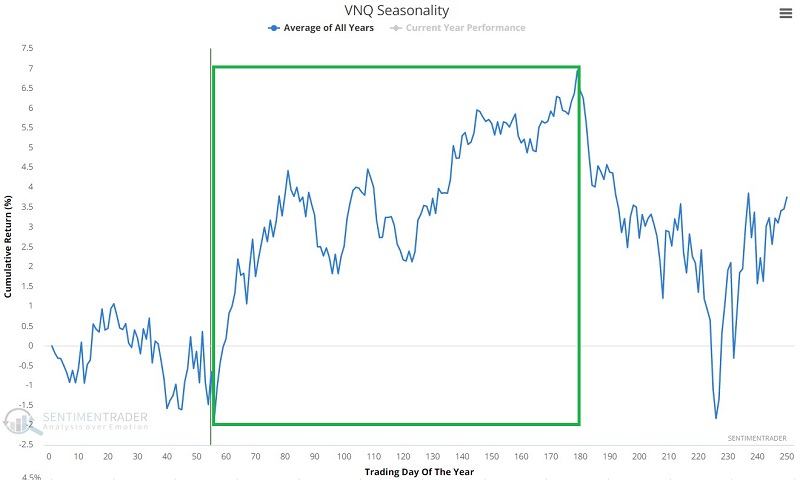
During these windows, extending from March 23 through September 11 this year, the sector gained 73% of the time. Its average gain was about equal to its average loss, which isn't great. But it rallied more than 20% during twelve years, while losing more than that much only twice.
About TradingEdge Weekly...
The goal of TradingEdge Weekly is to summarize some of the research published to SentimenTrader over the past week. Sometimes there is a lot to digest, and this summary highlights the highest conviction or most compelling ideas we discussed. This is NOT the published research; rather, it pulls out some of the most relevant parts. It includes links to the published research for convenience, and if you don't subscribe to those products, it will present the options for access.
Indicators at Extremes
|
|
|
Phase Table
|
|
|
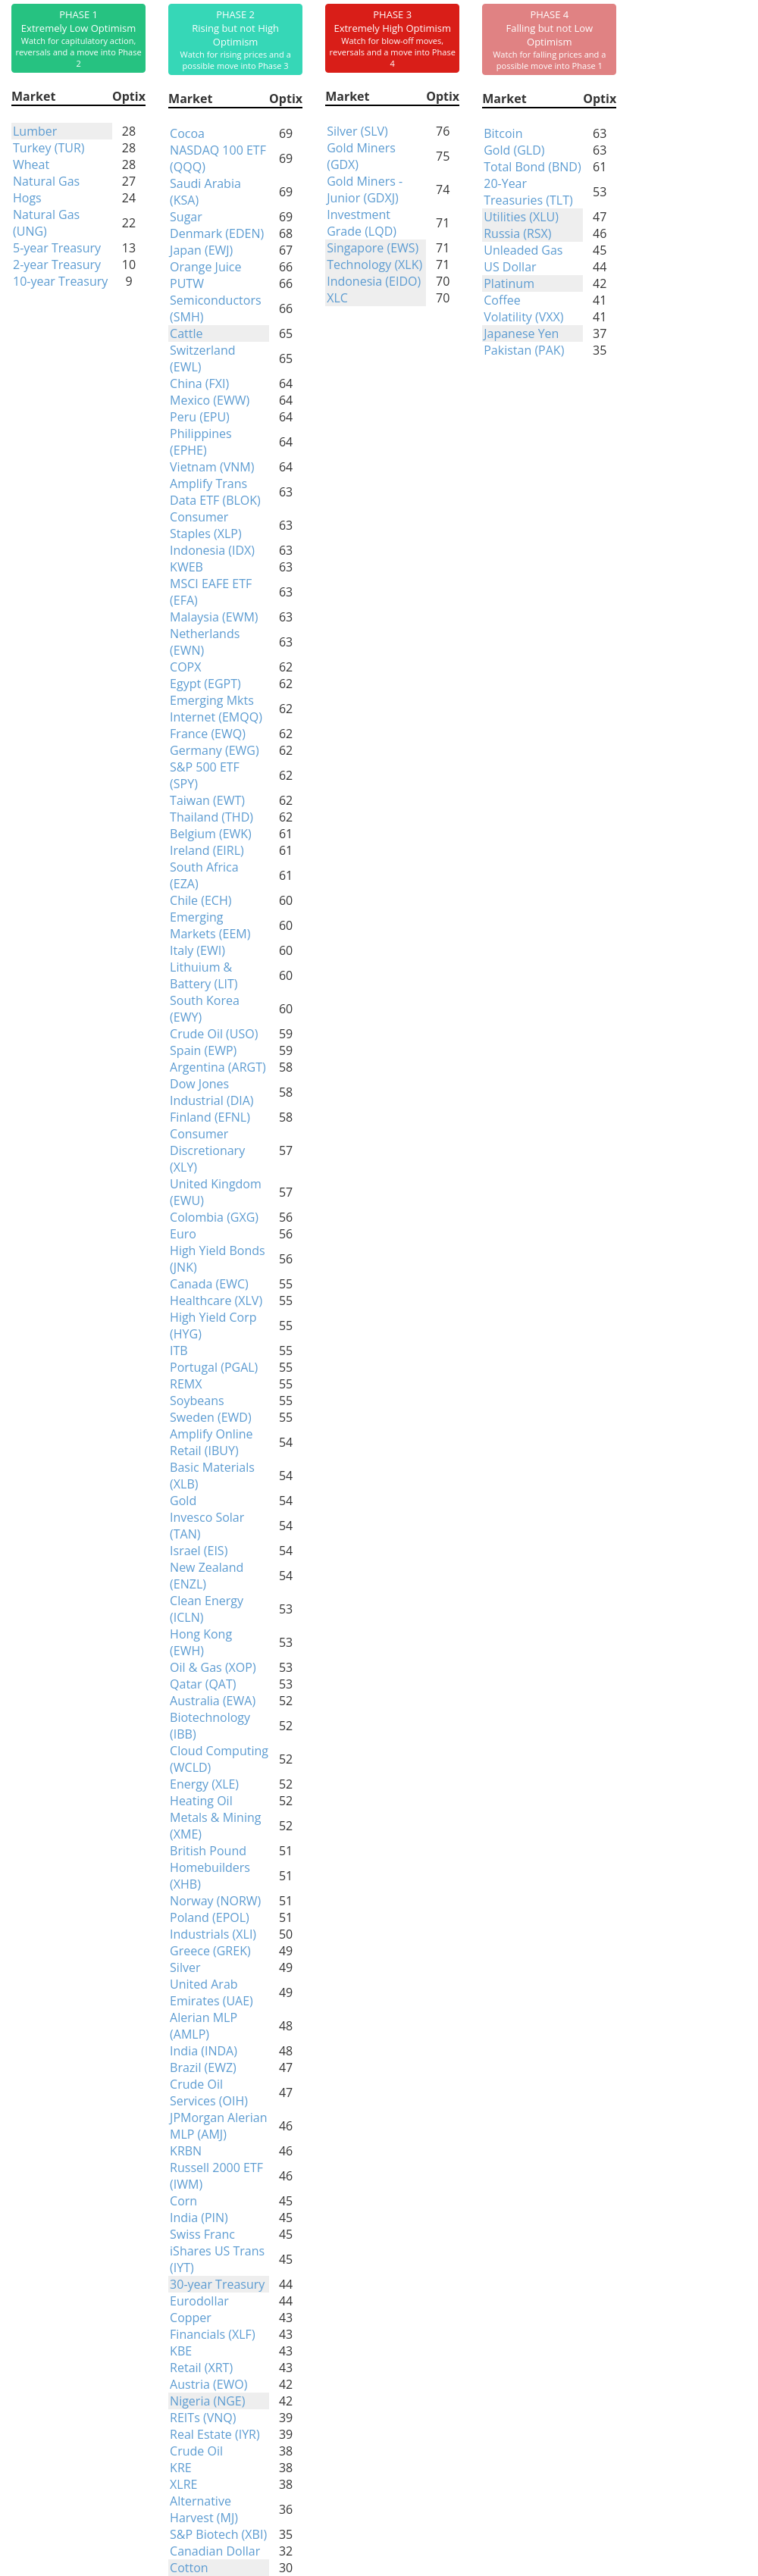
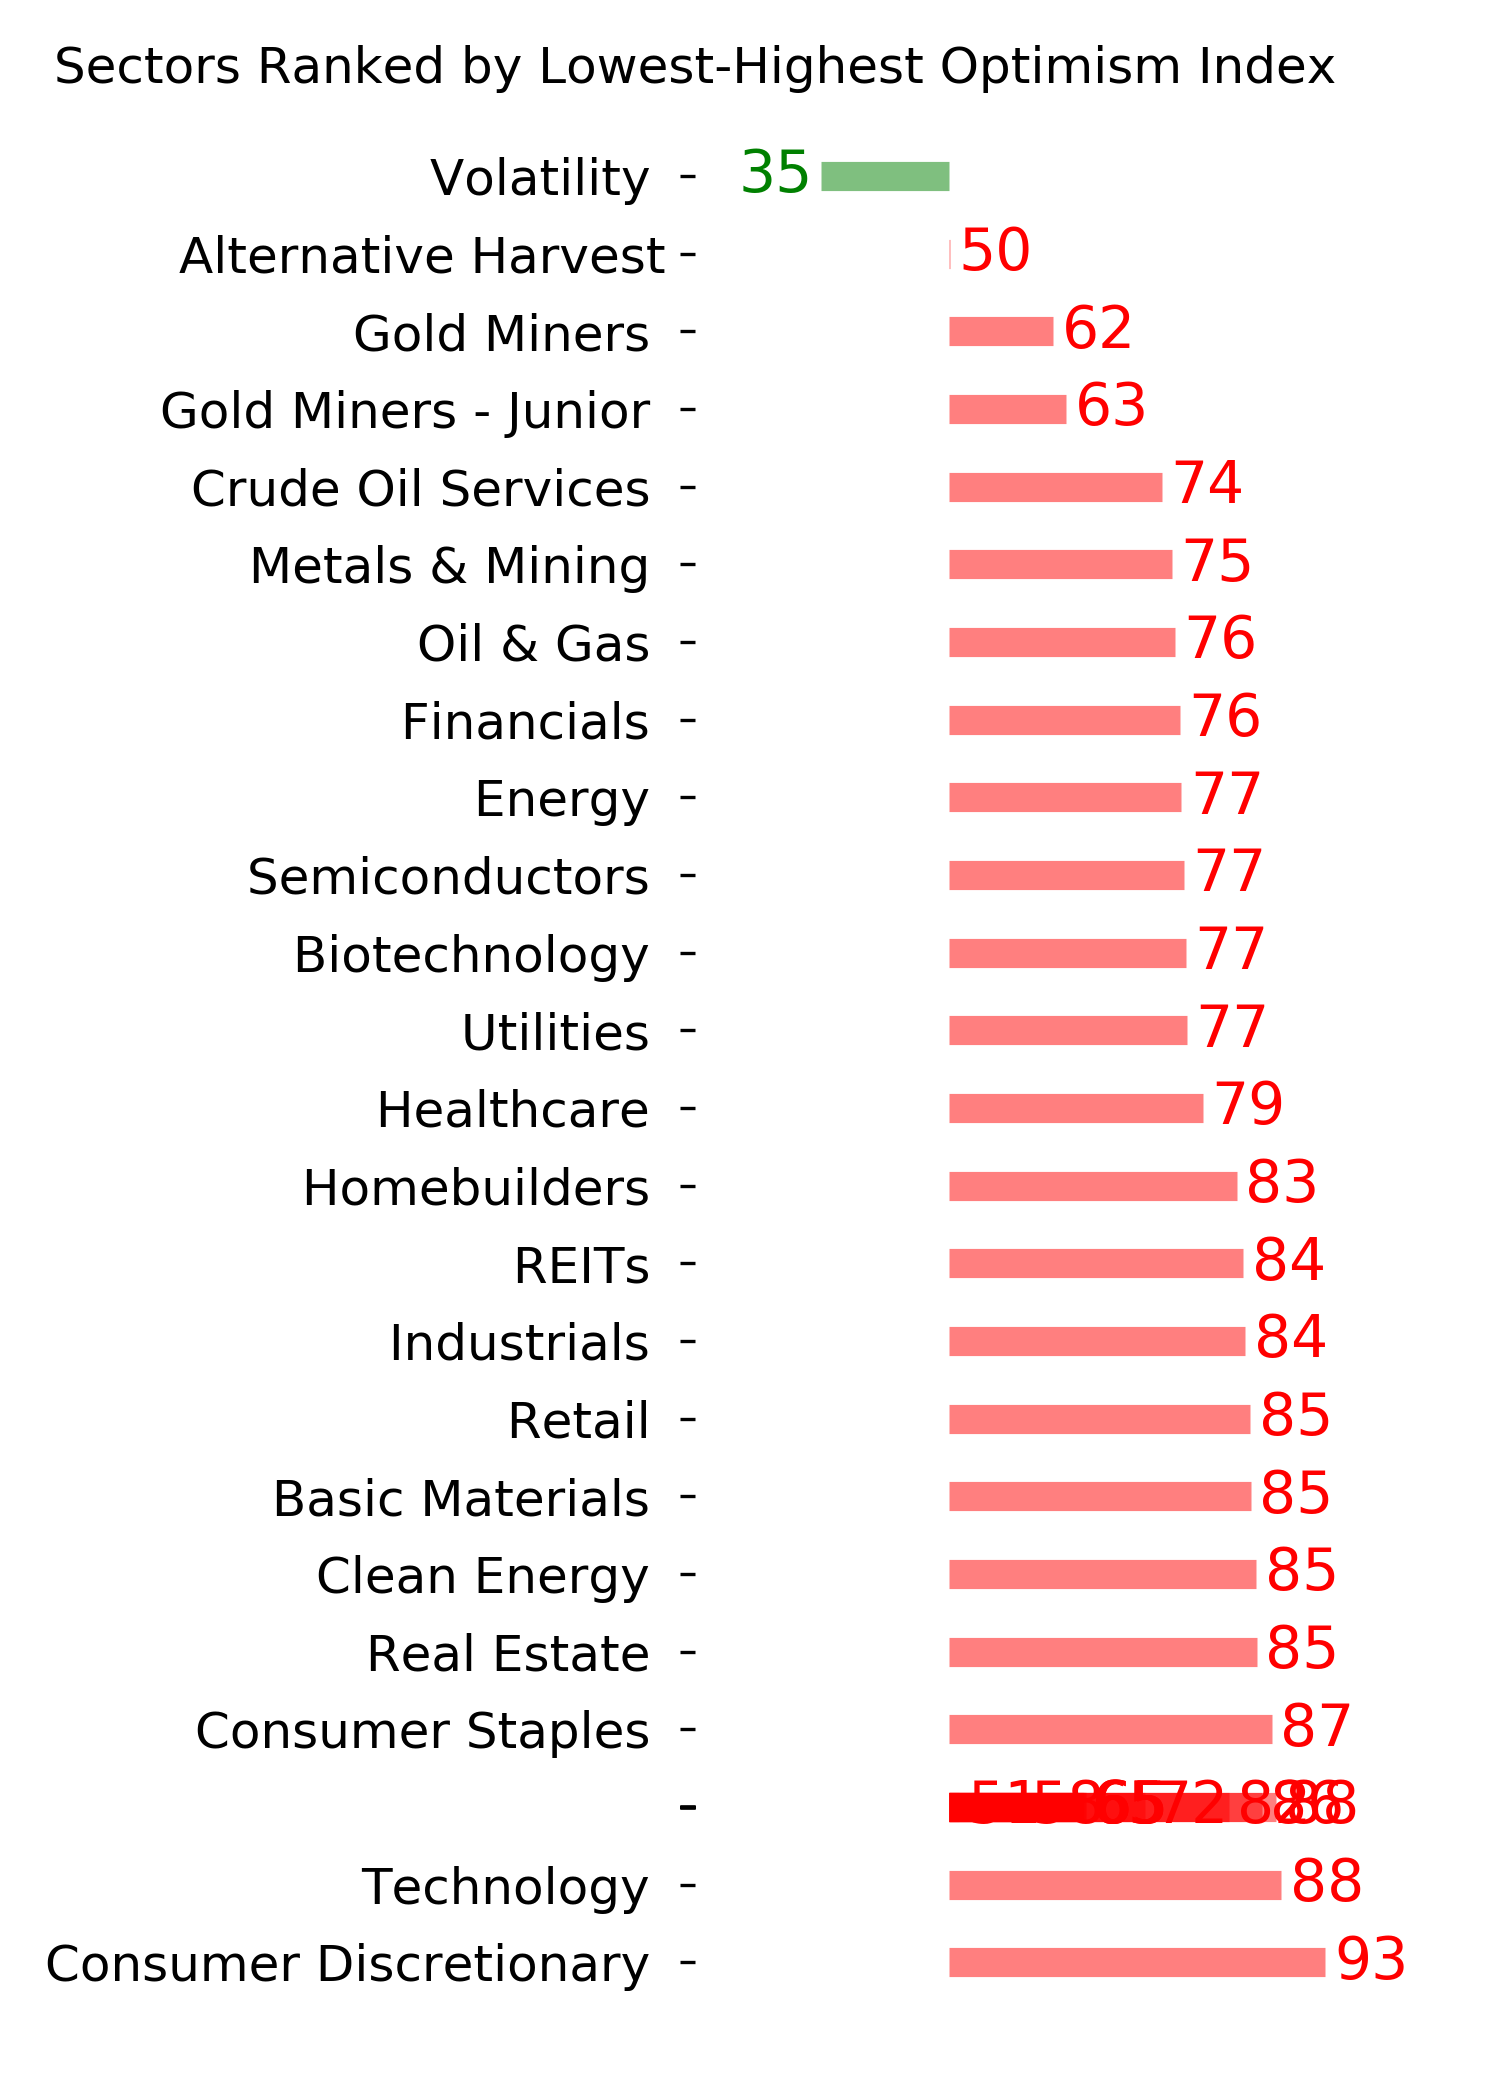
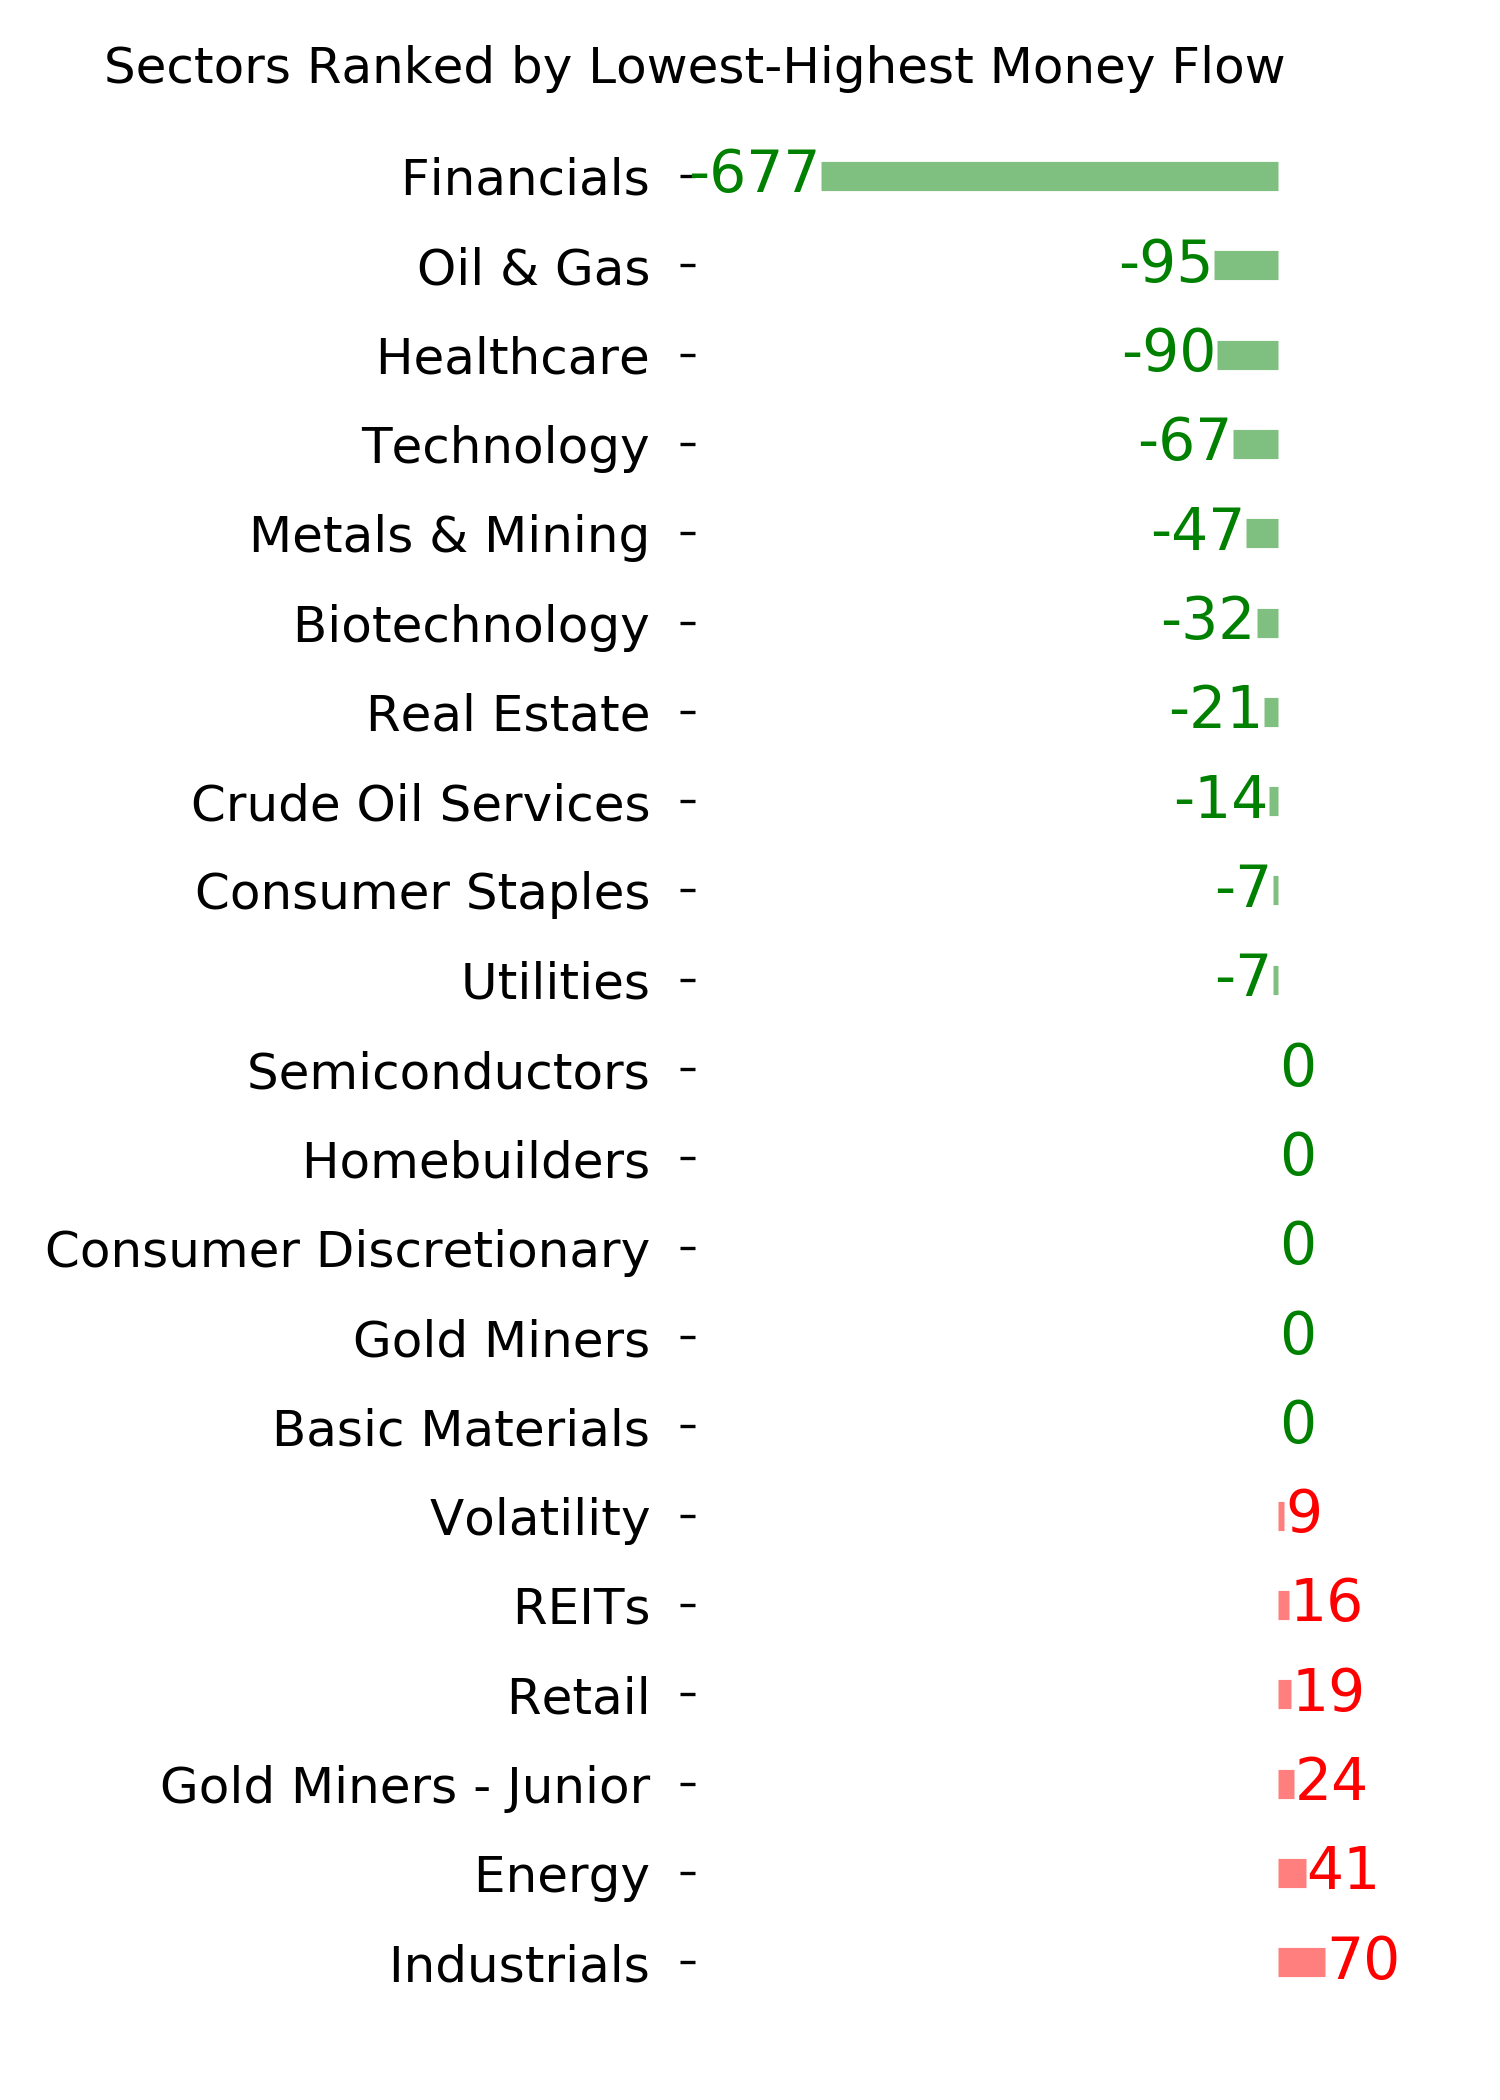
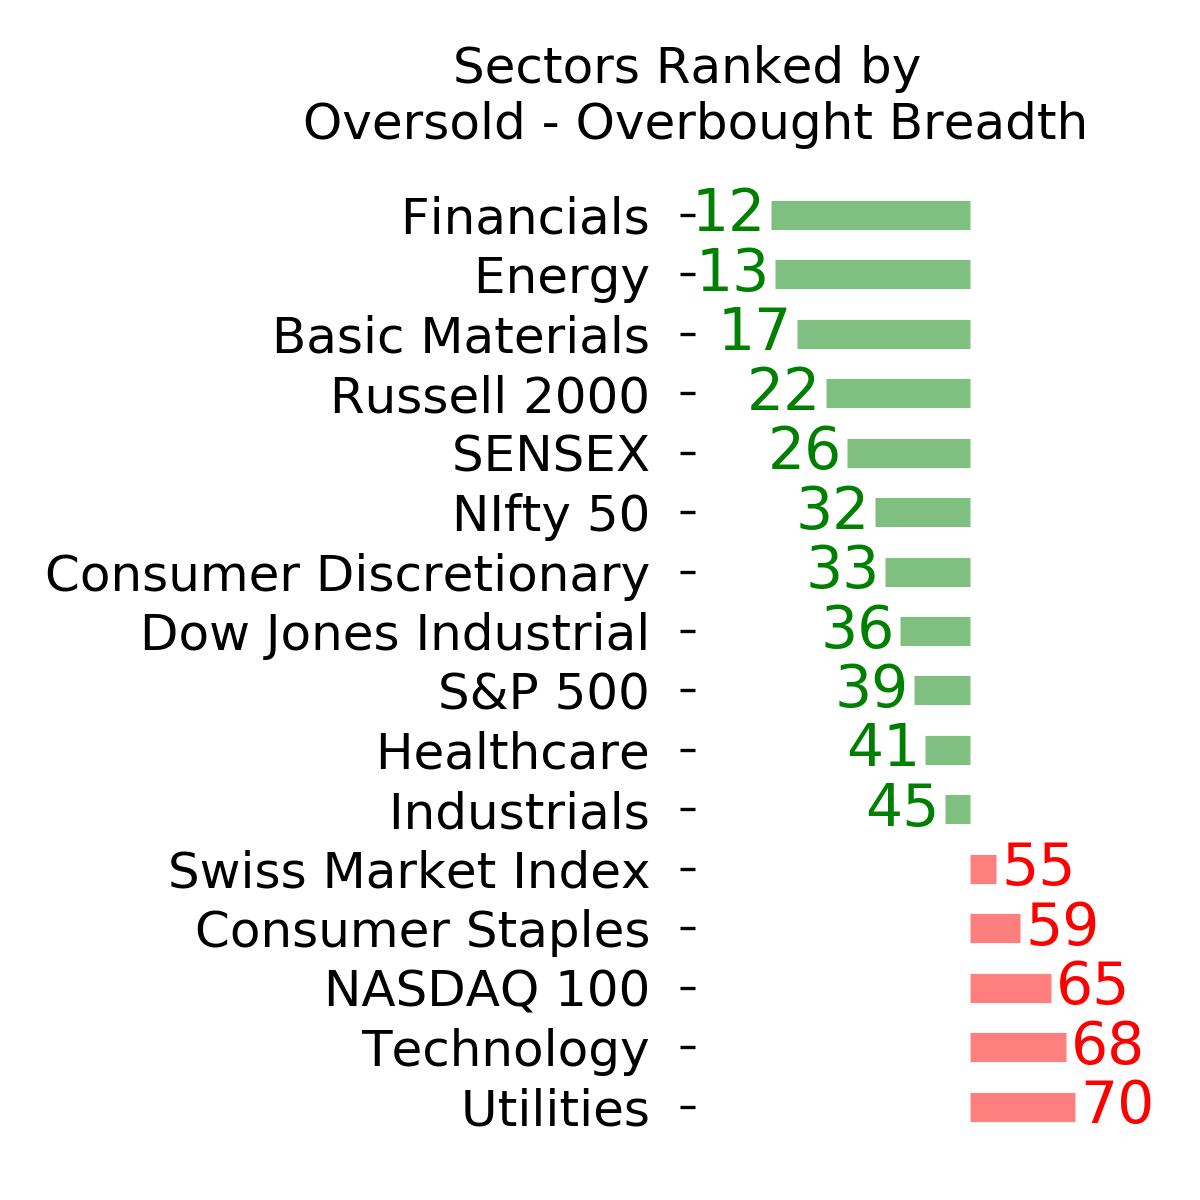
Ranks
|
|
|
|
|
|
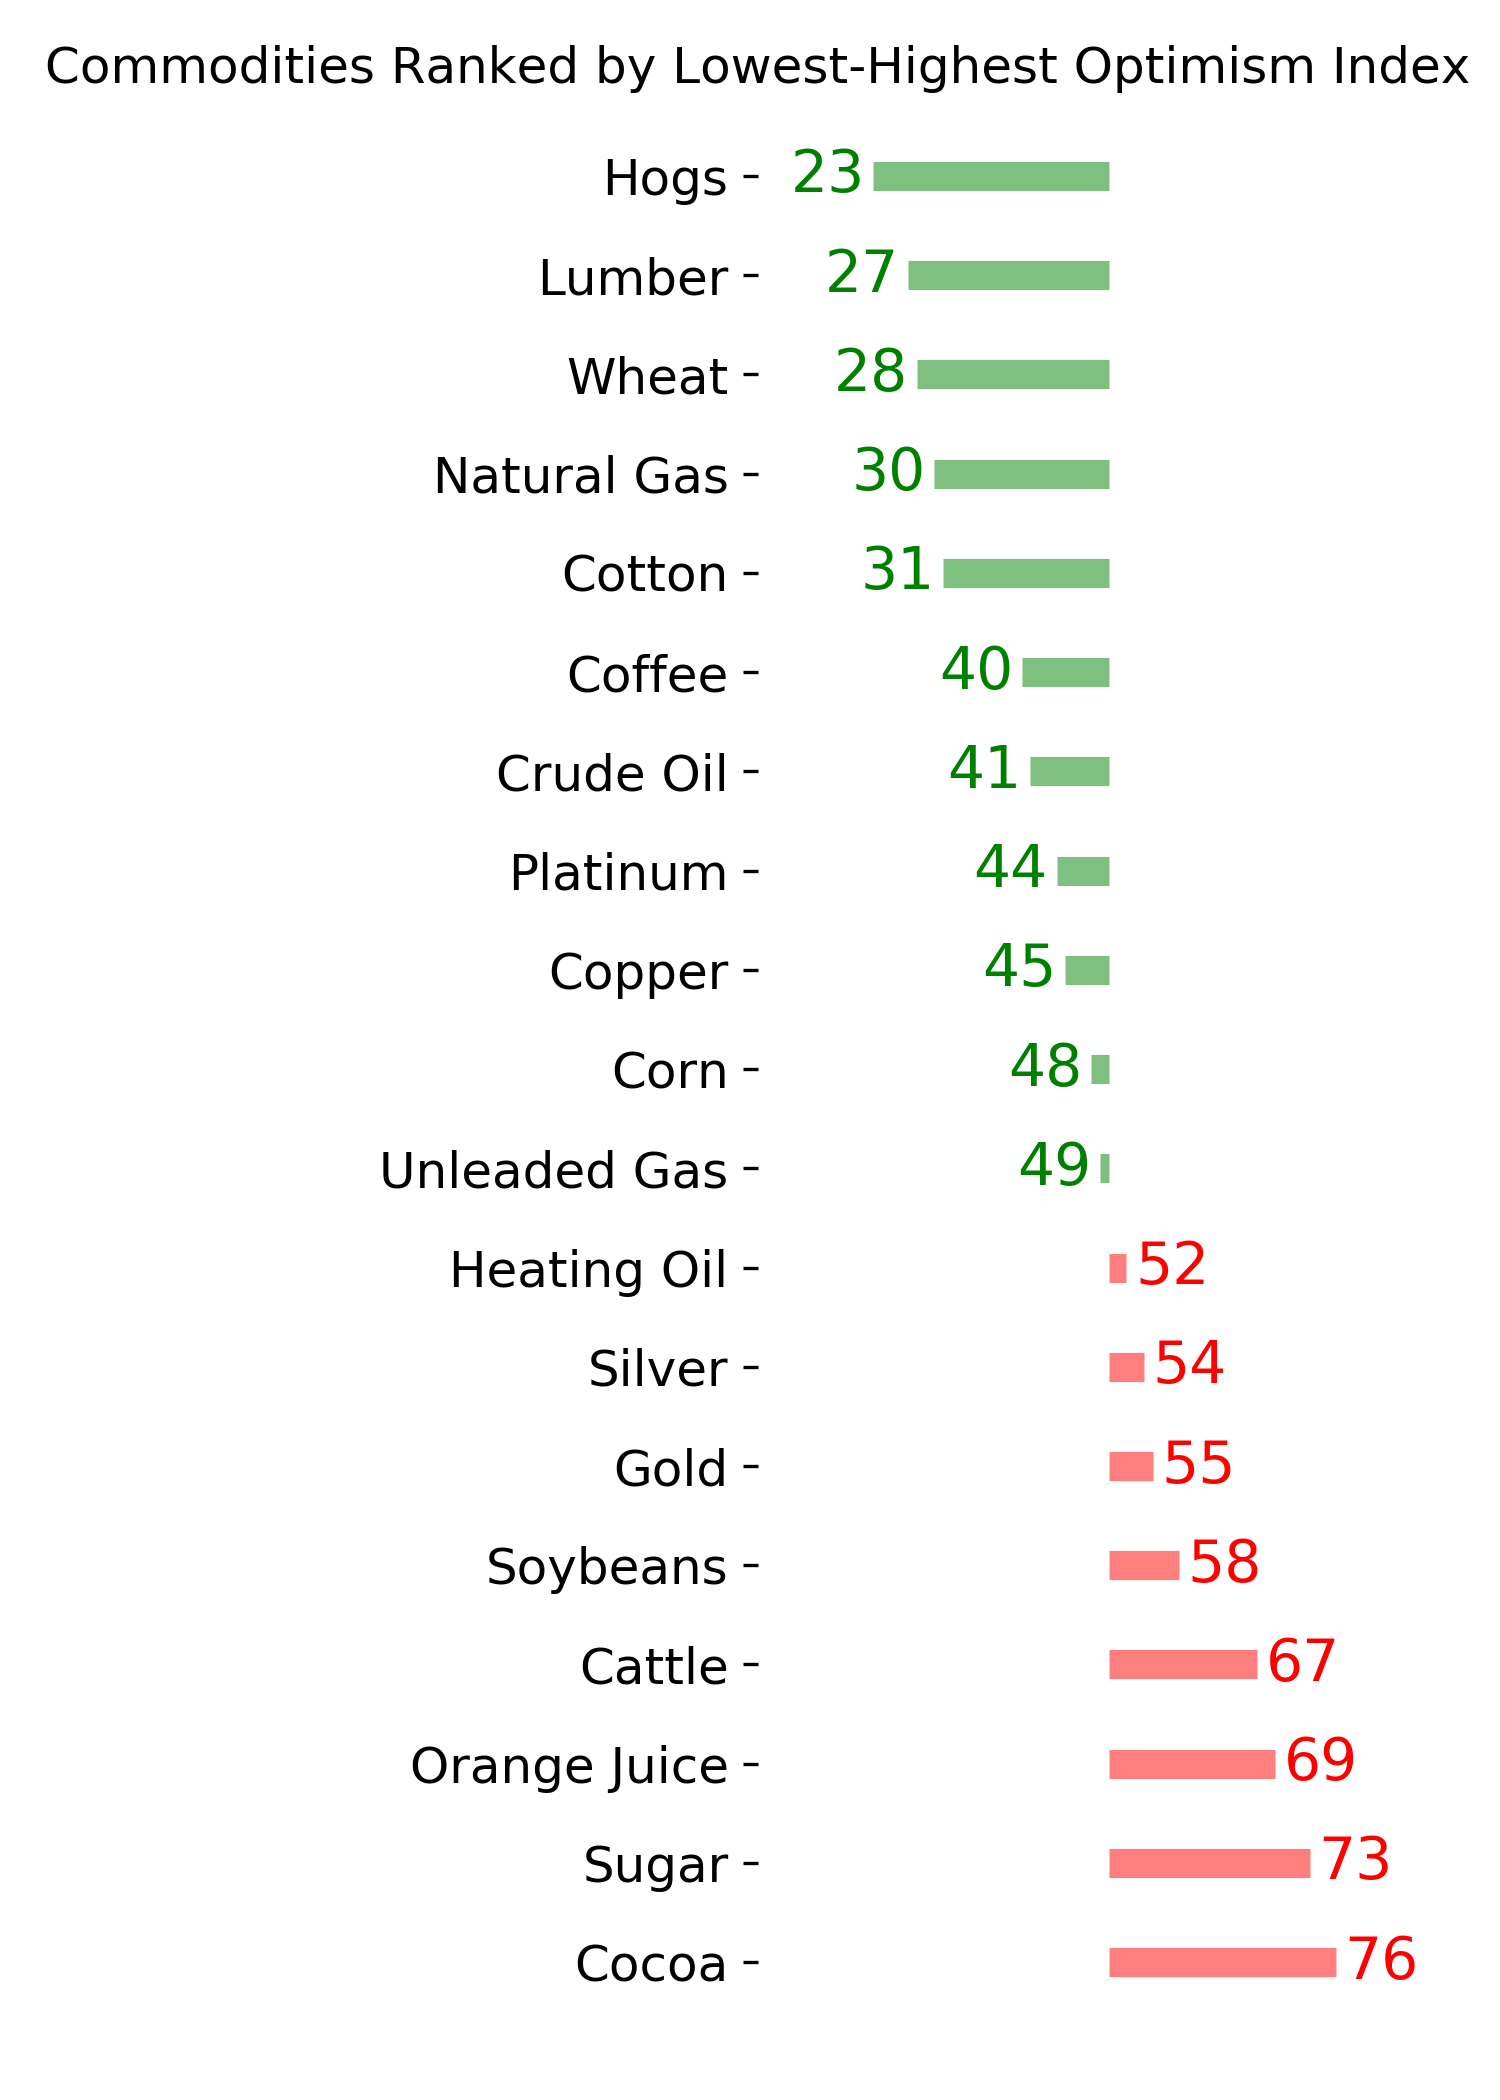
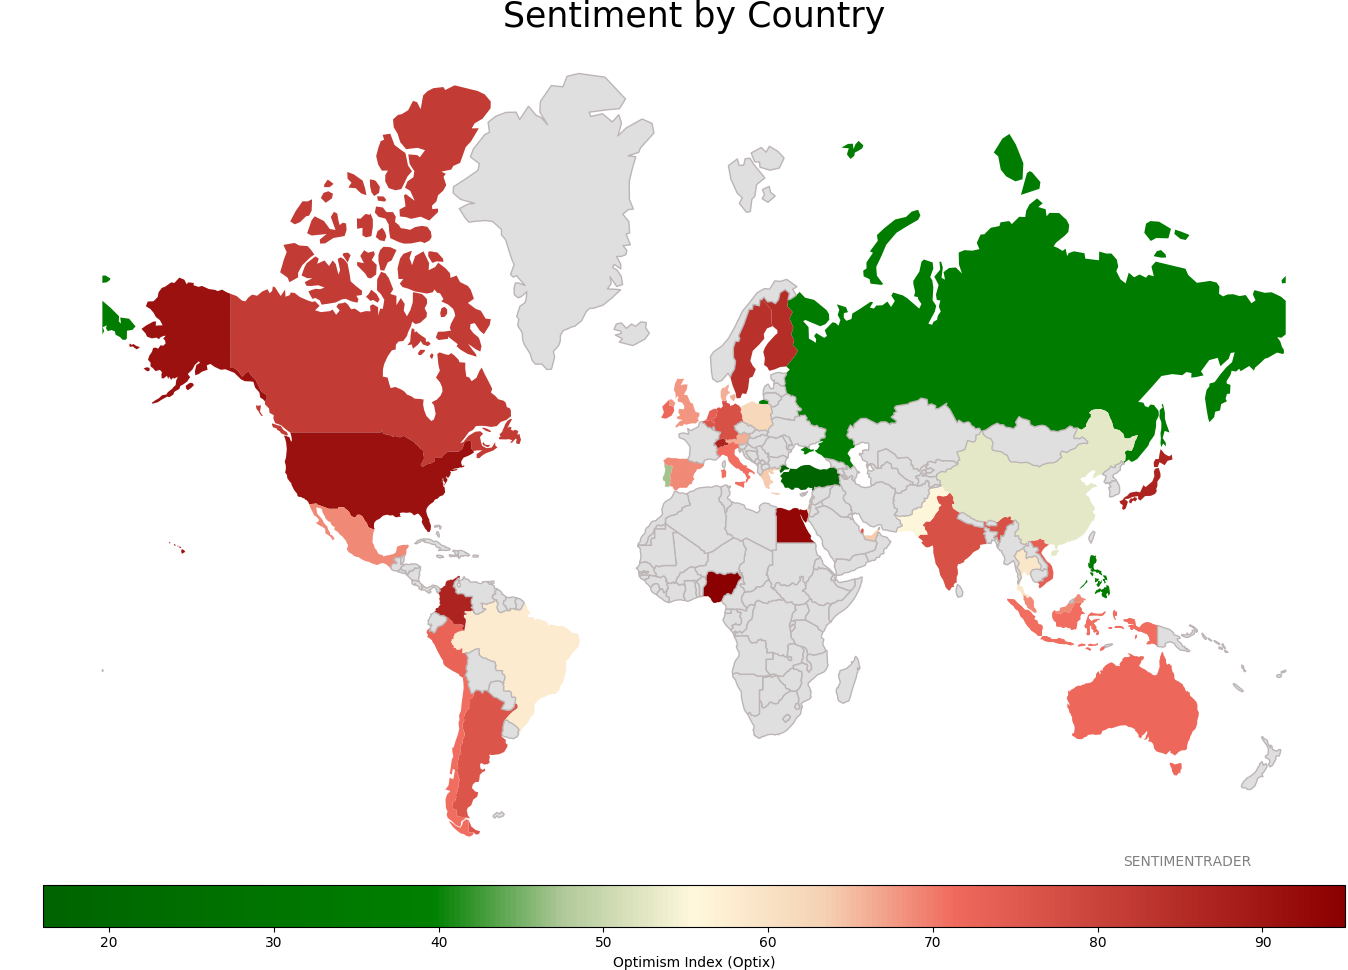
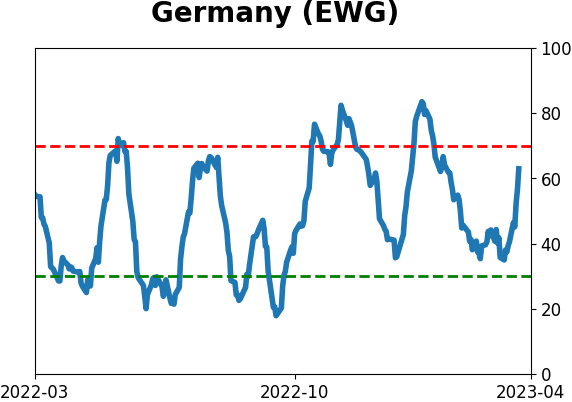
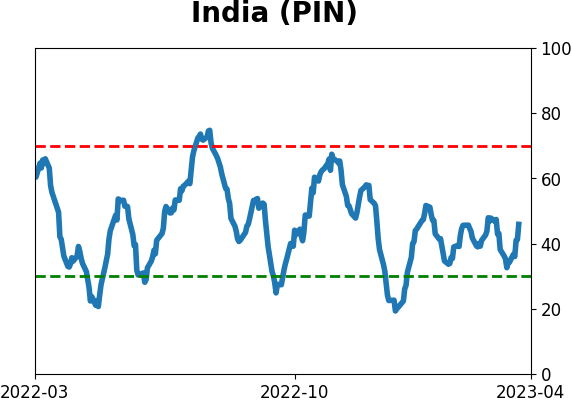
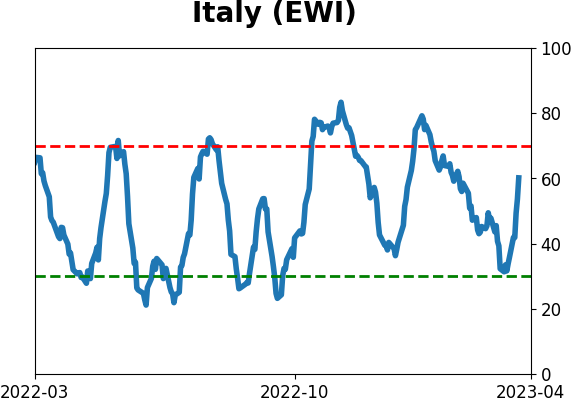
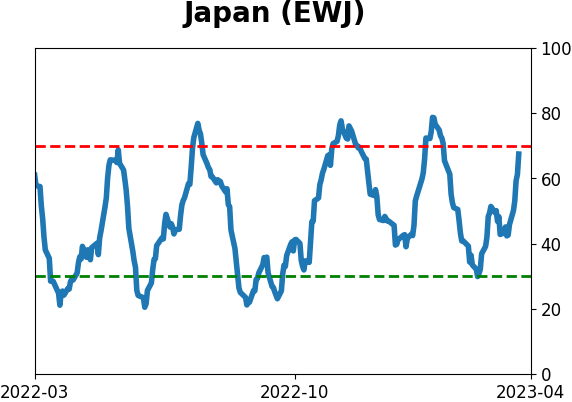
Sentiment Around The World
|
|
|
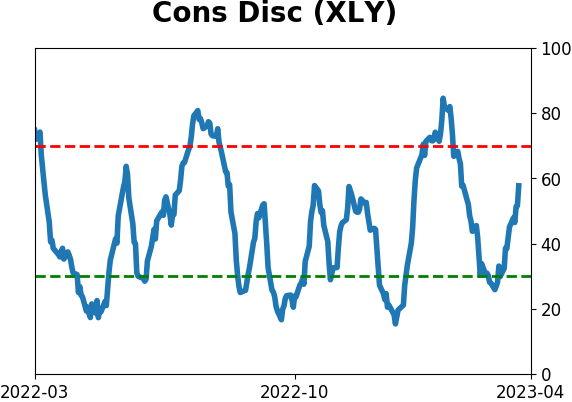
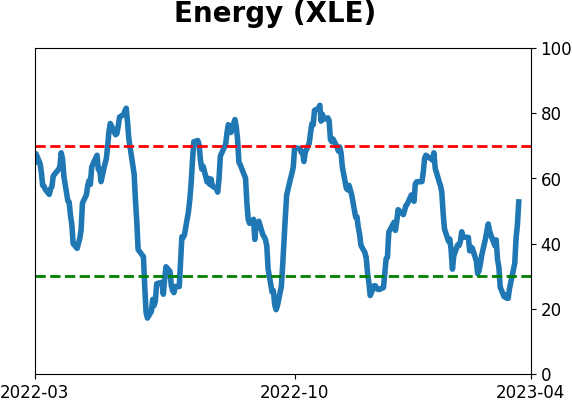
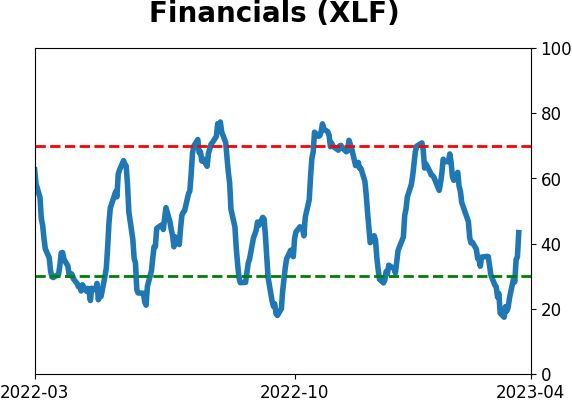
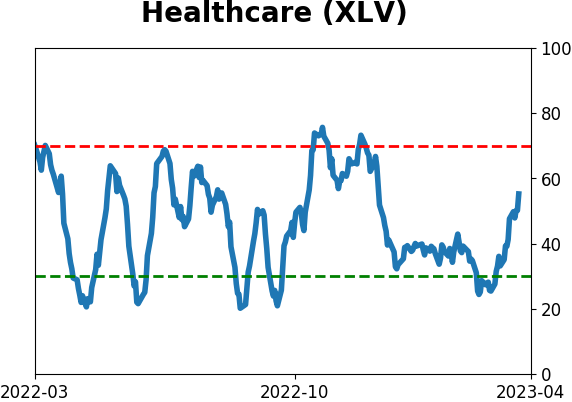
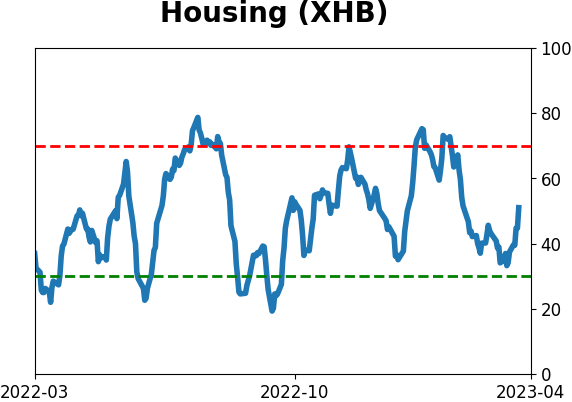
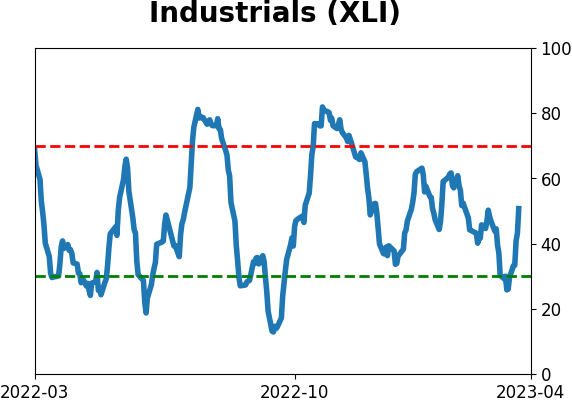
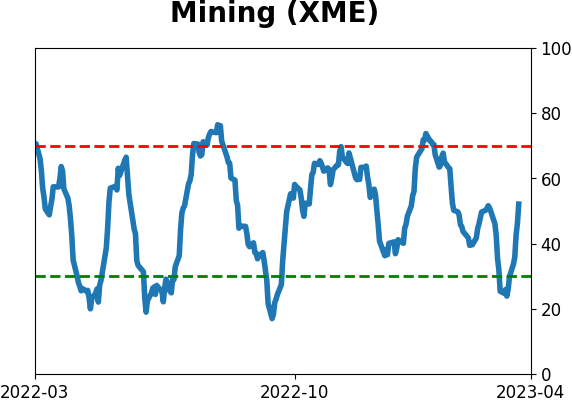
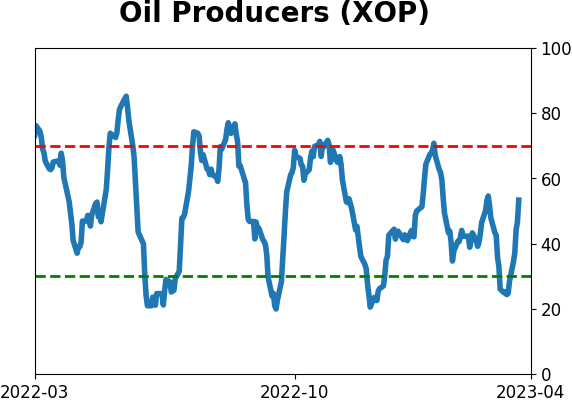
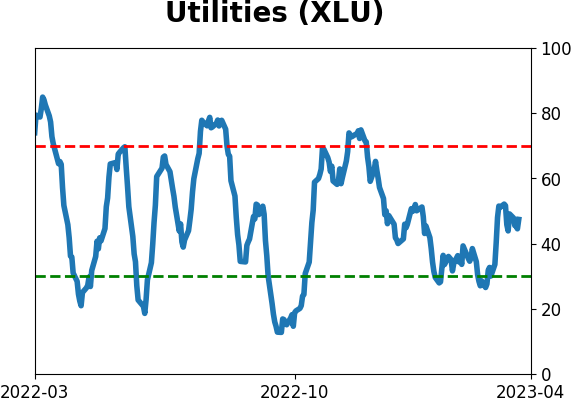
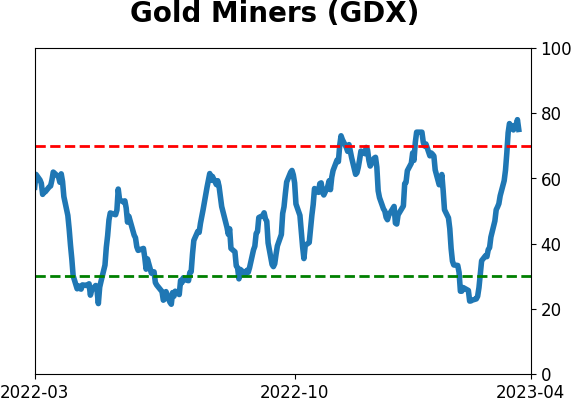
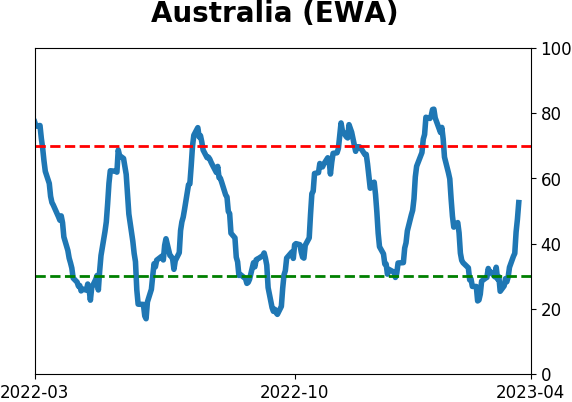
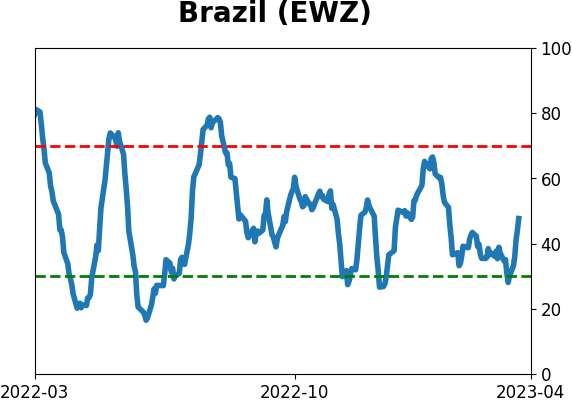
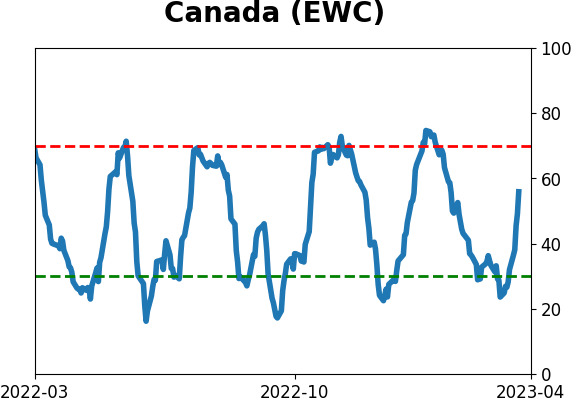
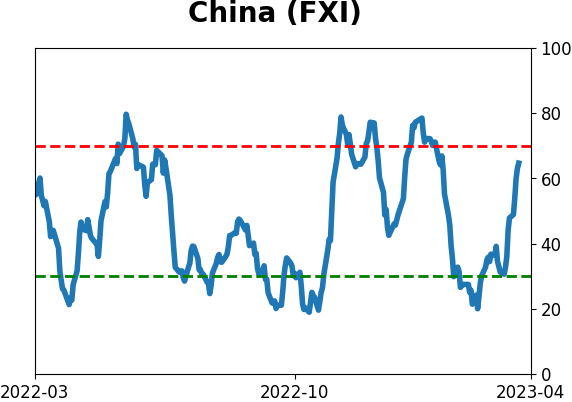
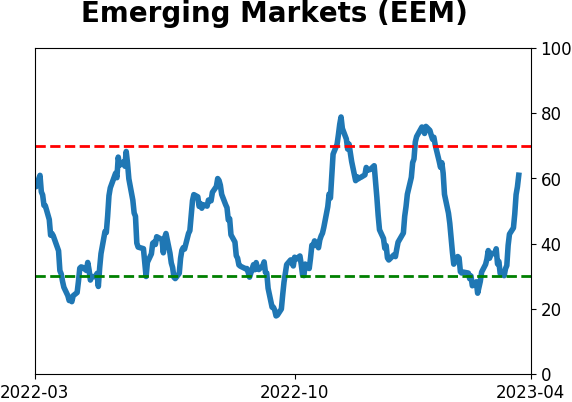
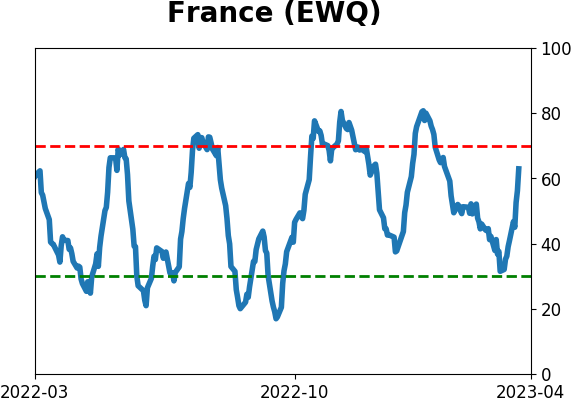
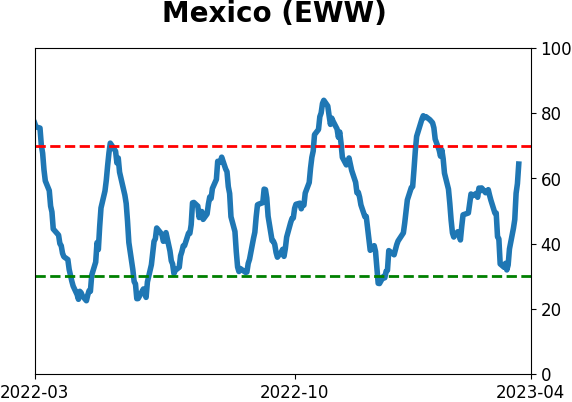
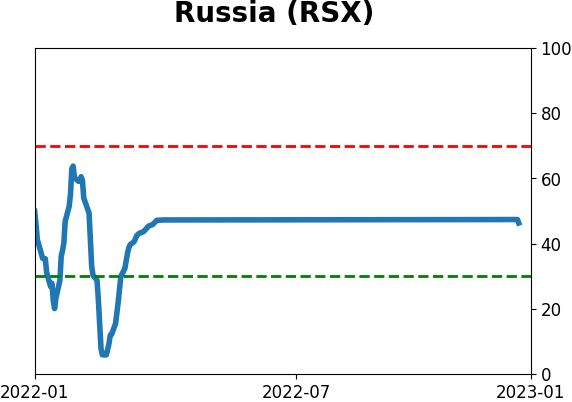
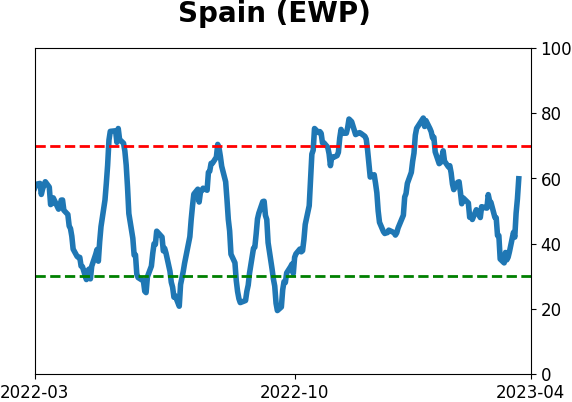
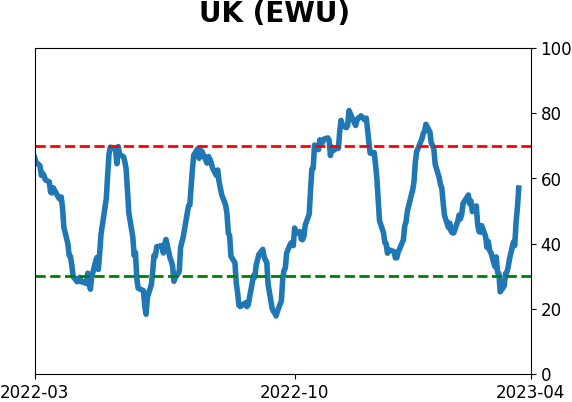
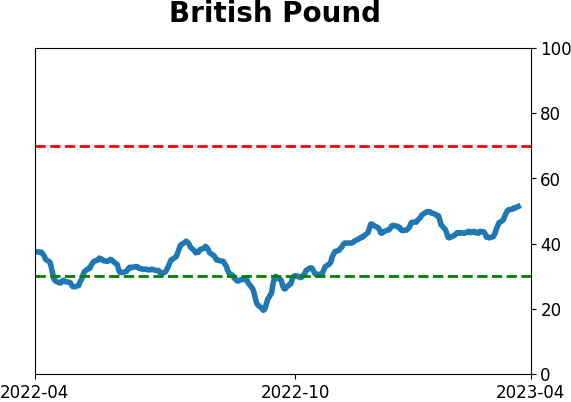
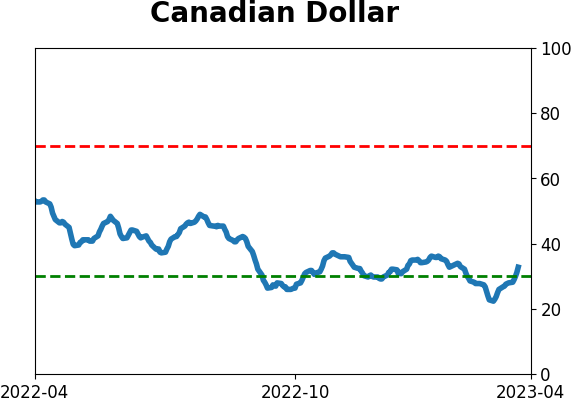
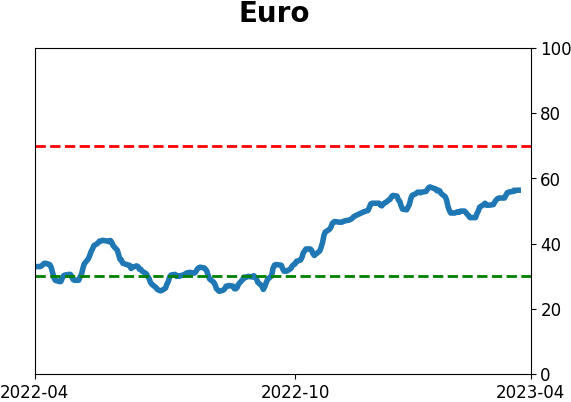
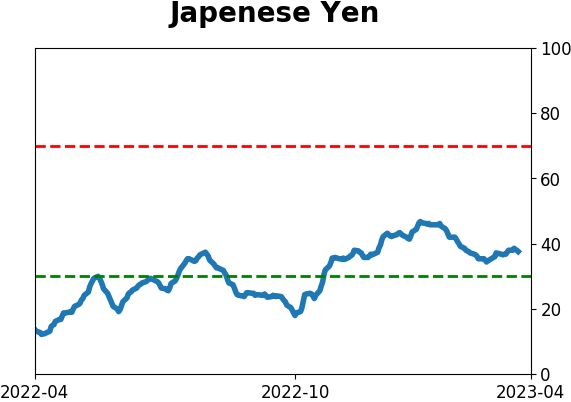
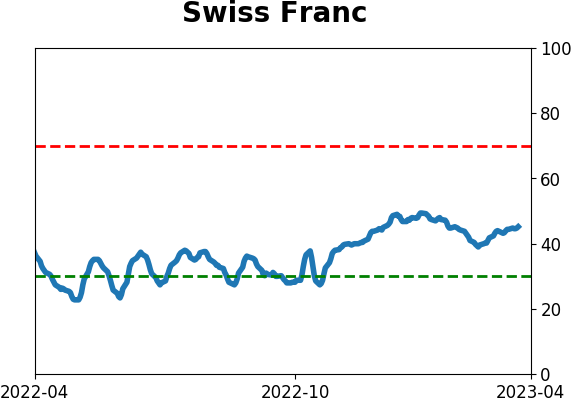
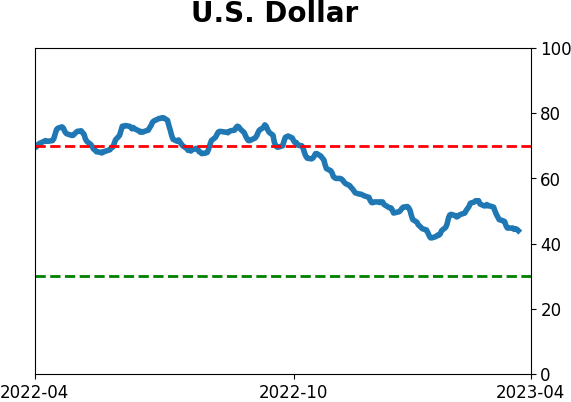
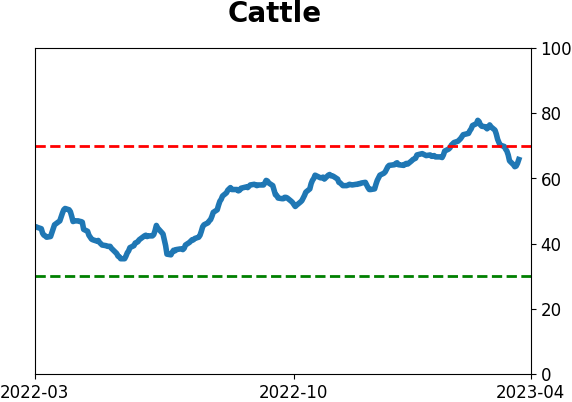
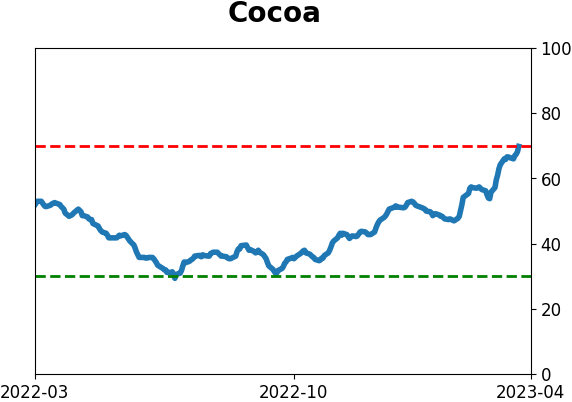
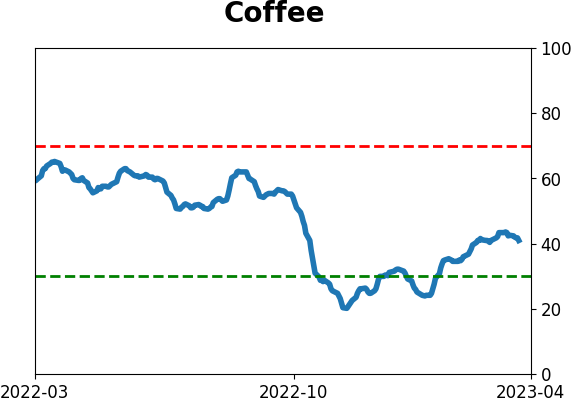
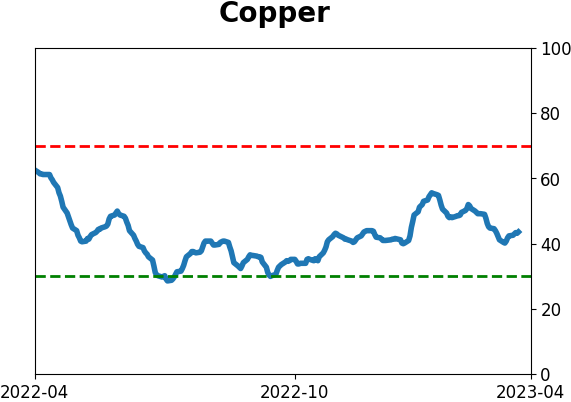
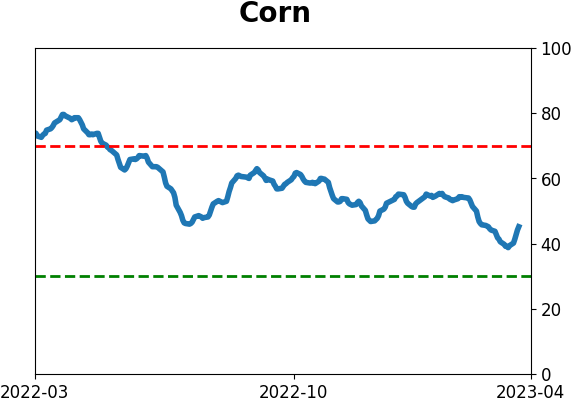
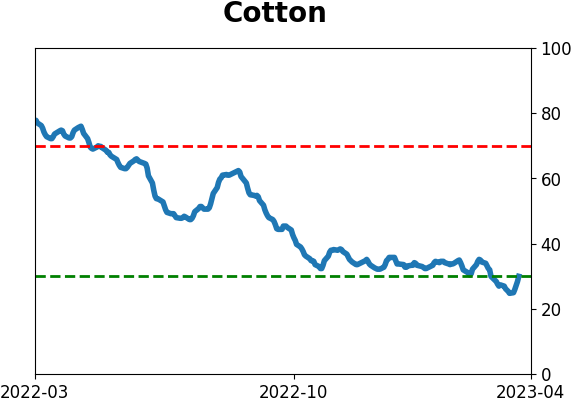
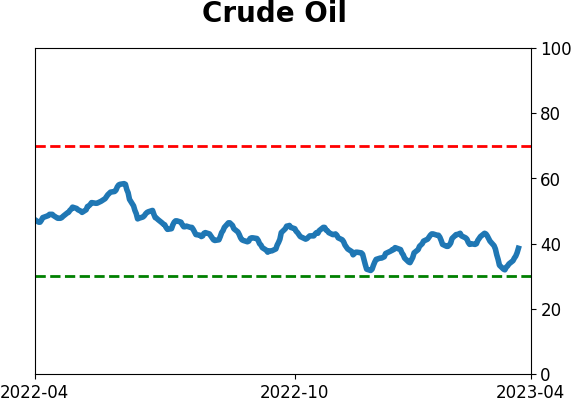
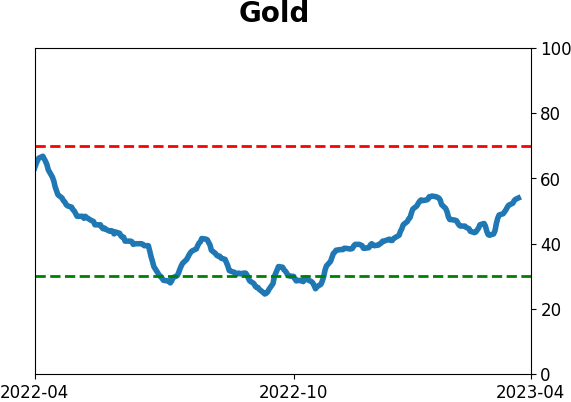
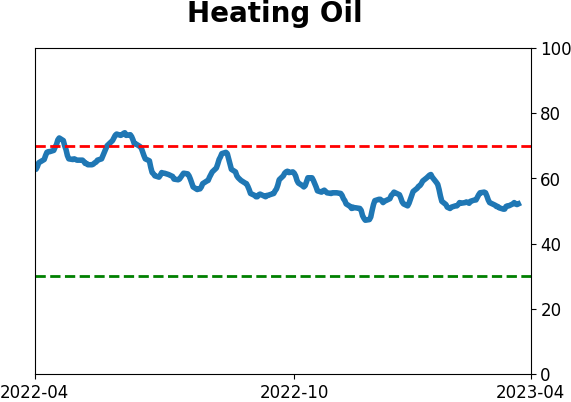
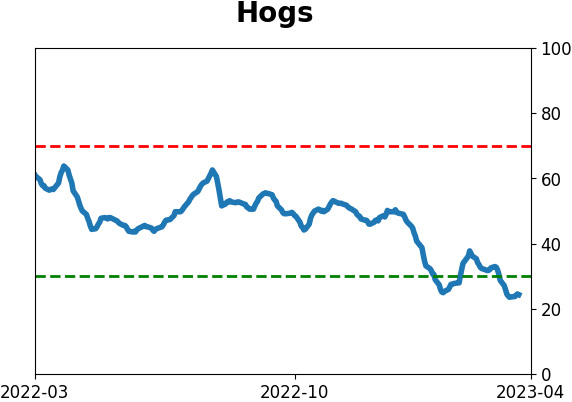
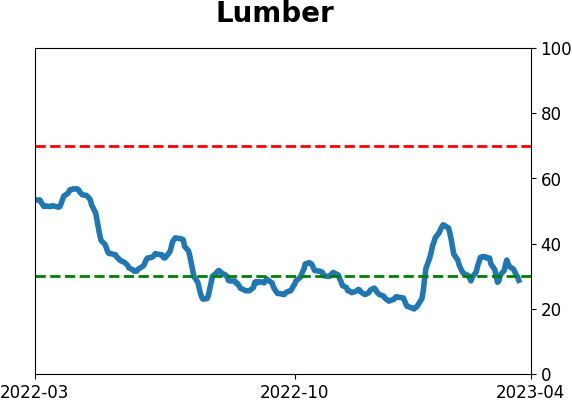
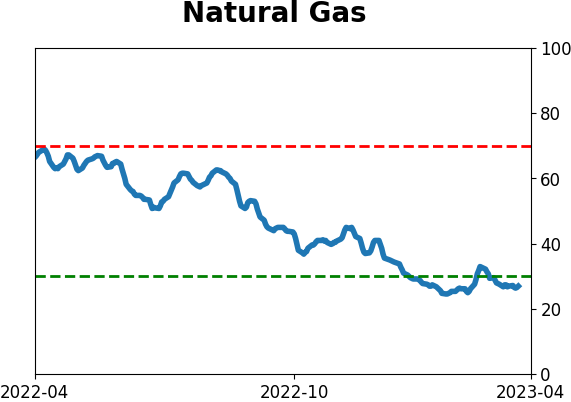
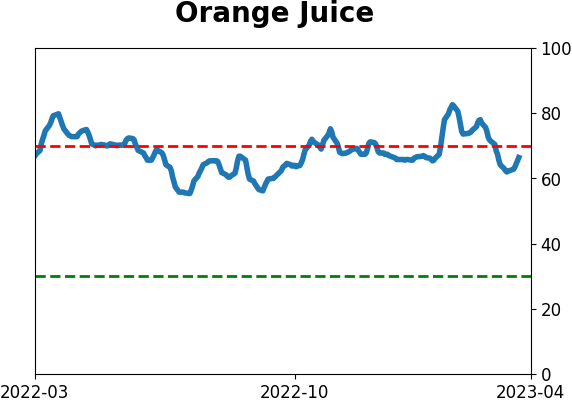
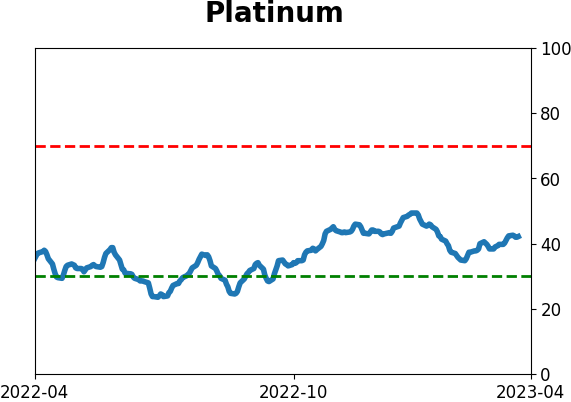
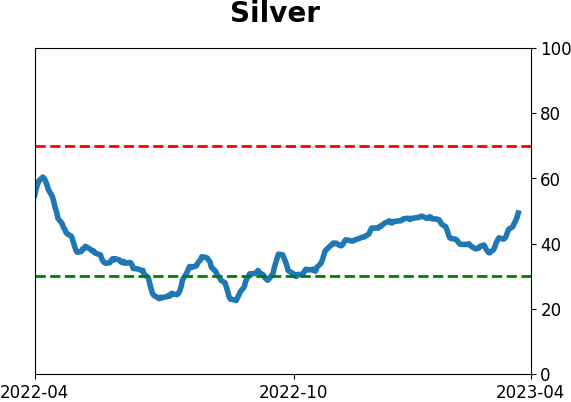
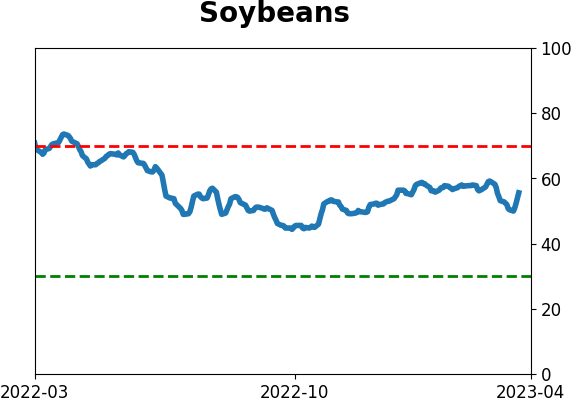
Optimism Index Thumbnails
|
|
|
|
|
|
|
|
|
|
|
|
|
|
|
|
|
|
|
|
|