Headlines
|
|
The McClellans couldn't be happier about moves in the S&P 500:
A surge in stocks in the S&P 500 has cycled its McClellan Oscillator from below -100 to above +100. Similar cycles since 1950 have preceded further gains over the next year almost without exception. This thrust has also allowed the Summation Index to move into its most positive configuration, above zero and rising.
|
Smart / Dumb Money Confidence
|
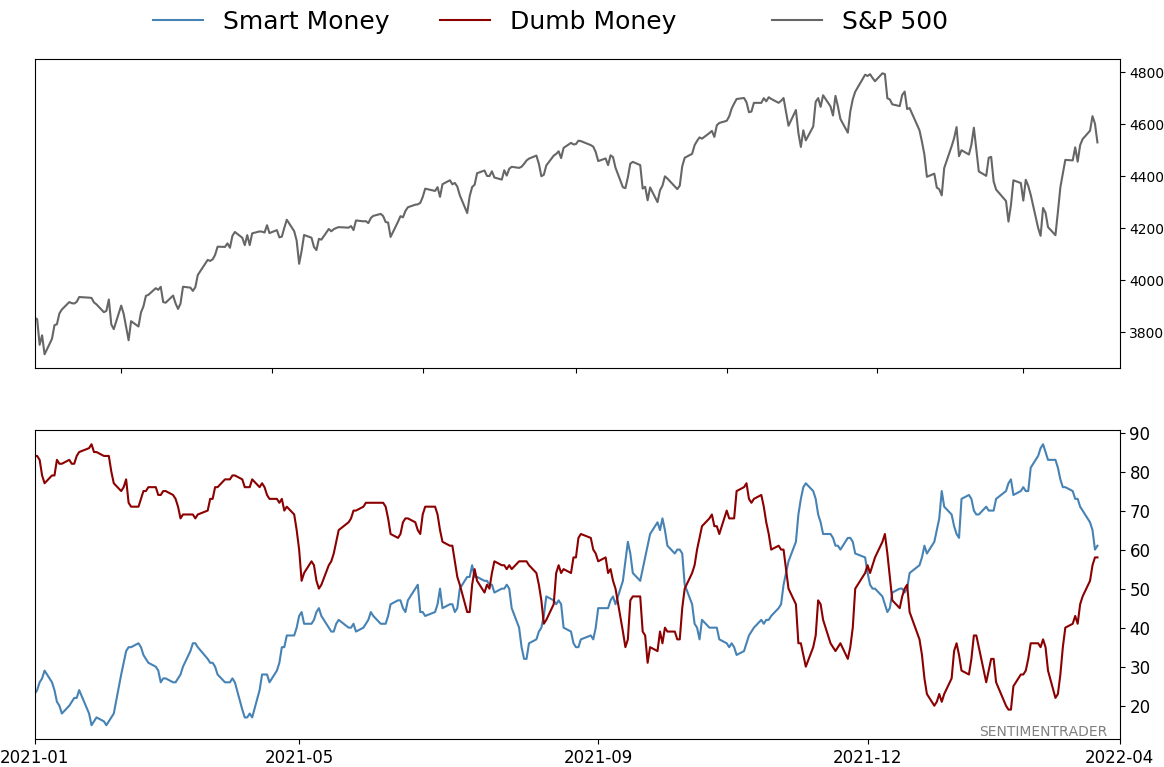
Smart Money Confidence: 61%
Dumb Money Confidence: 58%
|
|
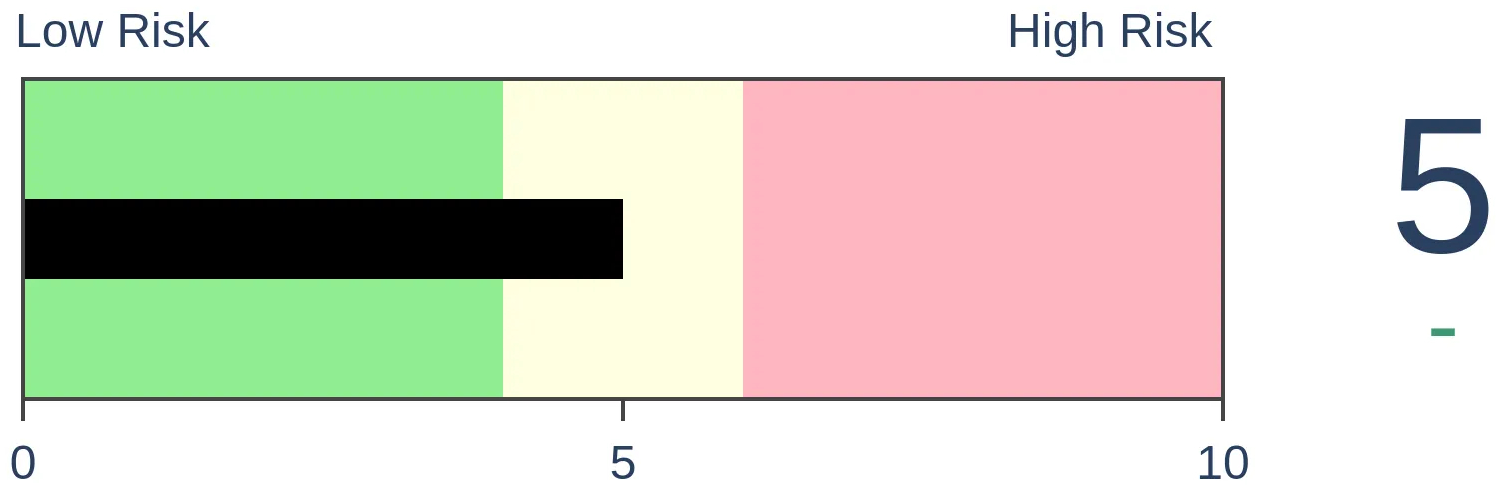
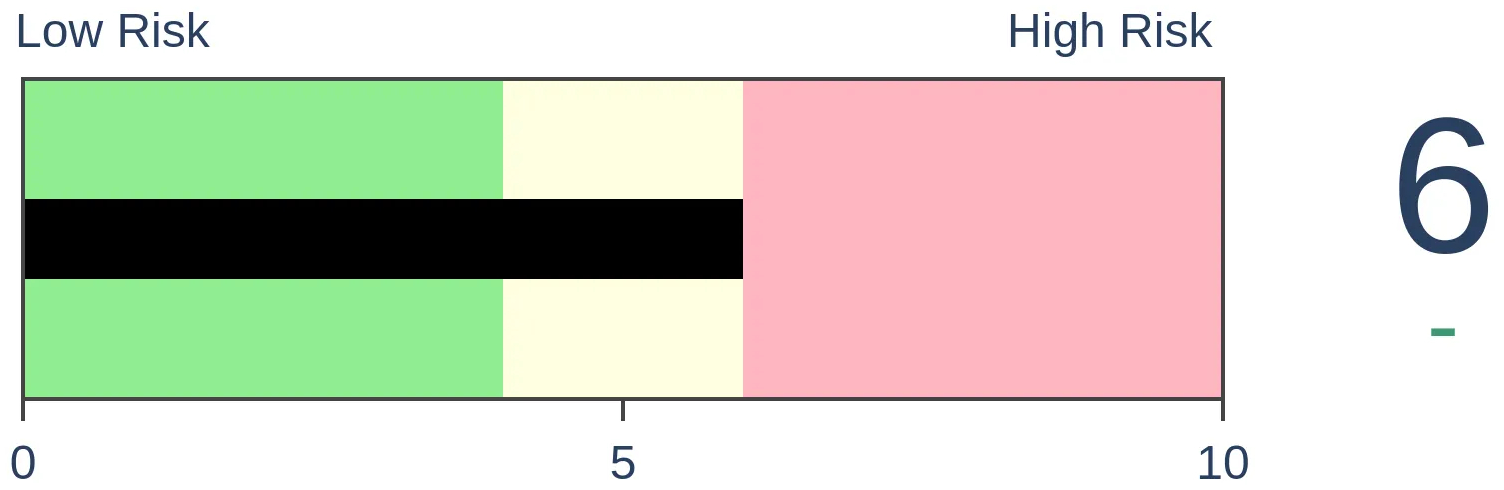
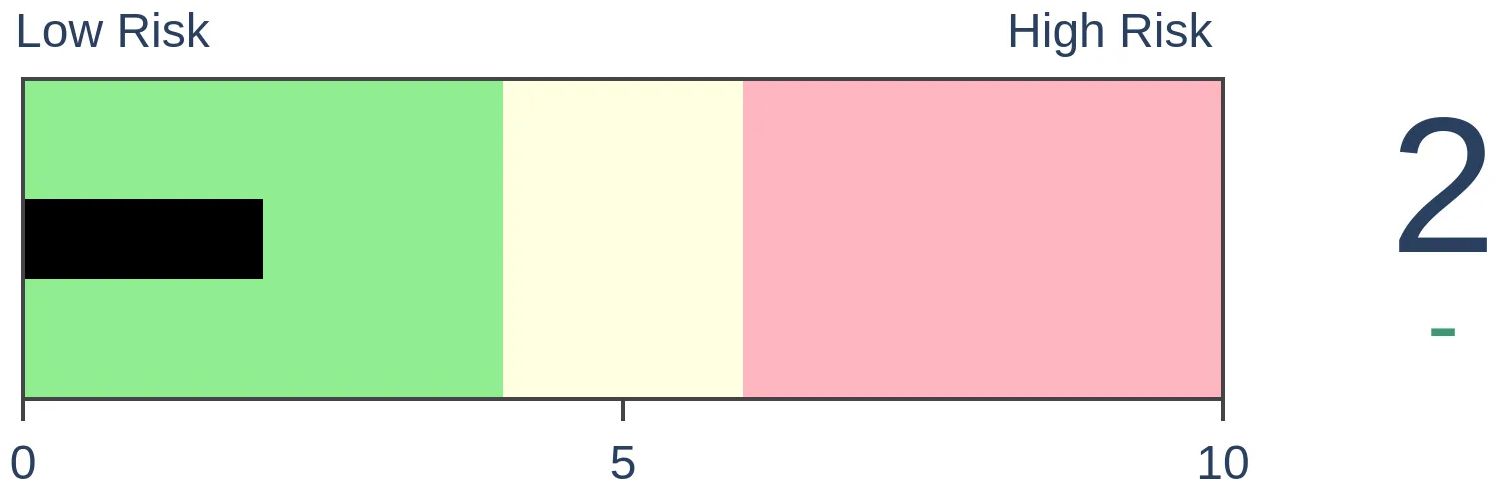
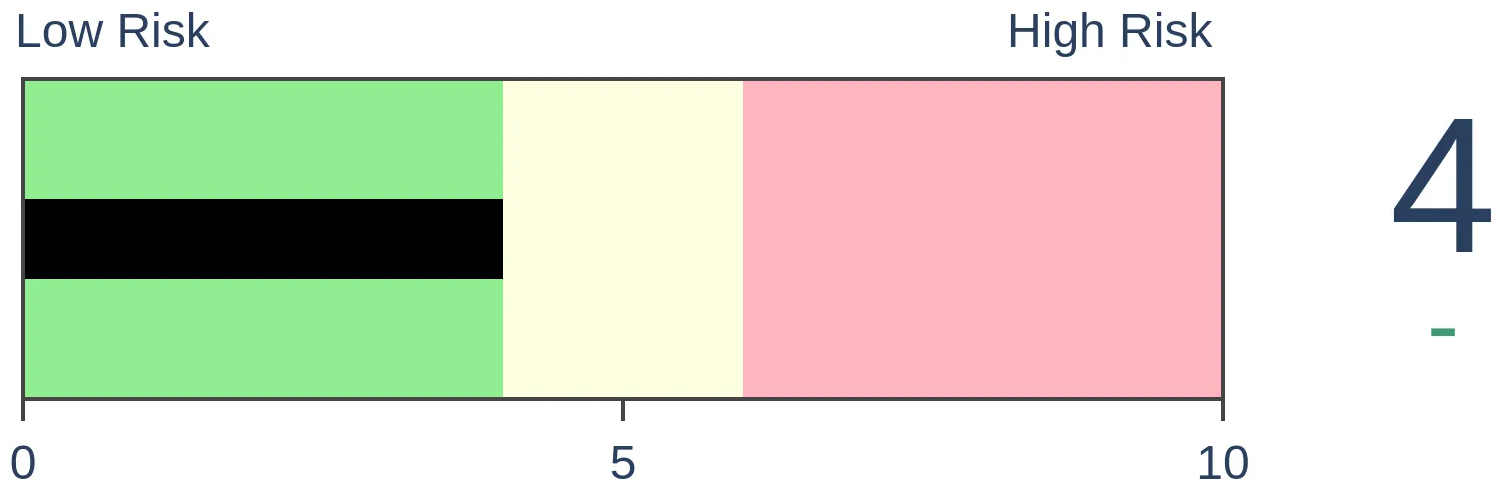
Risk Levels
Stocks Short-Term
|
Stocks Medium-Term
|
|
Bonds
|
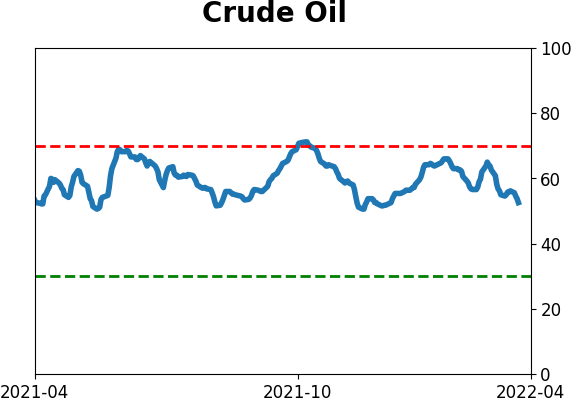
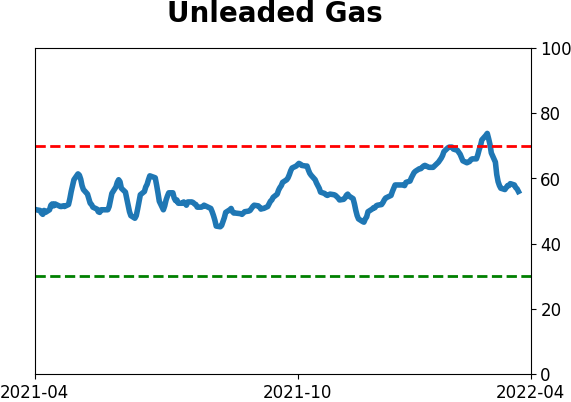
Crude Oil

|
|
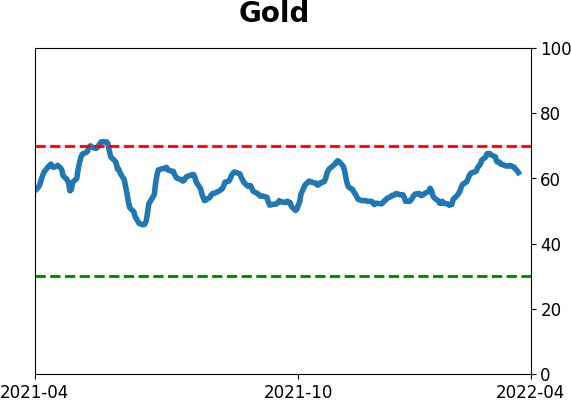
Gold

|
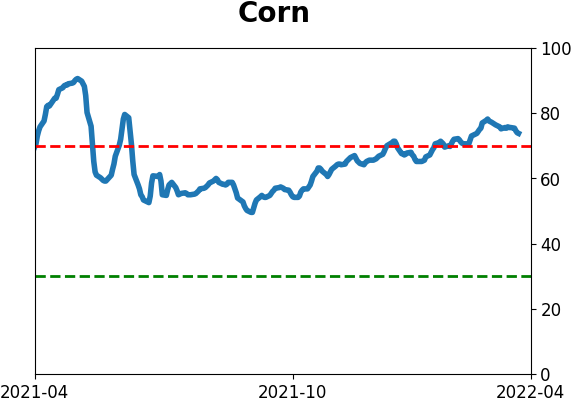
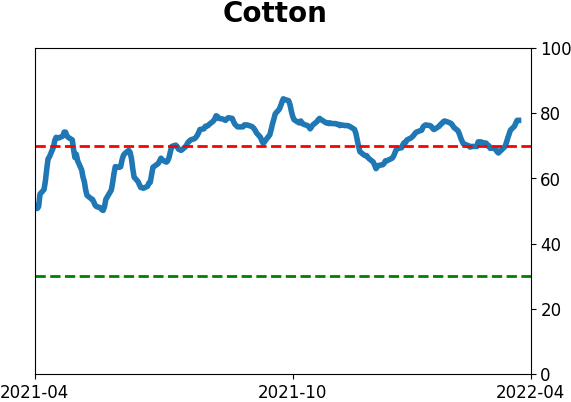
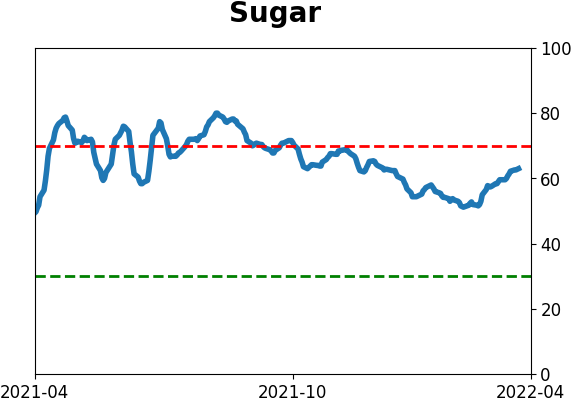
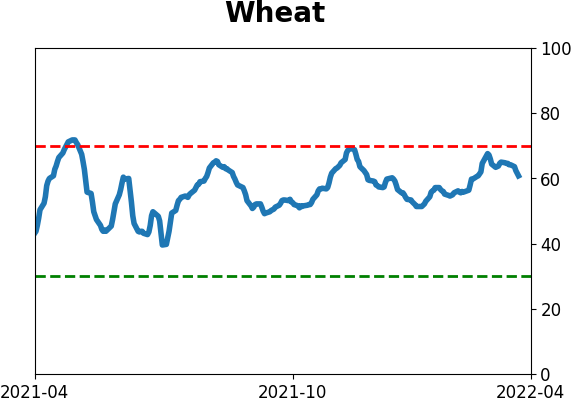
Agriculture
|
|
Research
By Jason Goepfert
BOTTOM LINE
A surge in stocks in the S&P 500 has cycled its McClellan Oscillator from below -100 to above +100. Similar cycles since 1950 have preceded further gains over the next year almost without exception. This thrust has also allowed the Summation Index to move into its most positive configuration, above zero and rising.
FORECAST / TIMEFRAME
SPY -- Up, Long-Term
|
Key points:
- The McClellan Oscillator for the S&P 500 has cycled from -100 to +100
- That kind of recovery has triggered gains over the next year almost every time
- The Summation Index has also moved into its most positive configuration
A historic cycle in internal momentum
Over the past few weeks, we've looked at various thrusts underlying some of the impressive moves in major indexes. While there still hasn't been an impressive move in the net number of 52-week highs, shorter-term signs have been encouraging.
Among them is the momentum underlying the S&P 500, with the McClellan Oscillator for the S&P cycling from below -100 to above +100. The Oscillator is a spread between two exponential moving averages of the difference between daily advancing and declining stocks.
This is only the 3rd time the indicator has made such an extreme round trip over the past 5 years. The other two coincided with significant bottoms.
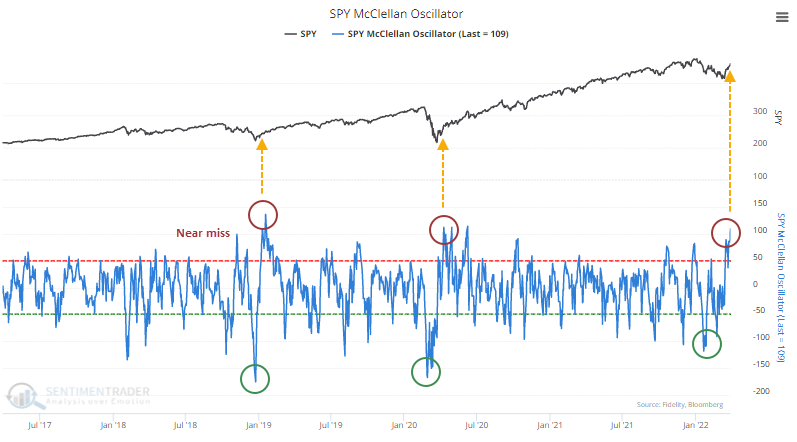
There have been 22 similar signals since 1950, times when the Oscillator underwent an extreme cycle within 50 days. After the others, the S&P 500 had an almost unblemished record of gains during the following year.
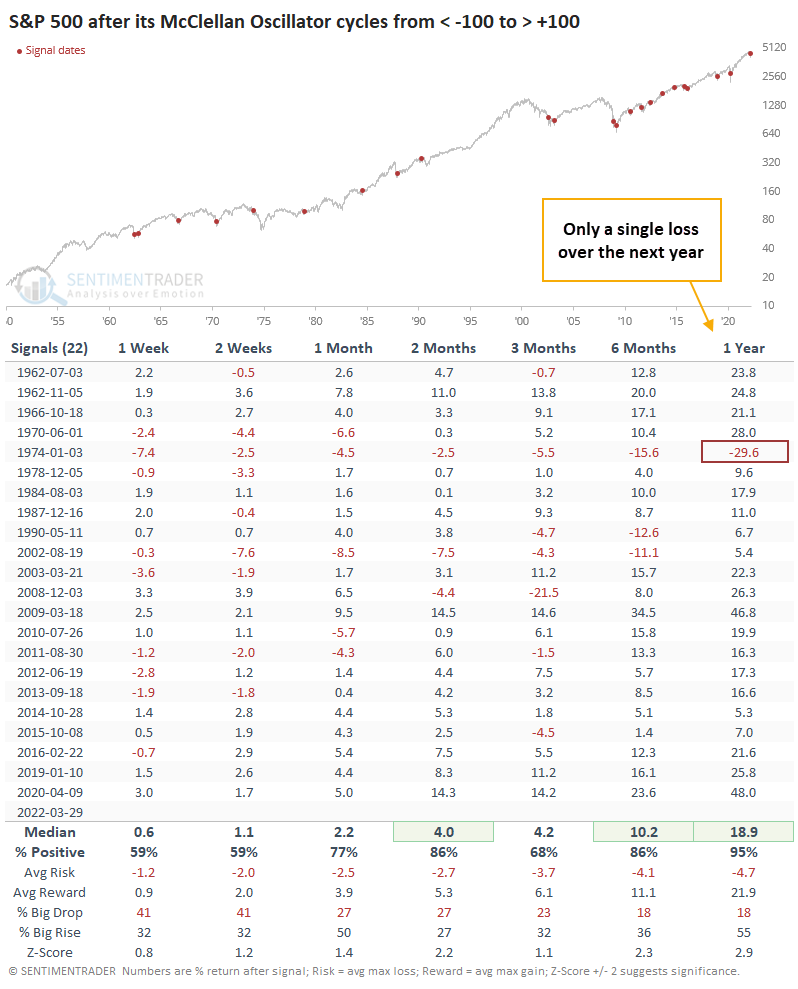
This cycle in momentum was an abject failure in 1974 and triggered right before a recession-worry decline in 1990. It also preceded some large temporary losses in 2002 and 2008, both during the final panic phases of protracted bear markets. Other than those, the risk of a substantial pullback of even -5% was remote at any point within the next several months.
The short-term surge is helping a longer-term recovery
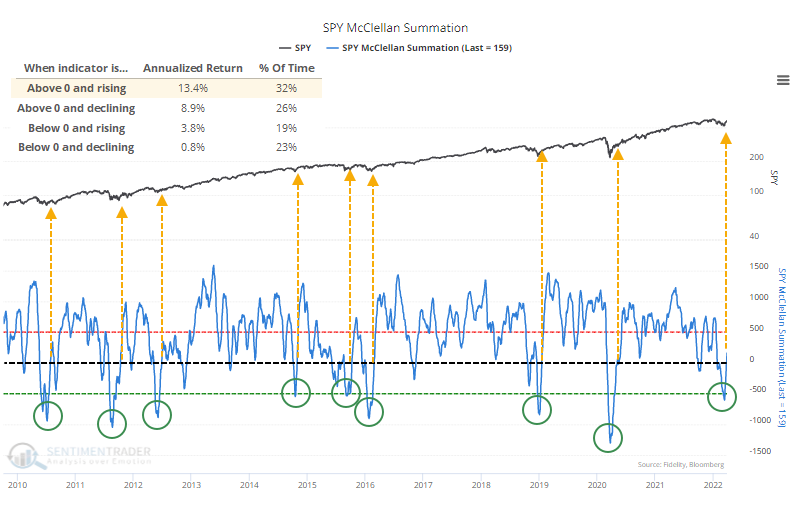
Because of the surge in the Oscillator, the McClellan Summation Index for the S&P 500 has also recovered. The Summation Index is a running cumulative sum of the Oscillator and is a longer-term indicator.
When it's above zero and rising, which it now is, it tends to be the best possible combination. Since the mid-1920s, the S&P has returned +13.4% p.a. when the Summation Index was in this condition.
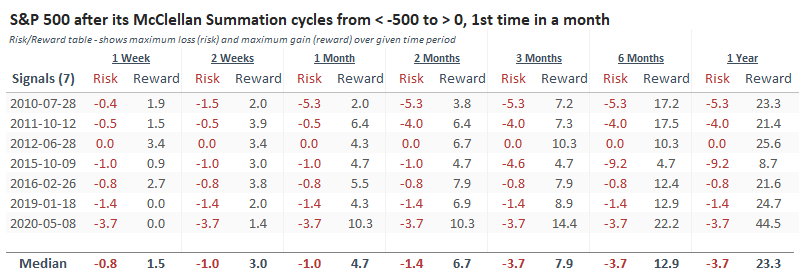
There have been 8 other times it recovered from below -500 to above 0 since the global financial crisis, coinciding with important troughs in the index.
Since the financial crisis, the S&P 500's returns were stellar after similar recoveries. Every aspect of the S&P's performance was impressive, both absolutely and relative to random returns during the past 12 years.
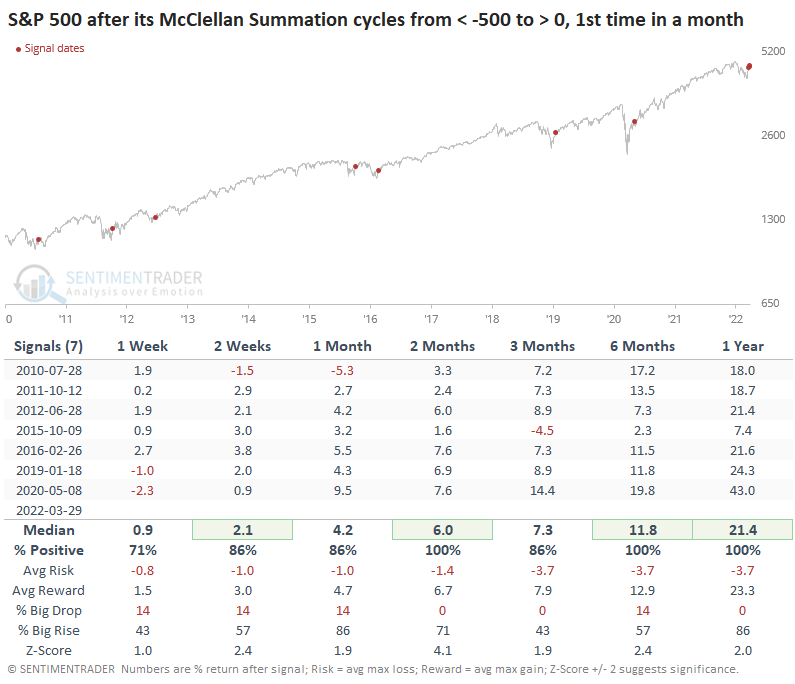
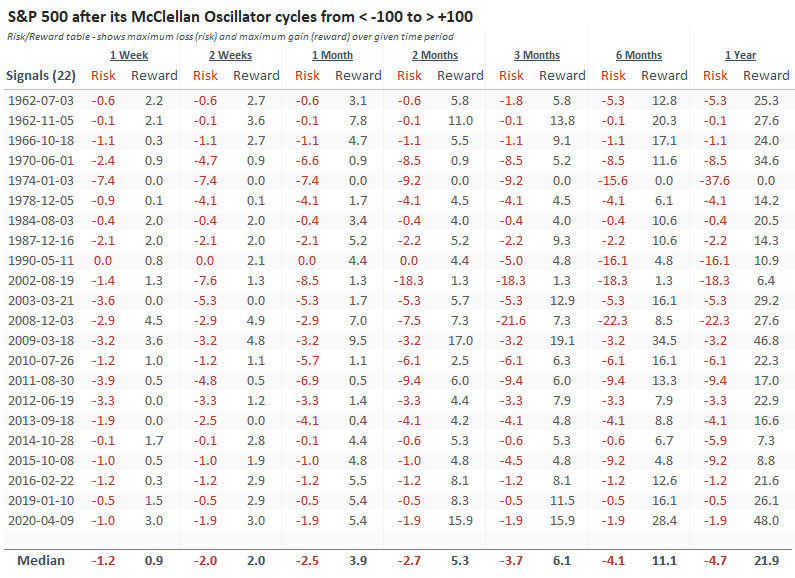
The Risk/Reward Table shows that "risk" was limited in the months ahead. None of the signals showed more than a -5.3% loss at any point within the next 3 months, while all but one showed a maximum gain of at least that much.
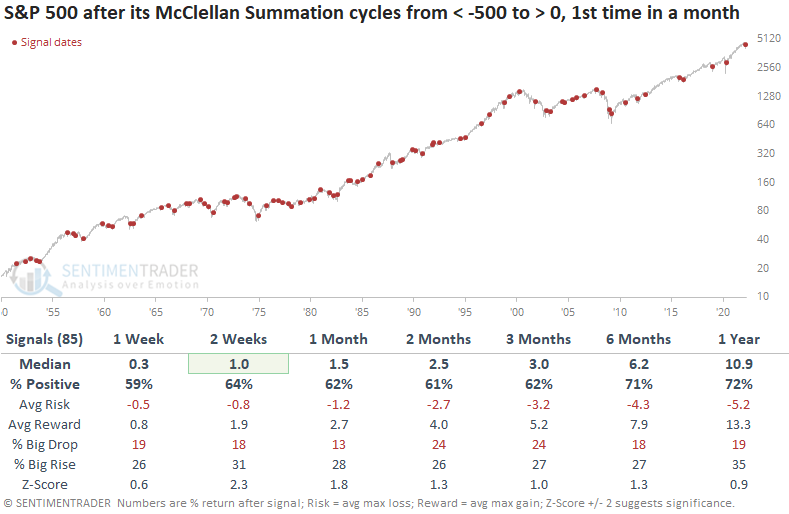
A longer-term history of these recoveries hasn't been as impressive. Since 1950, there have been 85 of these signals, and forward returns were above random but not significantly so. The risk/reward was good but not skewed enough to consider it a major edge.
What the research tells us...
We're still waiting to see if buyers have enough oomph to trigger a surge in 52-week highs versus 52-week lows. So far, they haven't, mainly because many bond-related issues on the NYSE are still struggling. A recovery in those issues would go a long way to helping us move to a healthier market environment. On a shorter time frame, the thrusts in indexes and their underlying components are very impressive, and they have a good track record of preceding even more gains over the medium- to long-term. We just need to see these thrusts morph into longer-term recoveries.
Active Studies
| Time Frame | Bullish | Bearish | | Short-Term | 4 | 0 | | Medium-Term | 25 | 2 | | Long-Term | 17 | 5 |
|
Indicators at Extremes
Portfolio
| Position | Description | Weight % | Added / Reduced | Date | | Stocks | 21.6% RSP, 5.1% IEMG | 26.7 | Added 5.3% | 2022-03-18 | | Bonds | 32.7% BND, 7.1% SCHP | 40.1 | Added 8.3% | 2021-10-26 | | Commodities | GCC | 2.4 | Reduced 2.1%
| 2020-09-04 | | Precious Metals | GDX | 4.6 | Reduced 4.2% | 2021-05-19 | | Special Situations | 7.6% KWEB, 4.9% XBI, 3.7% XLE, 1.8% PSCE | 18.0 | Added 4.6% | 2022-02-24 | | Cash | | 7.9 | | |
|
Updates (Changes made today are underlined)
We had a volatile few weeks into mid-March, and it was enough to trigger a number of extremes. Most of the studies we've looked at have had a clear bullish edge over a multi-month time frame. I'd typically be more proactive instead of reactive with changes in positions, adding exposure into weakness instead of strength, but during an unhealthy environment like we're in, I tend to be more conservative. I did add some exposure to emerging markets, choosing a fund with the least exposure to China, since I already have exposure there with KWEB. It's still heavily weighted to that market. The only other times the MSCI Emerging Markets Index has had a weekly reversal like this week were October 2008, October 2011, and August 2015, all leading to long-term gains. RETURN YTD: +0.1% 2021: +8.7%, 2020: +8.1%, 2019: +12.6%, 2018: +0.6%, 2017: +3.8%, 2016: +17.1%, 2015: +9.2%, 2014: +14.5%, 2013: +2.2%, 2012: +10.8%, 2011: +16.5%, 2010: +15.3%, 2009: +23.9%, 2008: +16.2%, 2007: +7.8%
|
|
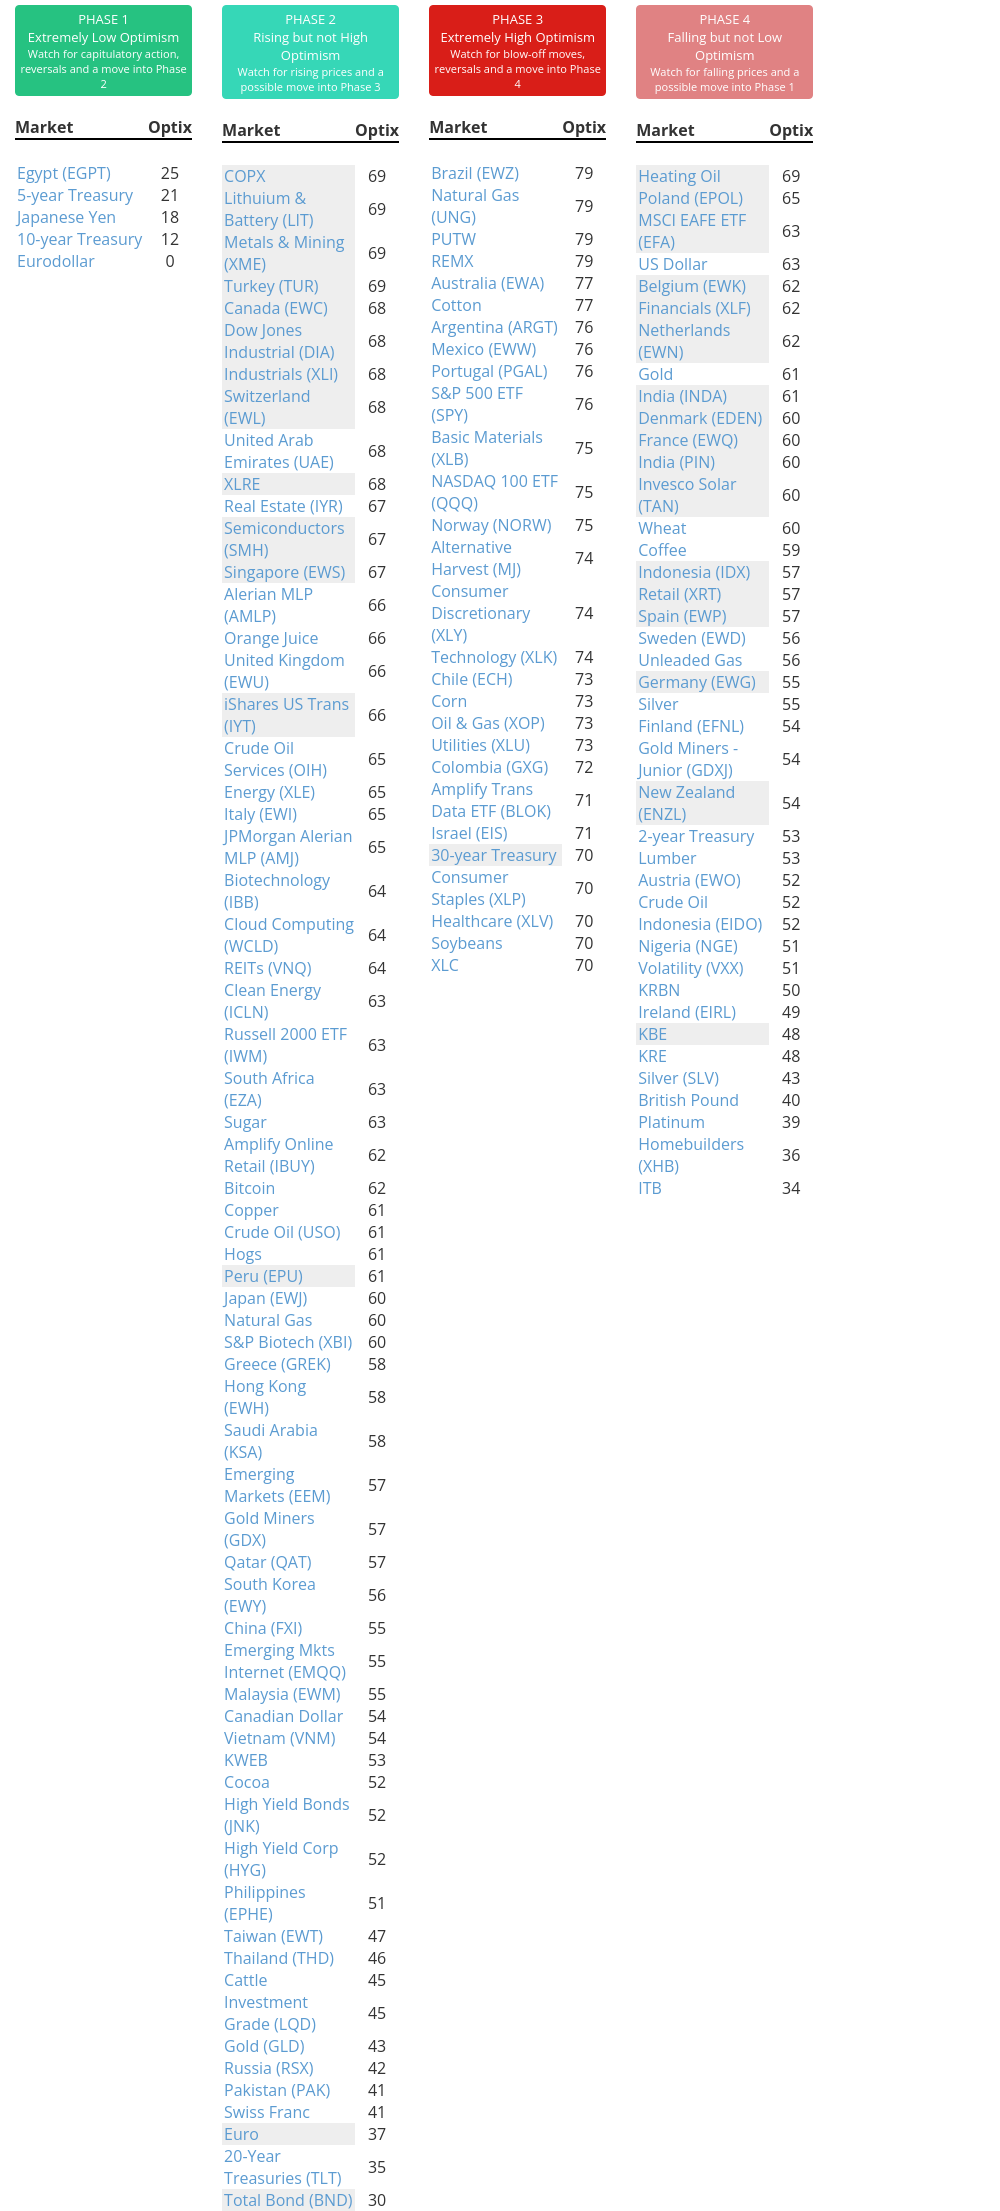
Phase Table
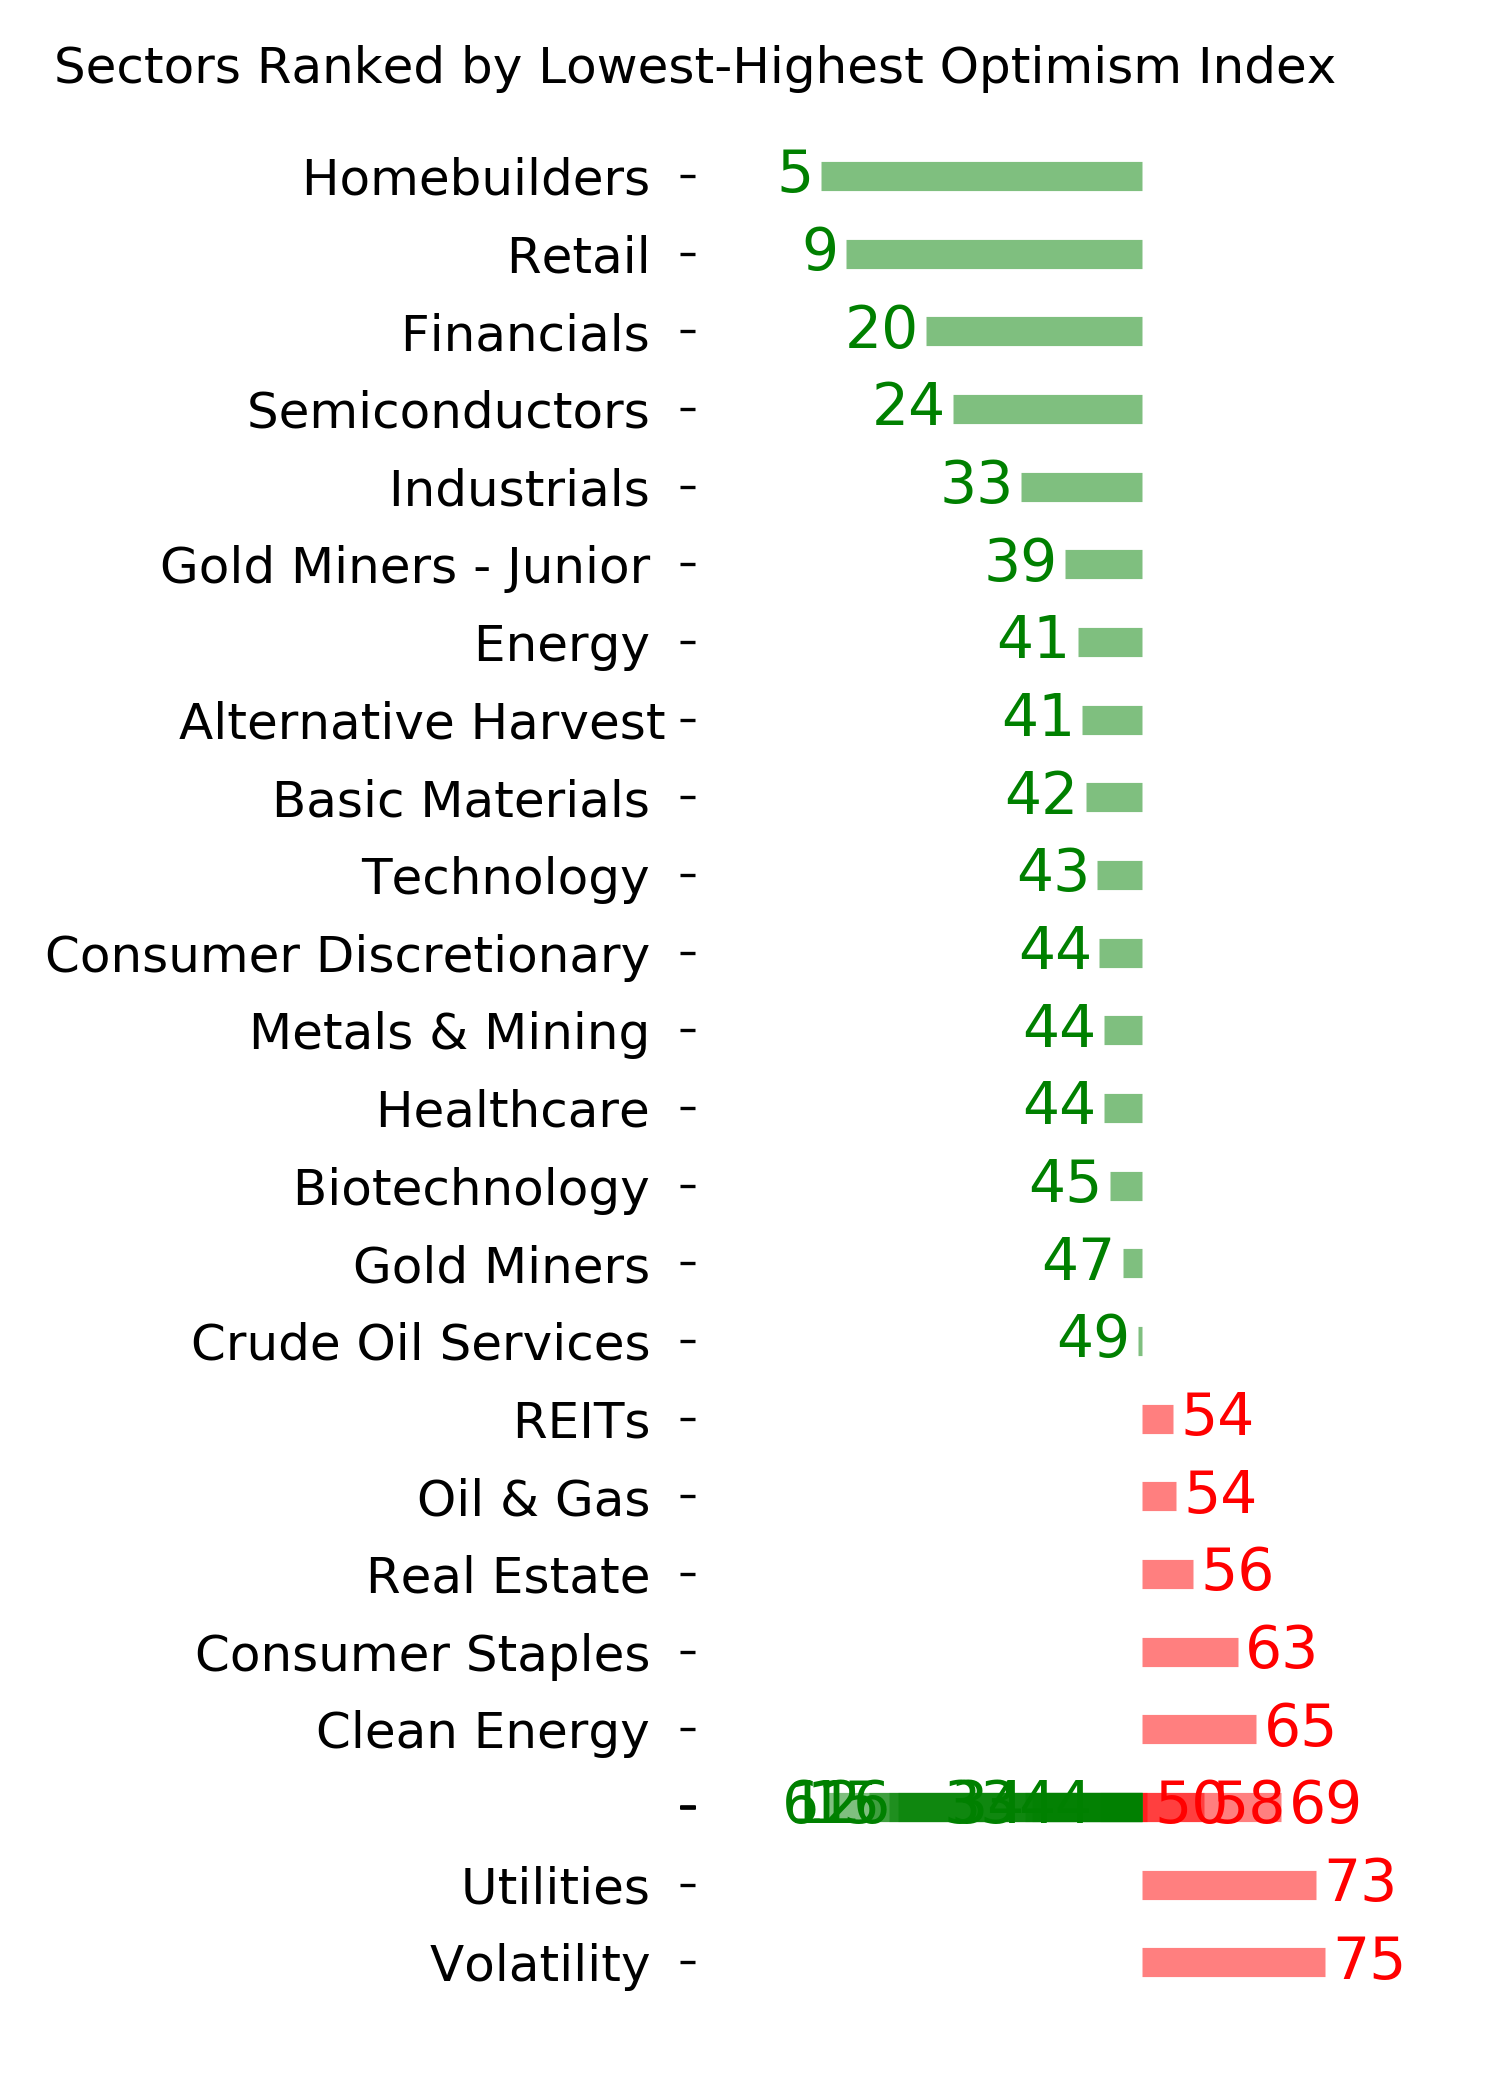
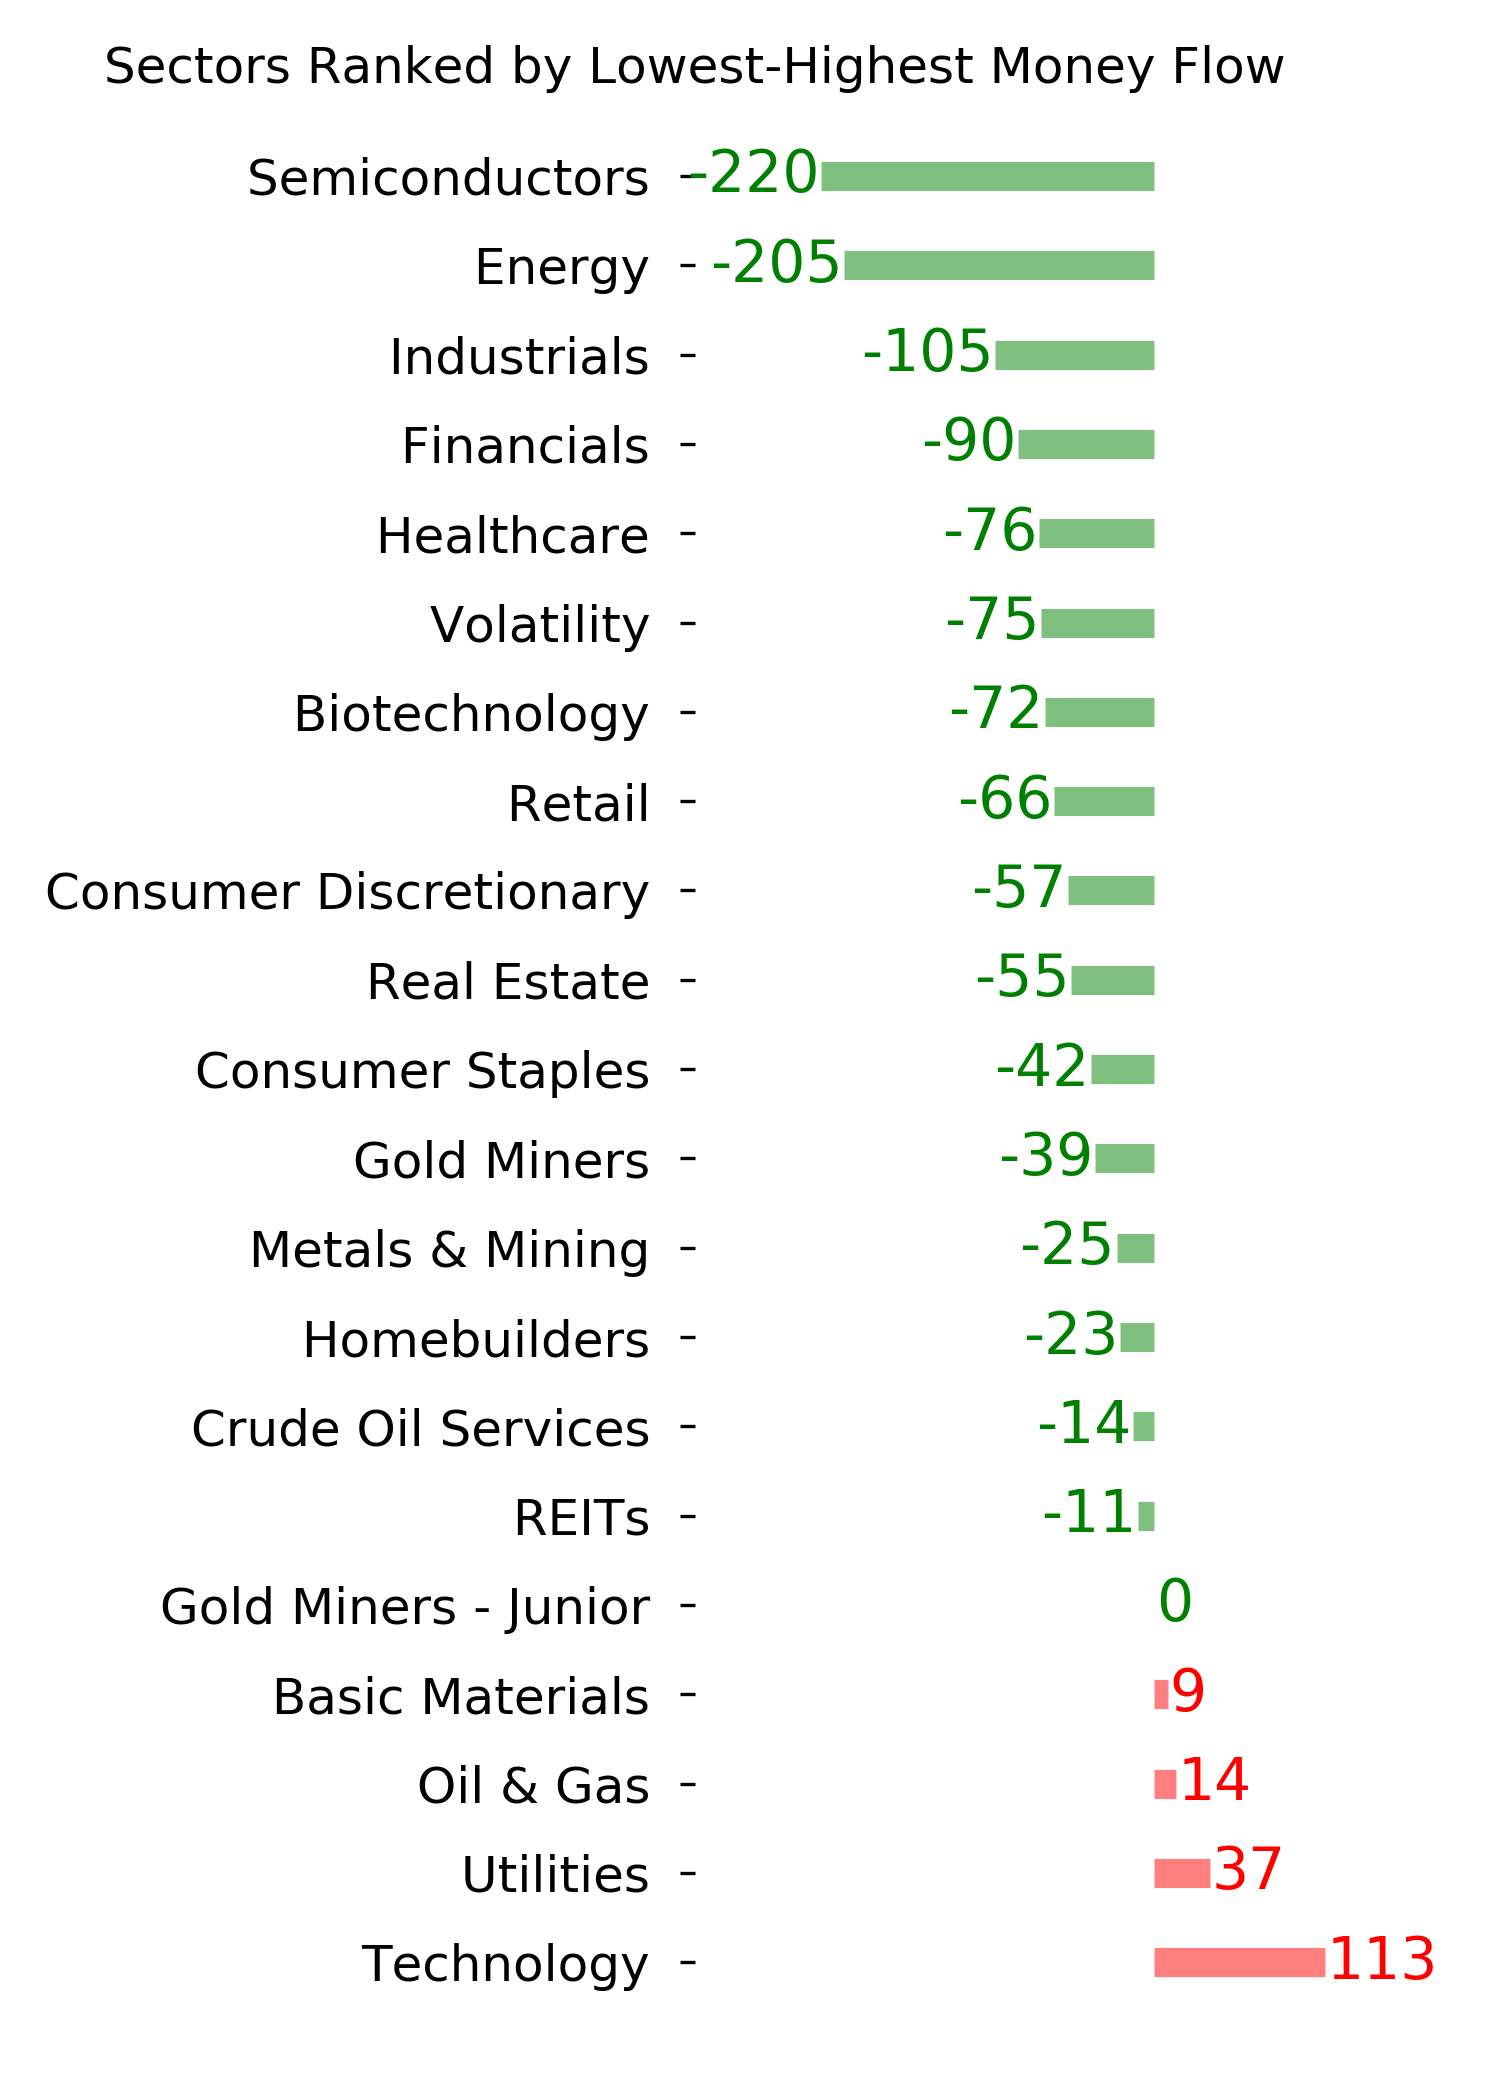
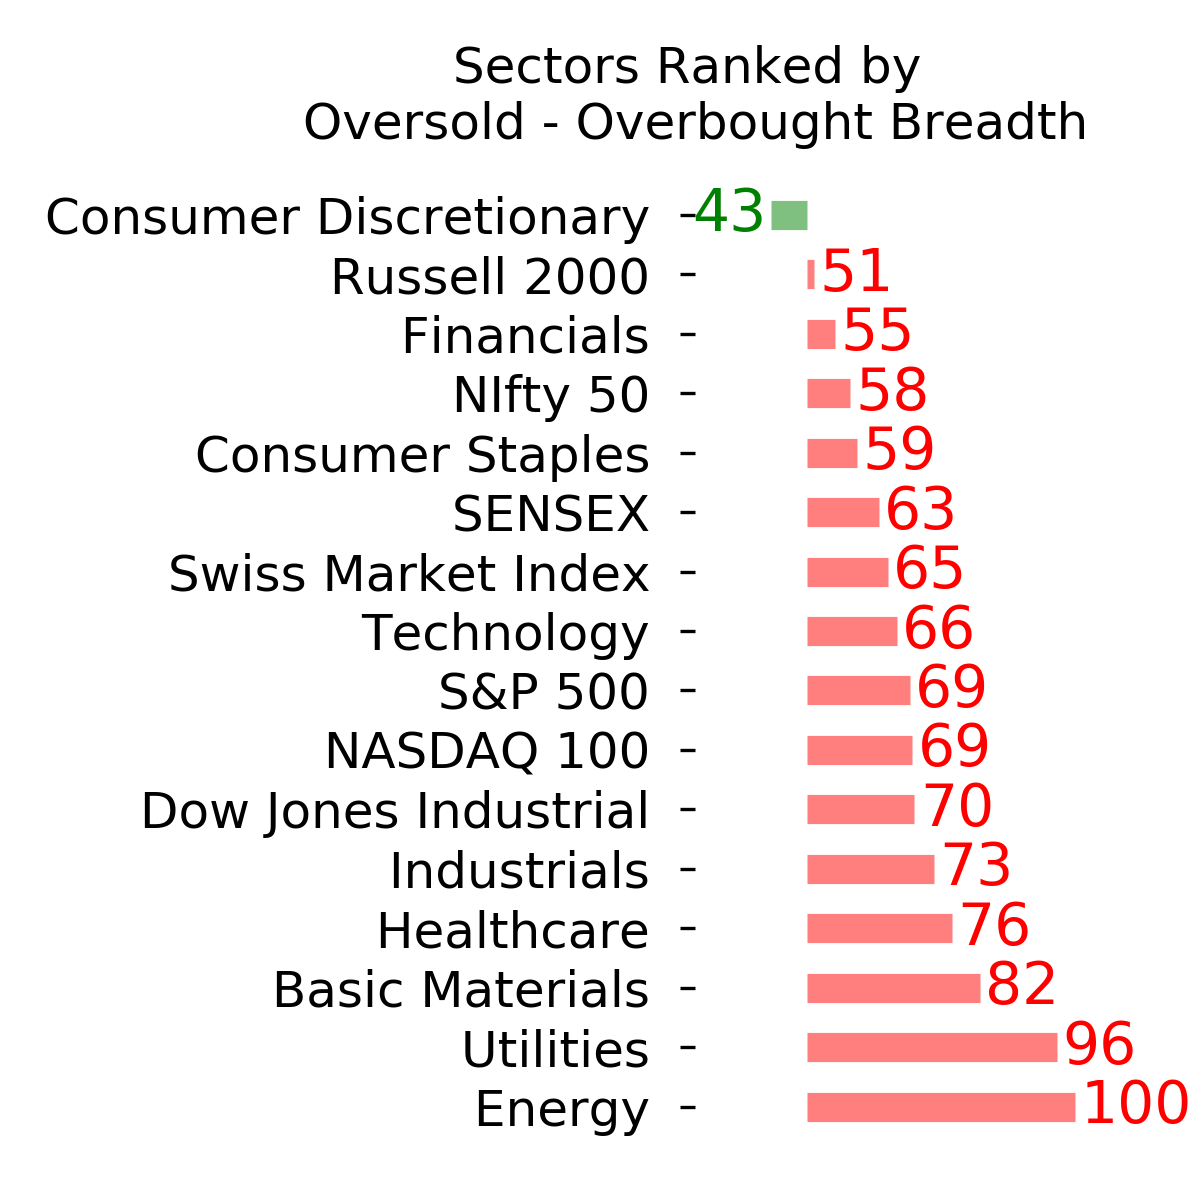
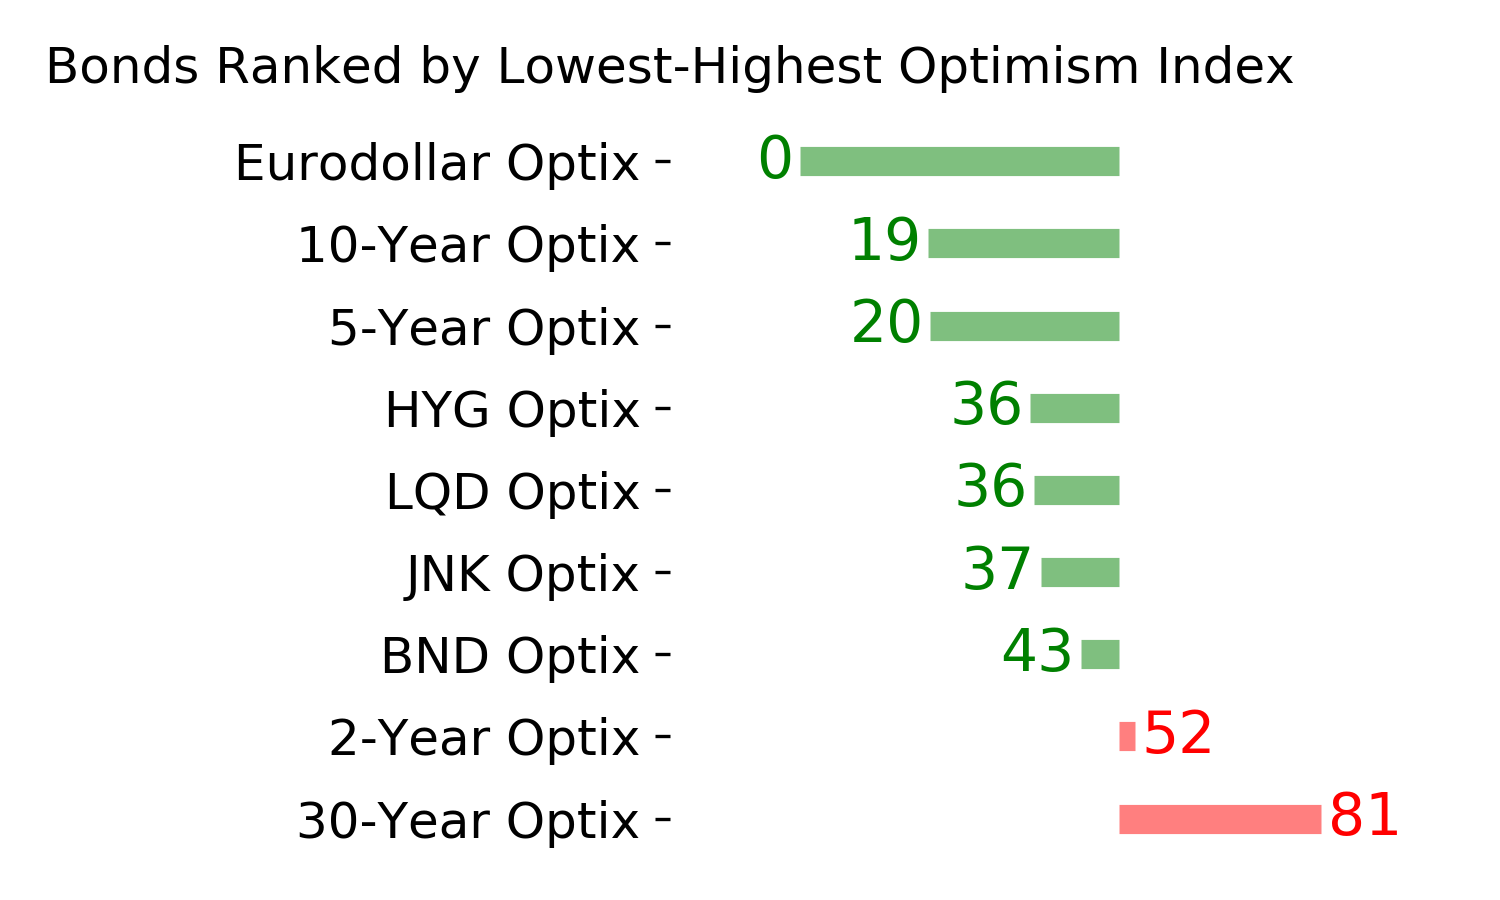
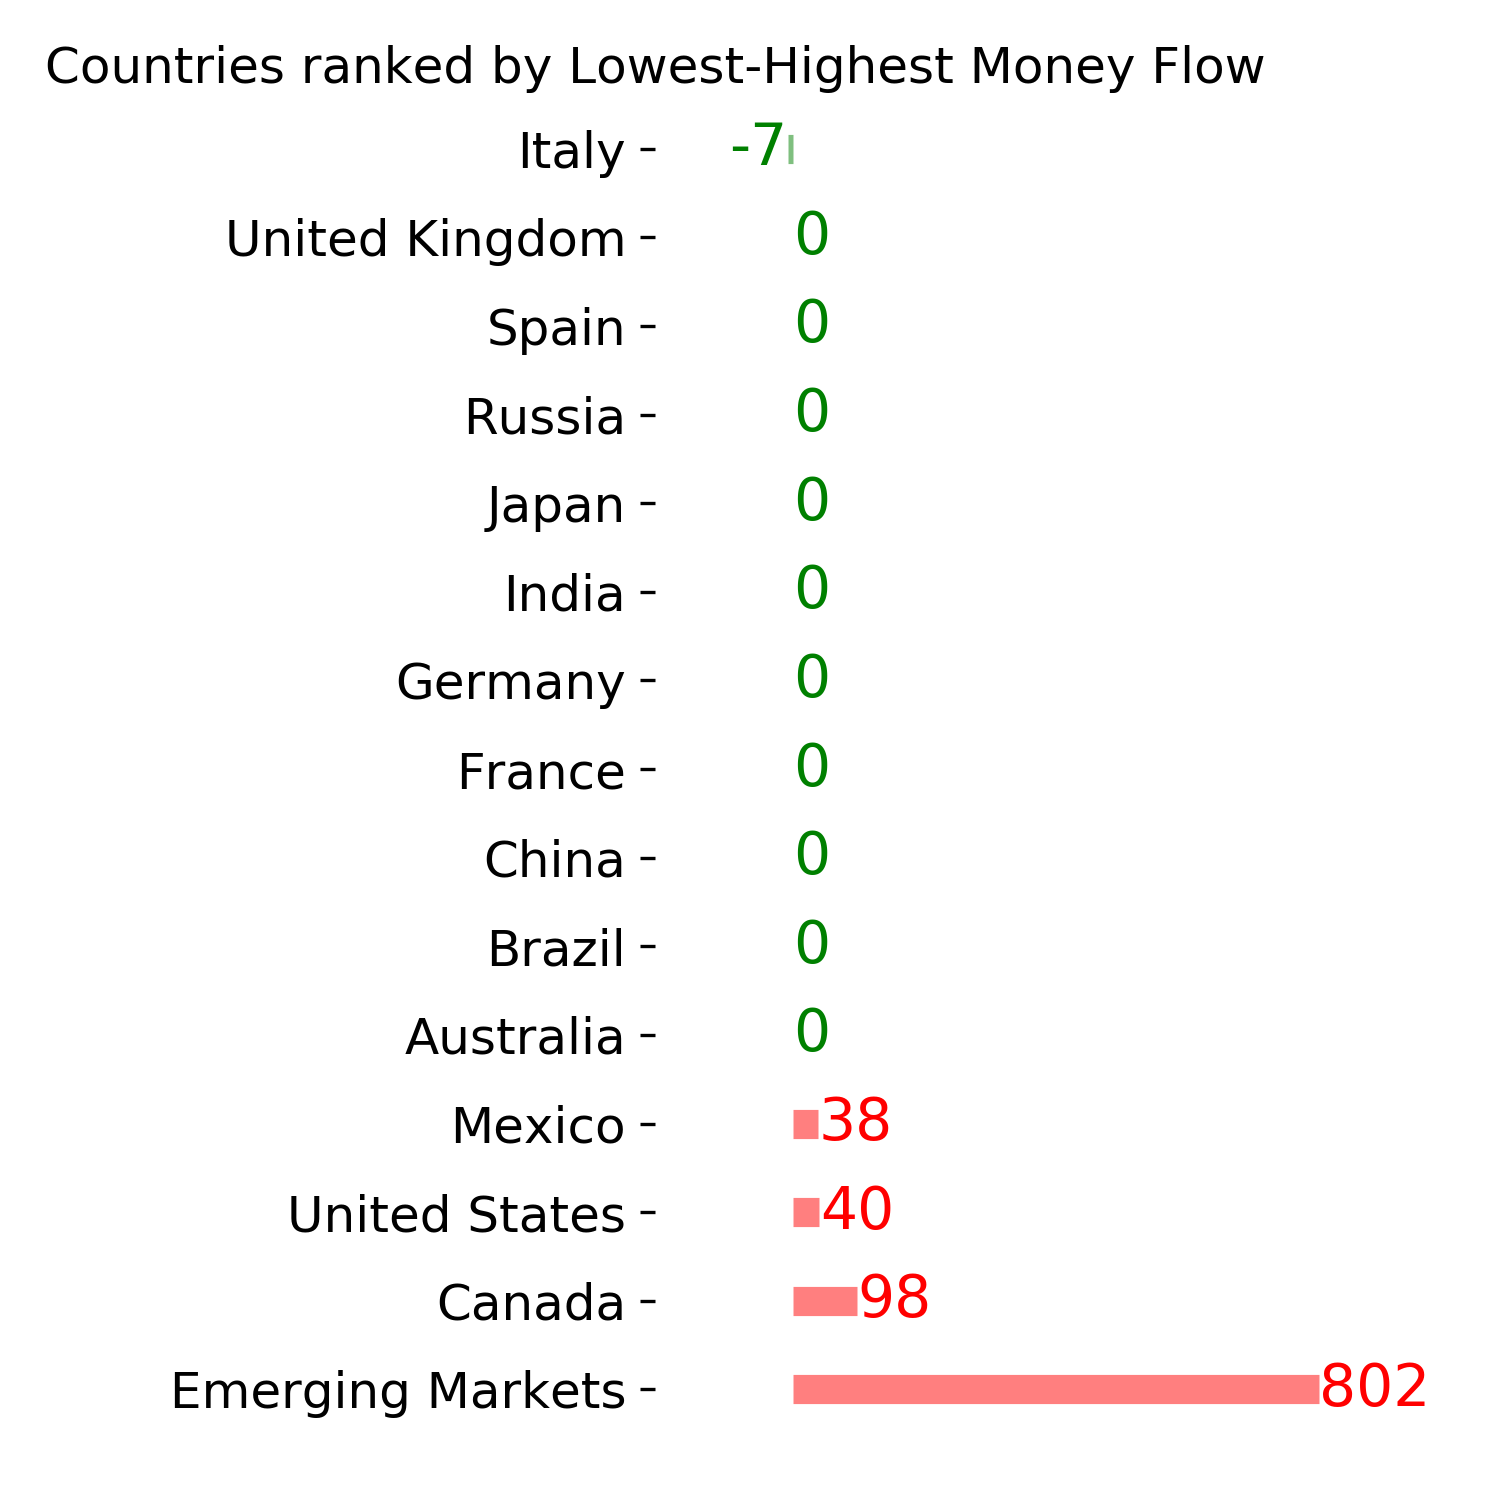
Ranks
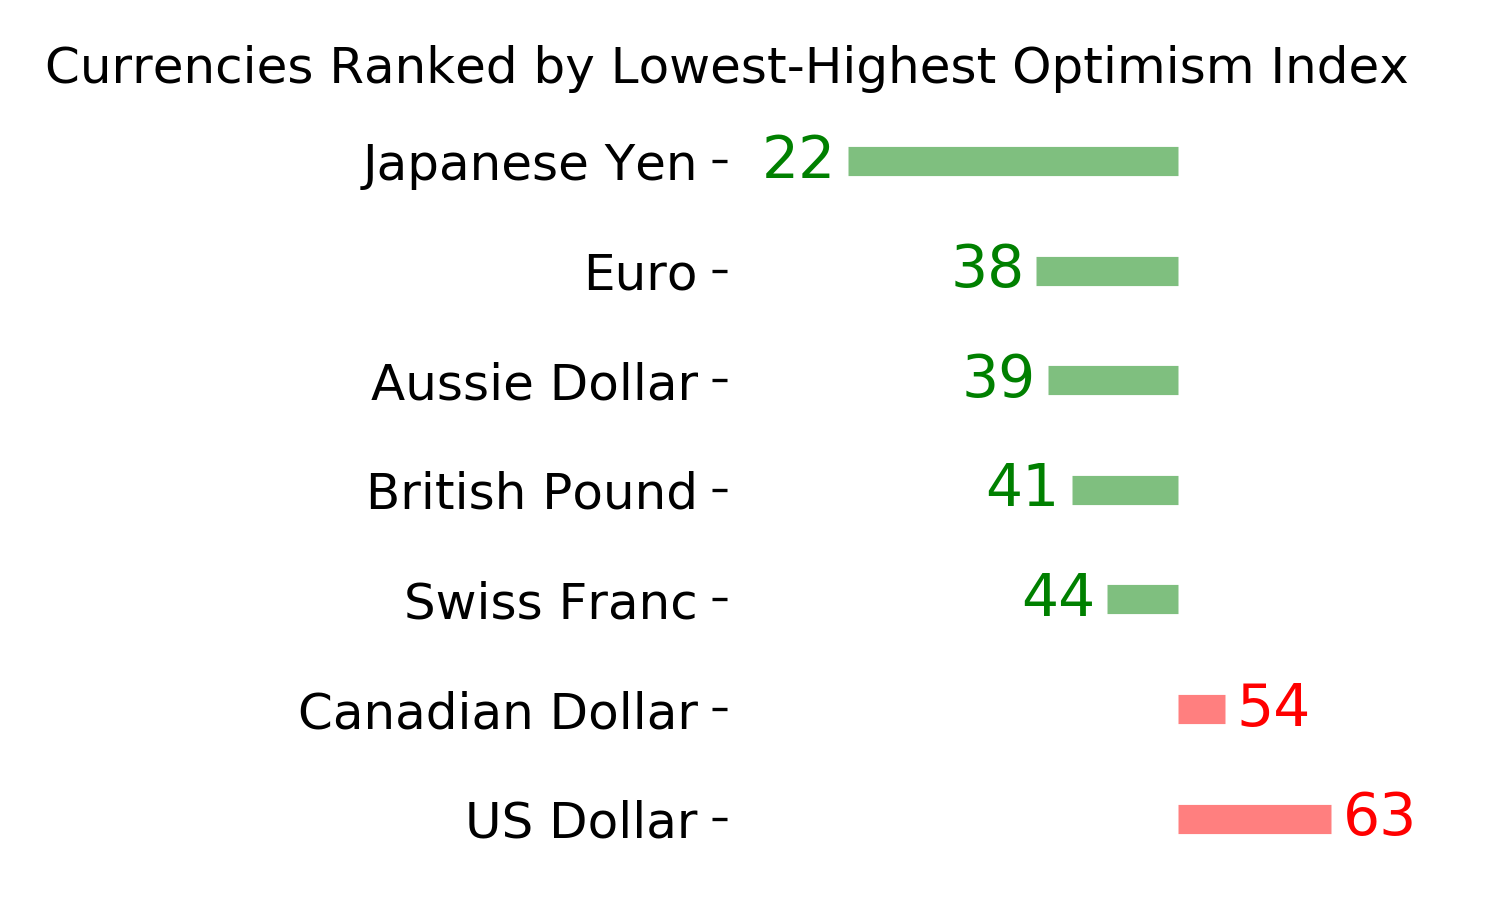
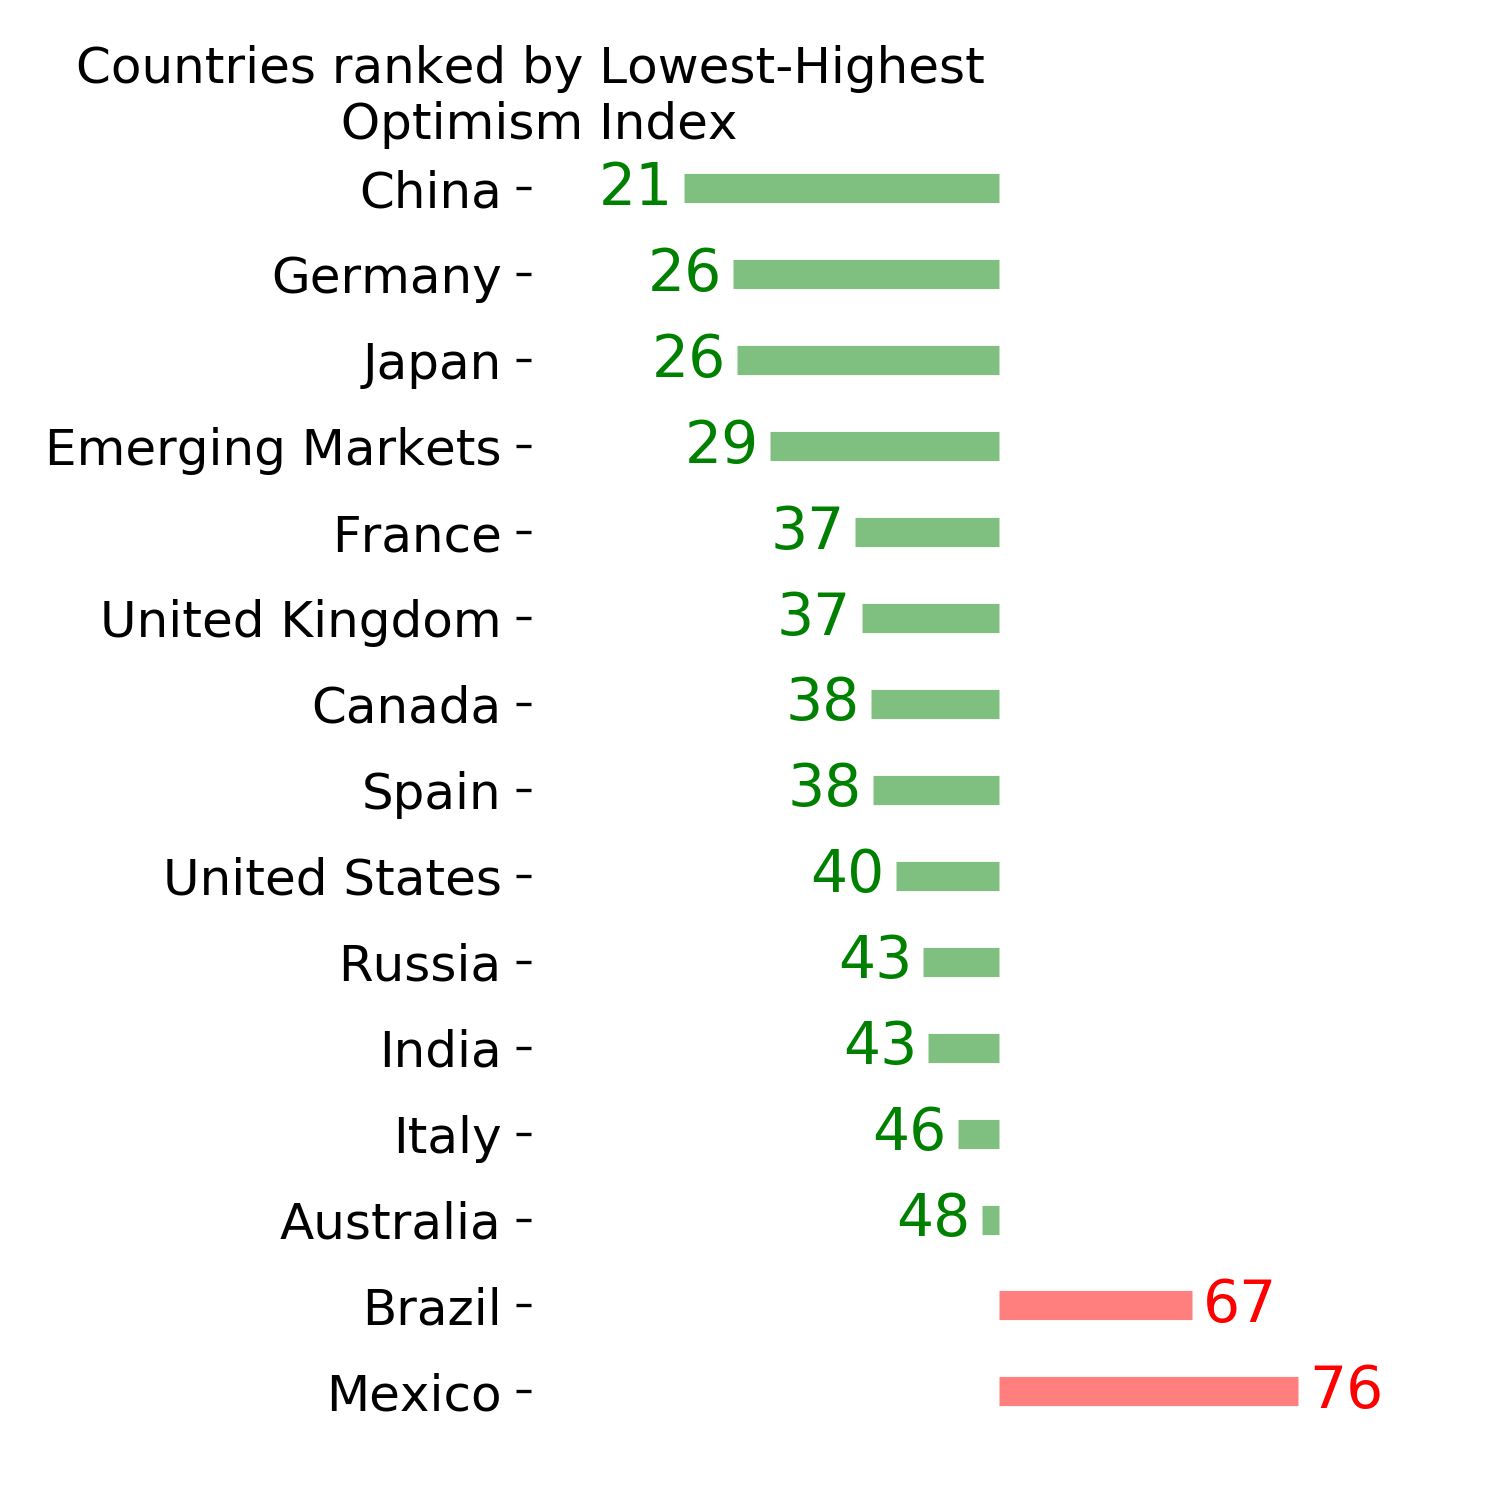
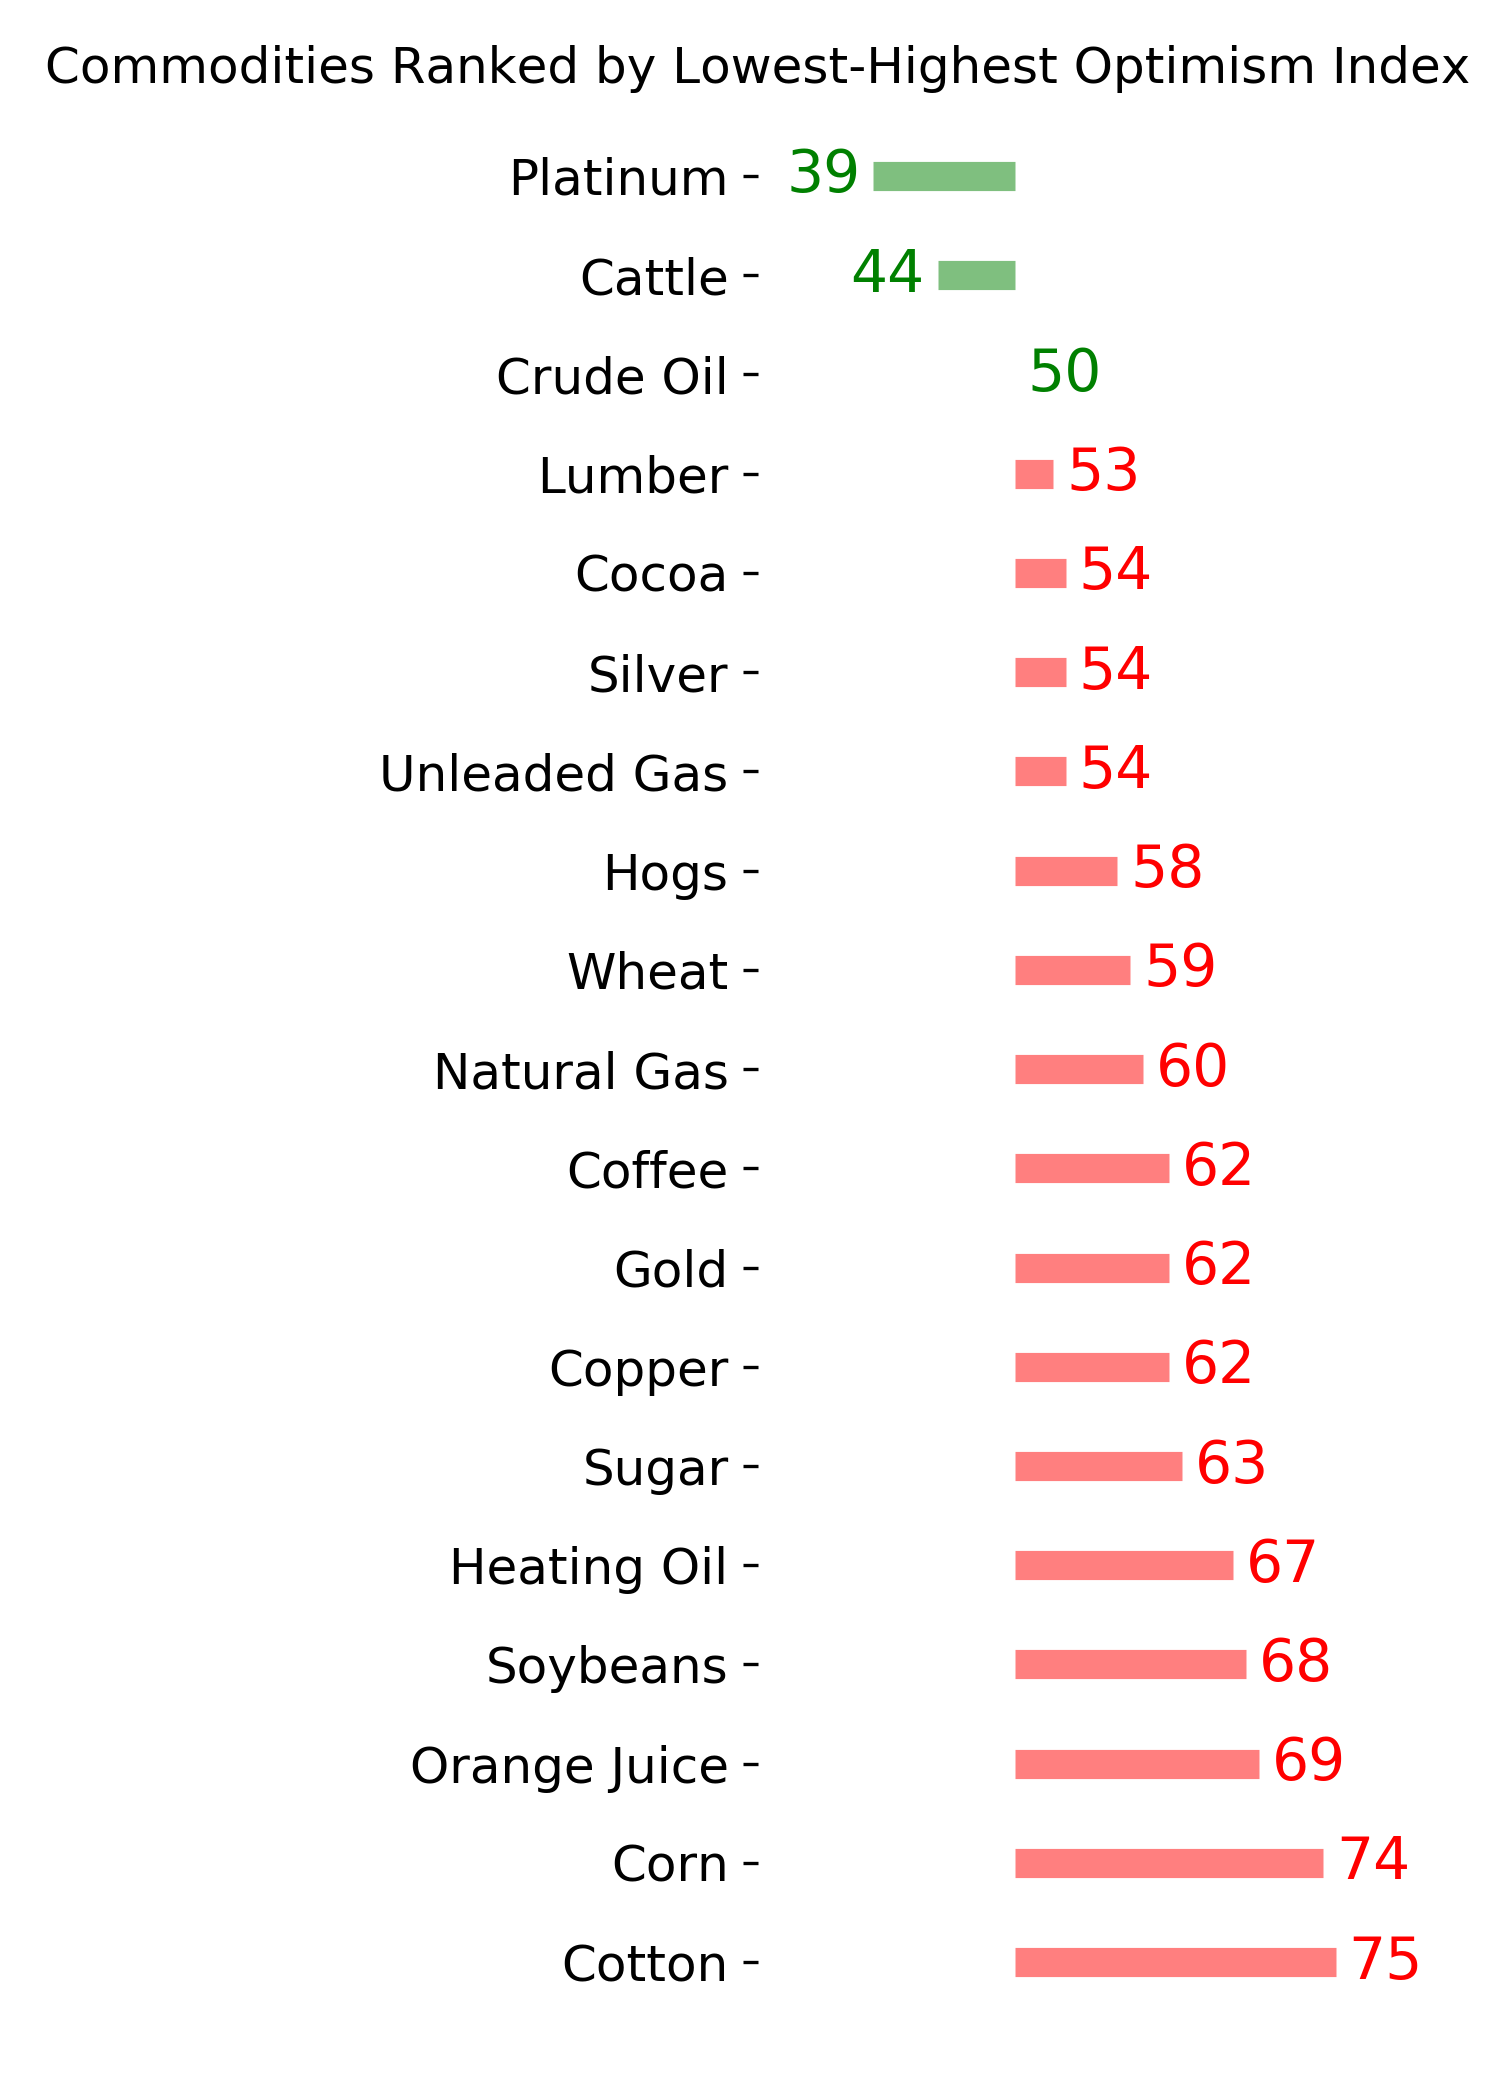
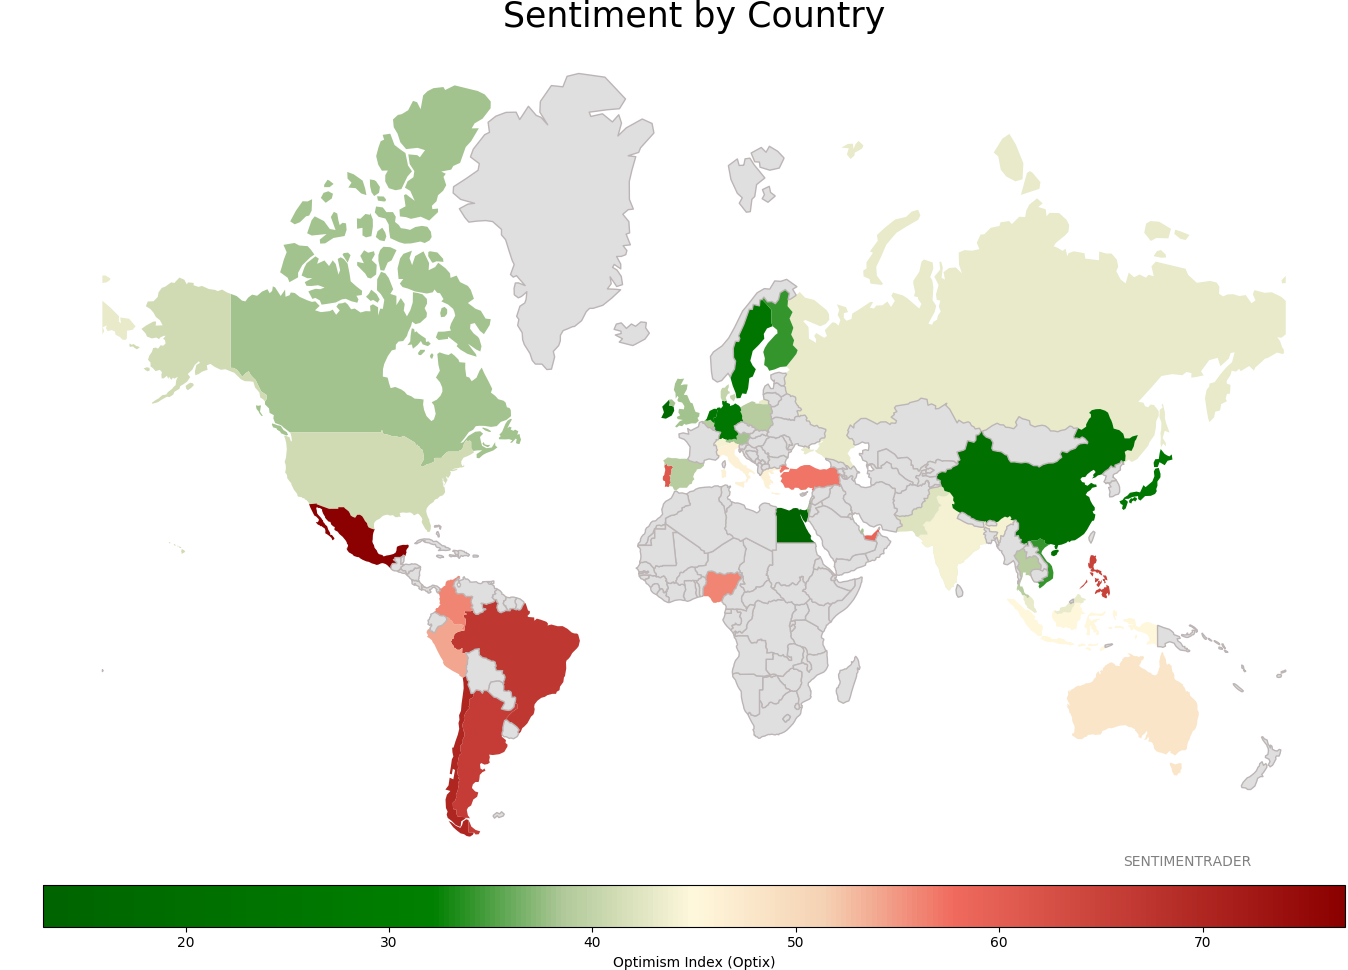
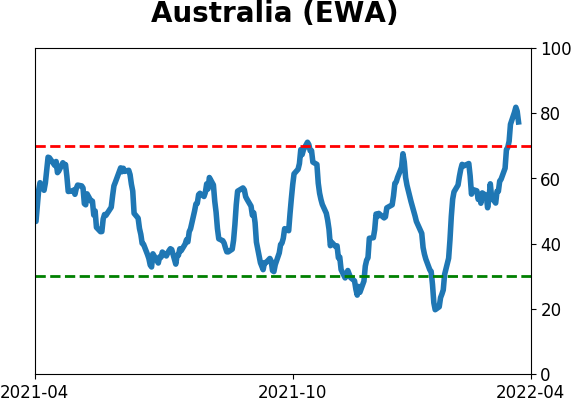
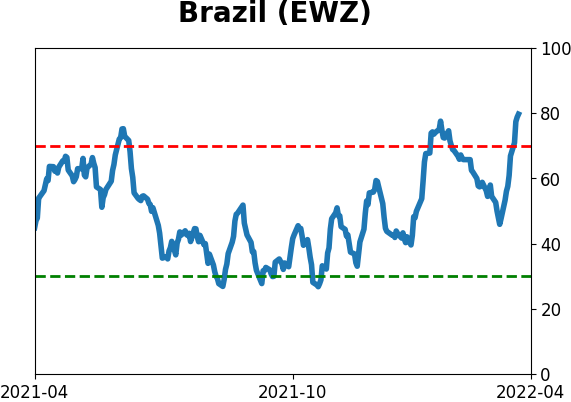
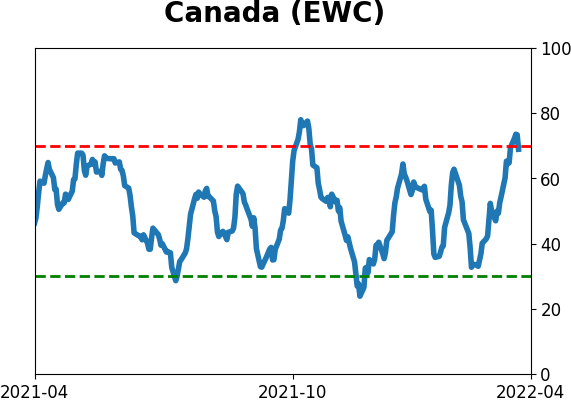
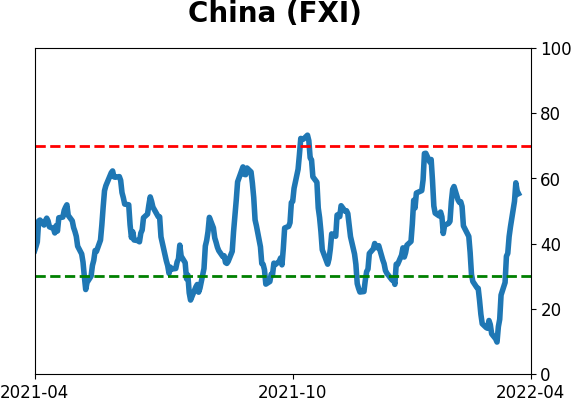
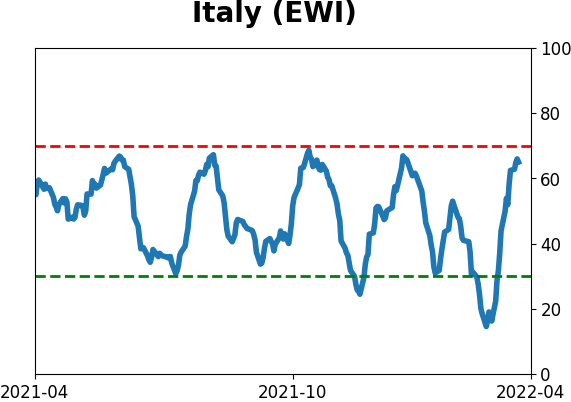
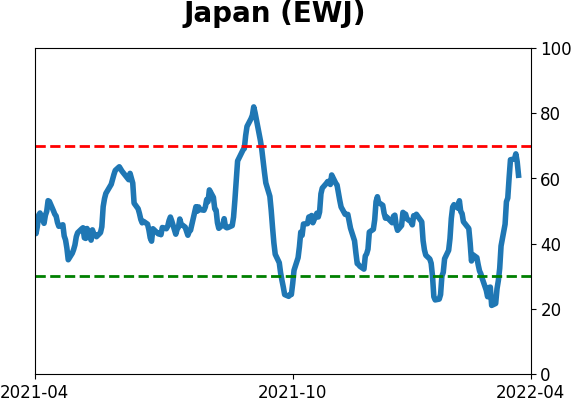
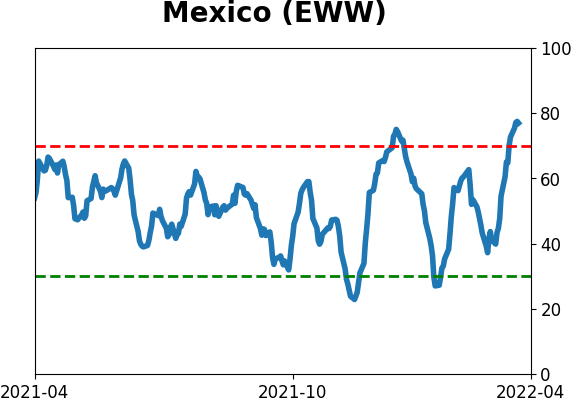
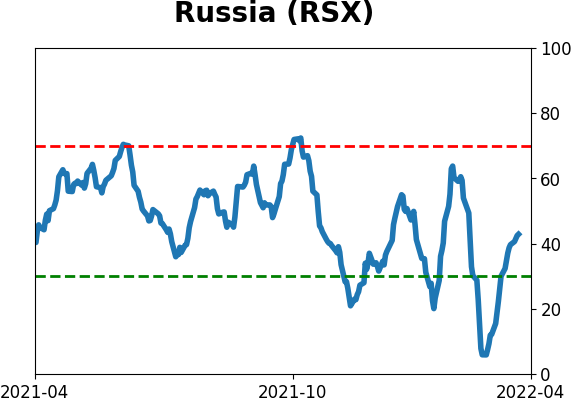
Sentiment Around The World
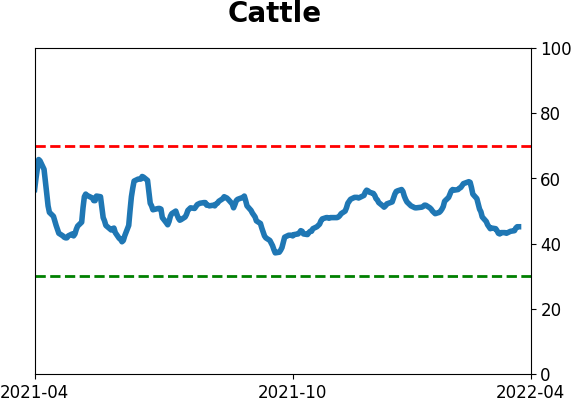
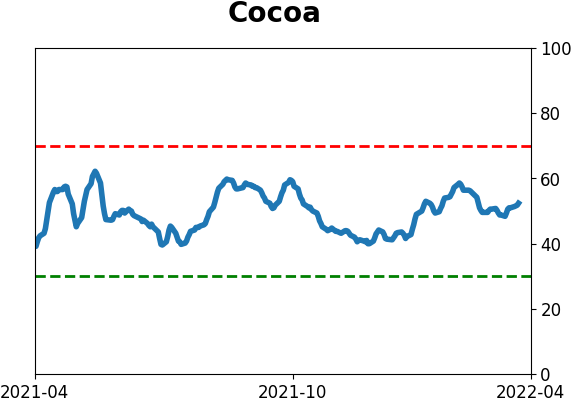
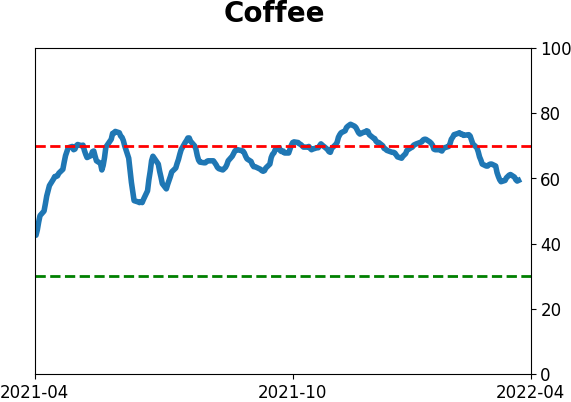
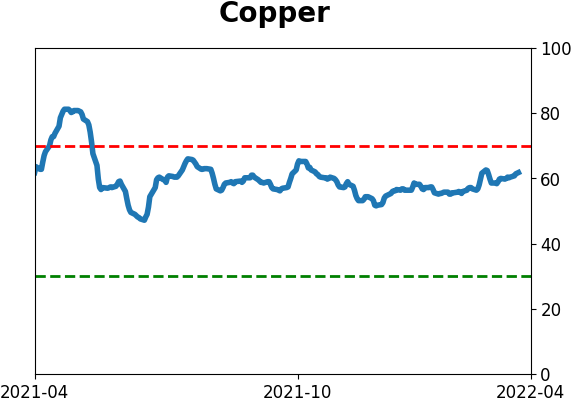
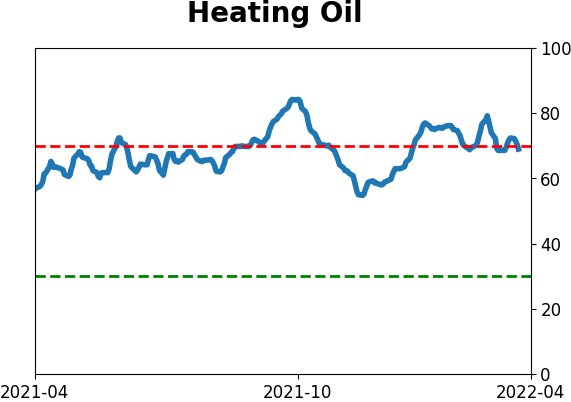
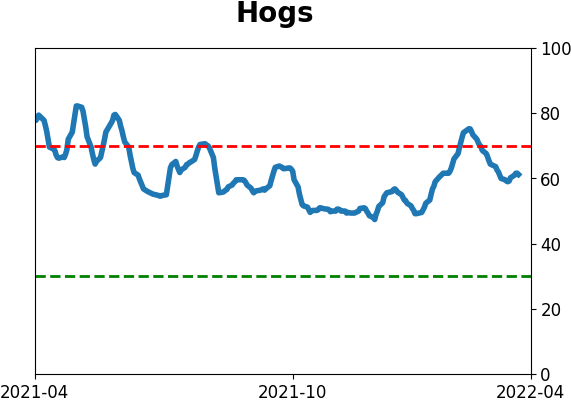
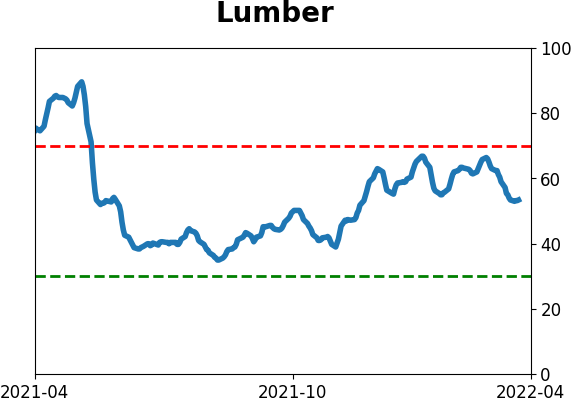
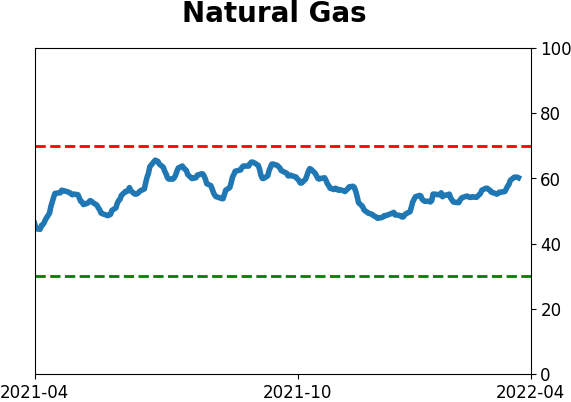
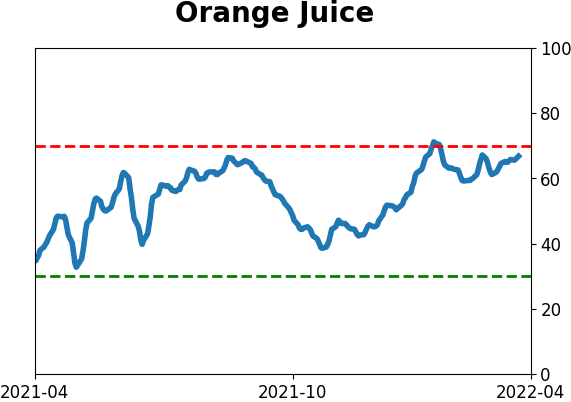
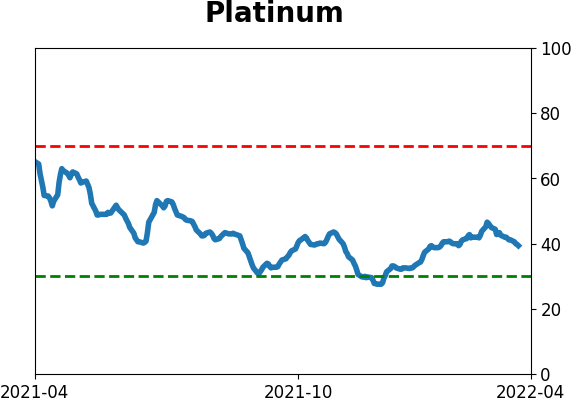
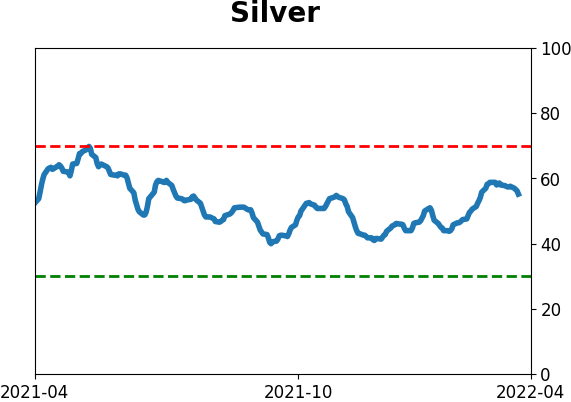
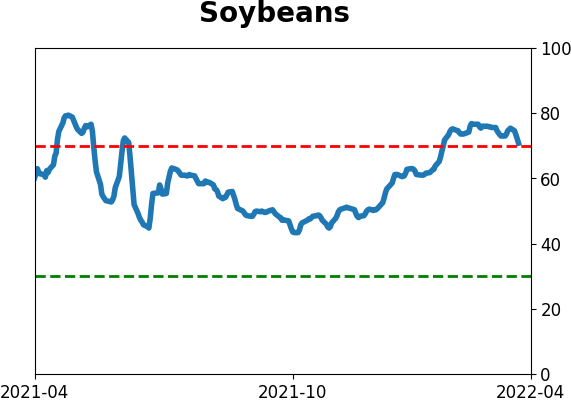
Optimism Index Thumbnails
|
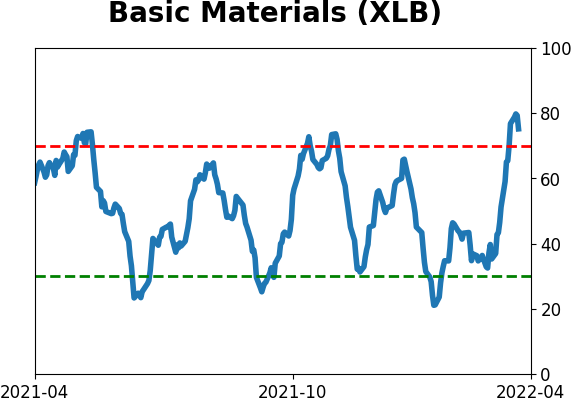
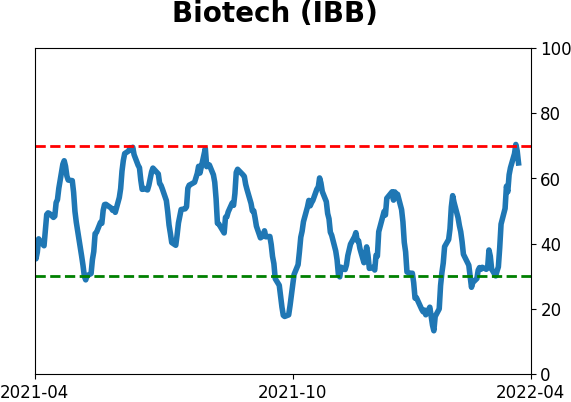
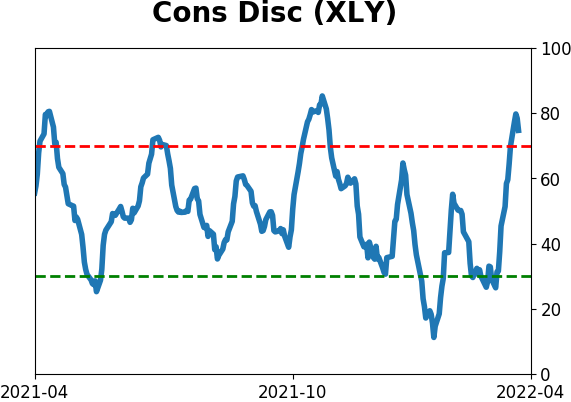
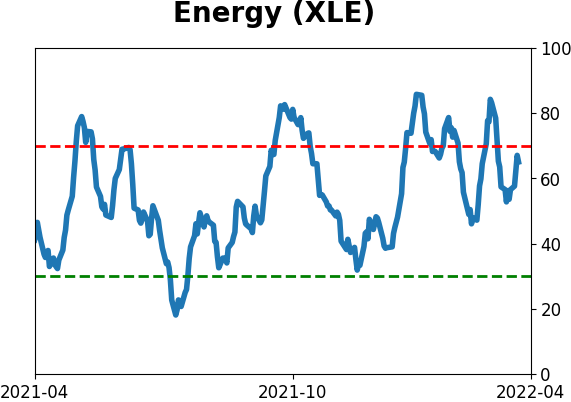
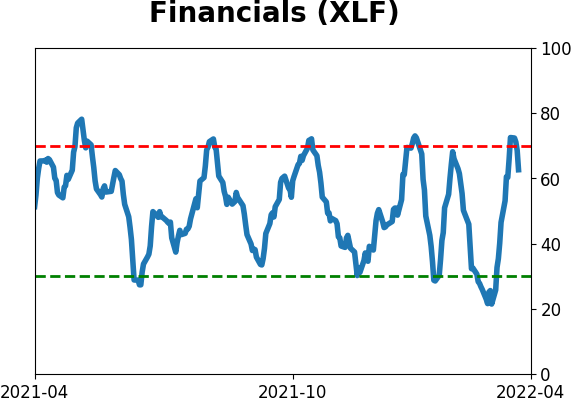
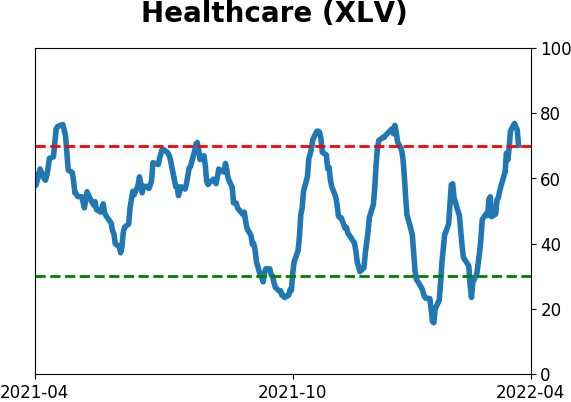
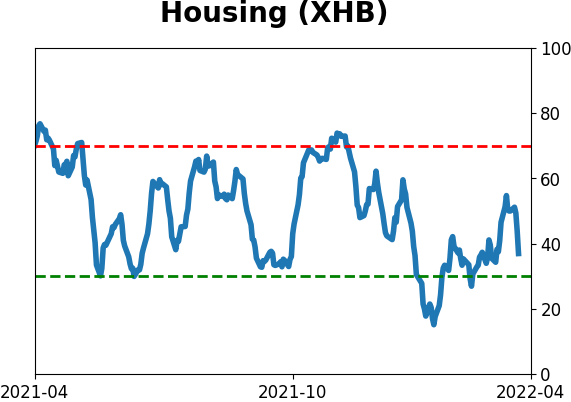
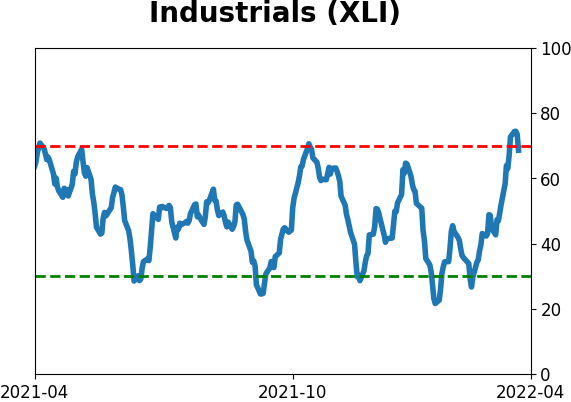
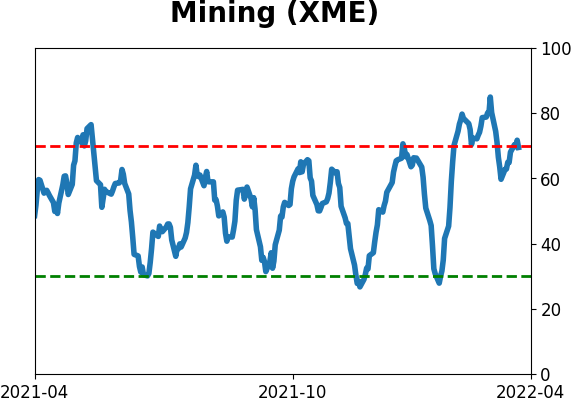
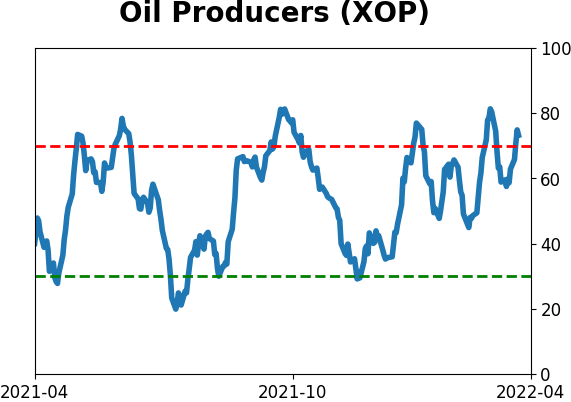
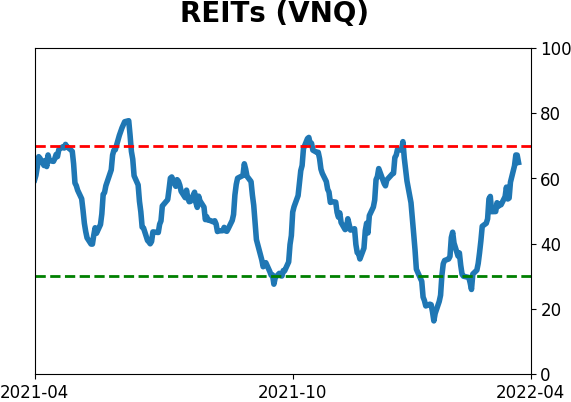
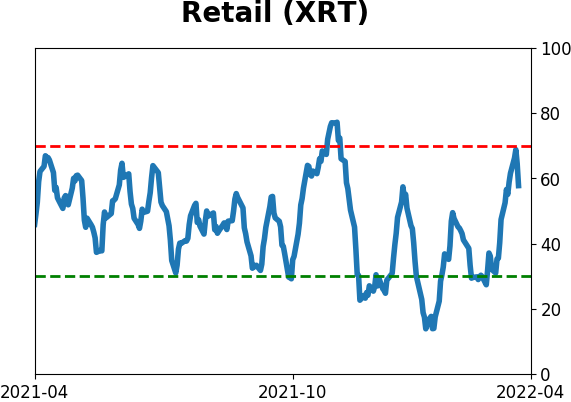
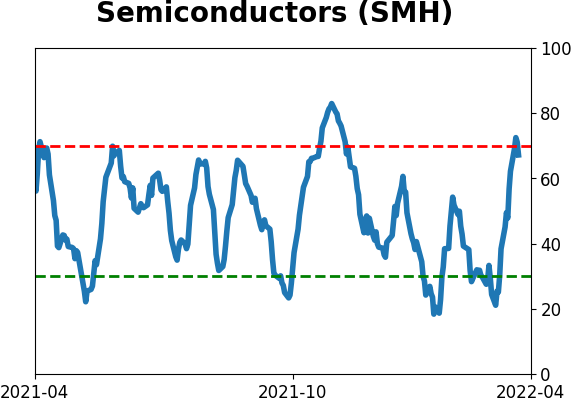
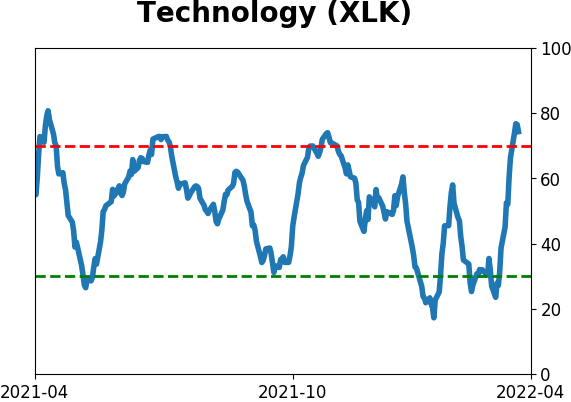
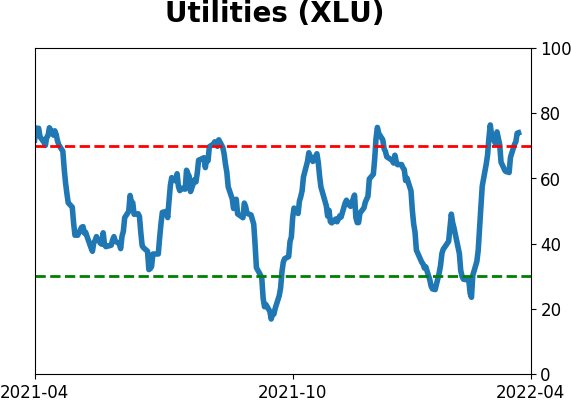
Sector ETF's - 10-Day Moving Average
|
|
|
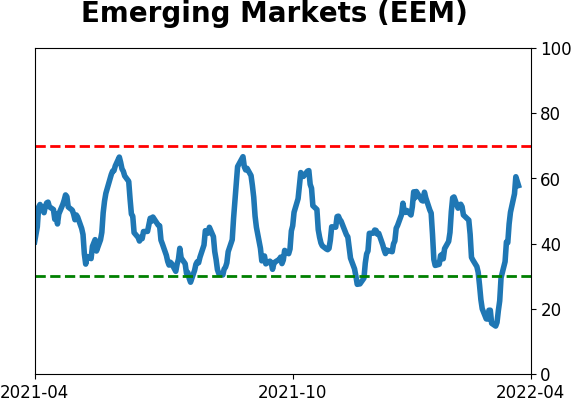
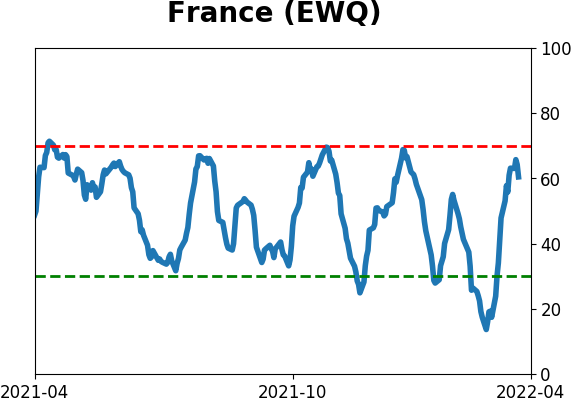
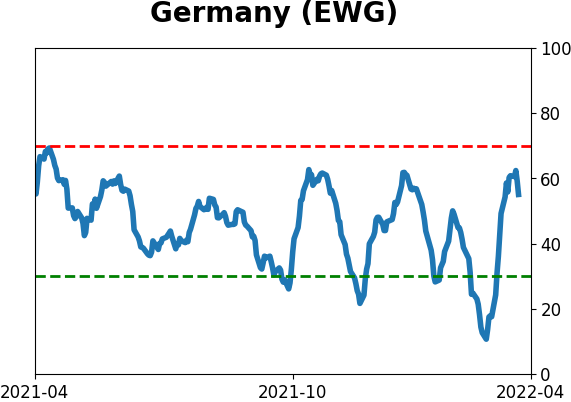
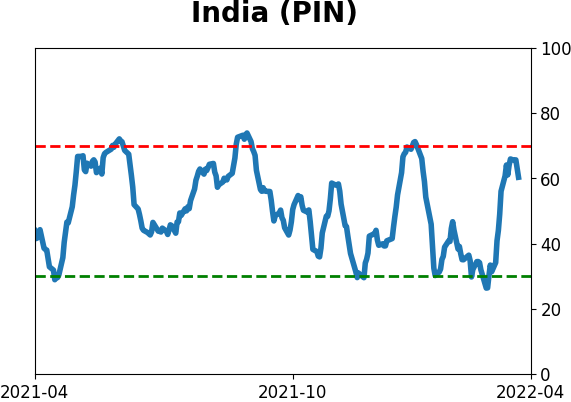
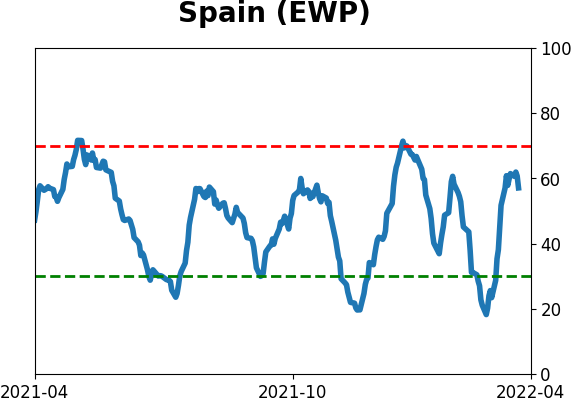
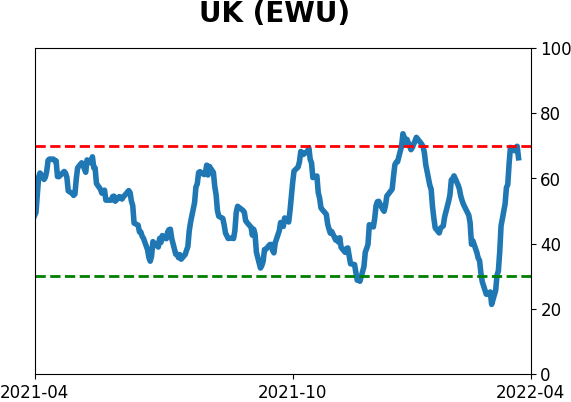
Country ETF's - 10-Day Moving Average
|
|
|
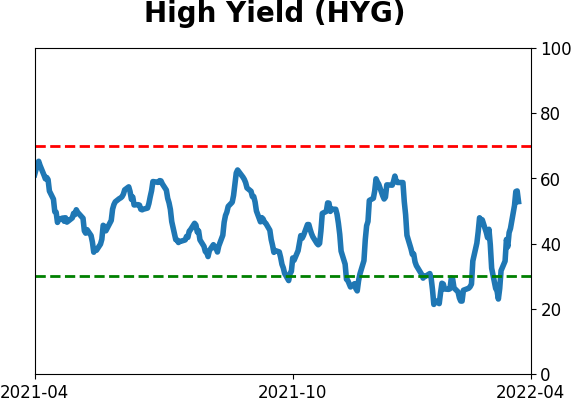
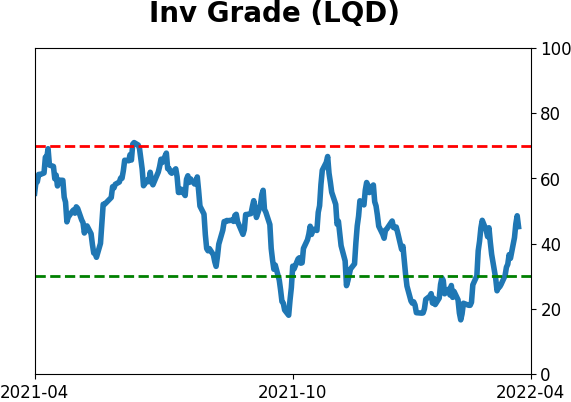
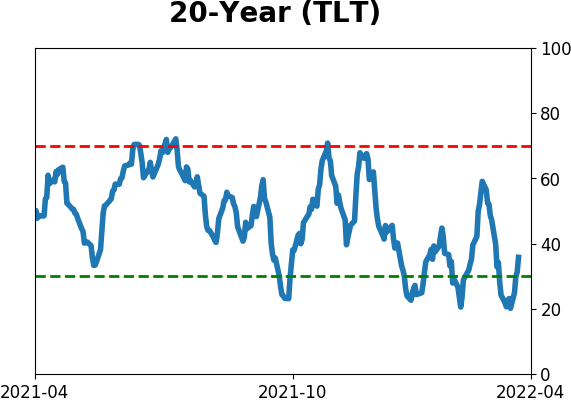
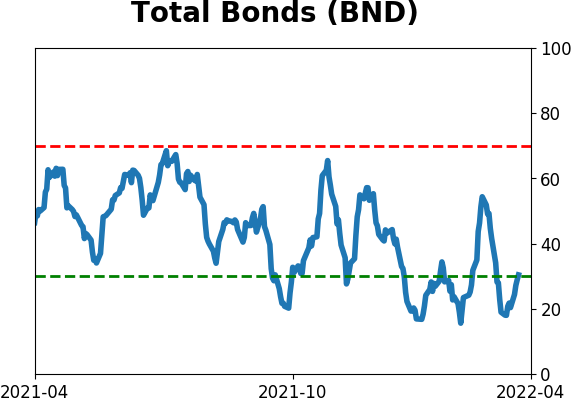
Bond ETF's - 10-Day Moving Average
|
|
|
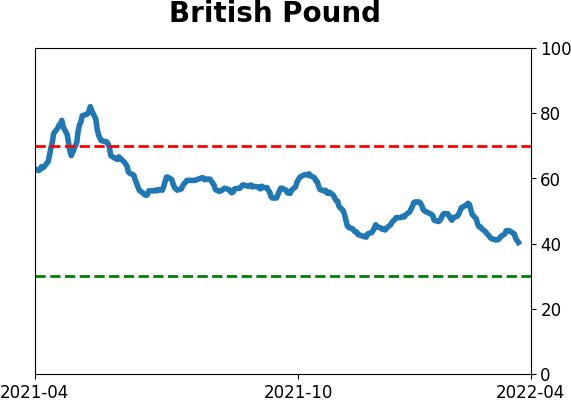
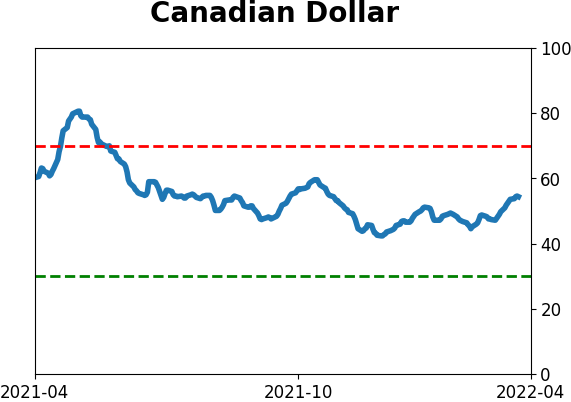
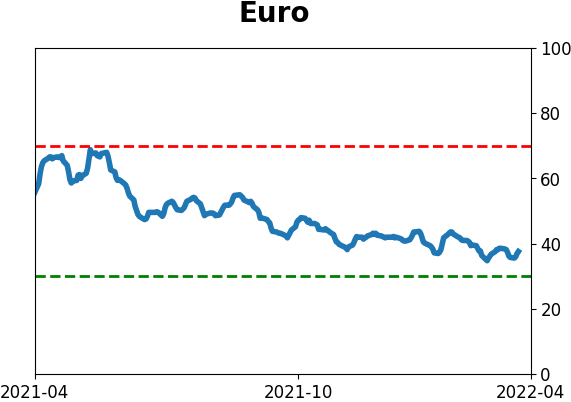
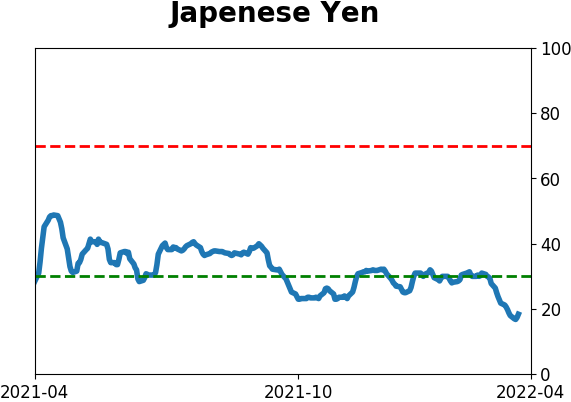
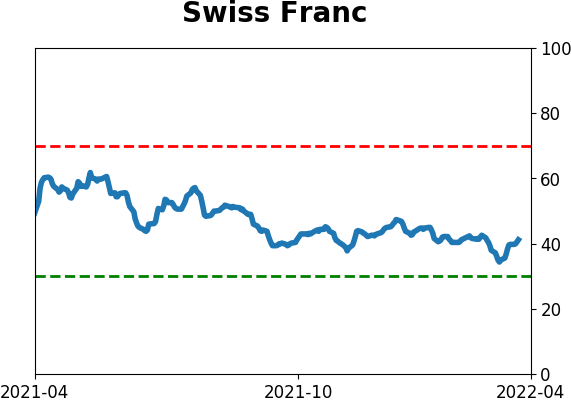
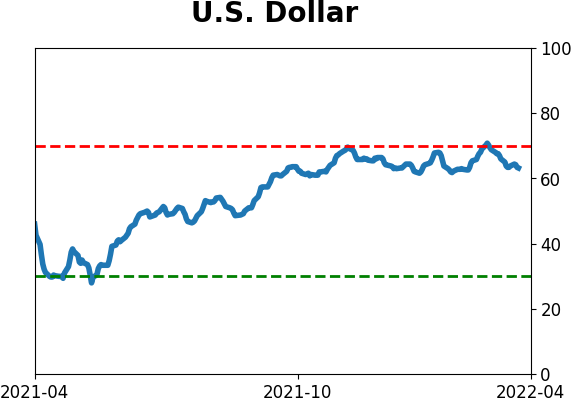
Currency ETF's - 5-Day Moving Average
|
|
|
Commodity ETF's - 5-Day Moving Average
|
|