Headlines
|
|
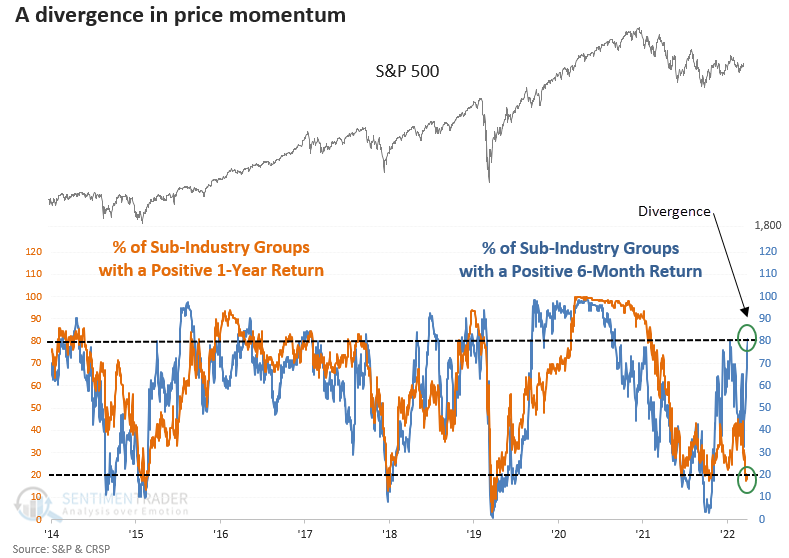
A bullish divergence in price momentum:
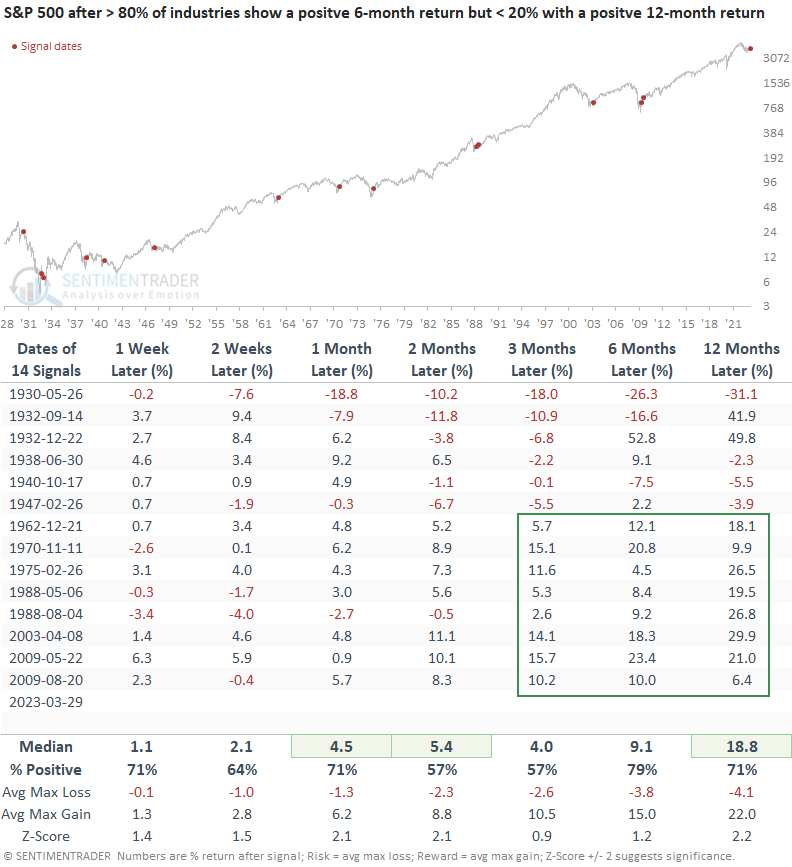
The percentage of sub-industry groups with a positive 6-month return increased to the highest level since September 2021, triggering a bullish setup as the 1-year return for most industries remains depressed. After similar price momentum divergences, the S&P 500 tends to rally in favor of the bulls.
|
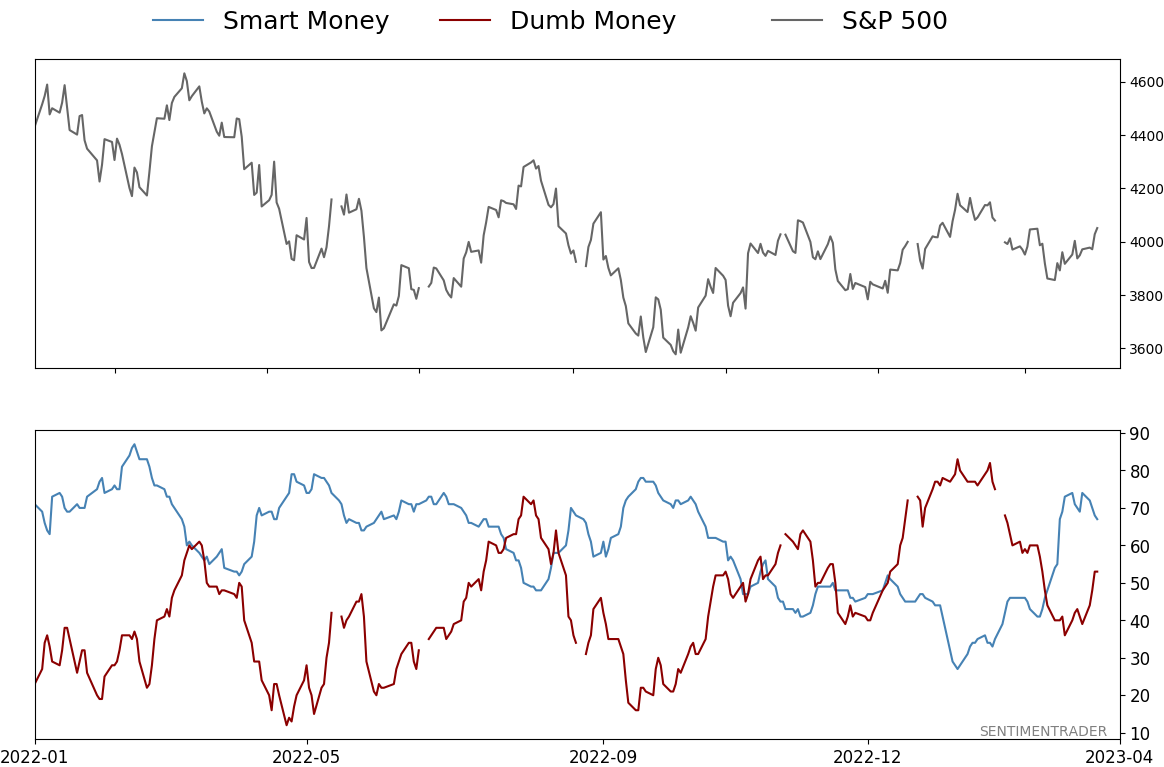
Smart / Dumb Money Confidence
|
Smart Money Confidence: 67%
Dumb Money Confidence: 53%
|
|
Risk Levels
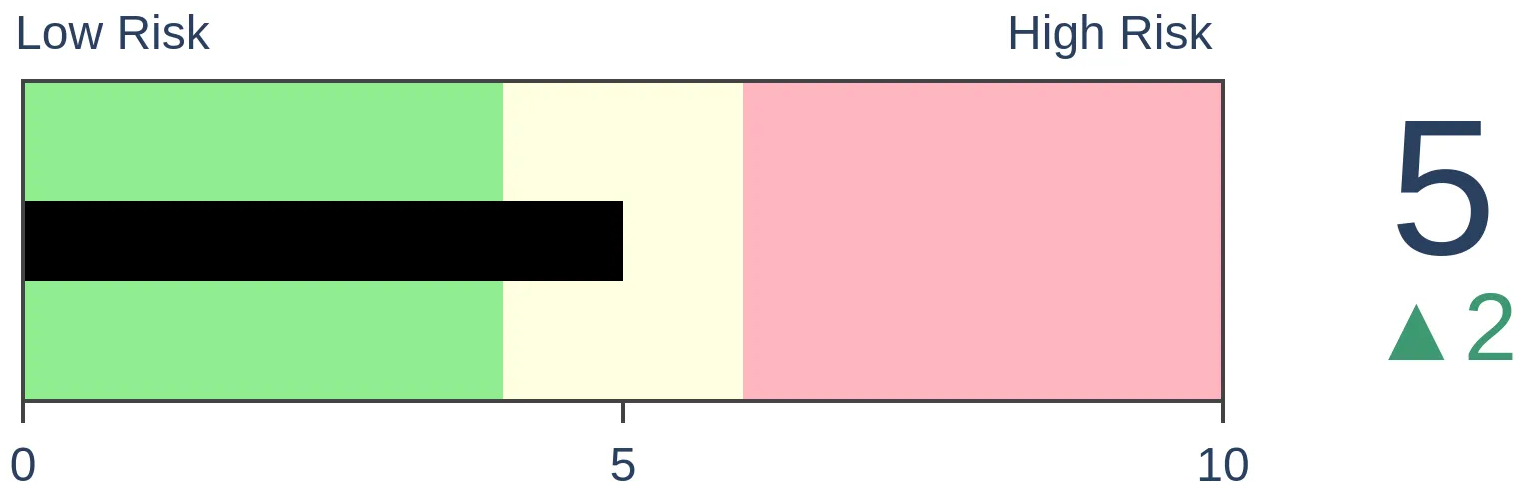
Stocks Short-Term
|
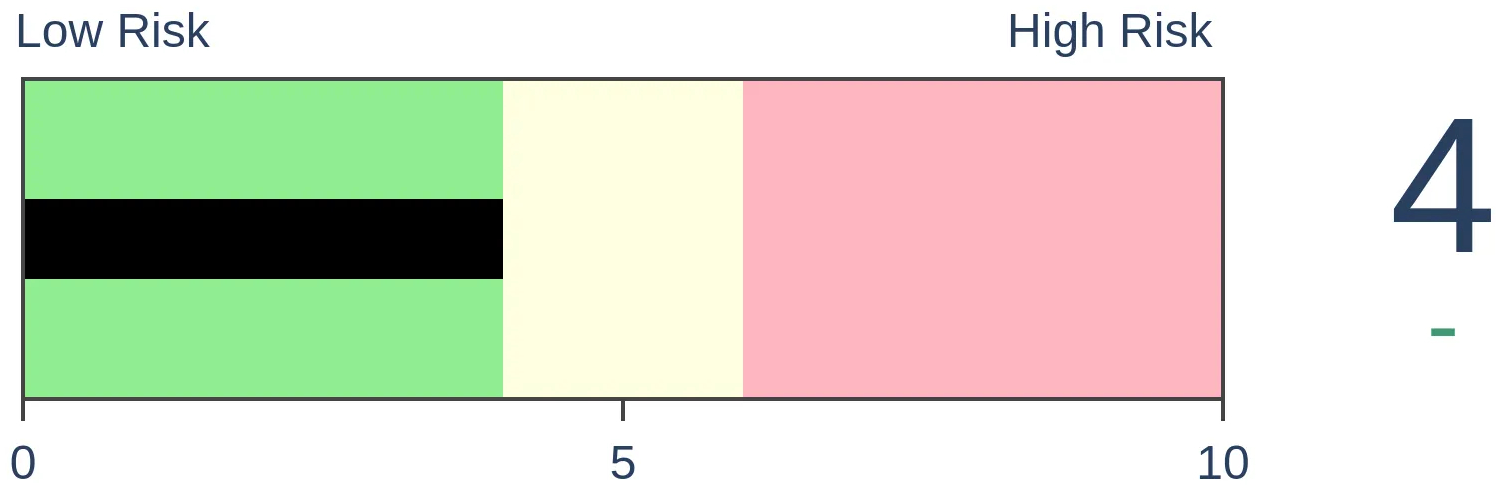
Stocks Medium-Term

|
|
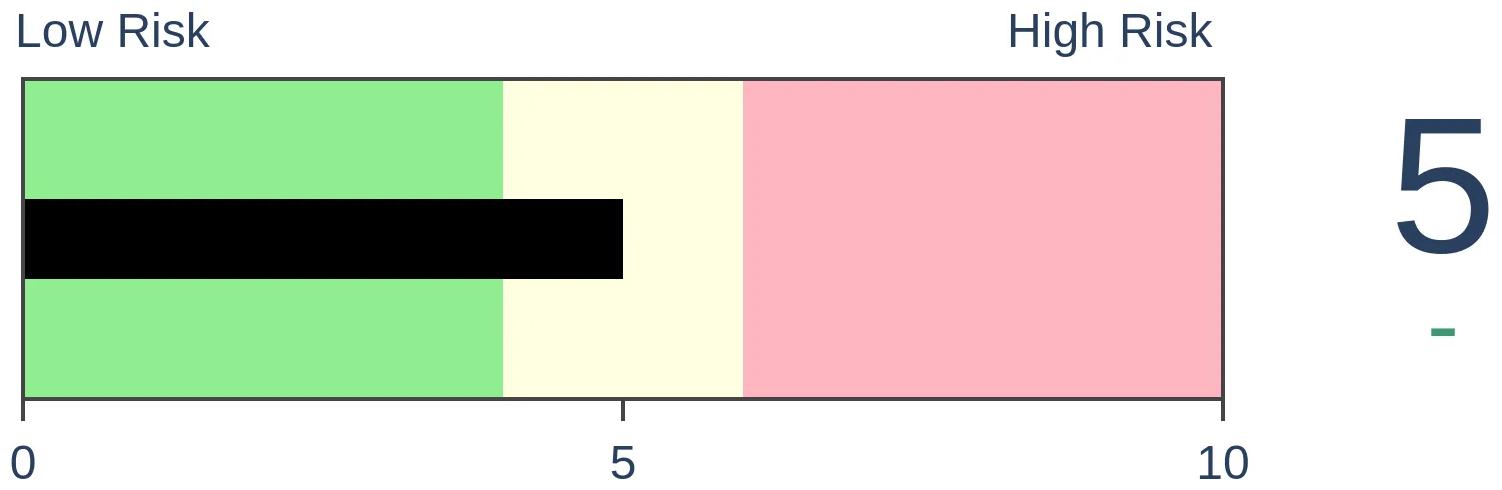
Bonds
|
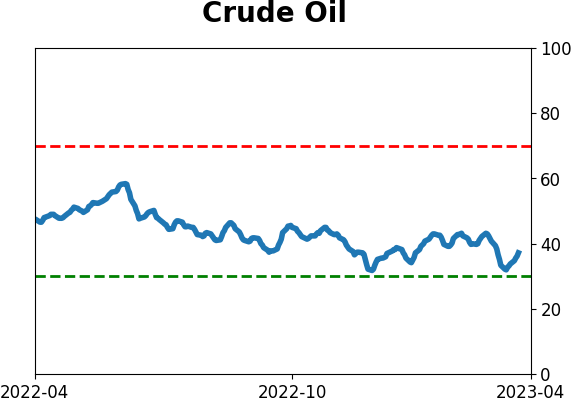
Crude Oil
|
|
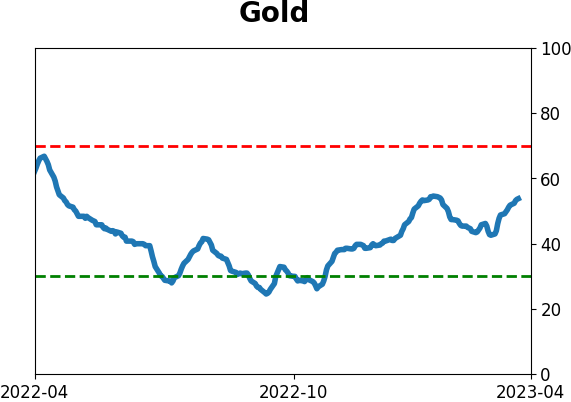
Gold

|
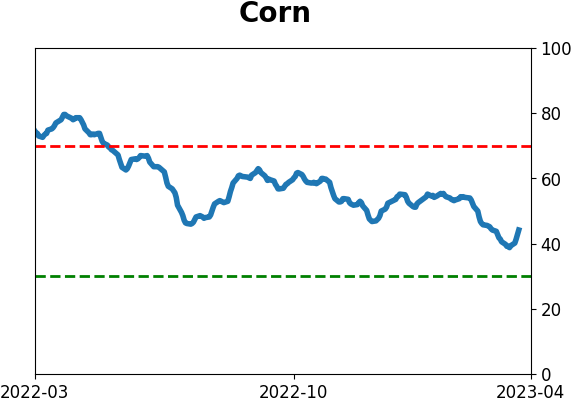
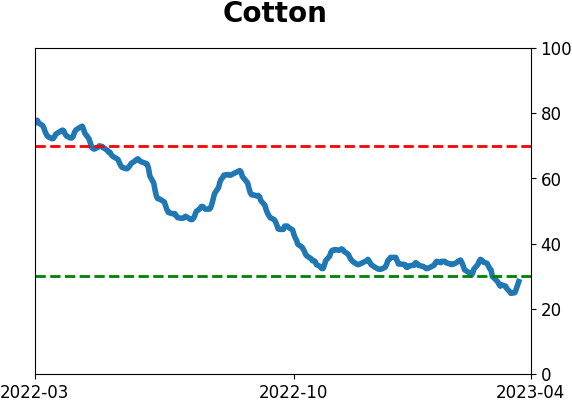
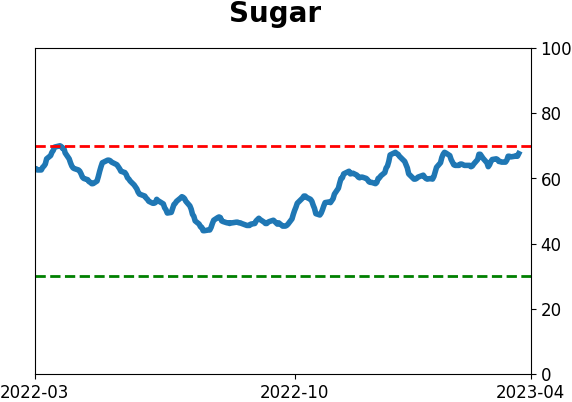
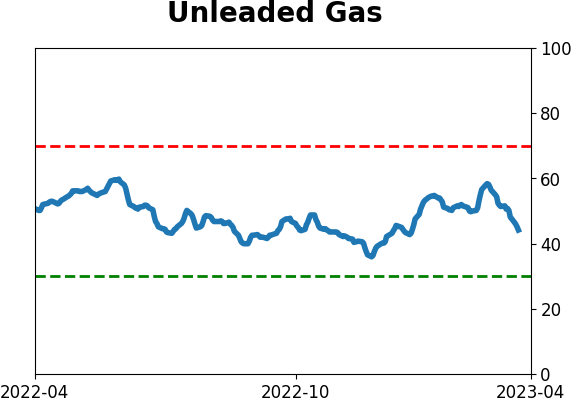
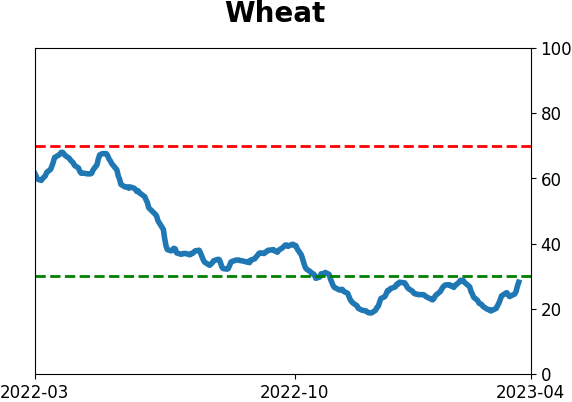
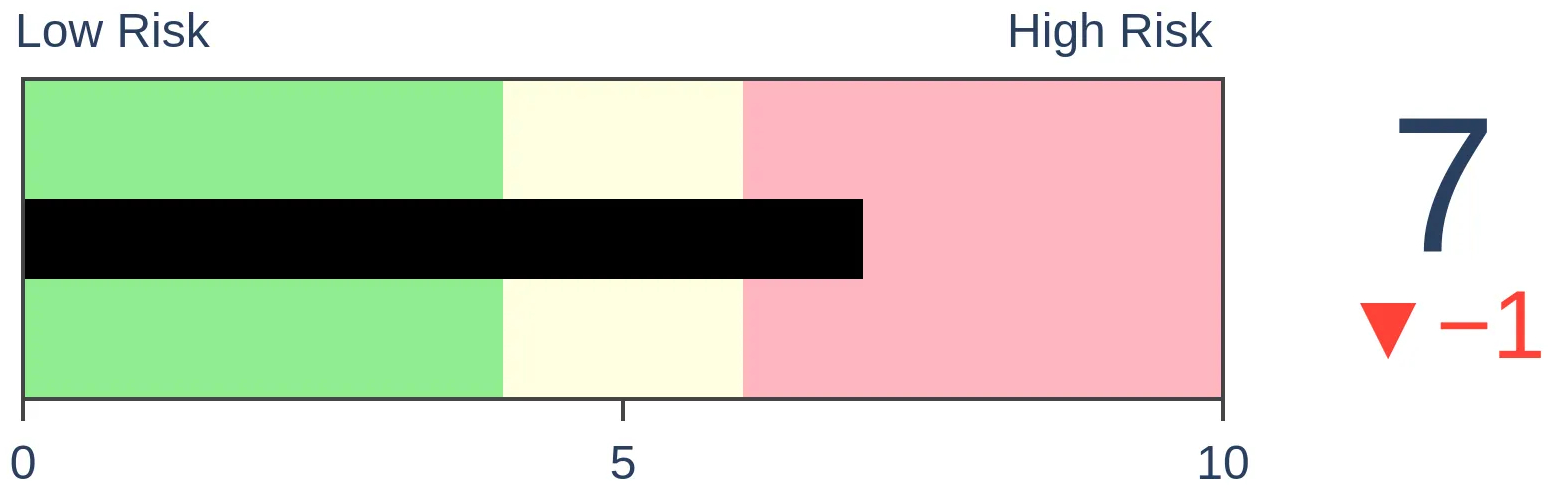
Agriculture
|
|
Research
By Dean Christians
BOTTOM LINE
The percentage of sub-industry groups with a positive 6-month return increased to the highest level since September 2021, triggering a bullish setup as the 1-year return for most industries remains depressed. After similar price momentum divergences, the S&P 500 tends to rally in favor of the bulls.
FORECAST / TIMEFRAME
None
|
Key points:
- More than 80% of sub-industry groups show a positive 6-month return
- At the same time, fewer than 20% of groups closed with a positive twelve-month return
- The S&P 500 tends to resolve the divergence in price momentum in favor of the bulls
A divergence in price momentum with bullish implications for stocks
While short to medium-term indicators gyrate up and down as the market encounters rolling corrections and rallies within a length consolidation pattern, some long-term measures continue to improve.
One such indicator, the percentage of sub-industry groups with a positive 6-month return, exceeded 81%, the highest level since September 2021. While industry momentum on a 6-month basis looks bullish, one can't say the same over a 1-year period, where fewer than 20% of groups closed with a positive return.
Let's assess the outlook for the S&P 500 when greater than 80% of sub-industry groups show a positive return over a rolling 6-month window but fewer than 20% of groups close with a positive return over a rolling 1-year period.
Similar price momentum divergences preceded positive returns
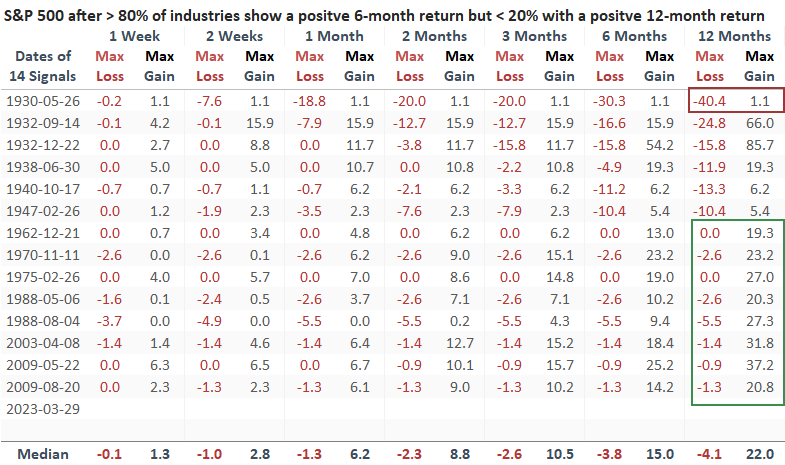
When price momentum for sub-industry groups over a six and twelve-month period are out of sync like now, the S&P 500 shows an excellent tendency to rally, especially since 1962. While the signals before 1950 were less favorable, 5 out of 6 precedents showed a profit at some point in the first two months.
Interestingly, a signal was triggered in 1947, which I highlighted recently in a note as a potential analog.
Besides 1930, the max gain was significantly better than the max loss a year later in most cases, especially since 1962.
What the research tells us...
The S&P 500 remains mired in a lengthy consolidation pattern. Rangebound markets, like now, produce a mixed message for short and medium-term indicators. The good news is that sentiment remains supportive, and some long-term indicators are improving. When price momentum for sub-industry groups over a six and twelve-month period diverges like now, the S&P 500 tends to rally, with a perfect record a year later since 1962.
Indicators at Extremes
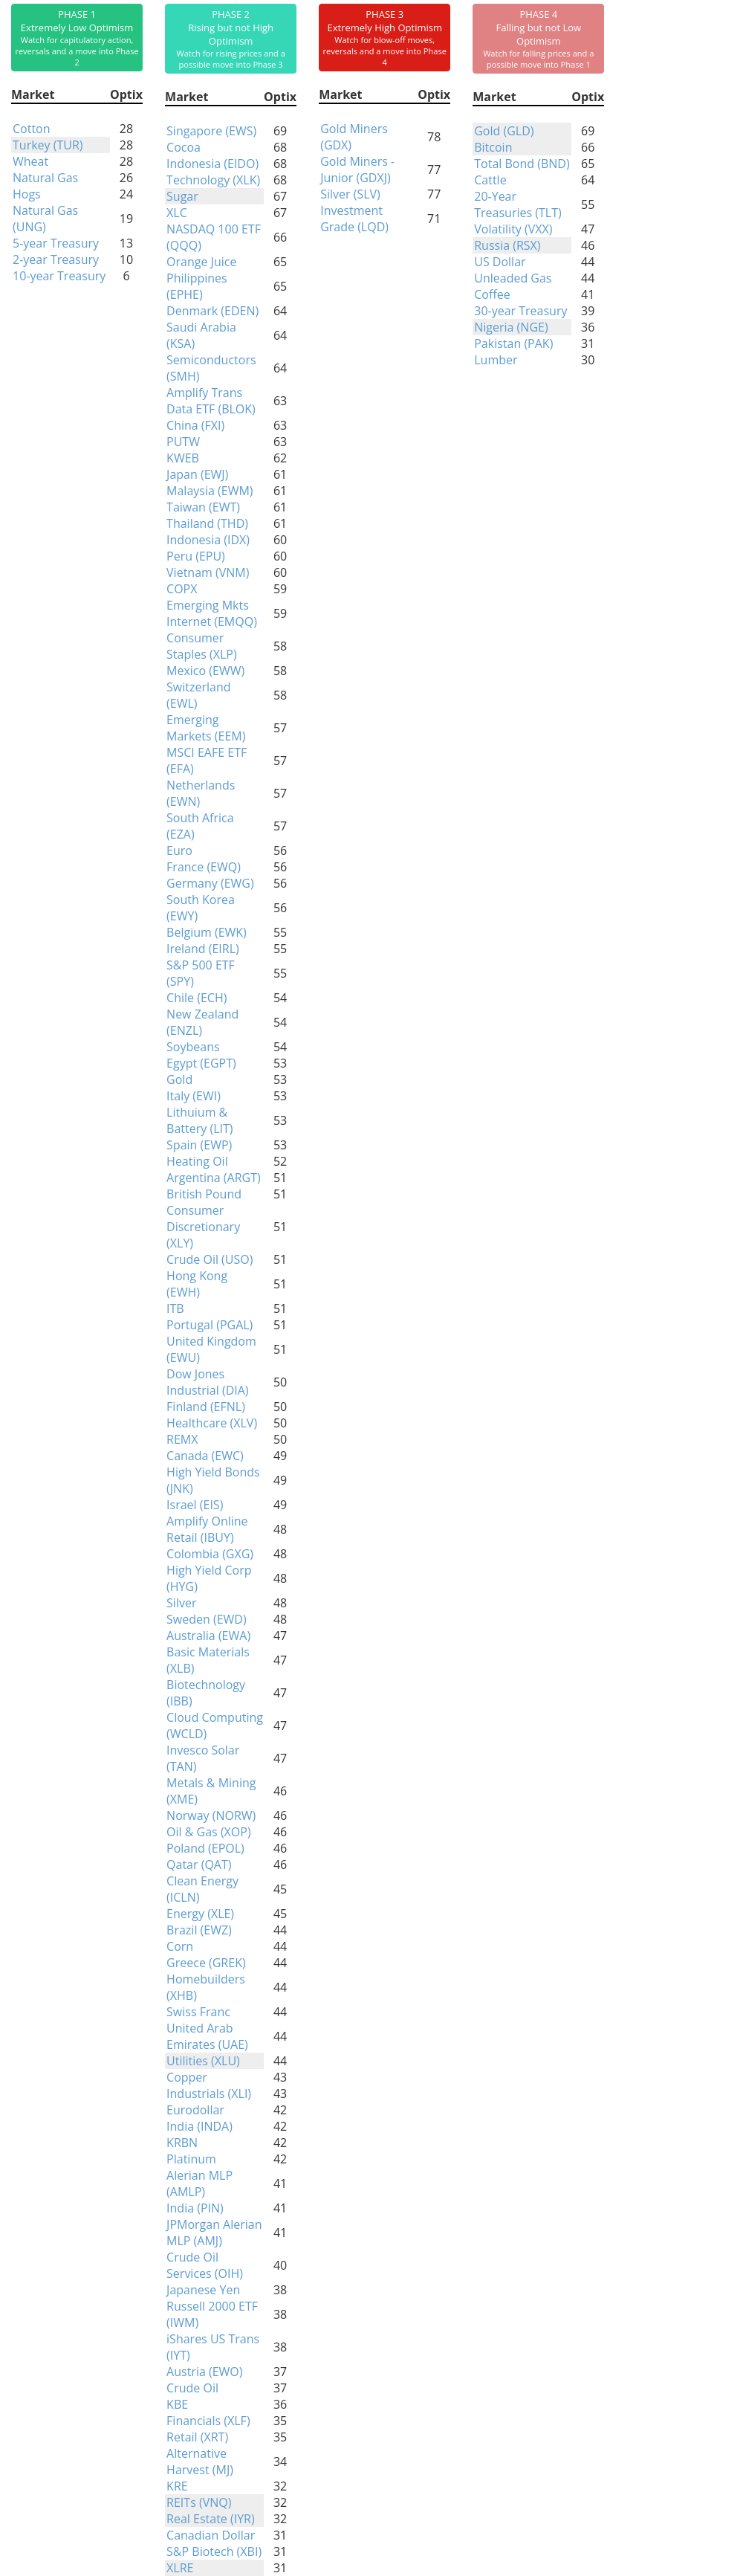
Phase Table
Ranks
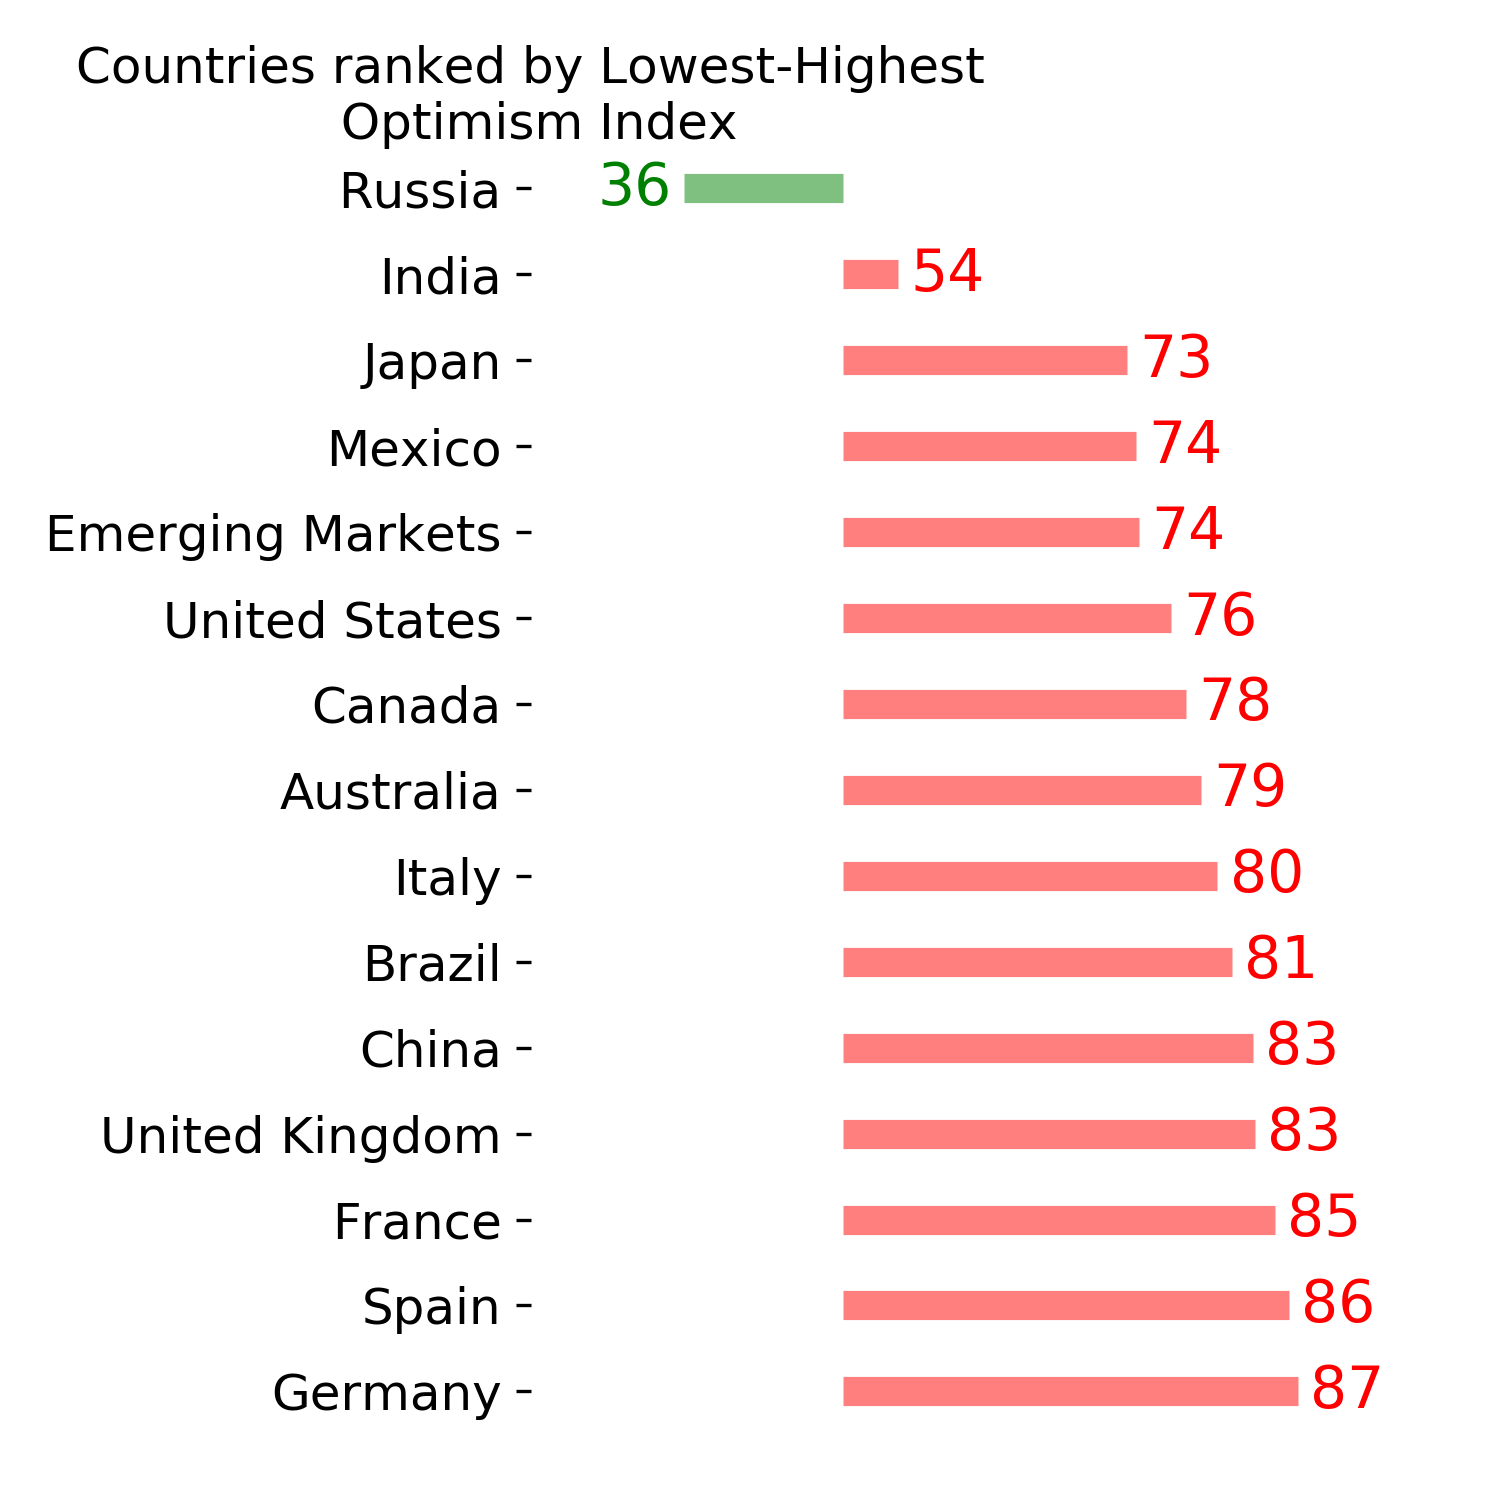
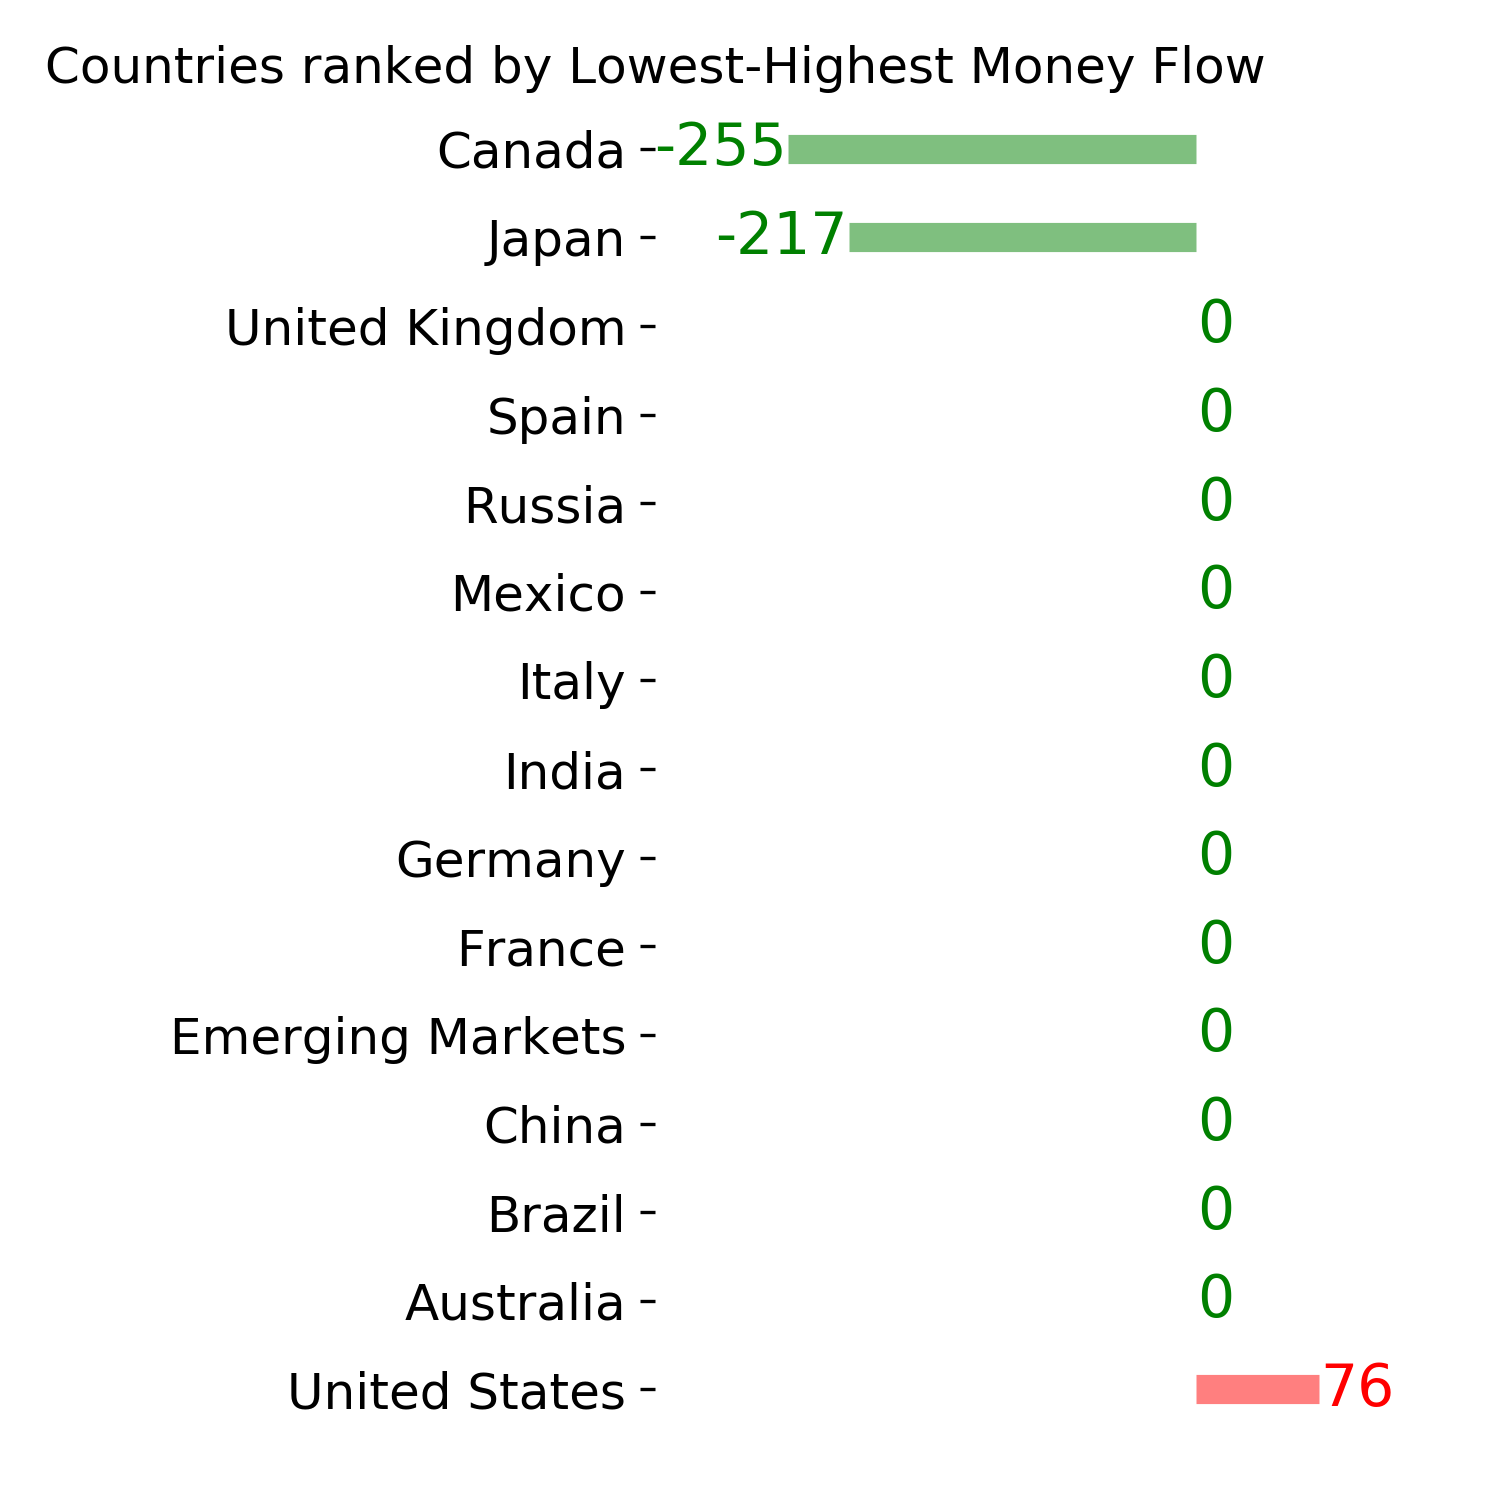
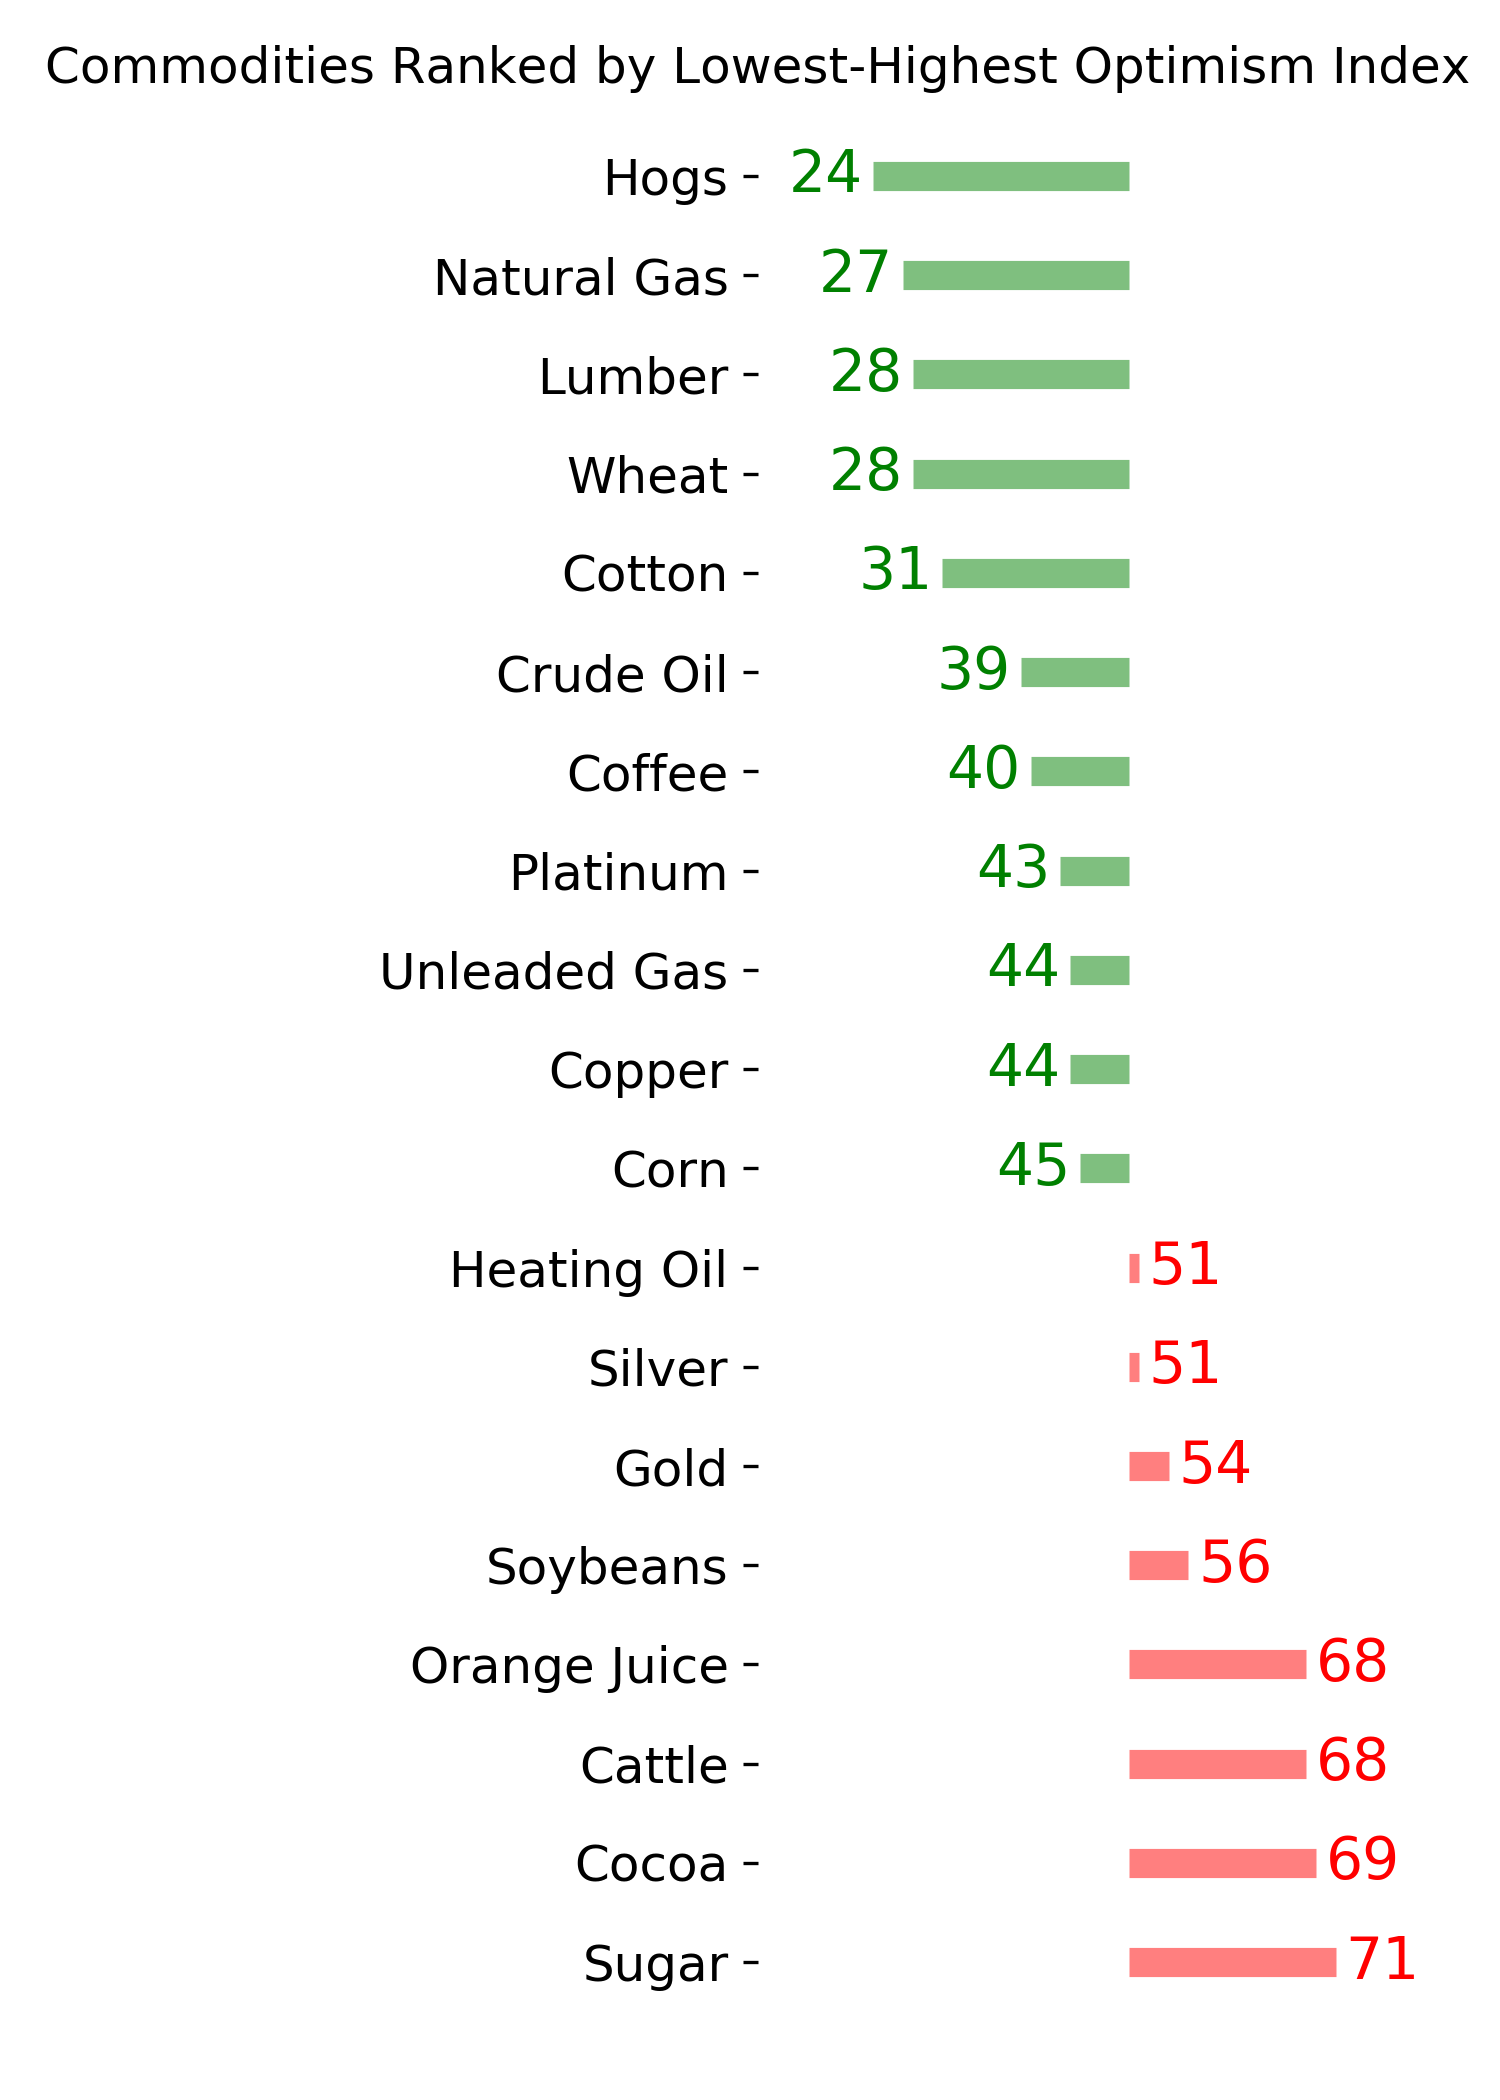
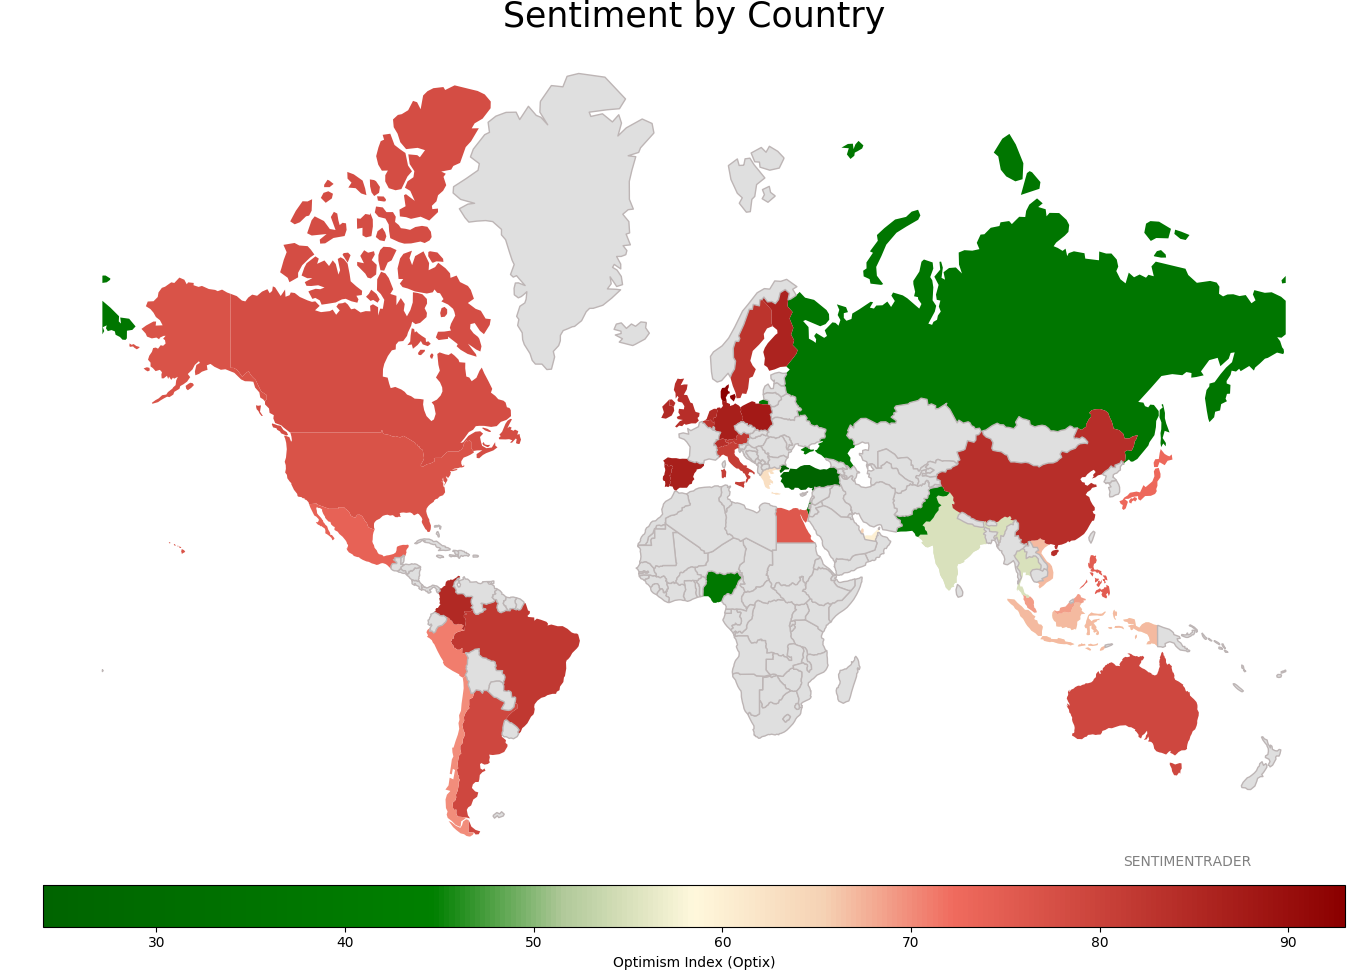
Sentiment Around The World
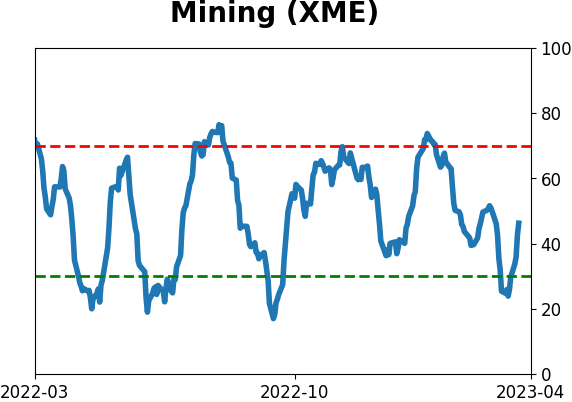
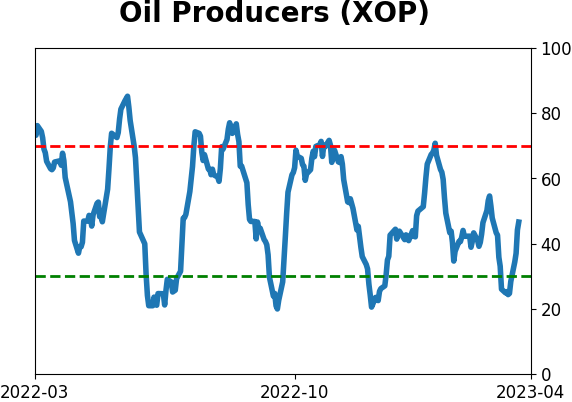
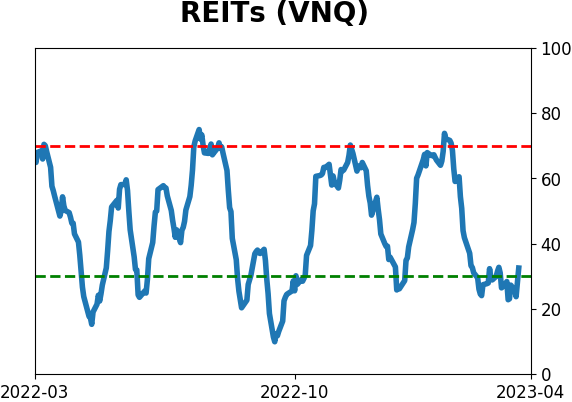
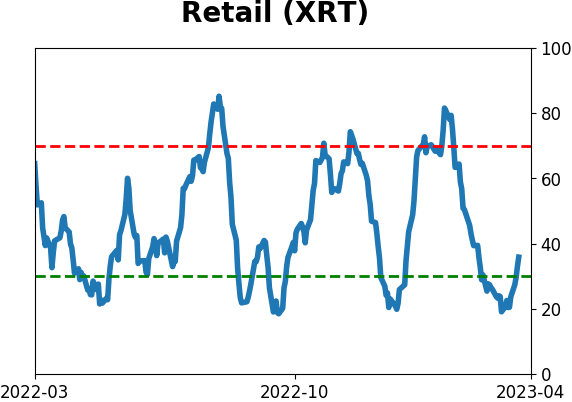
Optimism Index Thumbnails
|
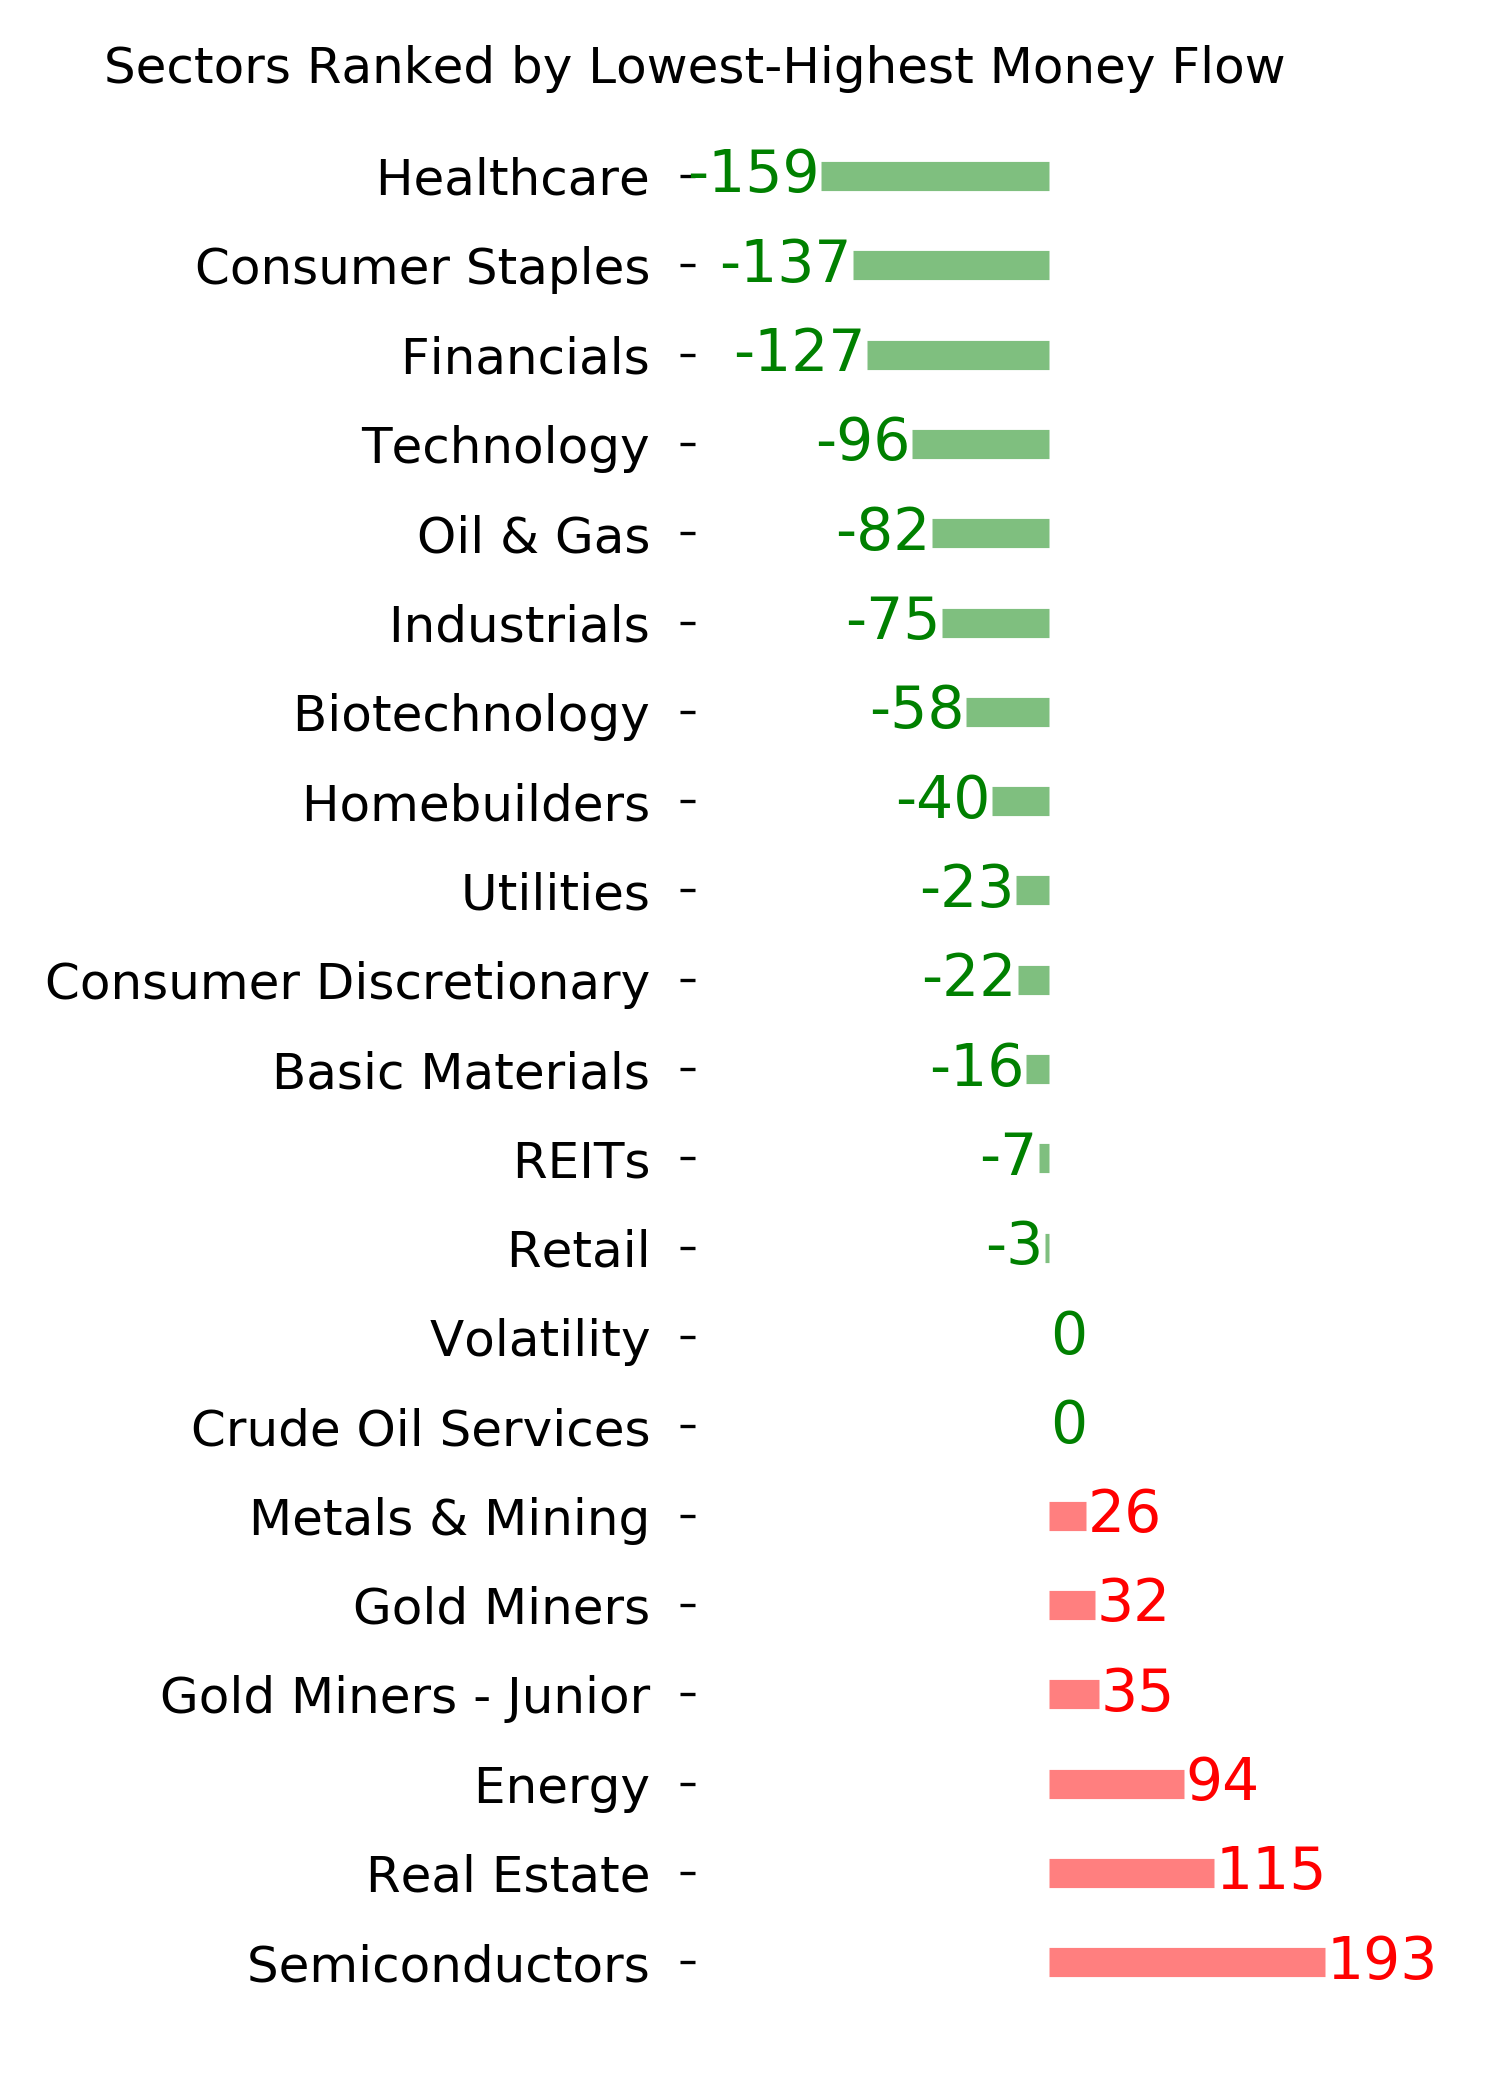
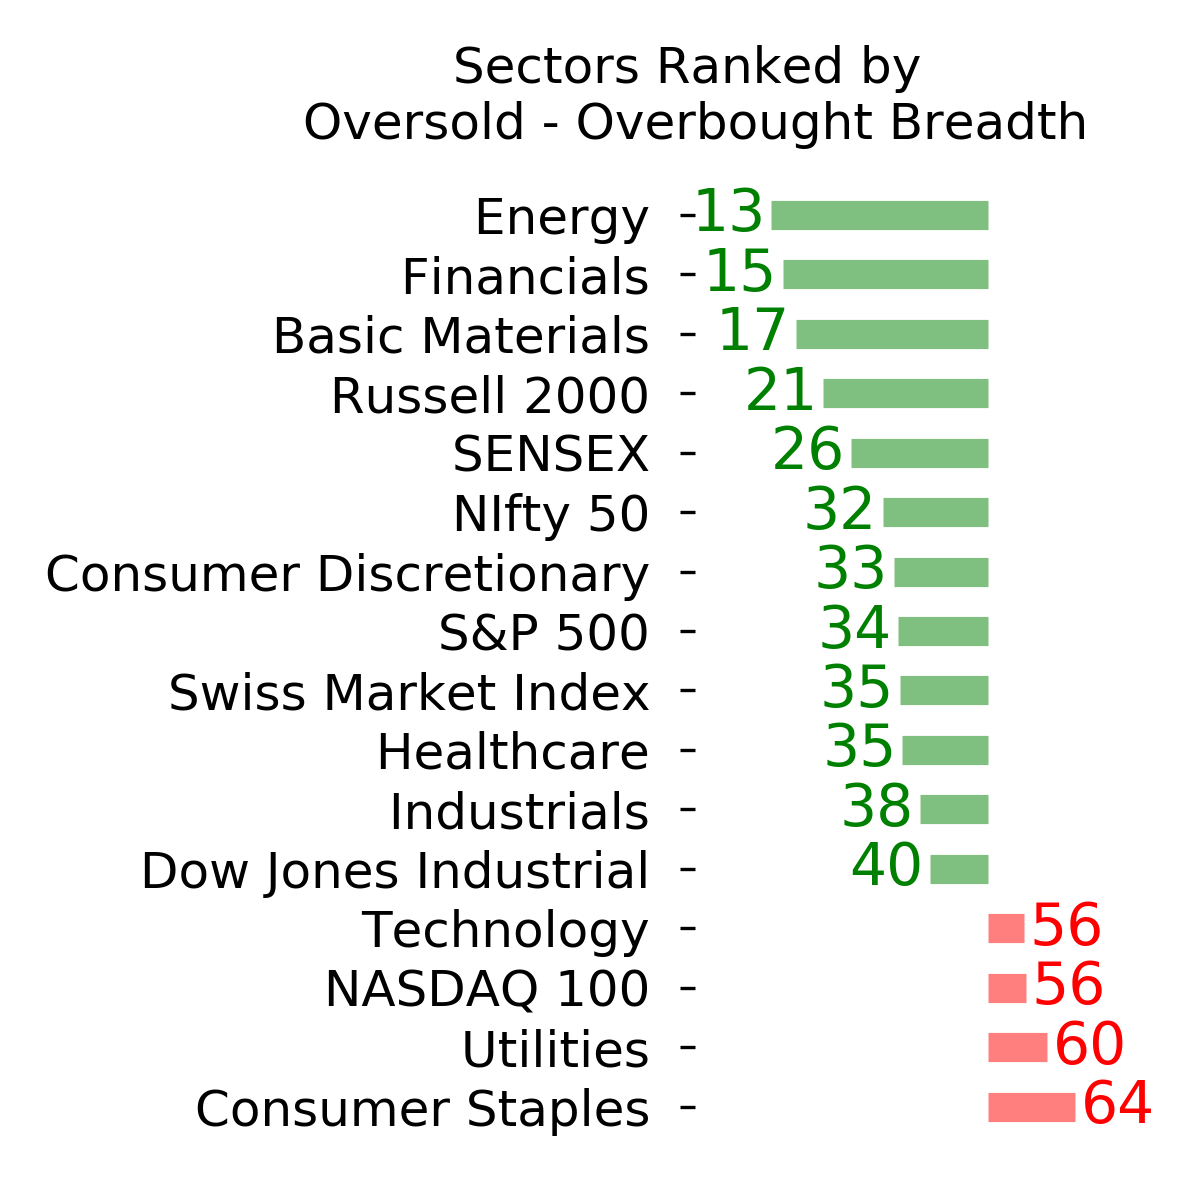
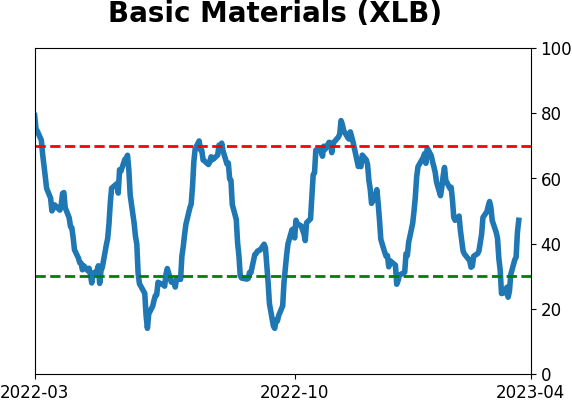
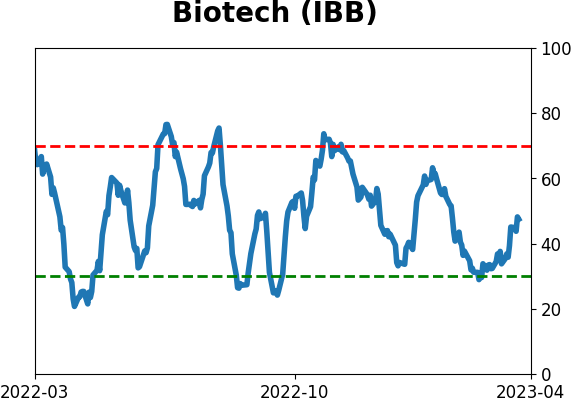
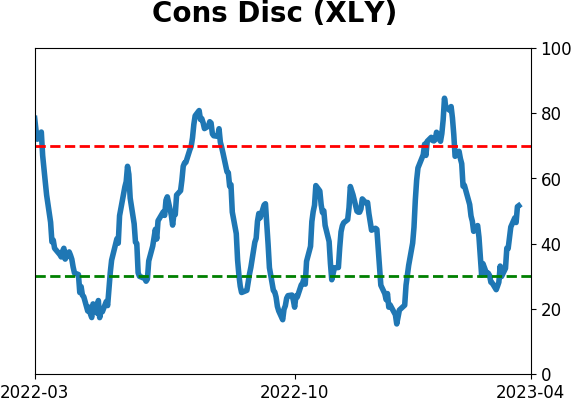
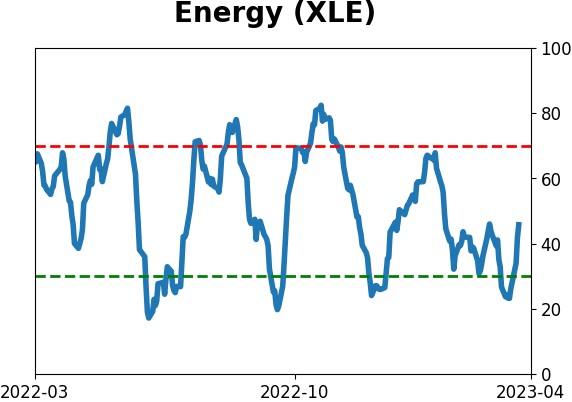
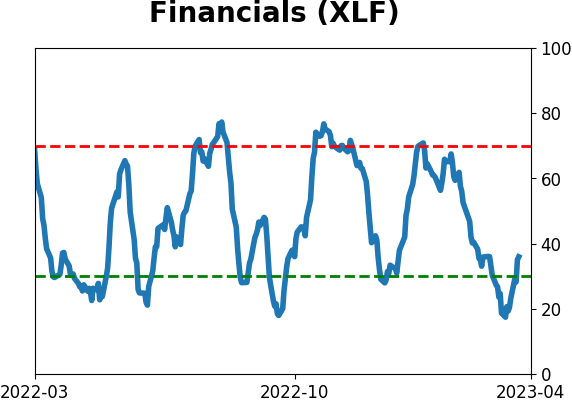
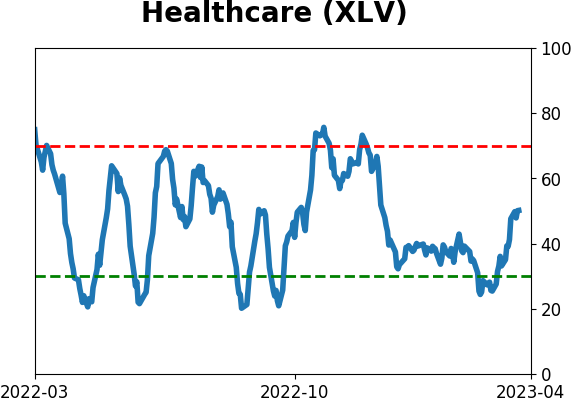
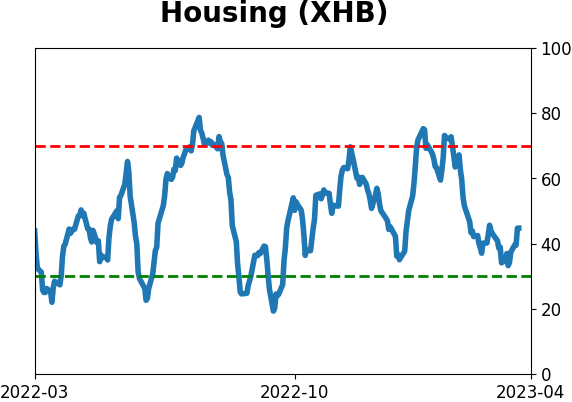
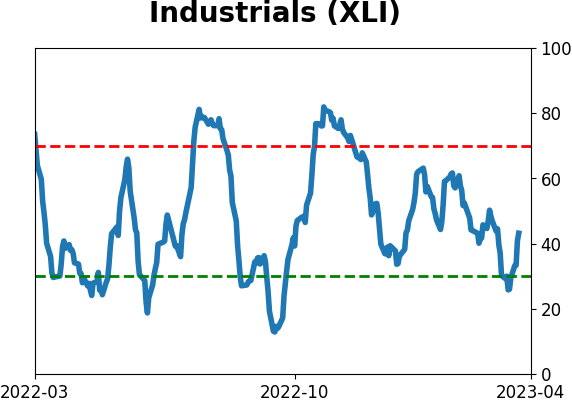
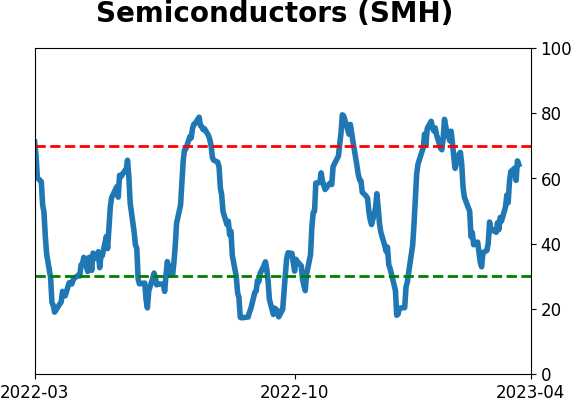
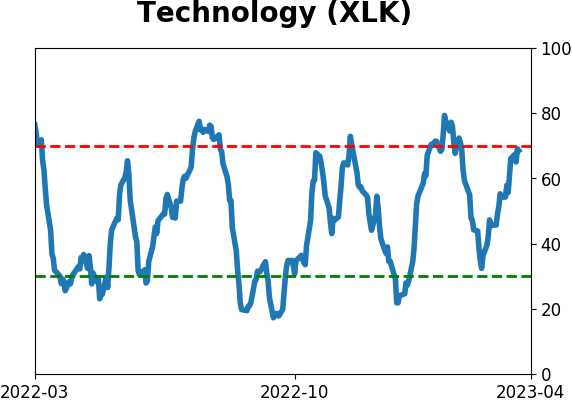
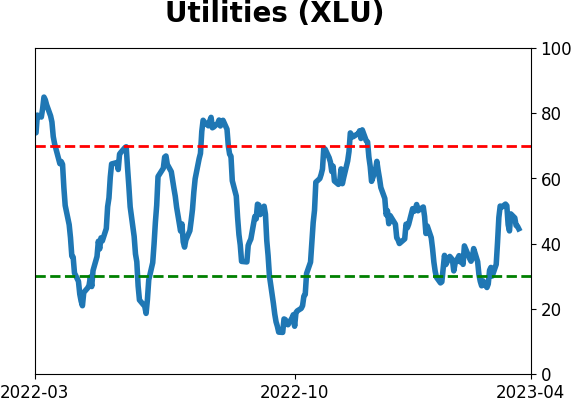
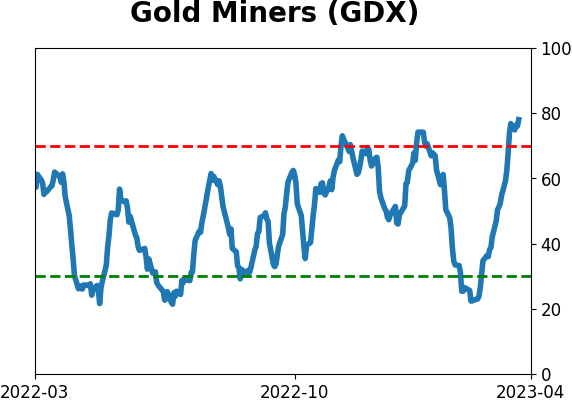
Sector ETF's - 10-Day Moving Average
|
|
|
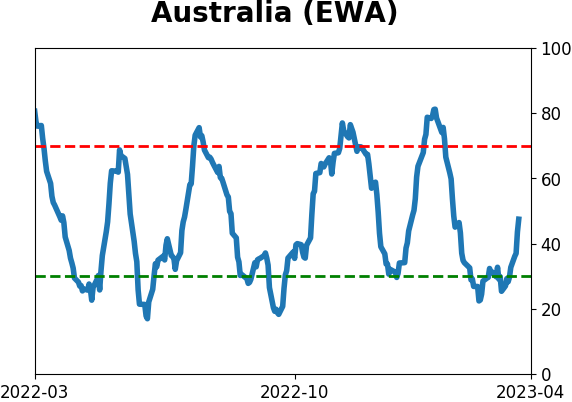
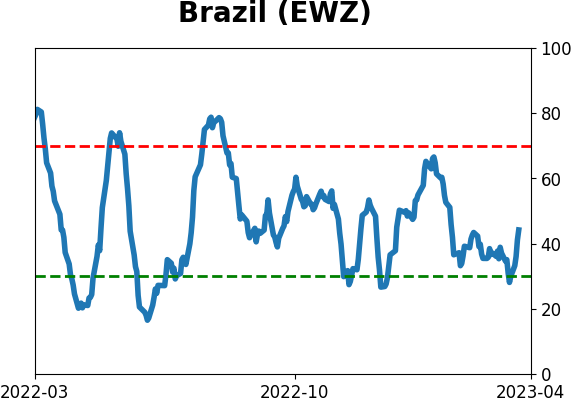
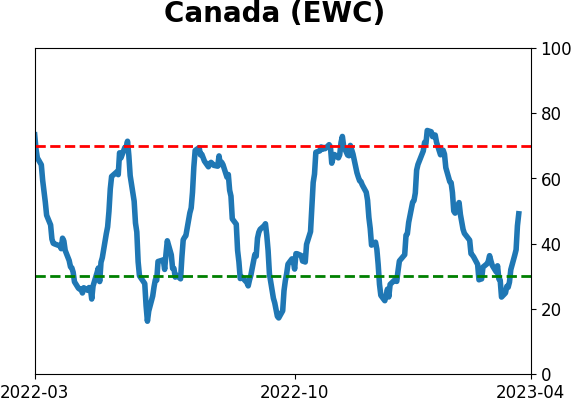
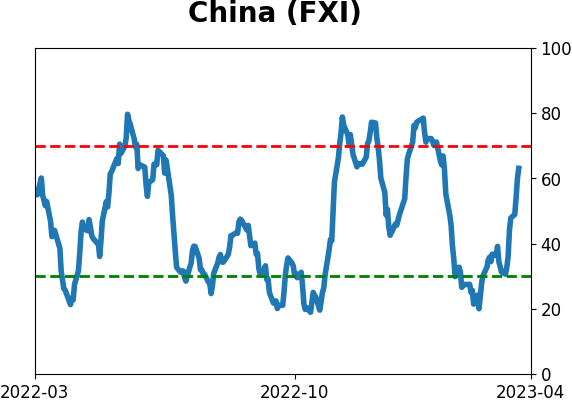
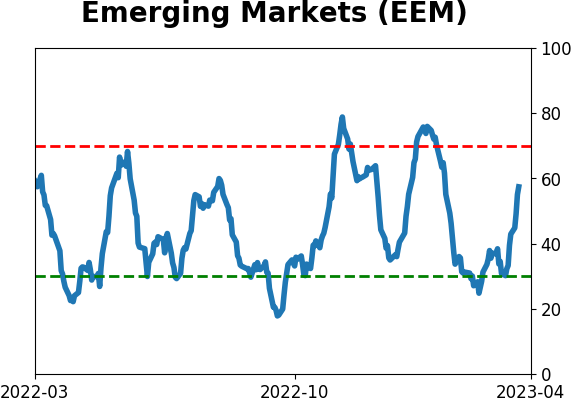
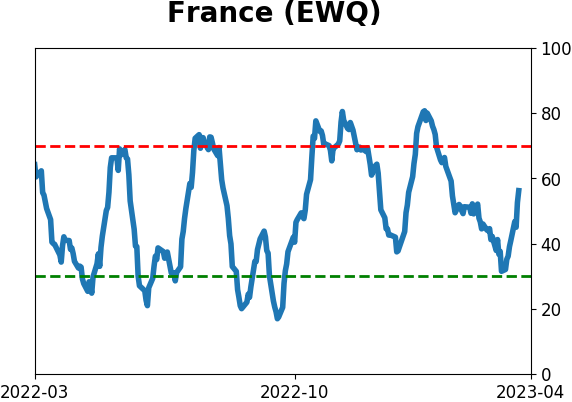
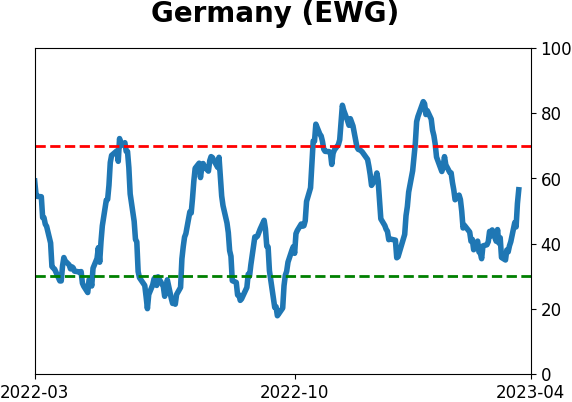
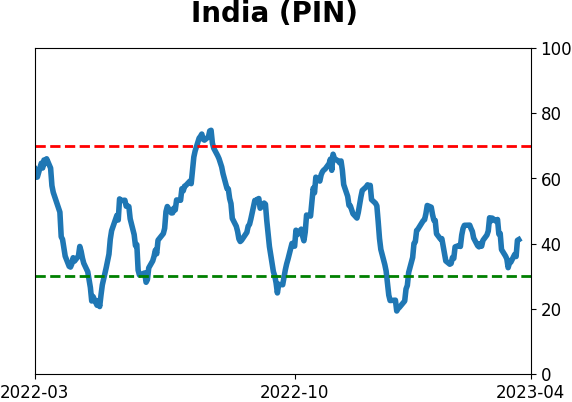
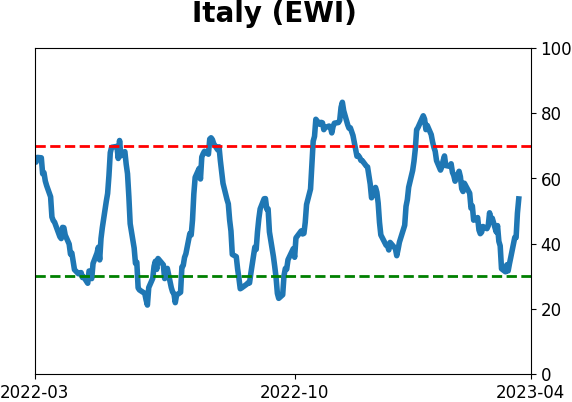
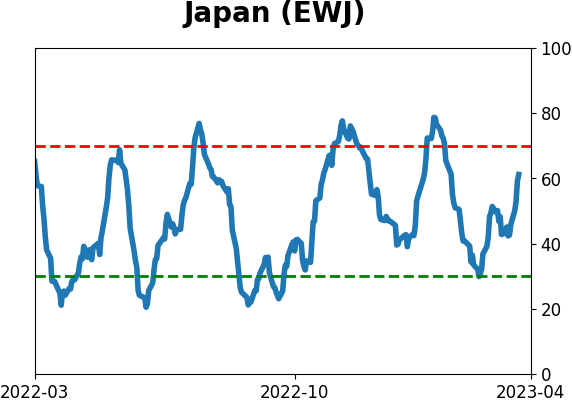
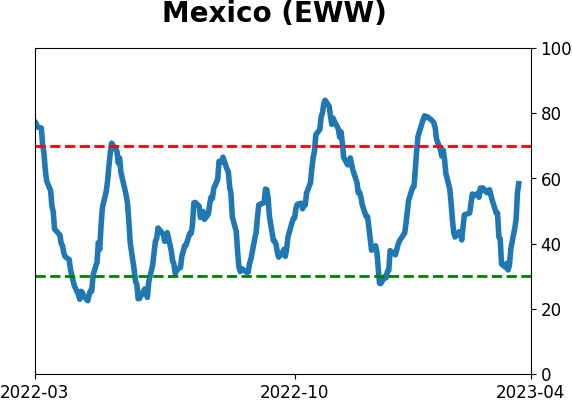
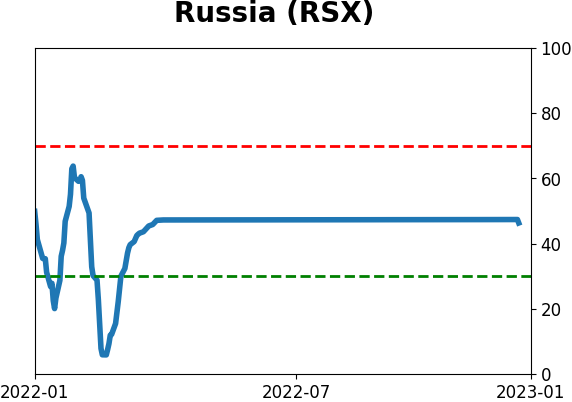
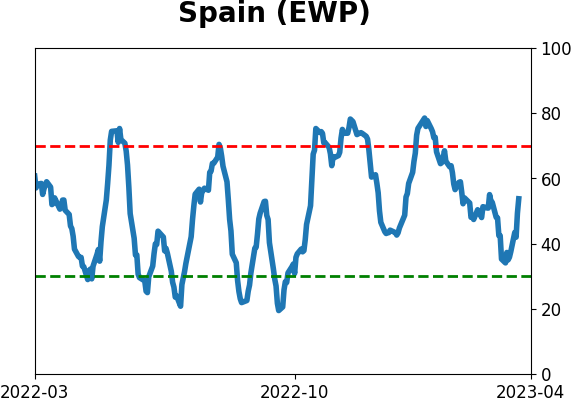
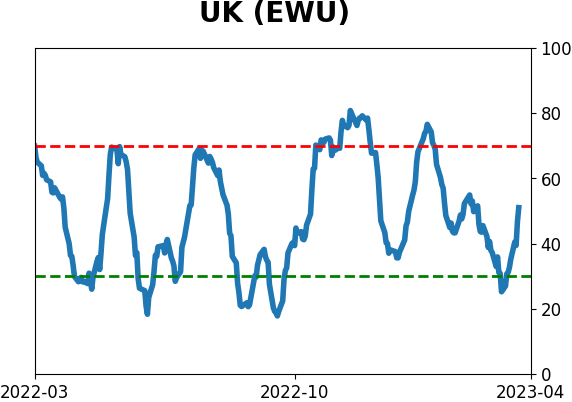
Country ETF's - 10-Day Moving Average
|
|
|
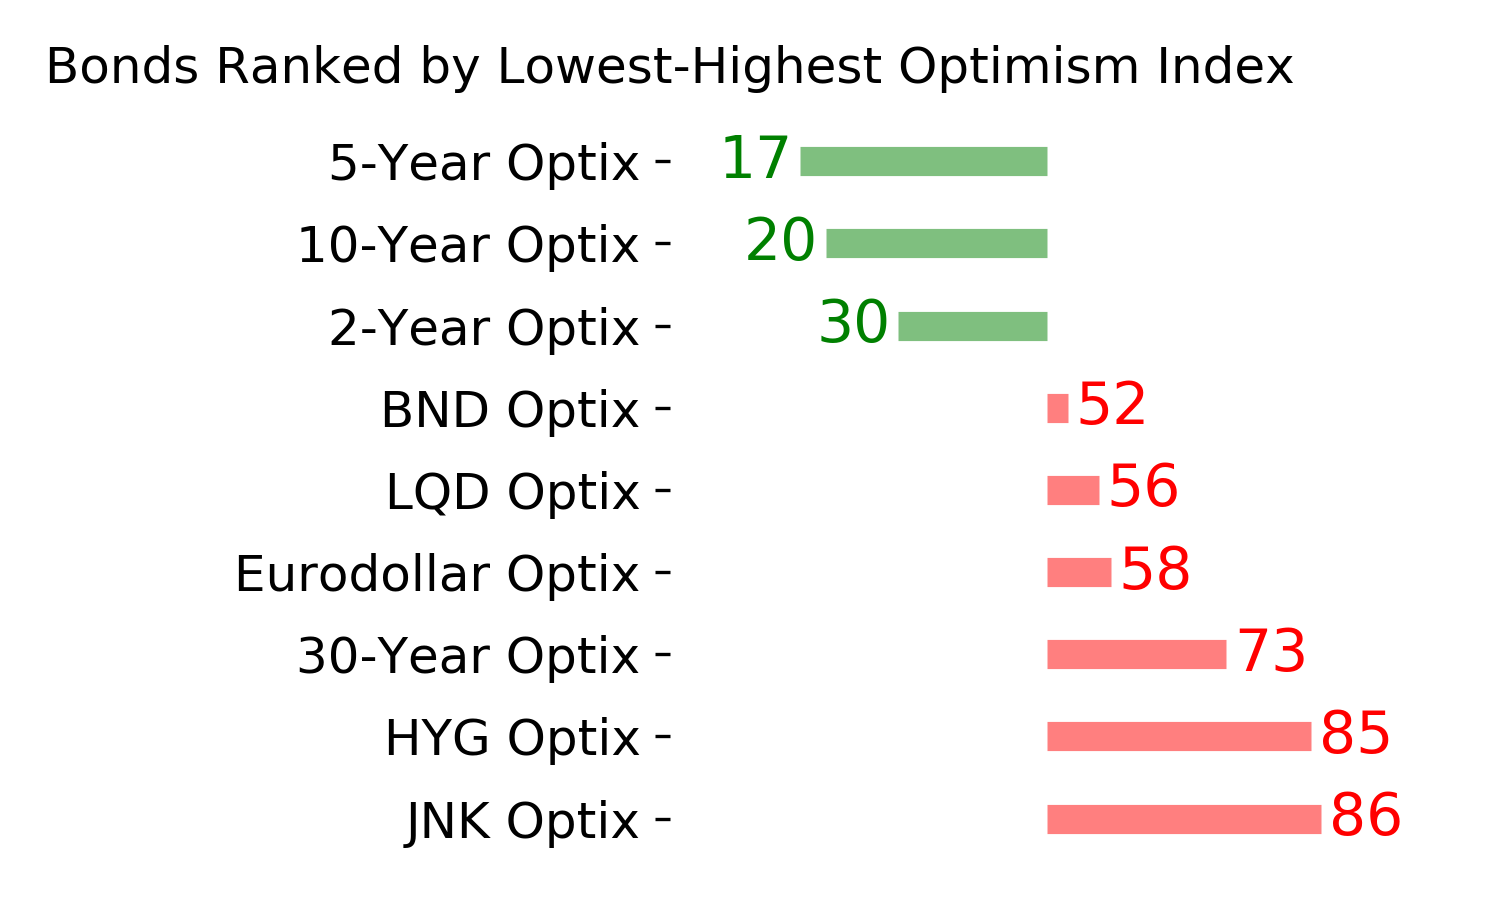
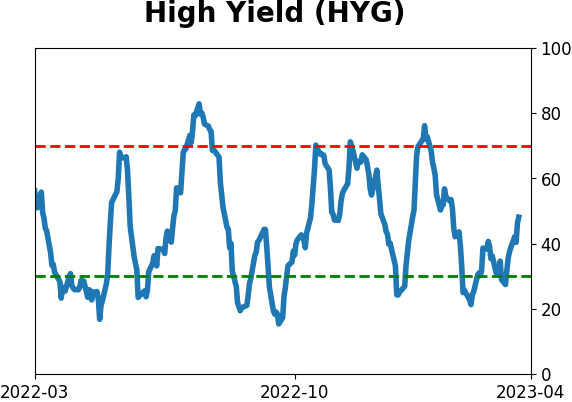
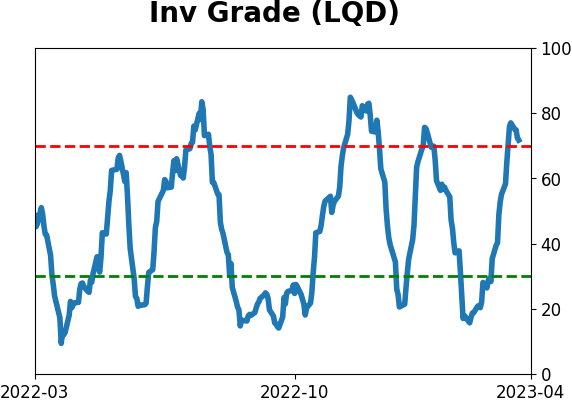
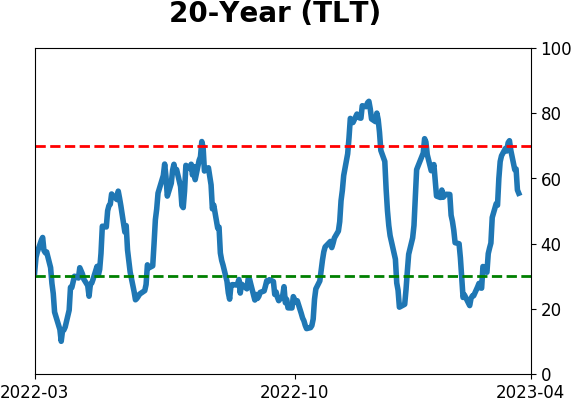
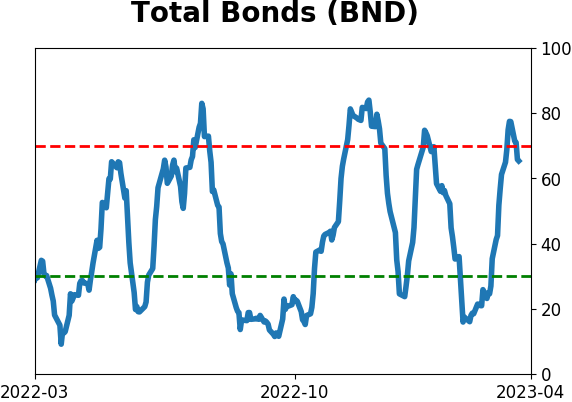
Bond ETF's - 10-Day Moving Average
|
|
|
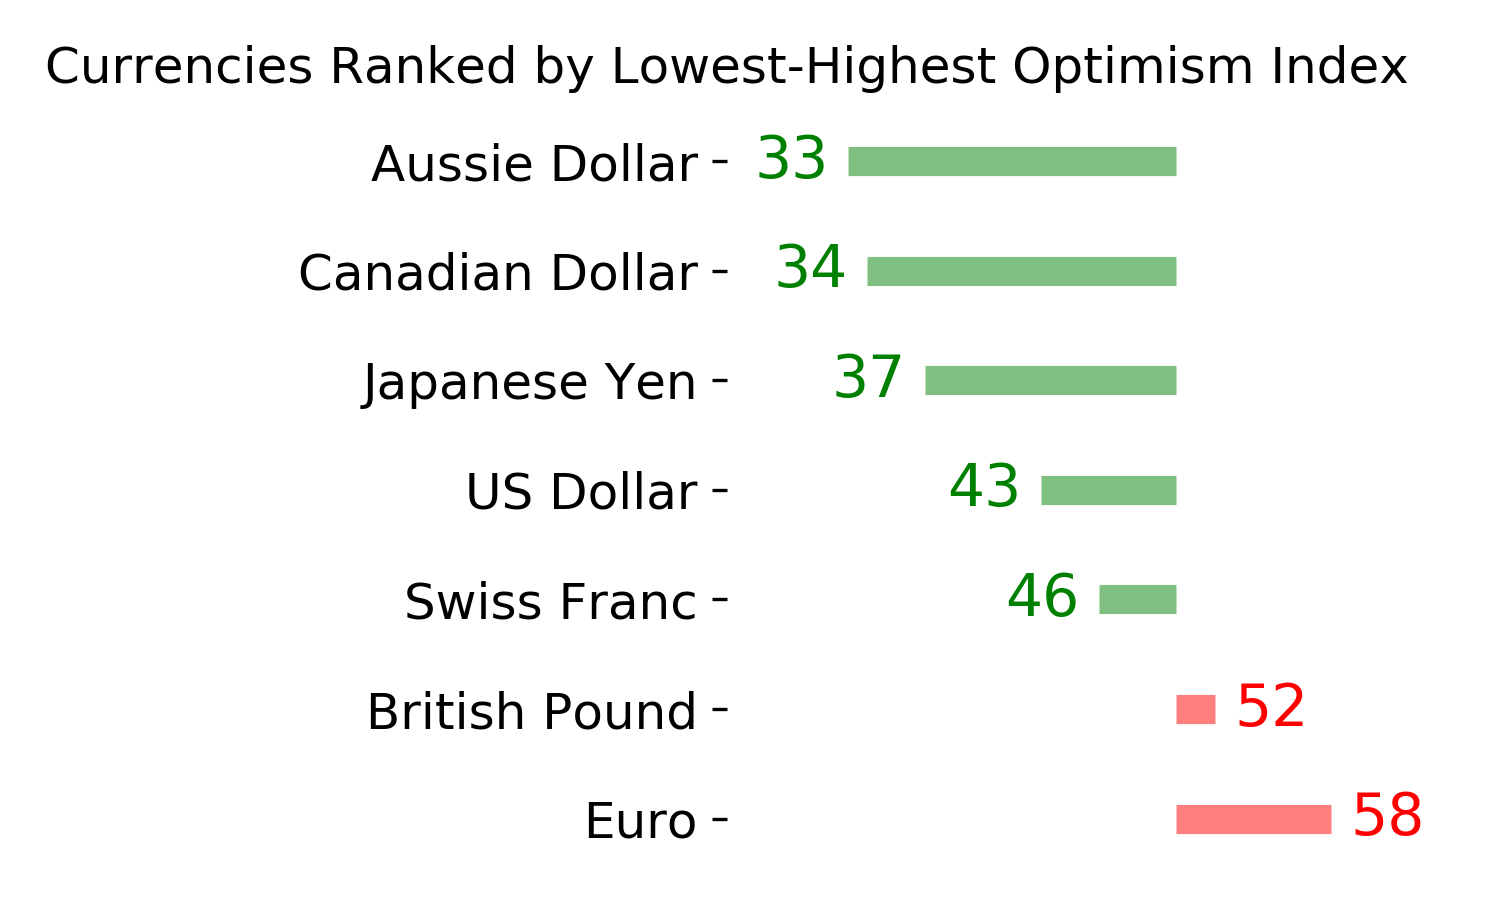
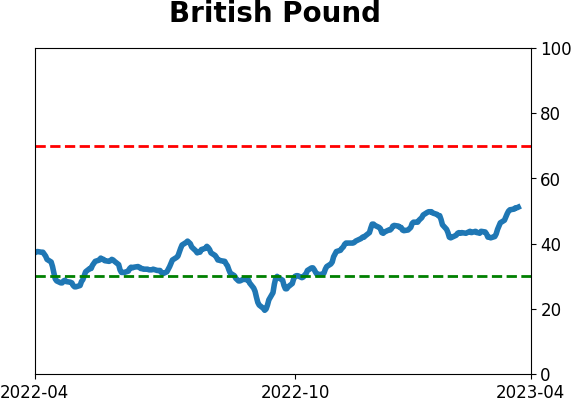
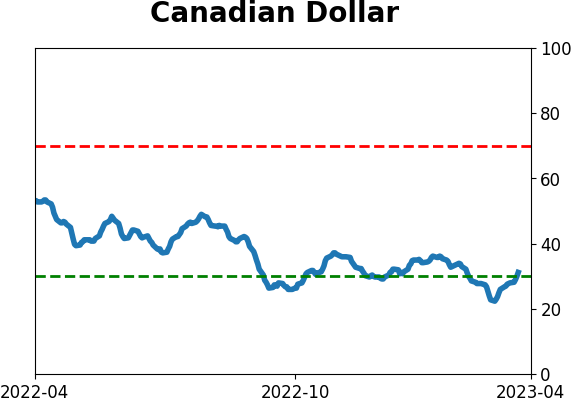
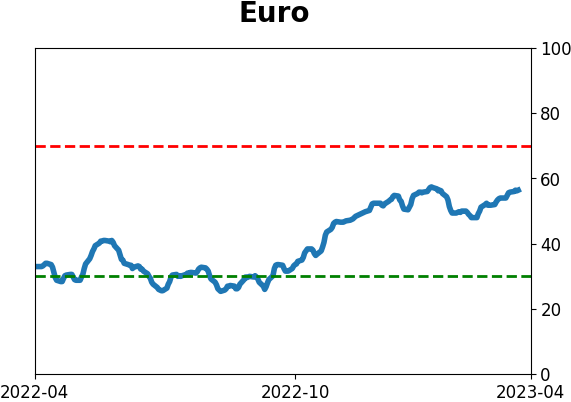
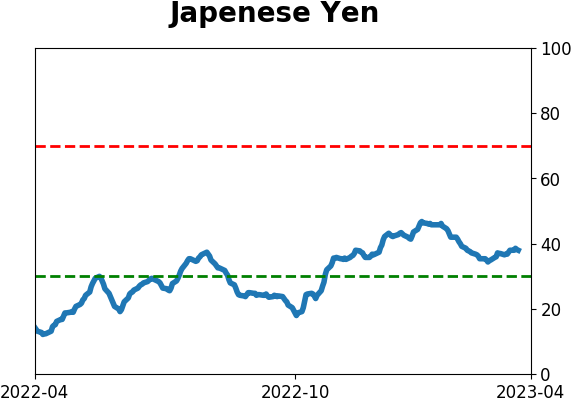
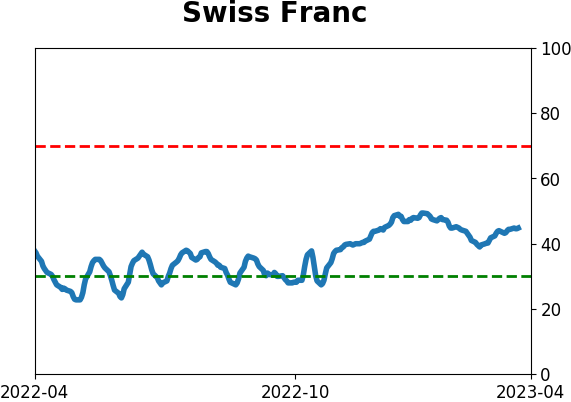
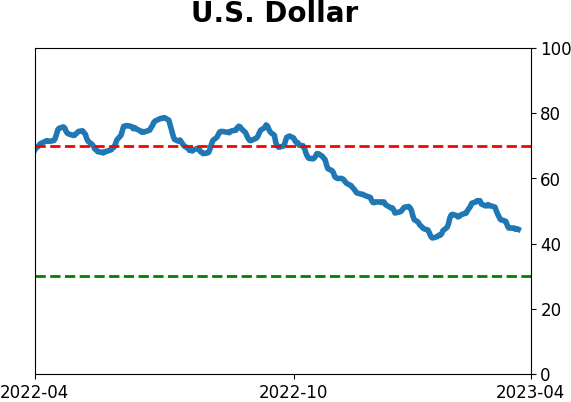
Currency ETF's - 5-Day Moving Average
|
|
|
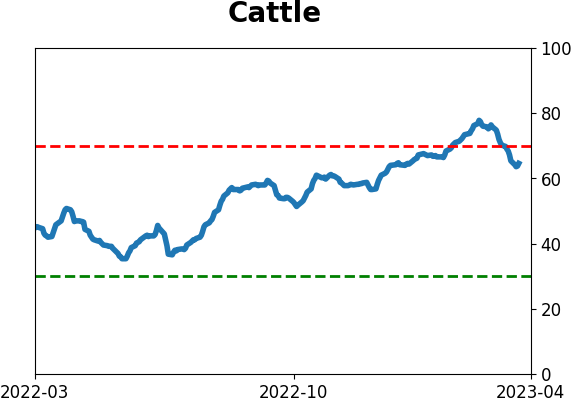
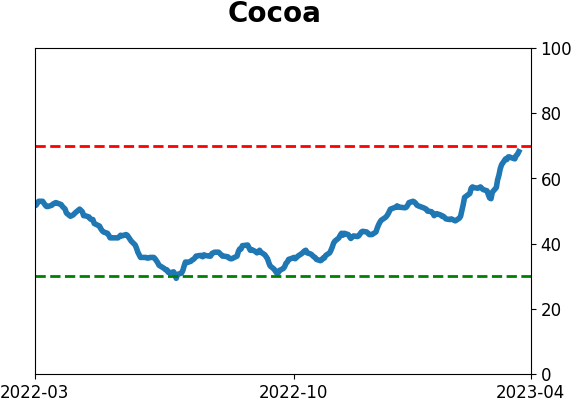
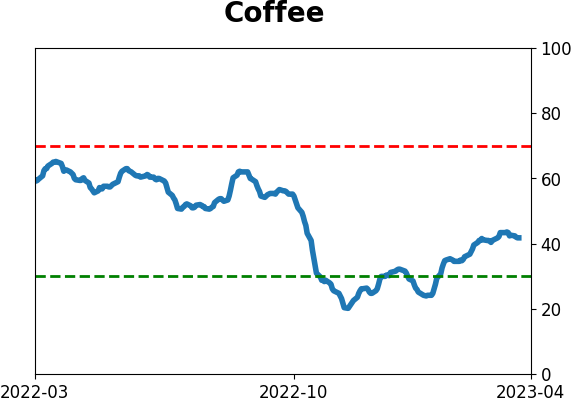
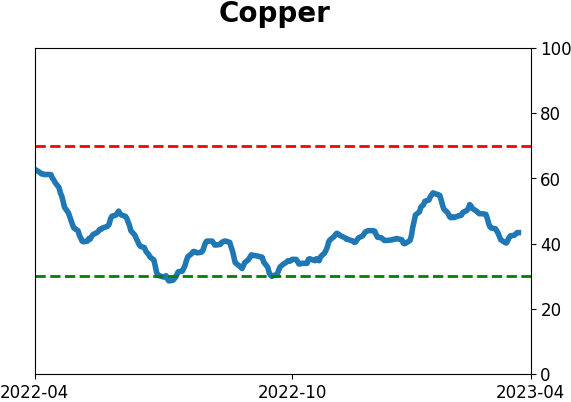
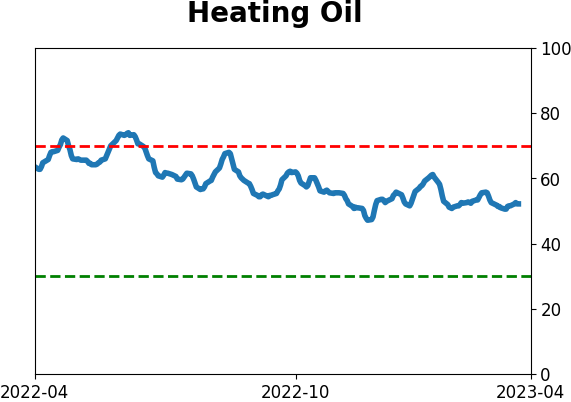
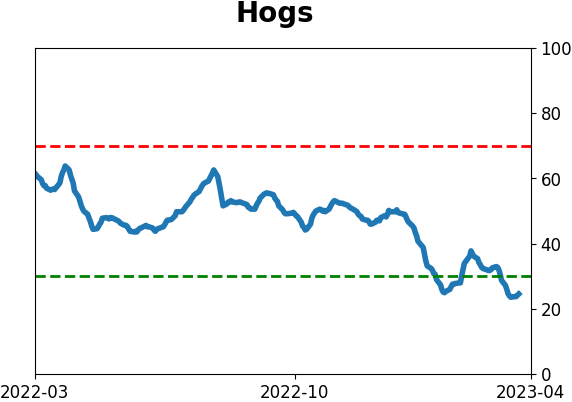
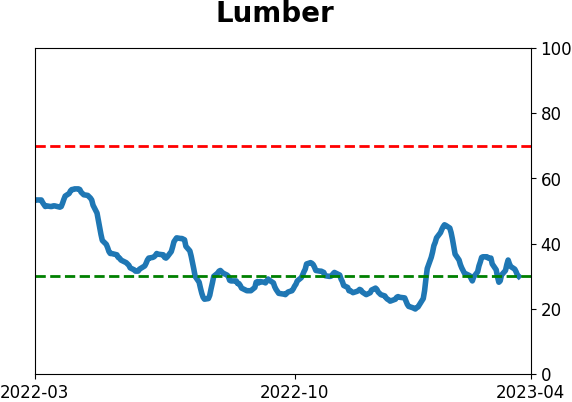
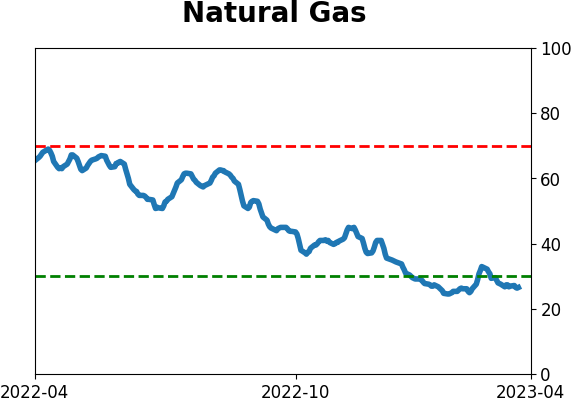
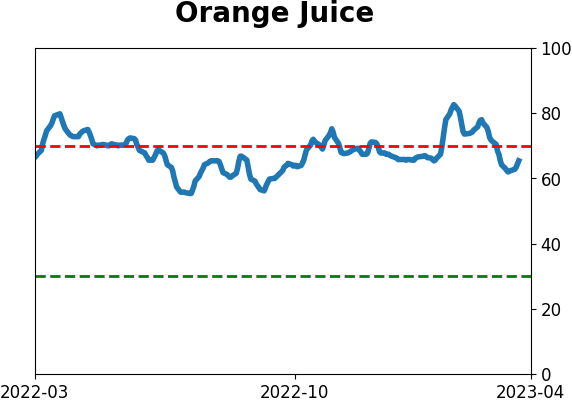
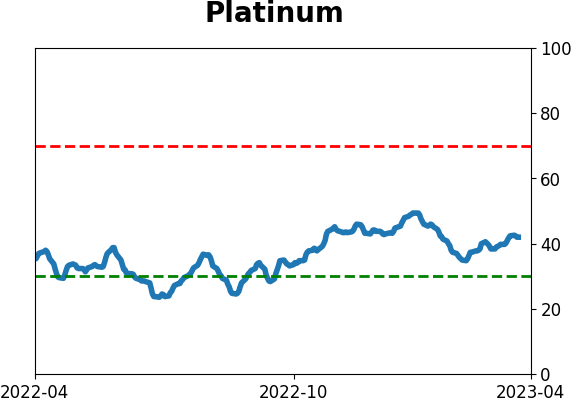
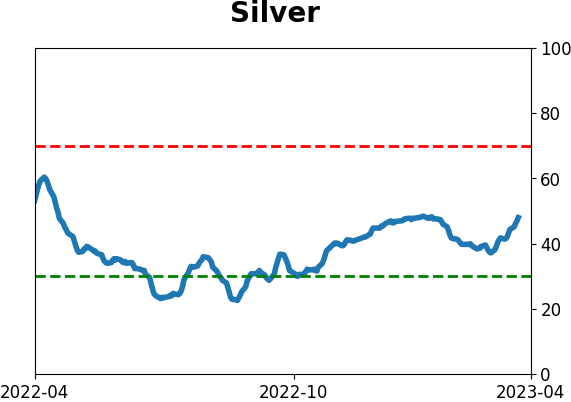
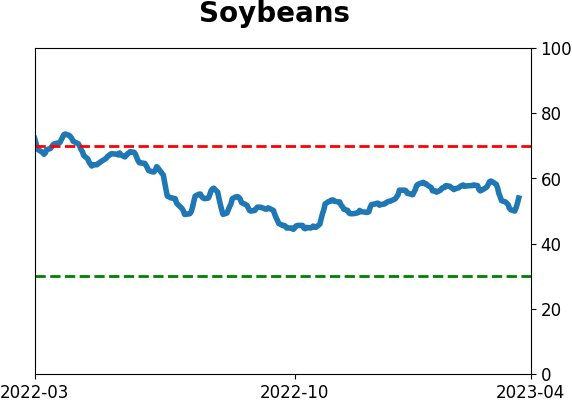
Commodity ETF's - 5-Day Moving Average
|
|