Headlines
|
|
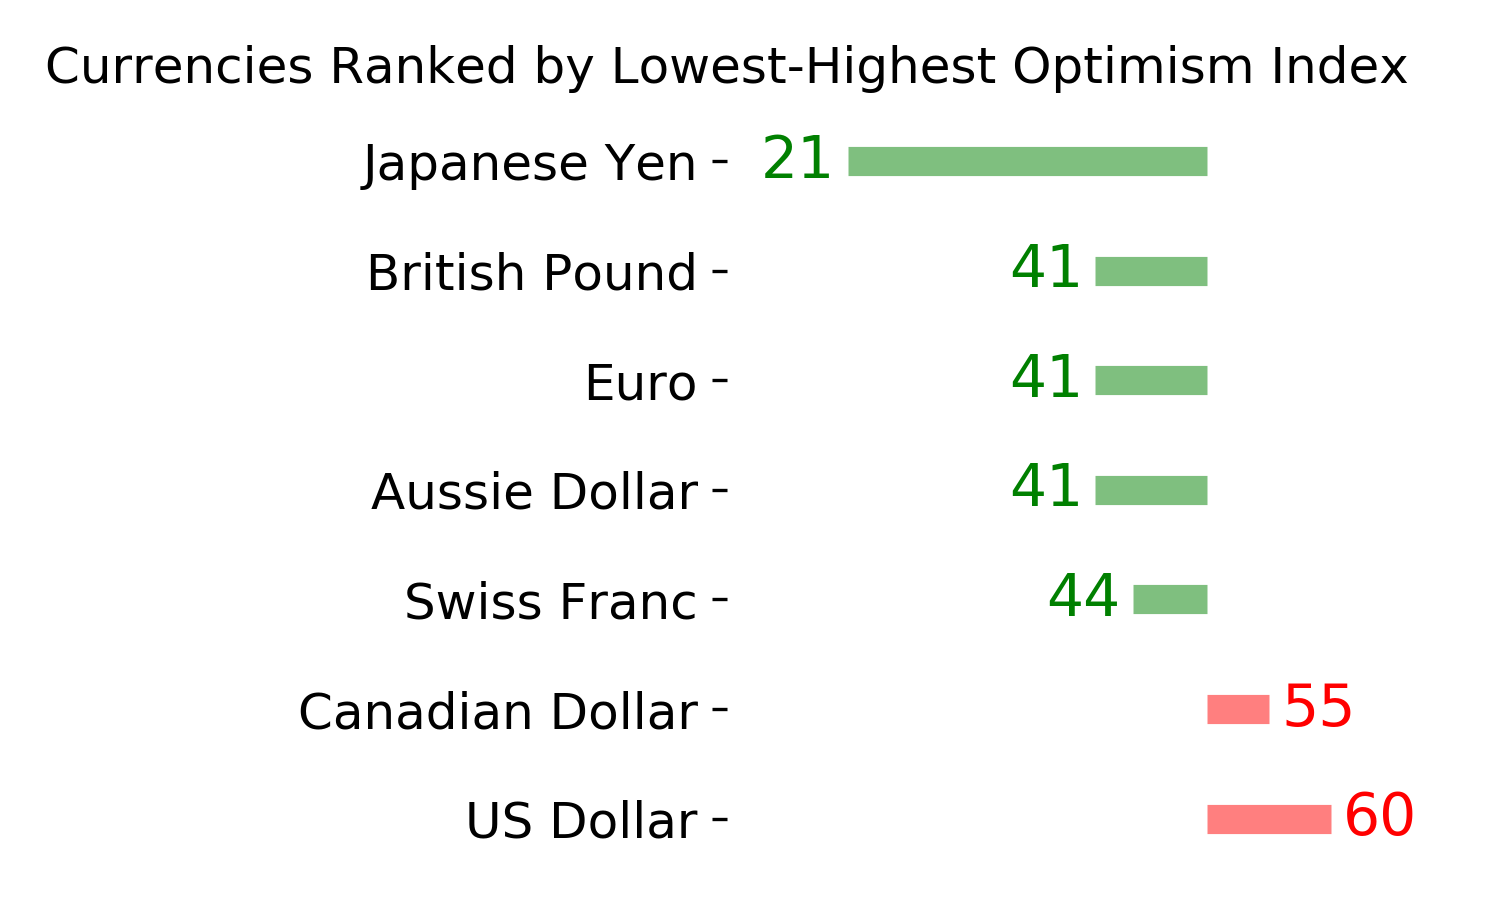
Yen has been hit, and sentiment is sour:
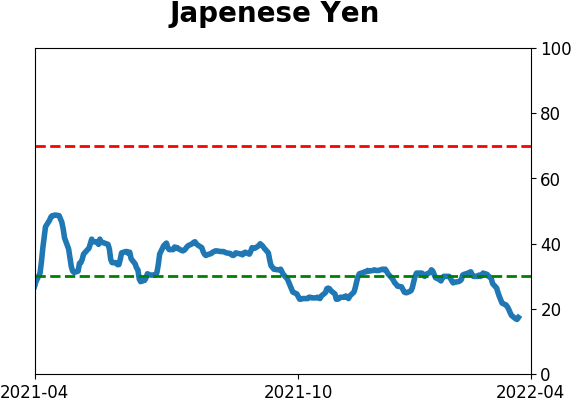
The Japanese yen suffered an almost unbroken string of down days over a multi-week period, one of its worst in history. That has triggered one of the lowest Optimism Index readings in 30 years, just as the currency is entering its most consistently positive time of the year.
|
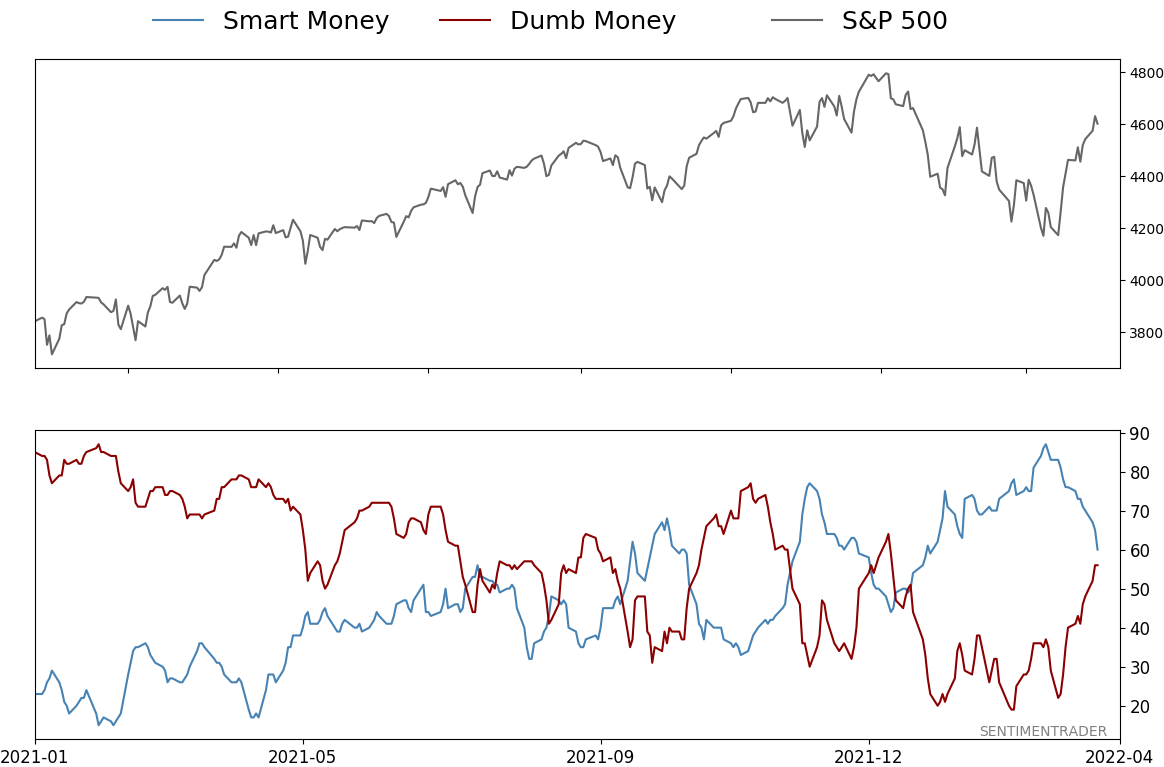
Smart / Dumb Money Confidence
|
Smart Money Confidence: 60%
Dumb Money Confidence: 56%
|
|
Risk Levels
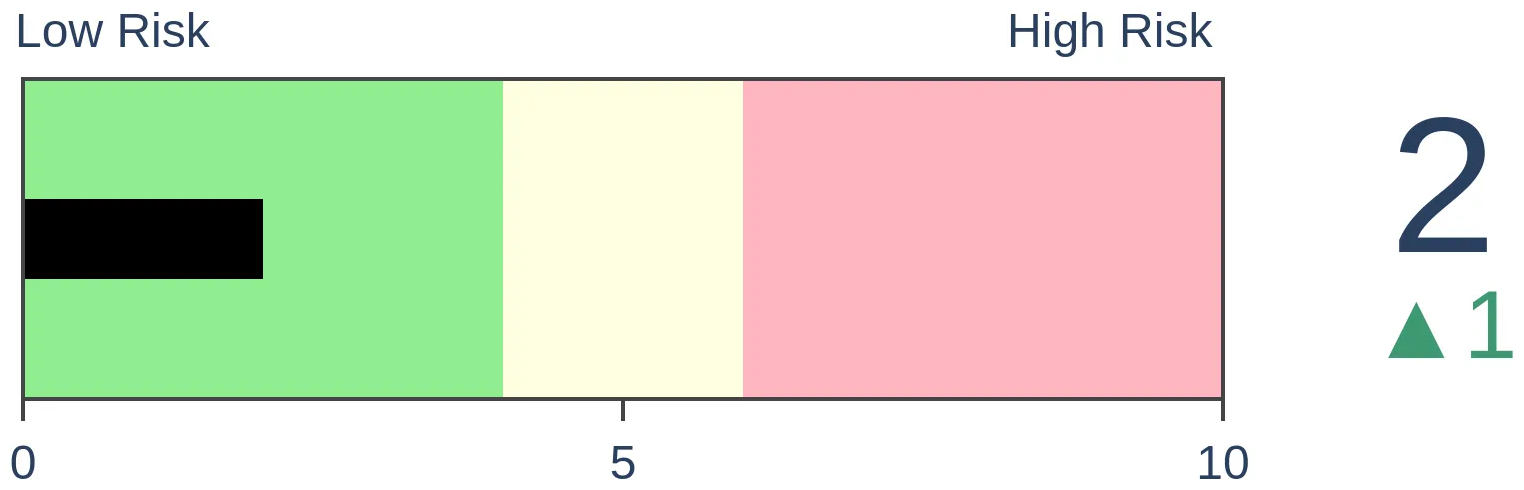
Stocks Short-Term
|
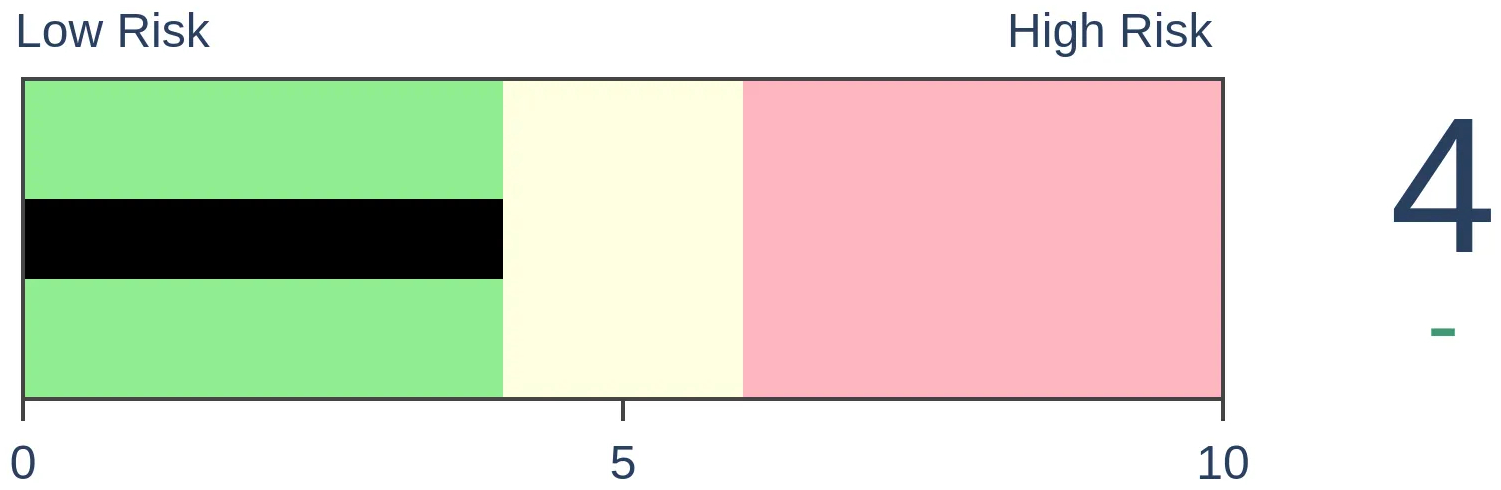
Stocks Medium-Term
|
|
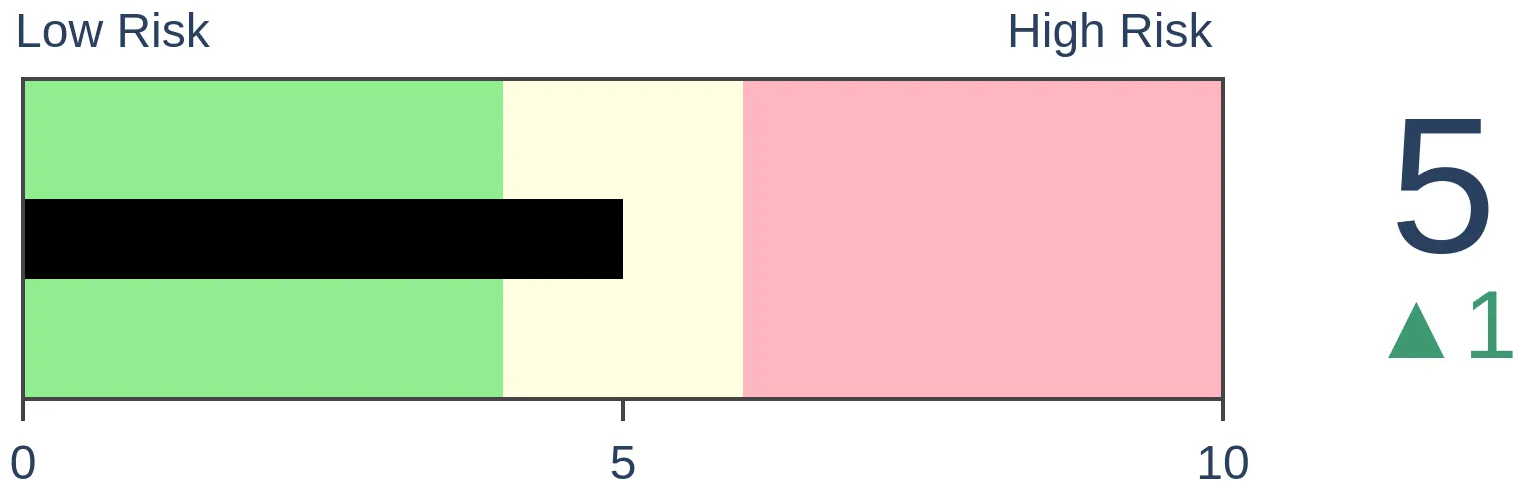
Bonds
|
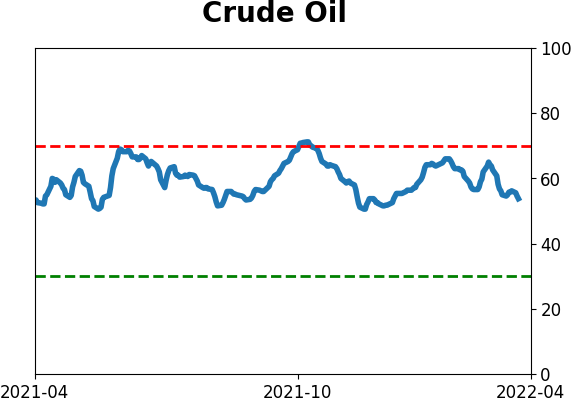
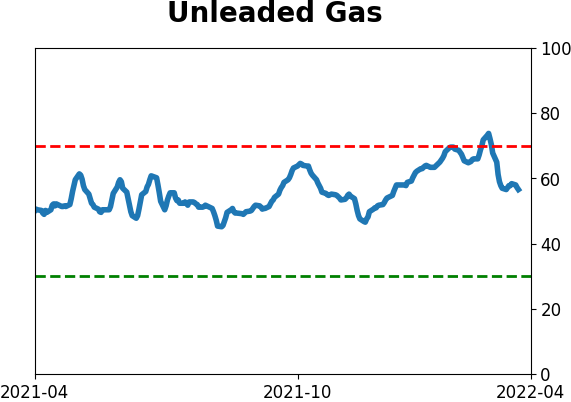
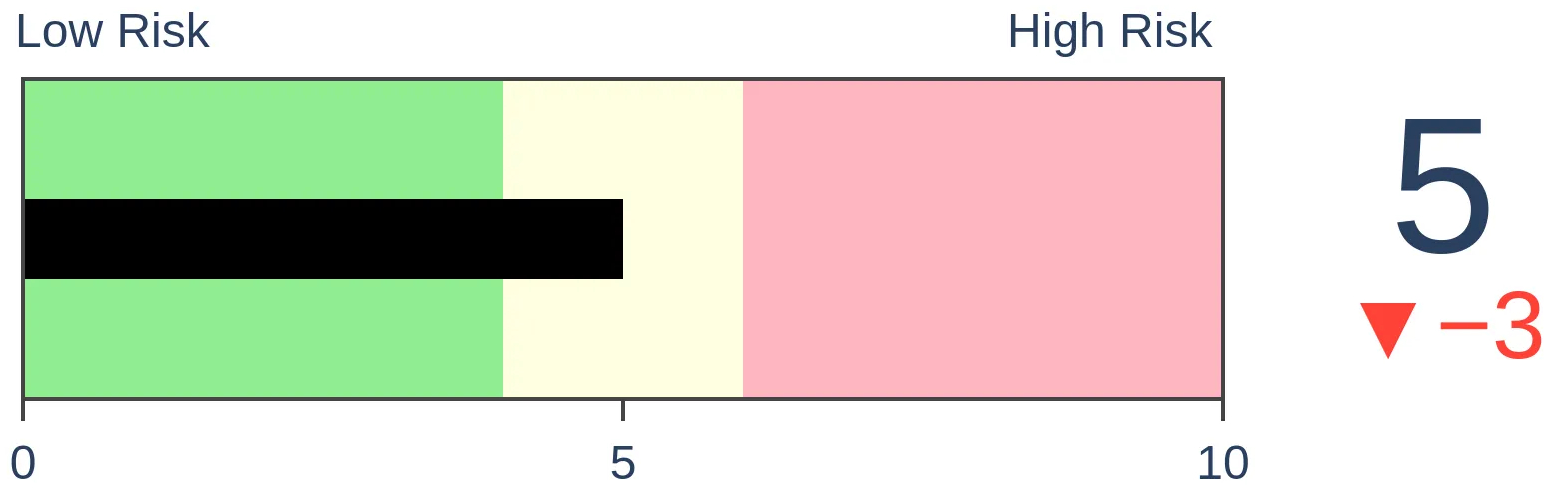
Crude Oil
|
|
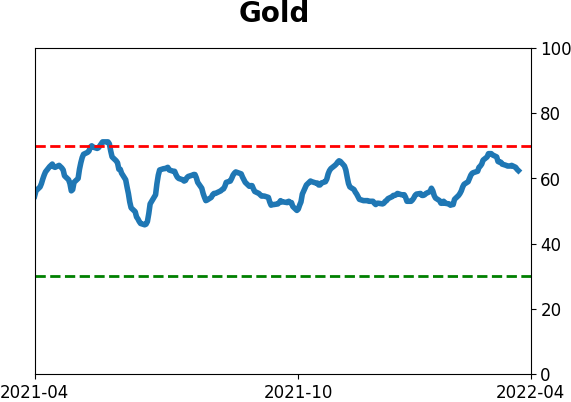
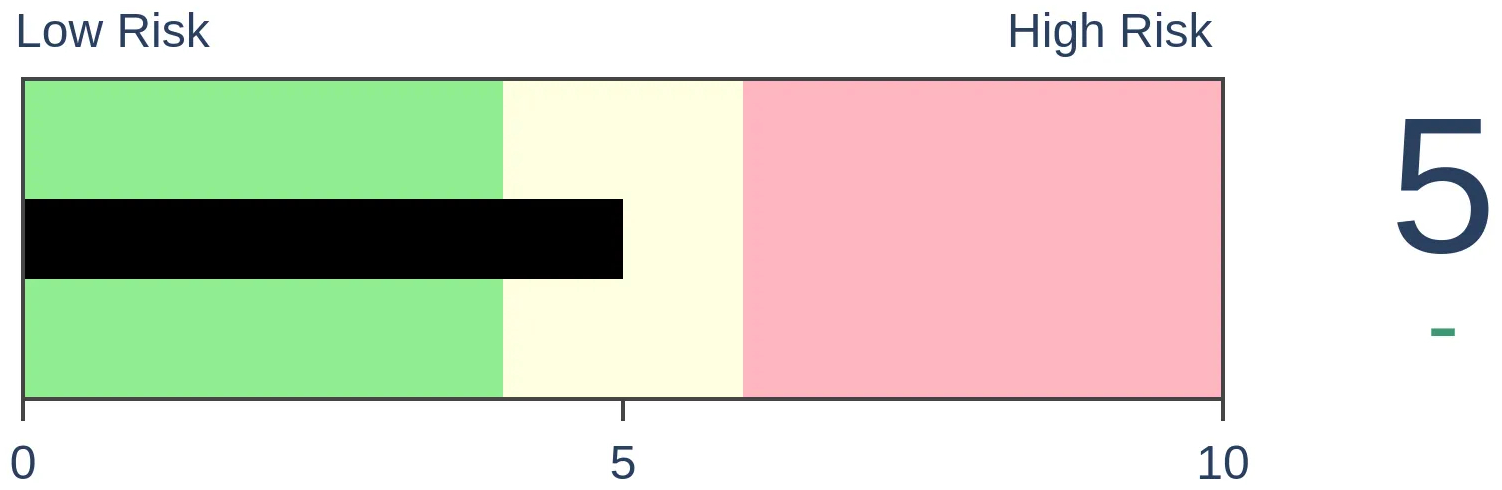
Gold
|
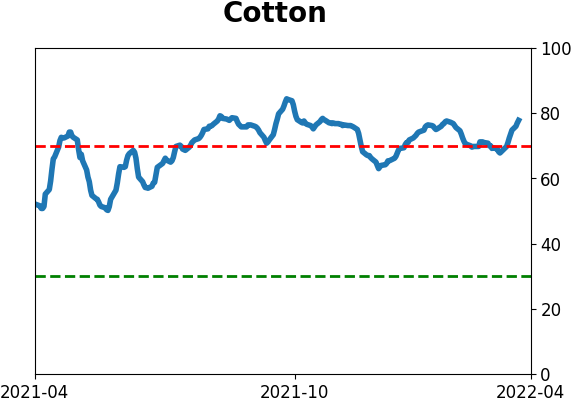
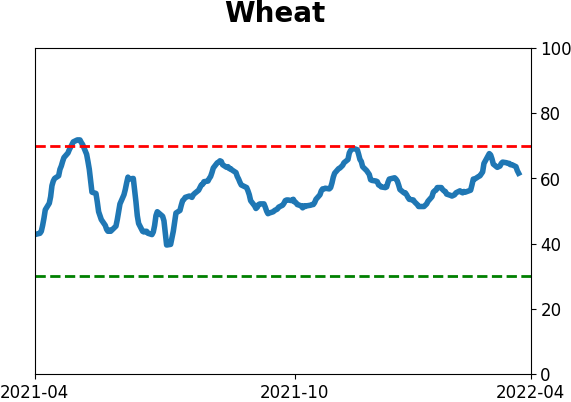
Agriculture

|
|
Research
By Jason Goepfert
BOTTOM LINE
The Japanese yen suffered an almost unbroken string of down days over a multi-week period, one of its worst in history. That has triggered one of the lowest Optimism Index readings in 30 years, just as the currency is entering its most consistently positive time of the year.
FORECAST / TIMEFRAME
None
|
Key points:
- The Japanese yen has suffered a historic bout of selling pressure
- That has triggered some of the lowest levels of optimism in 30 years
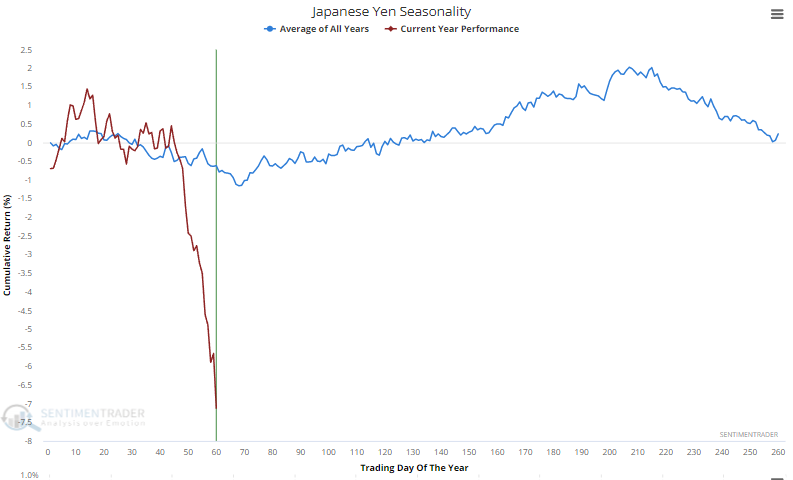
- The currency is about to enter its most seasonally favorable time of the year
Persistent selling has weighed on sentiment
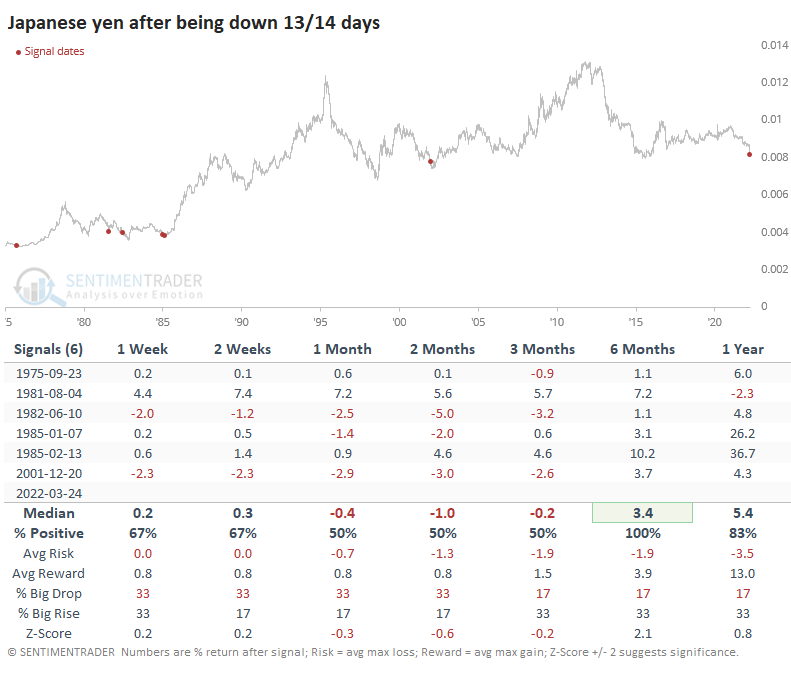
The yen just can't catch a break. Heading into the end of last week, it sunk versus the U.S. dollar on 13 out of 14 sessions. That kind of losing streak has rarely been matched.
The others generally occurred around significant lows but not imminent ones. The yen bounced around for the next 2-3 months but 6 months later was higher each time. Granted, the sample size is tiny.
The losses have clearly weighed on sentiment. The Optimism Index for the yen has dropped to the lowest level in nearly a decade.
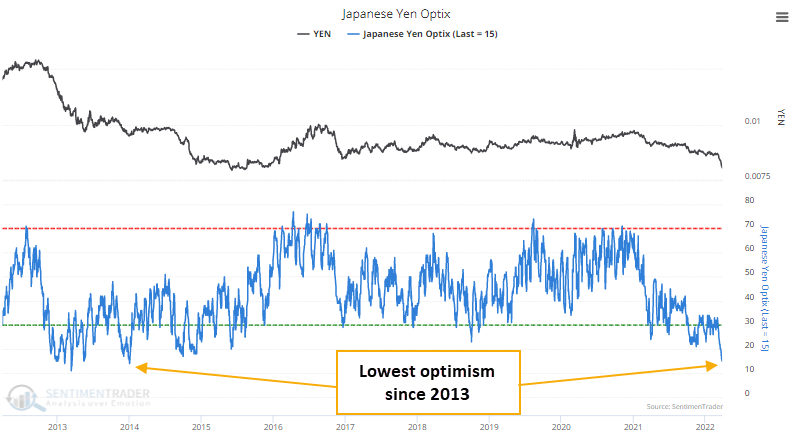
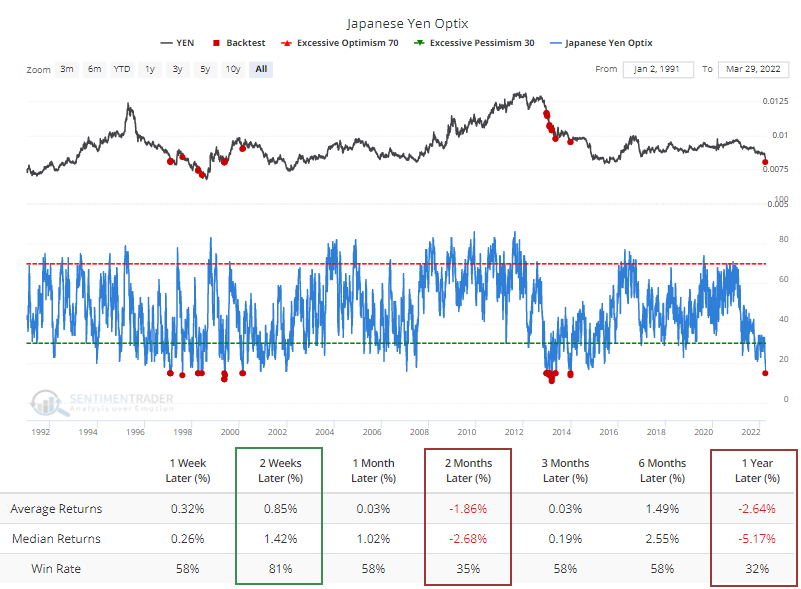
The Backtest Engine shows that a reading of 15 or below leads to quick snapbacks, but most were unsustainable. Only structural bear markets have generated this kind of despair. During structural bull markets, the Optimism Index didn't drop below 20, or if it did, it quickly brought in buyers.
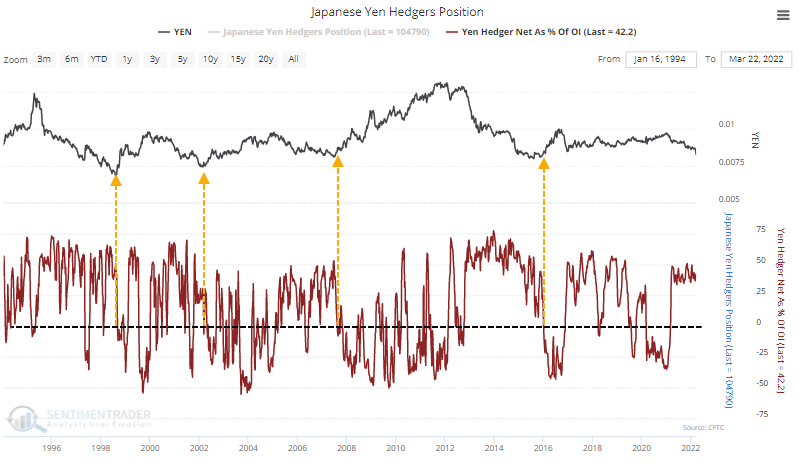
Part of the Optimism Index calculation includes hedgers' positions in the yen. Hedgers take the opposite side of speculators' positions, so a large net long among hedgers means that speculators are heavily short. Which they are; more than 40% of open interest. The problem is that major bottoms in the yen didn't hit bottom when hedgers were heavily long. It bottomed when hedgers started to reverse those positions and went net short, which they are still far from doing.
By definition, hedgers use the futures market only to hedge their day-to-day business operations, so if they go net short, it suggests they have more exposure to the underlying market.
The yen is about to exit its worst seasonal time of the year and enter the best. While much more exaggerated, it has roughly followed its typical pattern.
What the research tells us...
Currency markets tend to be the least reliable for medium-term mean-reversion tactics. The concepts of overbought/oversold or optimism/pessimism can work in very short time frames and very long ones. The multi-month time frames that are the sweet spot for extremes in most other markets aren't very effective in currencies. The yen is a perfect example. While some factors are lining up for a potential rally, it's hard to have a lot of confidence in it. After a historical bout of persistent selling, the currency is entering its best time of the year with extreme pessimism. In most markets, that would be good enough for a speculative bet at least, but risk is high.
Active Studies
| Time Frame | Bullish | Bearish | | Short-Term | 4 | 0 | | Medium-Term | 25 | 2 | | Long-Term | 16 | 5 |
|
Indicators at Extremes
Portfolio
| Position | Description | Weight % | Added / Reduced | Date | | Stocks | 21.6% RSP, 5.1% IEMG | 26.7 | Added 5.3% | 2022-03-18 | | Bonds | 32.7% BND, 7.1% SCHP | 40.1 | Added 8.3% | 2021-10-26 | | Commodities | GCC | 2.4 | Reduced 2.1%
| 2020-09-04 | | Precious Metals | GDX | 4.6 | Reduced 4.2% | 2021-05-19 | | Special Situations | 7.6% KWEB, 4.9% XBI, 3.7% XLE, 1.8% PSCE | 18.0 | Added 4.6% | 2022-02-24 | | Cash | | 7.9 | | |
|
Updates (Changes made today are underlined)
We had a volatile few weeks into mid-March, and it was enough to trigger a number of extremes. Most of the studies we've looked at have had a clear bullish edge over a multi-month time frame. I'd typically be more proactive instead of reactive with changes in positions, adding exposure into weakness instead of strength, but during an unhealthy environment like we're in, I tend to be more conservative. I did add some exposure to emerging markets, choosing a fund with the least exposure to China, since I already have exposure there with KWEB. It's still heavily weighted to that market. The only other times the MSCI Emerging Markets Index has had a weekly reversal like this week were October 2008, October 2011, and August 2015, all leading to long-term gains. RETURN YTD: +1.1% 2021: +8.7%, 2020: +8.1%, 2019: +12.6%, 2018: +0.6%, 2017: +3.8%, 2016: +17.1%, 2015: +9.2%, 2014: +14.5%, 2013: +2.2%, 2012: +10.8%, 2011: +16.5%, 2010: +15.3%, 2009: +23.9%, 2008: +16.2%, 2007: +7.8%
|
|
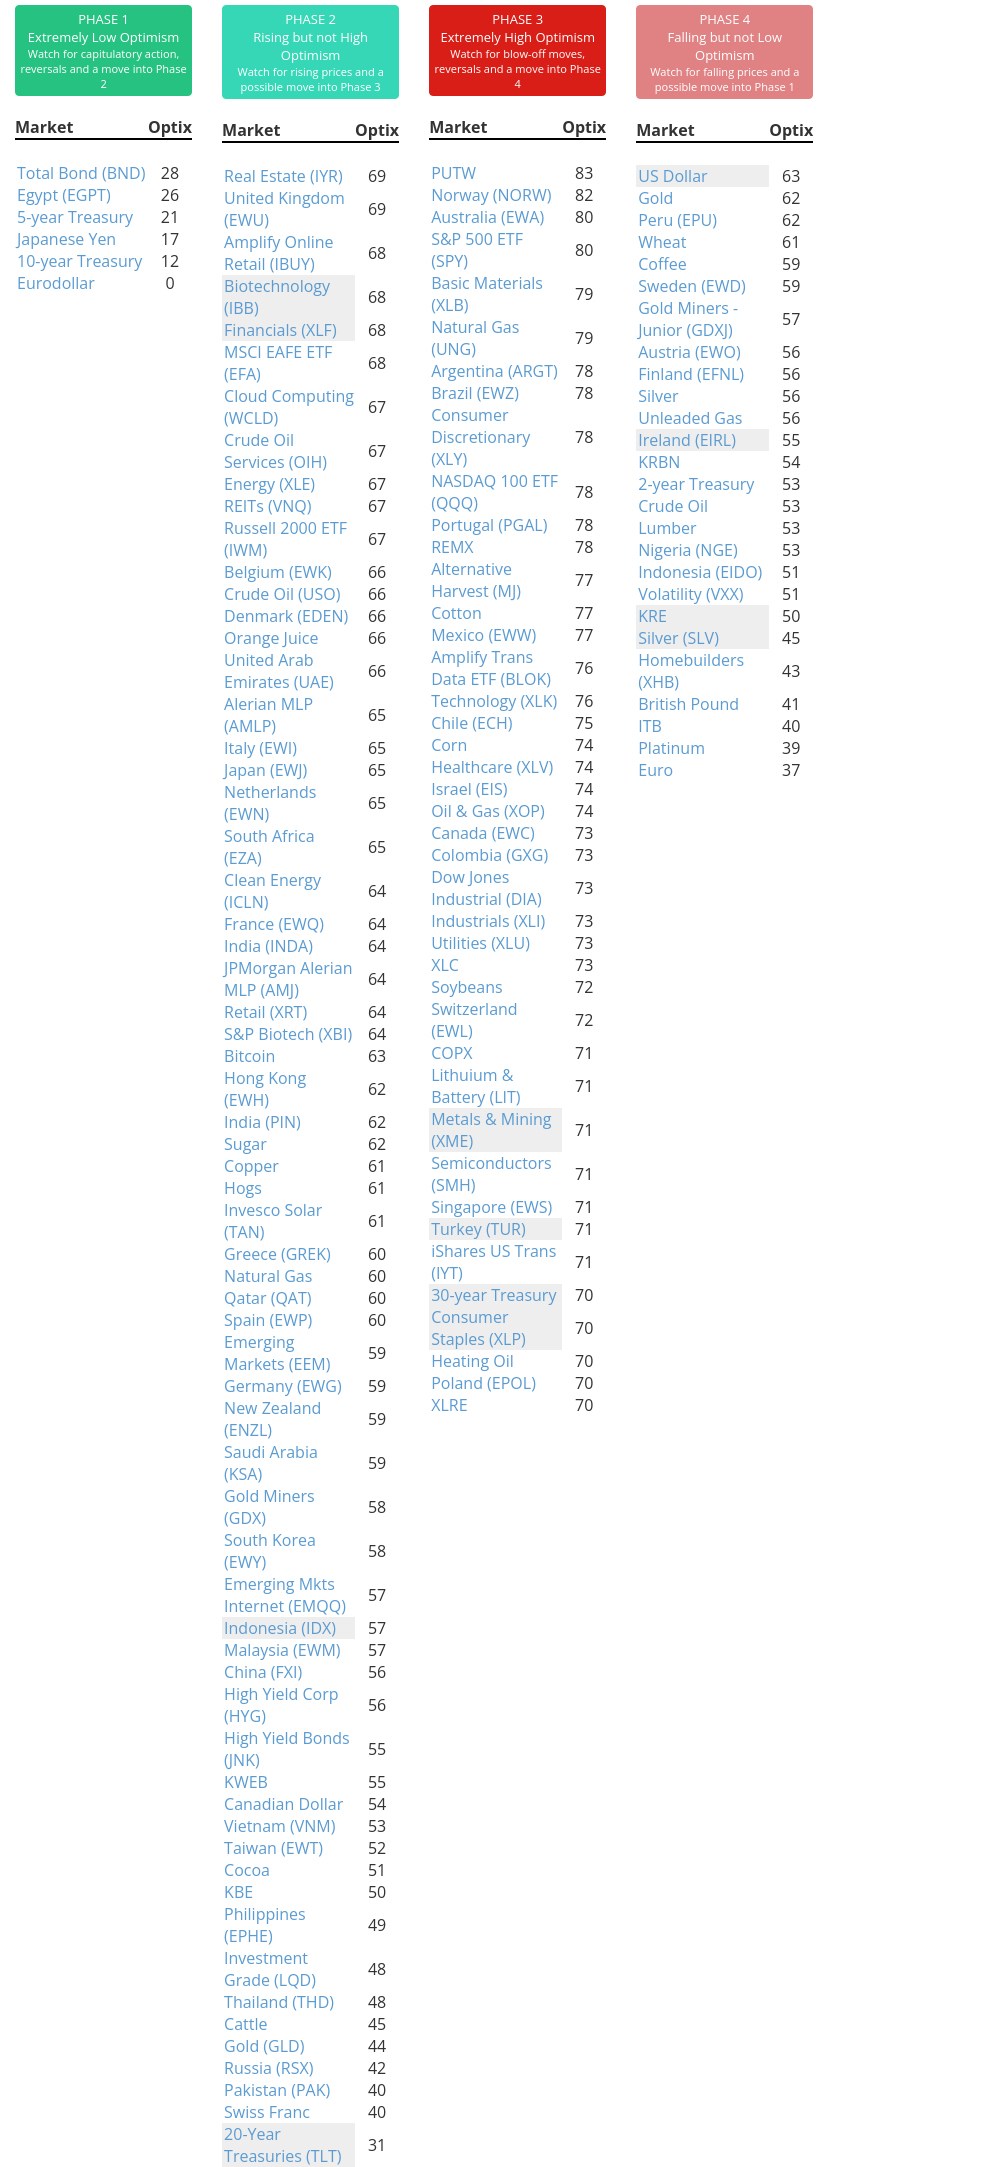
Phase Table
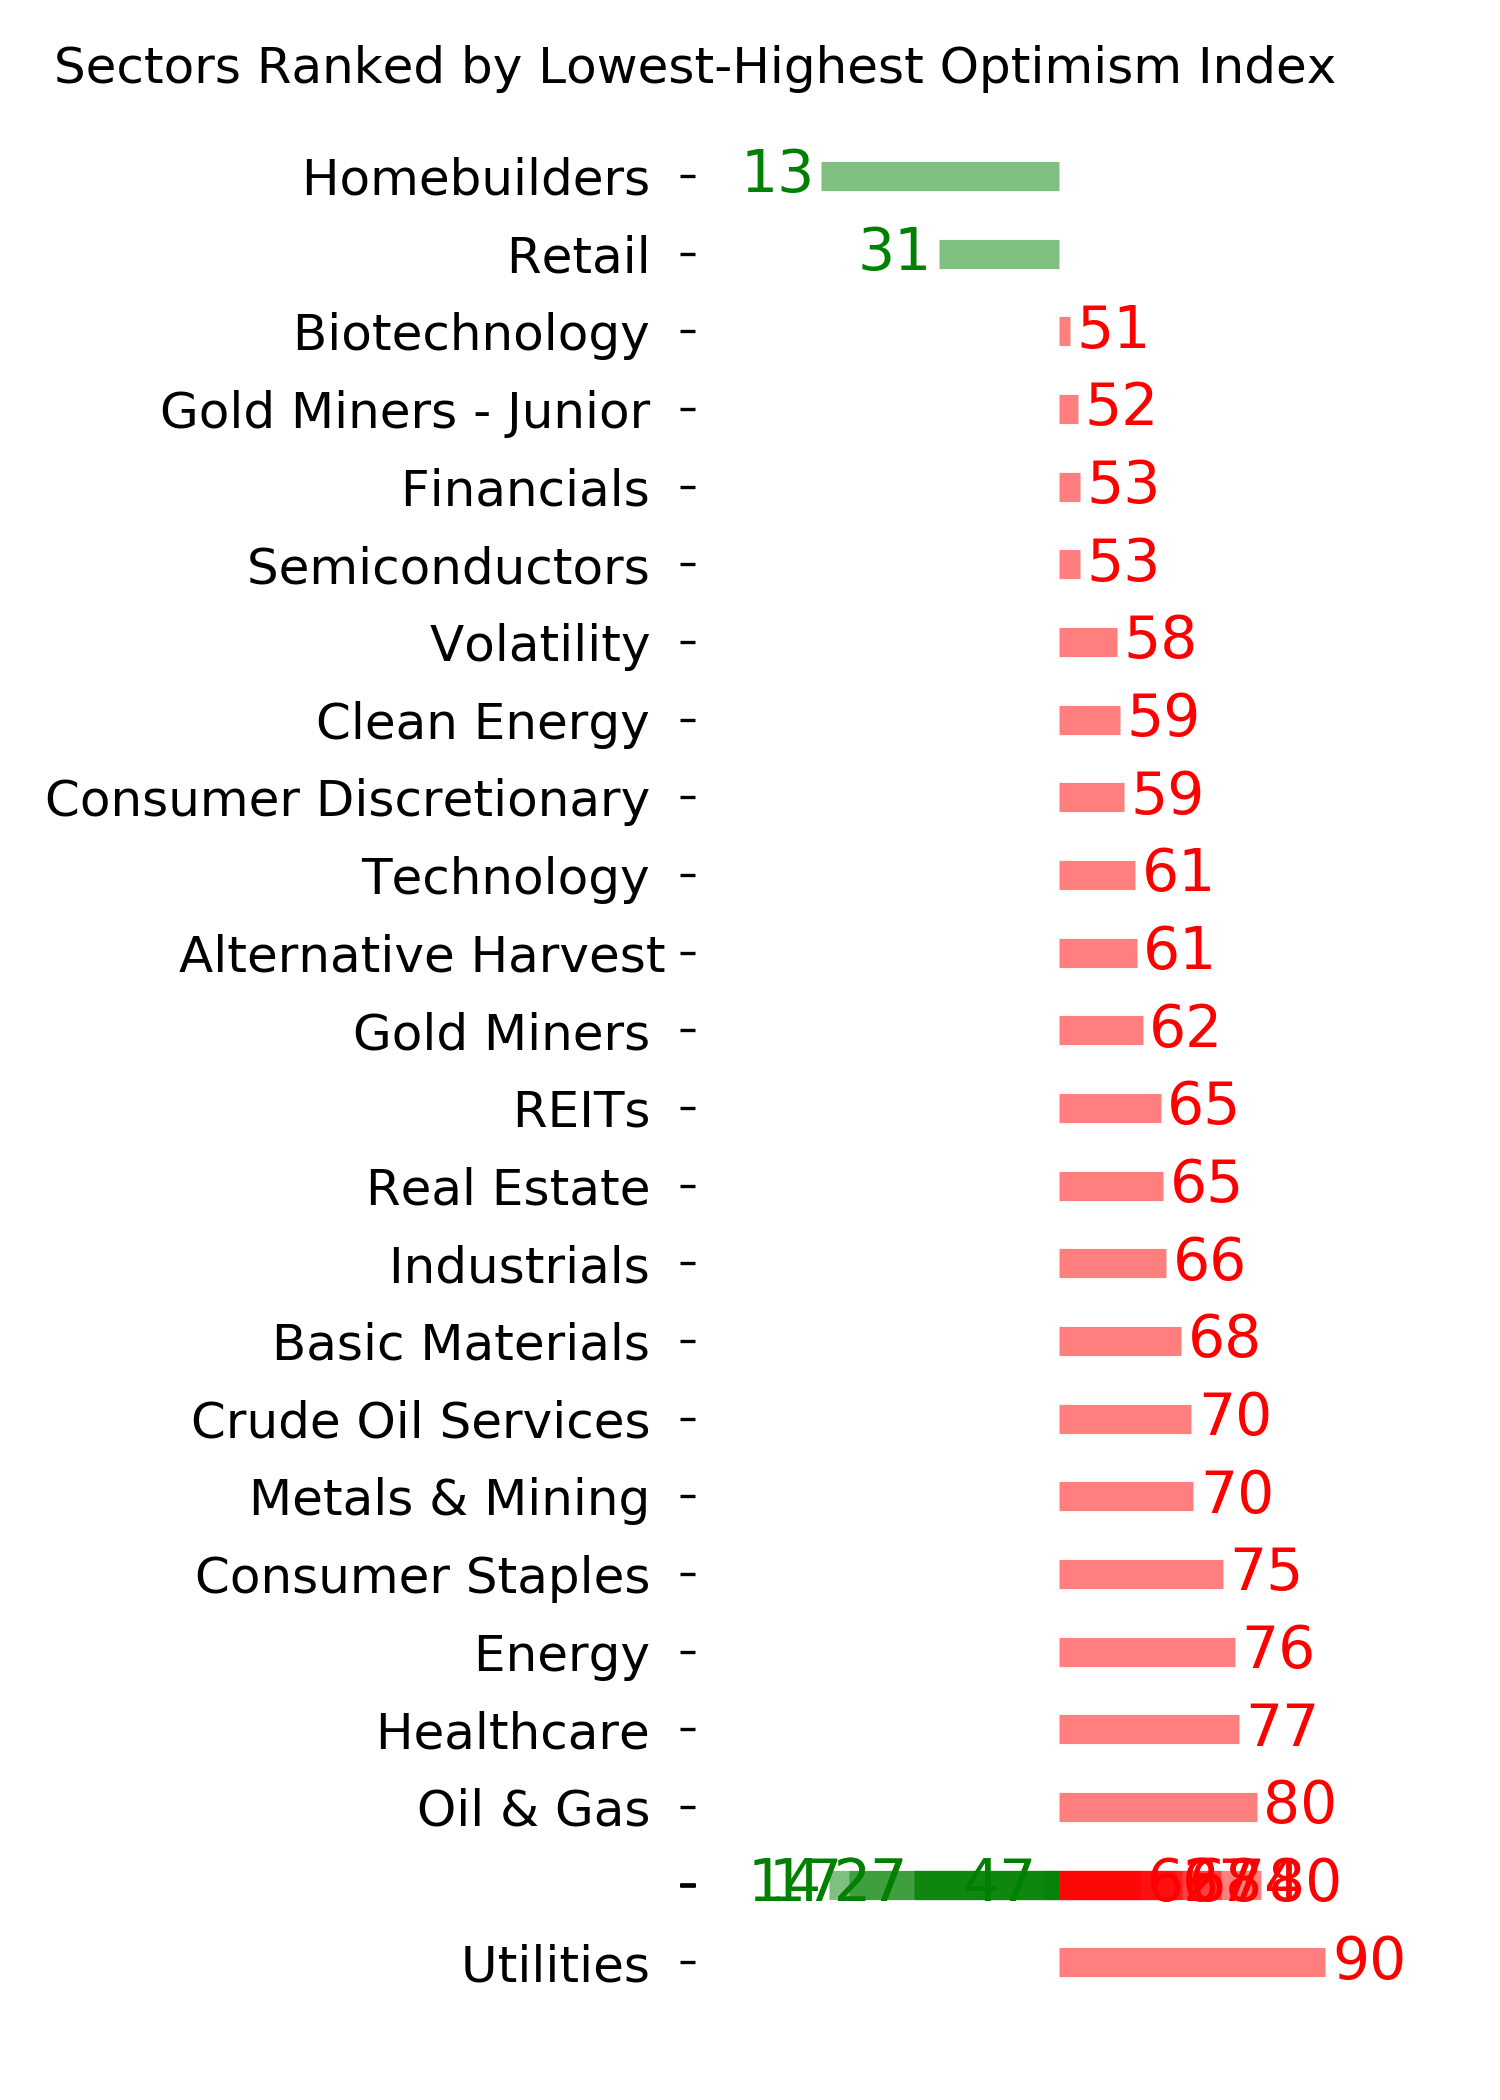
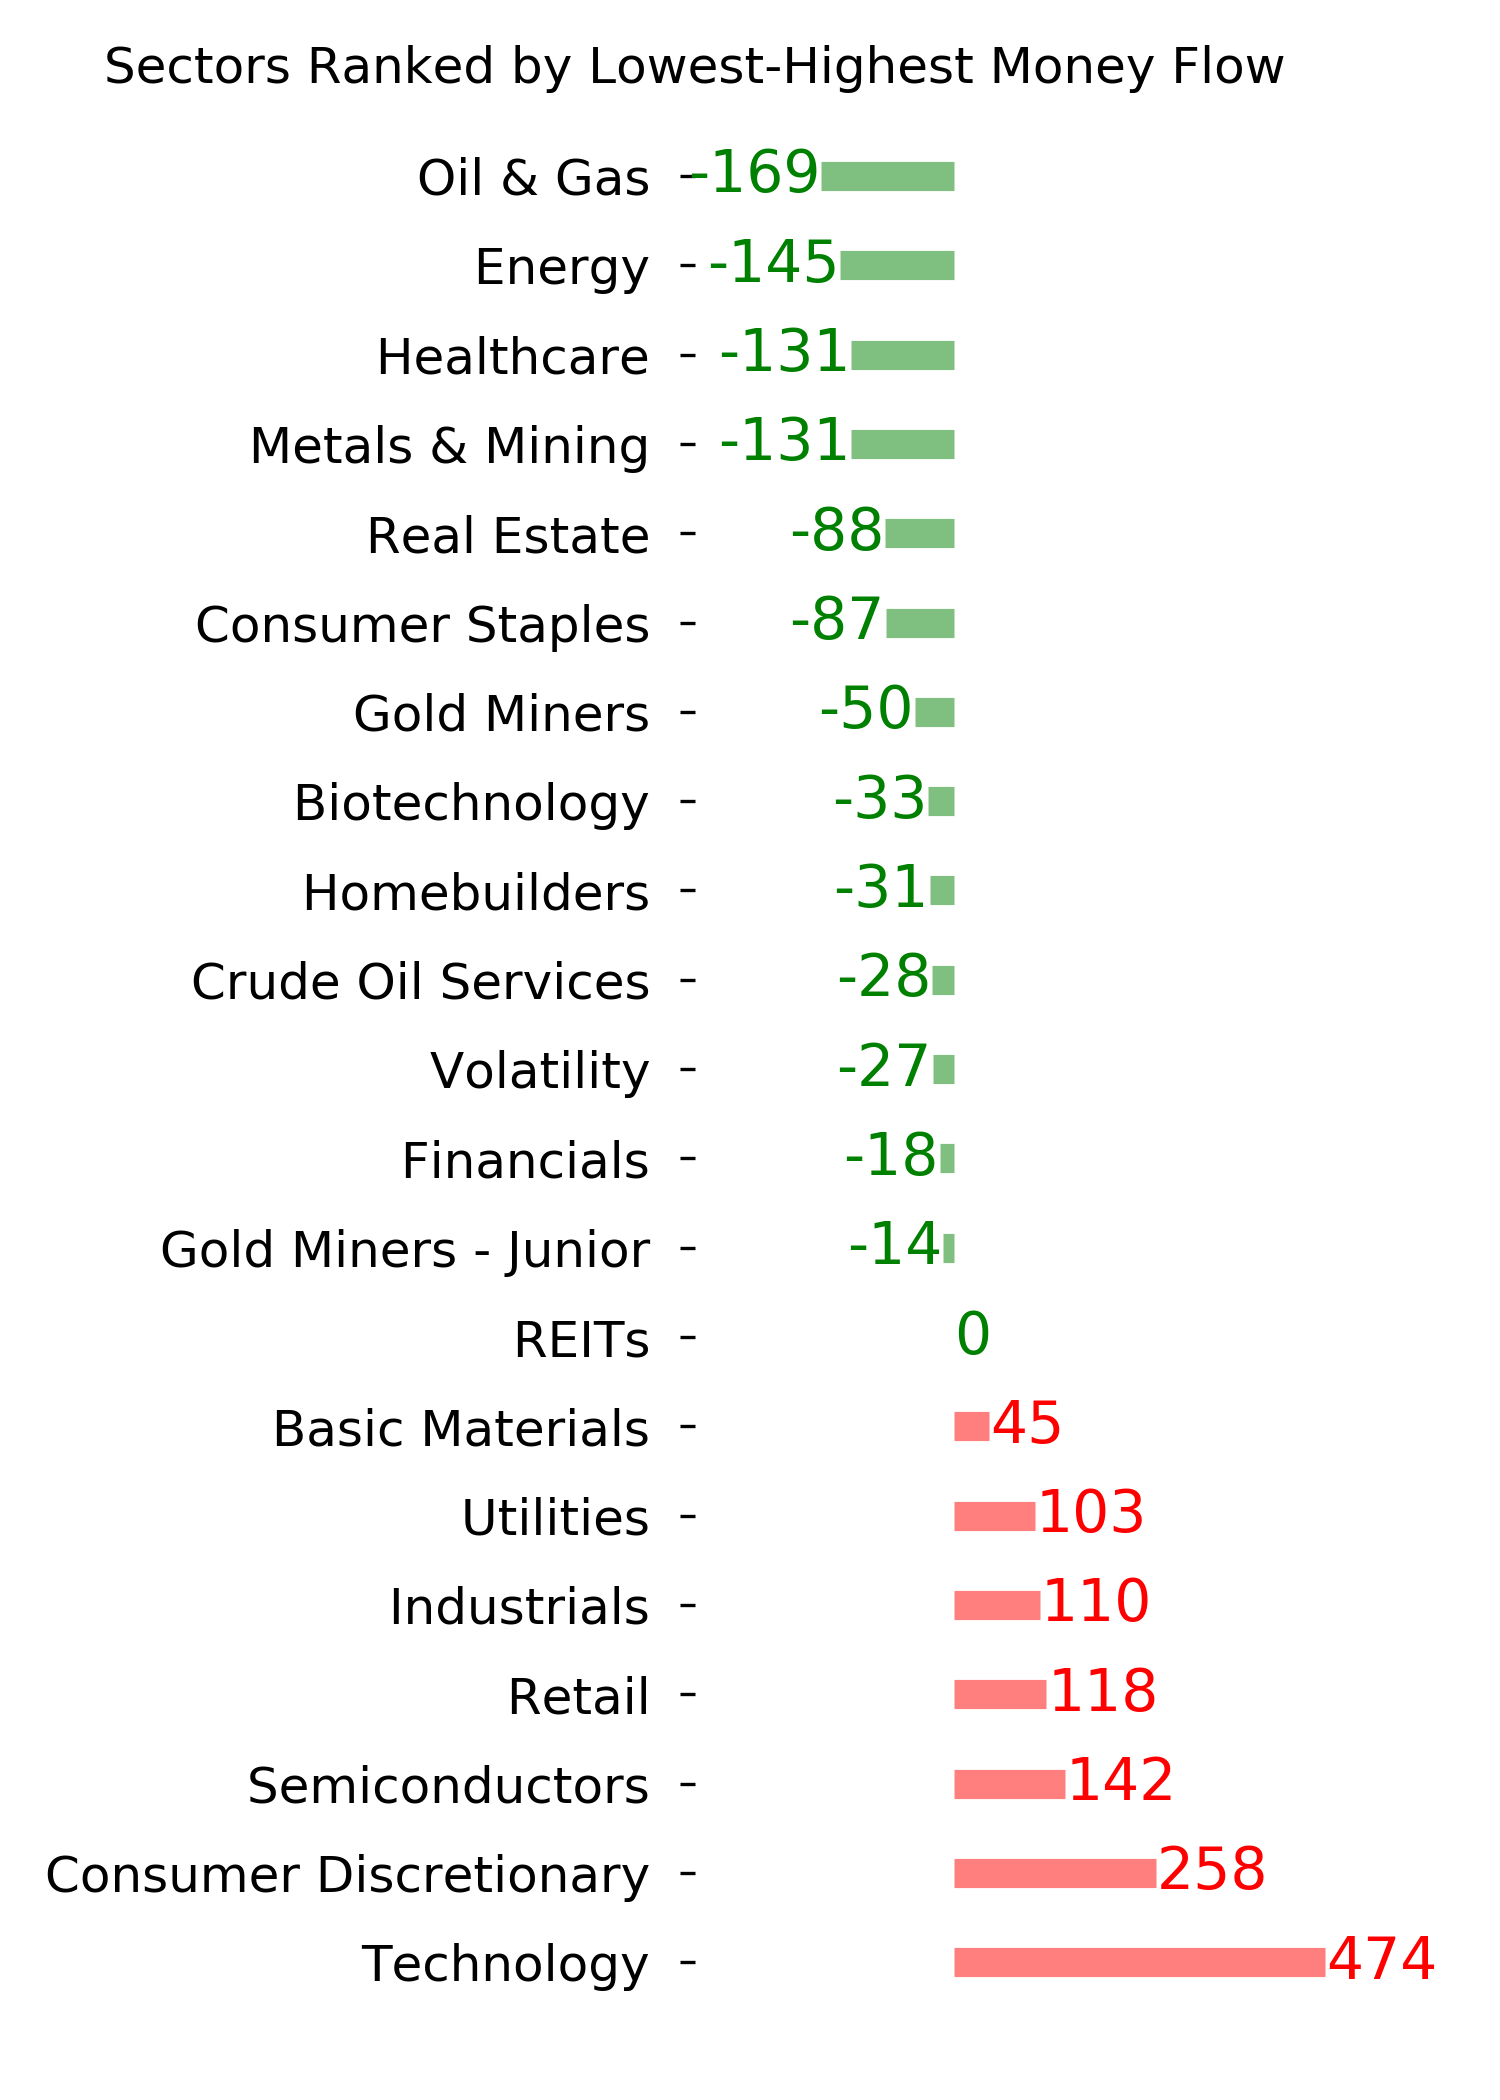
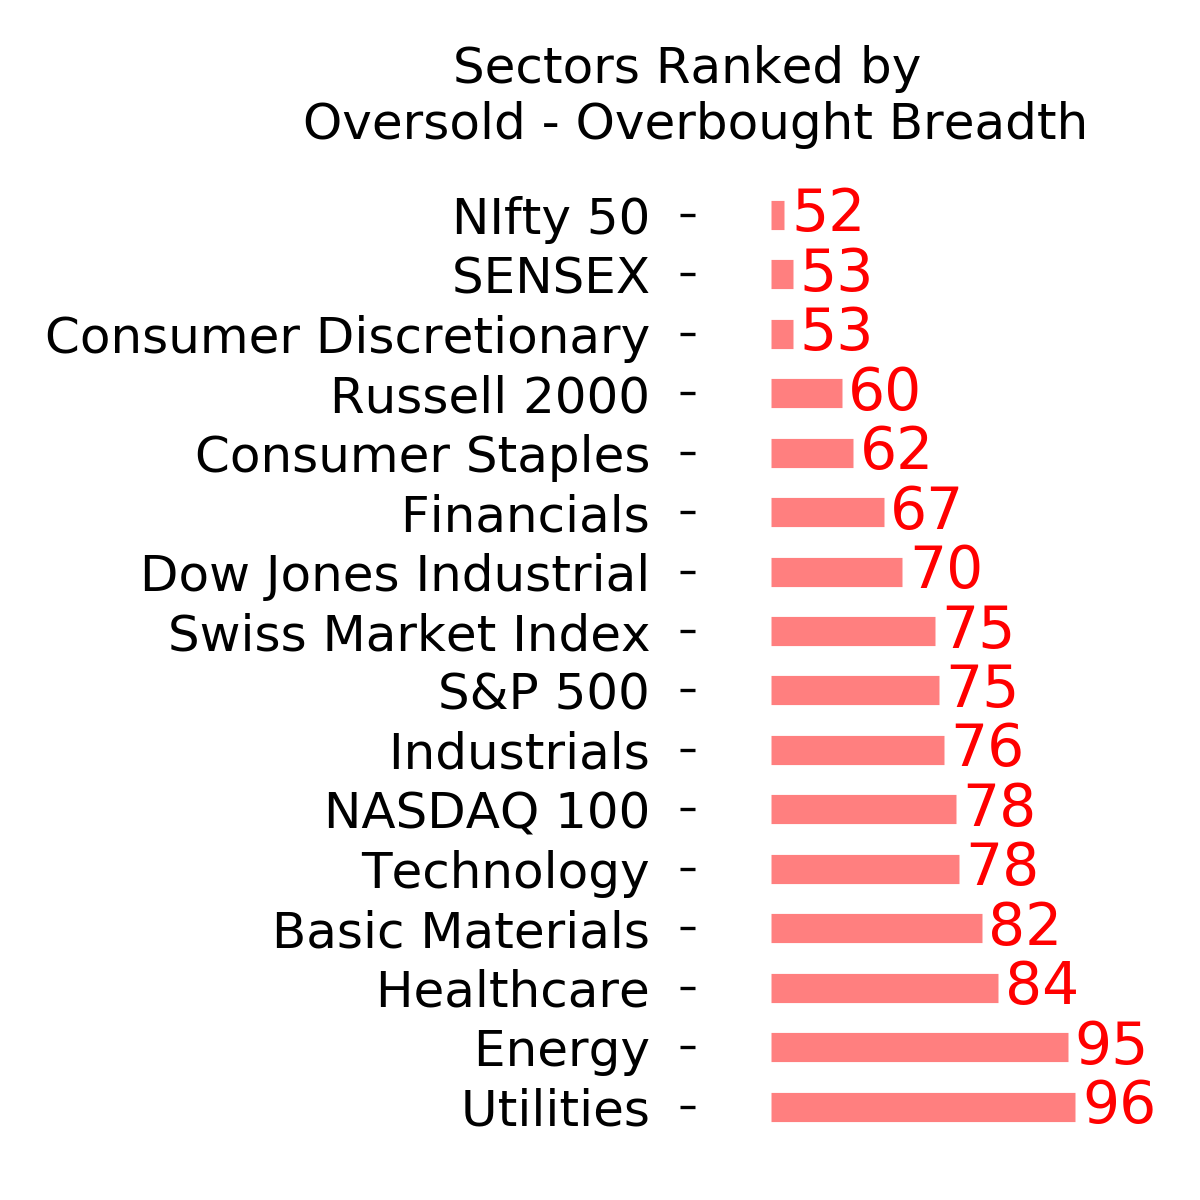
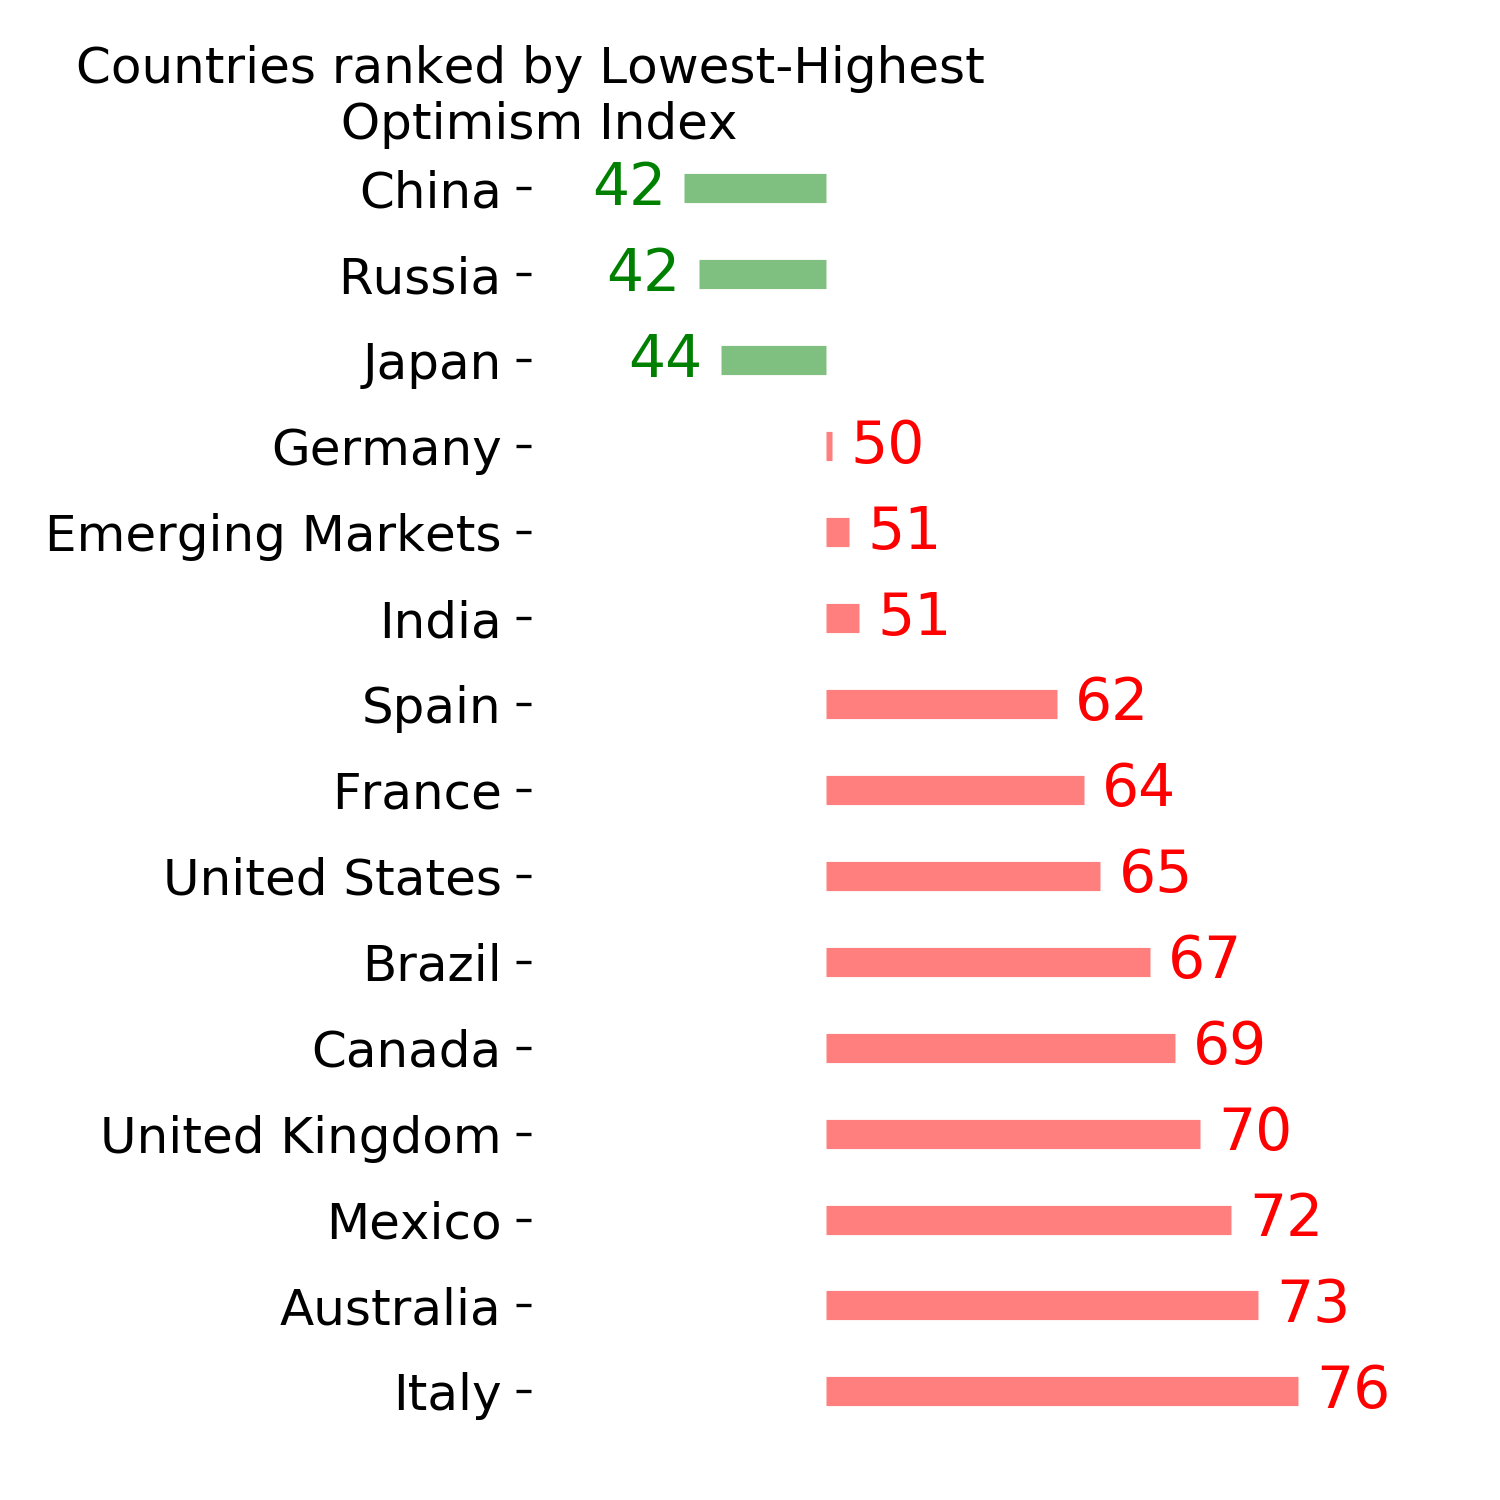
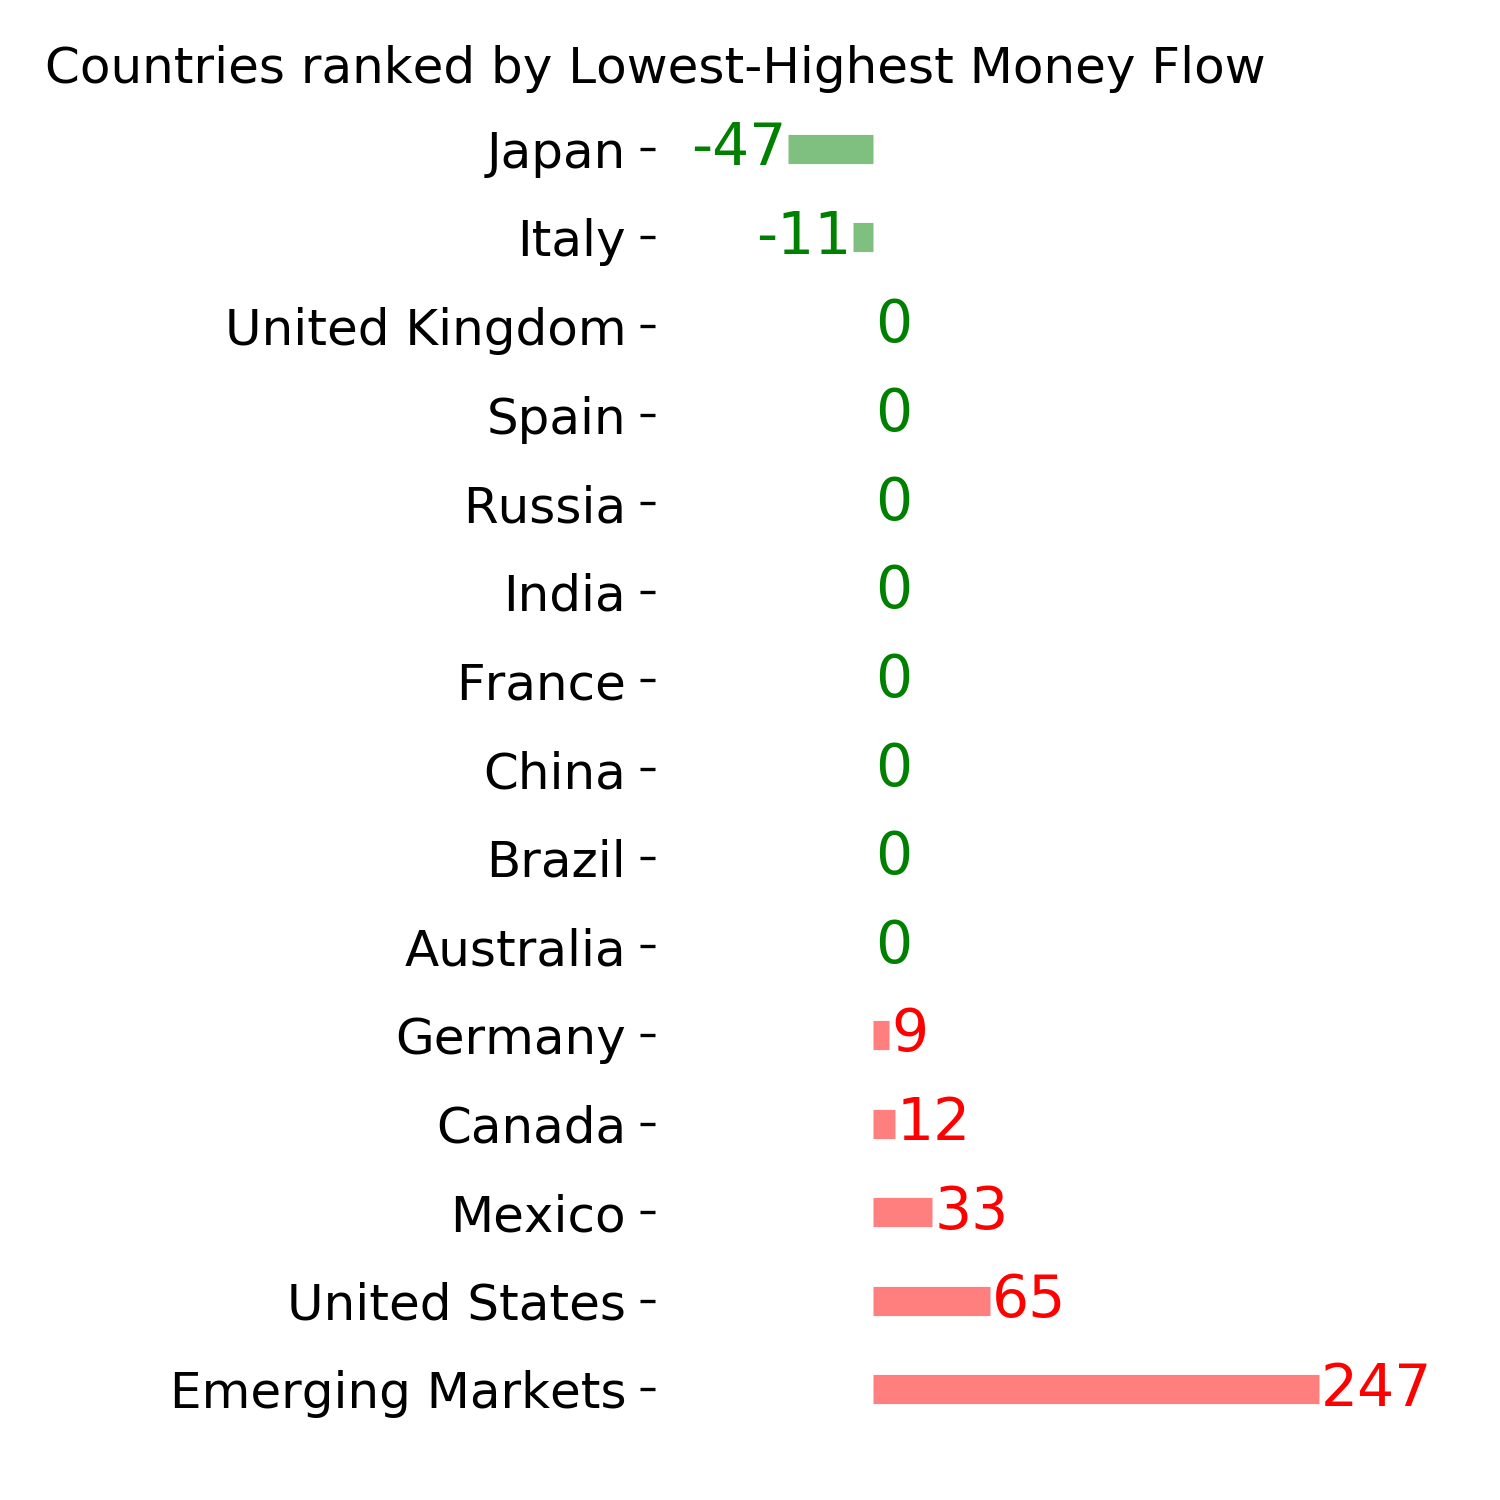
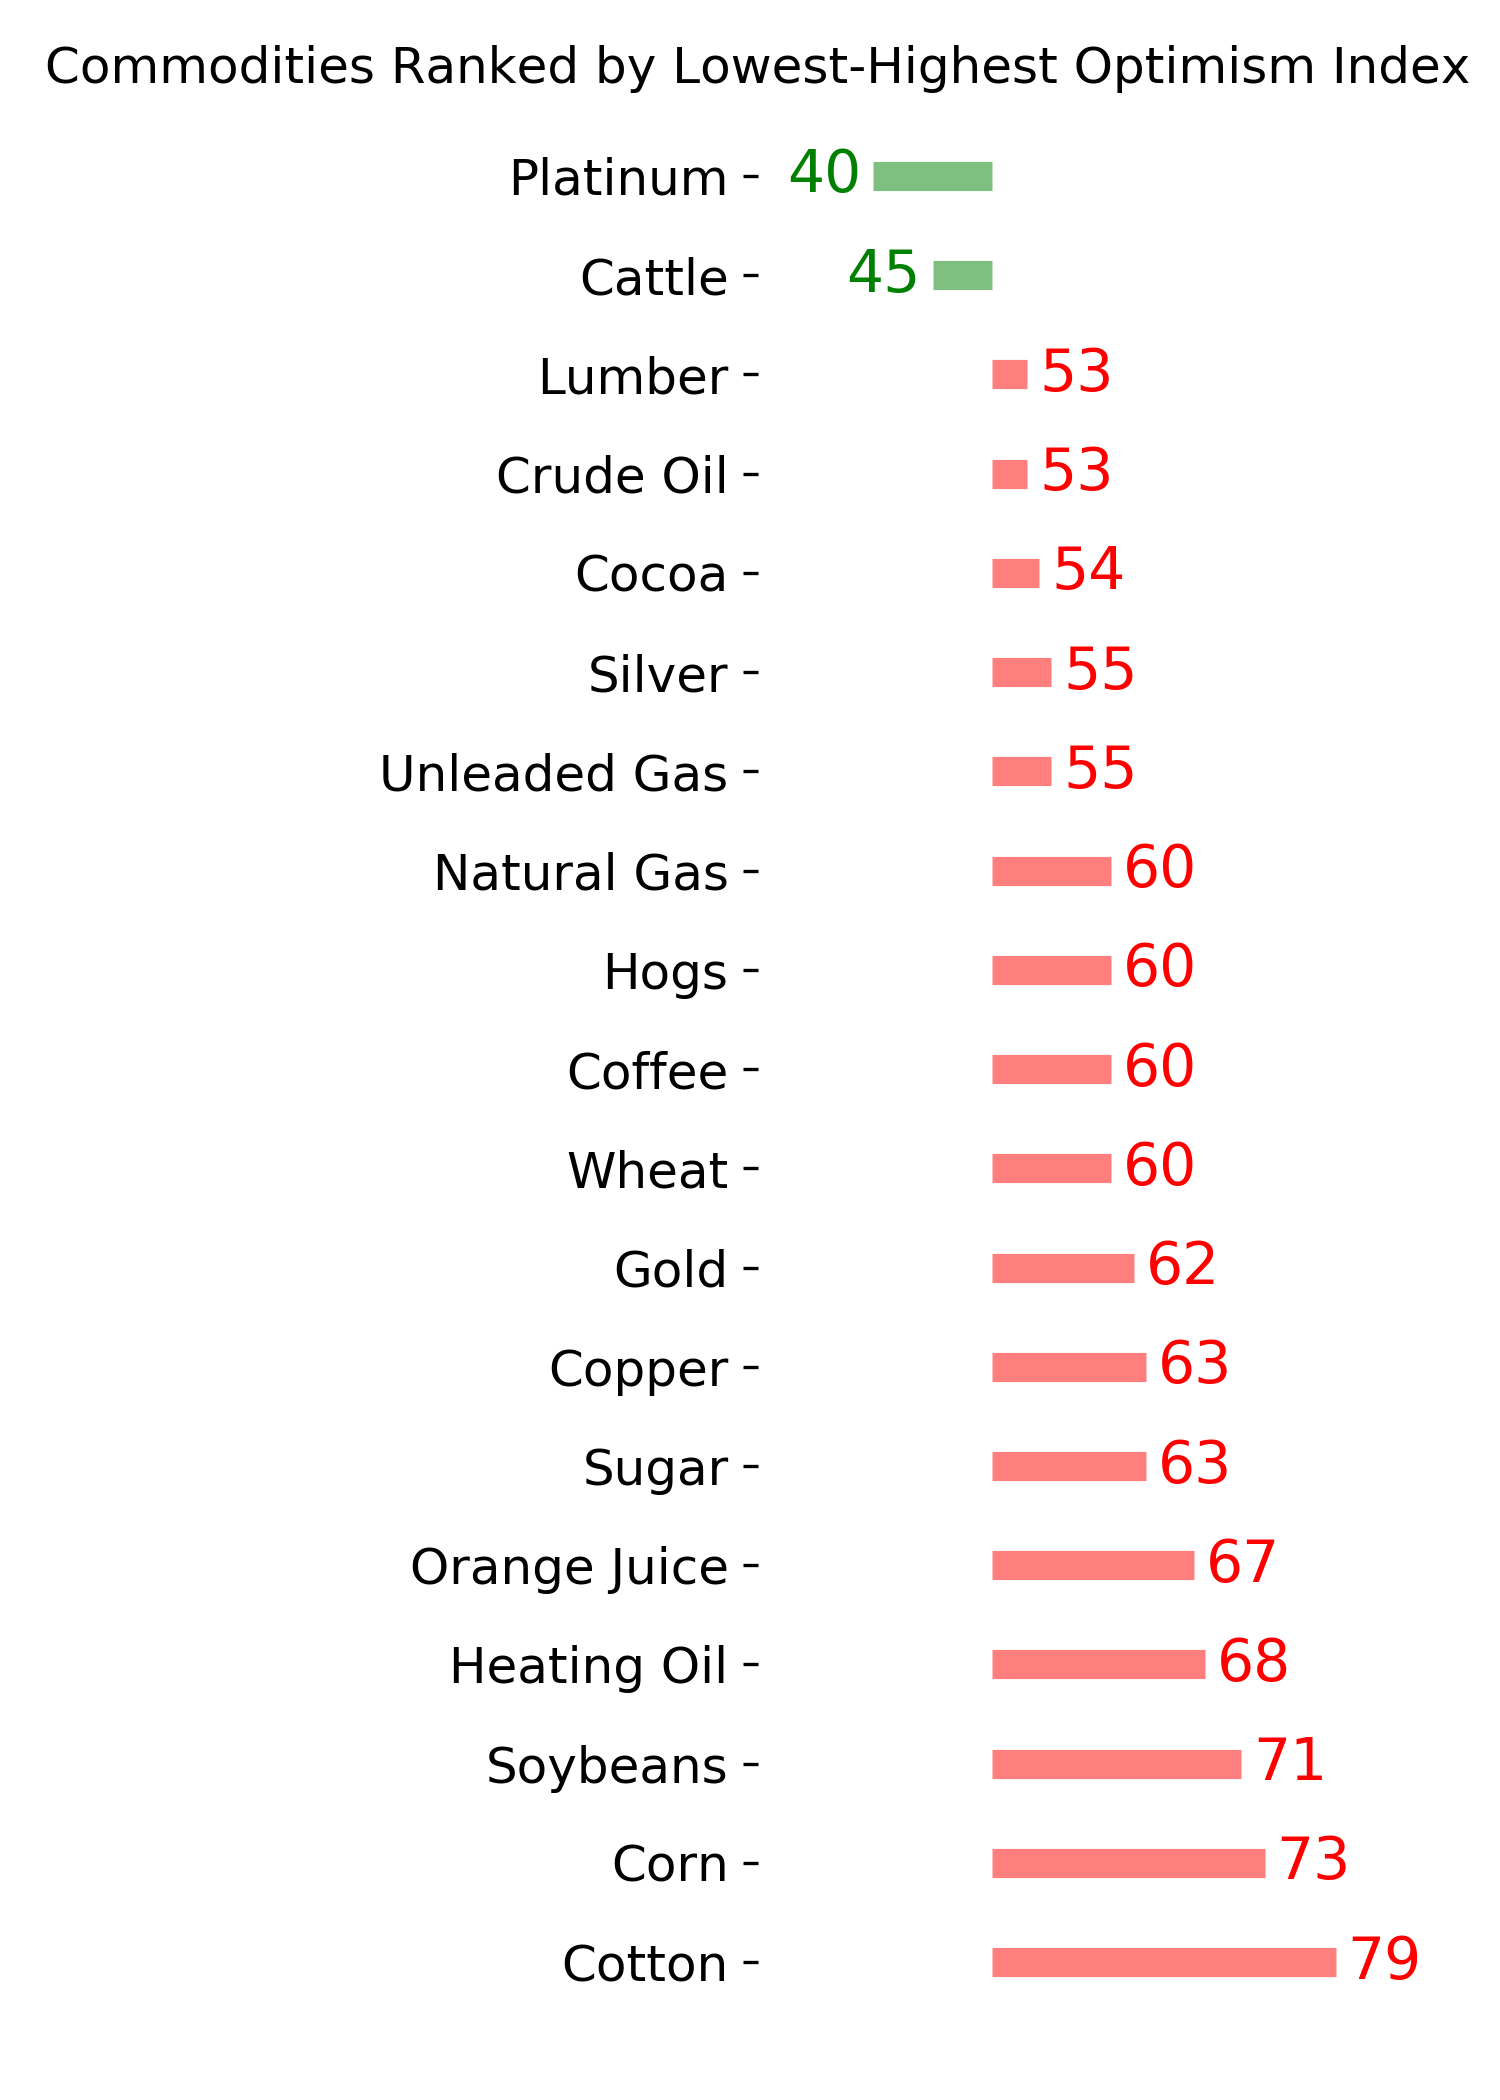
Ranks
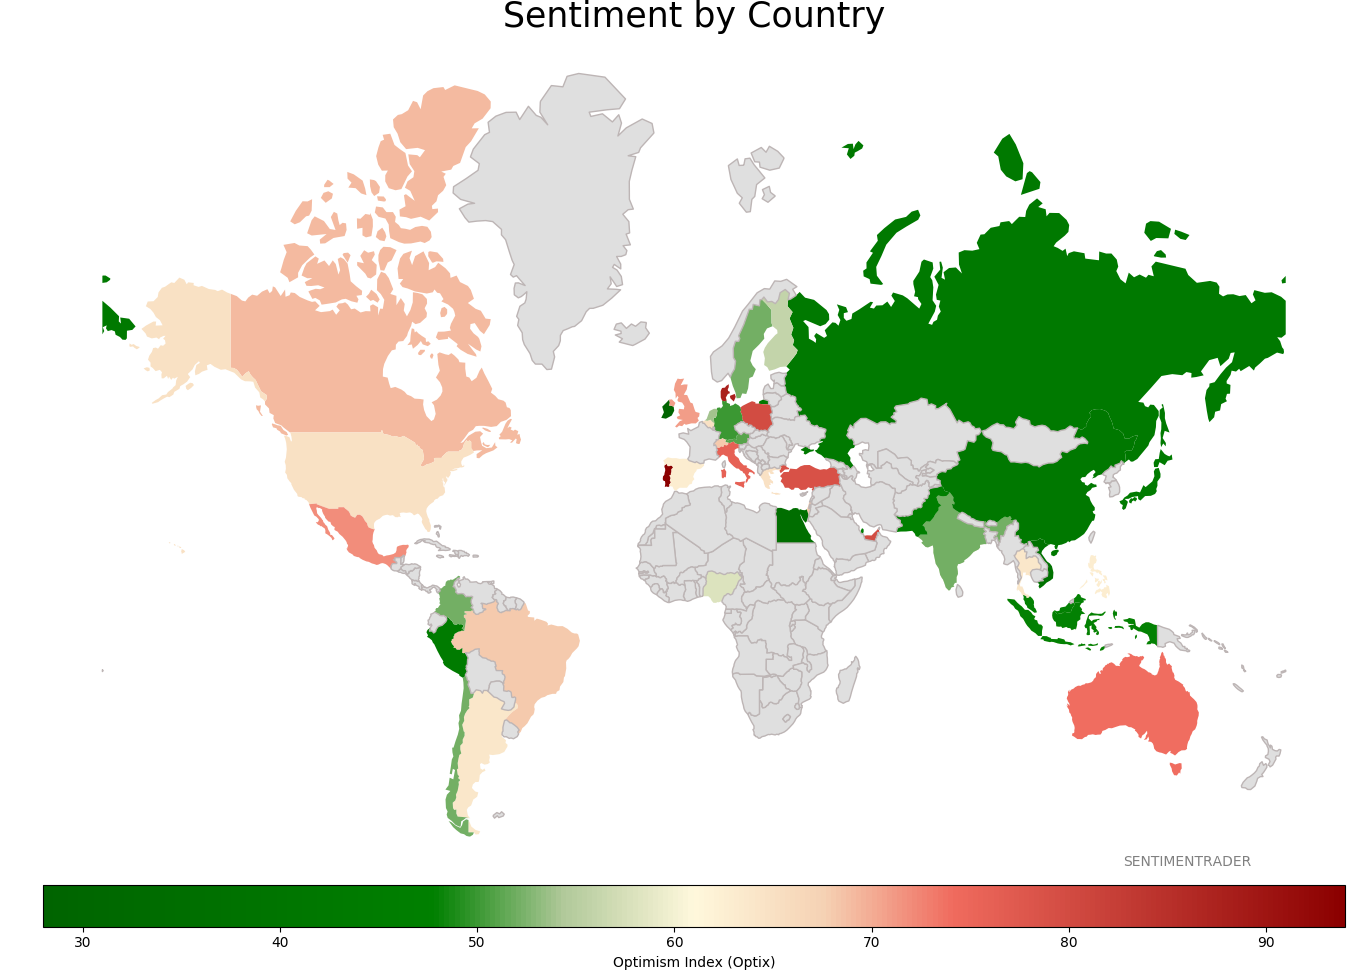
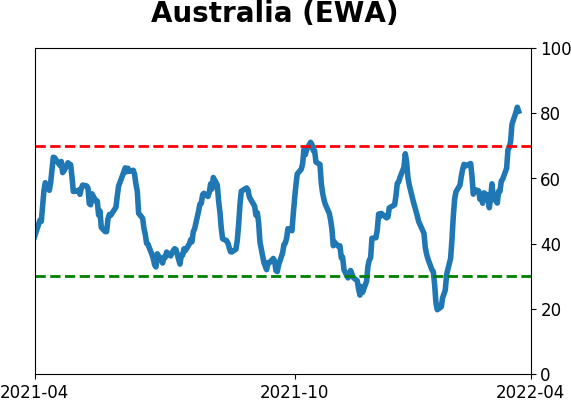
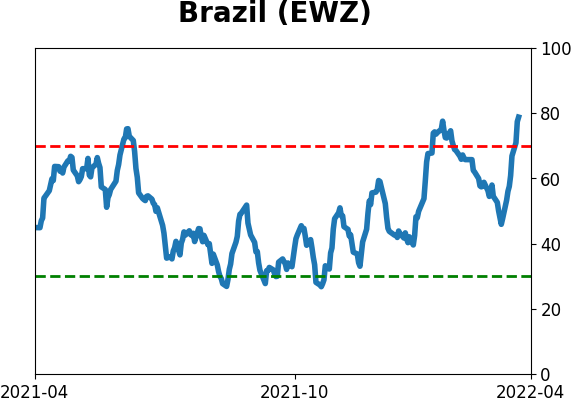
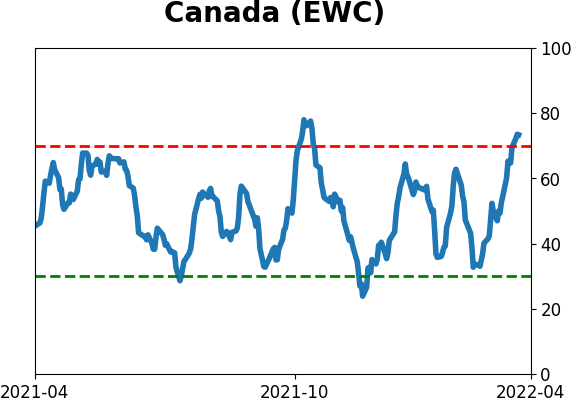
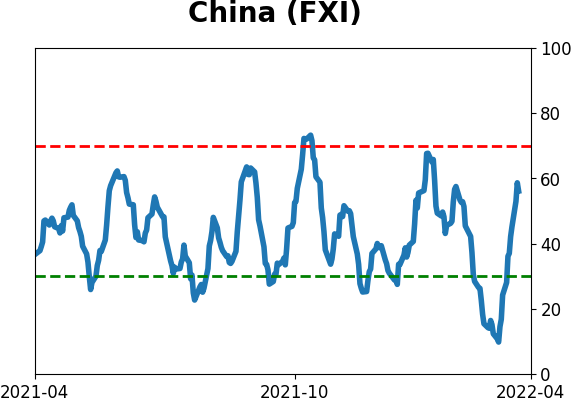
Sentiment Around The World
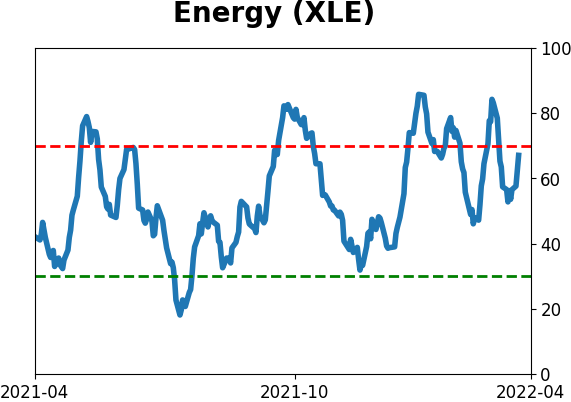
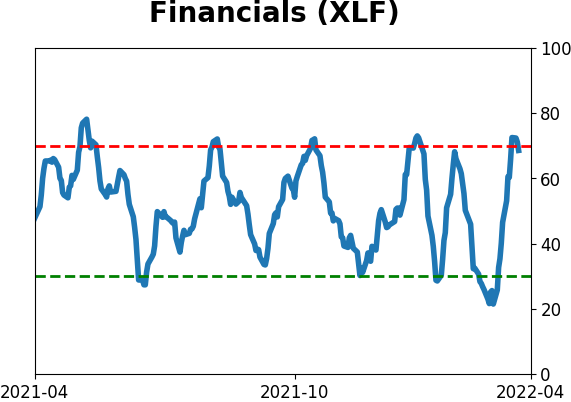
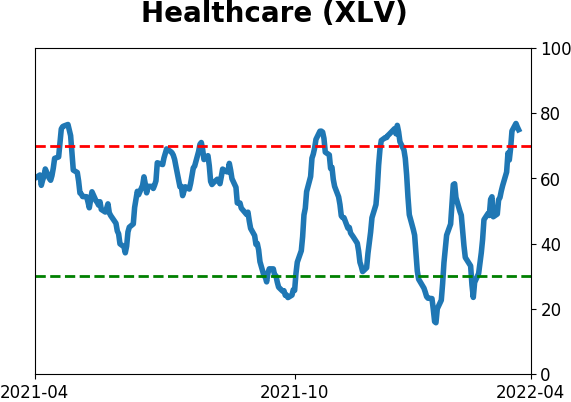
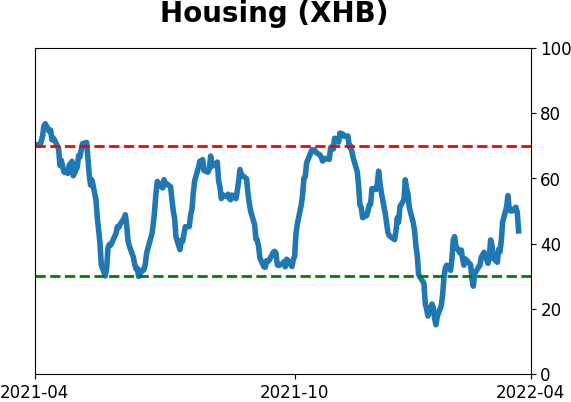
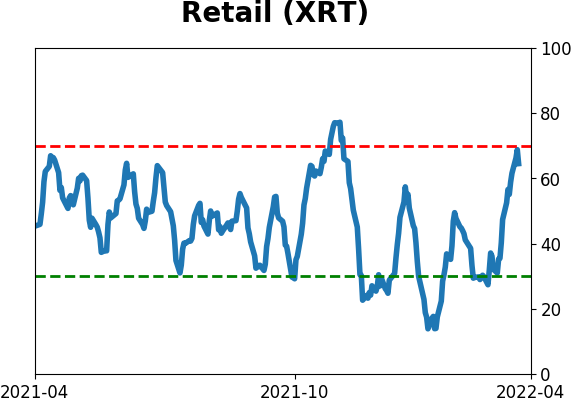
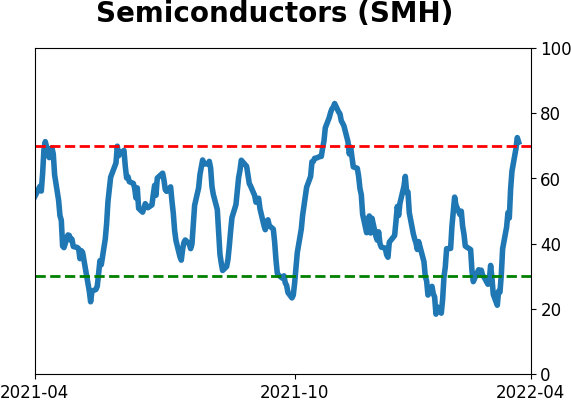
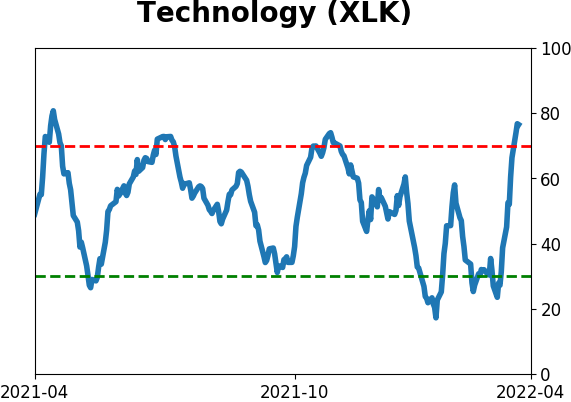
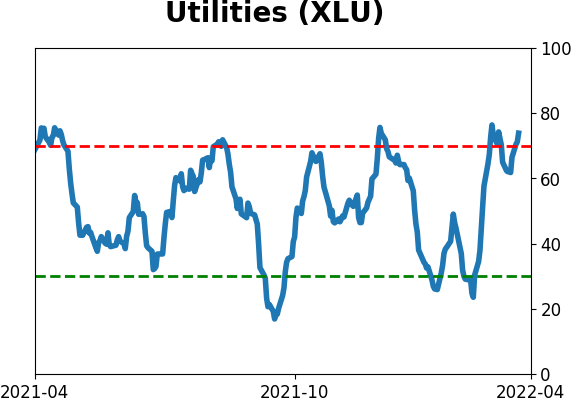
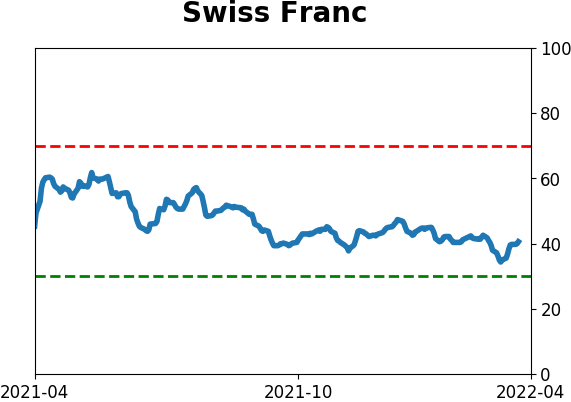
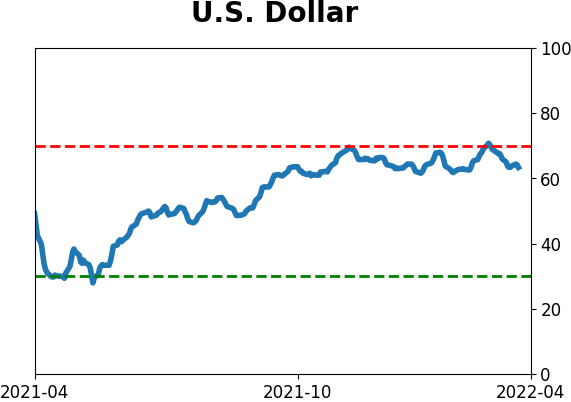
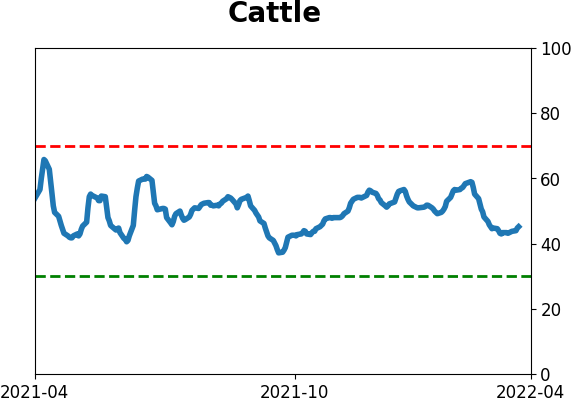
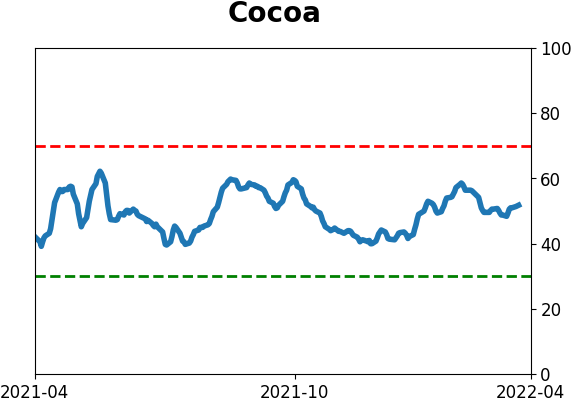
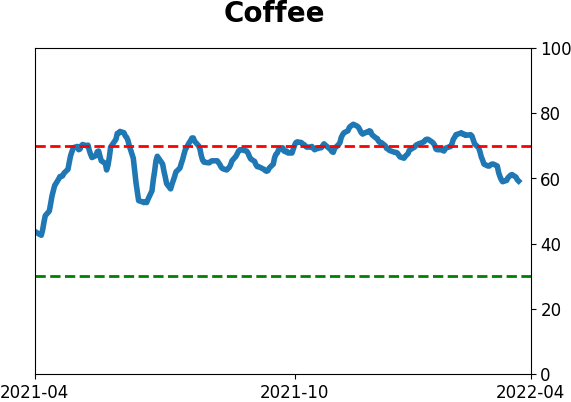
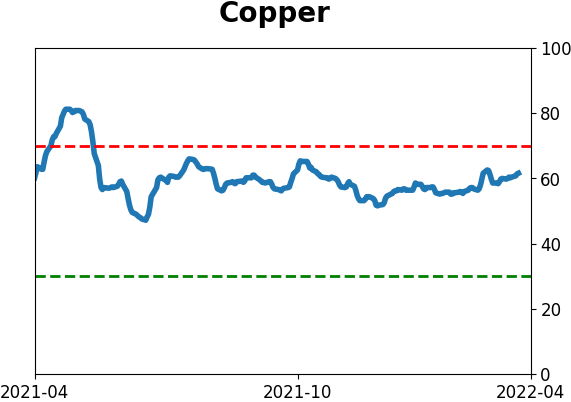
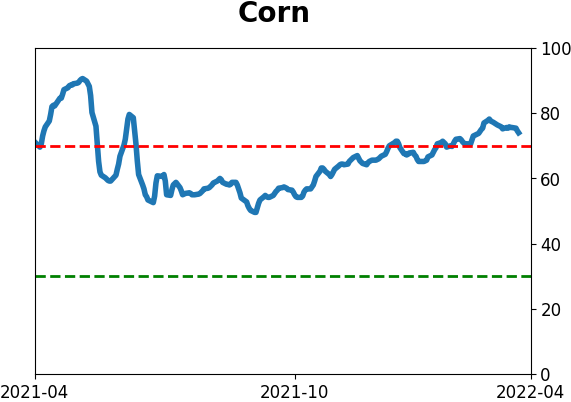
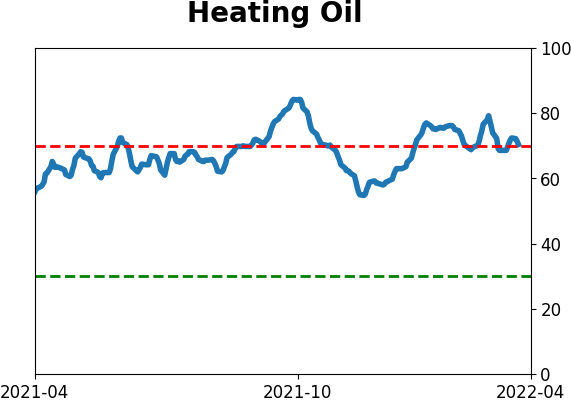
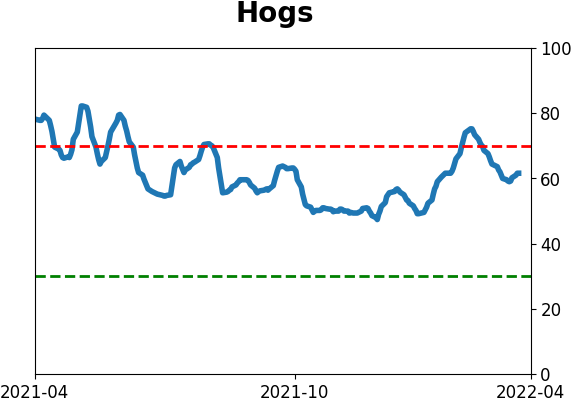
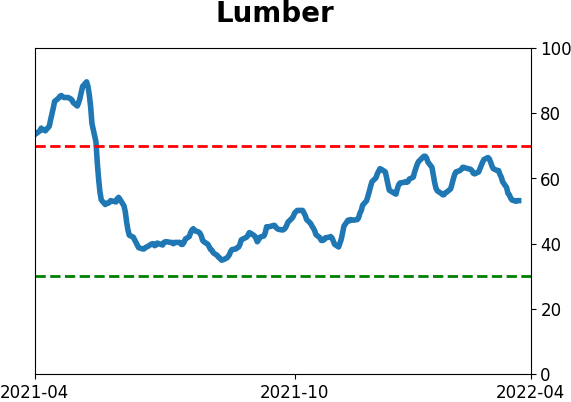
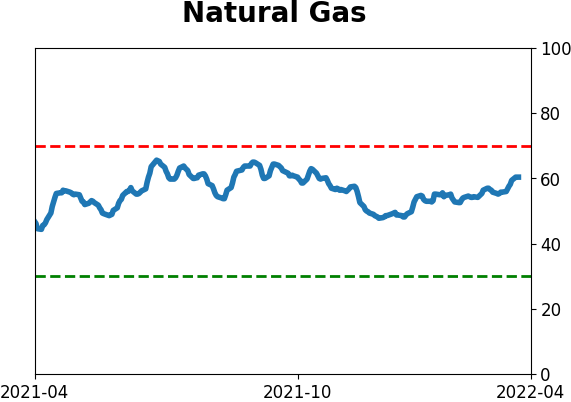
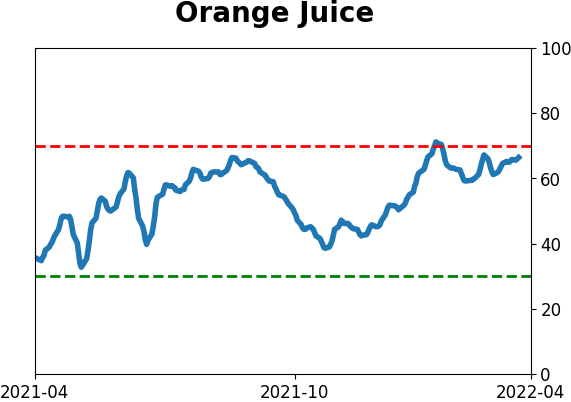
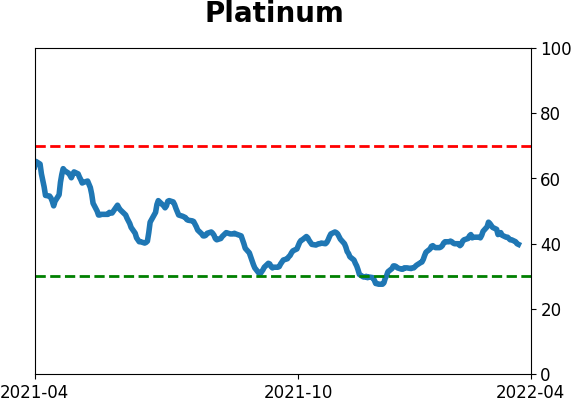
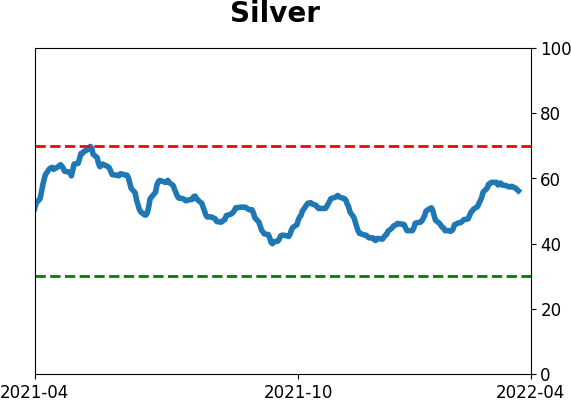
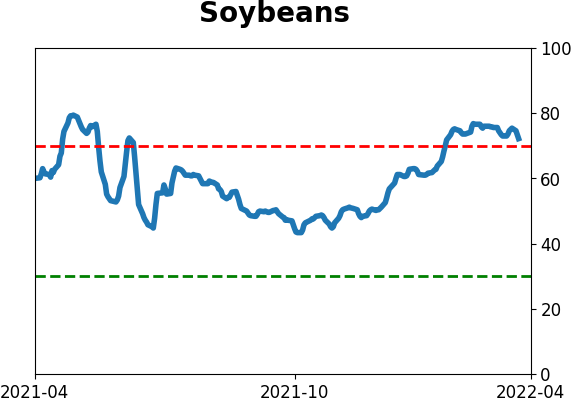
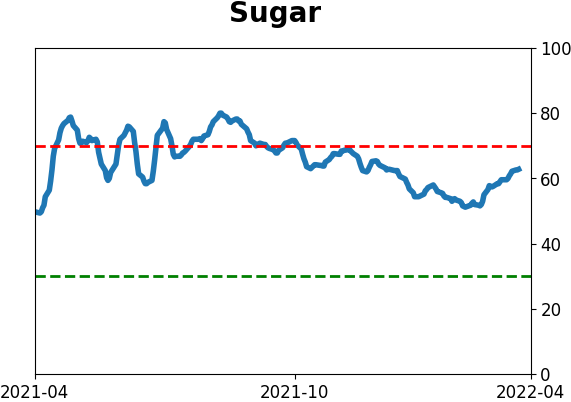
Optimism Index Thumbnails
|
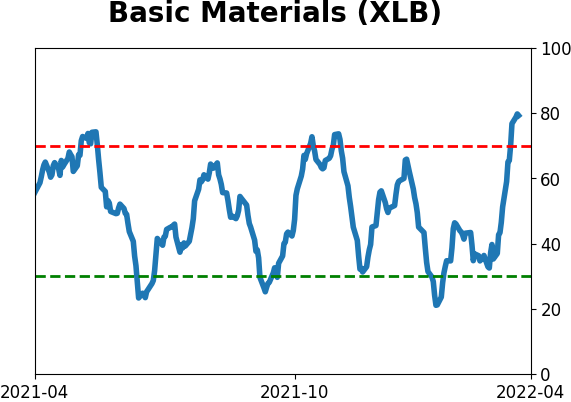
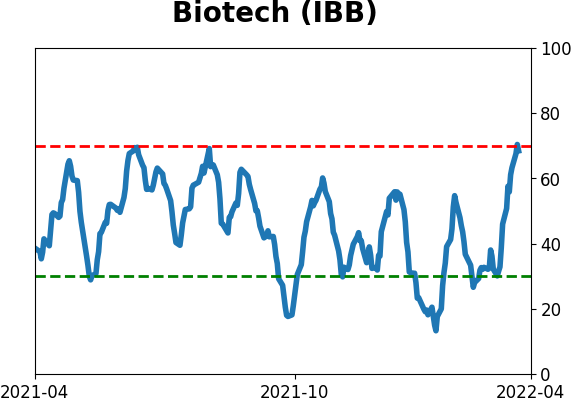
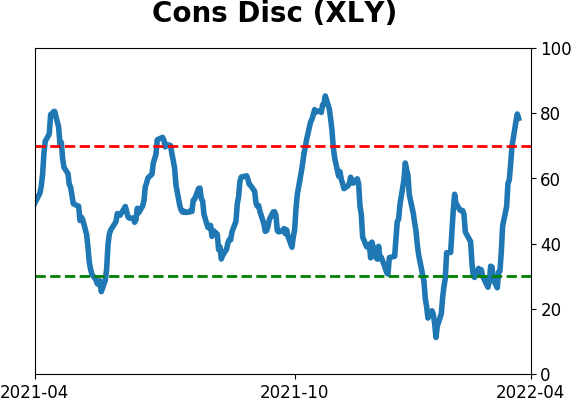
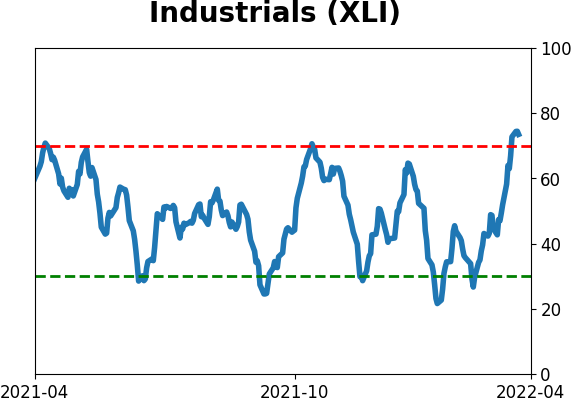
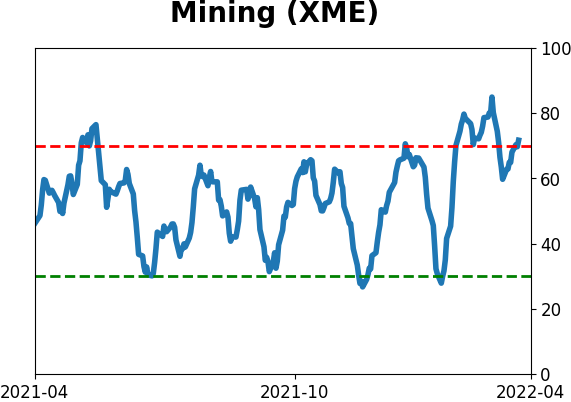
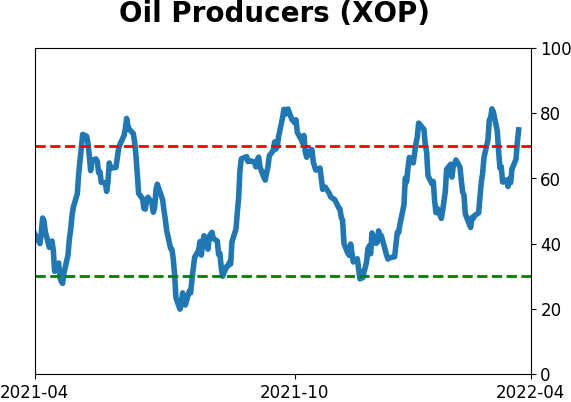
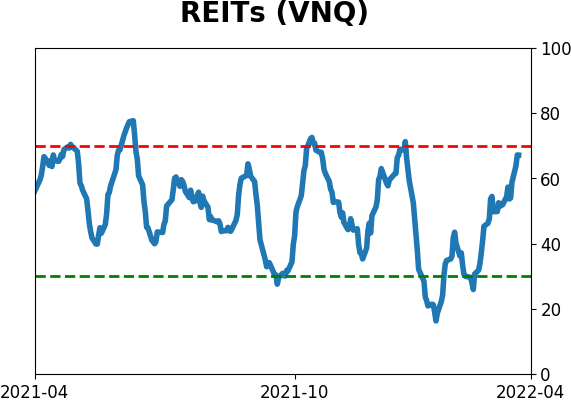
Sector ETF's - 10-Day Moving Average
|
|
|
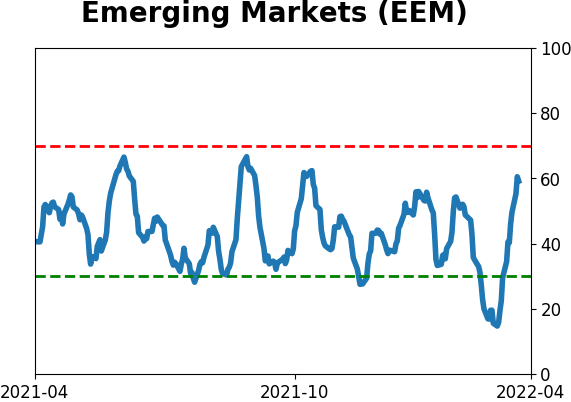
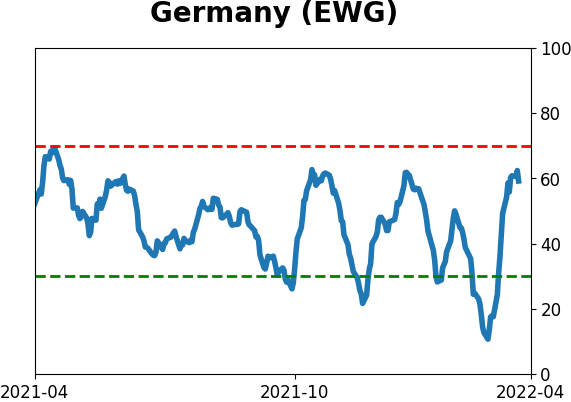
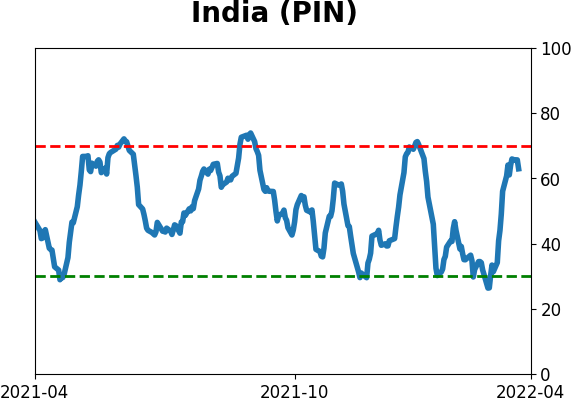
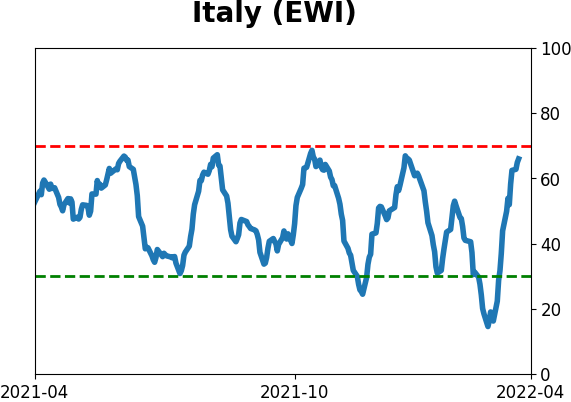
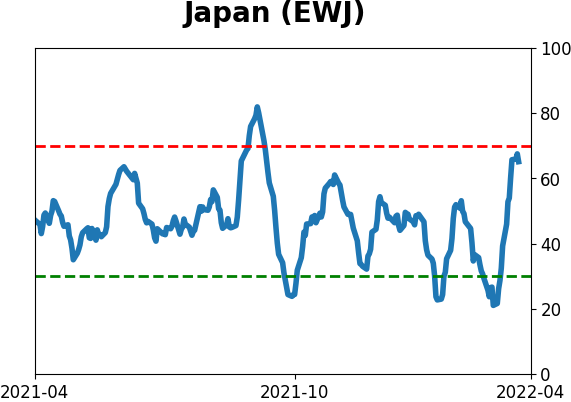
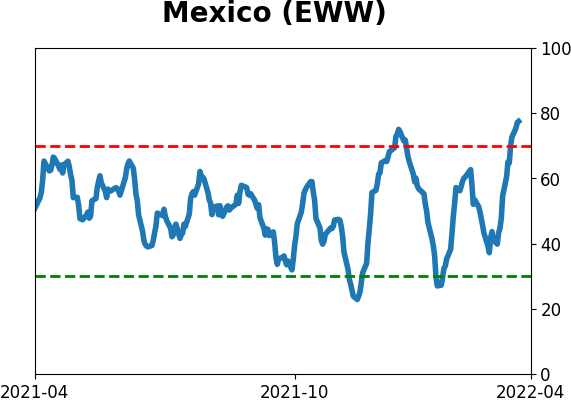
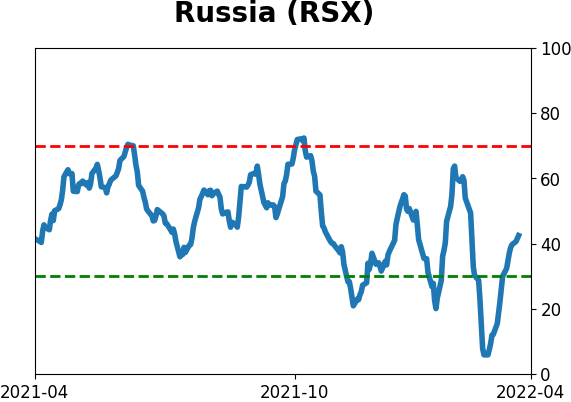
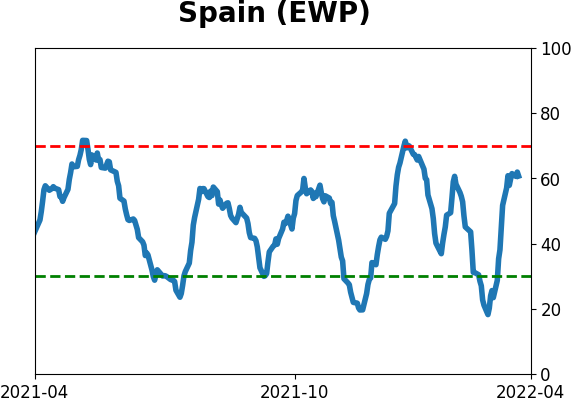
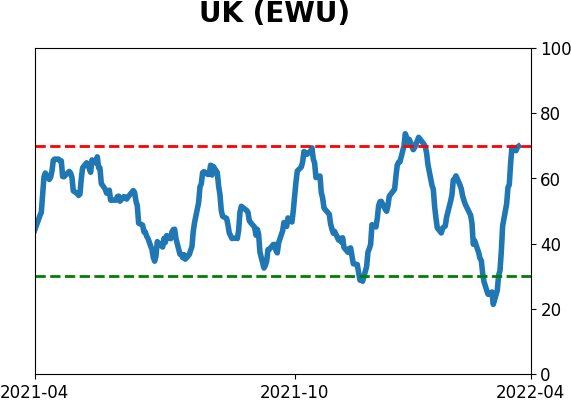
Country ETF's - 10-Day Moving Average
|
|
|
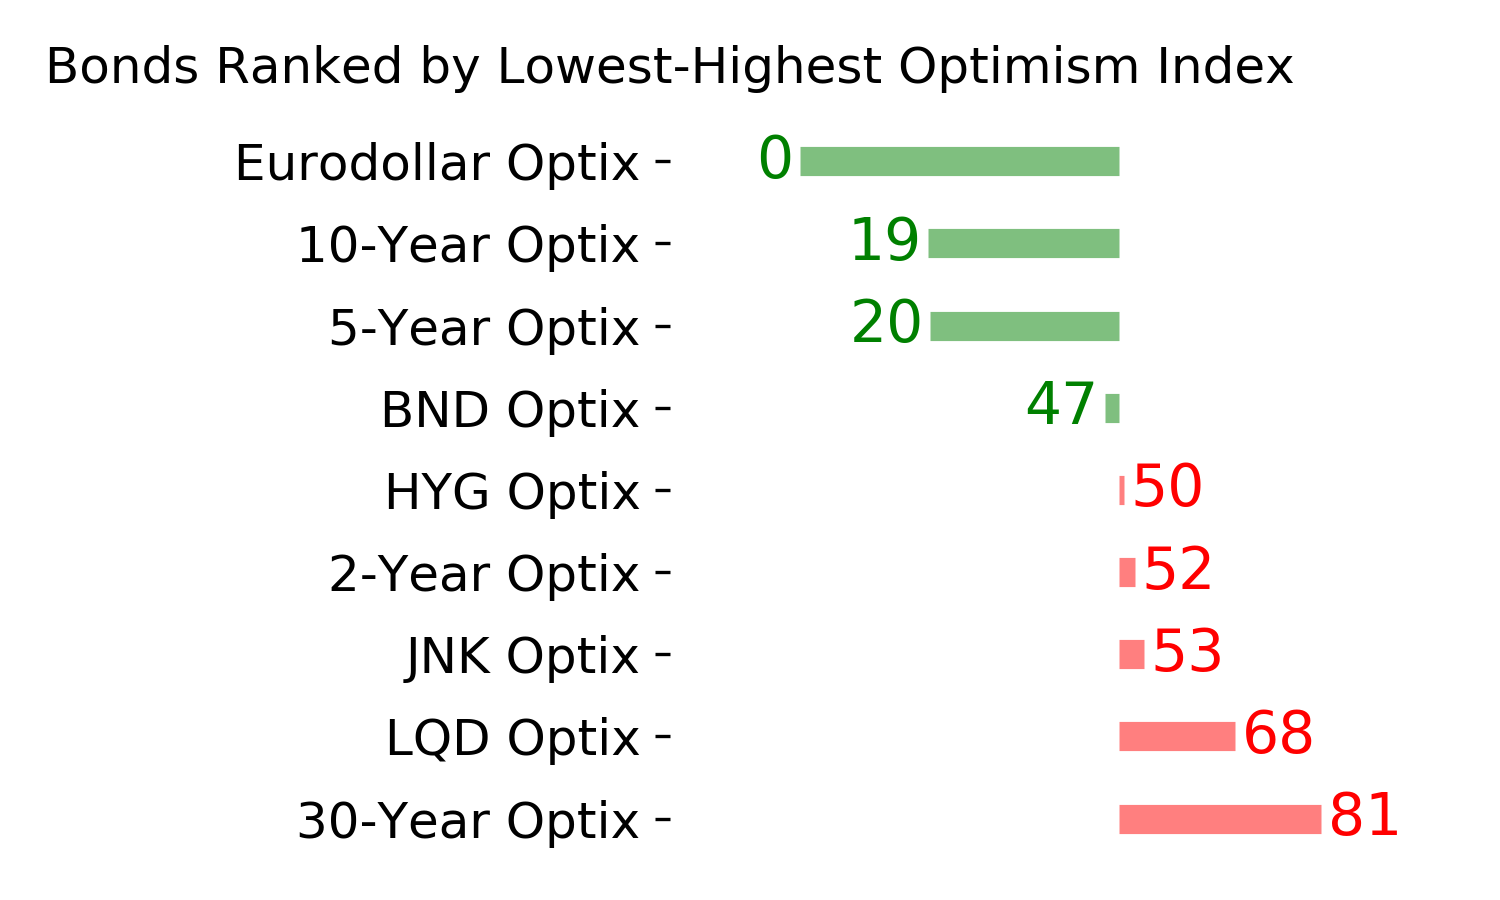
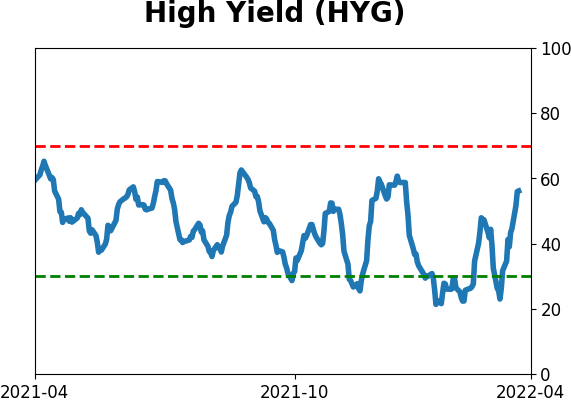
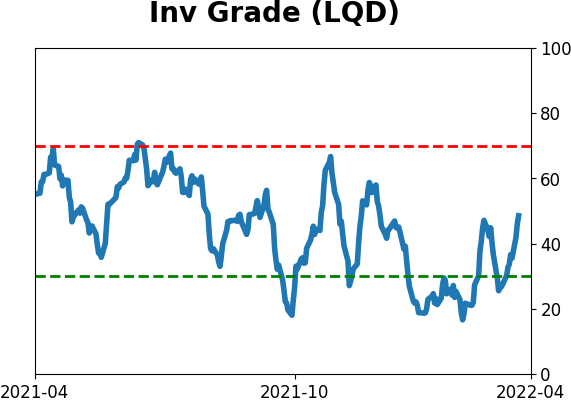
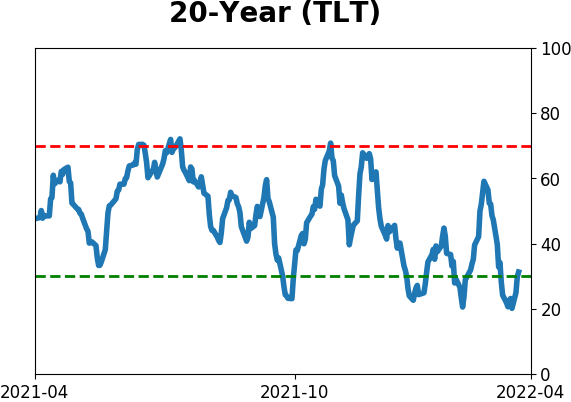
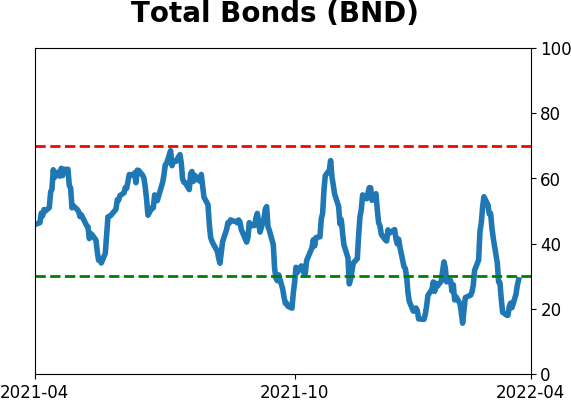
Bond ETF's - 10-Day Moving Average
|
|
|
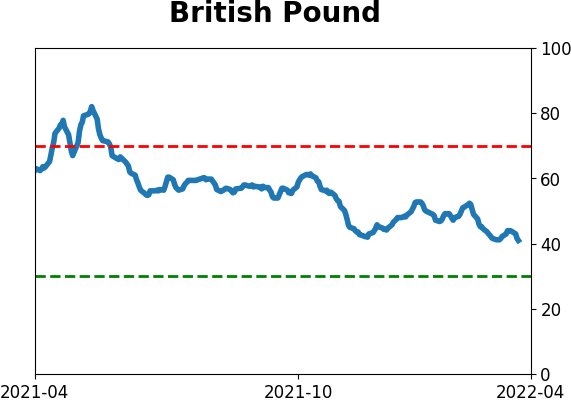
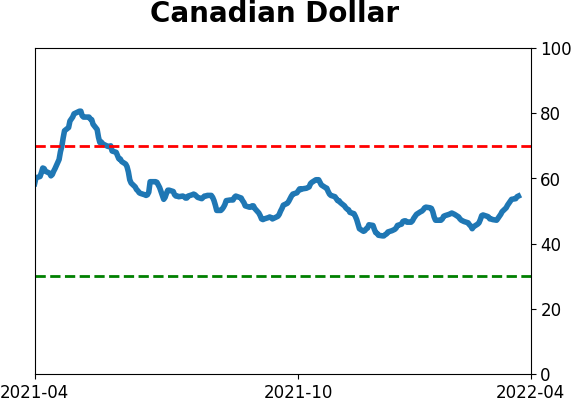
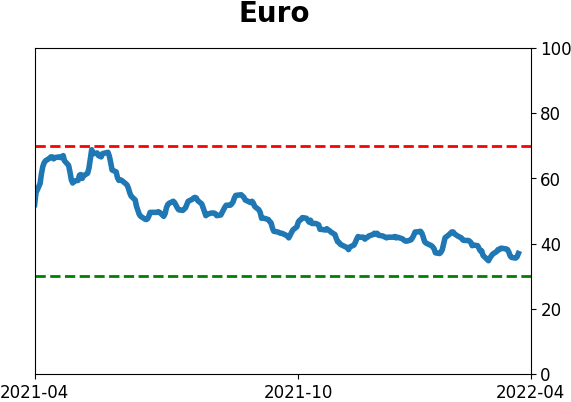
Currency ETF's - 5-Day Moving Average
|
|
|
Commodity ETF's - 5-Day Moving Average
|
|