Headlines
|
|
Divergence in sentiment surveys shows impact of high gas prices:
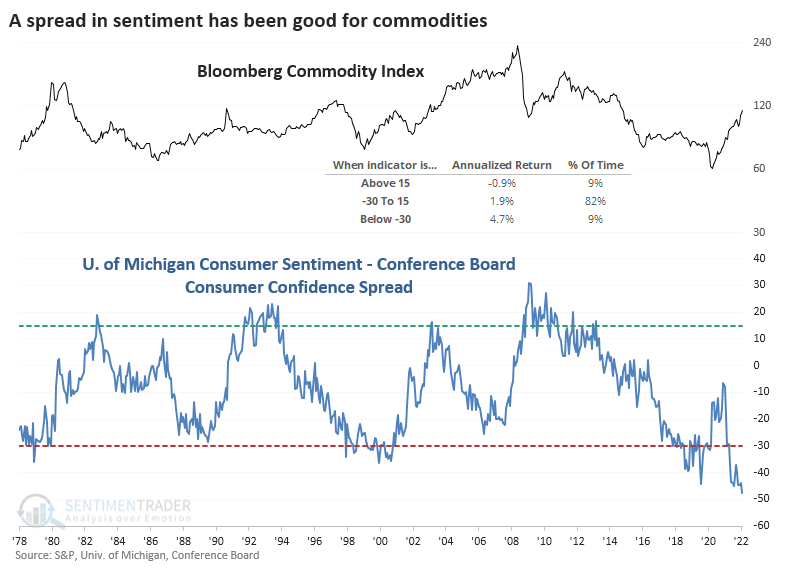
High gas prices have weighed on consumers' sentiment toward their individual circumstances relative to the broader economy. Wide spreads like this have preceded mostly poor returns in stocks, particularly in industries like retail. Commodities have tended to hold up well.
|
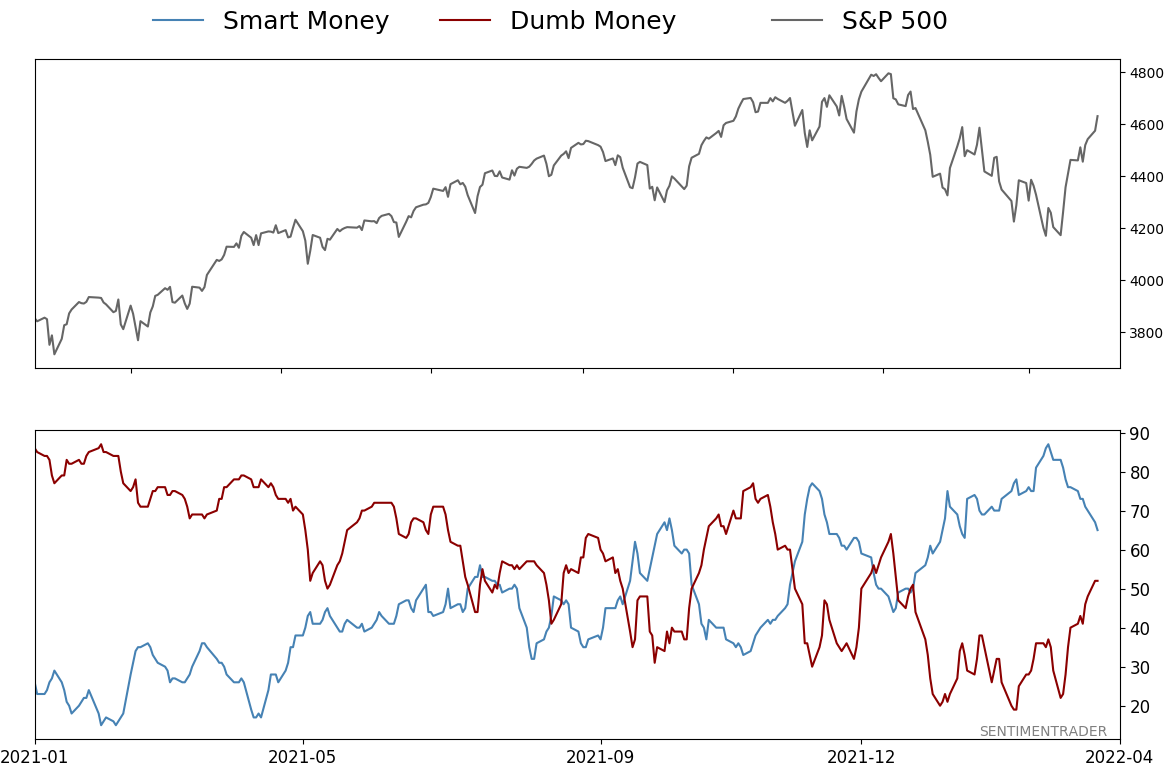
Smart / Dumb Money Confidence
|
Smart Money Confidence: 65%
Dumb Money Confidence: 52%
|
|
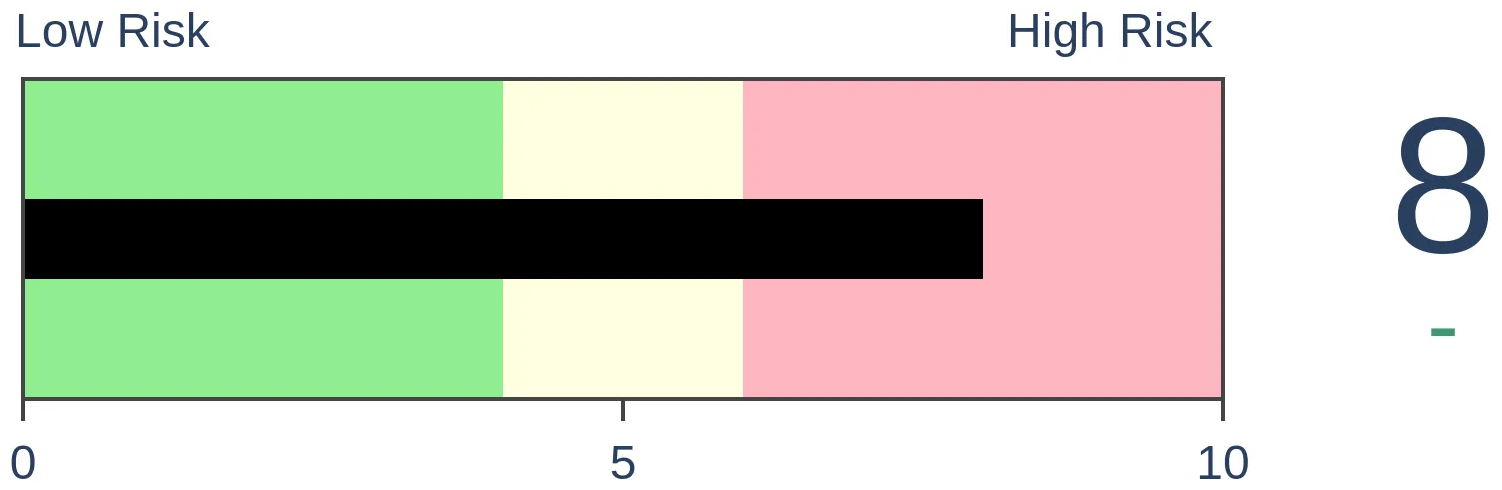
Risk Levels
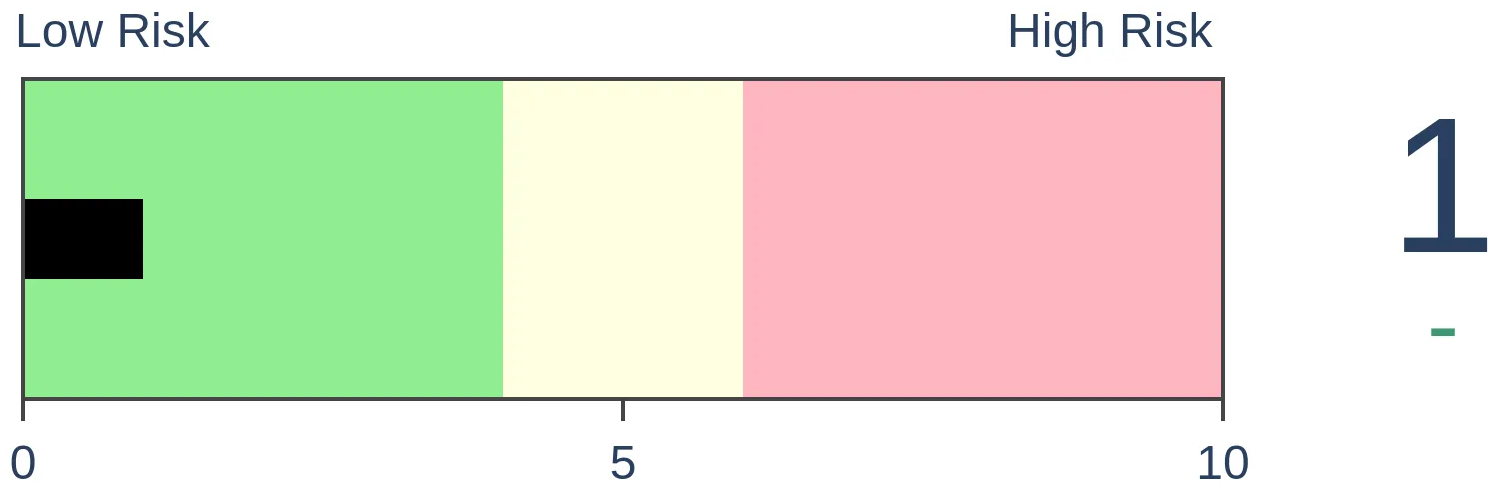
Stocks Short-Term
|
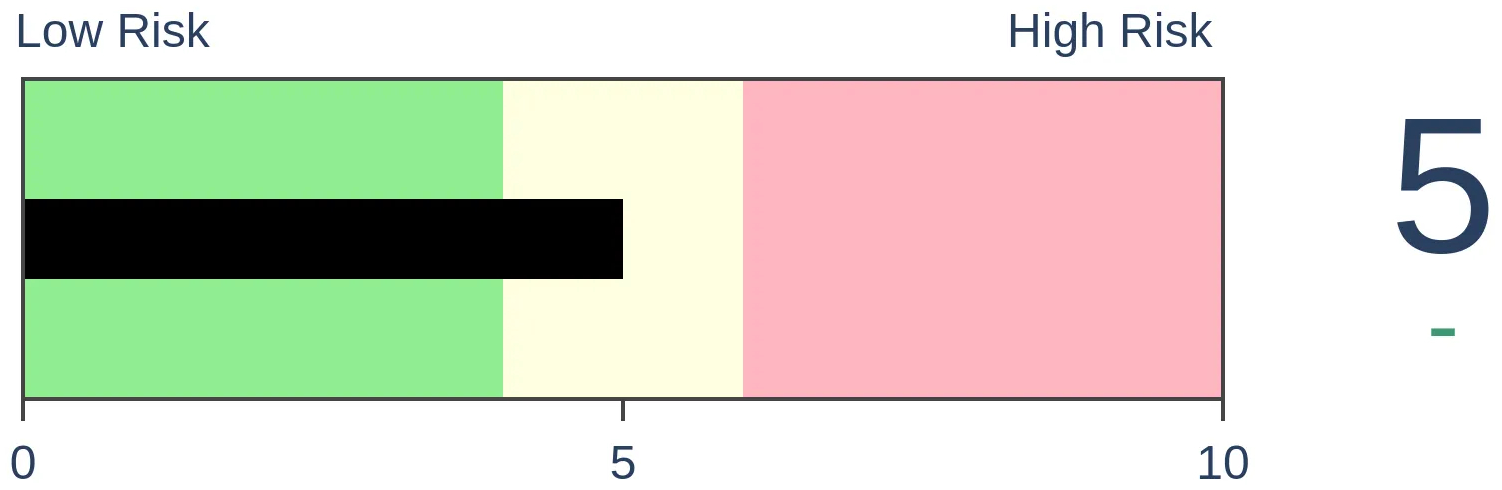
Stocks Medium-Term

|
|
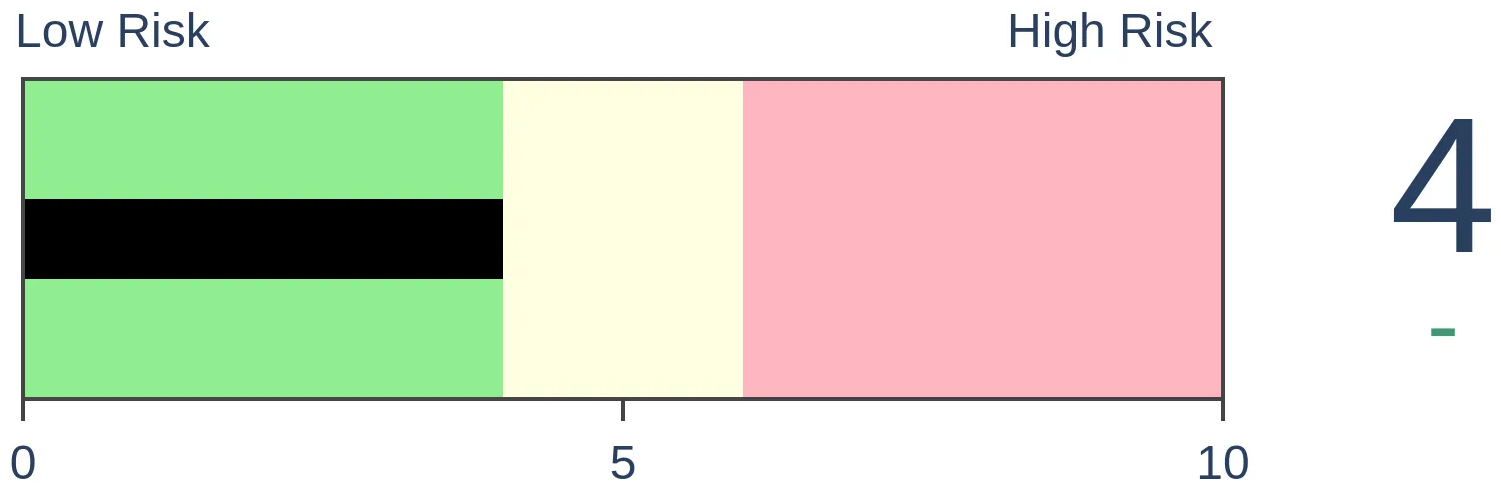
Bonds
|
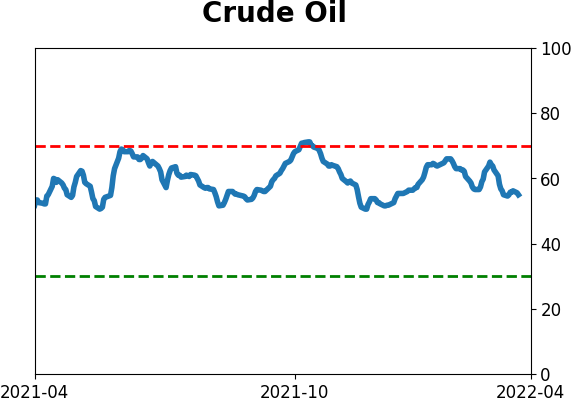
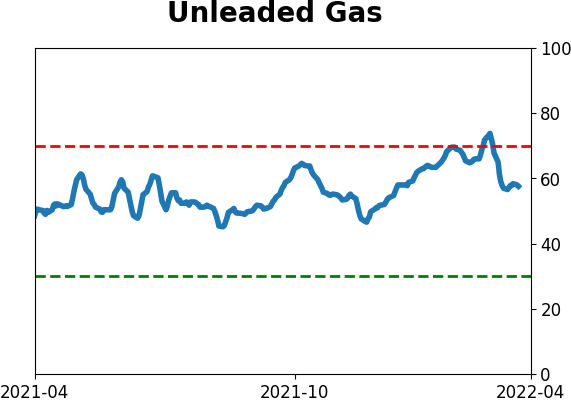
Crude Oil

|
|
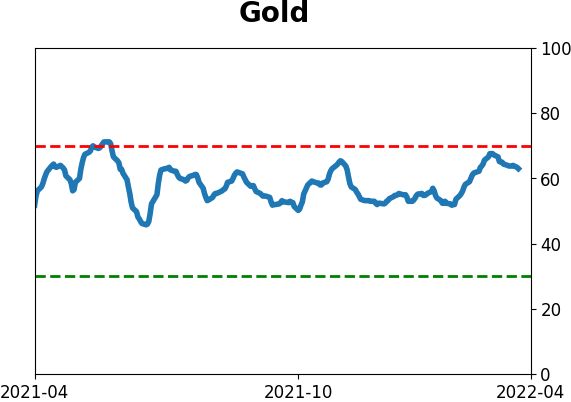
Gold
|
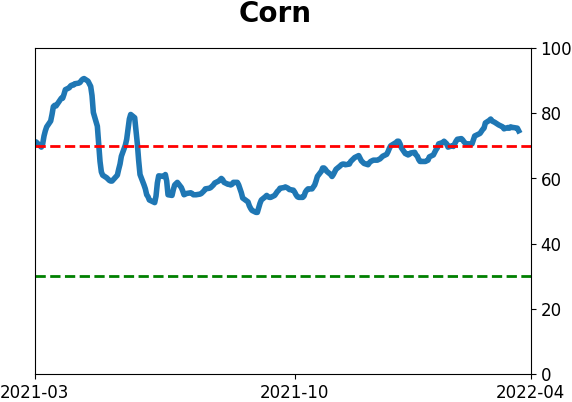
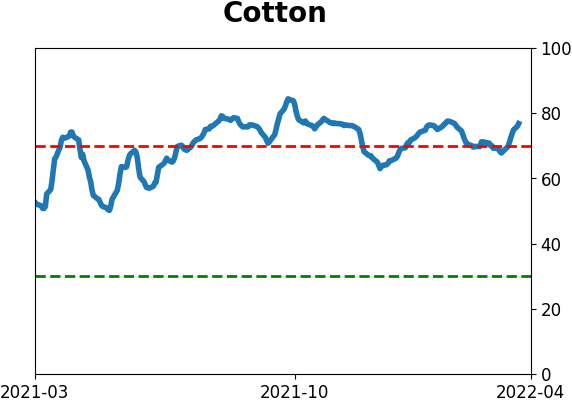
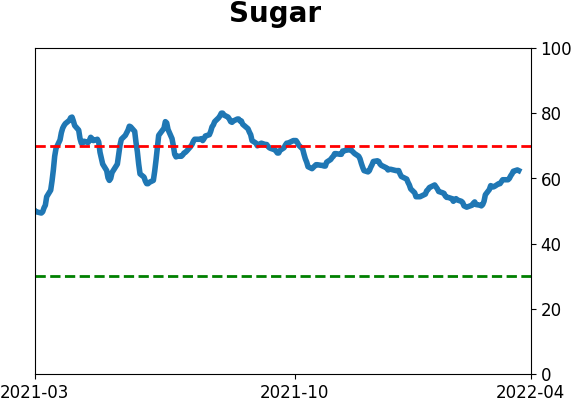
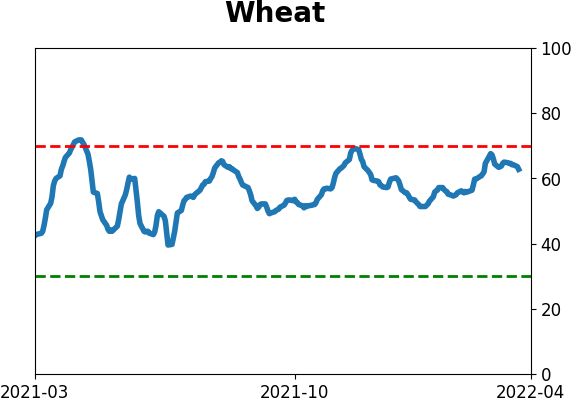
Agriculture
|
|
Research
By Jason Goepfert
BOTTOM LINE
High gas prices have weighed on consumers' sentiment toward their individual circumstances relative to the broader economy. Wide spreads like this have preceded mostly poor returns in stocks, particularly in industries like retail. Commodities have tended to hold up well.
FORECAST / TIMEFRAME
None
|
Key points:
- There is a record spread between sentiment in two benchmark consumer surveys
- The spread likely reflects consumers' negative reaction to high and rising gas prices
- Negative spreads in the surveys preceded poor returns in stocks, particularly retailers
High gas prices weigh on consumers' individual outlooks
The latest monthly surveys of consumer sentiment are out, and they're...not good. The Consumer Sentiment survey from the University of Michigan was particularly despondent, with the 11th-lowest reading since 1978. The only lower readings during the past 40 years were during the depths of the global financial crisis.
Other surveys aren't quite so drastic, including the Conference Board survey of Consumer Confidence. But the two surveys have some differences, most notably among the questions they ask.
US Bancorp Asset Management gets to the gist of it:
"The Consumer Confidence questions place a greater emphasis on employment and labor market conditions while the Consumer Sentiment survey emphasizes individual household finances. This drives the impression Consumer Confidence more generally reflects consumer feelings towards the overall economy while Consumer Sentiment reflects consumer perceptions of their own personal circumstances."
A simple web search will turn up dozens of in-depth analyses of the two surveys, including academic studies of the inputs important to each of them. It typically boils down to gasoline - consumers in the U. of Michigan survey tend to be more influenced by high gas prices. Prices have been rising quickly, so sentiment has declined.
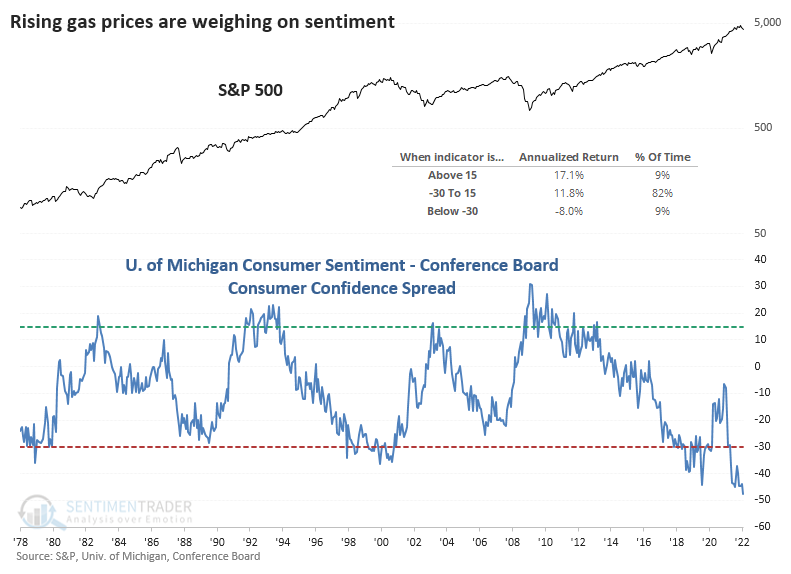
The spread between sentiment in the surveys just hit a record low. That (roughly) suggests that consumers have never been more pessimistic about their personal situation relative to the broader economy. And, when this spread has been extreme, it has had an impact on forward returns in the S&P 500.

The chart shows that the S&P returned +17.1% p.a. when the spread was extremely positive, but a woeful -8.0% p.a. when it was extremely negative like it is now.
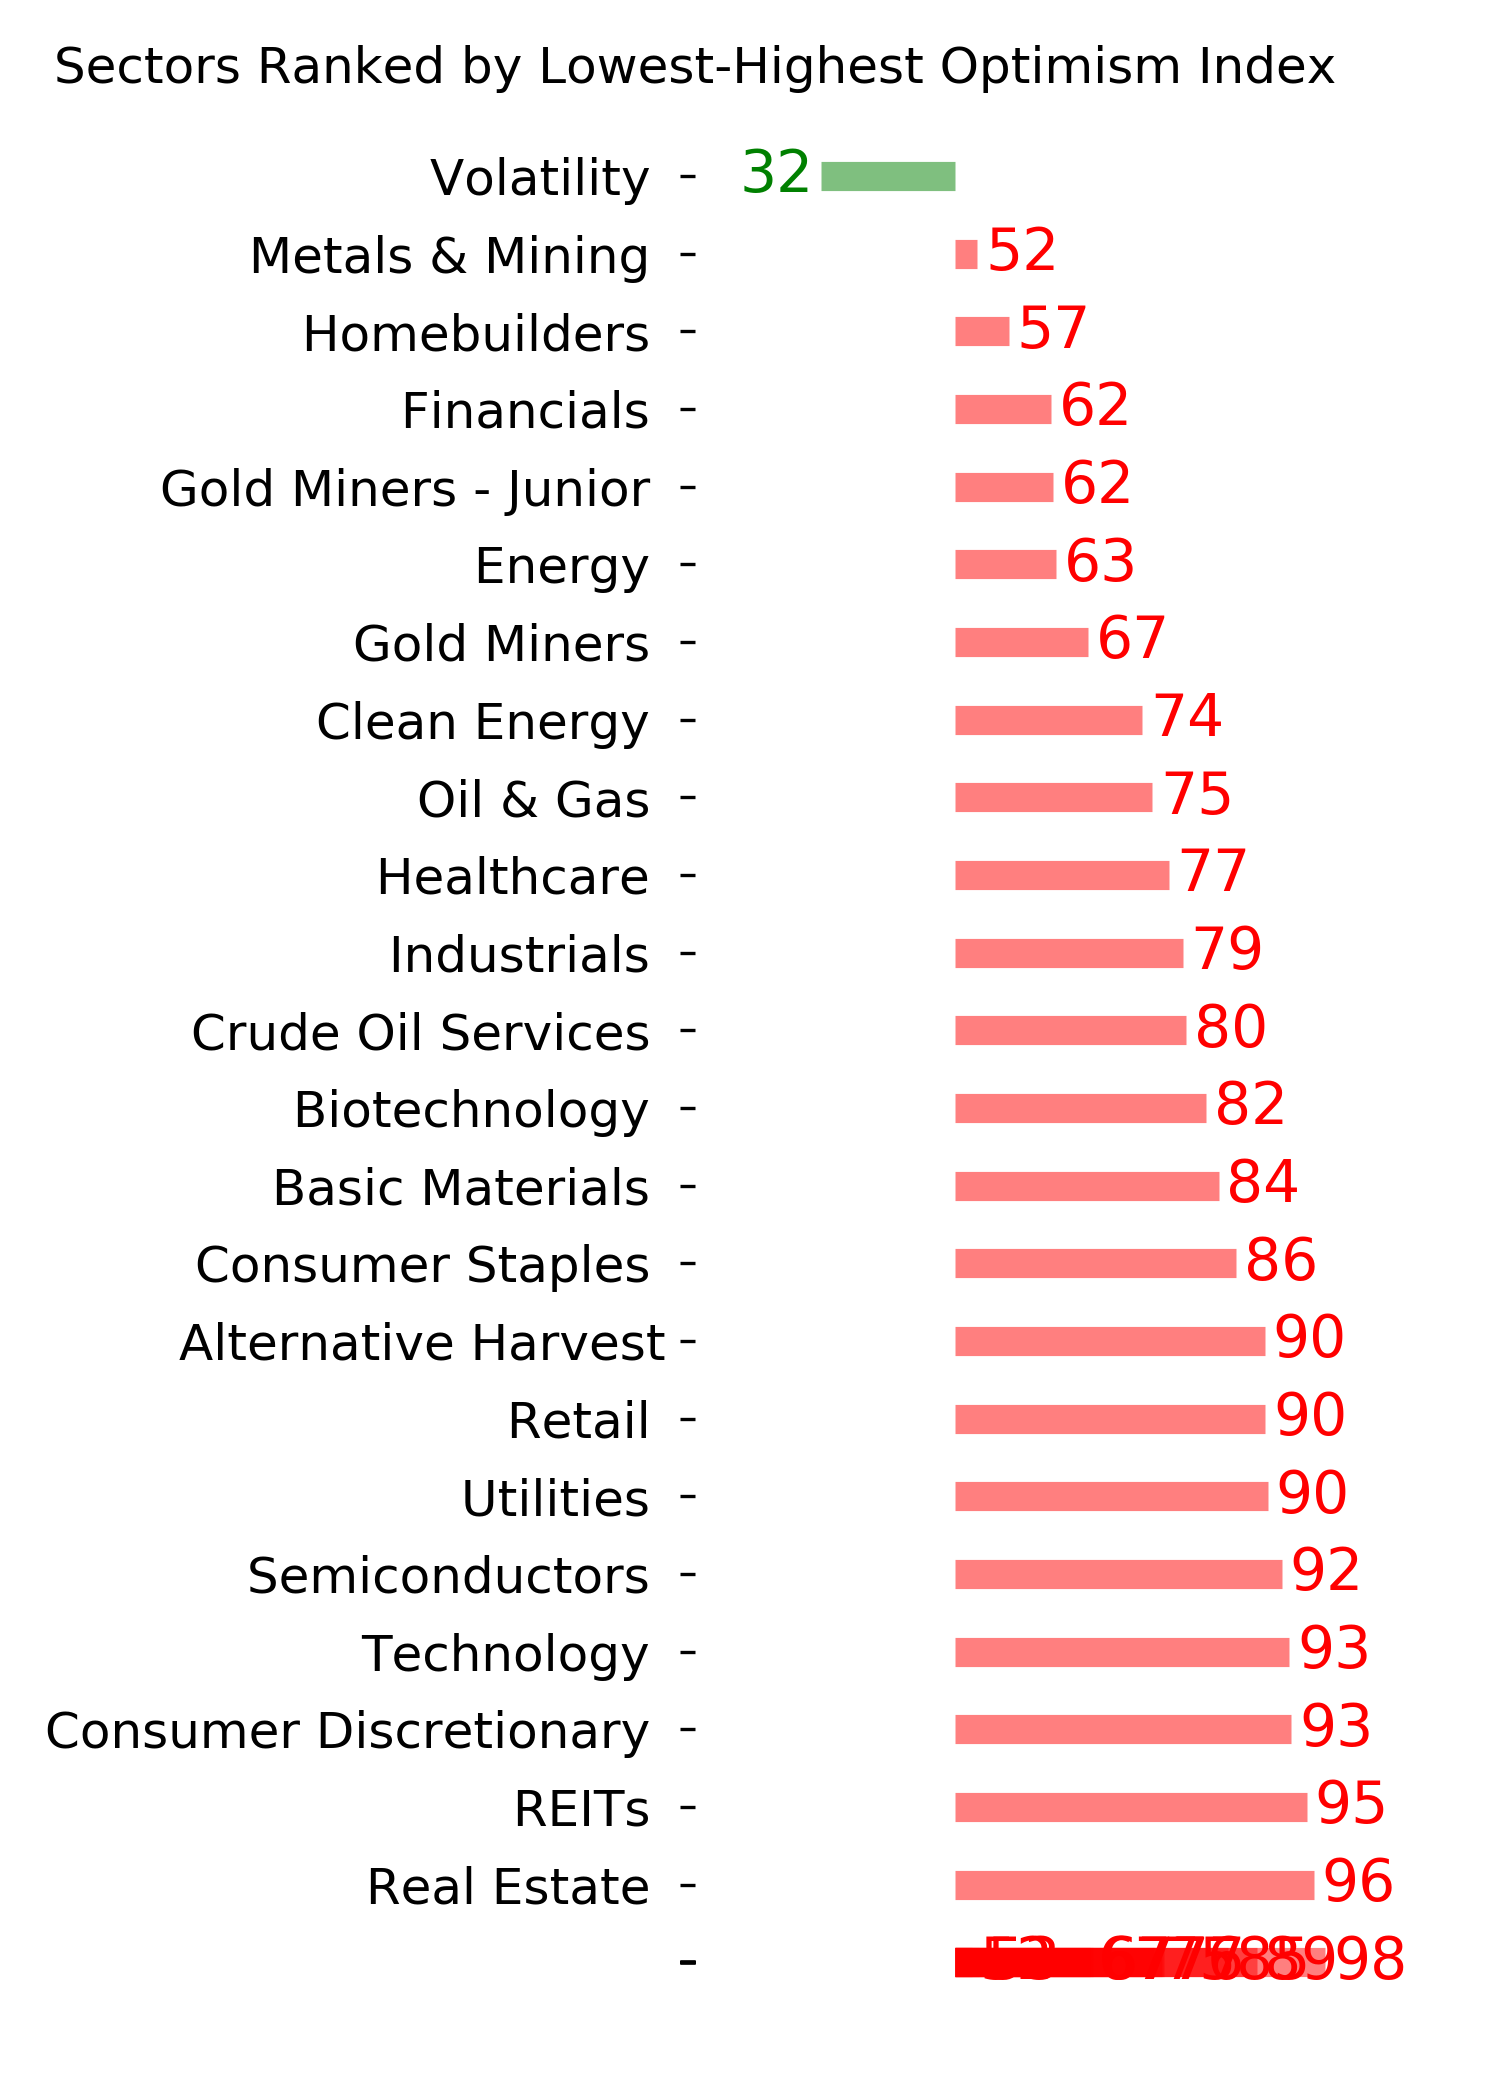
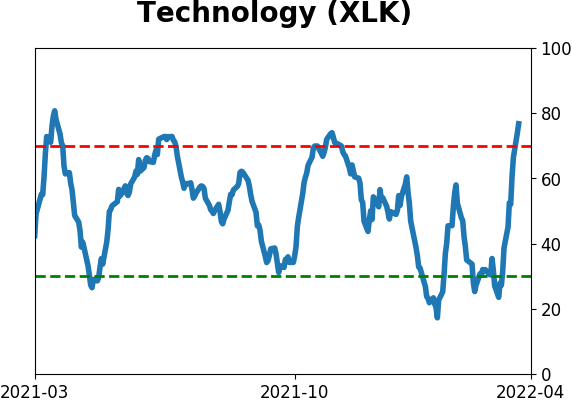
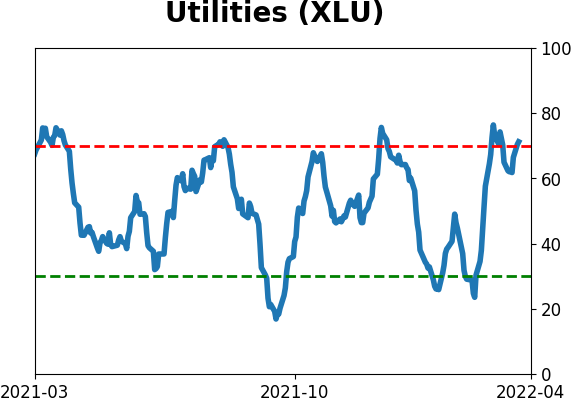
Among sectors and factors, the defensive Utilities and Health Care sectors showed the best annualized returns after extremely negative readings, while Industrials and Financials were among the worst performers. Surprisingly, Technology stocks were also among the top returners (using total return).
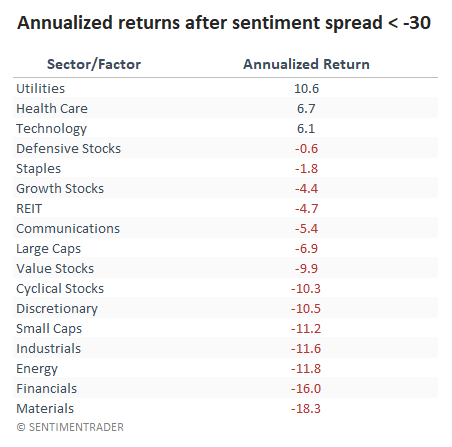
Another good performer was commodities. The Bloomberg Commodity Index averaged +4.7% annualized following very low readings, while it sported a negative return when the spread was high.
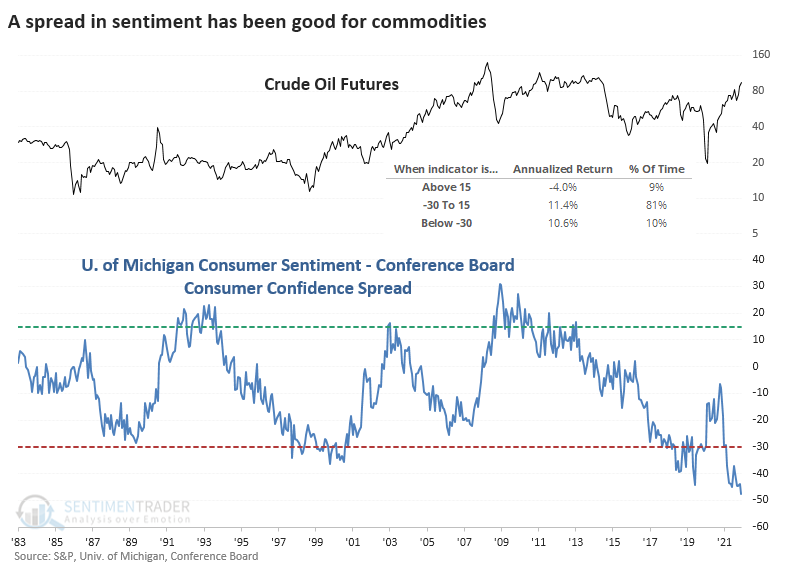
Oil is a big part of most commodity indexes, and it held up pretty well after extreme negative spreads. It's a bit surprising that Energy stocks didn't show the same robust performance since their returns are usually positively correlated.
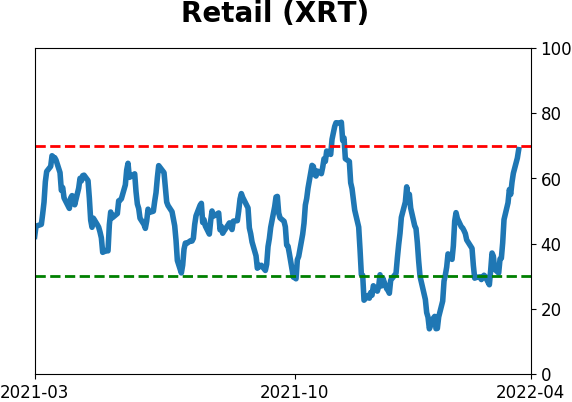
Some of the studies on differences between the two surveys suggest that when the Michigan survey is more pessimistic than the Conference Board one, it has a negative impact on retail sales in the months ahead. Indeed, one of the industries with the widest spreads in returns was the Retailing industry.
What the research tells us...
When the economy suffers a shock, especially when it's related to gas prices, it tends to have a large and immediate impact on consumer sentiment surveys. The University of Michigan survey is prone to these effects, and it has caused a record negative spread versus other sureys like that from the Conference Board that focuses on broader economic forces. Large negative spreads have tended to precede weak returns for stocks, but we wouldn't put a lot of weight on this. It's more of a factor for individual sectors, especially Financials and Retail.
Active Studies
| Time Frame | Bullish | Bearish | | Short-Term | 4 | 0 | | Medium-Term | 25 | 2 | | Long-Term | 16 | 5 |
|
Indicators at Extremes
Portfolio
| Position | Description | Weight % | Added / Reduced | Date | | Stocks | 21.6% RSP, 5.1% IEMG | 26.7 | Added 5.3% | 2022-03-18 | | Bonds | 32.7% BND, 7.1% SCHP | 40.1 | Added 8.3% | 2021-10-26 | | Commodities | GCC | 2.4 | Reduced 2.1%
| 2020-09-04 | | Precious Metals | GDX | 4.6 | Reduced 4.2% | 2021-05-19 | | Special Situations | 7.6% KWEB, 4.9% XBI, 3.7% XLE, 1.8% PSCE | 18.0 | Added 4.6% | 2022-02-24 | | Cash | | 7.9 | | |
|
Updates (Changes made today are underlined)
We had a volatile few weeks into mid-March, and it was enough to trigger a number of extremes. Most of the studies we've looked at have had a clear bullish edge over a multi-month time frame. I'd typically be more proactive instead of reactive with changes in positions, adding exposure into weakness instead of strength, but during an unhealthy environment like we're in, I tend to be more conservative. I did add some exposure to emerging markets, choosing a fund with the least exposure to China, since I already have exposure there with KWEB. It's still heavily weighted to that market. The only other times the MSCI Emerging Markets Index has had a weekly reversal like this week were October 2008, October 2011, and August 2015, all leading to long-term gains. RETURN YTD: +1.4% 2021: +8.7%, 2020: +8.1%, 2019: +12.6%, 2018: +0.6%, 2017: +3.8%, 2016: +17.1%, 2015: +9.2%, 2014: +14.5%, 2013: +2.2%, 2012: +10.8%, 2011: +16.5%, 2010: +15.3%, 2009: +23.9%, 2008: +16.2%, 2007: +7.8%
|
|
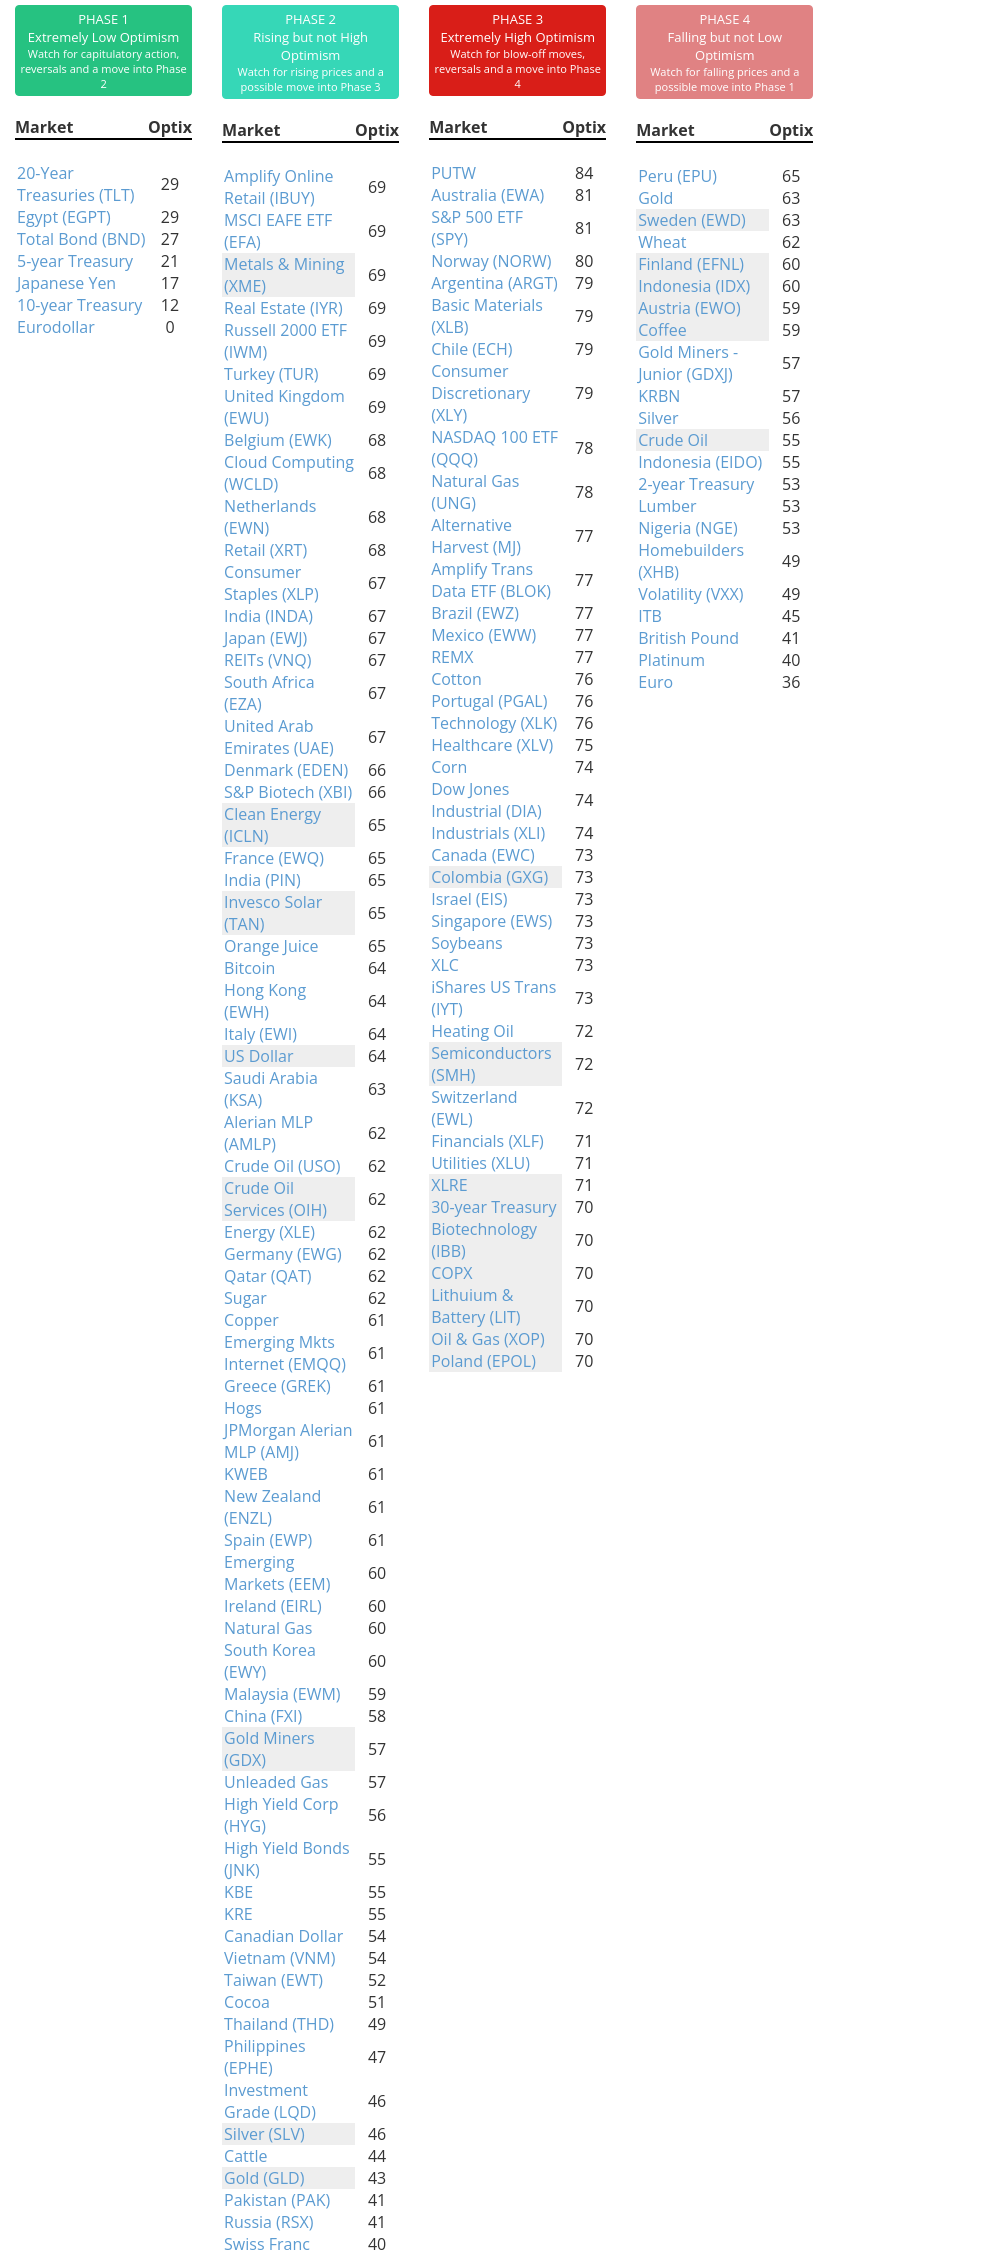
Phase Table
Ranks
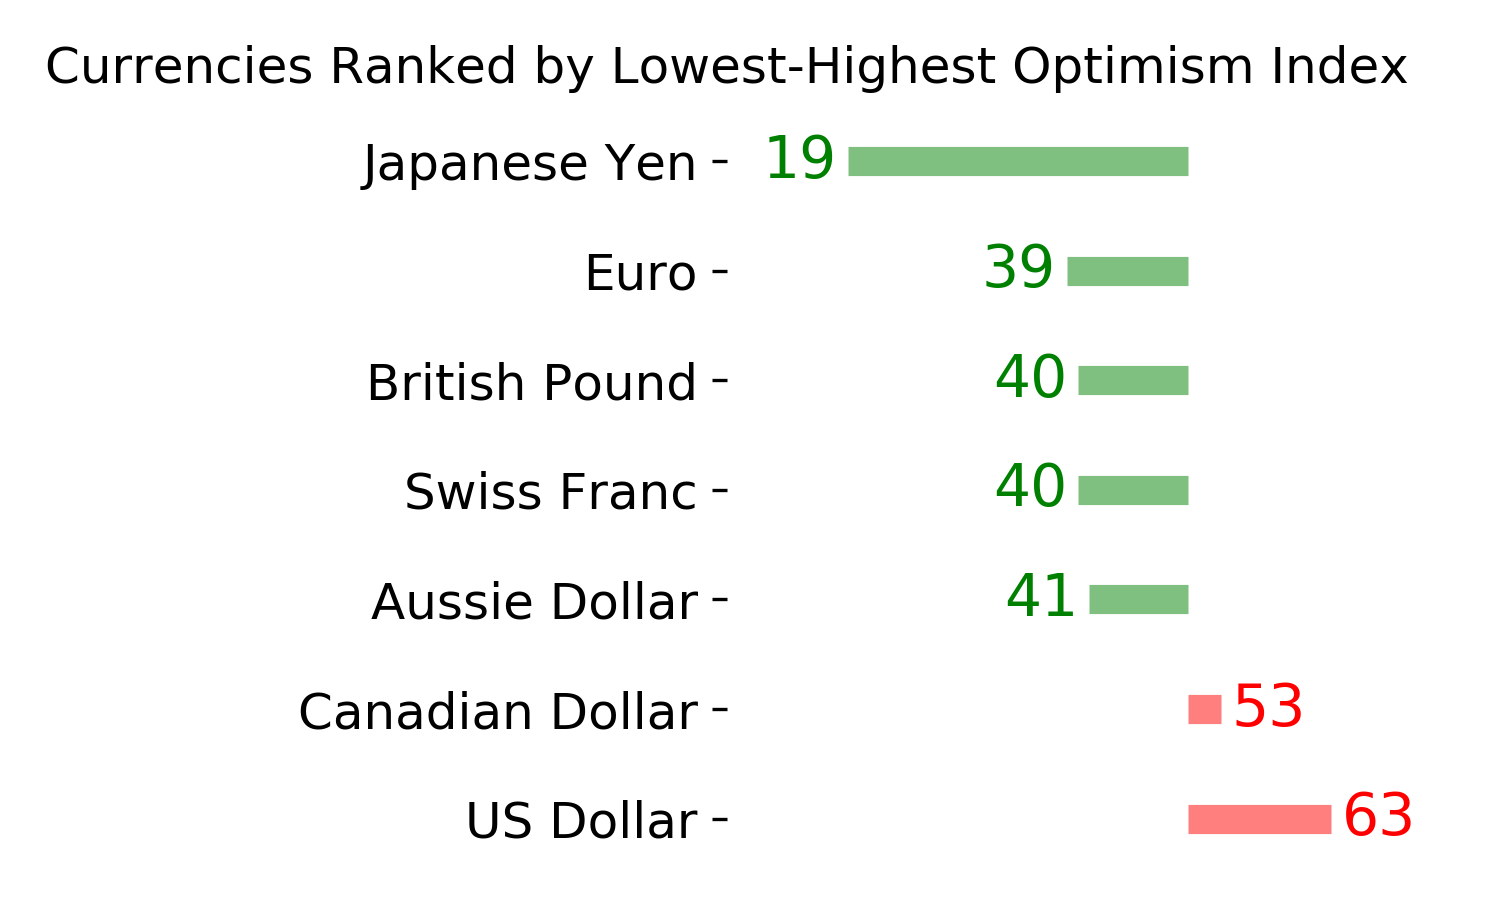
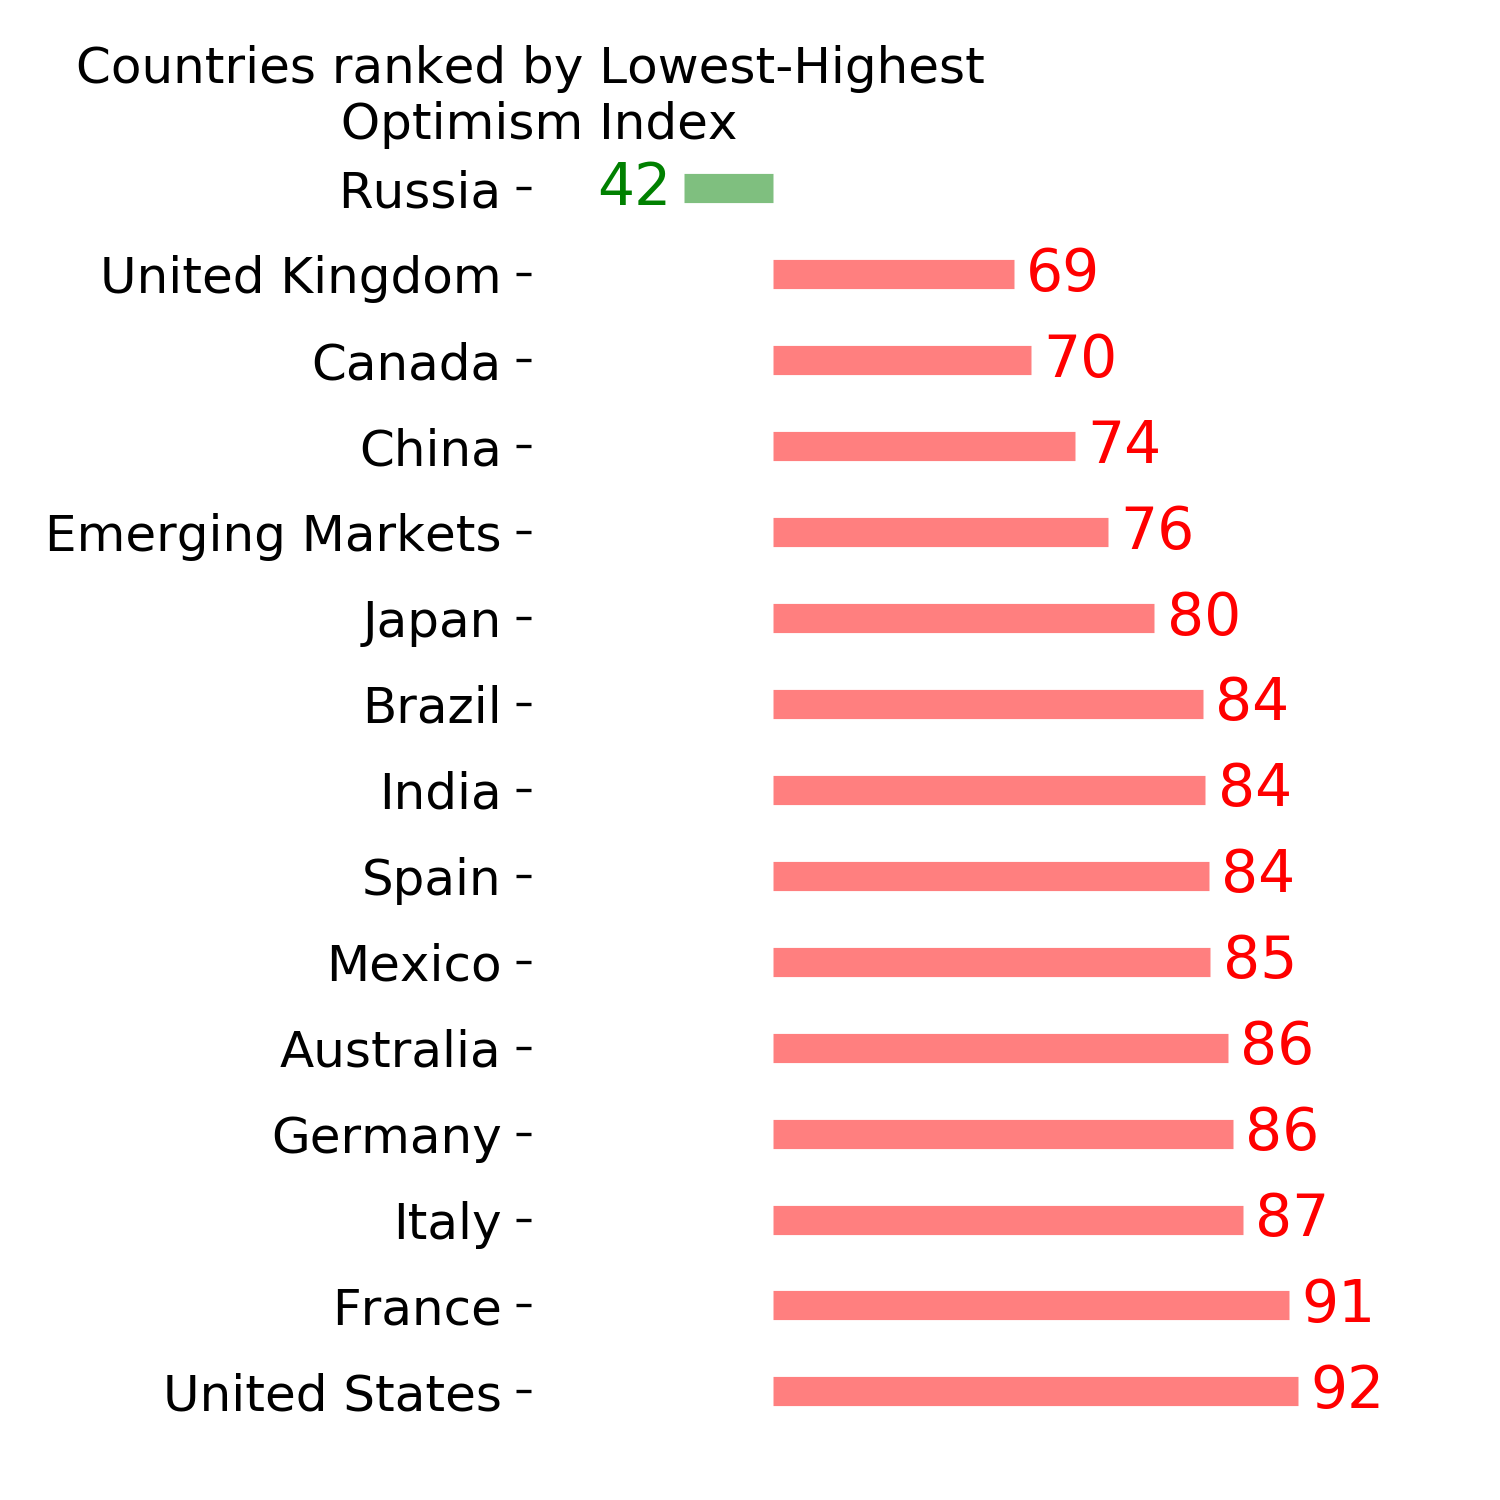
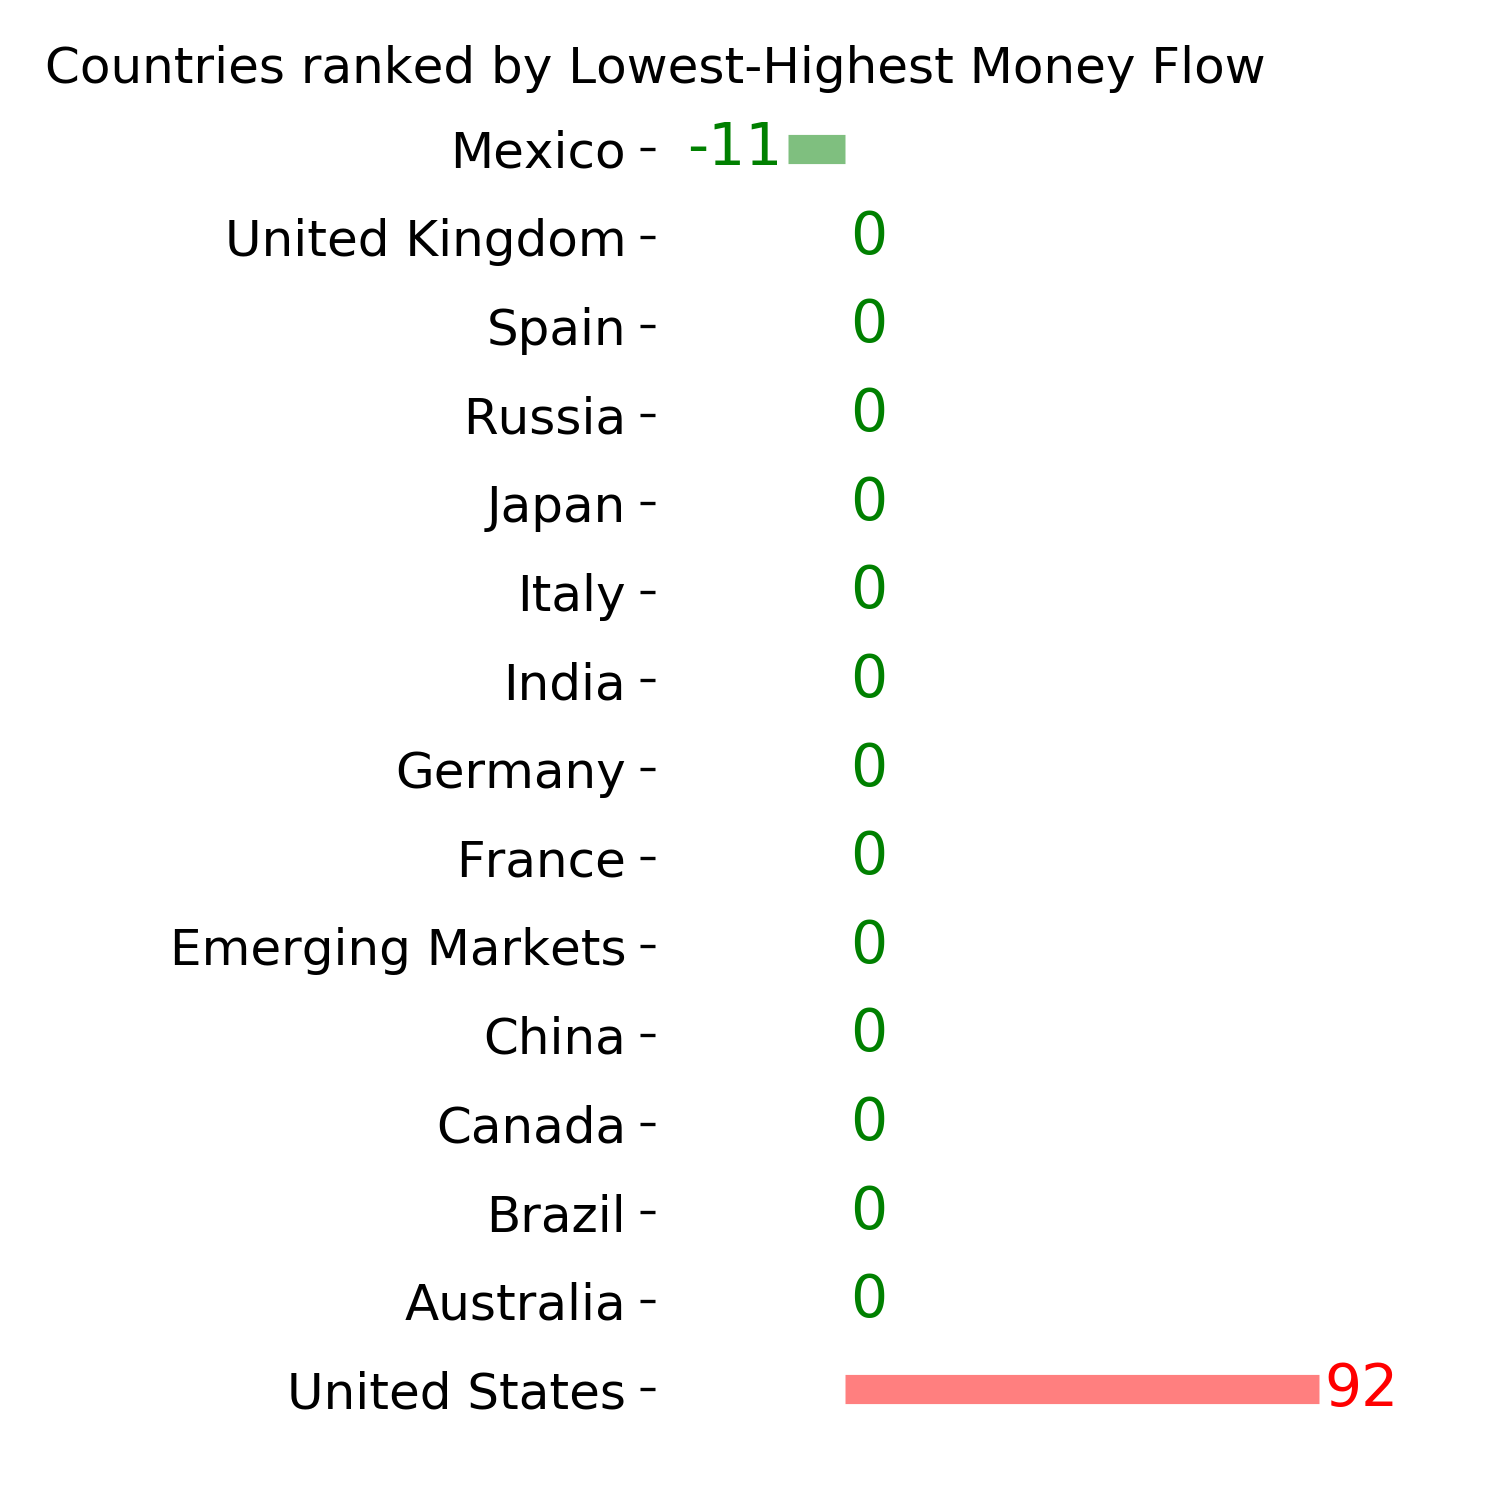
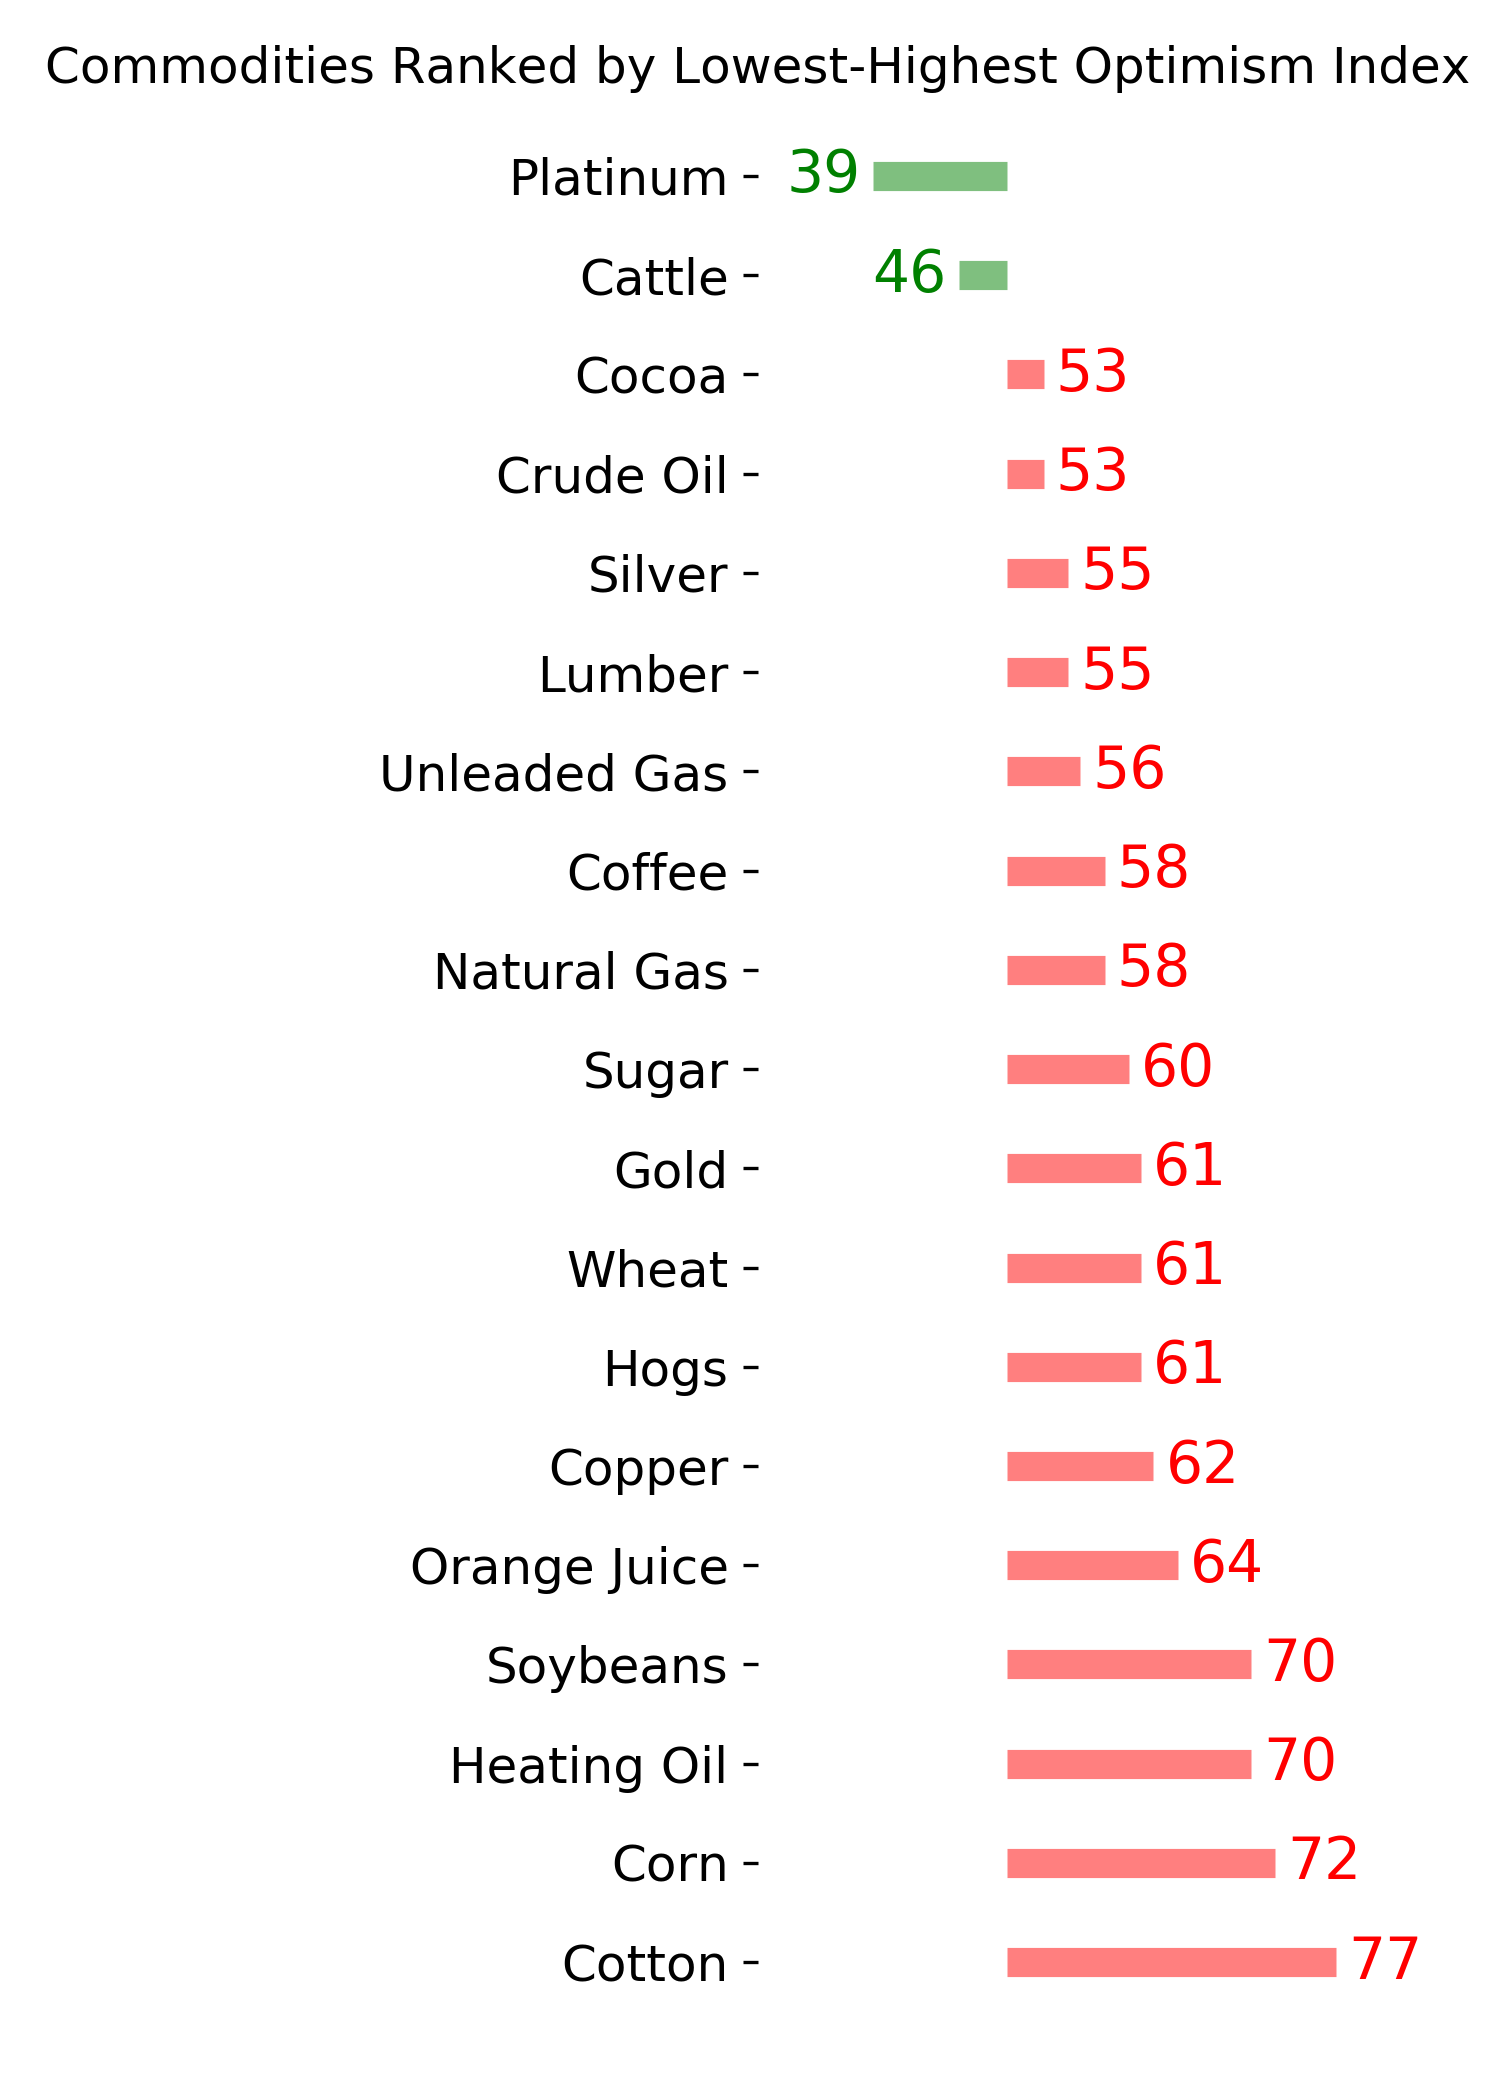
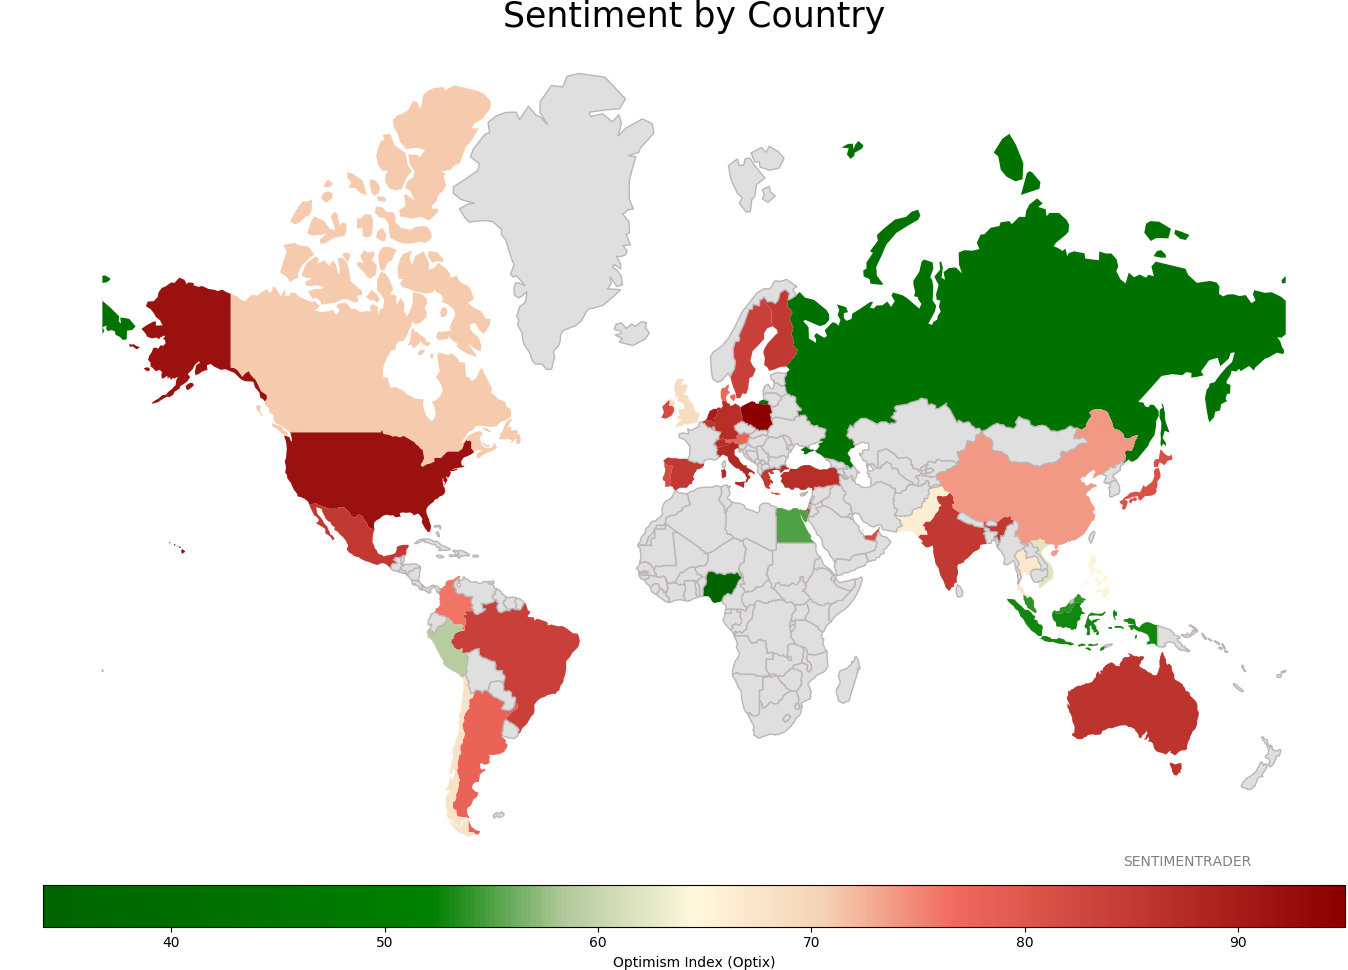
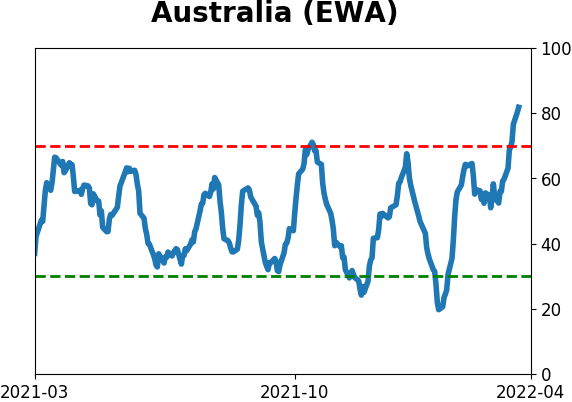
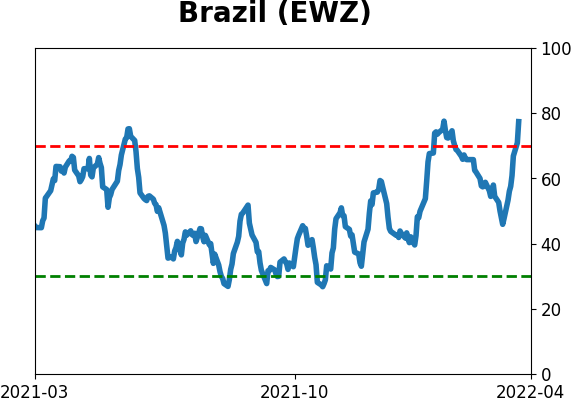
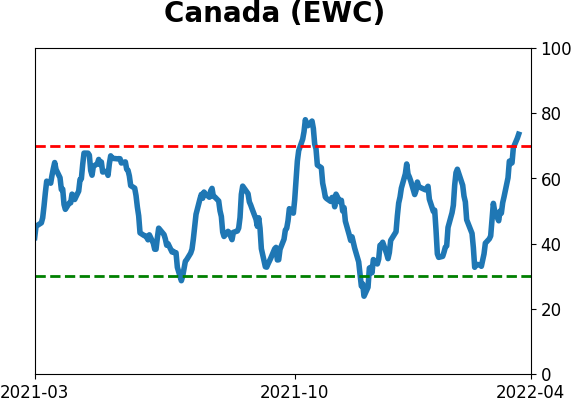
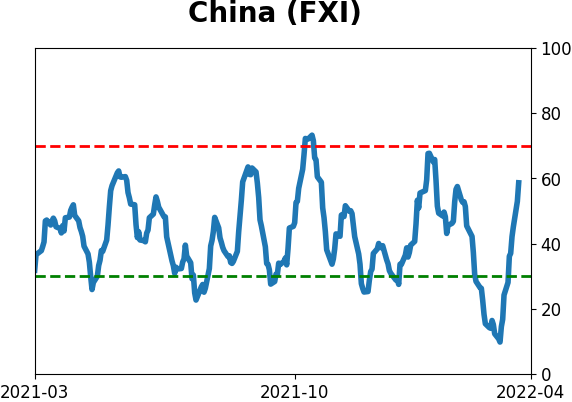
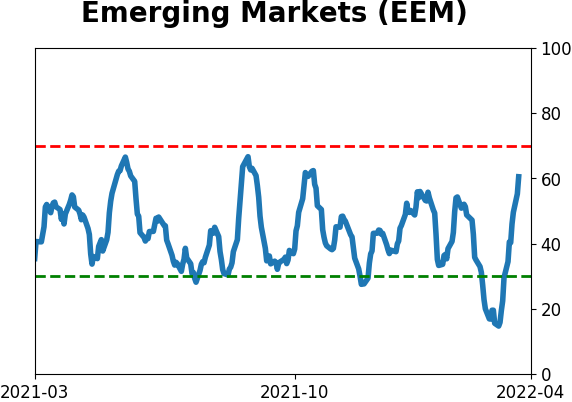
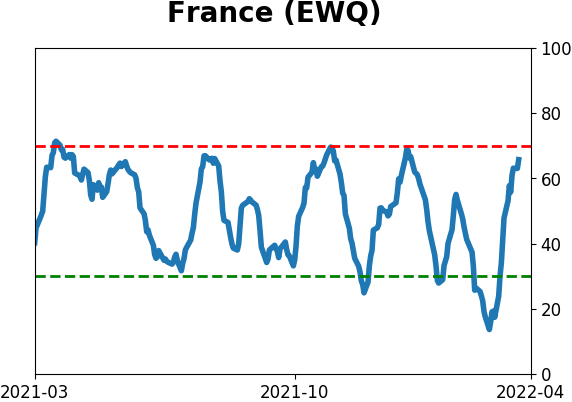
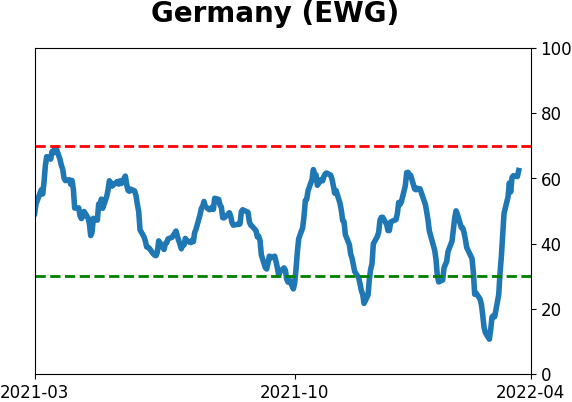
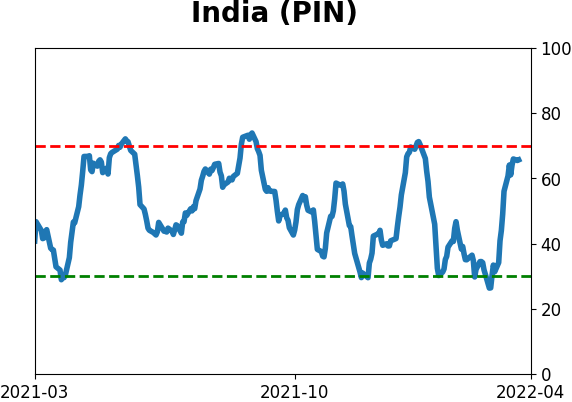
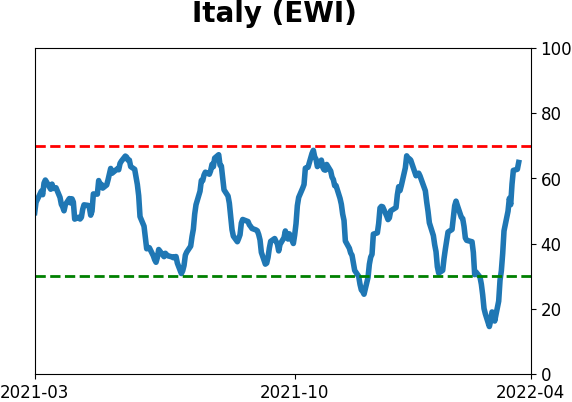
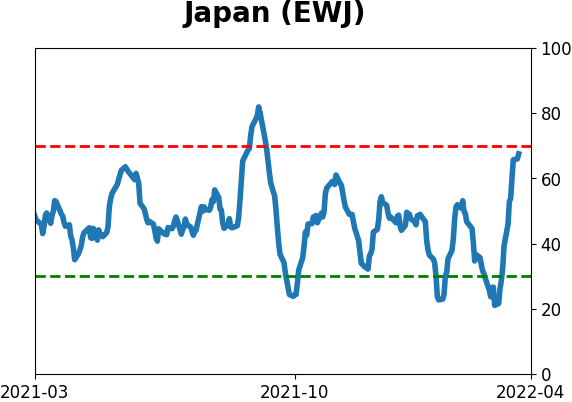
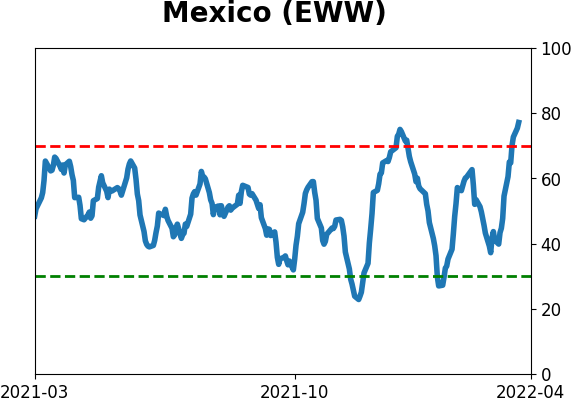
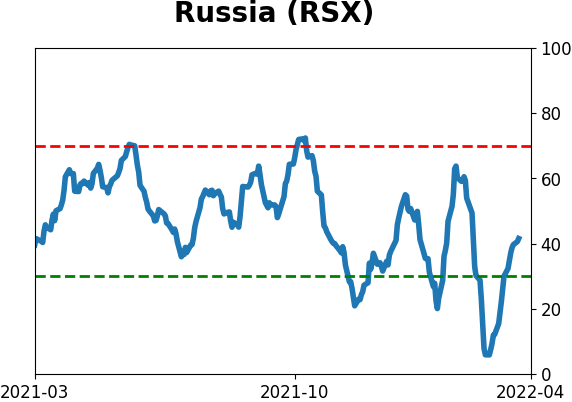
Sentiment Around The World
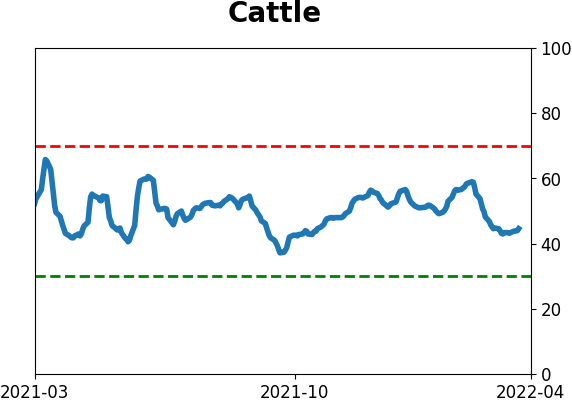
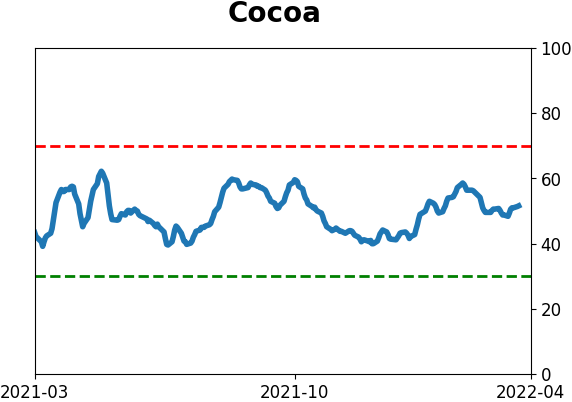
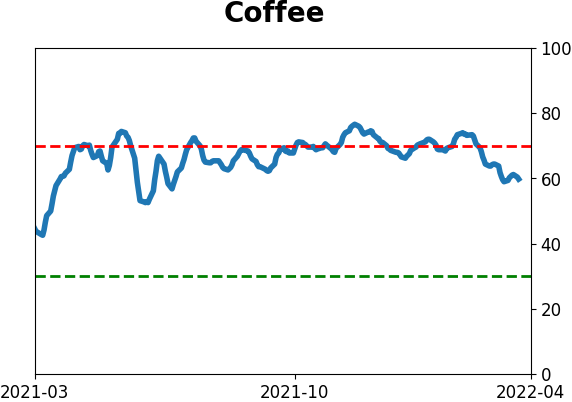
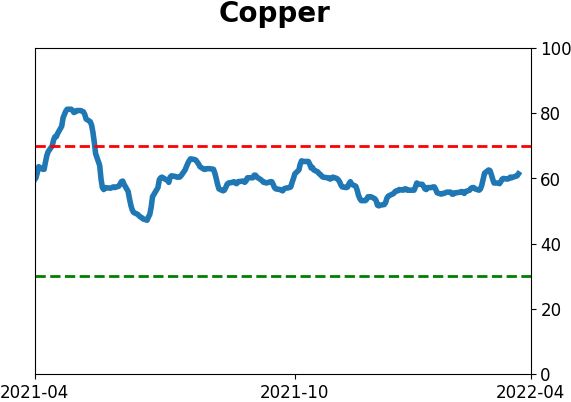
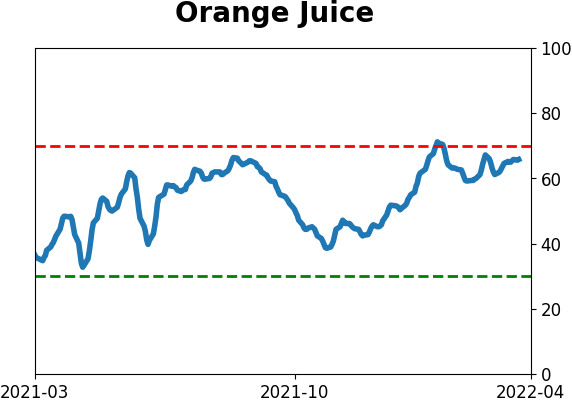
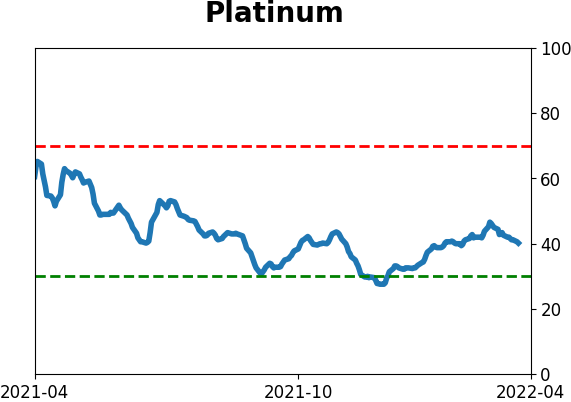
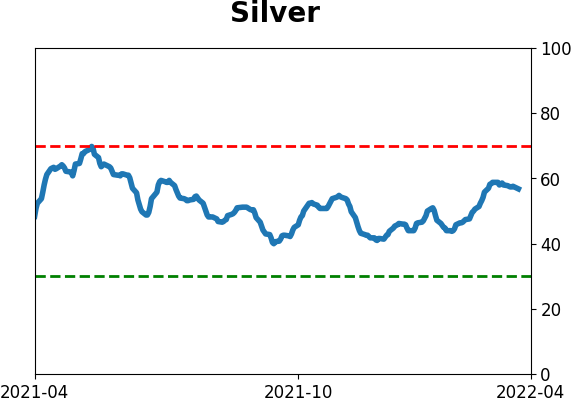
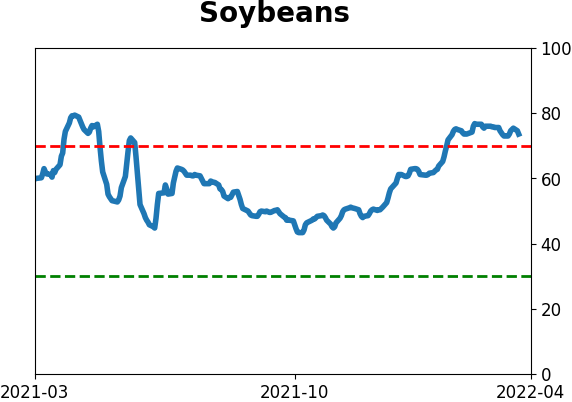
Optimism Index Thumbnails
|
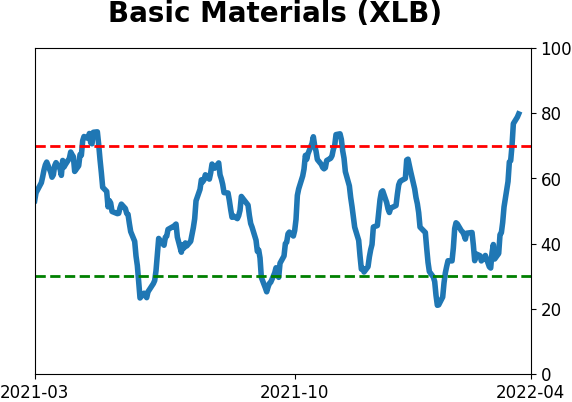
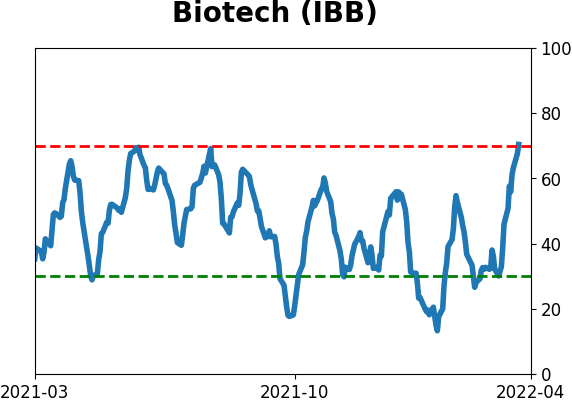
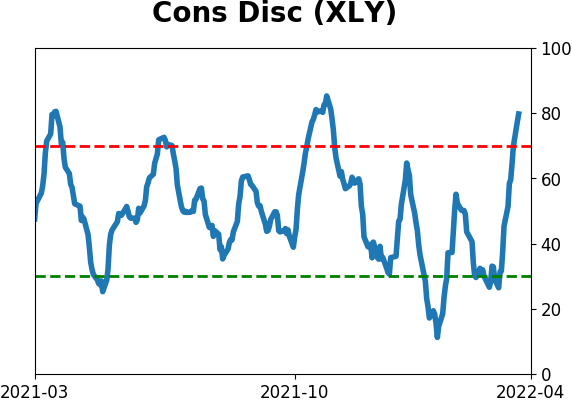
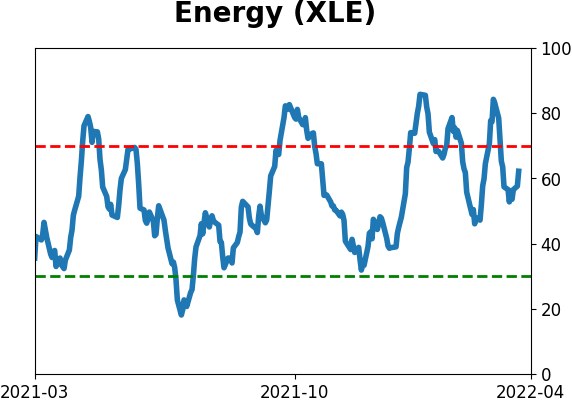
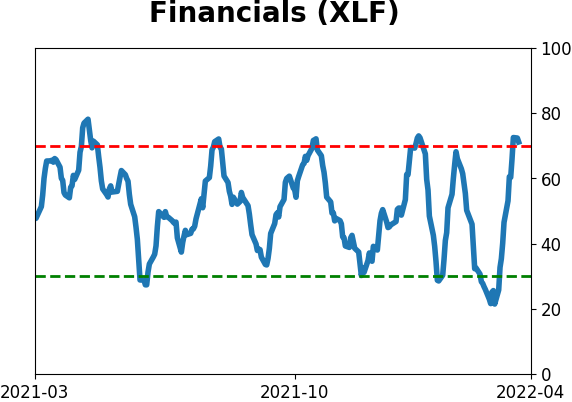
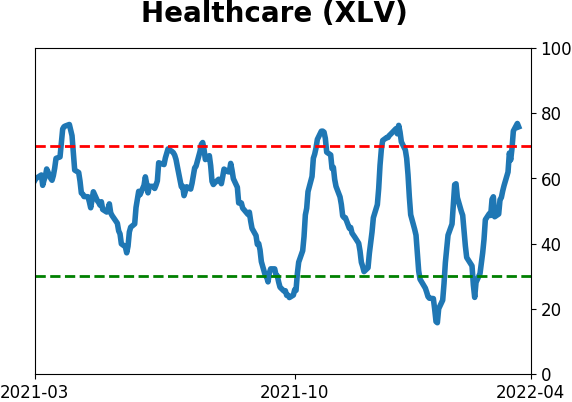
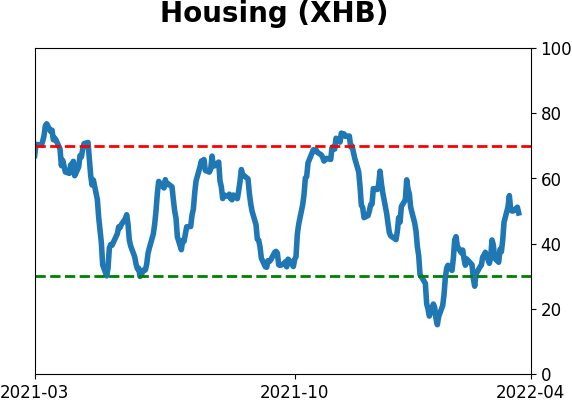
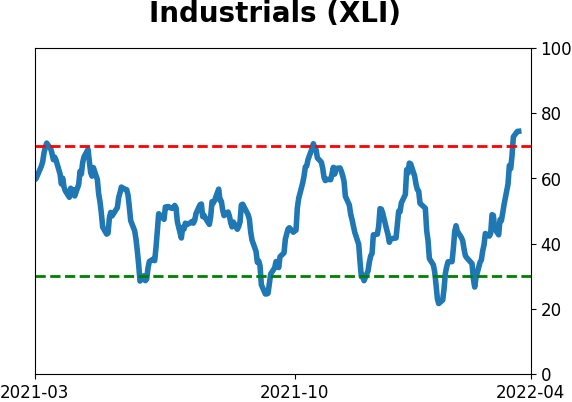
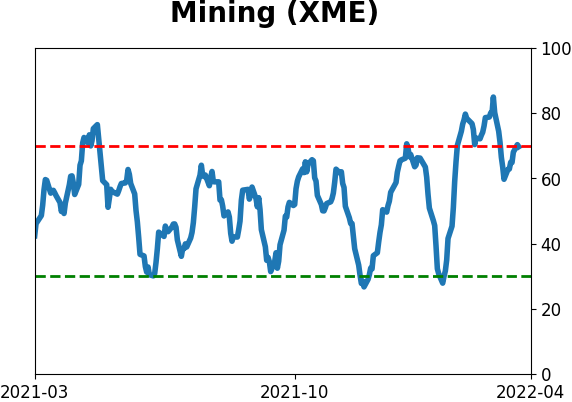
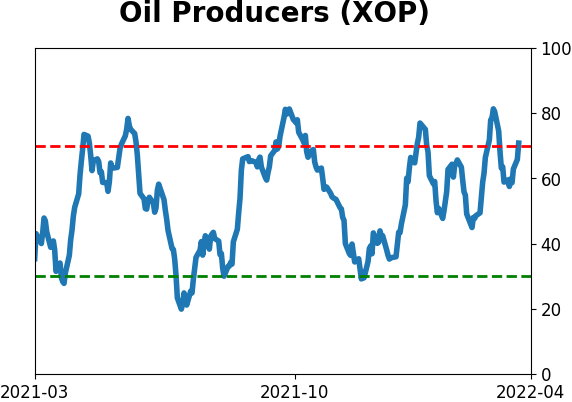
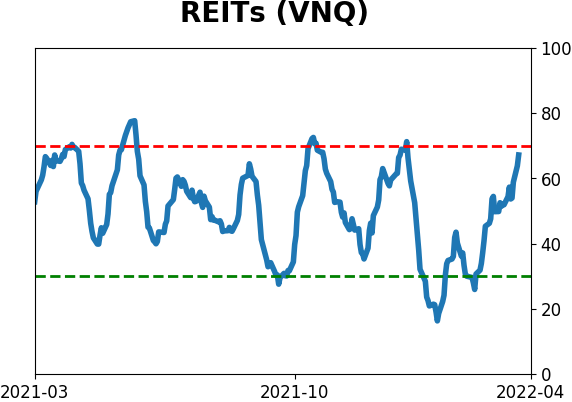
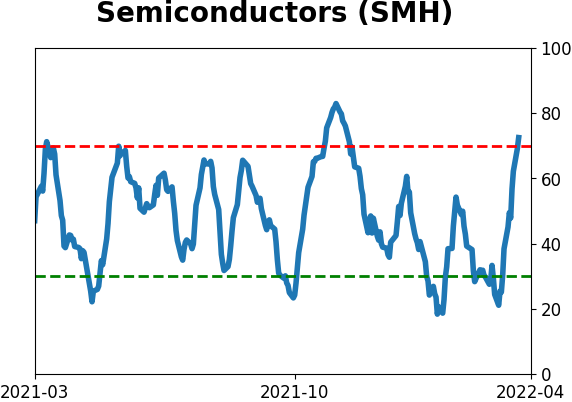
Sector ETF's - 10-Day Moving Average
|
|
|
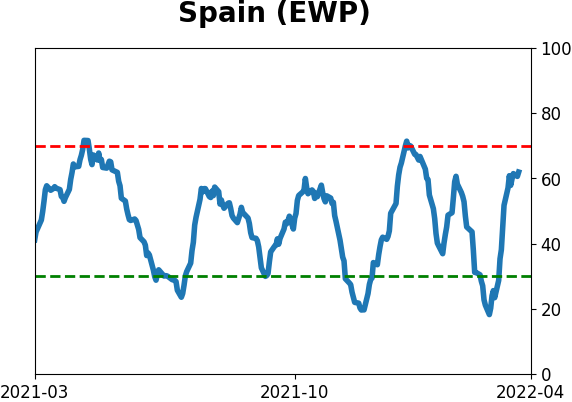
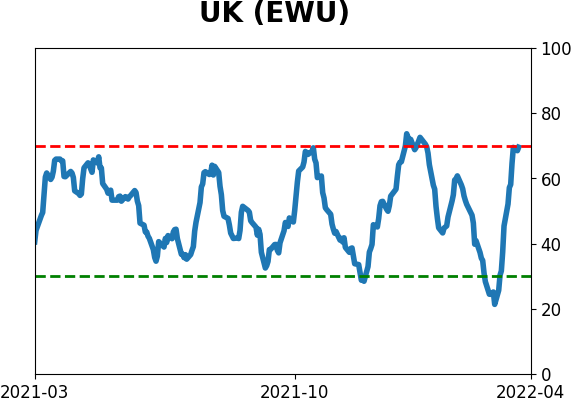
Country ETF's - 10-Day Moving Average
|
|
|
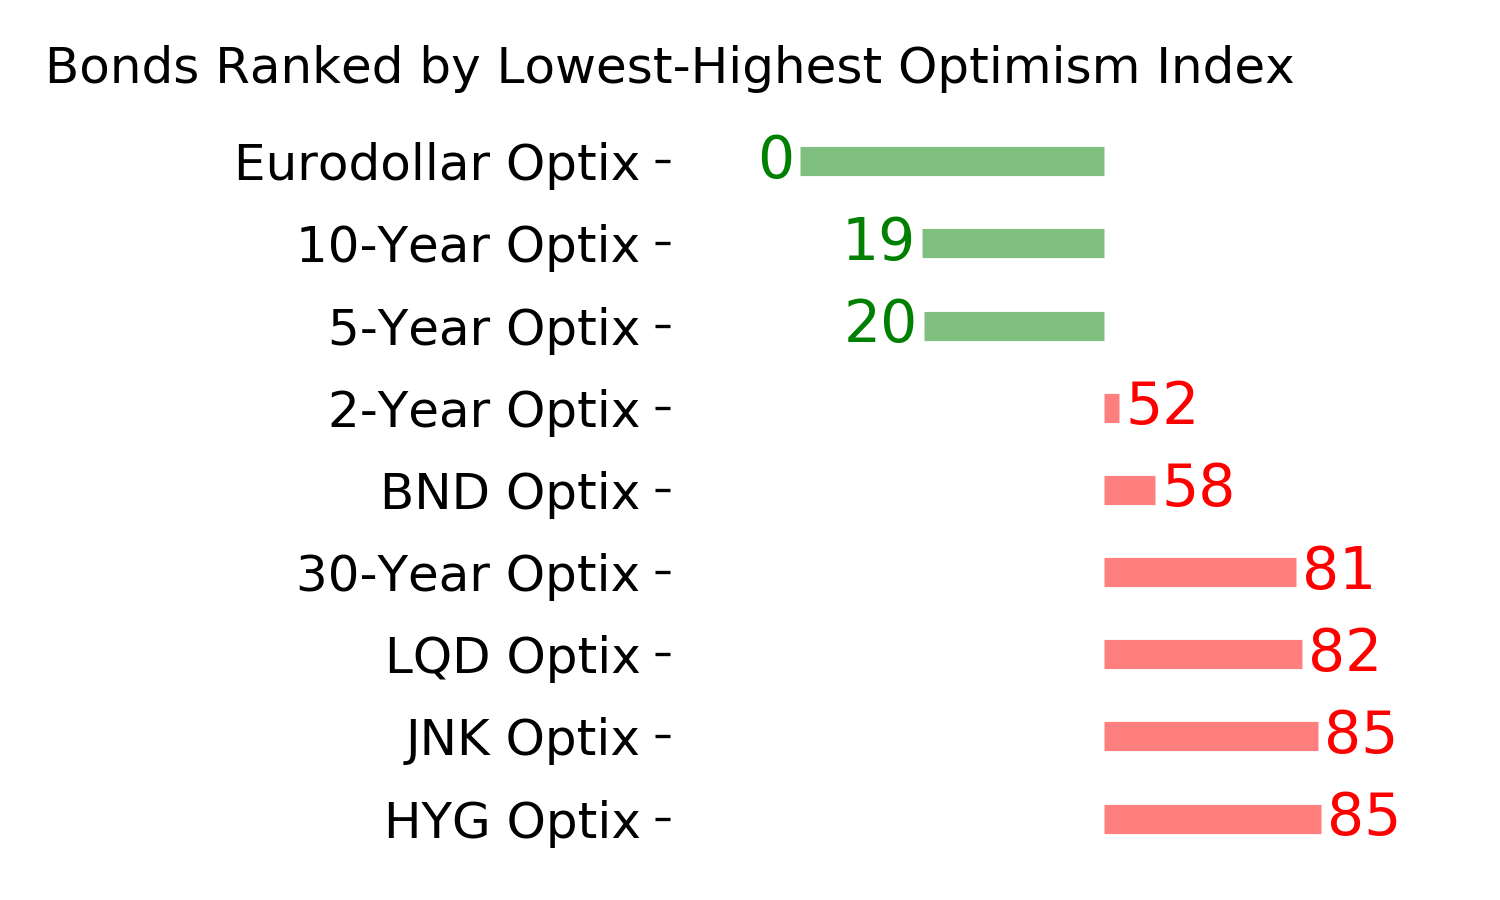
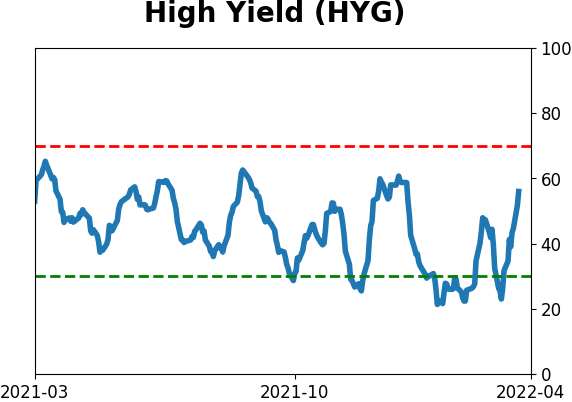
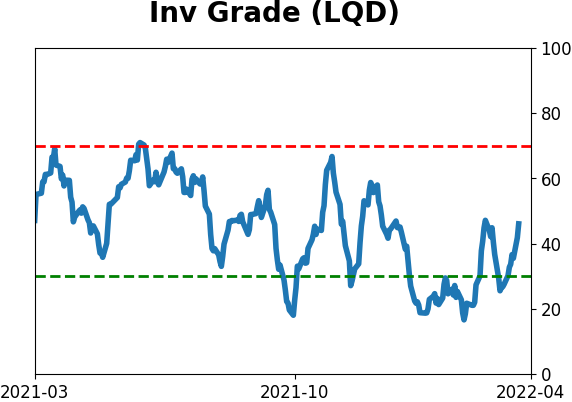
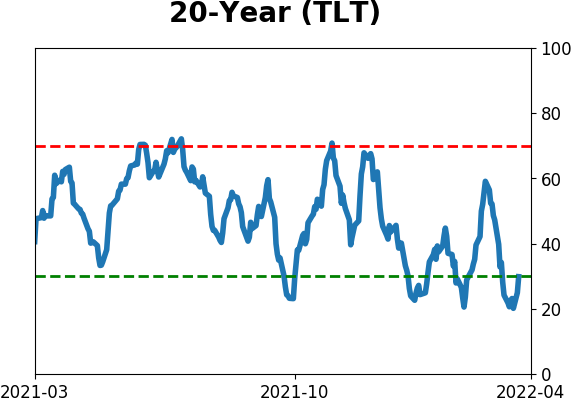
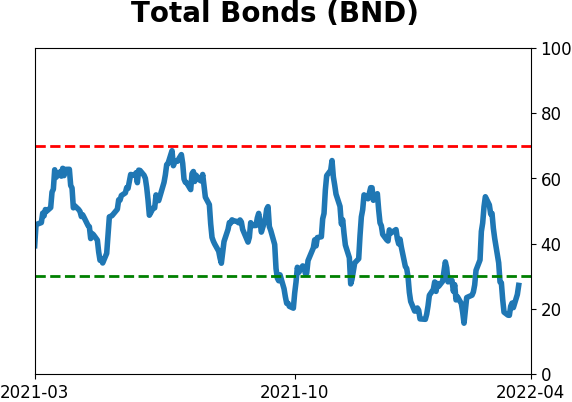
Bond ETF's - 10-Day Moving Average
|
|
|
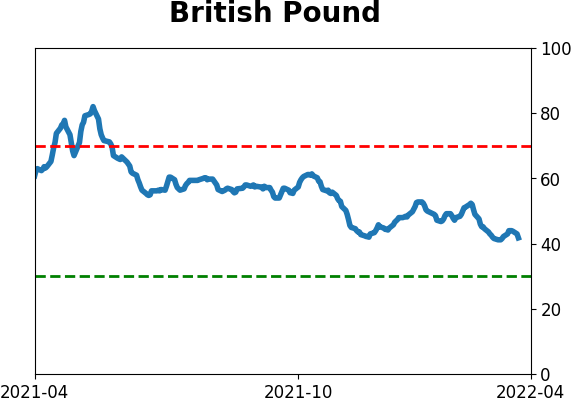
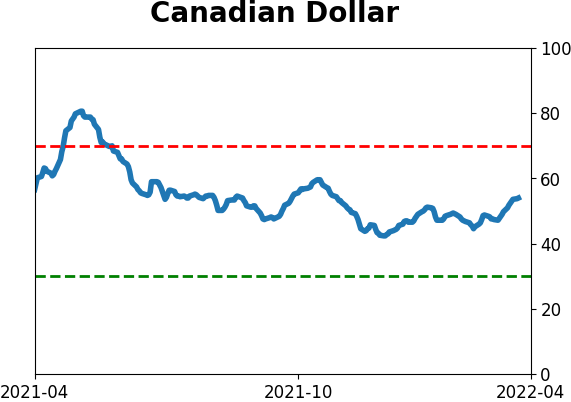
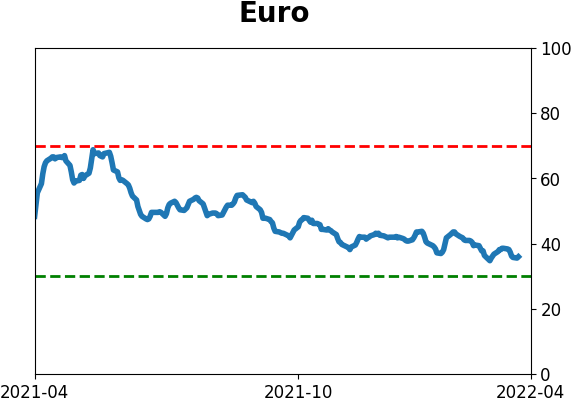
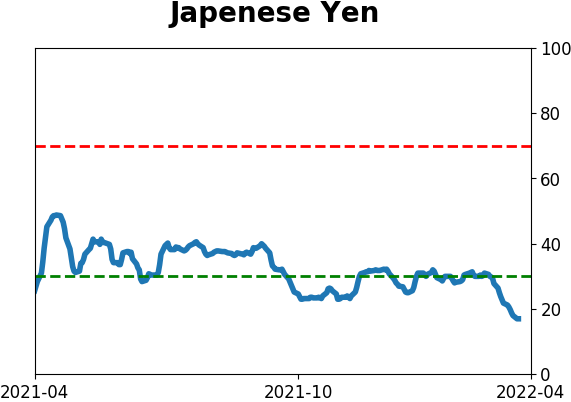
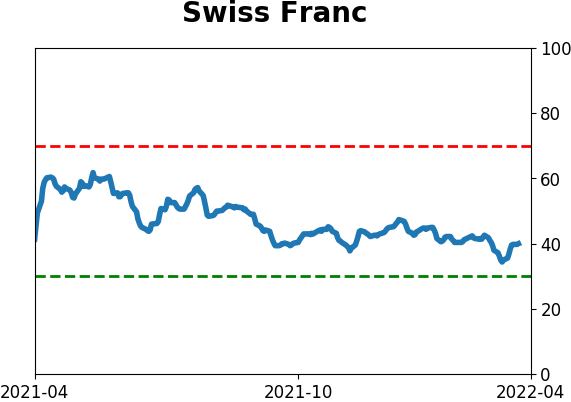
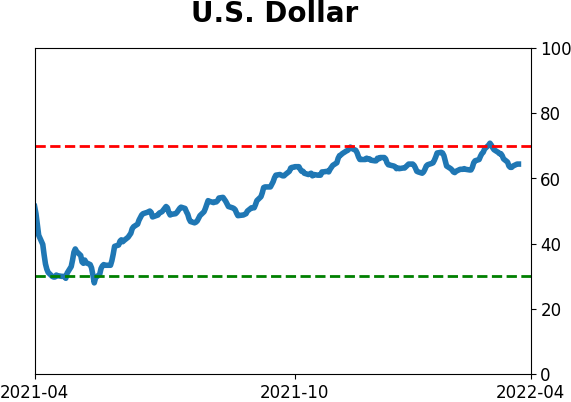
Currency ETF's - 5-Day Moving Average
|
|
|
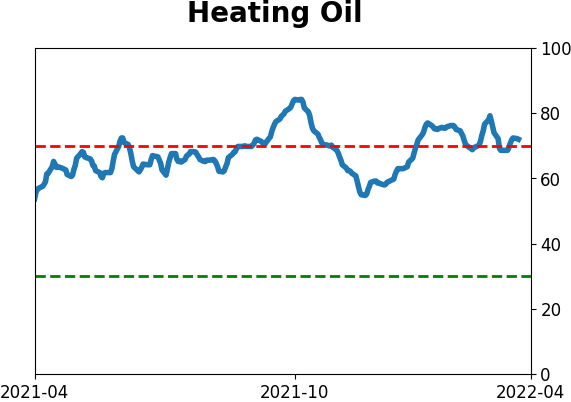
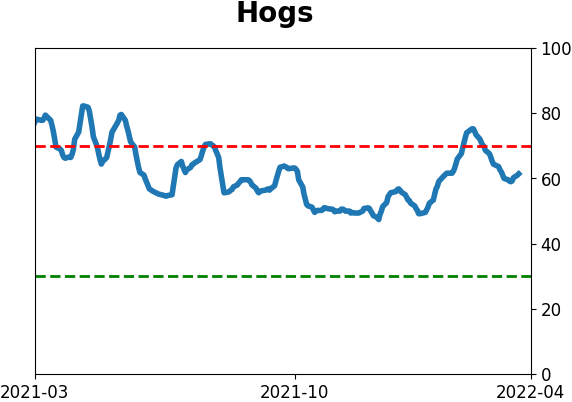
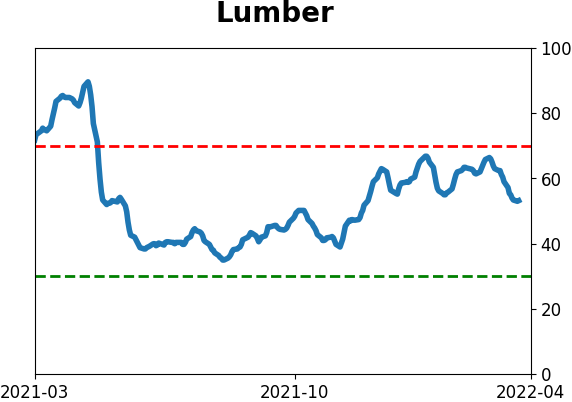
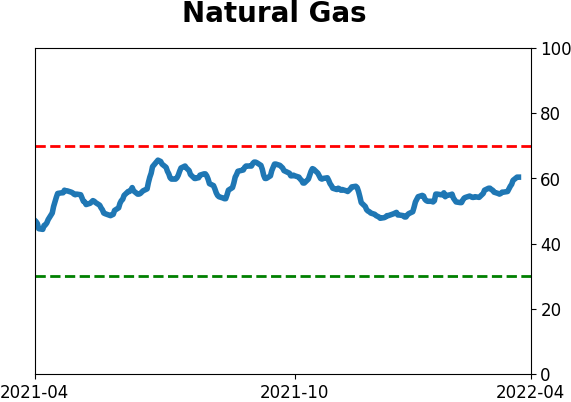
Commodity ETF's - 5-Day Moving Average
|
|