Headlines
|
|
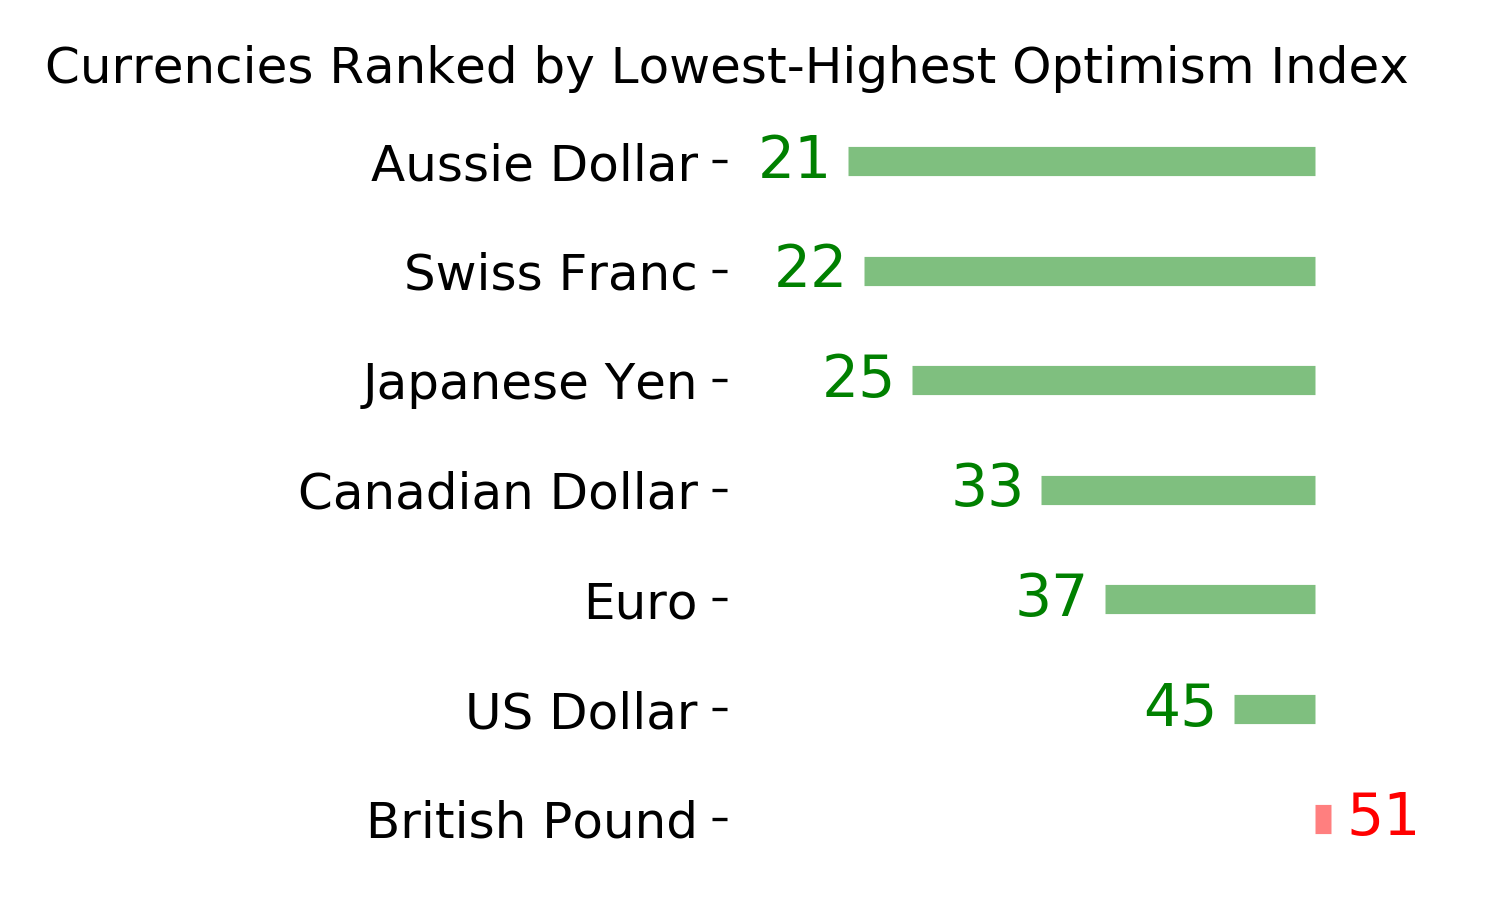
It's time to keep an eye on currencies:
History suggests that traders watch closely for a potential reversal of fortune for the U.S. Dollar and foreign currencies in the not too distant future.
|
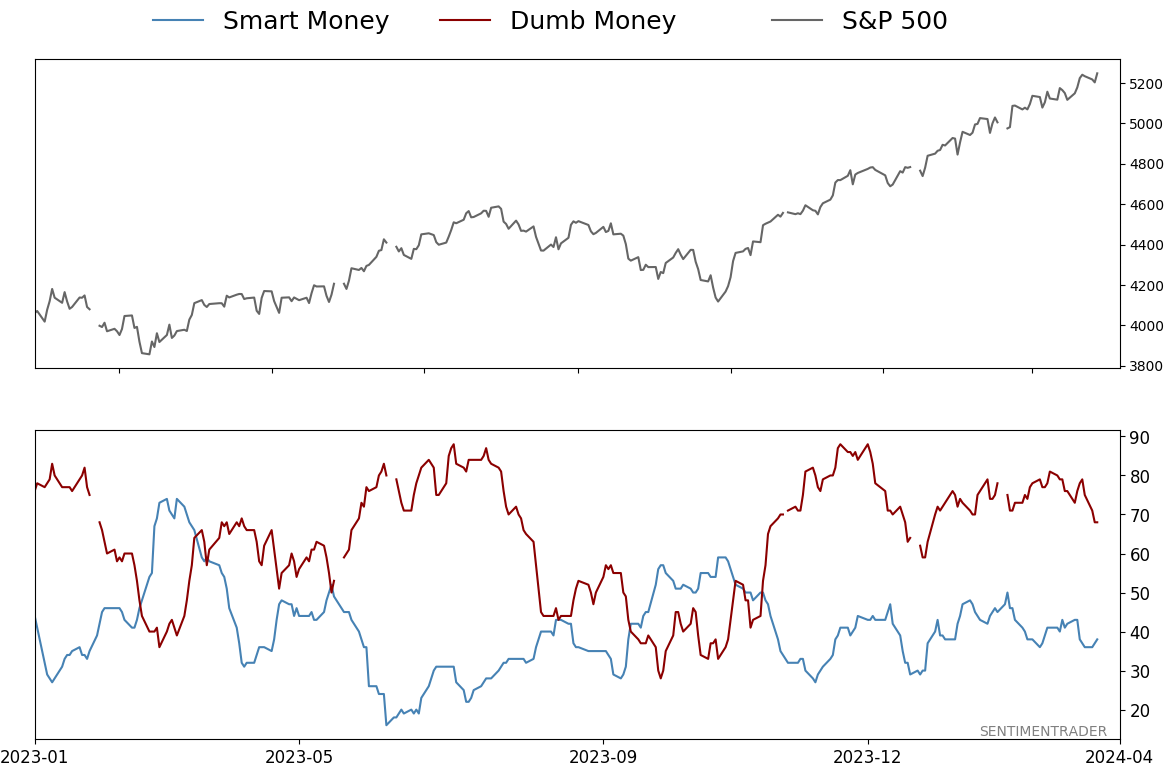
Smart / Dumb Money Confidence
|
Smart Money Confidence: 38%
Dumb Money Confidence: 68%
|
|
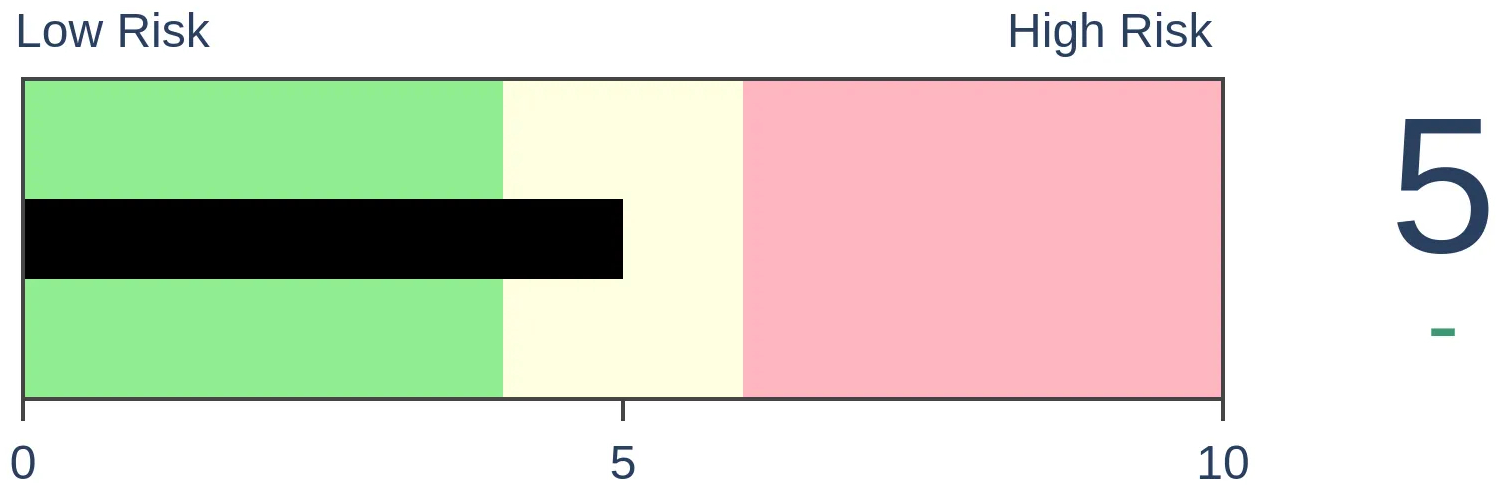
Risk Levels
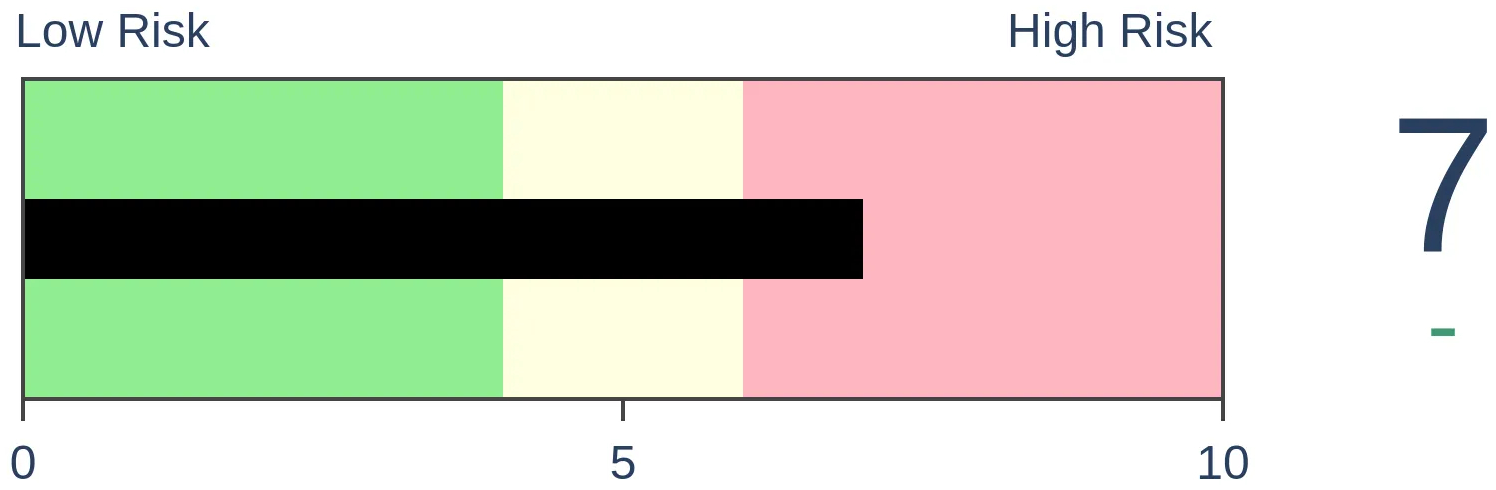
Stocks Short-Term
|
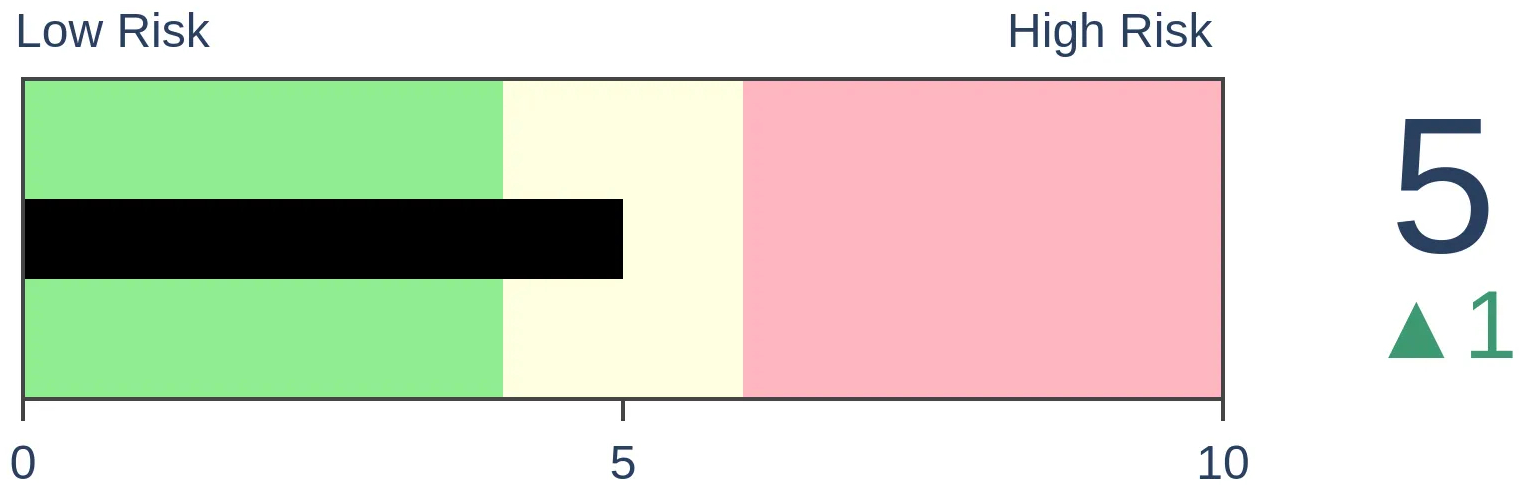
Stocks Medium-Term
|
|
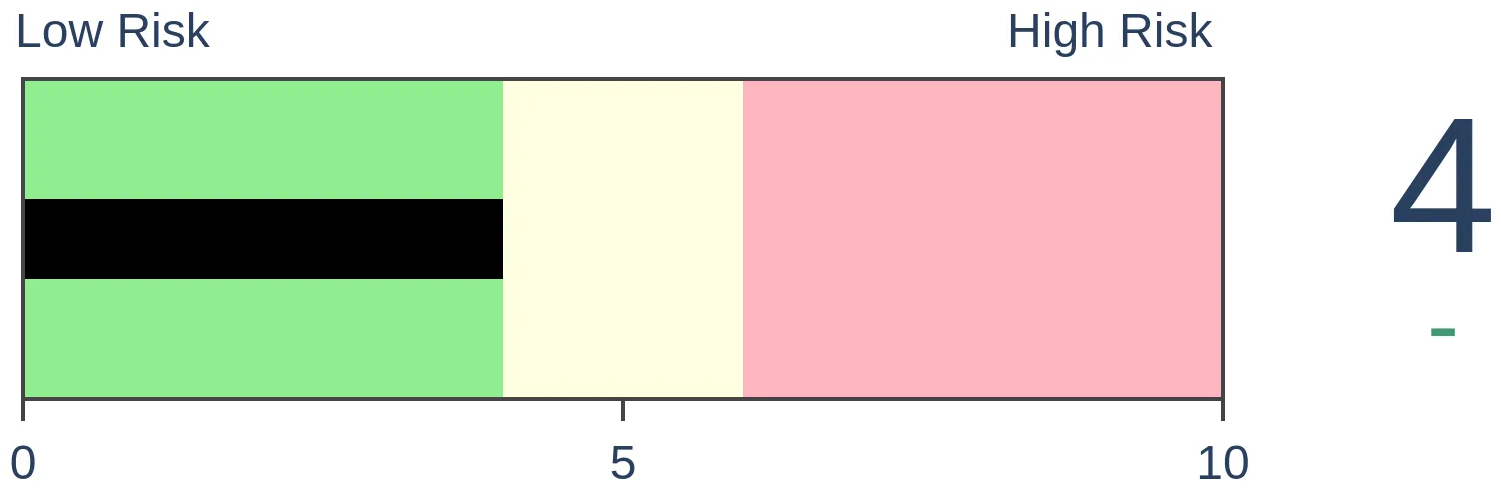
Bonds
|
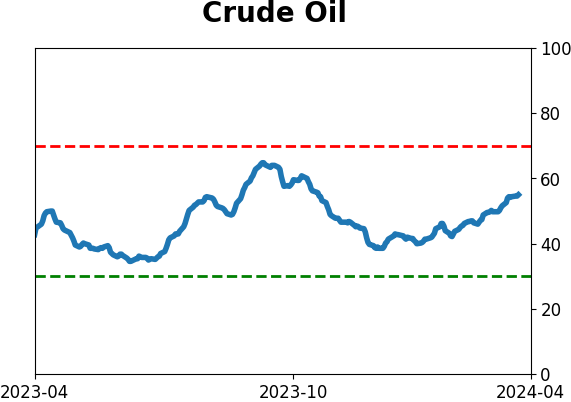
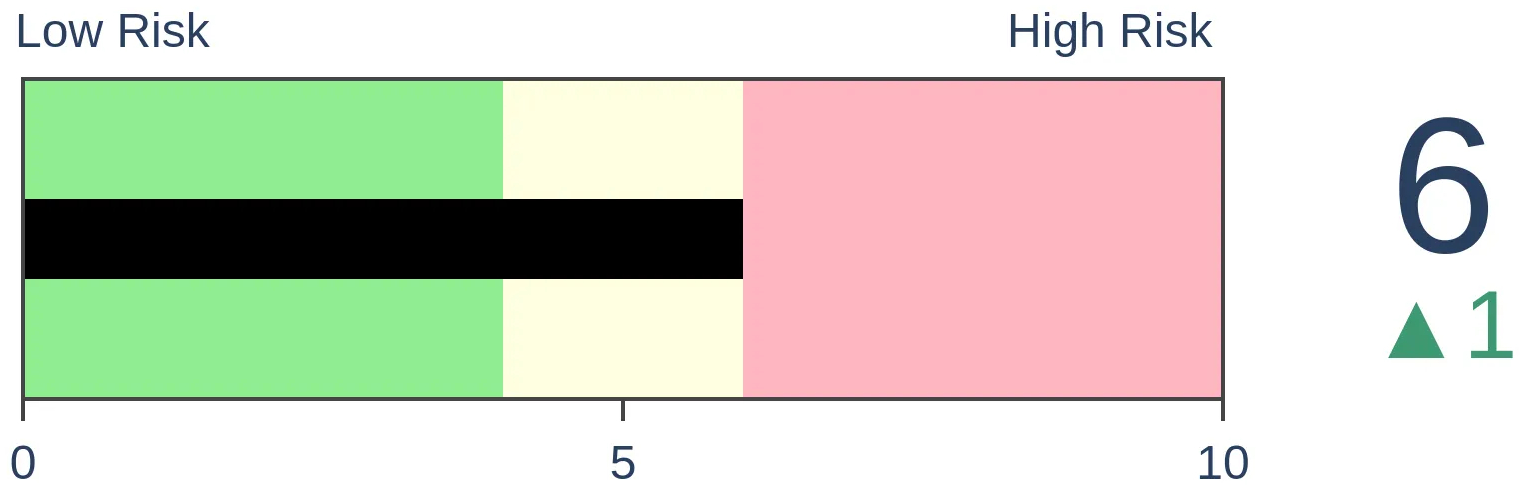
Crude Oil
|
|
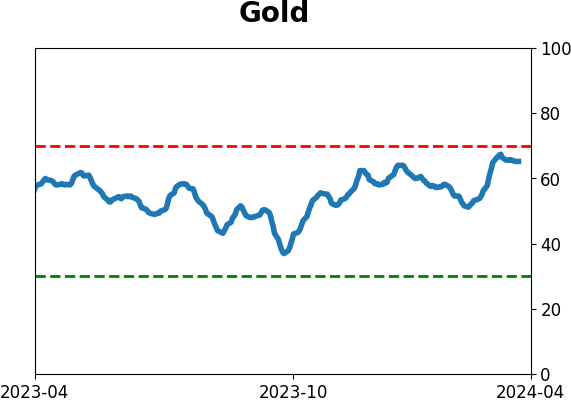
Gold
|
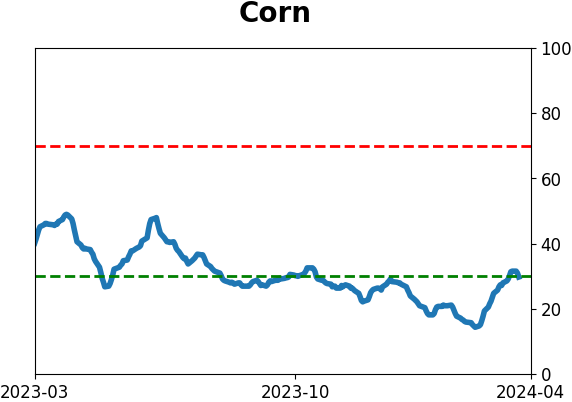
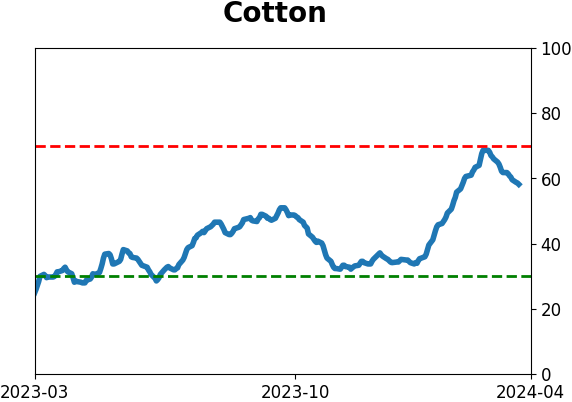
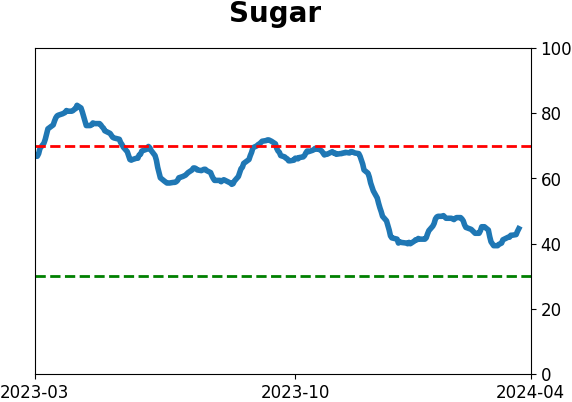
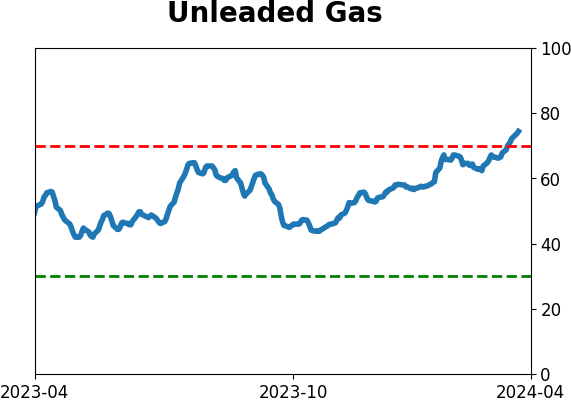
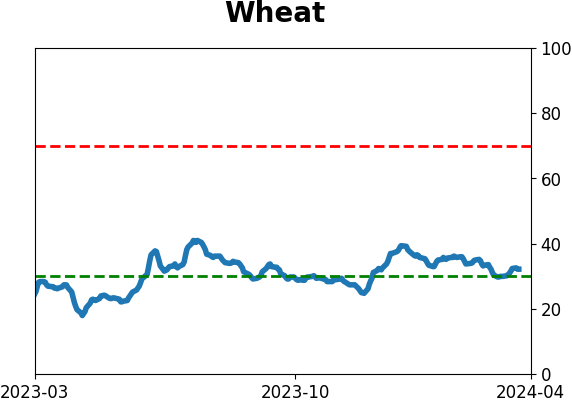
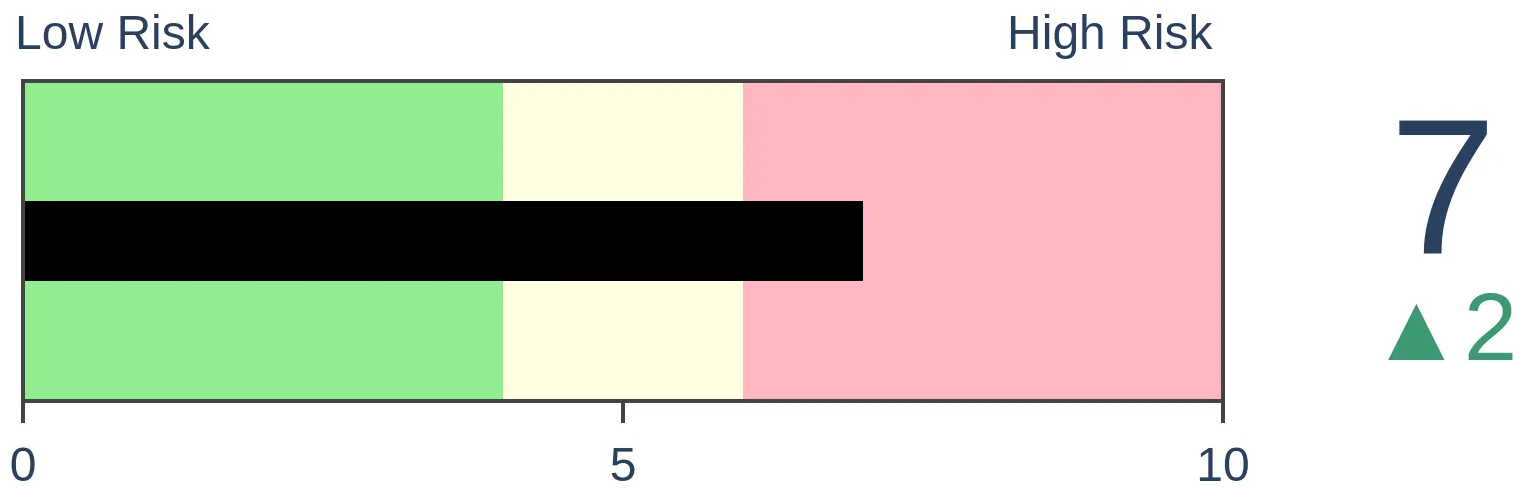
Agriculture
|
|
Research
By Jay Kaeppel
BOTTOM LINE
History suggests that traders watch closely for a potential reversal of fortune for the U.S. Dollar and foreign currencies in the not too distant future.
FORECAST / TIMEFRAME
None
|
Key points
- Over the past half-century, the US Dollar has shown a tendency to decline in value during late winter into mid-spring
- For now, the buck arguably remains in an uptrend
- Any sign of a reversal may highlight a trading opportunity in the dollar - as well as a host of foreign currencies, including the British Pound, the Canadian Dollar, and the Euro
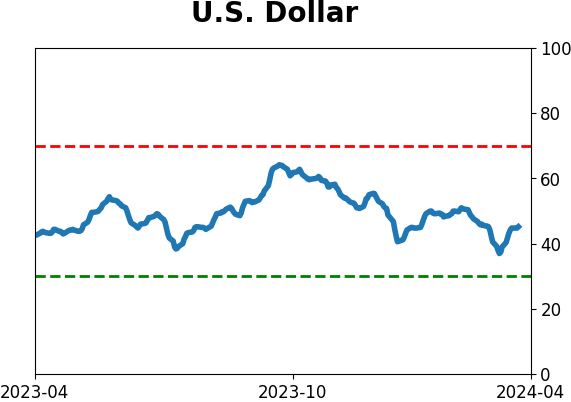
The US Dollar is nearing a decision point
The chart below shows that US Dollar futures are a) trading in a narrowing range and b) arguably attempting to establish a new uptrend.
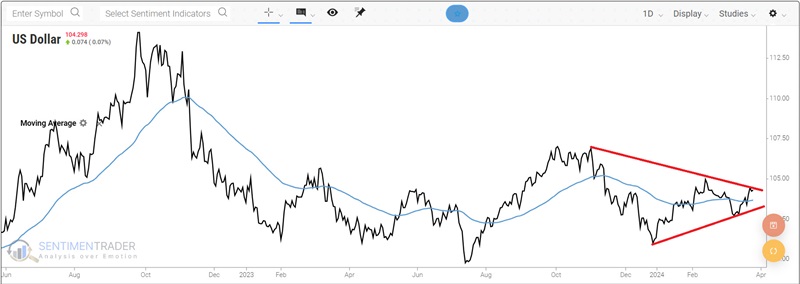
The second point is somewhat subjective and is based primarily on two higher lows and is presently trading above its 70-day exponential moving average. Where to from here? Anyone can put forth a prediction. But one thing that may help is to review a bit of history and try to put the odds on our side.
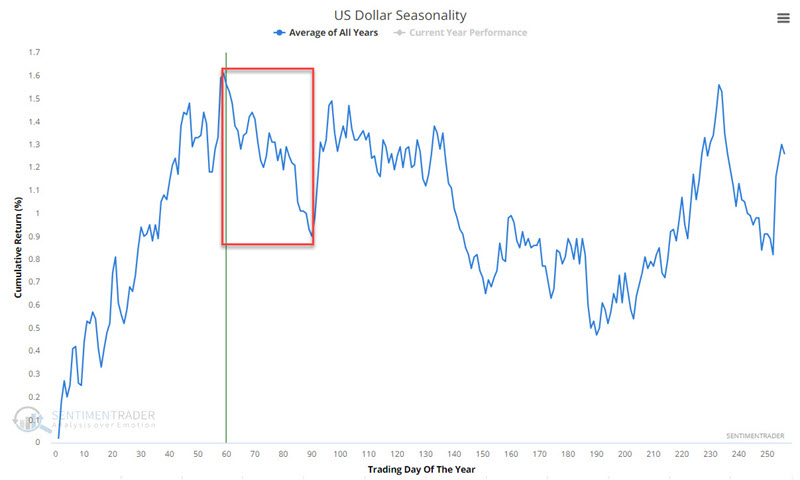
The chart below displays the annual seasonal trend for Dollar futures. Note that this market has entered an unfavorable seasonal period that extends from TDY #59 through TDY #90. For 2024, this period extends from the close on 2024-03-22 through 2024-05-06.
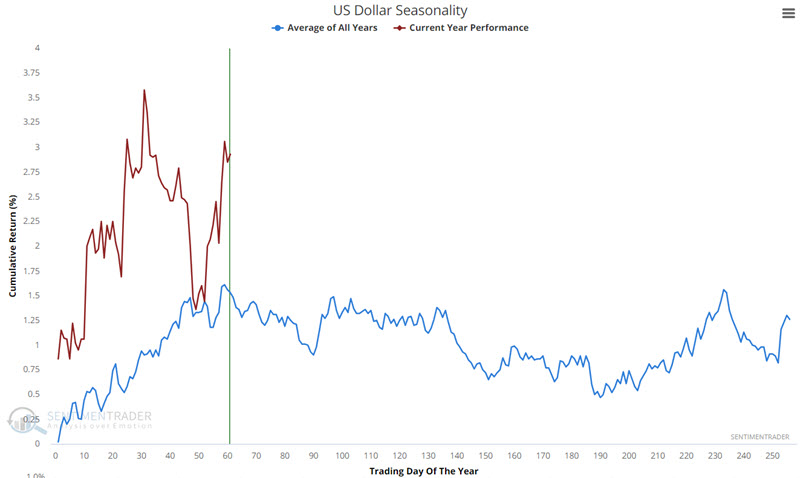
The chart below displays the annual seasonal trend versus the actual price action for this year for US Dollar futures.
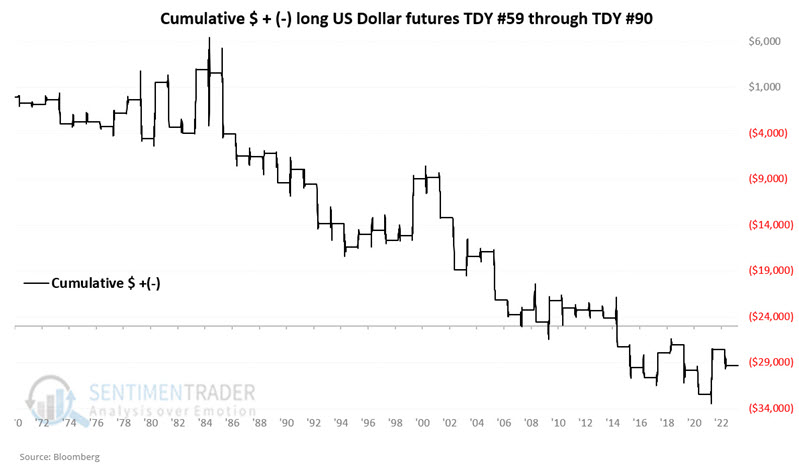
The chart below displays the hypothetical cumulative $ +(-) achieved by holding a long position in US Dollar futures only during TDY #59 through TDY #90 every year since 1971.
(NOTE: For this market and all that follow we use a database of futures data from Bloomberg. For any dates before the time that futures started trading, Bloomberg calculates "theoretical" futures values based on historical cash prices. We like this database because it allows for a longer backtest. Also, in recent years, this database includes many US Holidays on which electronic trading takes place and so counted as a trading day).
The table below summarizes US Dollar futures performance during this seasonal period.
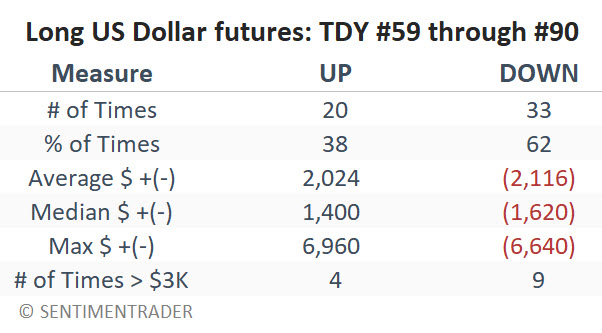
The results show a long-term downside bias but are far from a sure thing. Hence, we suggest that traders pay especially close attention to currency price action in the weeks ahead and look for an actual downside price reversal rather than trading based solely on seasonality alone (which is rarely a good idea).
Generally speaking, when the US Dollar weakens, foreign currencies tend to show strength. Let's consider some other currency markets. For the British Pound, the Canadian Dollar, and Euro futures, the relative seasonal period extends from the close of TDY #60 through TDY #87. For 2024, this period runs from 2024-03-22 through 2024-04-30.
The British Pound
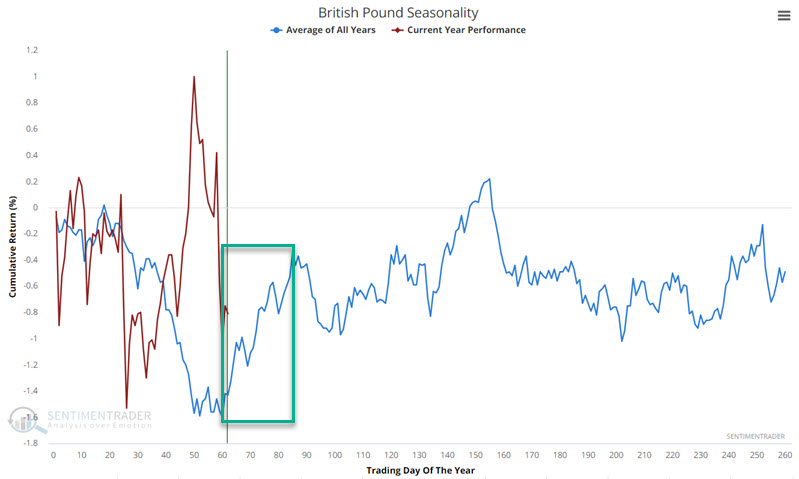
The chart below displays the annual seasonal trend versus the actual price action for the British Pound futures this year.
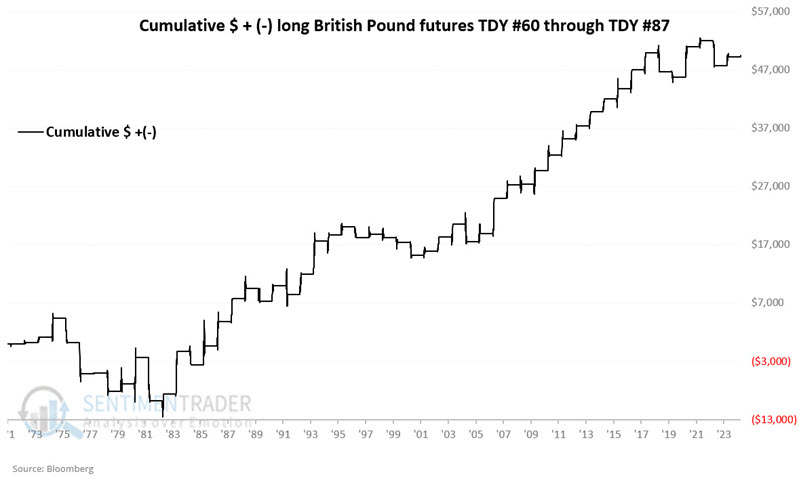
The chart below displays the hypothetical cumulative $ +(-) achieved by holding a long position in British Pound futures only during TDY #60 through TDY #87 every year since 1971.
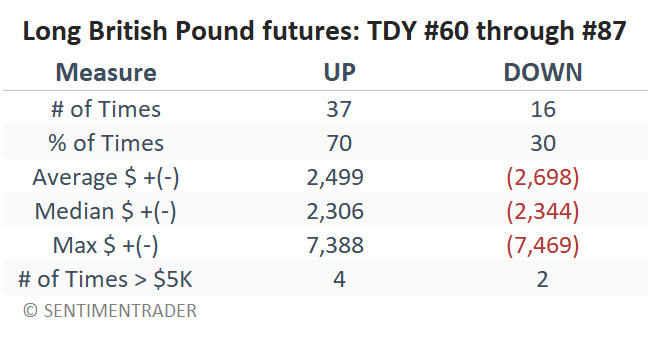
The table below summarizes the British Pound futures performance during this seasonal period.
The Canadian Dollar
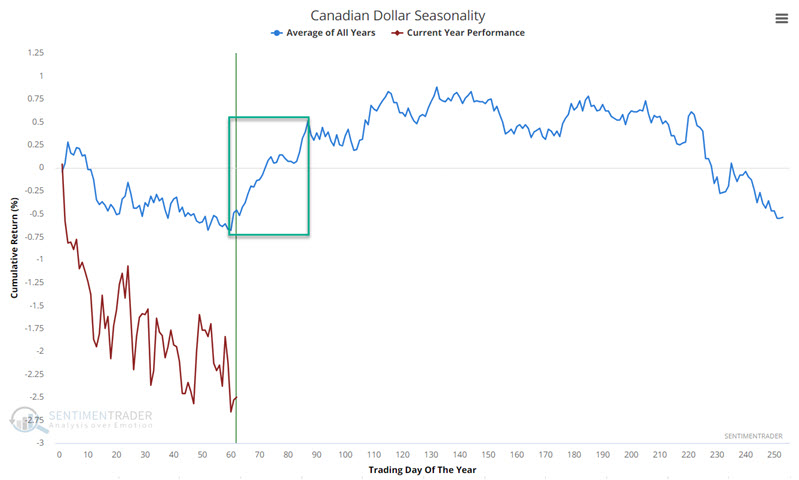
The chart below displays the annual seasonal trend versus the actual price action for tanadian Dollar futures. this year
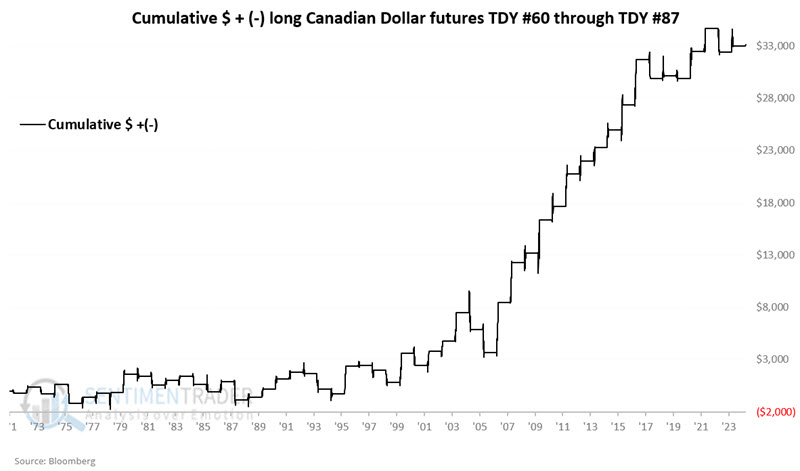
The chart below displays the hypothetical cumulative $ +(-) achieved by holding a long position in Canadian Dollar futures only during TDY #60 through TDY #87 every year since 1971.
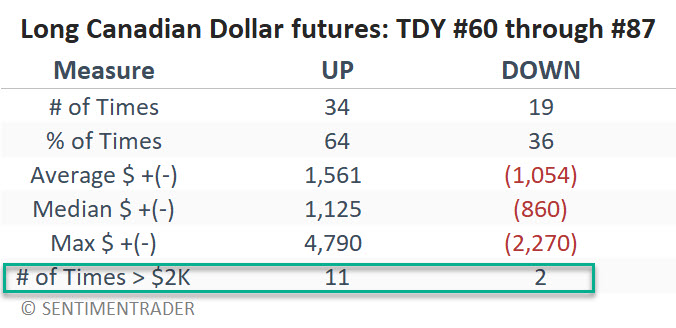
The table below summarizes Canadian Dollar futures performance during this seasonal period.
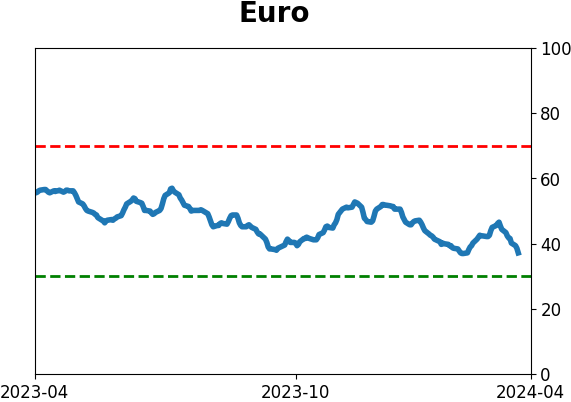
Euro futures
The chart below displays the annual seasonal trend versus the actual price action for thro futures.
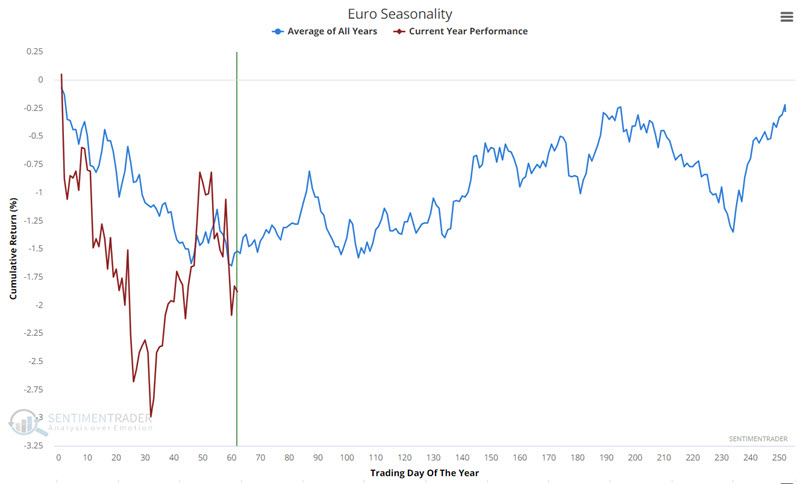
this yearThe chart below displays the hypothetical cumulative $ +(-) achieved by holding a long position in Euro futures only during TDY #60 through TDY #87 every year since 1975.
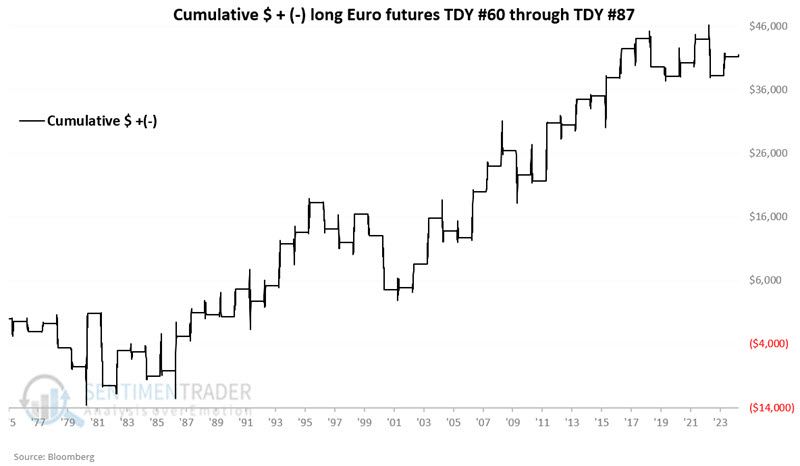
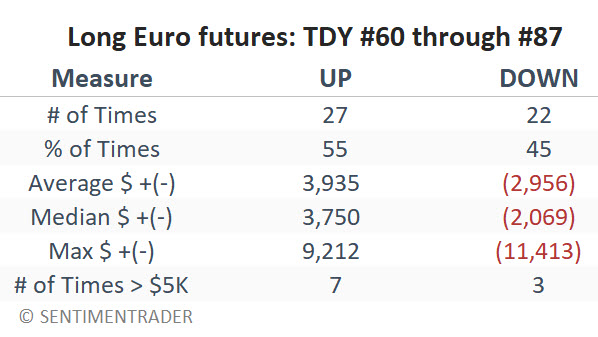
The table below summarizes Euro futures performance during this seasonal period.
ETF alternatives for non-futures traders
A handful of ETFs may be useful as an alternative to trading currency futures for most individual traders. Buying shares of the ETFs below allow a trader to gain short exposure in the US Dollar or long exposure in foreign currencies just as they would buy shares of stock.
- Invesco DB US Dollar Index Bearish Fund (UDN) tracks the inverse of US Dollar futures
- Invesco CurrencyShares British Pound Sterling Trust (FXB) tracks the British Pound Sterling
- Invesco CurrencyShares Canadian Dollar Trust (FXC) tracks the Canadian Dollar
- Invesco CurrencyShares Euro Trust (FXE) tracks the Euro currency
Note that these ETFs trade relatively low volume (under 50K shares traded daily do not offer the leverage of currency futures trading. Still, they dffer a way for non-futures traders to participate in the price movements of the US Dollar and foreign currencies.
What the research tells us…
Over the past half-century, the US Dollar has shtendedo decline during the late-winter, mid-spring period. As a result, various foreign currencies have concurrently shown a tendency to advance during a similar period. As we see in the results above, however, this is no "sure thing", in any given year, but rather only a slight potential edge. Looking for confirming price action - and acting decisively (with a risk management plan in place) if and when the time comes to act - is key.
The US Dollar is arguably trending higher, and the foreign currencies highlighted above are arguably trending lower. Will the seasonal tendency highlighted above exert itself in 2024? We cannot predict. That said, the real message may be that currency traders should watch closely for any signs of reversal in these markets and be prepared to take advantage, as any such reversal could highlight a useful trading opportunity.
Indicators at Extremes
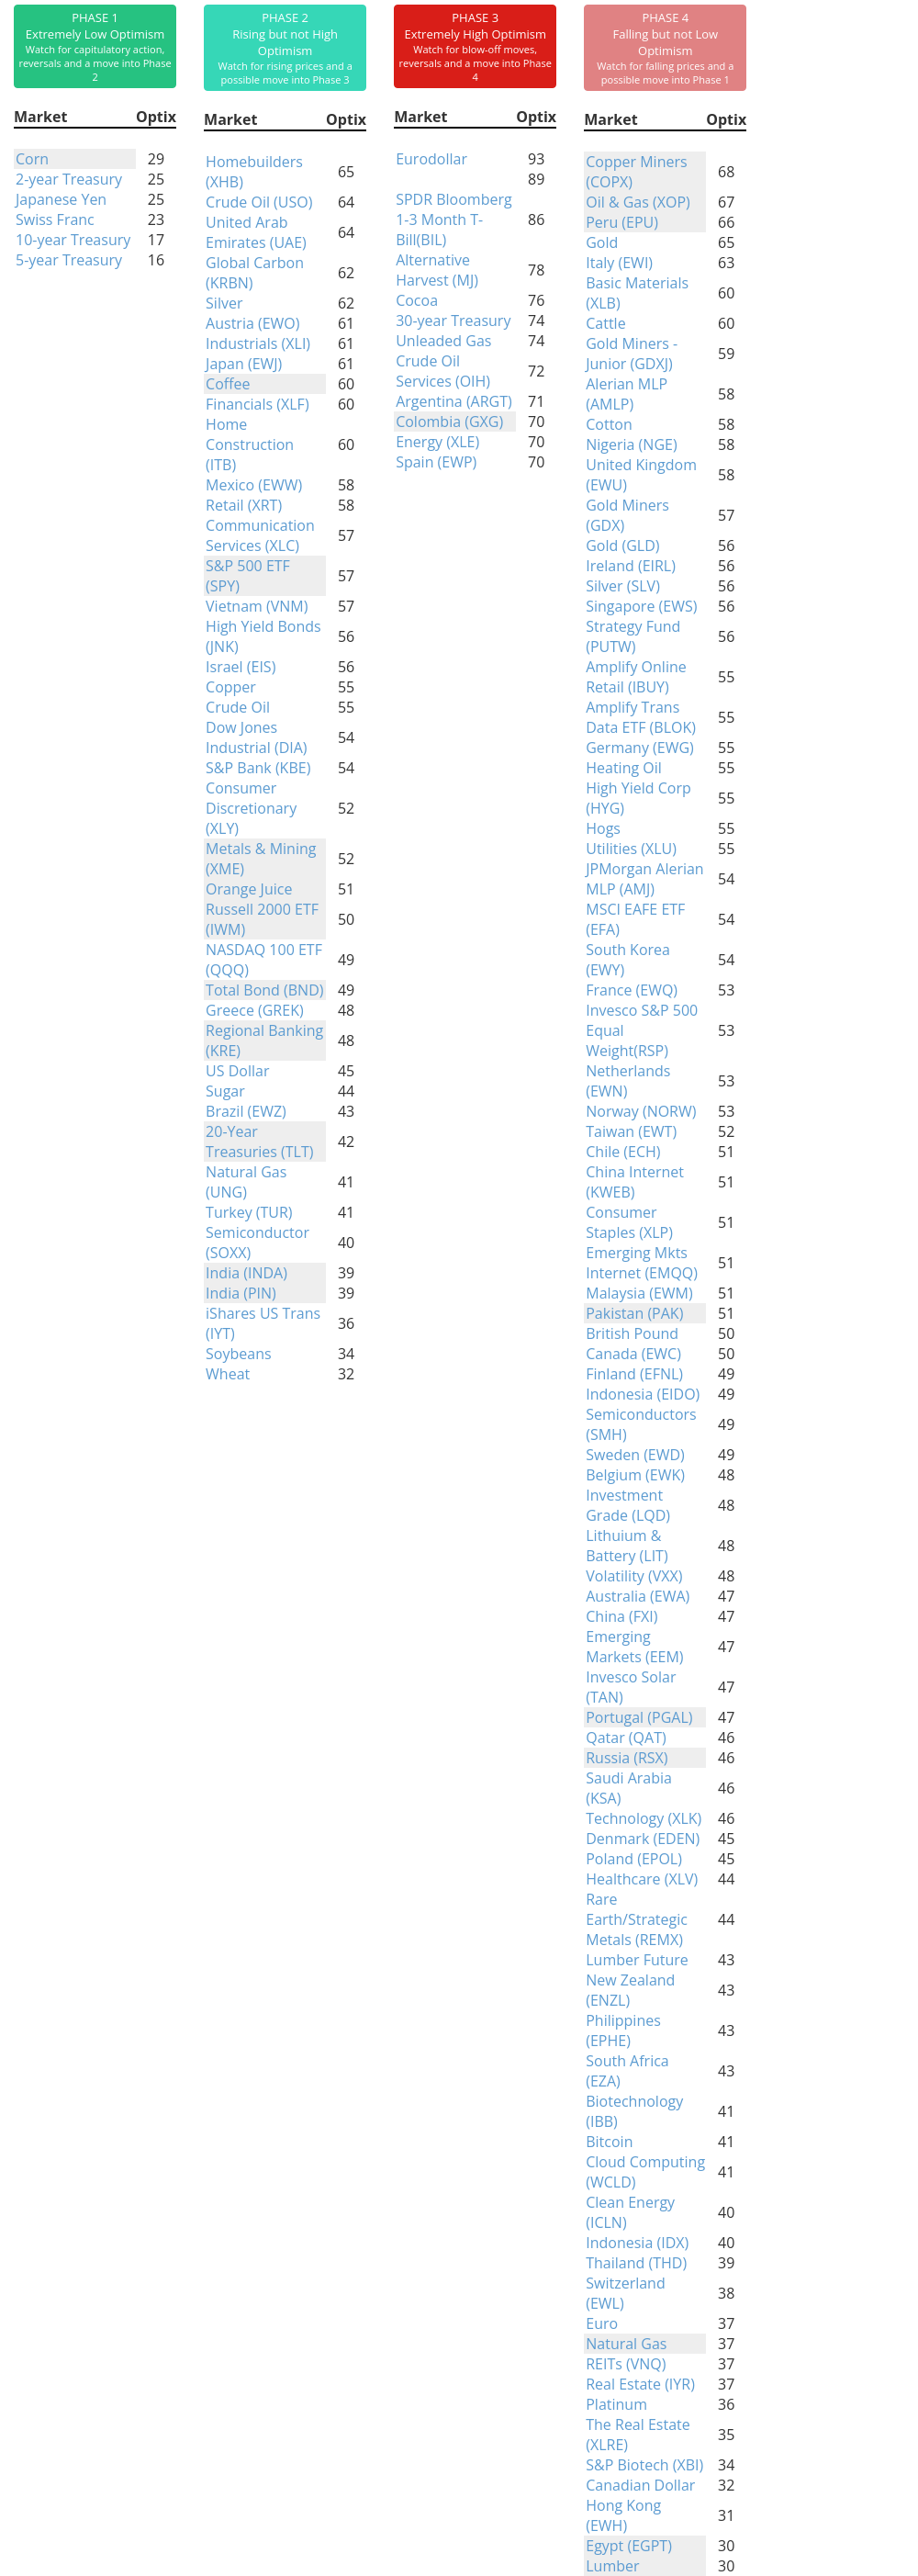
Phase Table
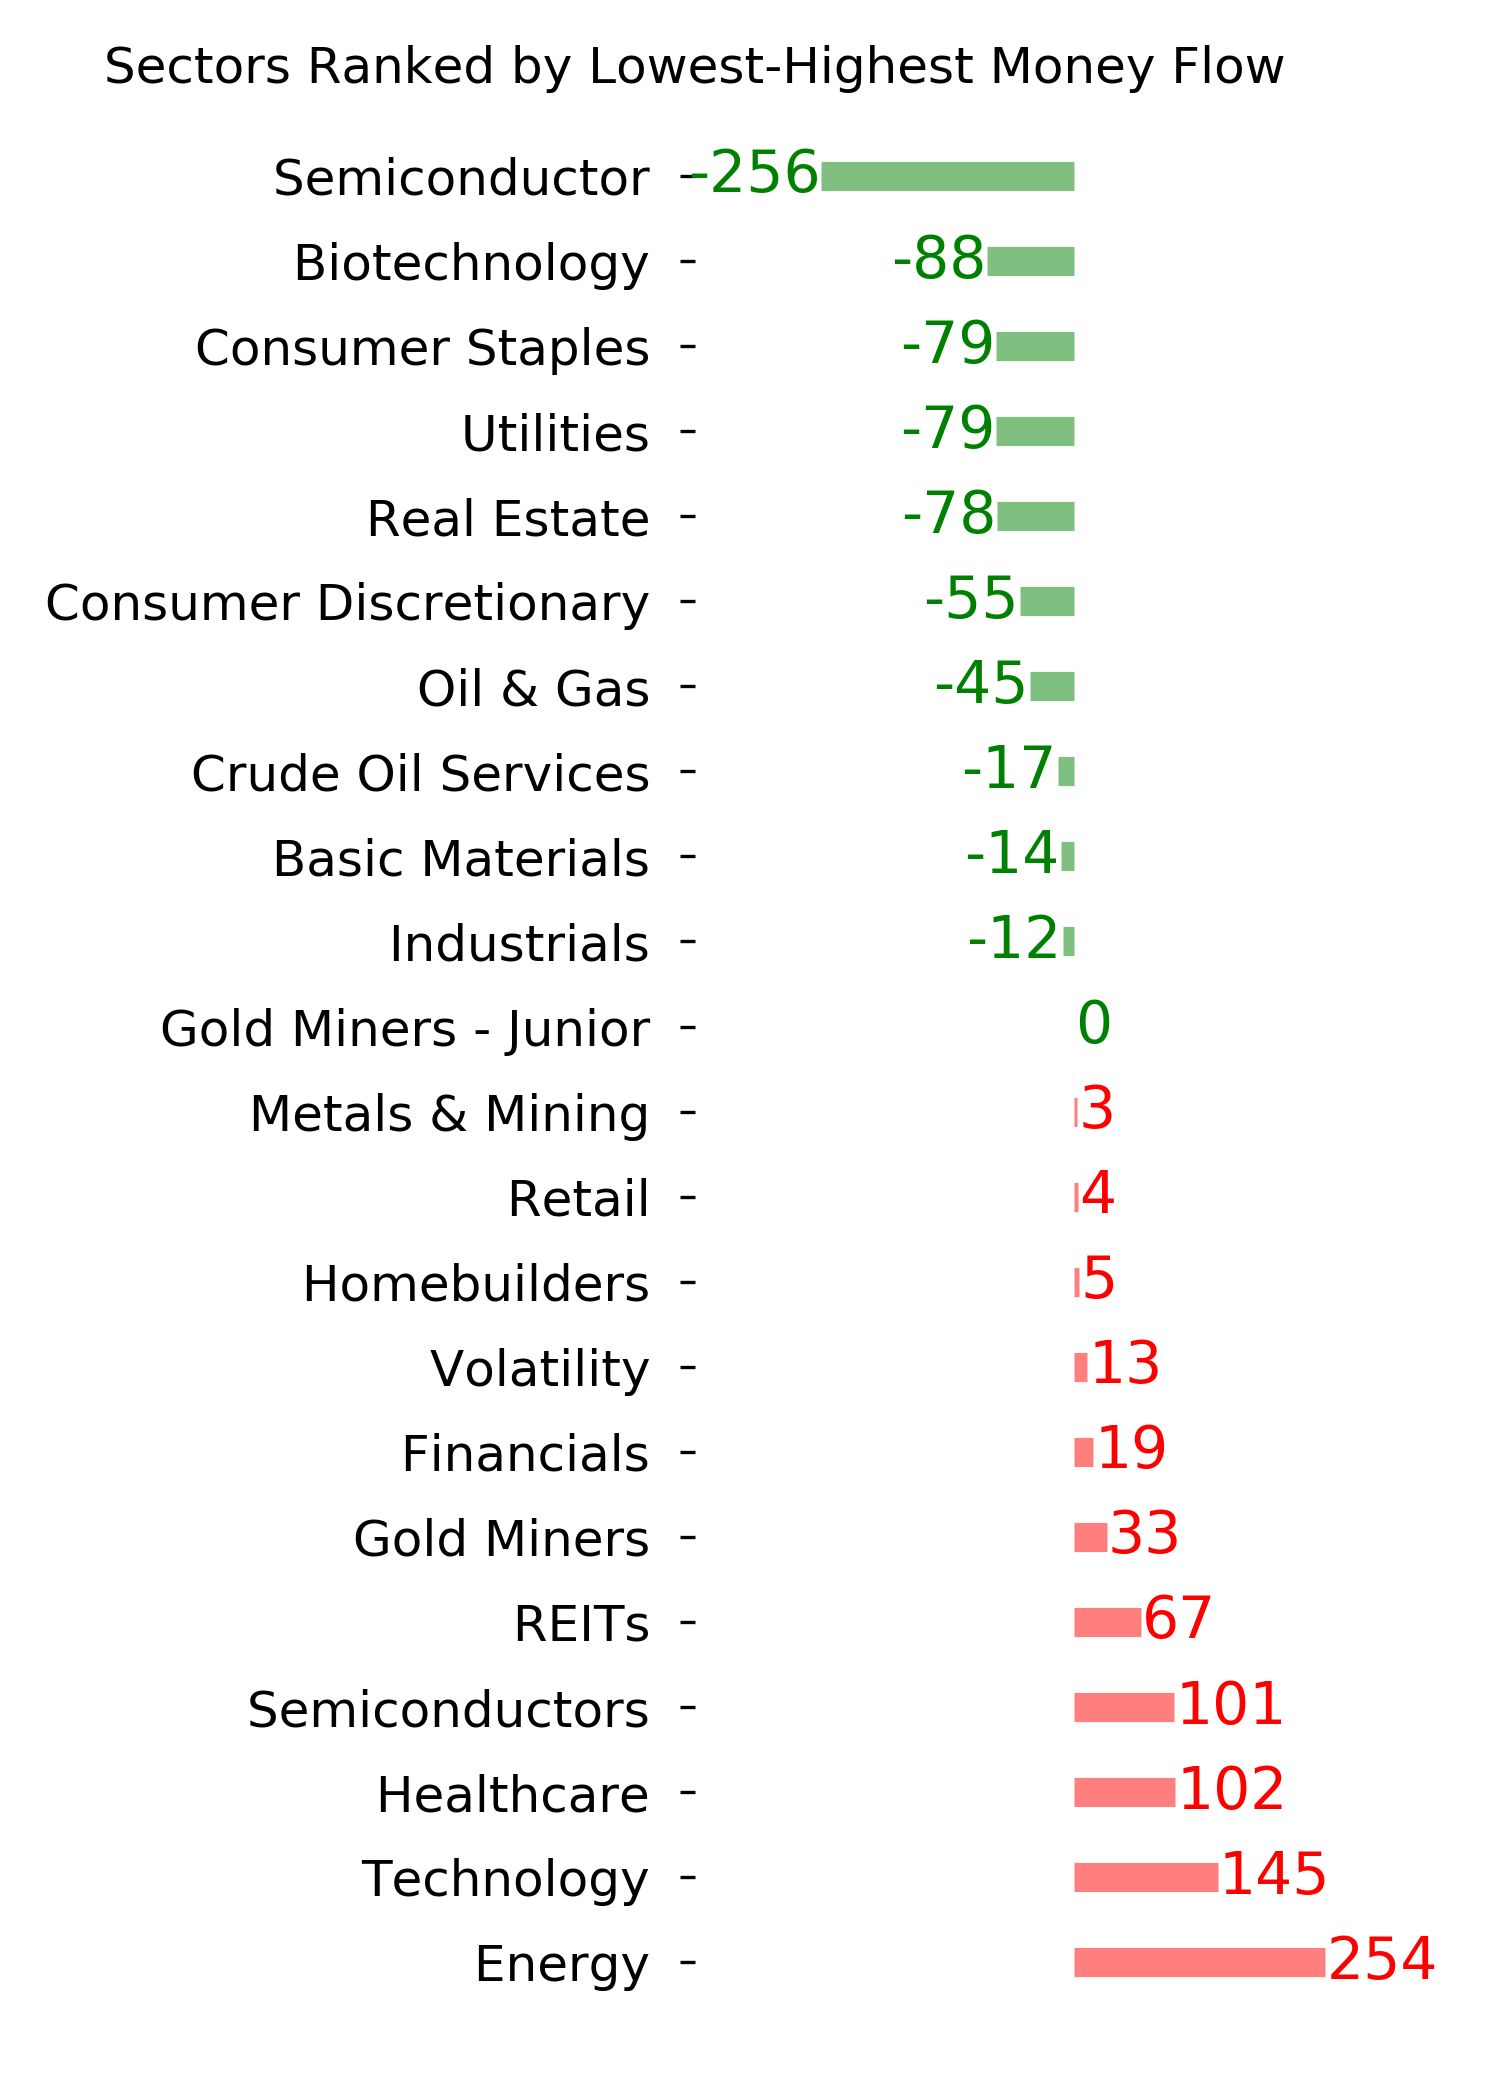
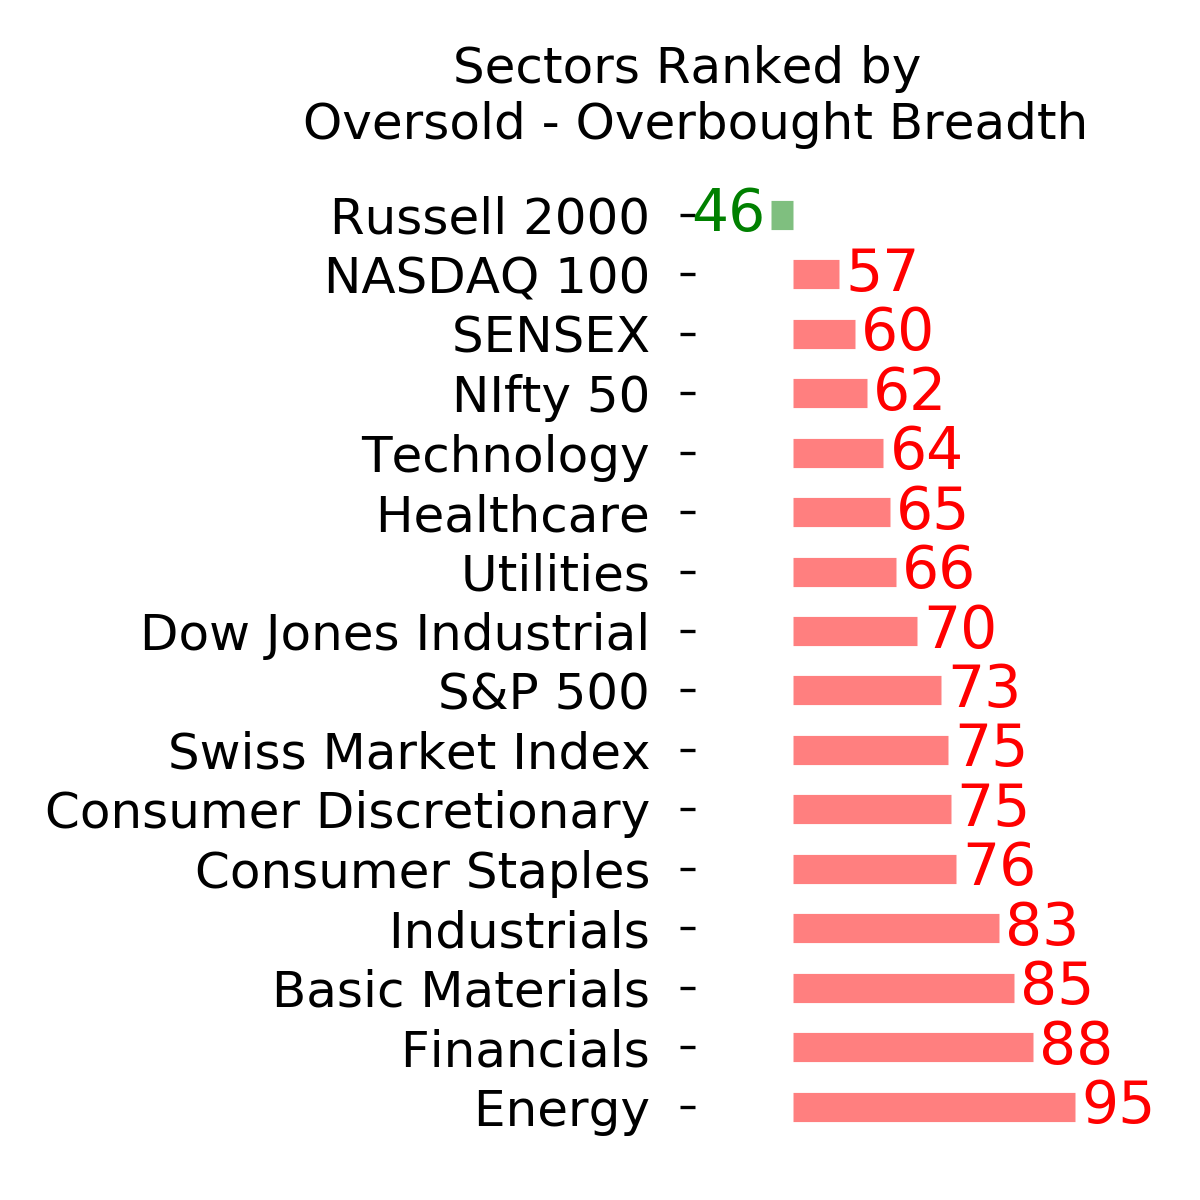
Ranks
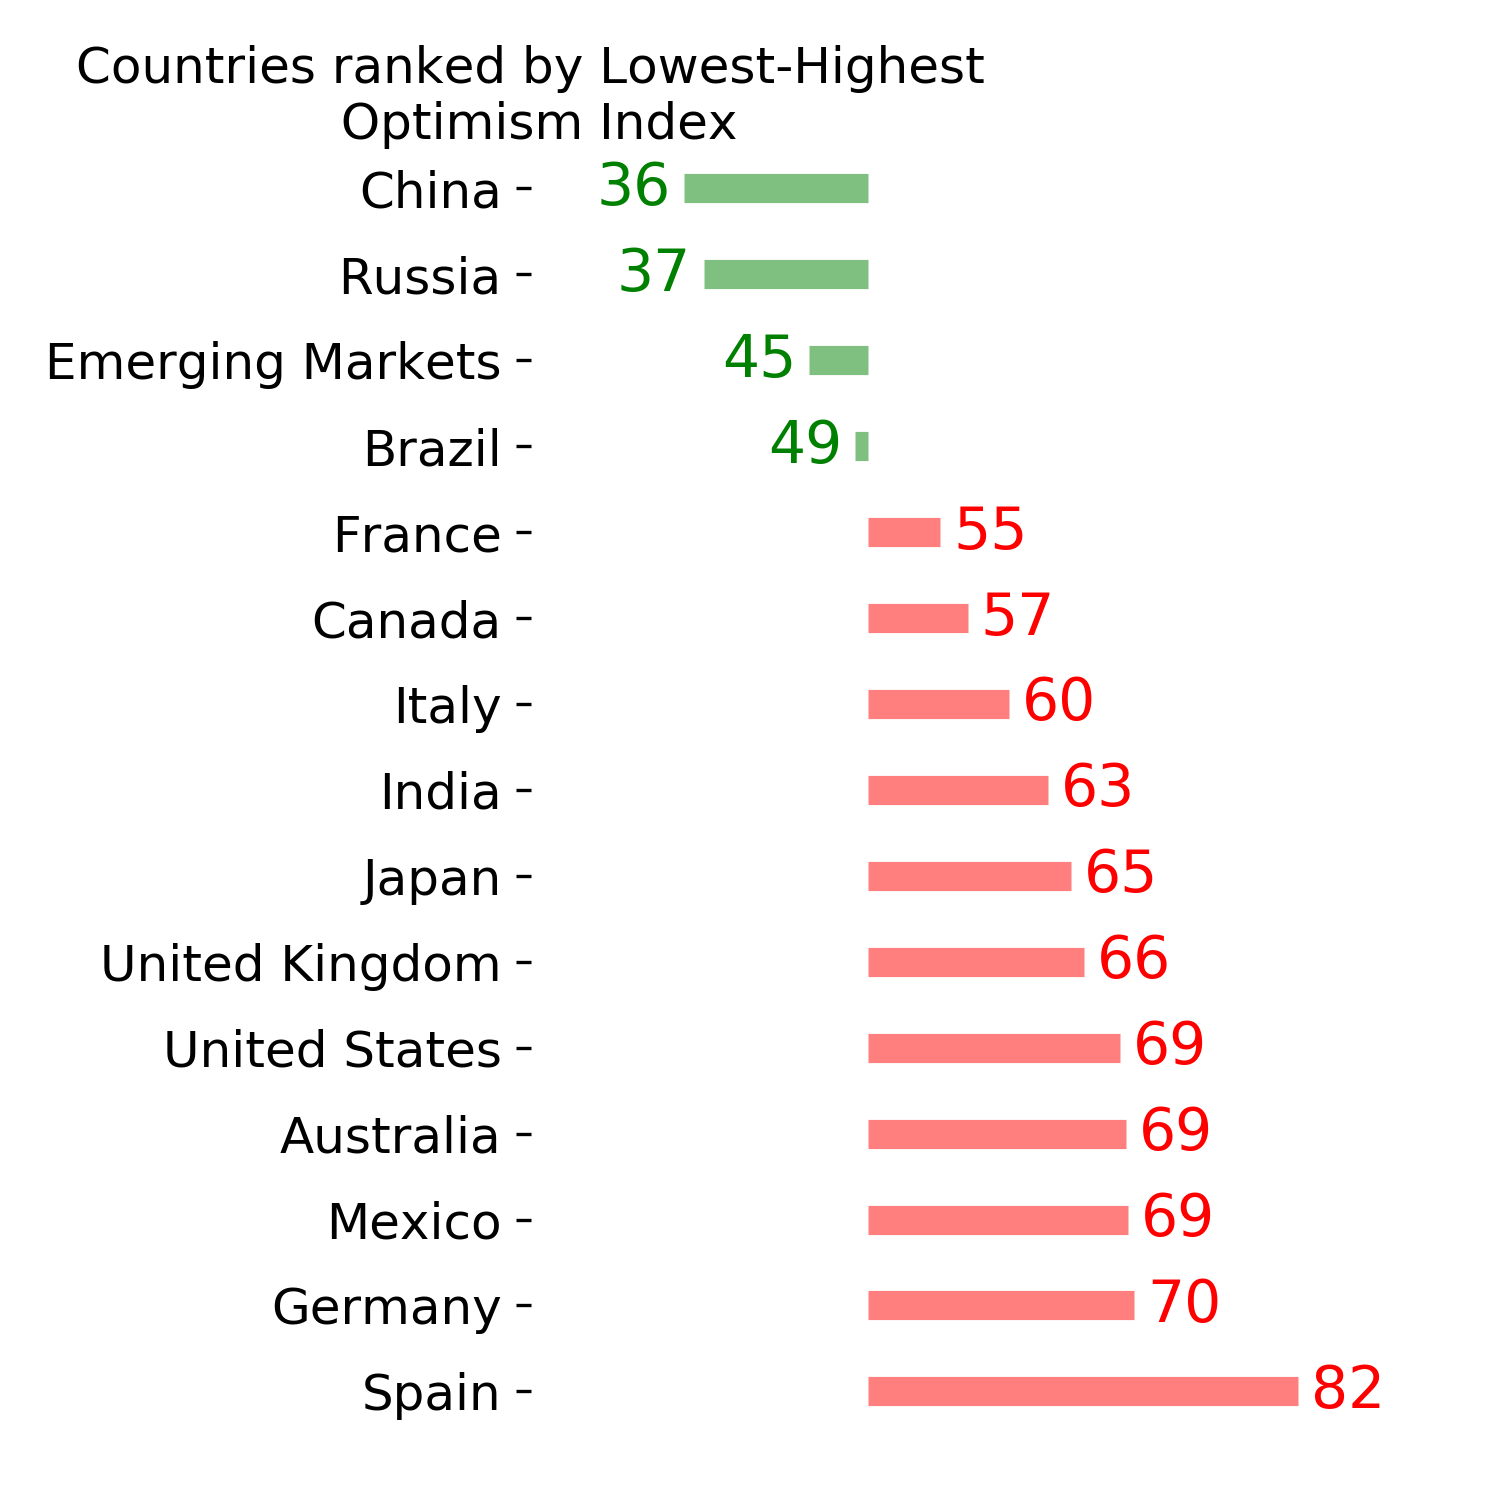
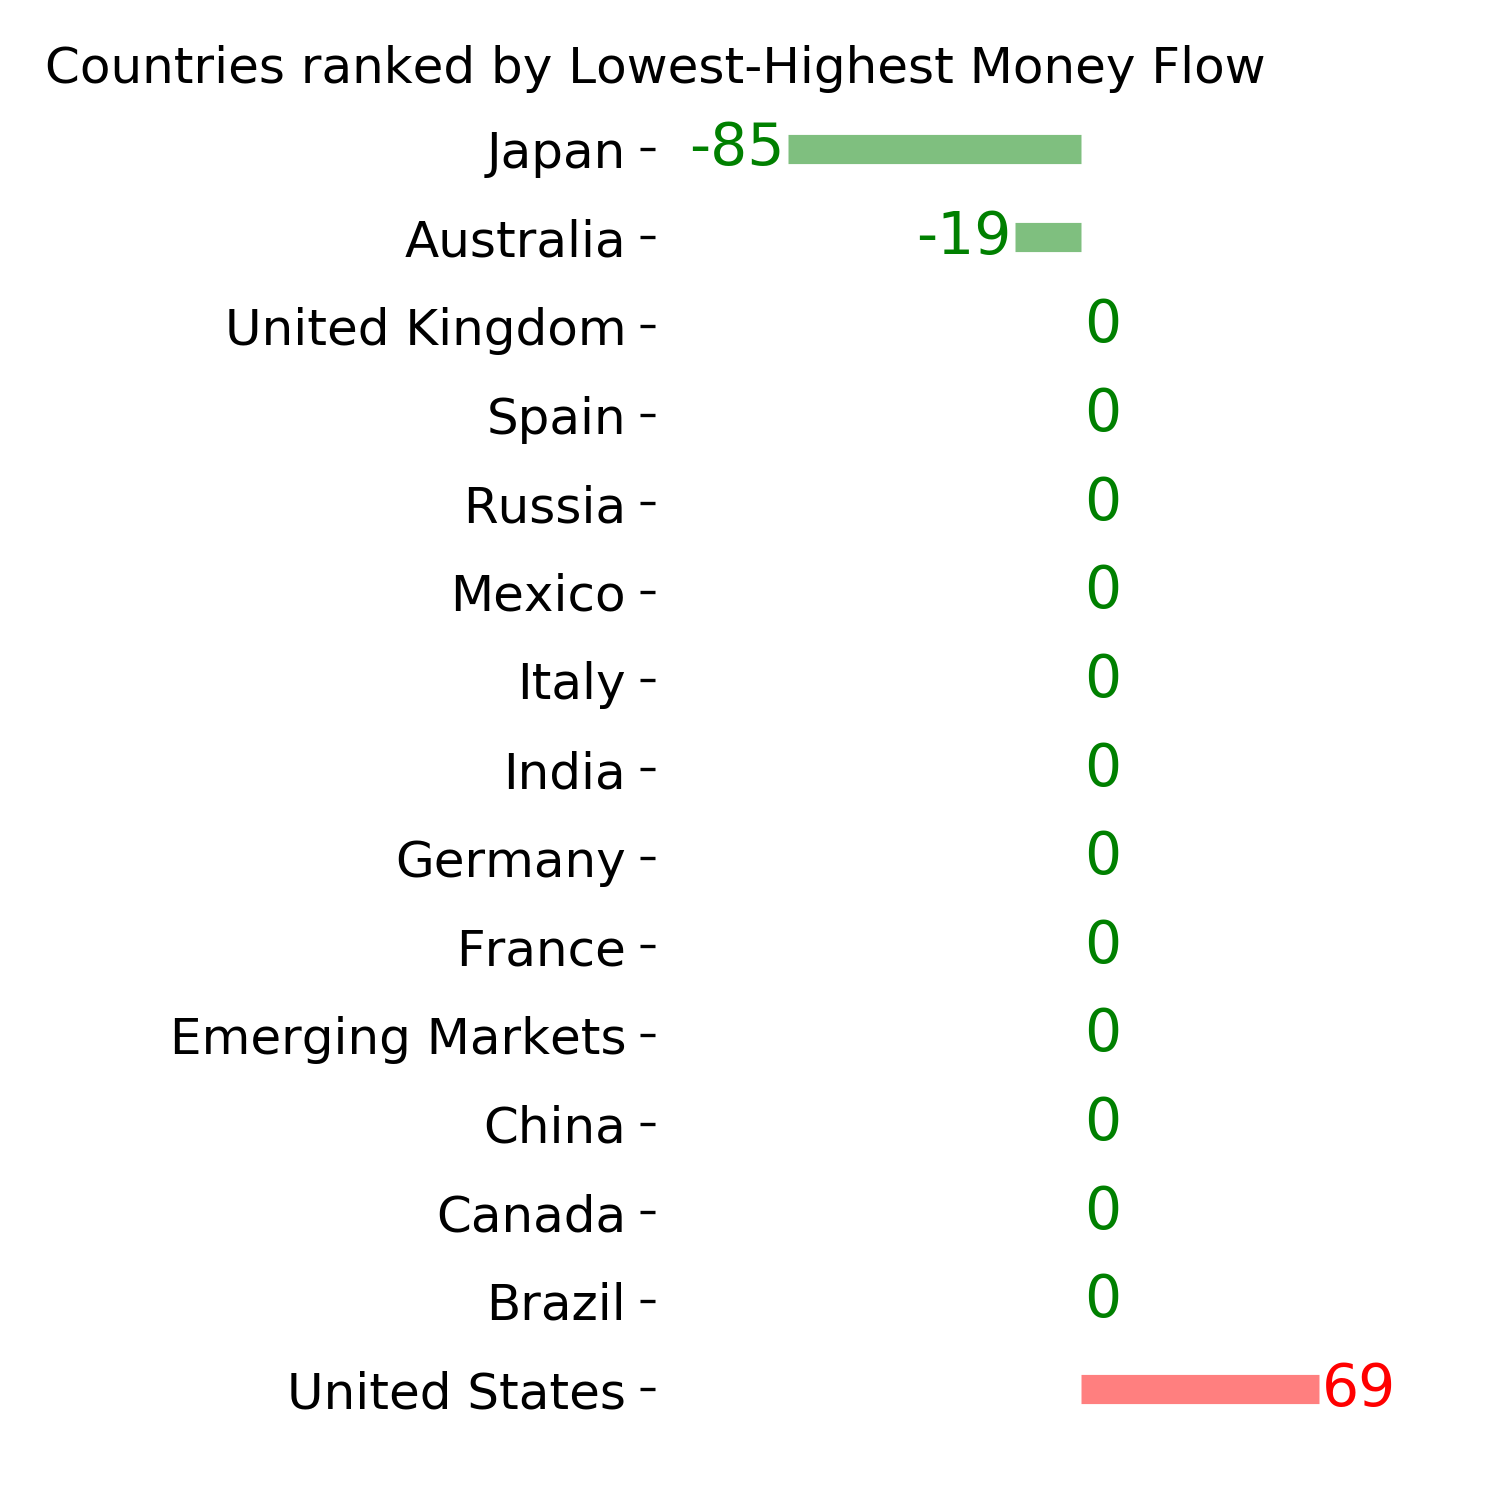
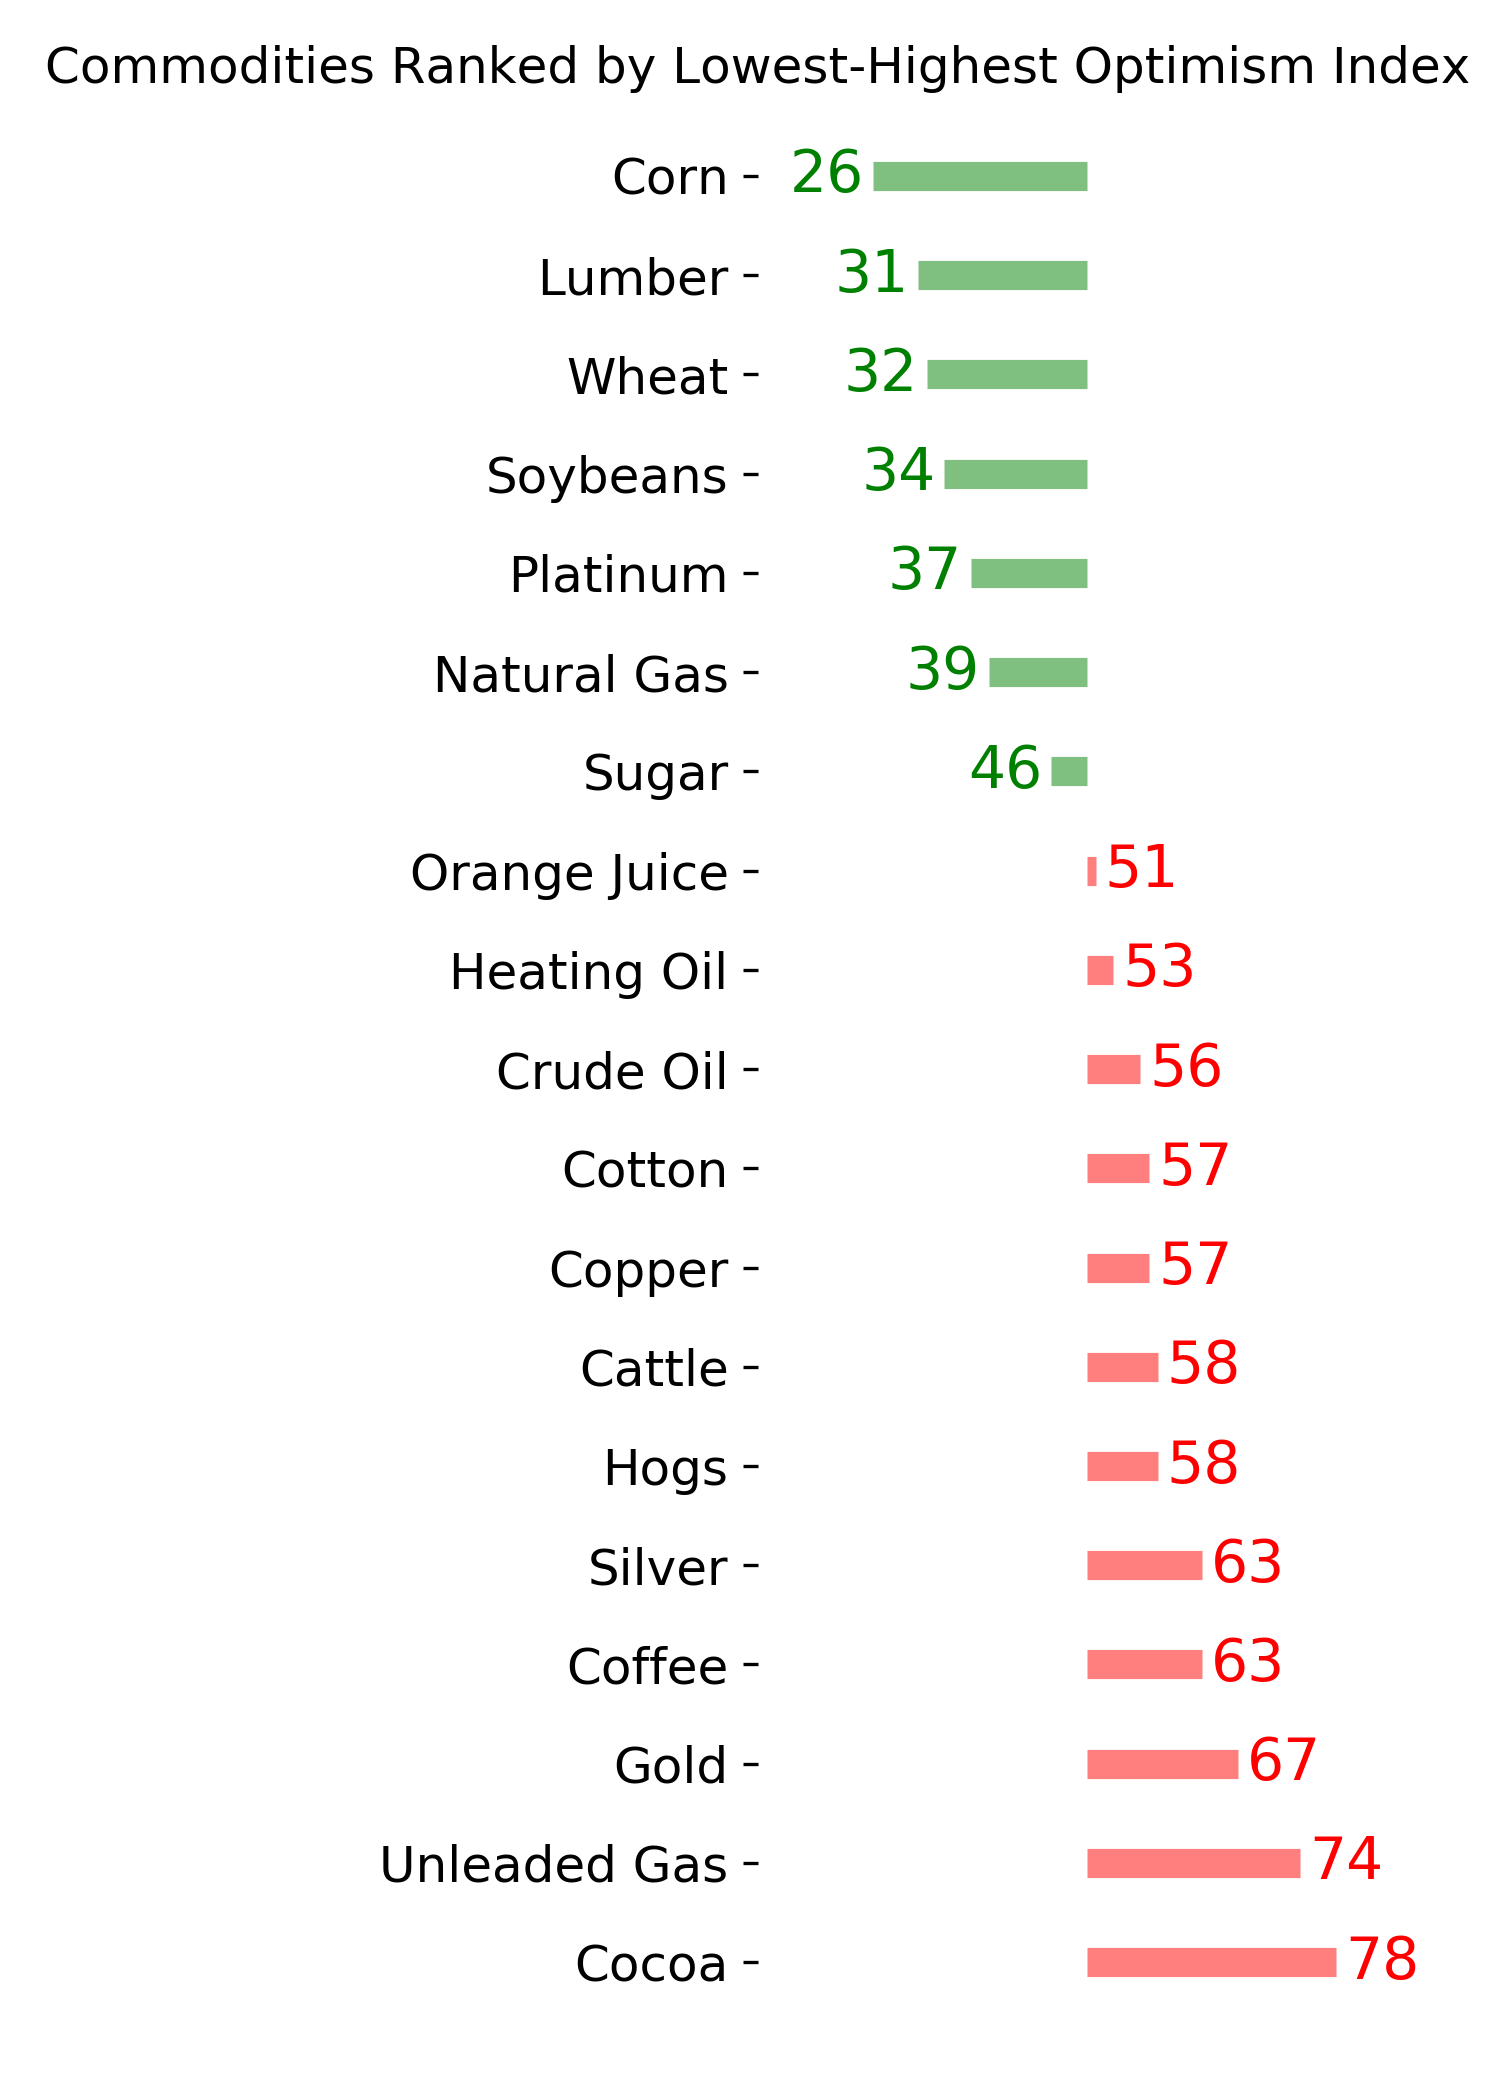
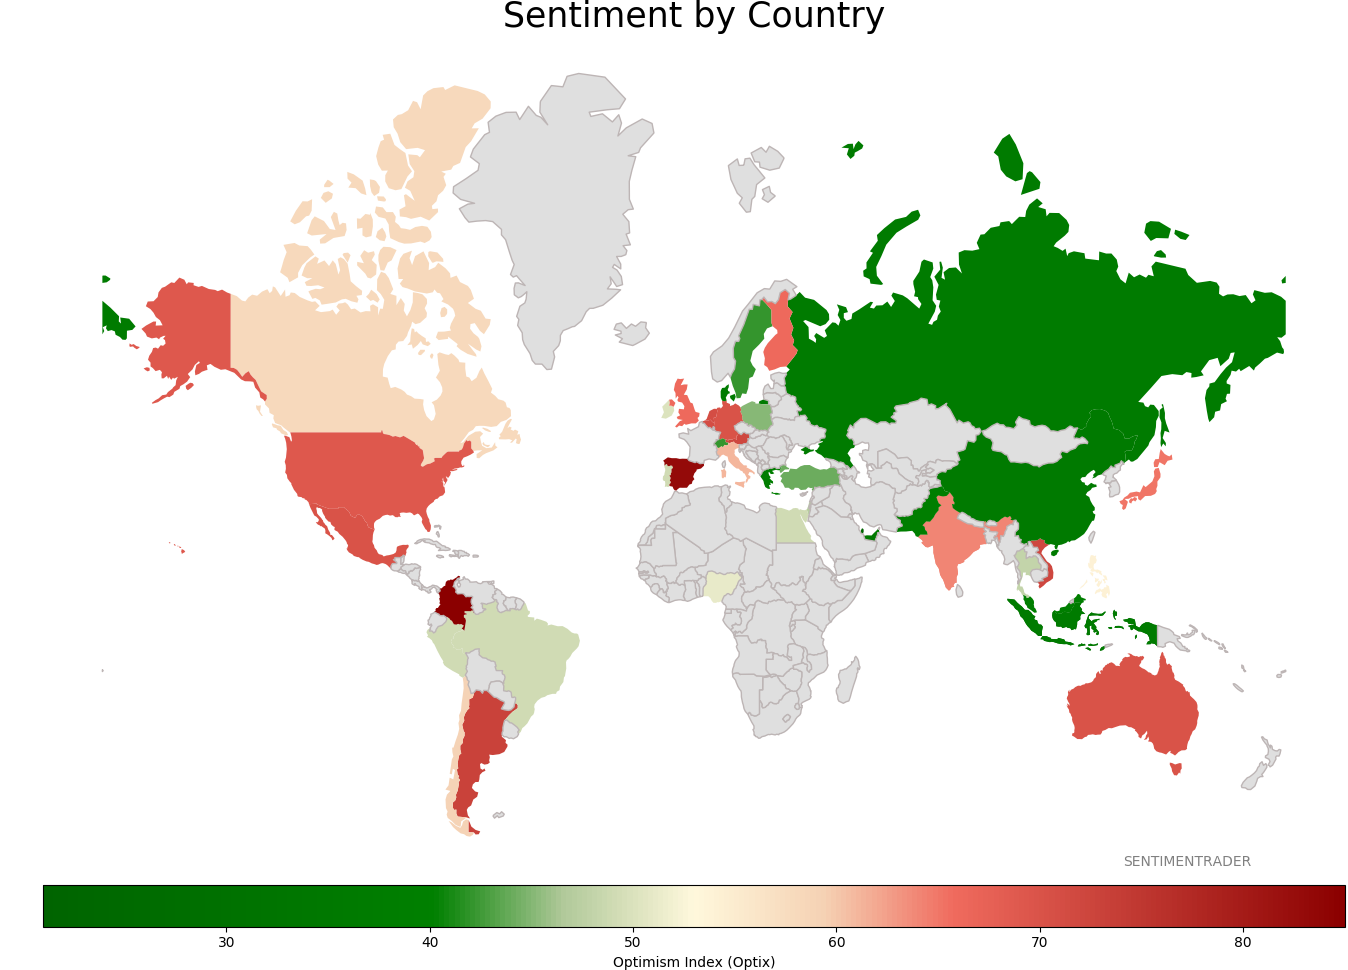
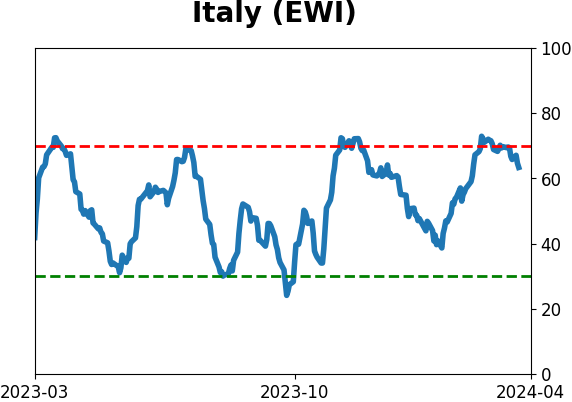
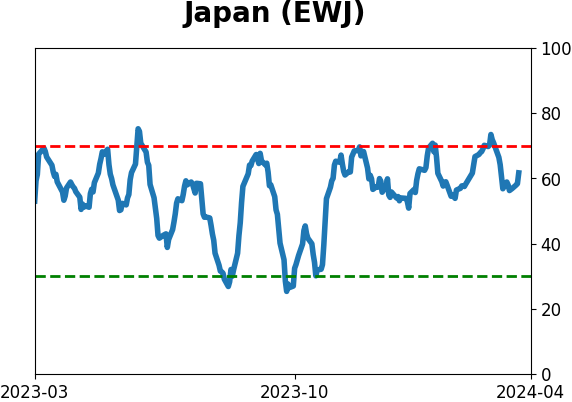
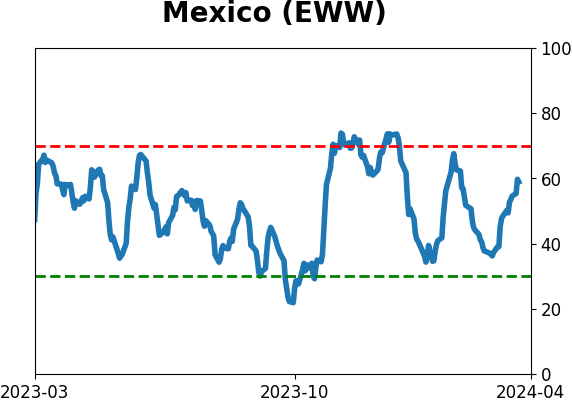
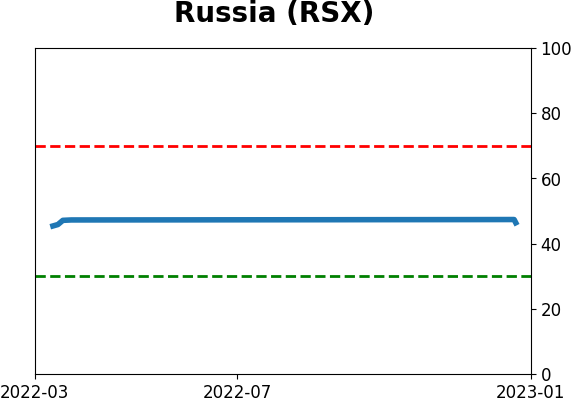
Sentiment Around The World
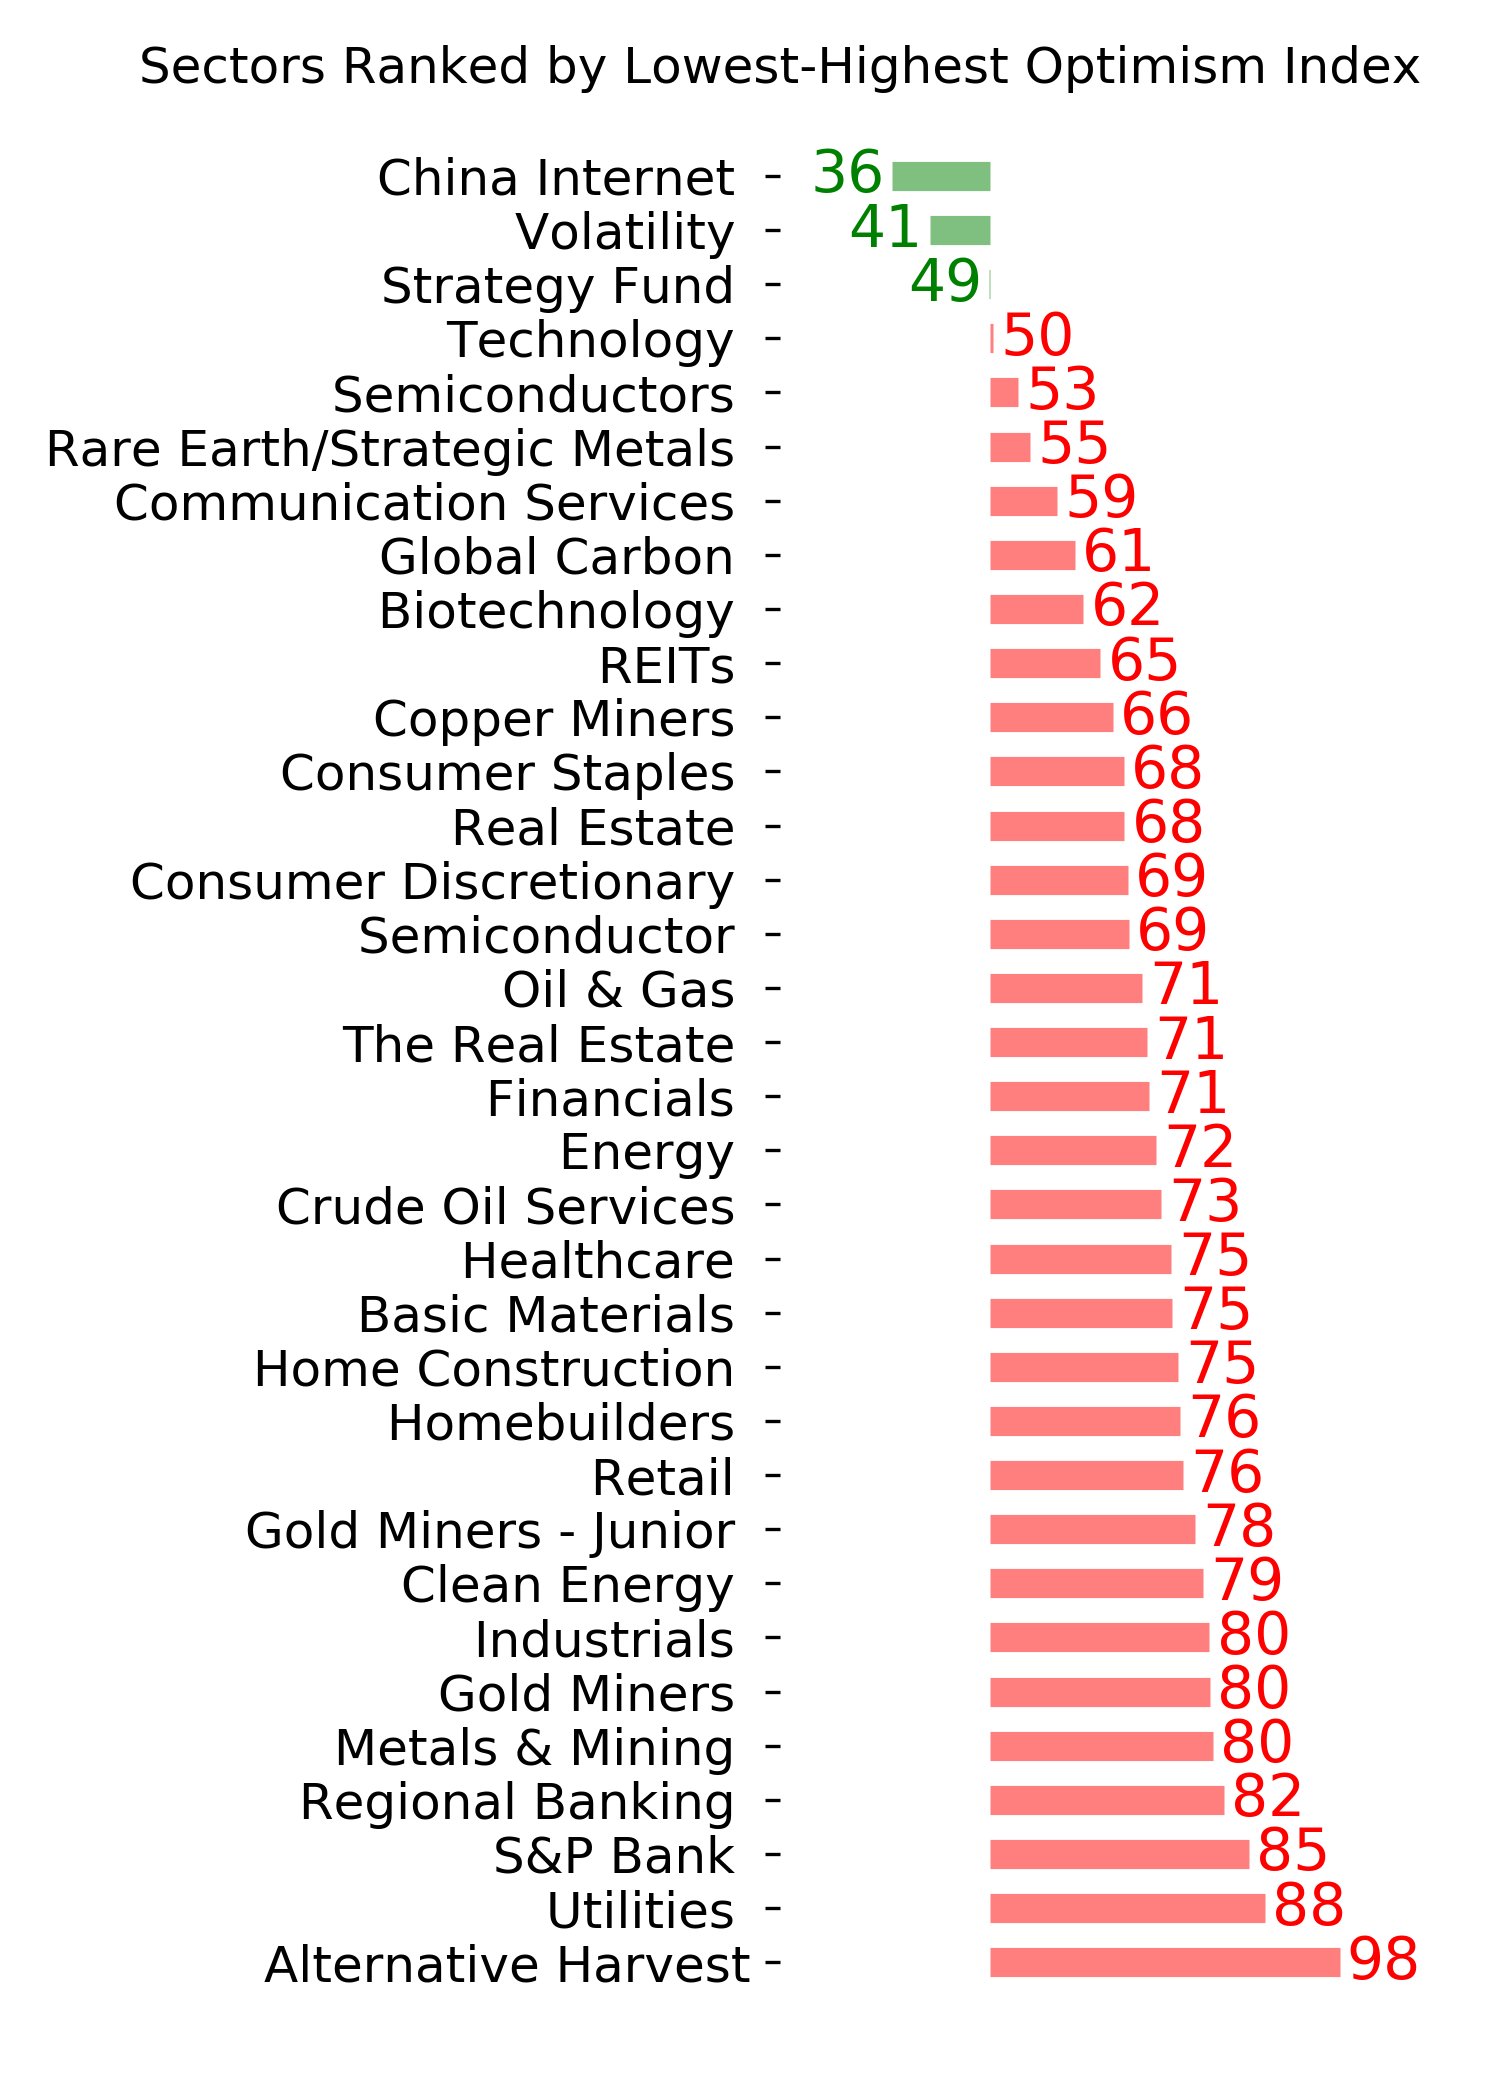
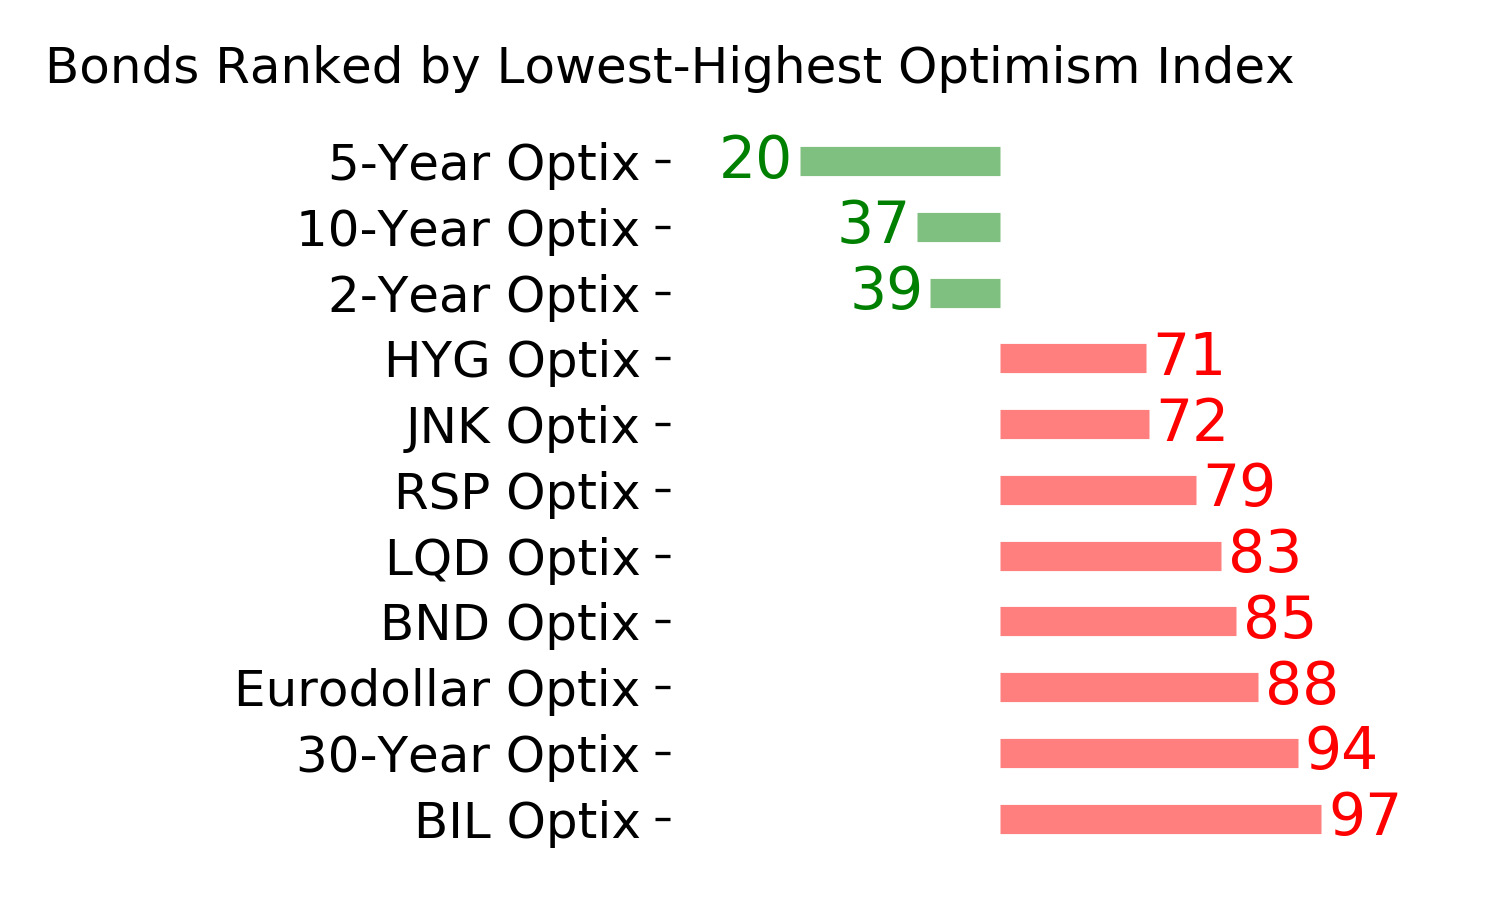
Optimism Index Thumbnails
|
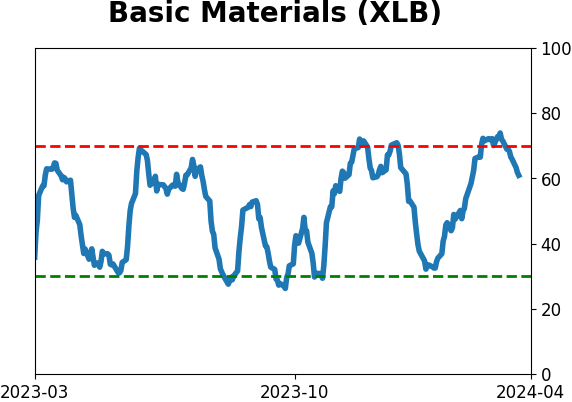
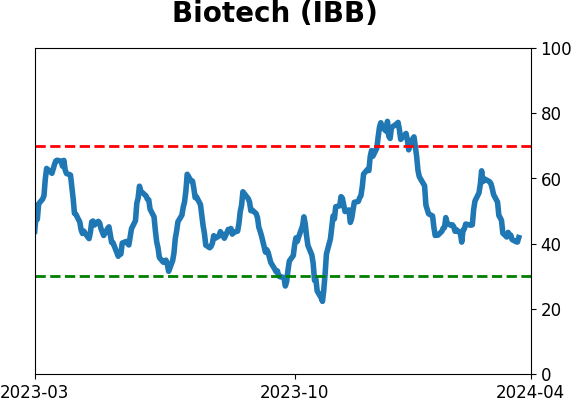
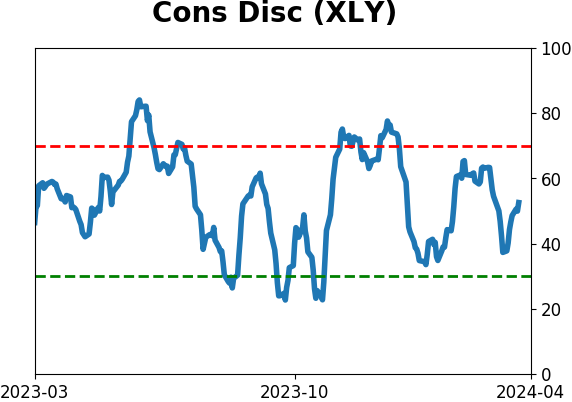
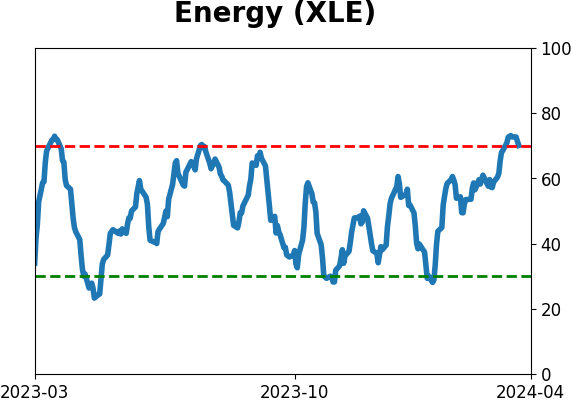
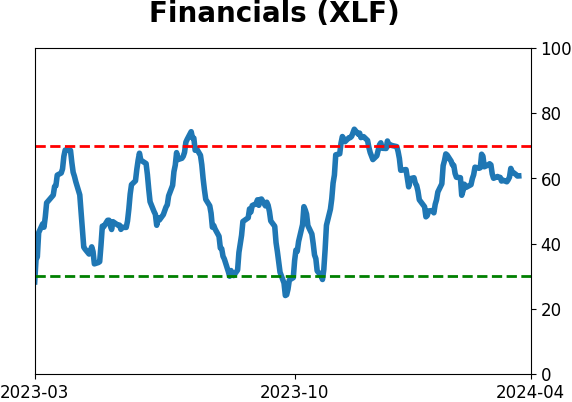
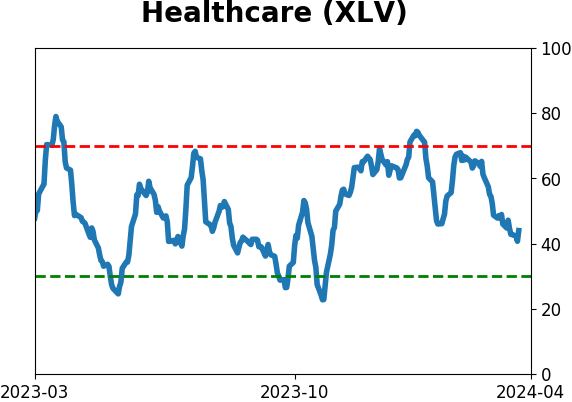
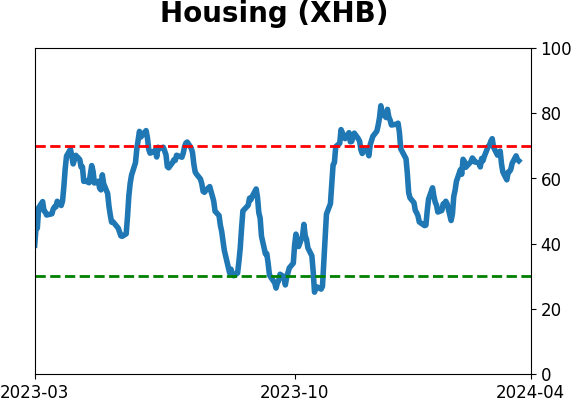
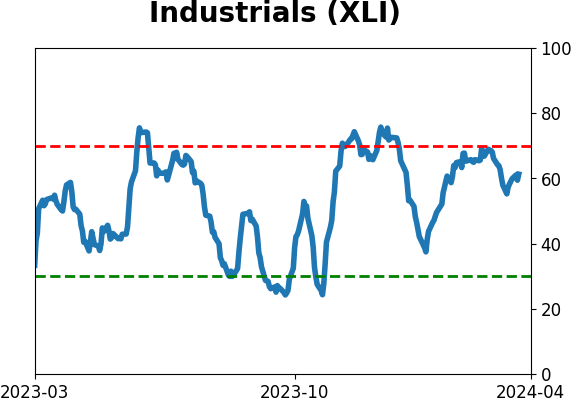
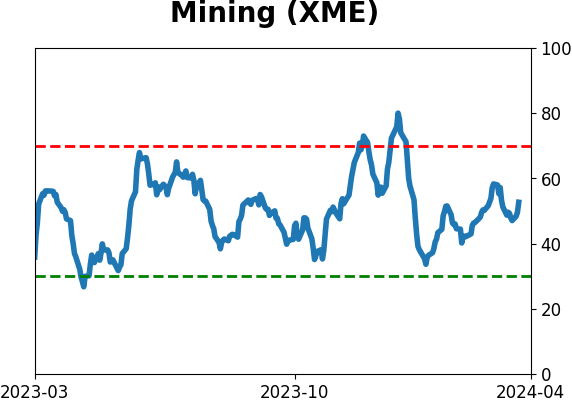
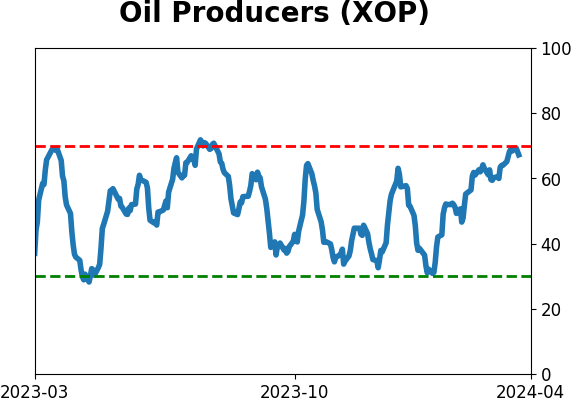
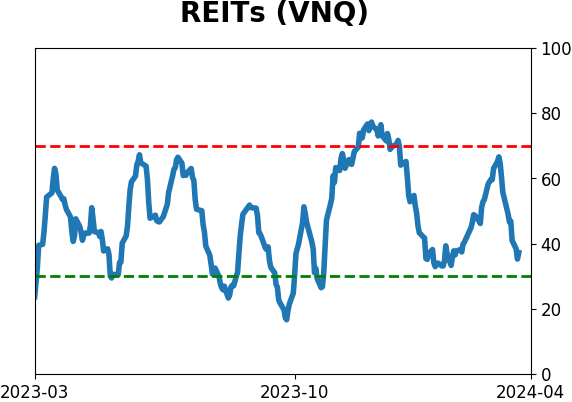
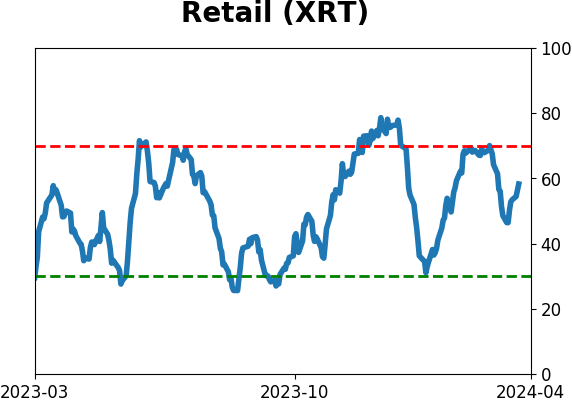
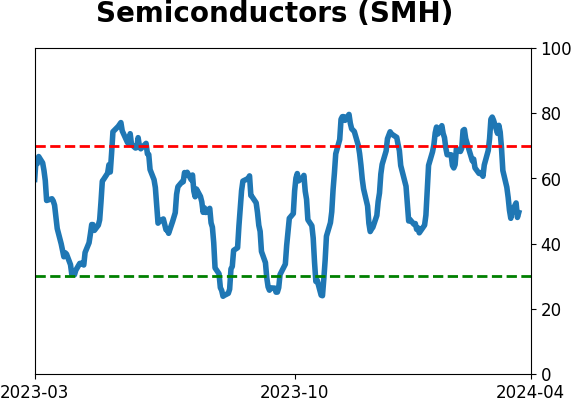
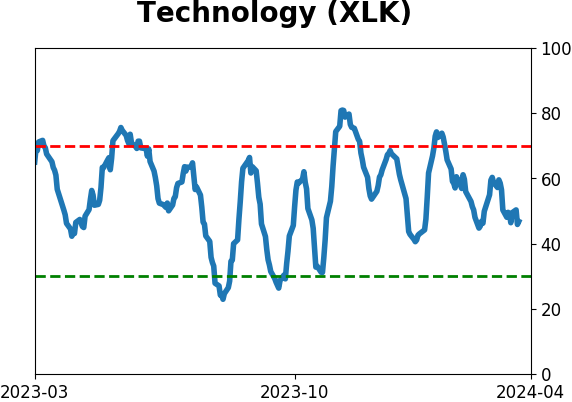
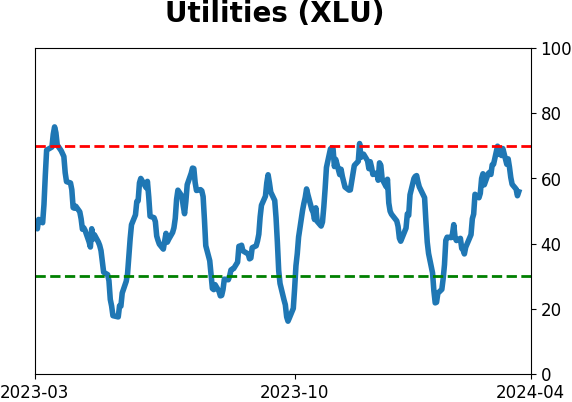
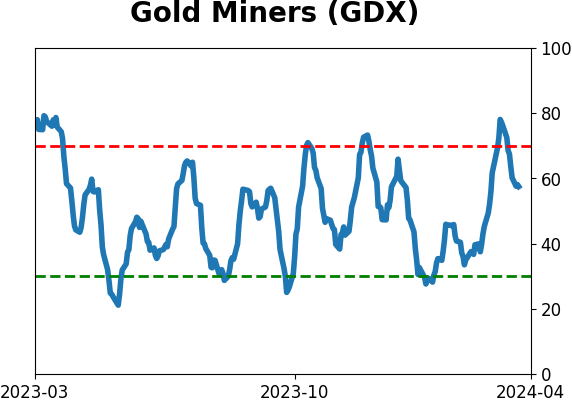
Sector ETF's - 10-Day Moving Average
|
|
|
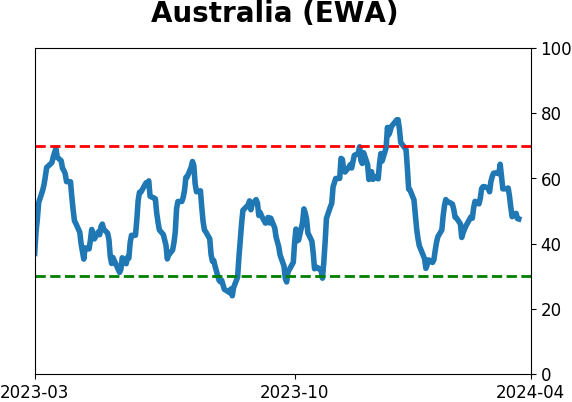
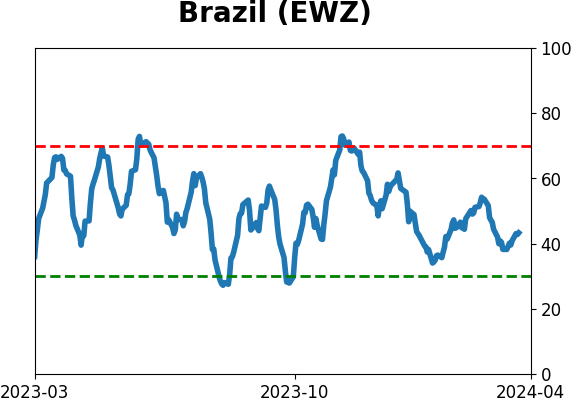
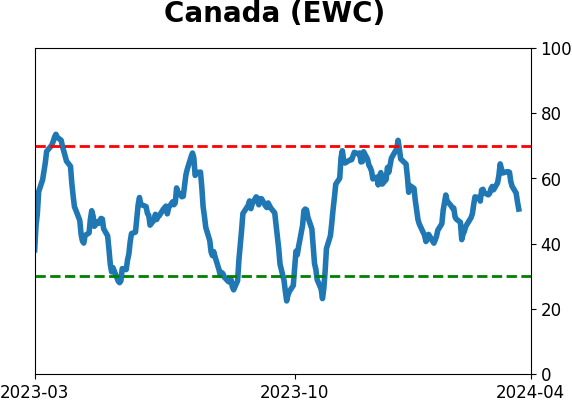
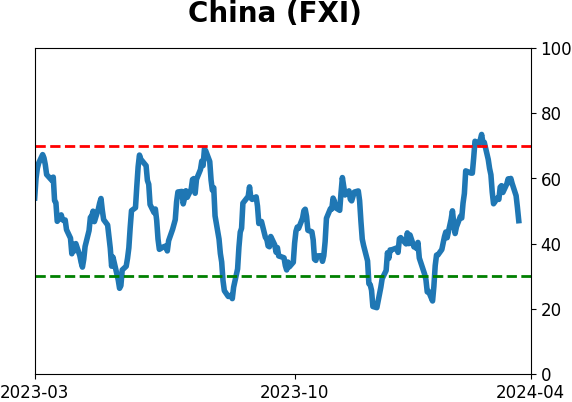
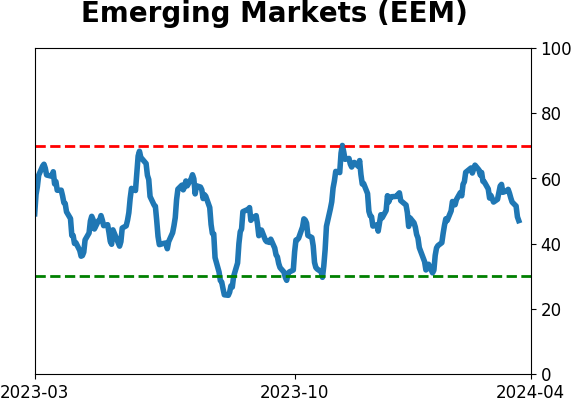
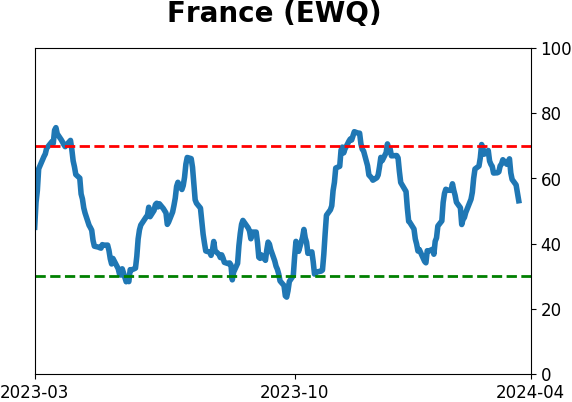
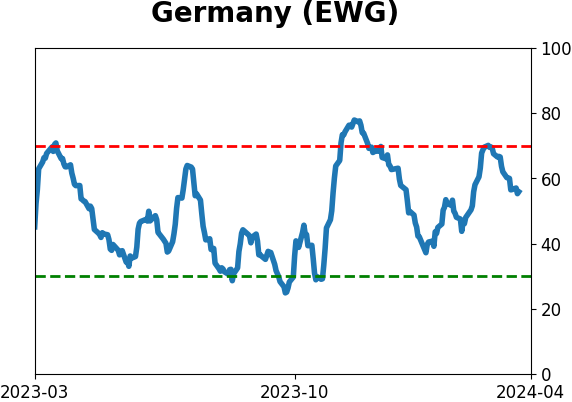
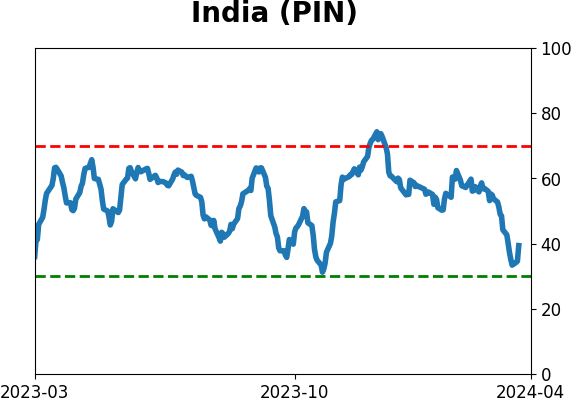
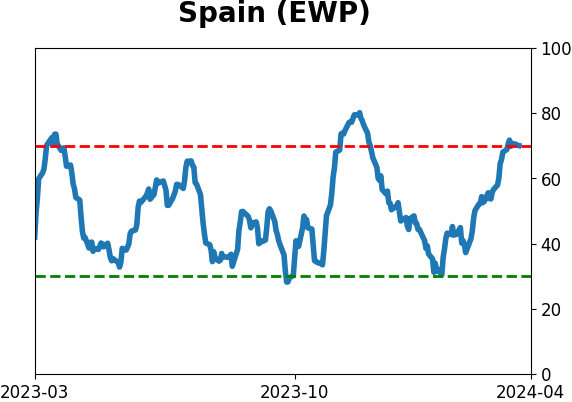
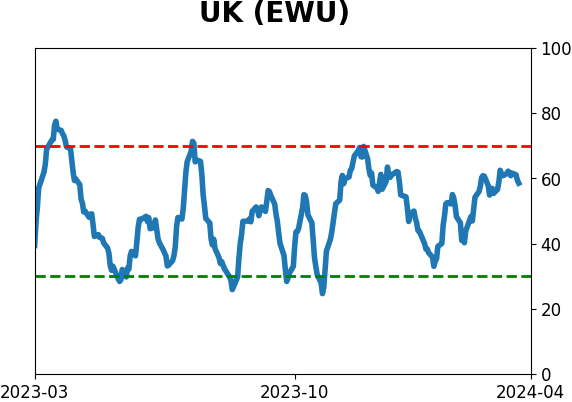
Country ETF's - 10-Day Moving Average
|
|
|
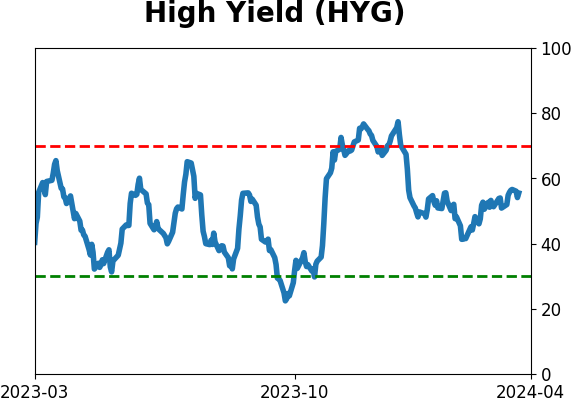
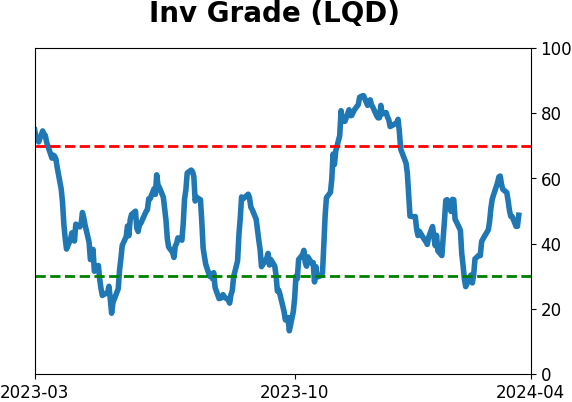
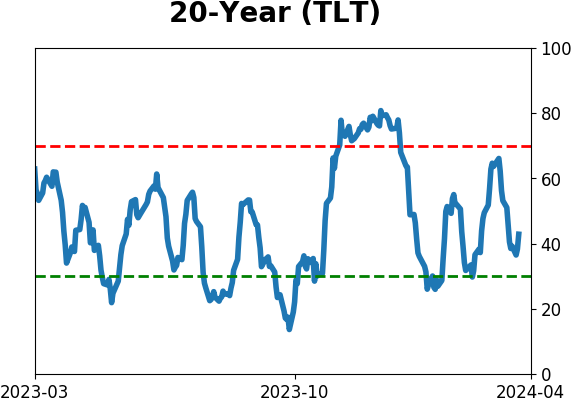
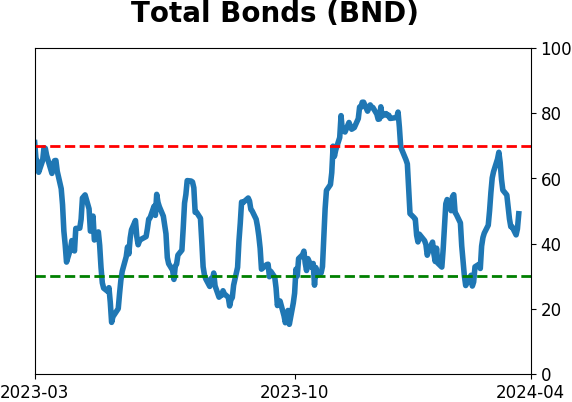
Bond ETF's - 10-Day Moving Average
|
|
|
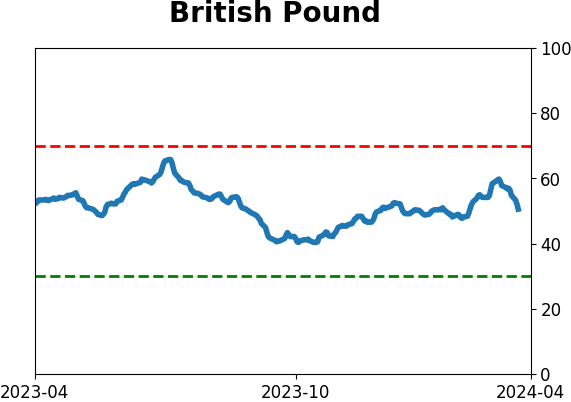
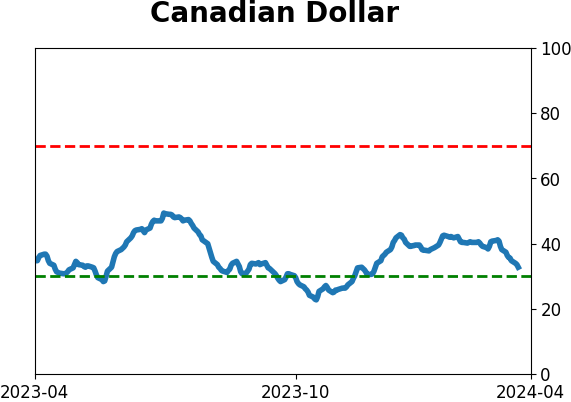
Currency ETF's - 5-Day Moving Average
|
|
|
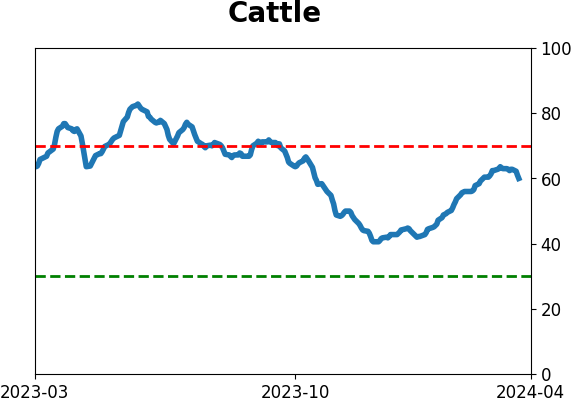
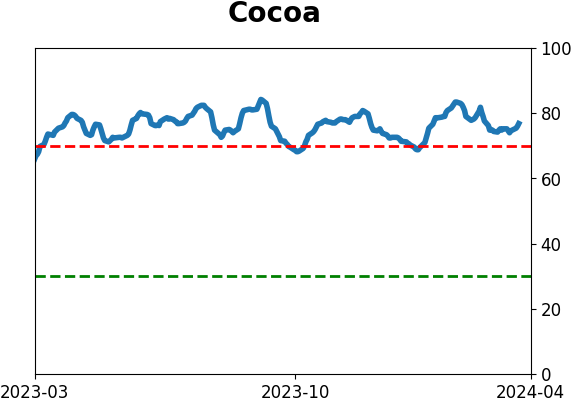
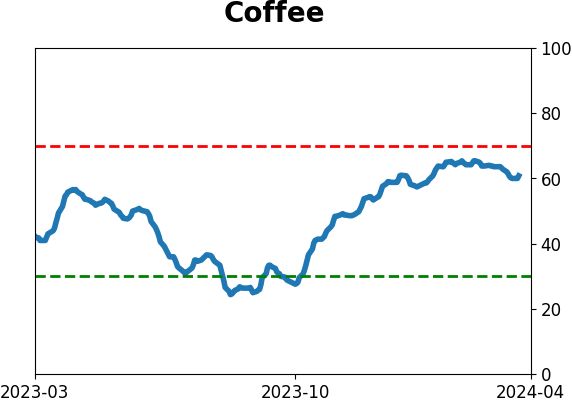
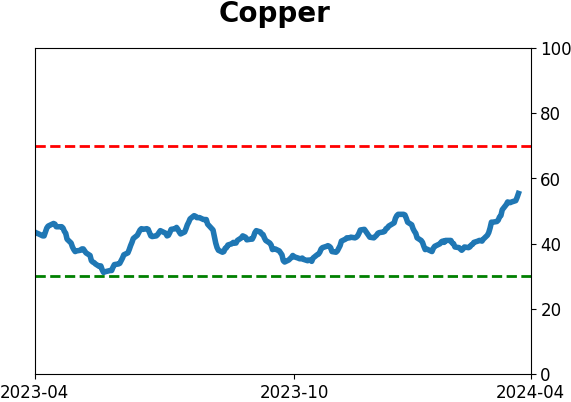
Commodity ETF's - 5-Day Moving Average
|
|