Headlines
|
|
Bond traders pricing in much bigger swings than stock investors:
Even though bond traders are pricing in heavier volatility in the weeks ahead, stock investors are not. The ratio between the VIX and MOVE indexes is near the lowest in 30 years. That has implications for swings in bond prices, as well as foreign stocks and the U.S. Financial sector.
|
Smart / Dumb Money Confidence
|
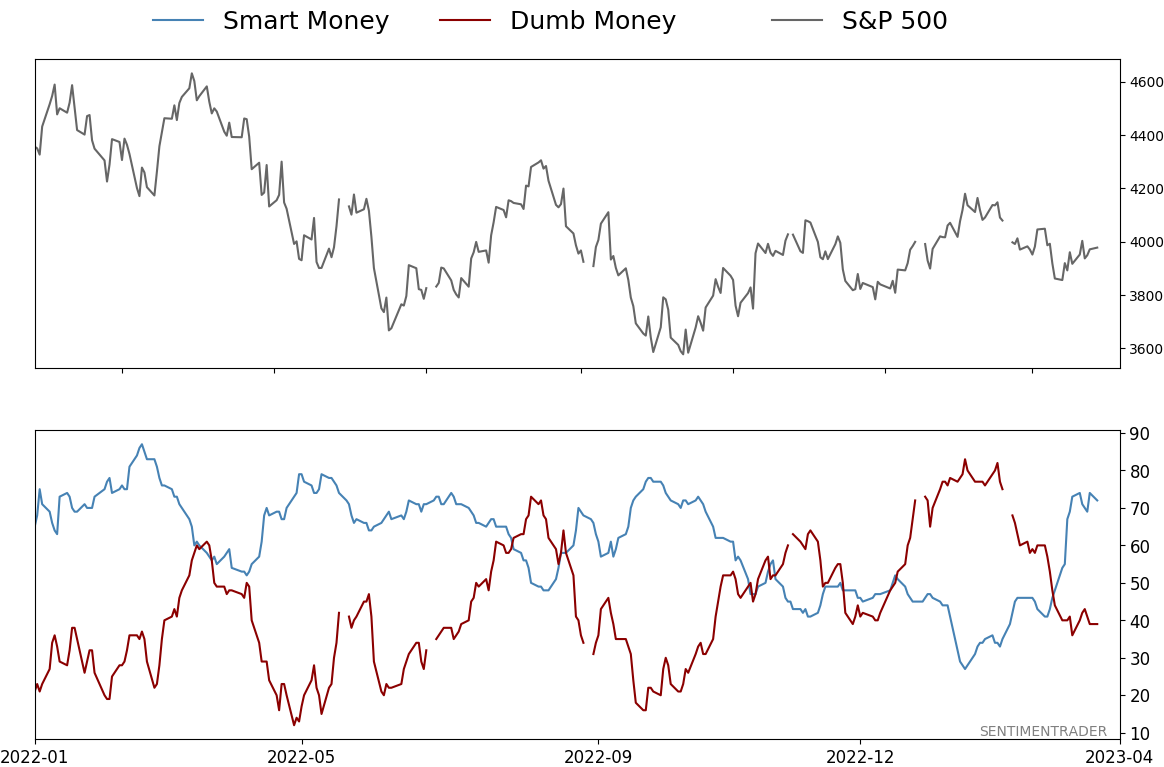
Smart Money Confidence: 72%
Dumb Money Confidence: 39%
|
|
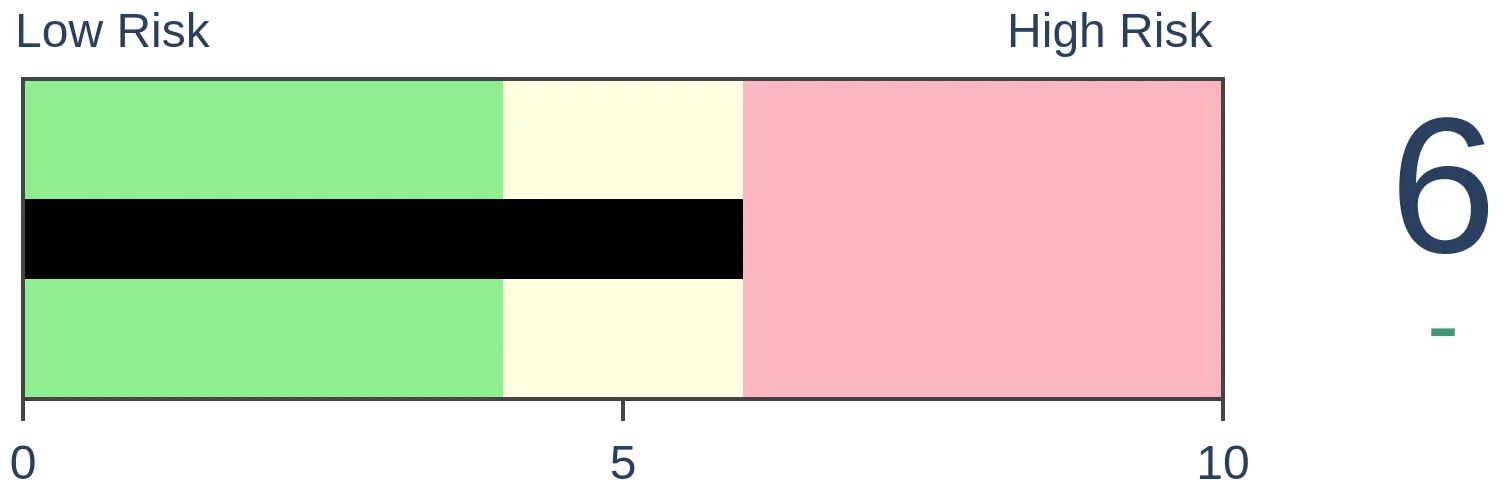
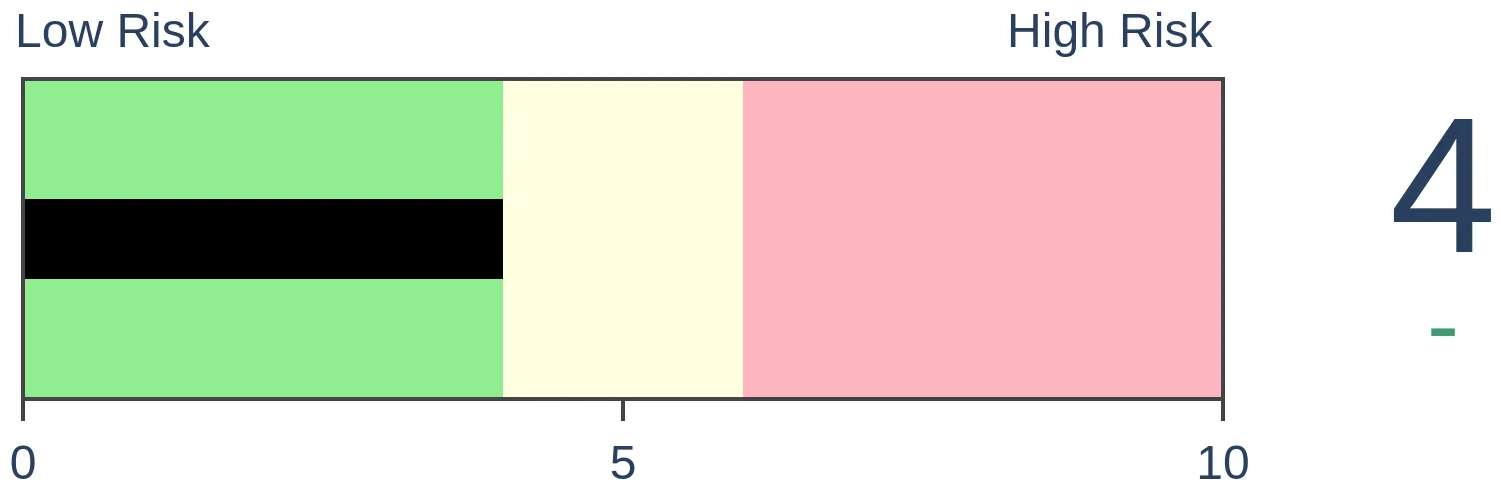
Risk Levels
Stocks Short-Term
|
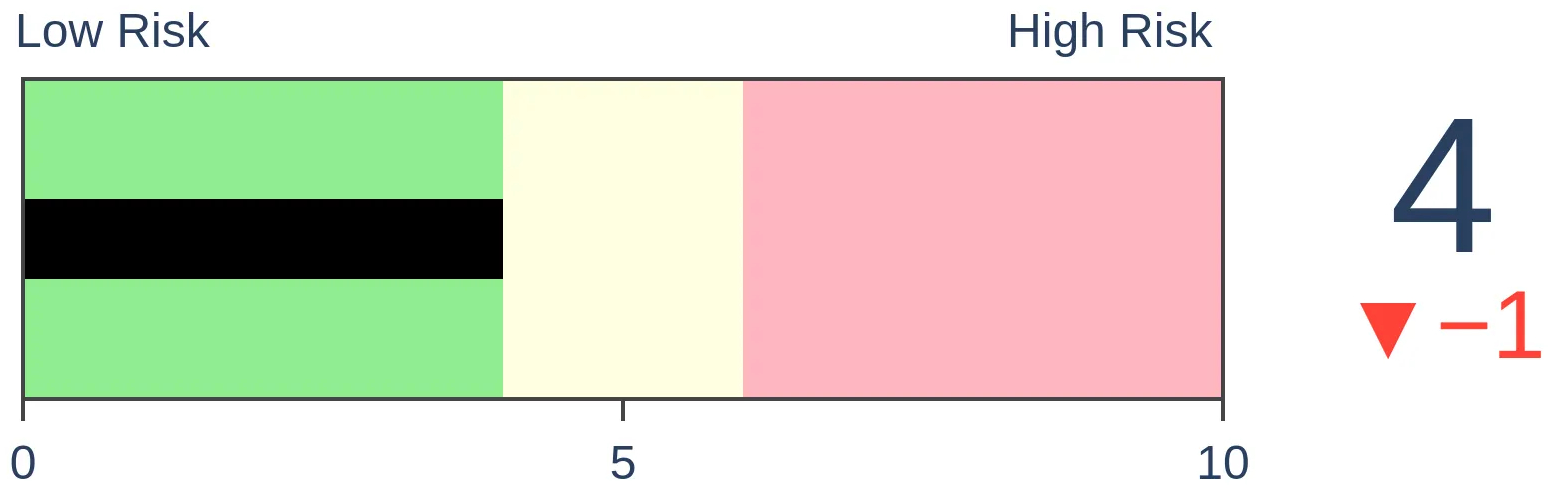
Stocks Medium-Term
|
|
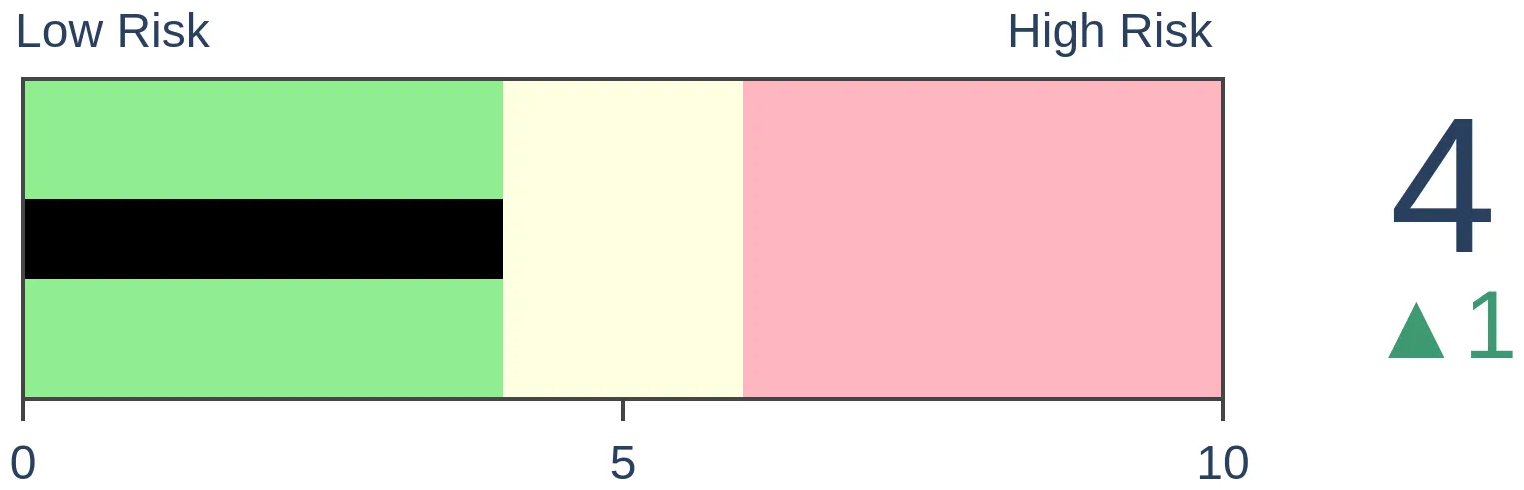
Bonds
|
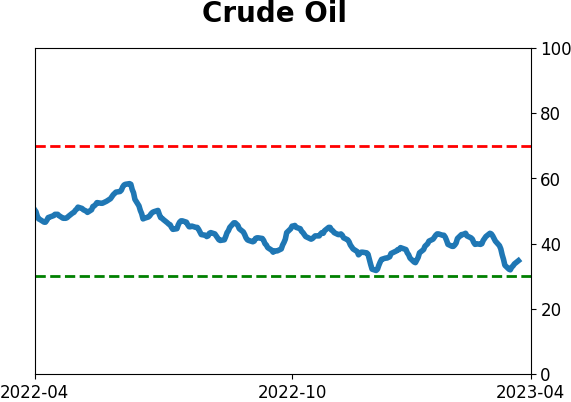
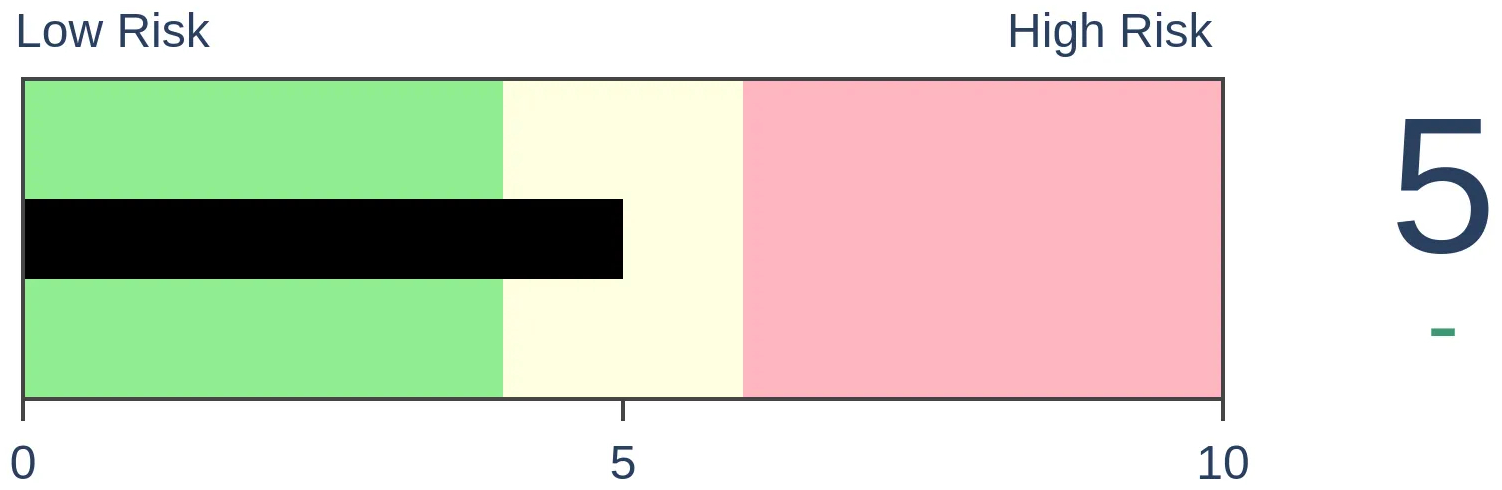
Crude Oil
|
|
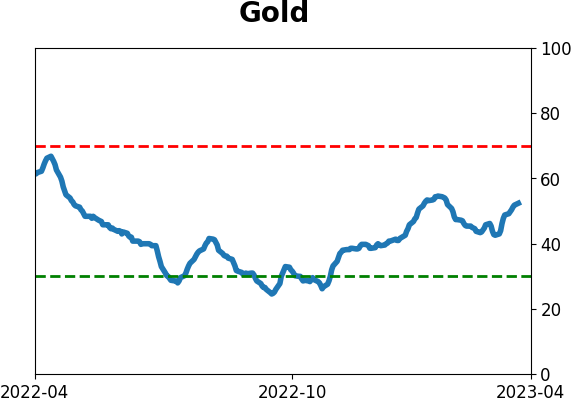
Gold

|
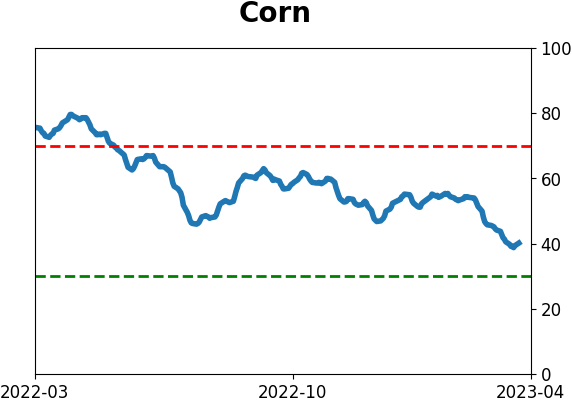
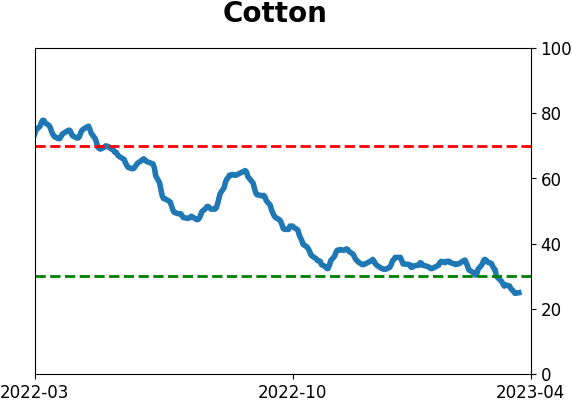
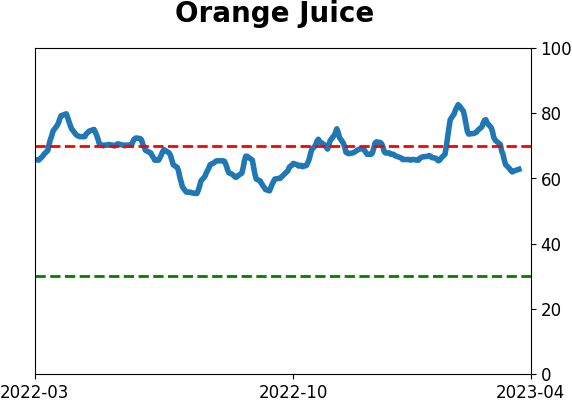
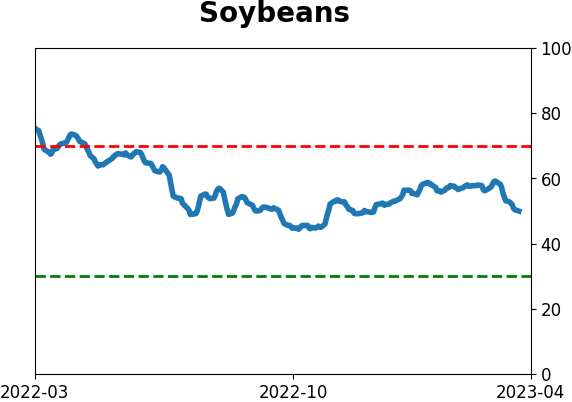
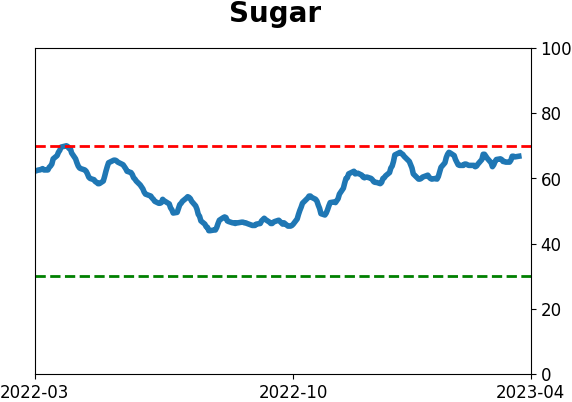
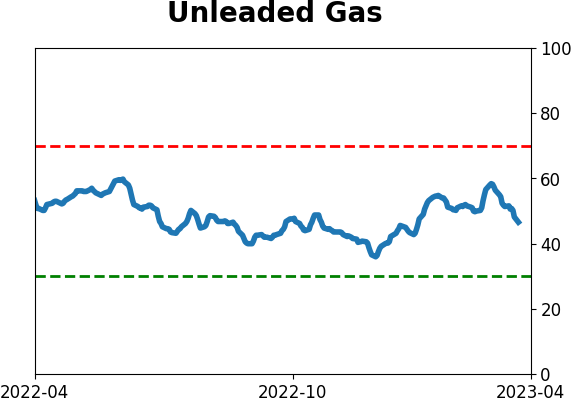
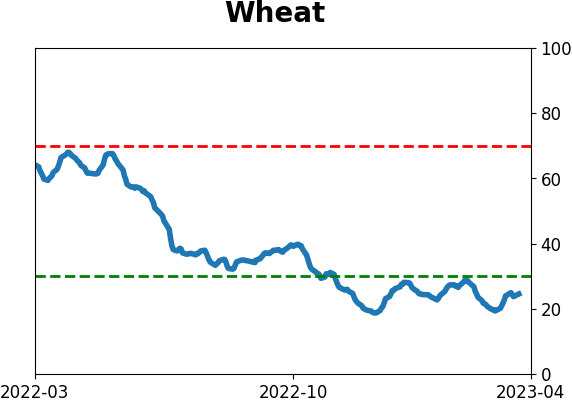
Agriculture
|
|
Research
By Jason Goepfert
BOTTOM LINE
Even though bond traders are pricing in heavier volatility in the weeks ahead, stock investors are not. The ratio between the VIX and MOVE indexes is near the lowest in 30 years. That has implications for swings in bond prices, as well as foreign stocks and the U.S. Financial sector.
FORECAST / TIMEFRAME
None
|
Key points:
- Implied volatility in the bond market has exploded relative to stock volatility
- The ratio between expected future moves in the two markets is near its lowest ever
- Low levels in the ratio preceded consistently lower bond volatility, higher foreign stocks, and rising Financials
Bond traders are pricing in much bigger moves than stock investors
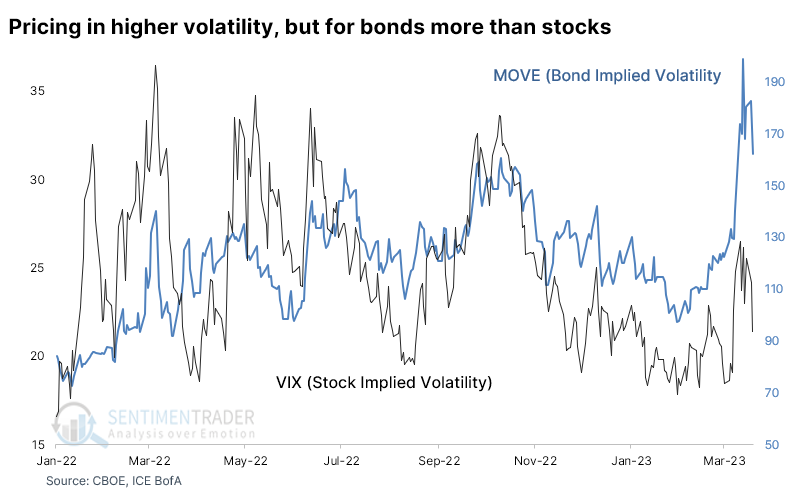
Thanks to the issues that all of us are hyper-aware of by now, volatility in the bond market has skyrocketed to one of the highest levels in 30 years. Wild swings in bond prices tend to freak out equity investors, so stock volatility tends to go hand-in-glove with bond volatility.
Not so much this time. Options traders are pricing in further dramatic swings in bond prices, but not so in stocks. The MOVE index, which monitors implied volatility in various maturities of Treasuries, has therefore become uncoupled from the VIX, which monitors options traders' expectations on stock volatility.
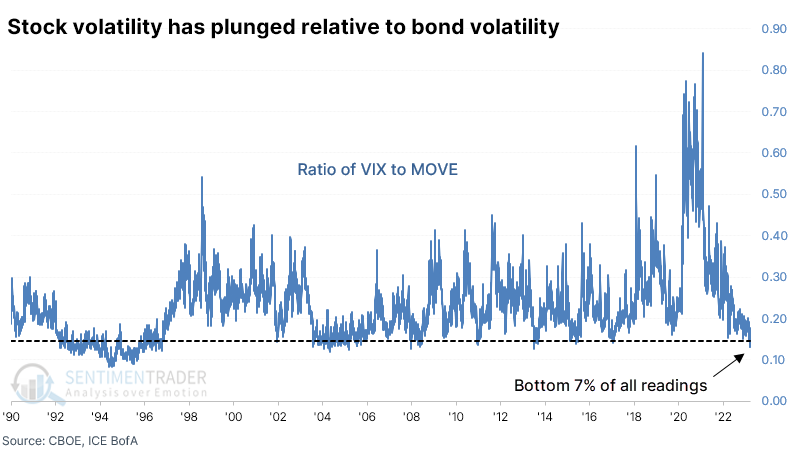
Because the VIX has remained subdued while MOVE has jumped, the ratio between them has plunged to one of the lowest readings in more than 30 years. It's now in the bottom 7% of all readings.
Implications for different opinions on stock vs. bond volatility
When options traders in the stock and bond markets form such disparate opinions about what volatility is likely to be in their respective markets, analysts tend to assume the bond market is smarter. And that typically means that high bond volatility should lead to high stock volatility, which virtually always means a big drop.
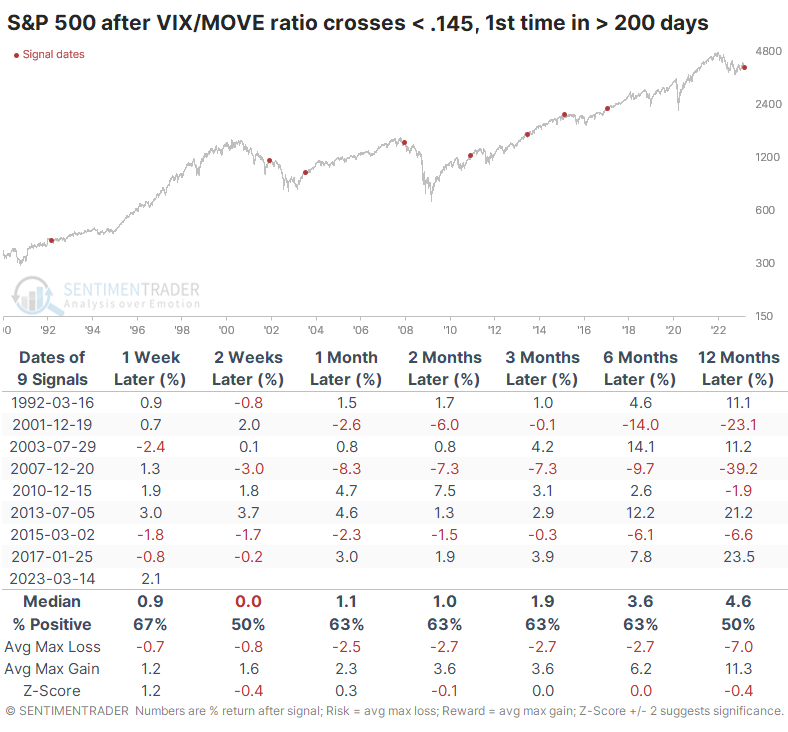
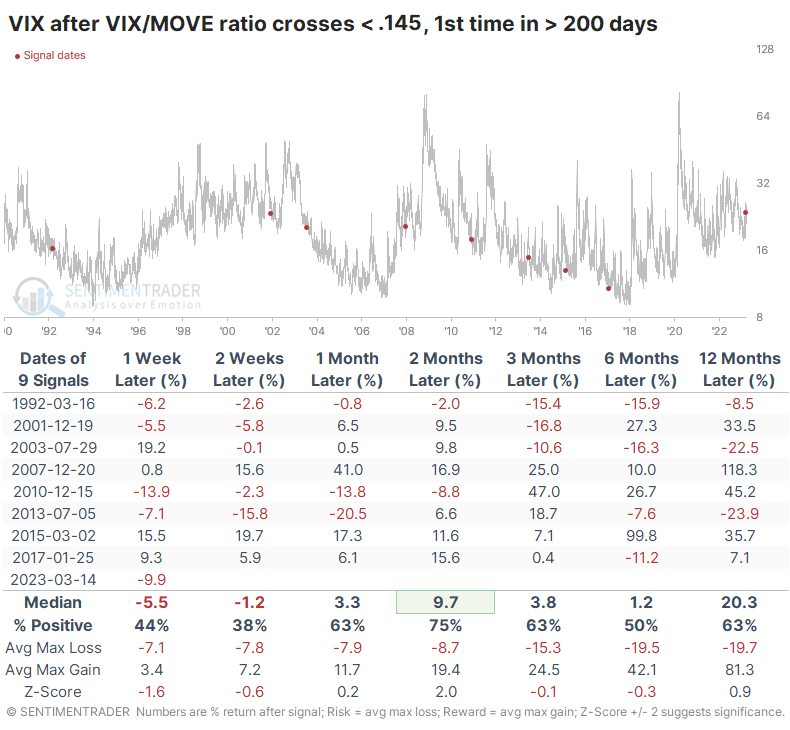
The evidence doesn't support that conclusion. The table below shows future returns in the S&P 500 whenever the ratio between the VIX and MOVE drops below 0.145 for the first time in more than 200 sessions. While the S&P didn't show significant gains going forward, it also didn't decline consistently. Over the next three months, there was only a single loss of more than -0.3%.
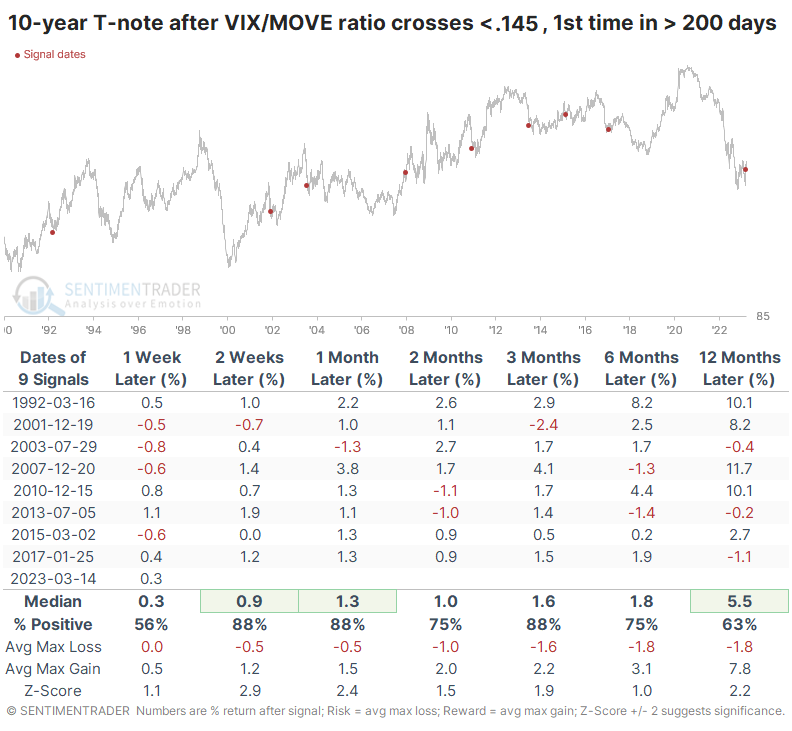
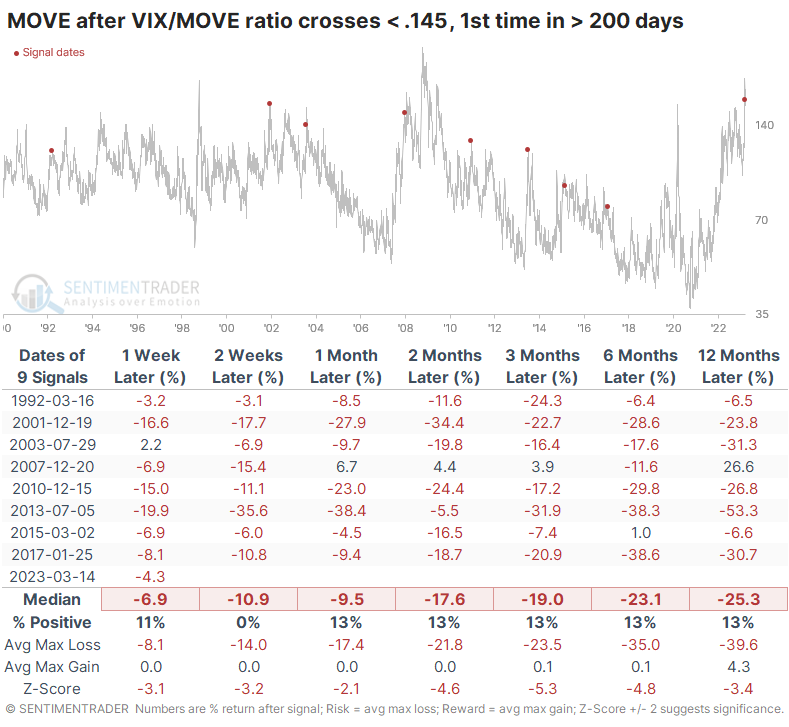
It was a more consistent signal for 10-year Treasury note prices. Across all time frames, that futures contract enjoyed higher-than-average returns with relatively low risk. Three months later, the price on 10-year notes rallied all but one time, and that loss was quickly erased. Granted, the past 30 years have been dominated by a favorable bond market, which virtually everyone believes is no longer applicable.
As for volatility, the VIX tended to rise in the couple of months after the ratio dropped to such a low level. It was higher two months later after seven of the nine signals - but as we saw above, rising volatility doesn't necessarily mean lower stock prices. There is a correlation, but it's not perfect.
More notable was the impact on bond volatility. It was virtually guaranteed to decline across almost every time frame. The MOVE index suffered consistent and heavy losses across the board.
Using MOVE to trade other markets
Taking advantage of that likelihood can be difficult unless a trader wishes to construct difficult and risky strategies like selling straddles on Treasury futures contracts.
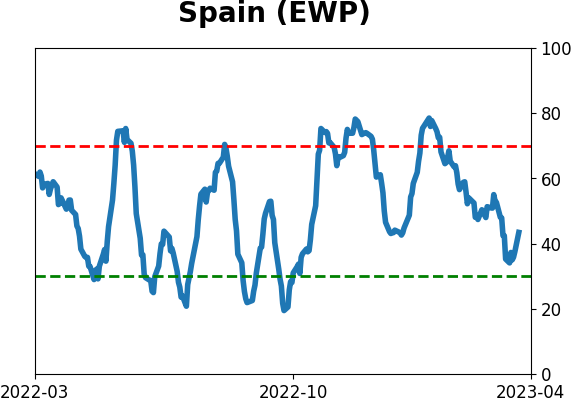
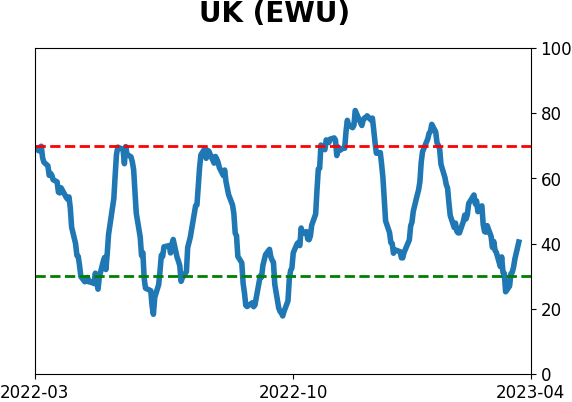
According to Bloomberg calculations, the MOVE index has had a relatively high negative correlation with many non-U.S. ETFs. The 3-month correlation between MOVE and EWO, the Austria ETF, was -0.57. It was also strongly negative for virtually every major fund that tracks non-U.S. stock markets.
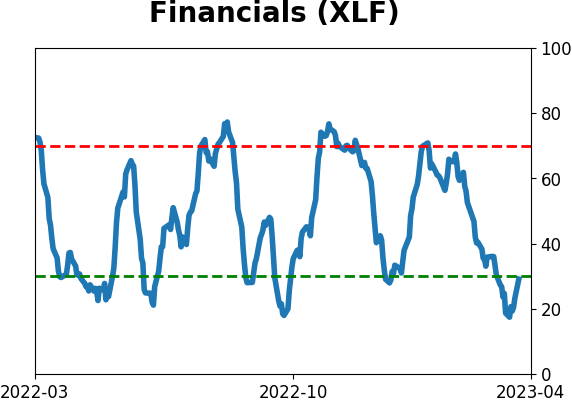
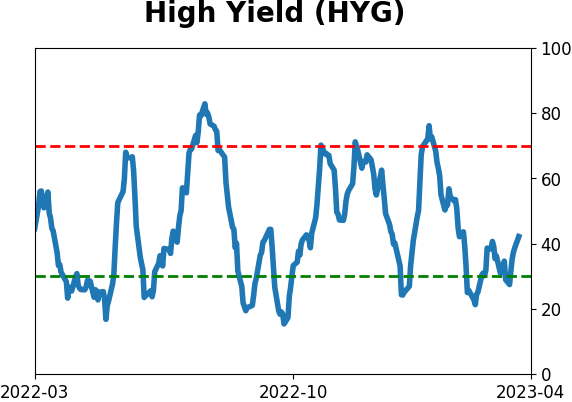
Among U.S.-based ETFs, it showed the highest negative correlation to Financials (XLF) and high-yield bonds (HYG, JNK).
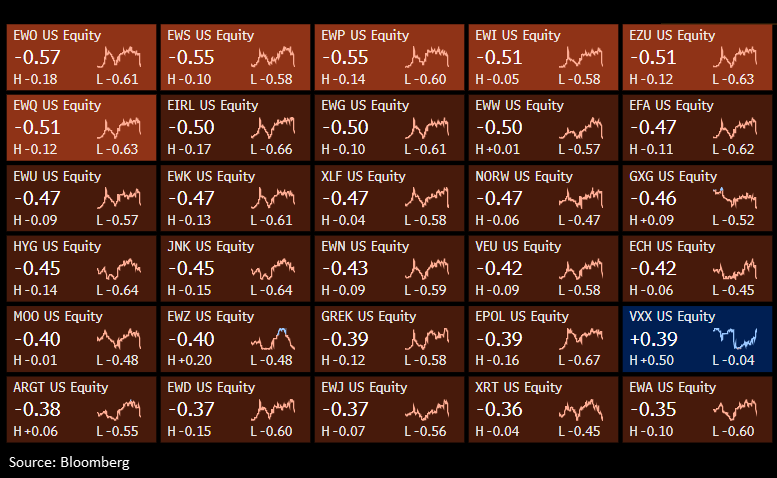
A high negative correlation would suggest that if MOVE does, indeed, decline in the weeks and months ahead, then these funds should rise. Of course, a trader then has to bet that not only does MOVE decline, but the correlations hold, which introduces additional risk.
Among S&P 500 stocks, Financials dominated the negative correlations. First Republic (FRC), State Street (STT), and KeyCorp (KEY) had the most negative correlations to bond volatility.
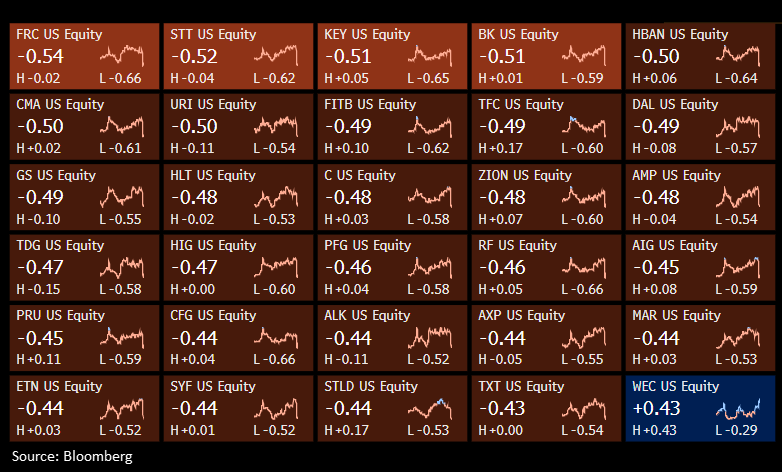
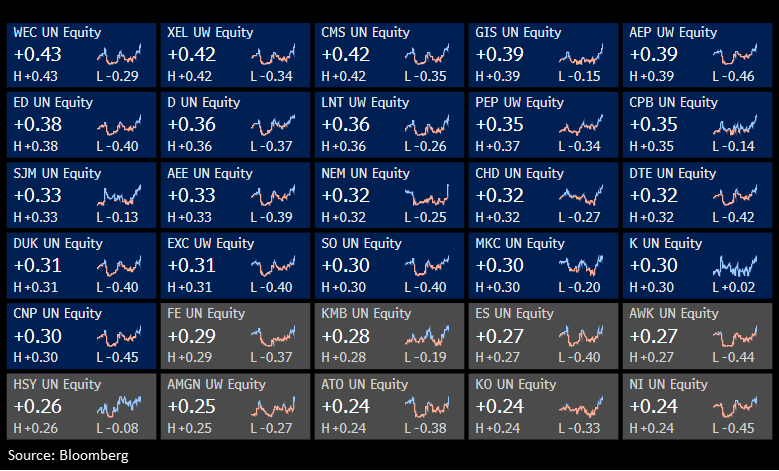
Interestingly, the most positive correlations between the MOVE index and S&P 500 stocks were focused on the Energy sector. While these correlations weren't as high, stocks like WEC Energy Group (WEC), Xcel Energy (XEL), and CMS Energy (CMS) could be vulnerable if MOVE declines.
What the research tells us...
Dramatic moves across markets always bring out the doomsayers, especially among self-style macro analysts. They think every big move in every market is always an indication that stocks are going to crash - especially when it comes to the bond market. And sometimes, that has come to pass. But much more often, it was a nothing burger. Even if the VIX rose in the weeks and months ahead, it didn't necessarily mean a drastic decline in stock prices.
What it did mean, with impressive consistency, was that volatility in the bond market was very likely to decline, and quite soon. That tended to lead to better returns in non-U.S. stock markets and the domestic Financial sector.
Indicators at Extremes
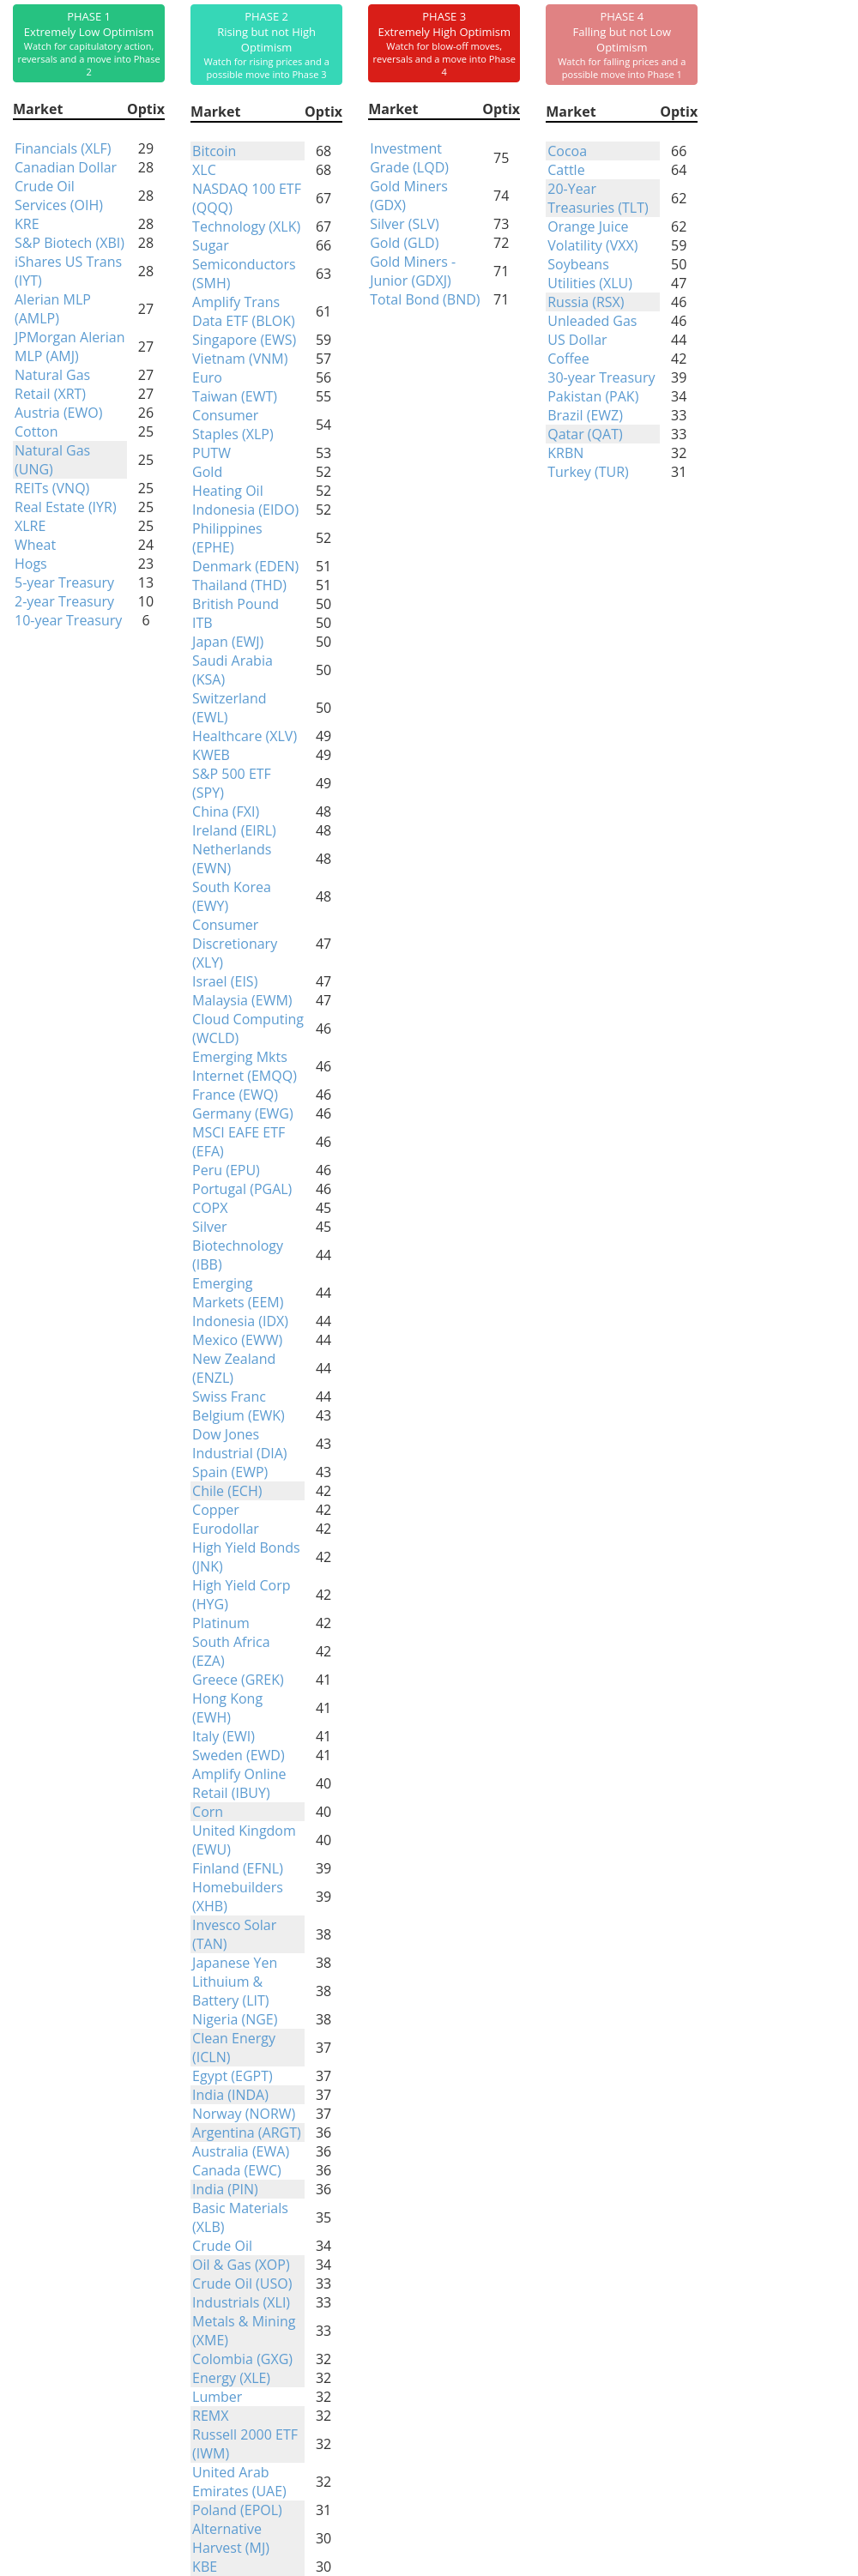
Phase Table
Ranks
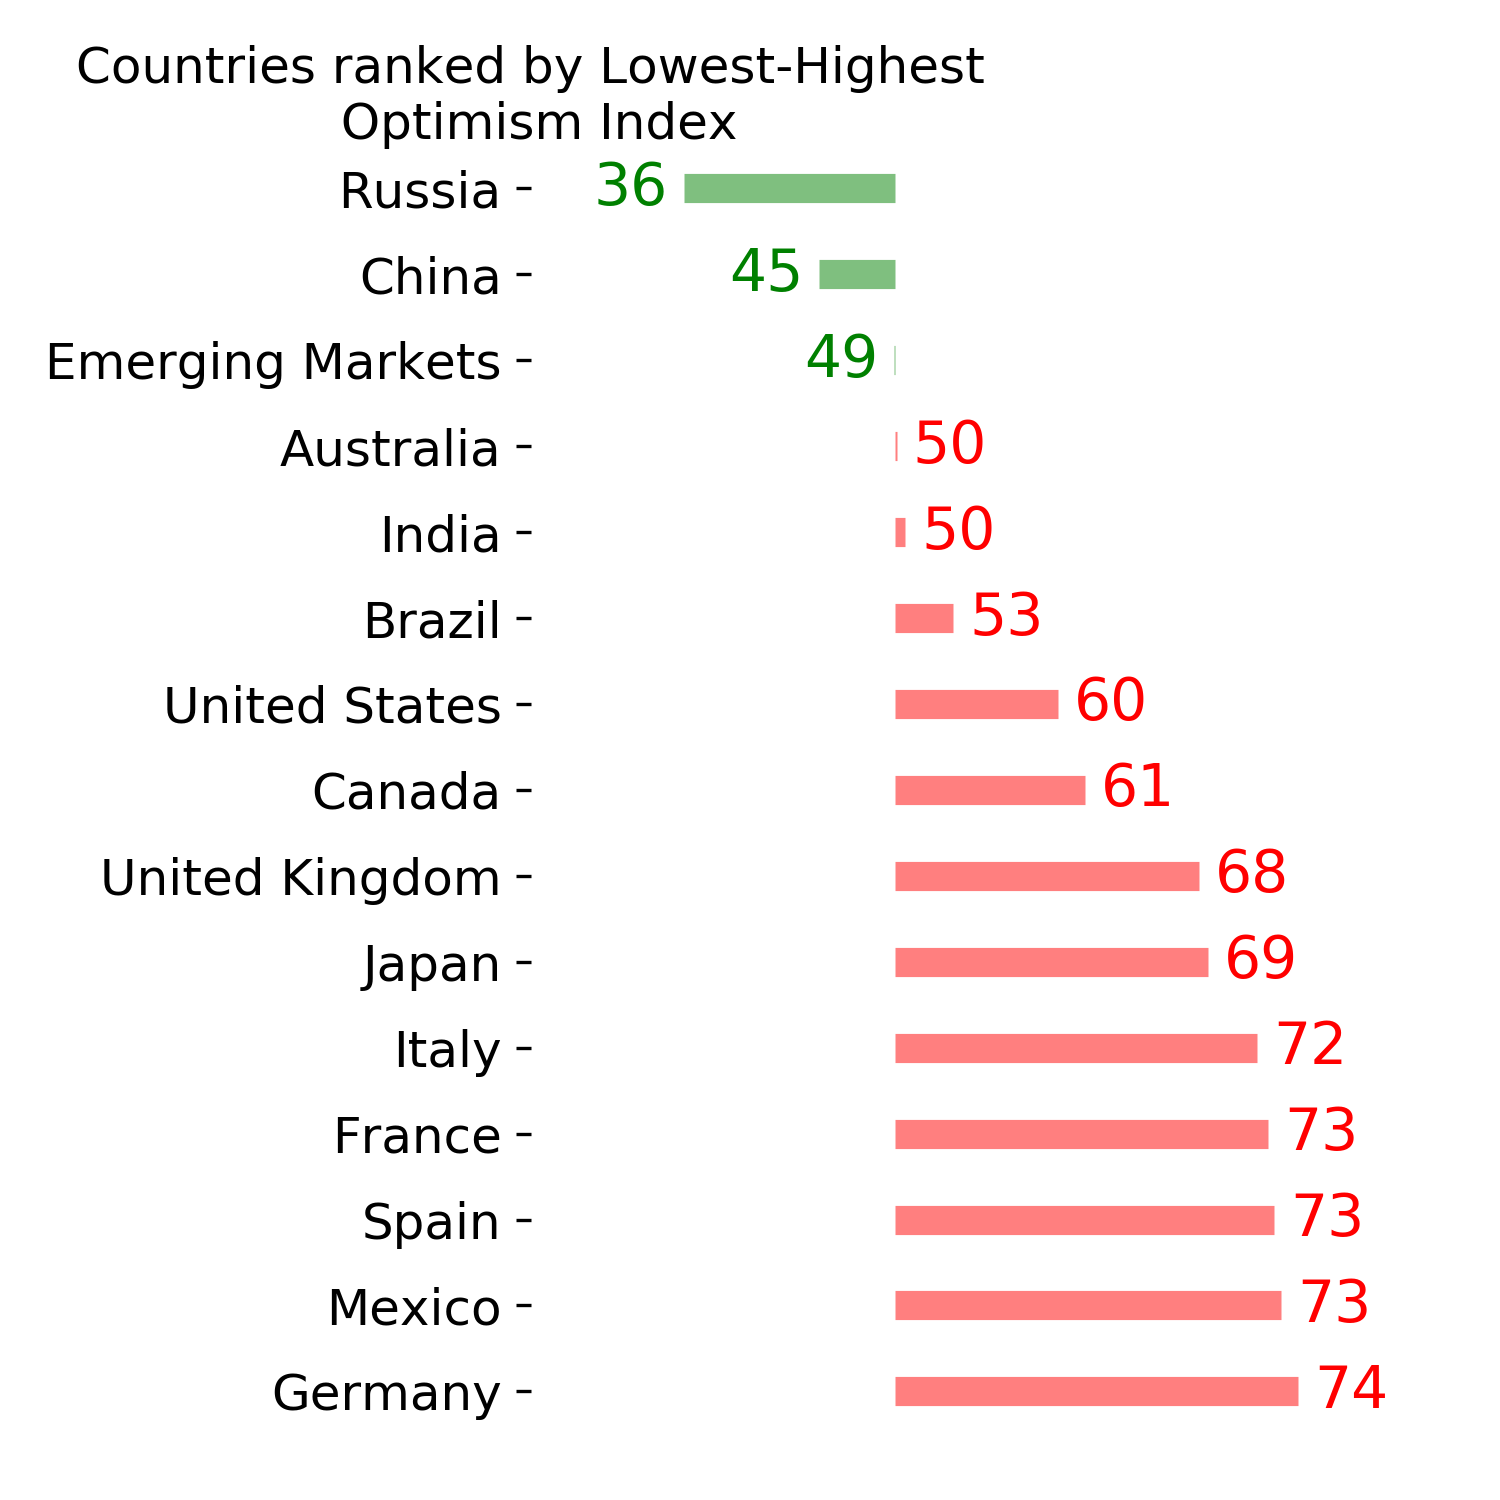
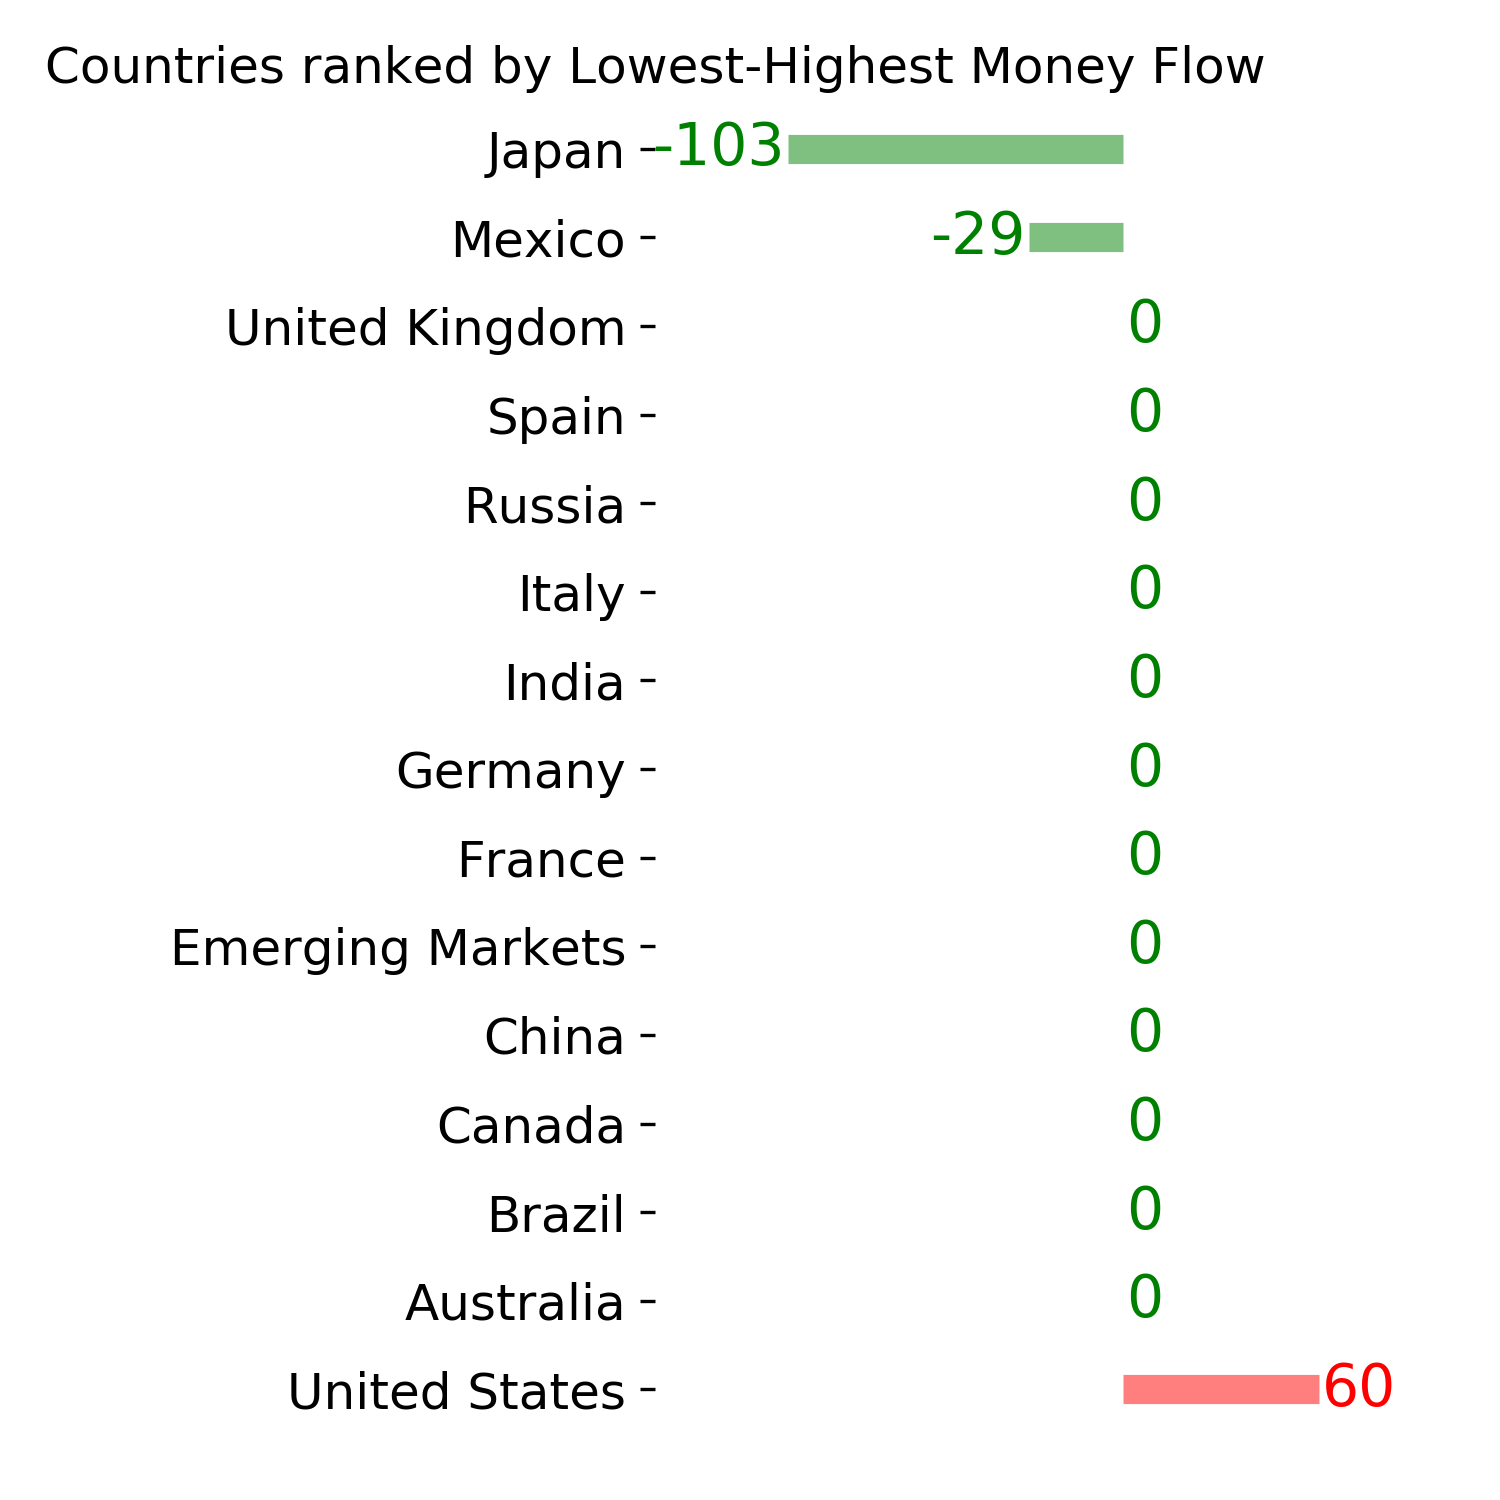
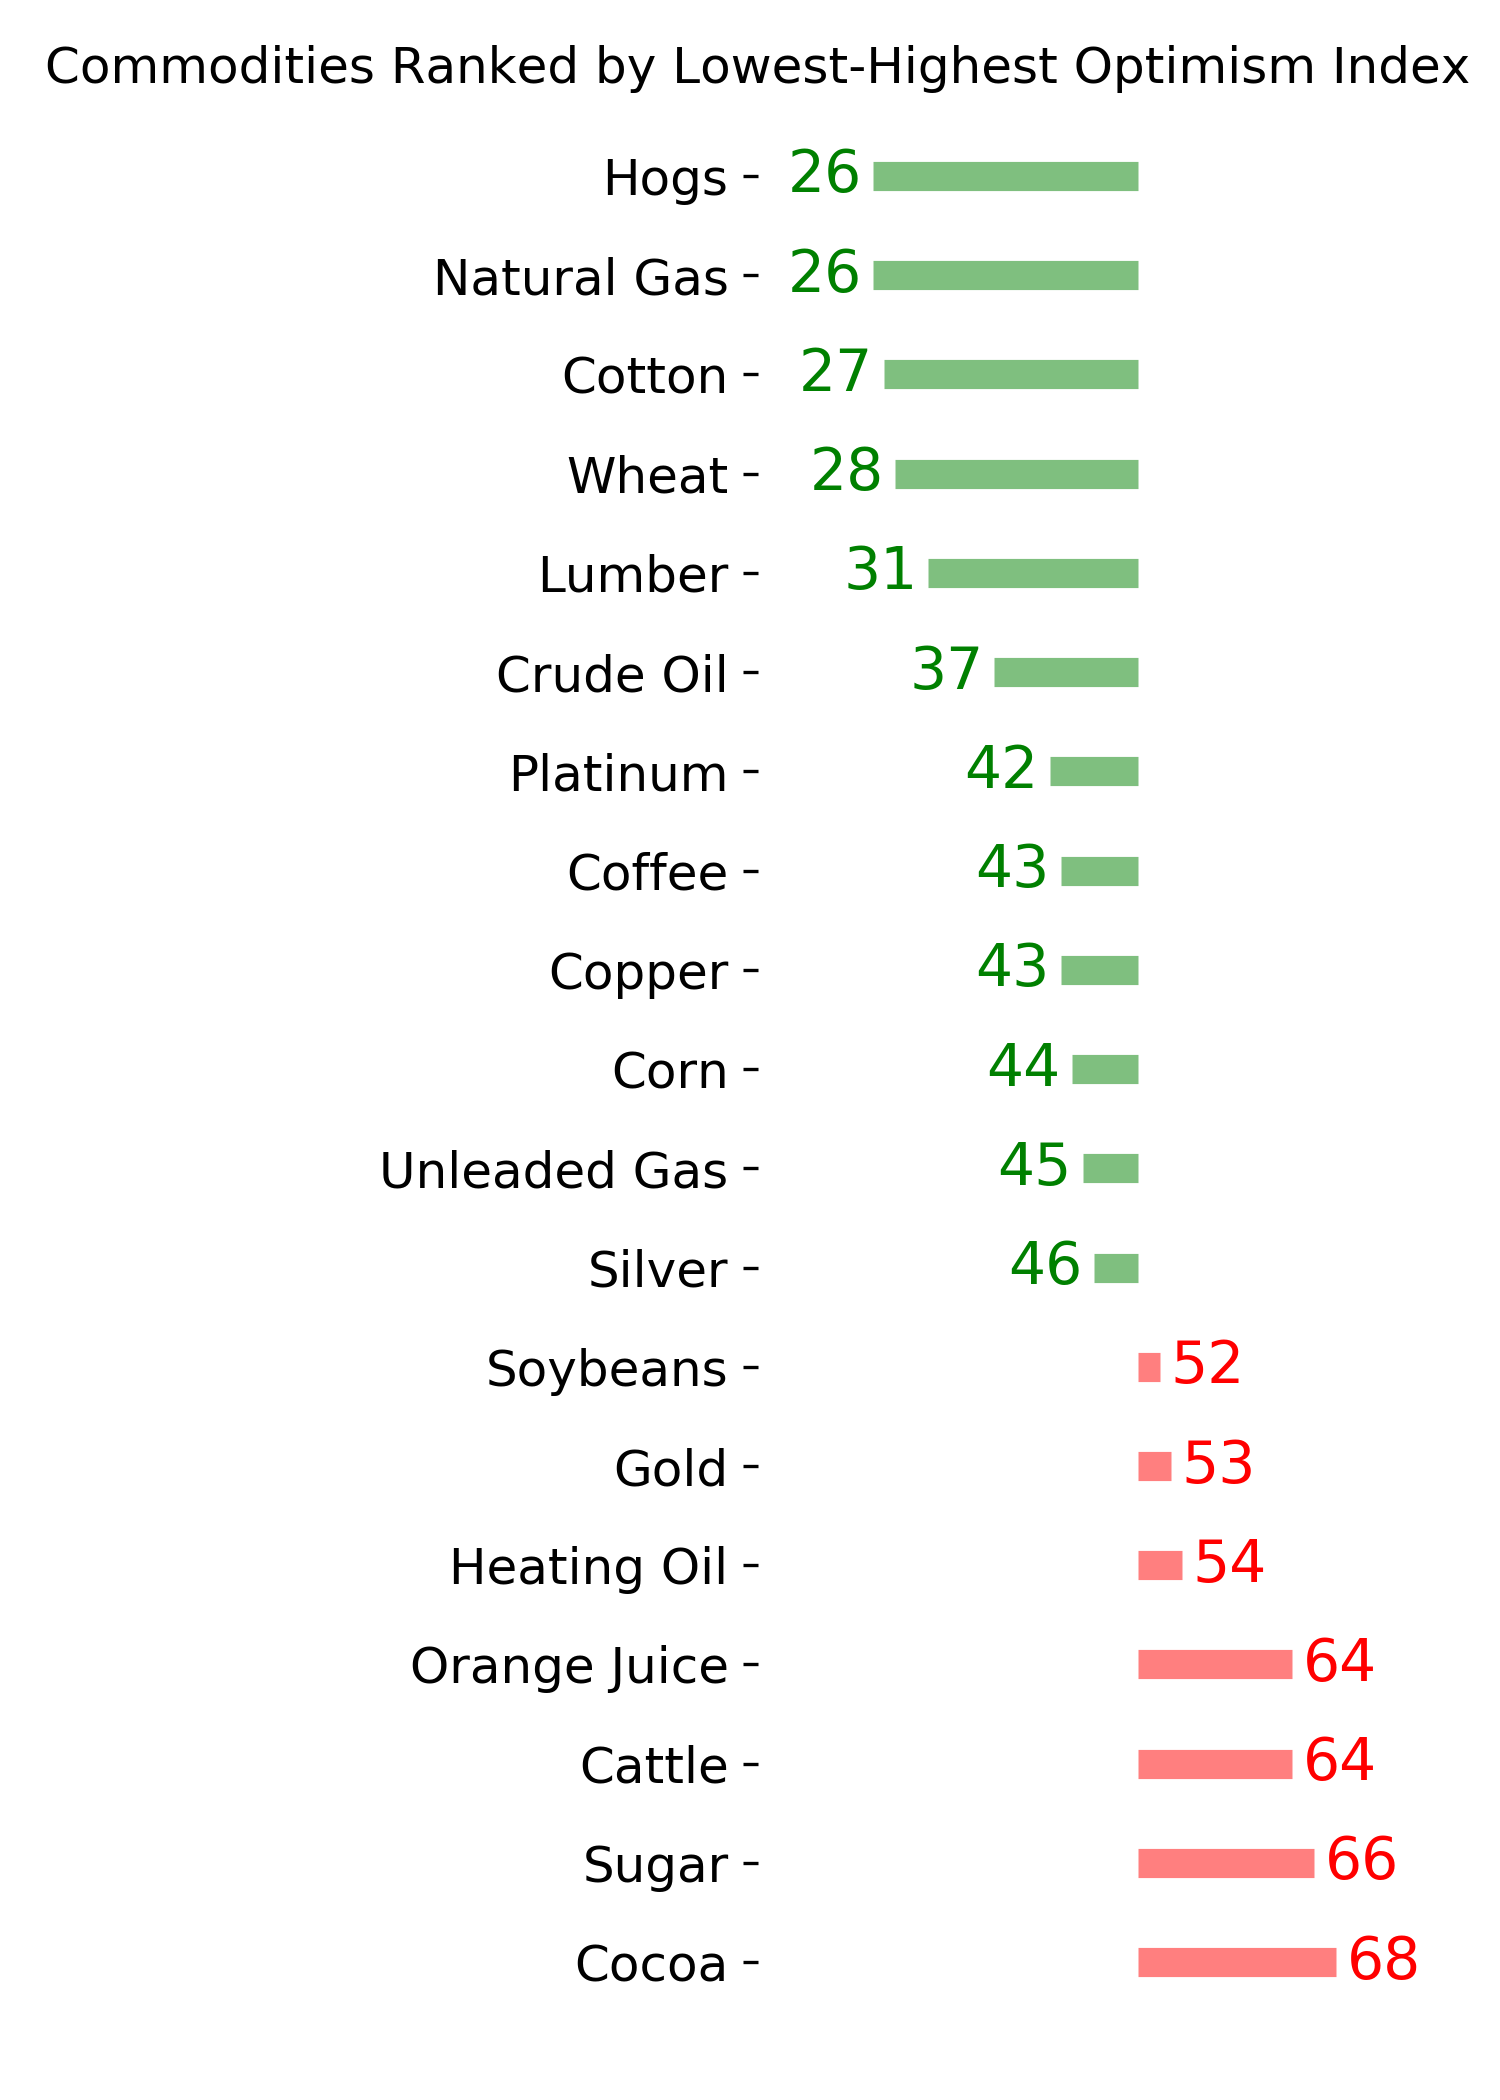
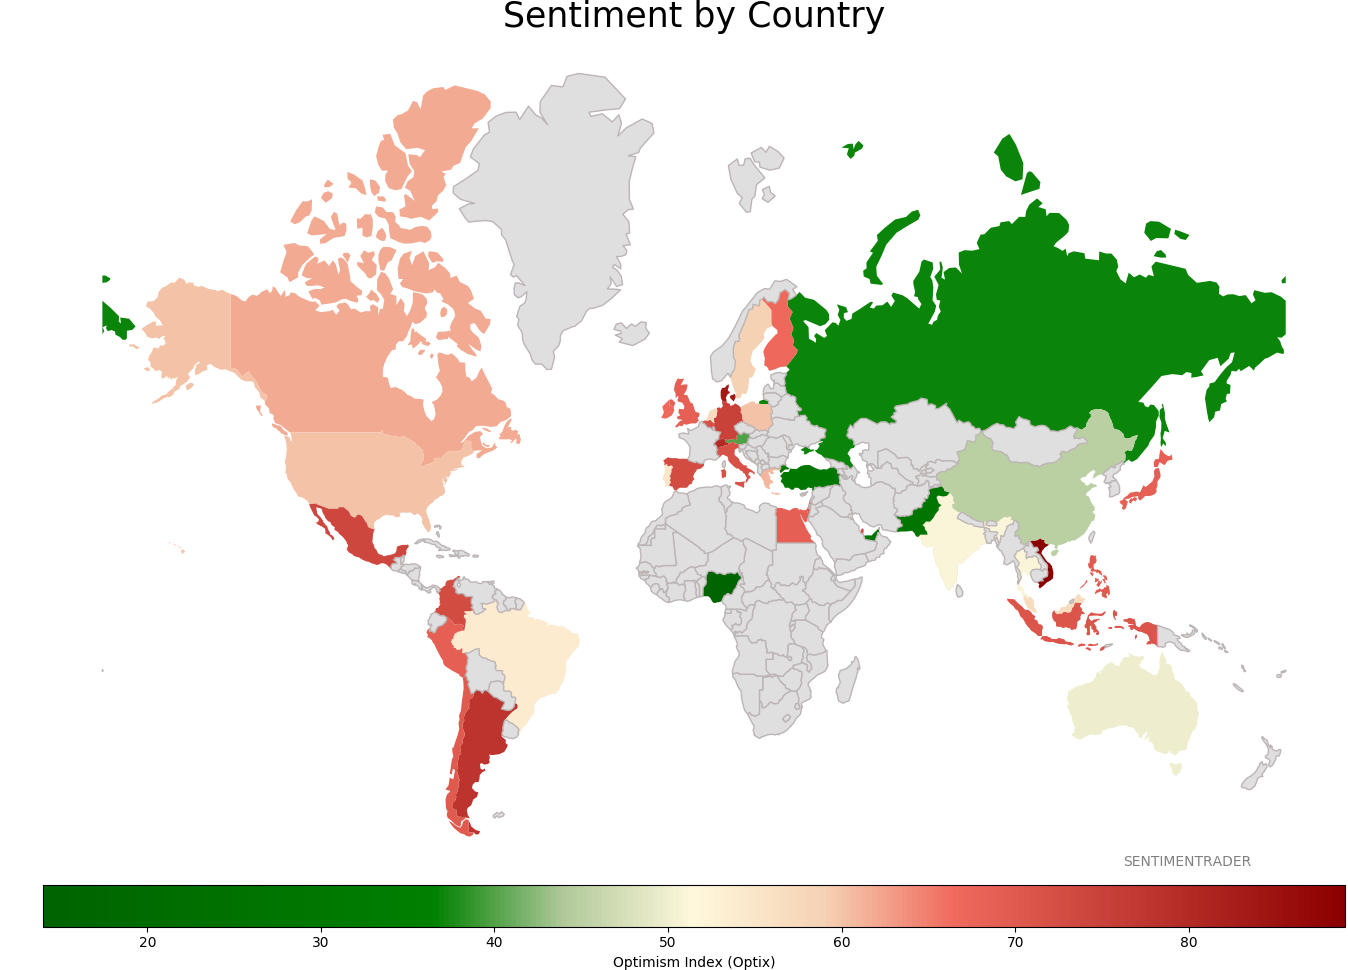
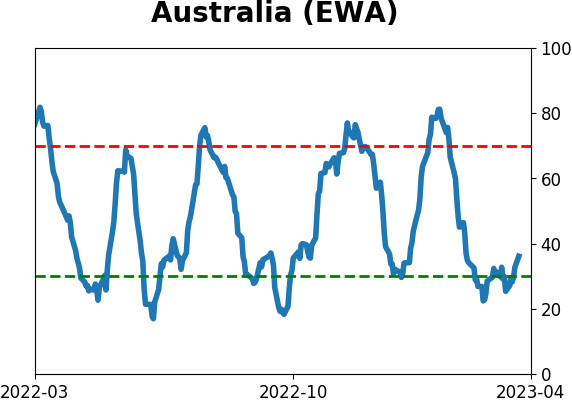
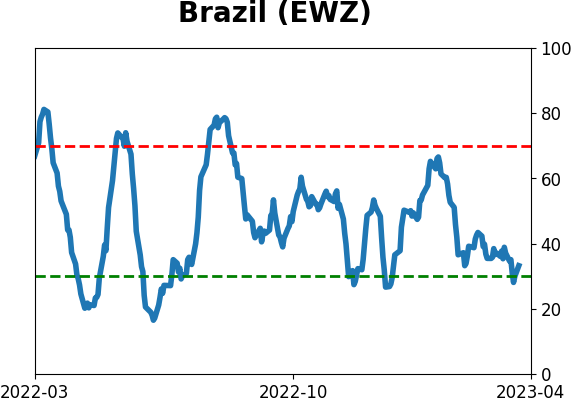
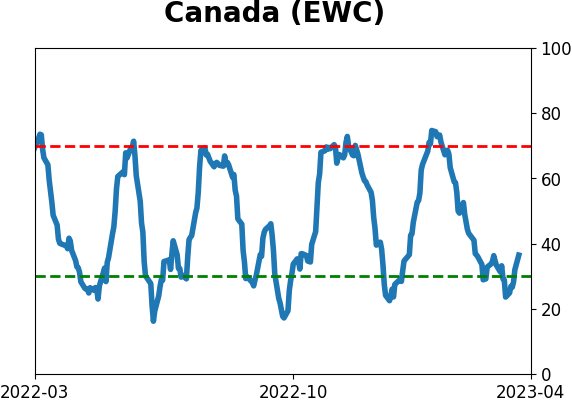
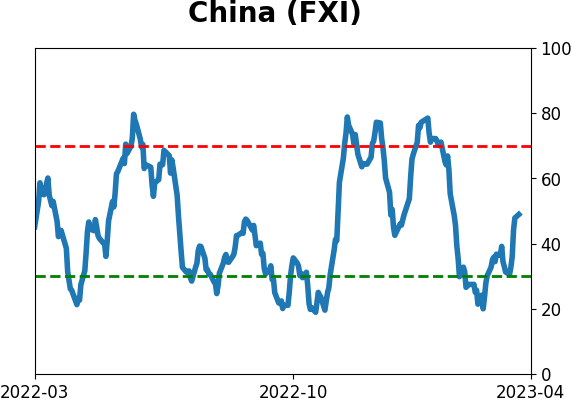
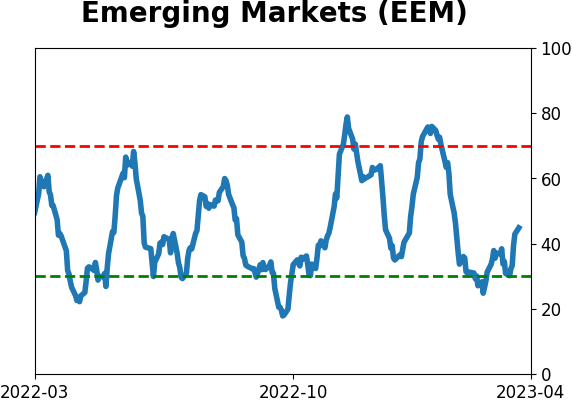
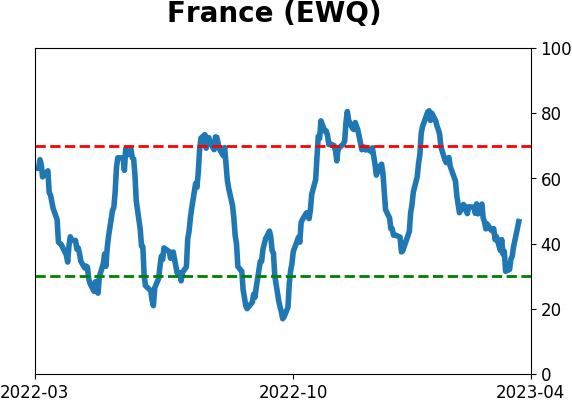
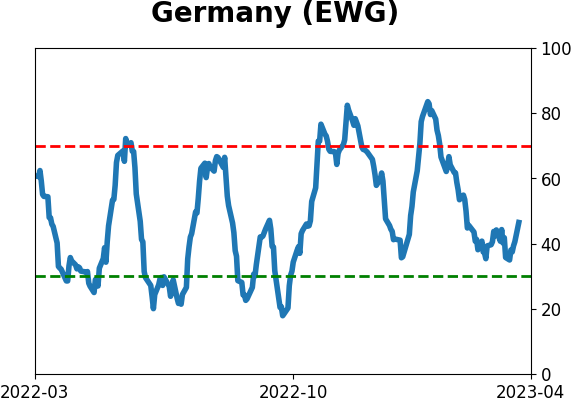
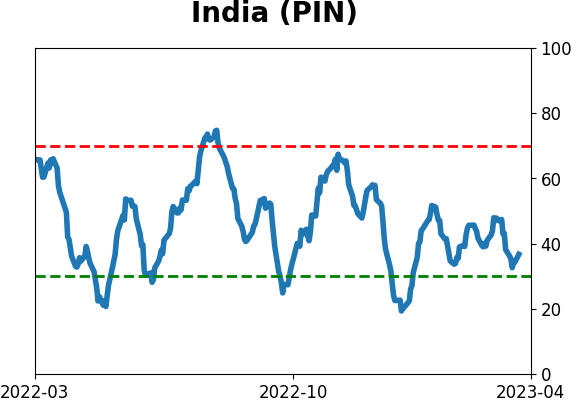
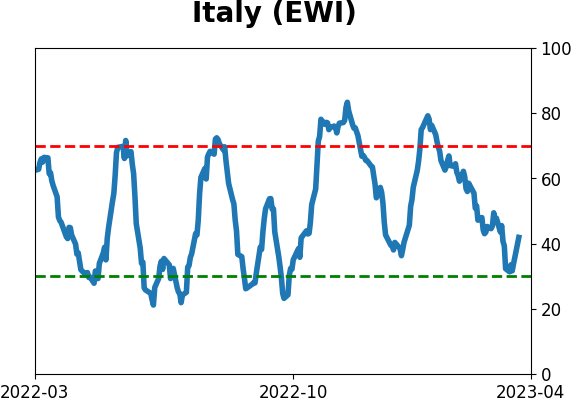
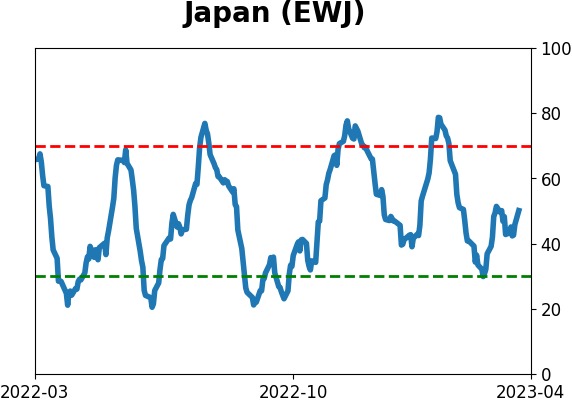
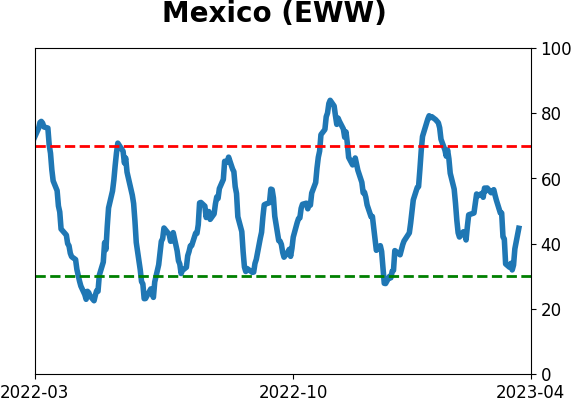
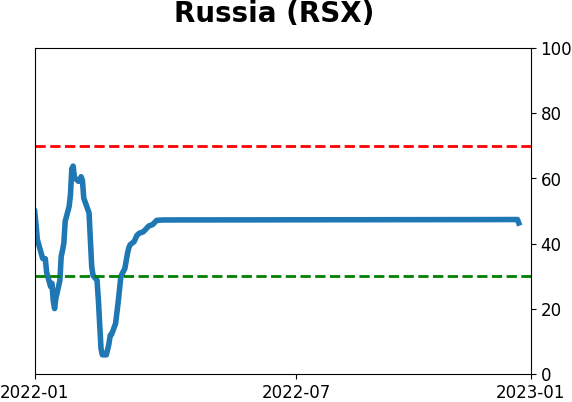
Sentiment Around The World
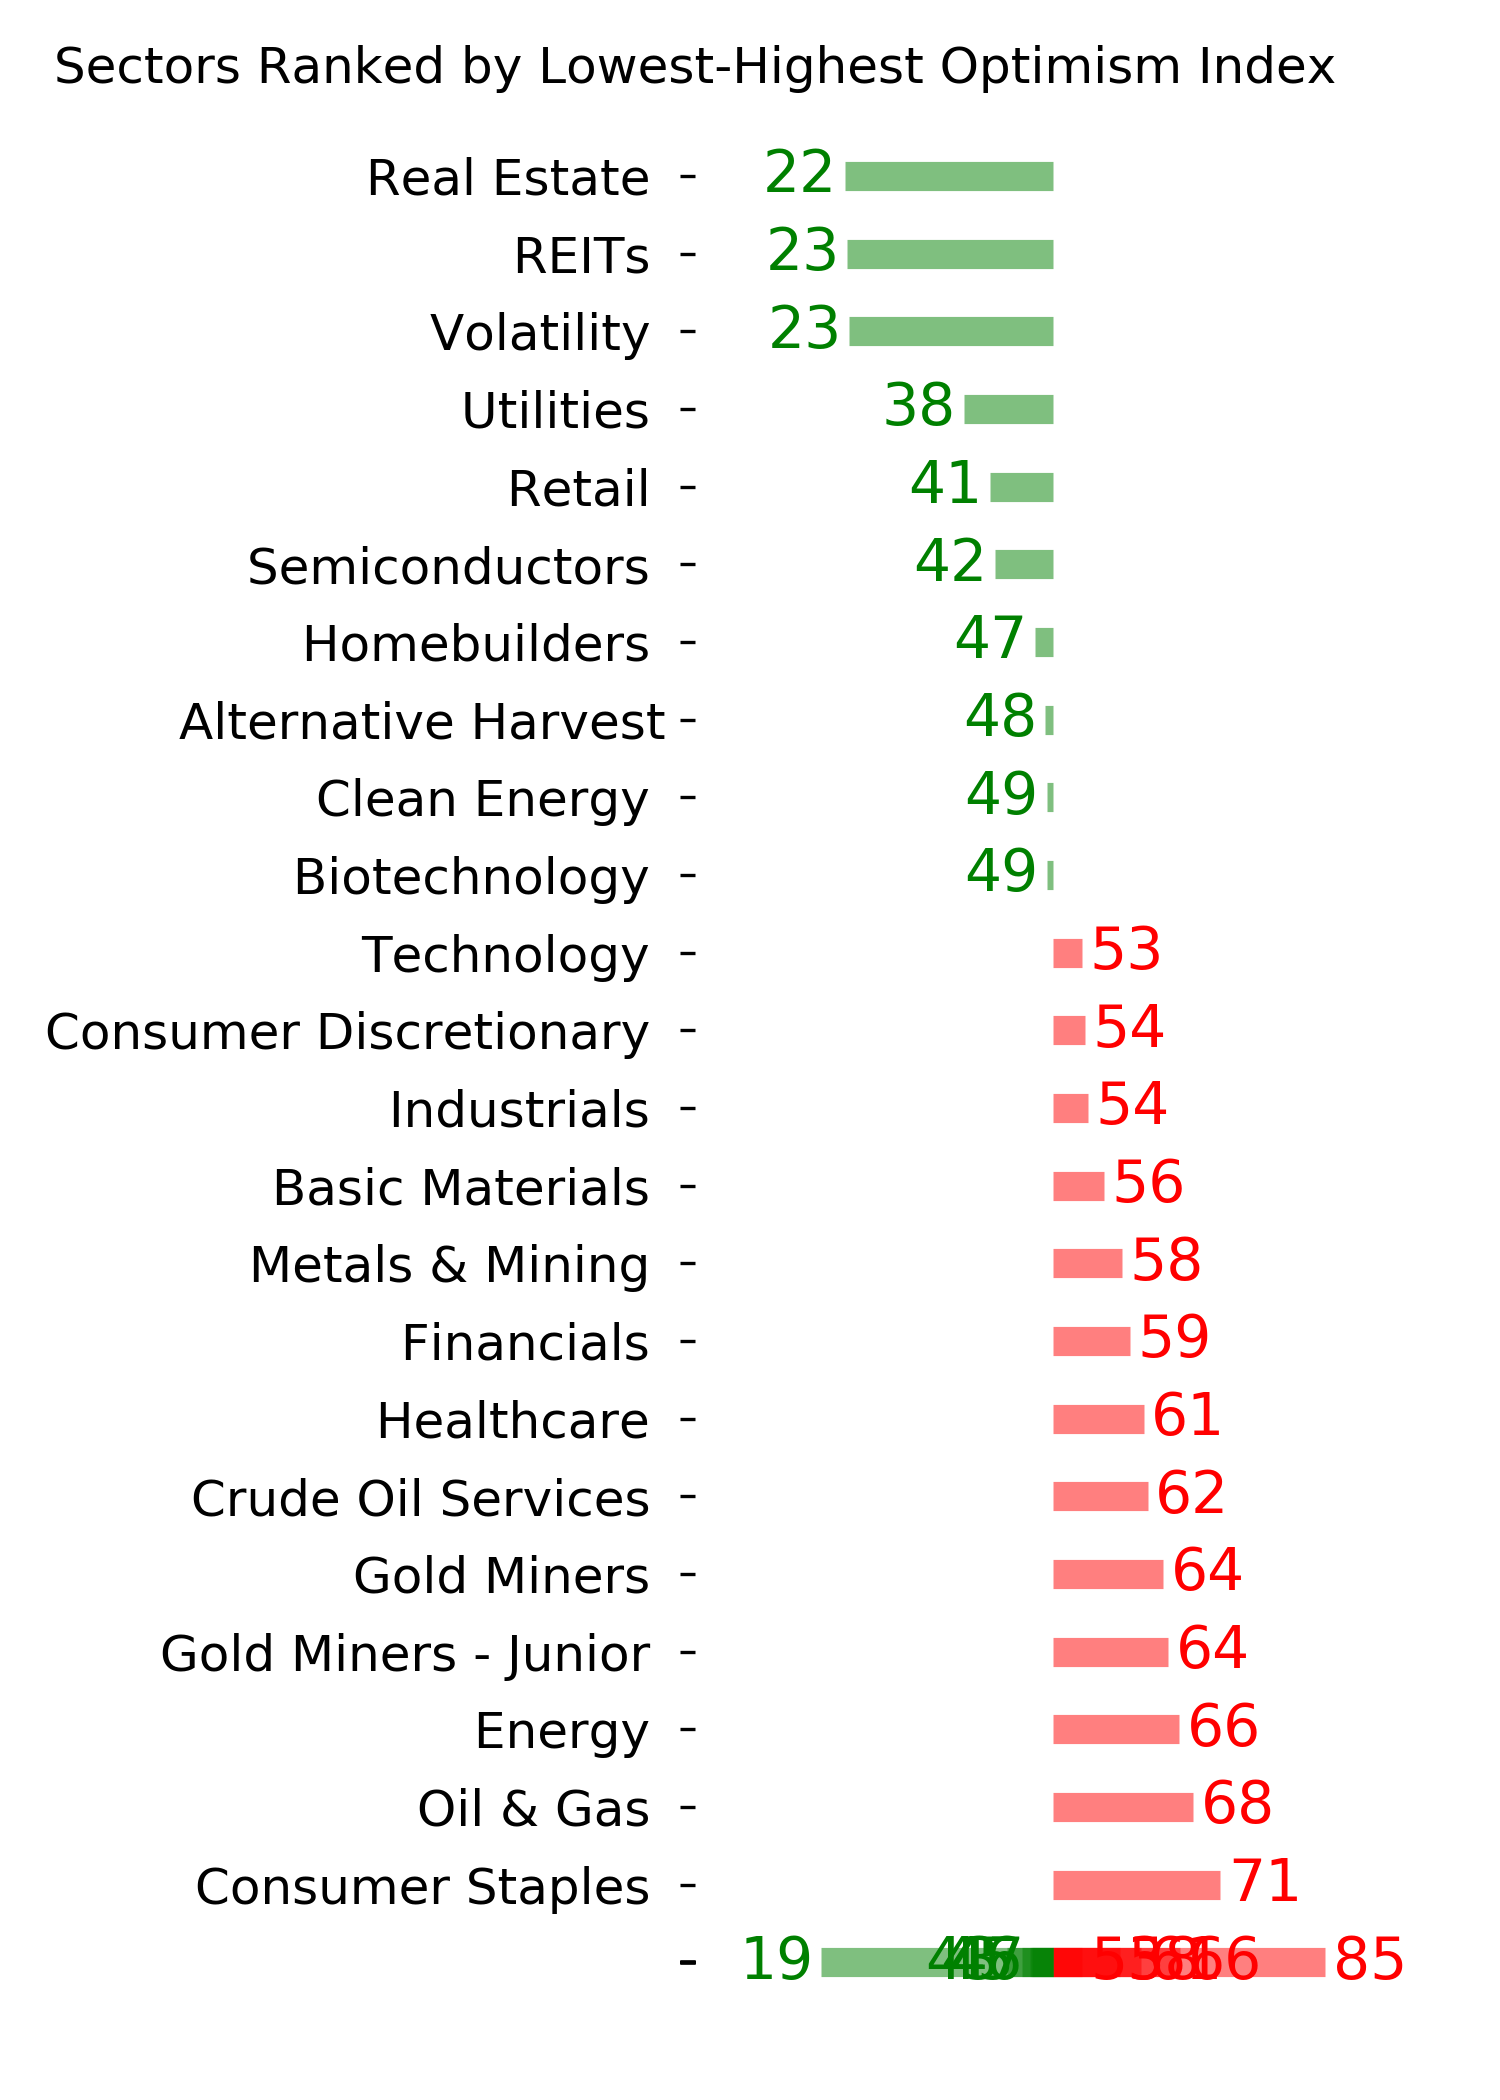
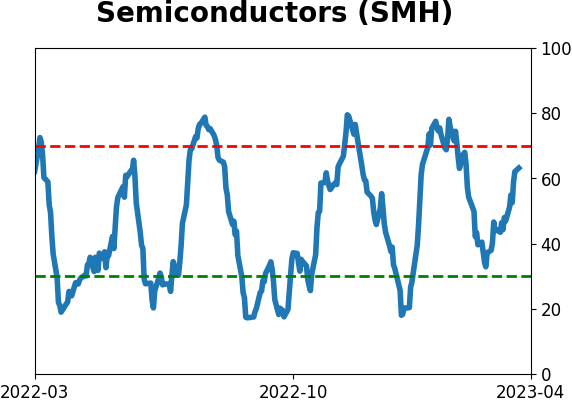
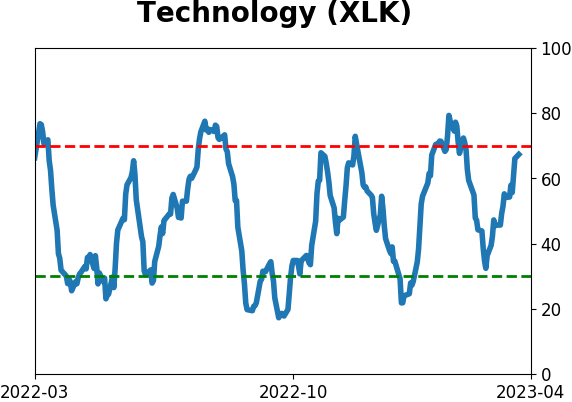
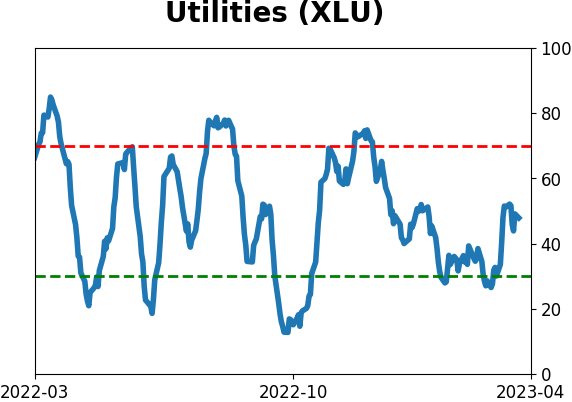
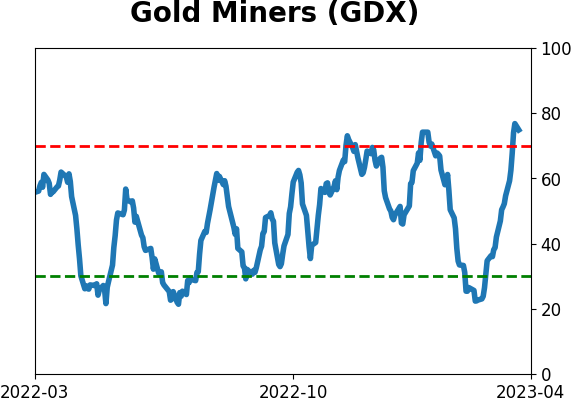
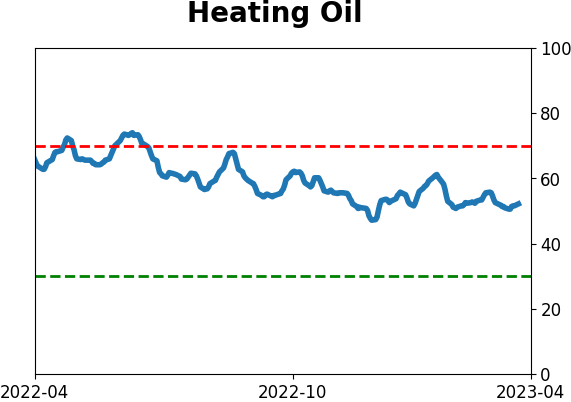
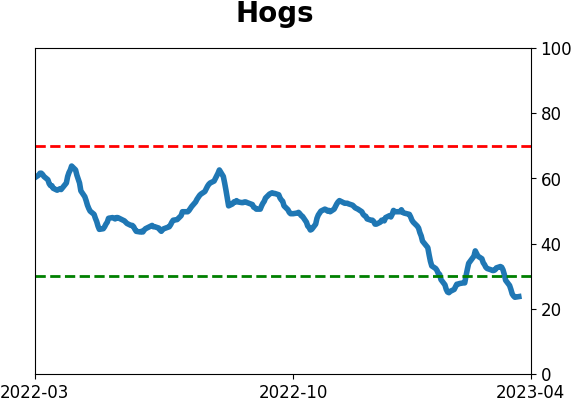
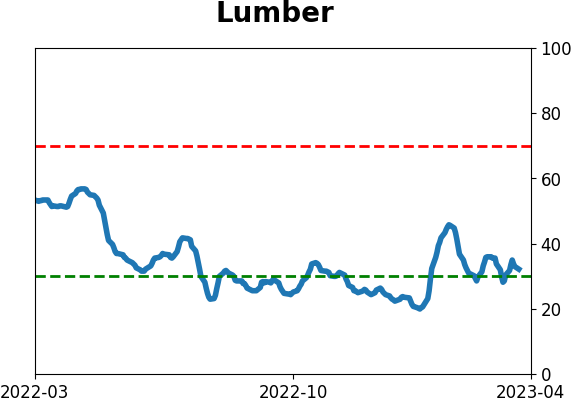
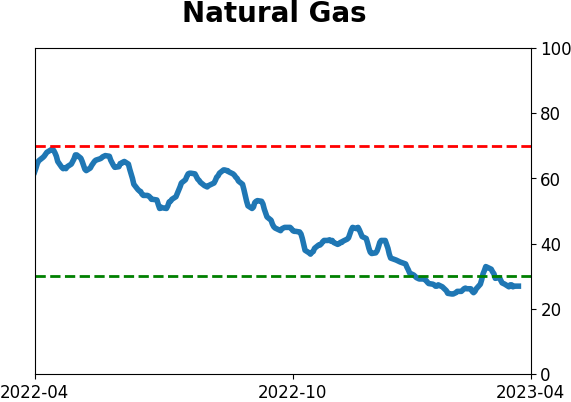
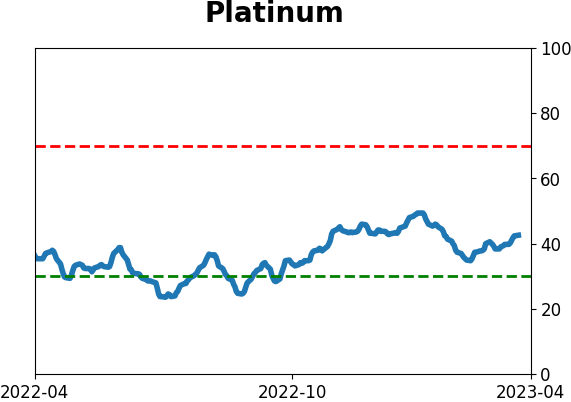
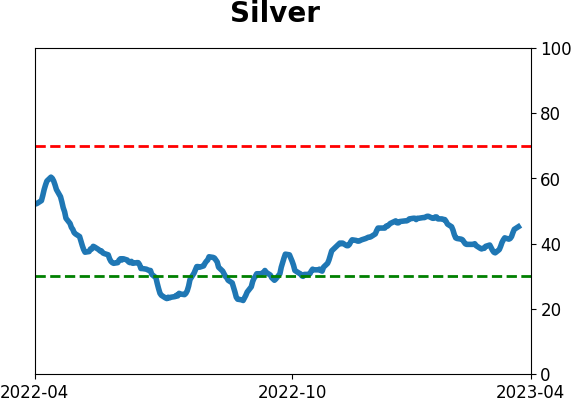
Optimism Index Thumbnails
|
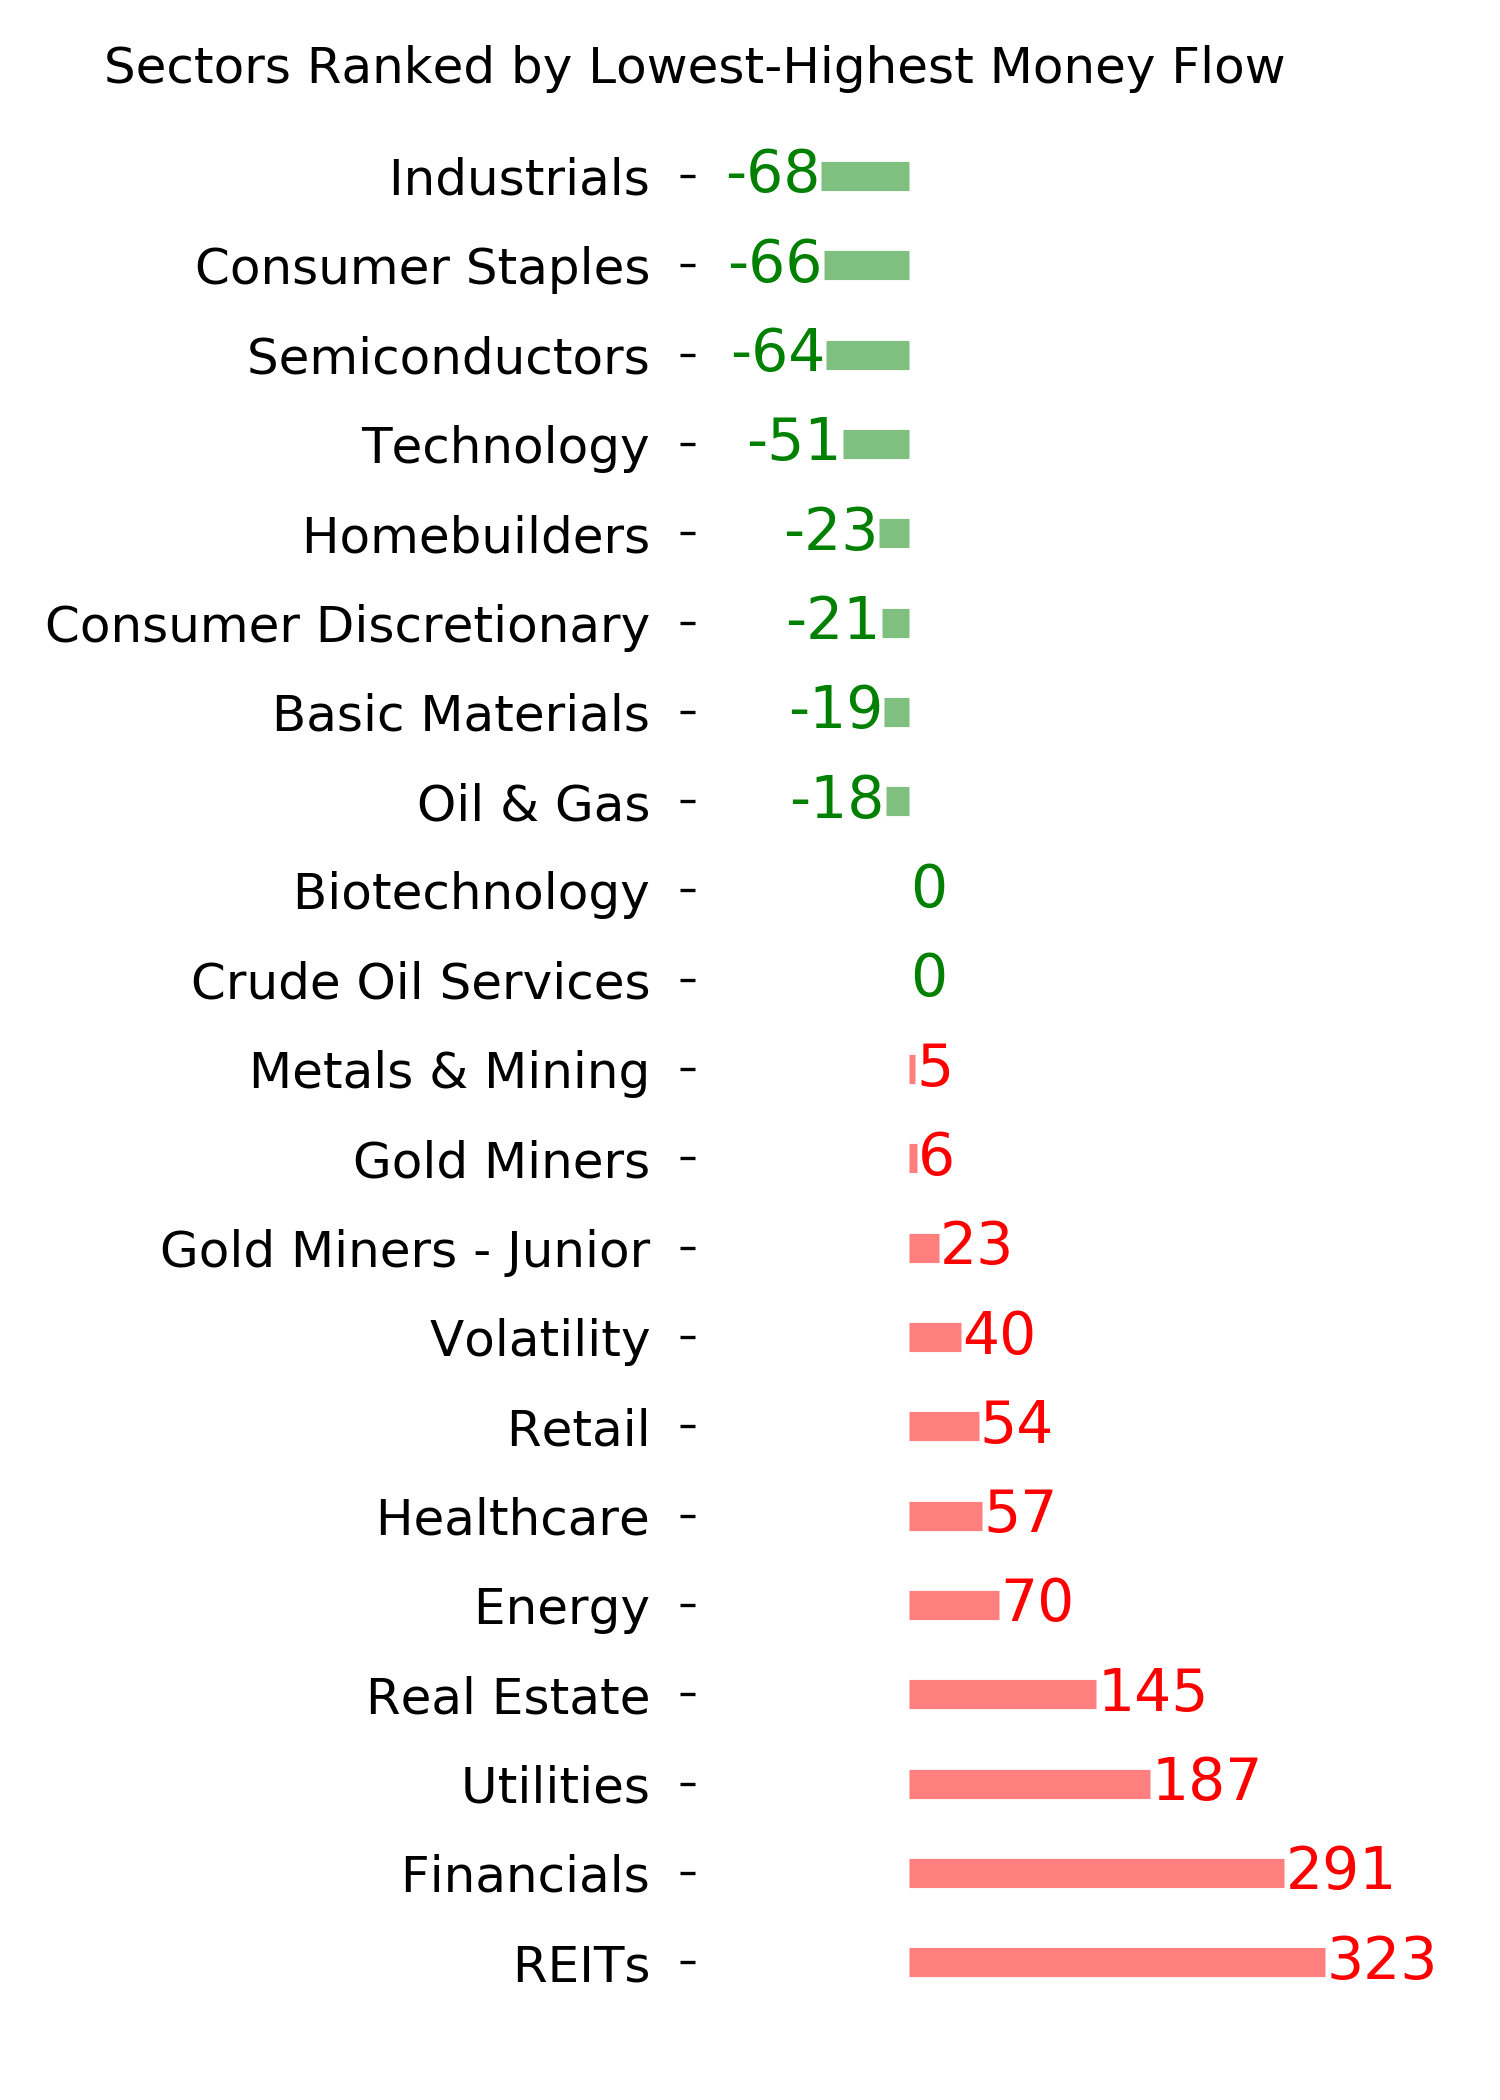
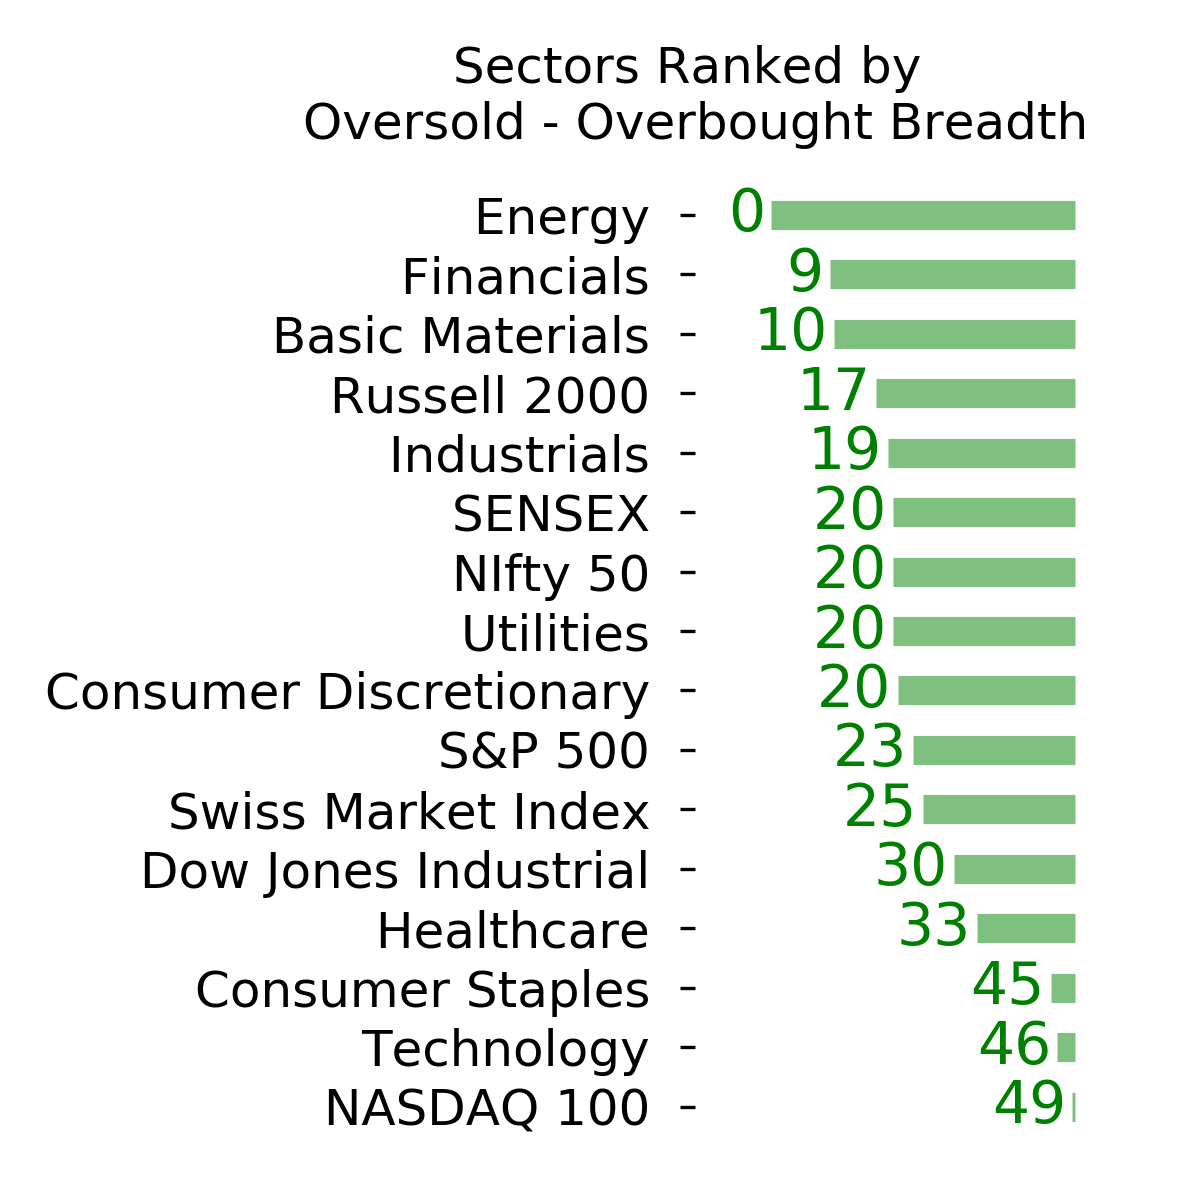
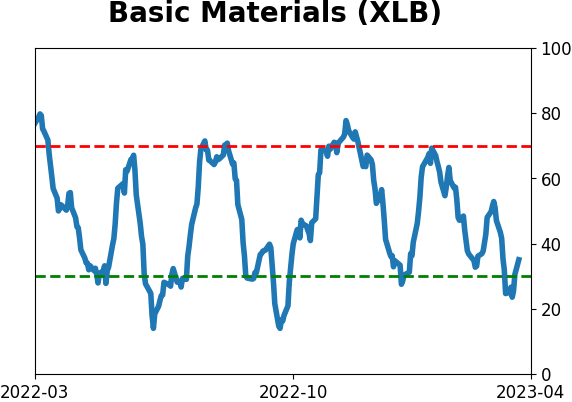
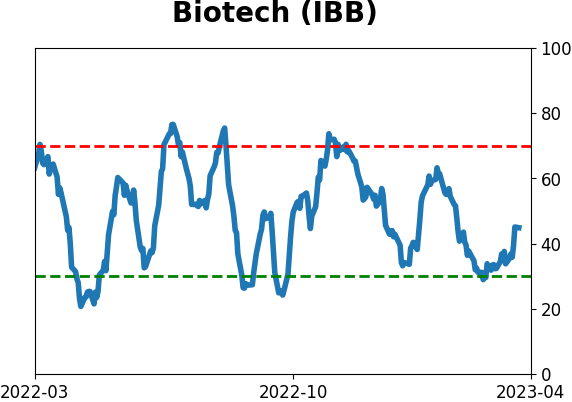
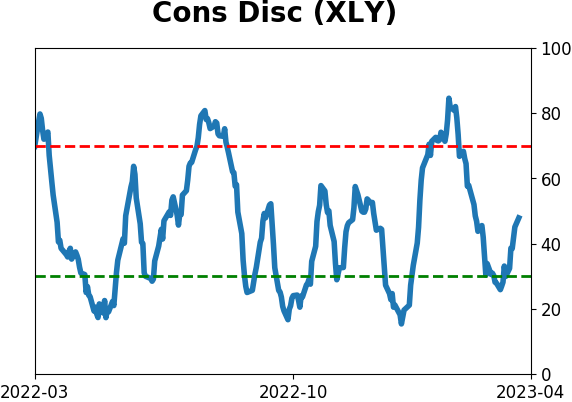
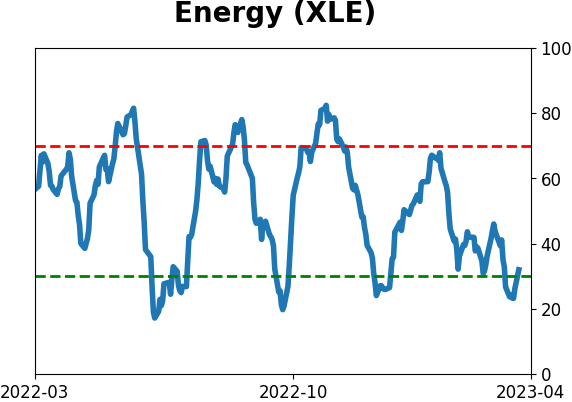
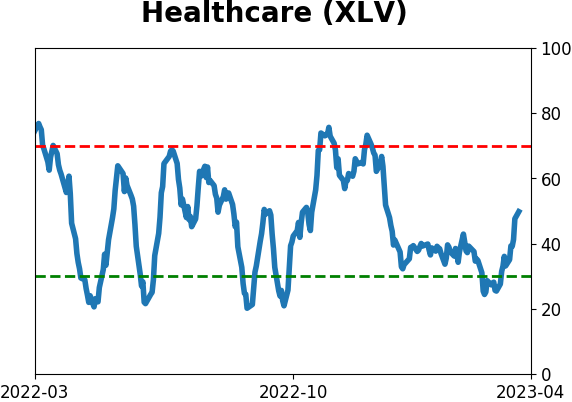
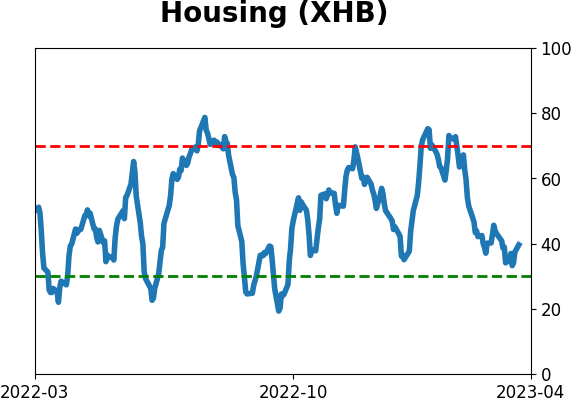
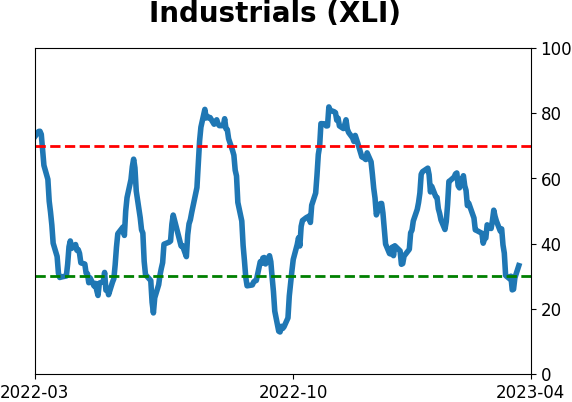
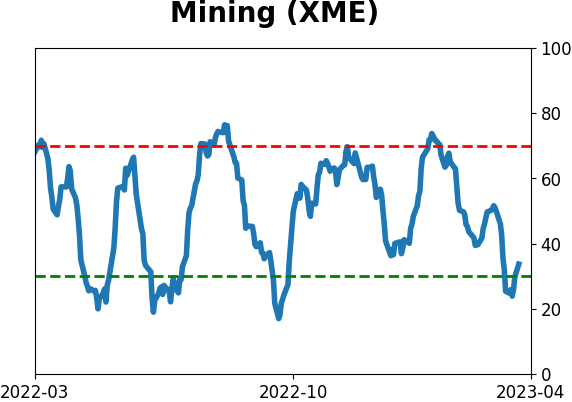
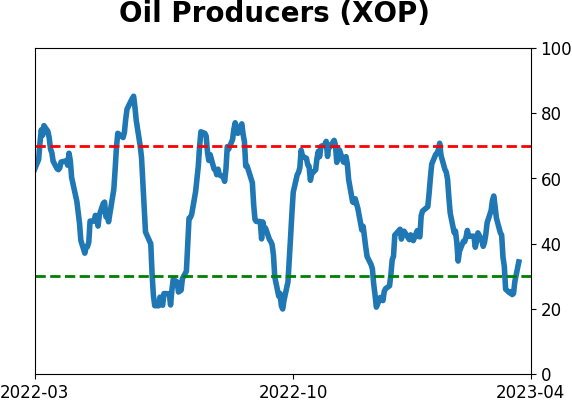
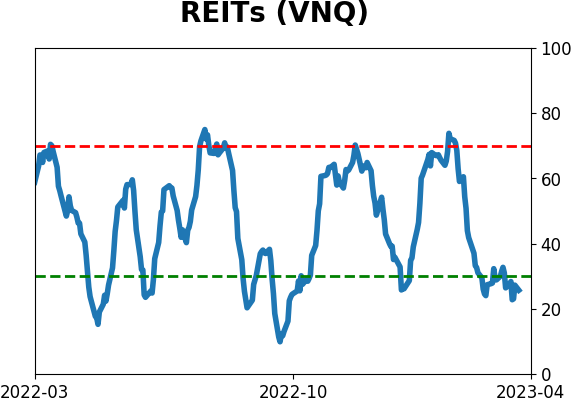
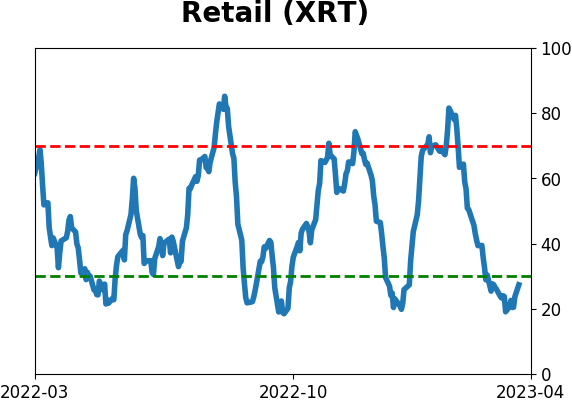
Sector ETF's - 10-Day Moving Average
|
|
|
Country ETF's - 10-Day Moving Average
|
|
|
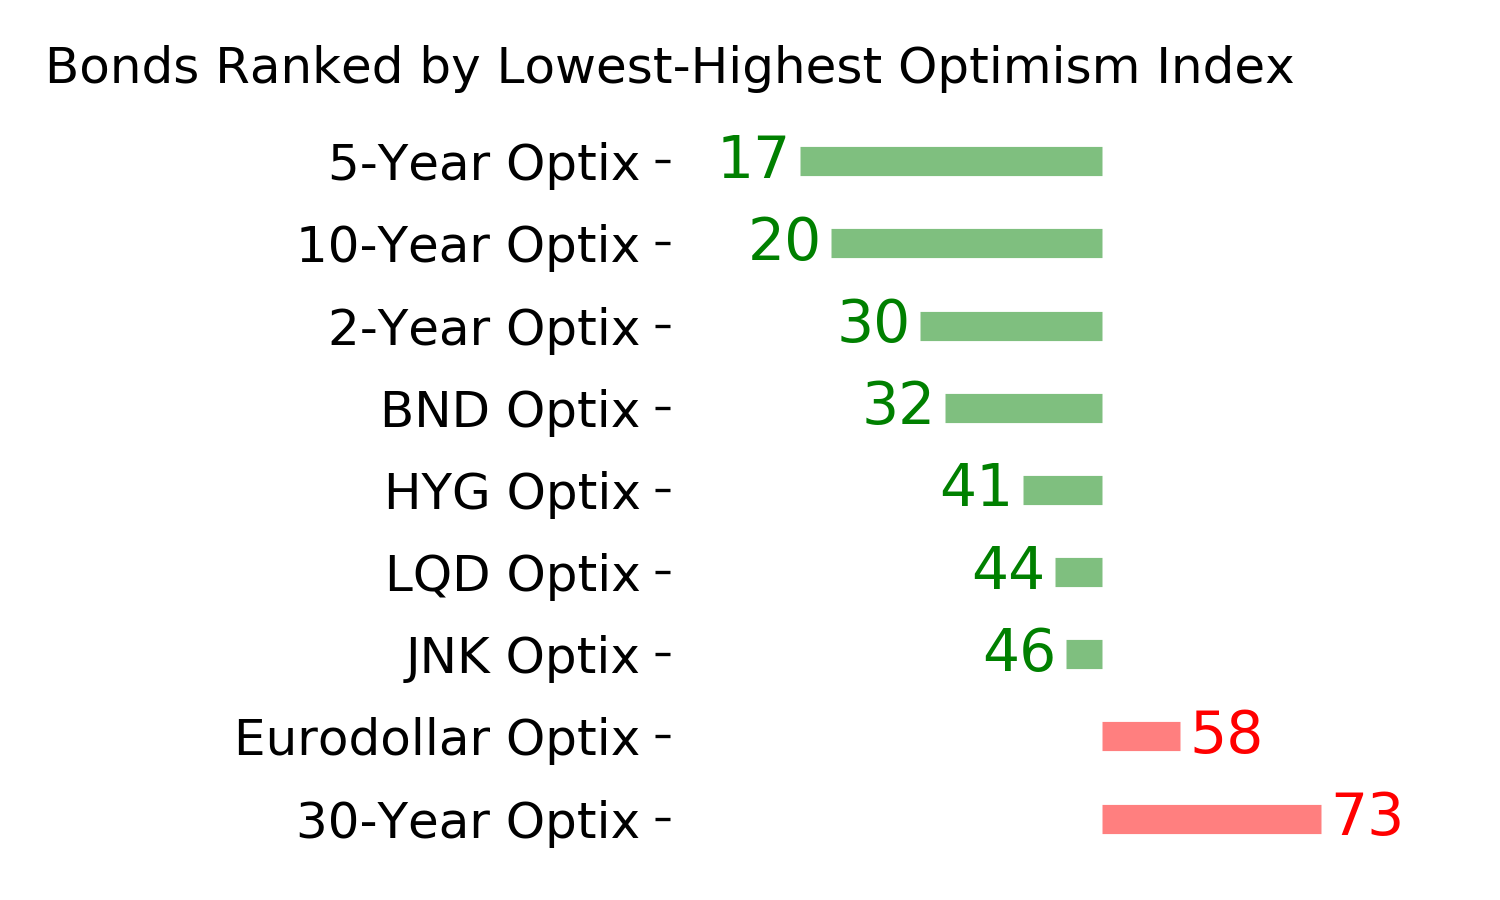
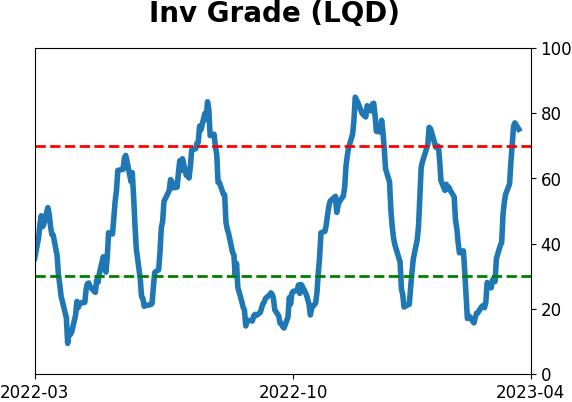
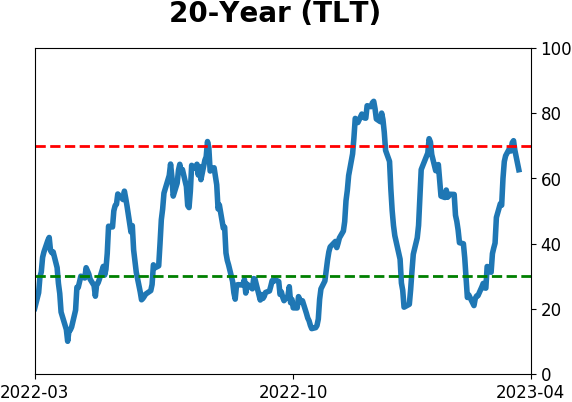
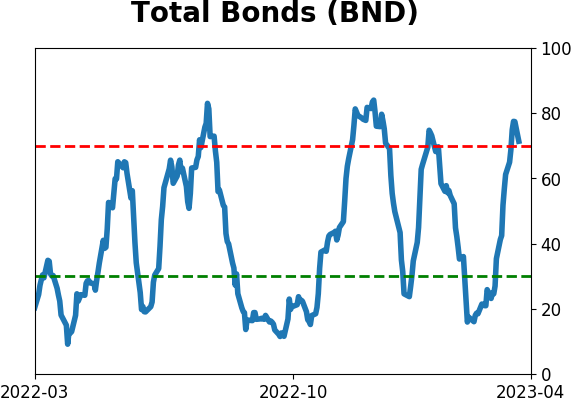
Bond ETF's - 10-Day Moving Average
|
|
|
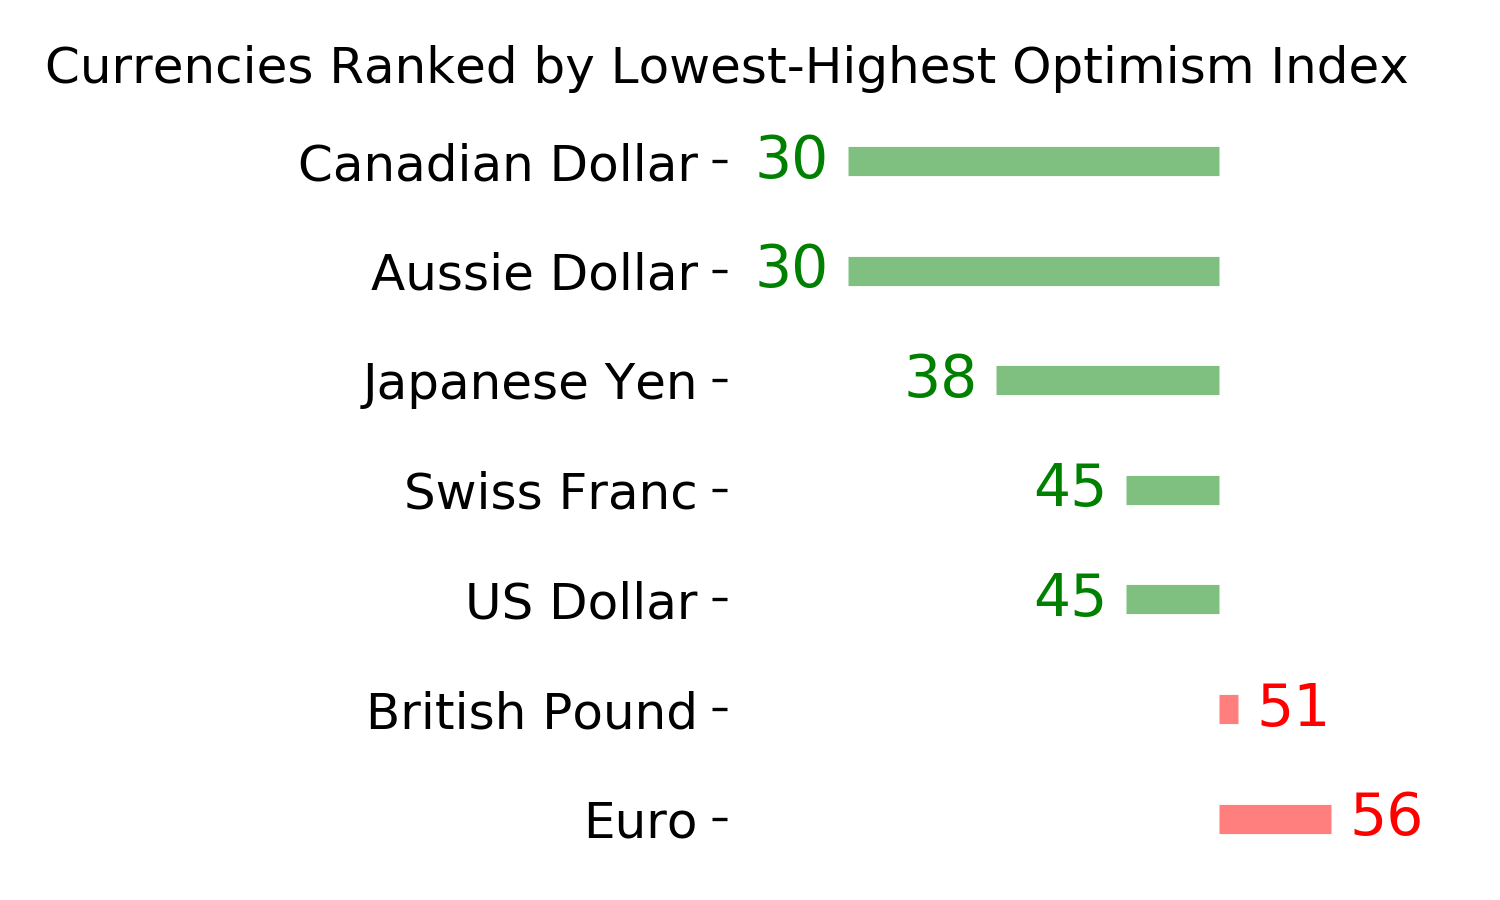
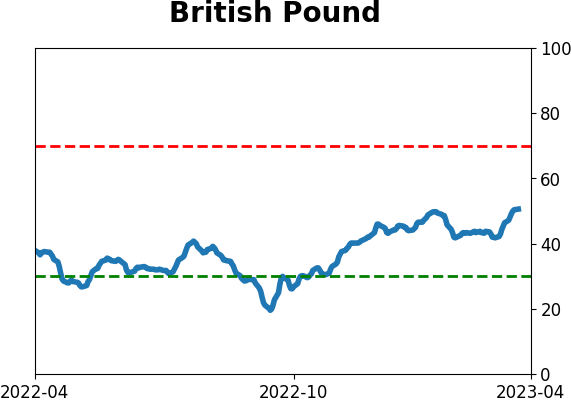
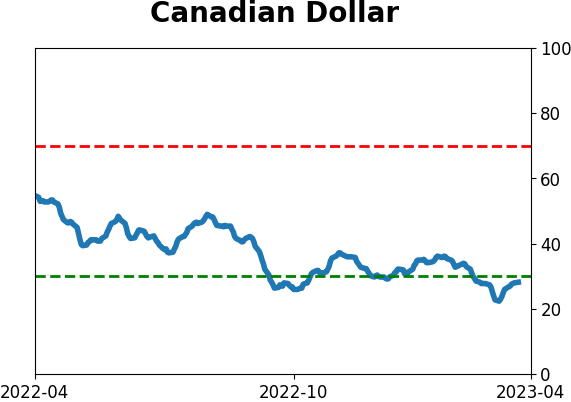
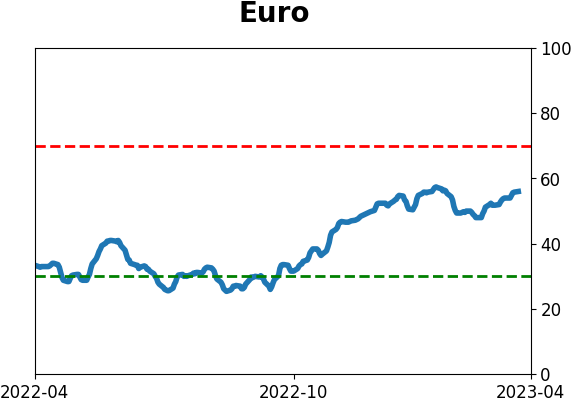
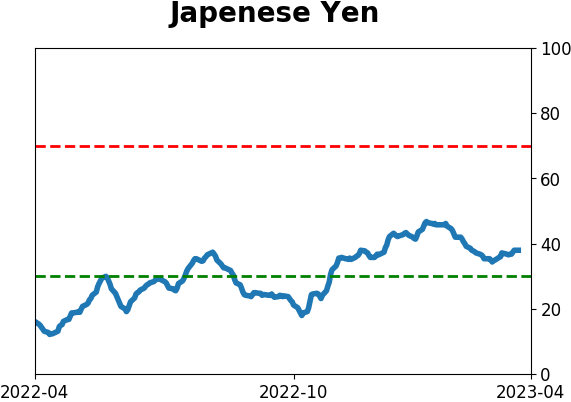
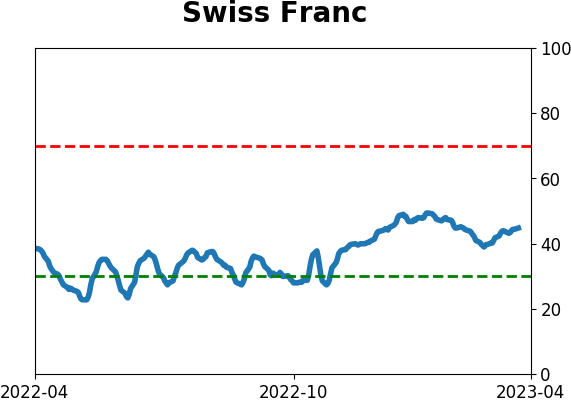
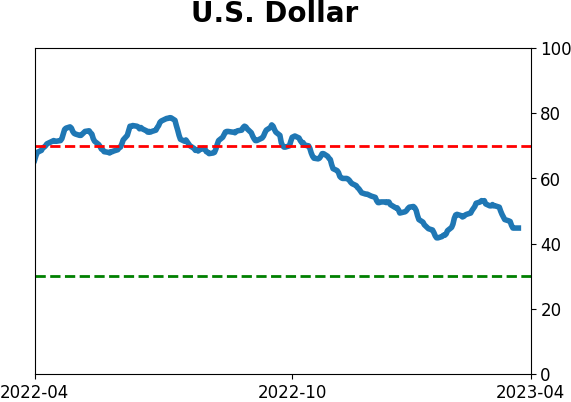
Currency ETF's - 5-Day Moving Average
|
|
|
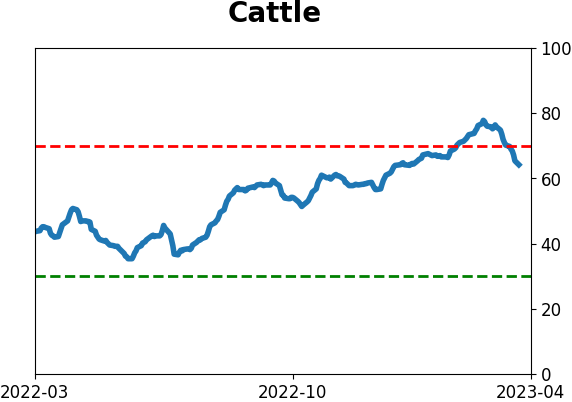
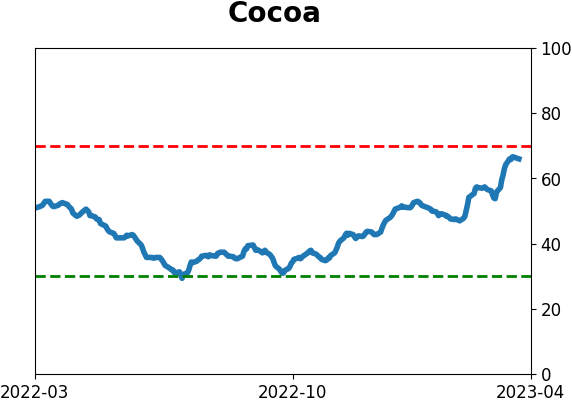
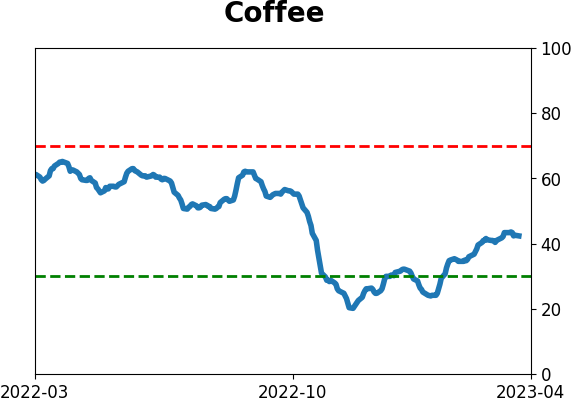
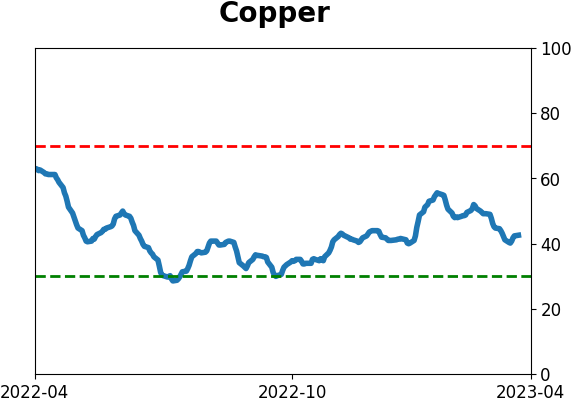
Commodity ETF's - 5-Day Moving Average
|
|