Headlines
|
|
Oh, what a 100 days it's been:
It's been 100 days since the S&P 500 bottomed in October 2023. During that 100 days, the S&P's gains have been exceptionally strong, and there have been nearly a dozen sessions with more than 80% of NYSE volume flowing into advancing issues. Other strong and broad 100-day rallies off a low preceded even more gains.
|
Smart / Dumb Money Confidence
|
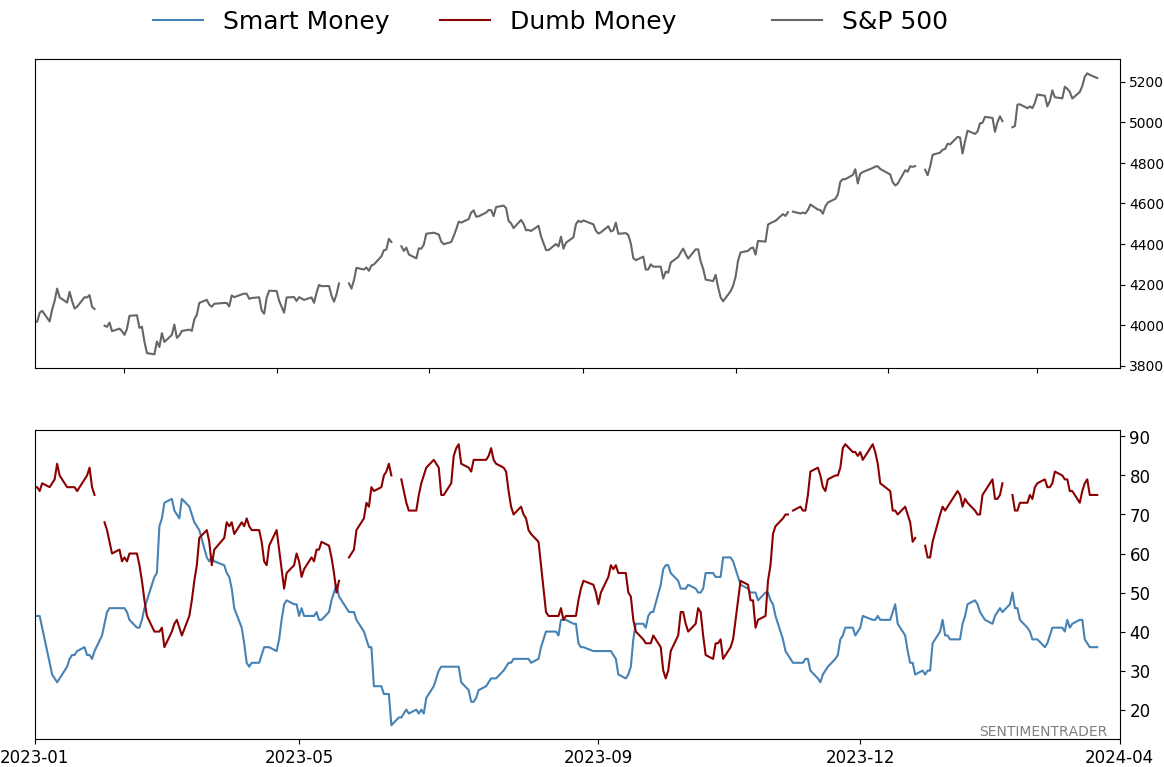
Smart Money Confidence: 36%
Dumb Money Confidence: 75%
|
|
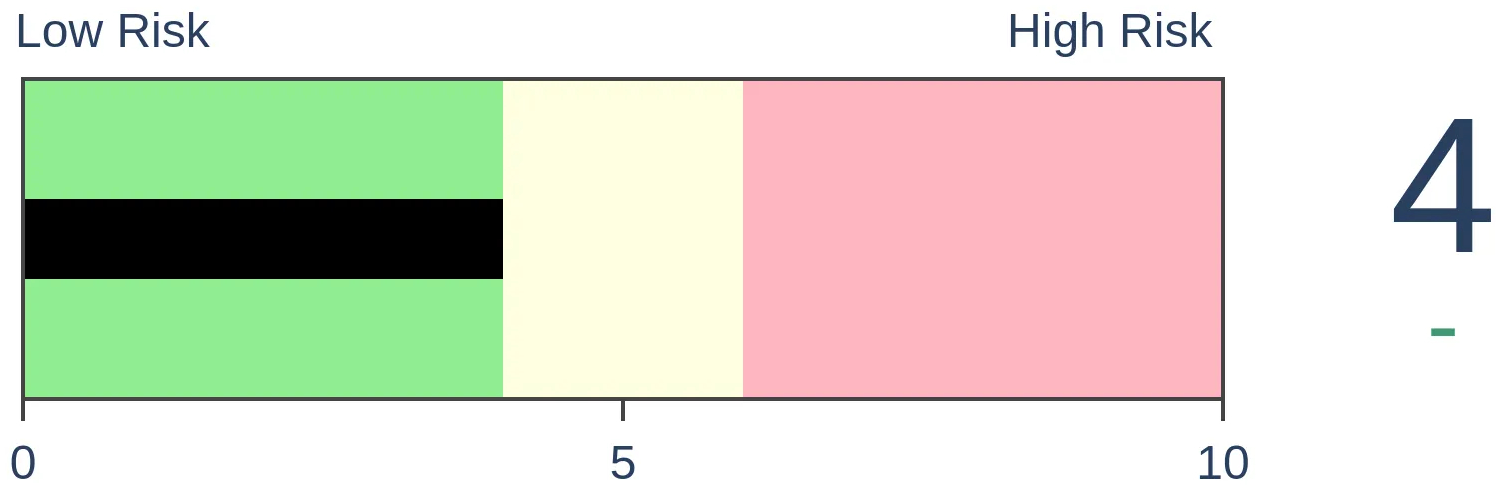
Risk Levels
Stocks Short-Term
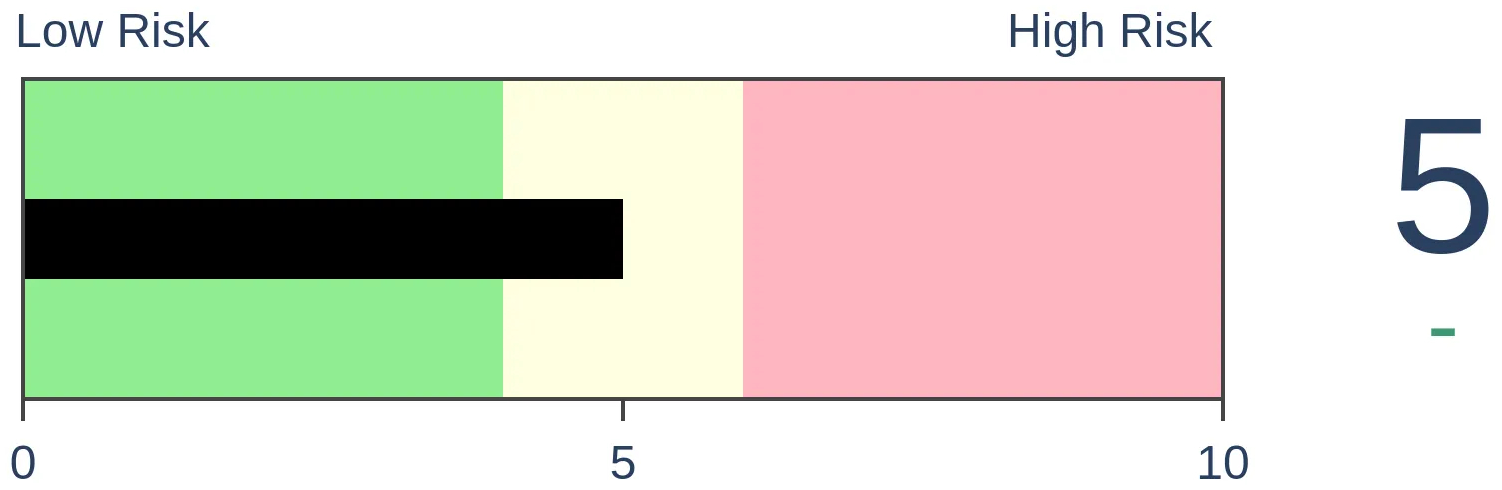
|
Stocks Medium-Term
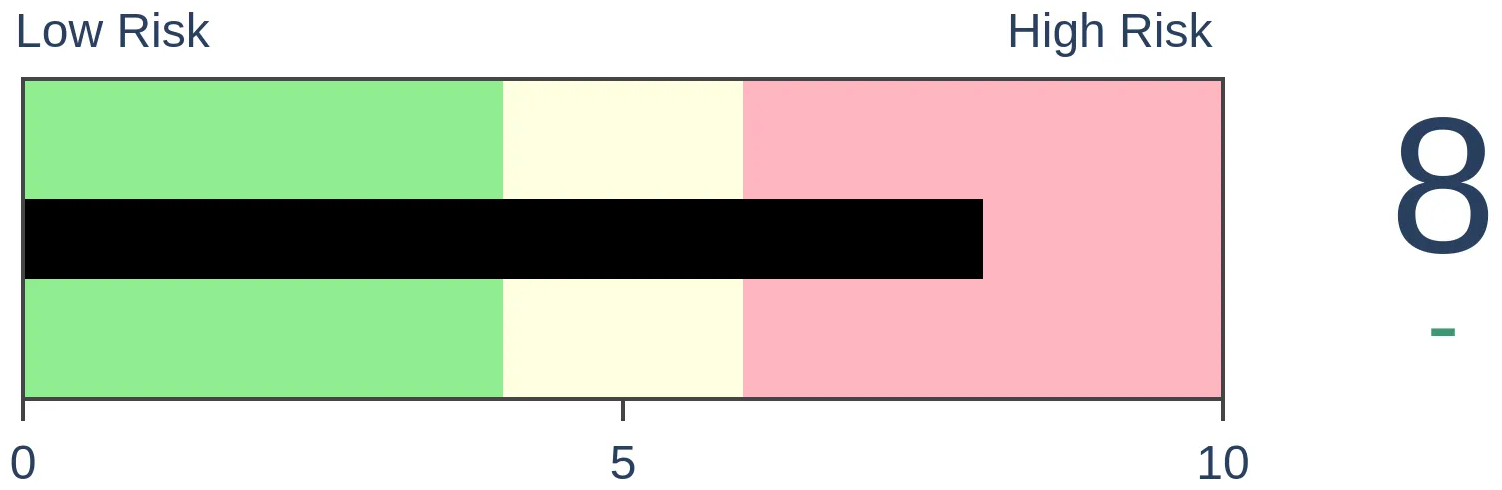
|
|
Bonds
|
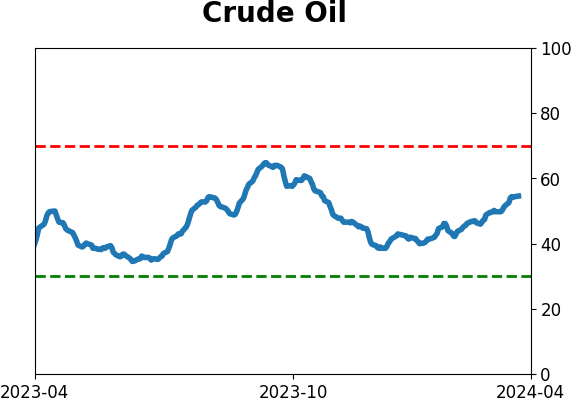
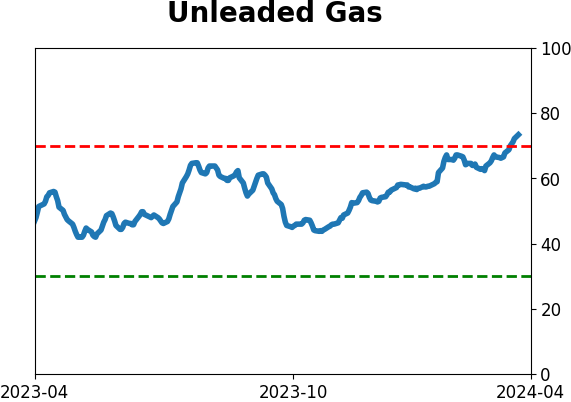
Crude Oil

|
|
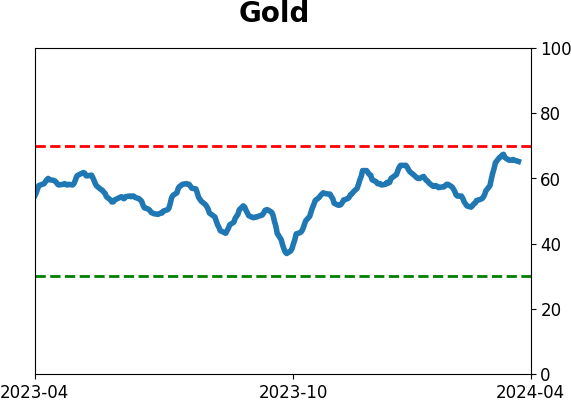
Gold

|
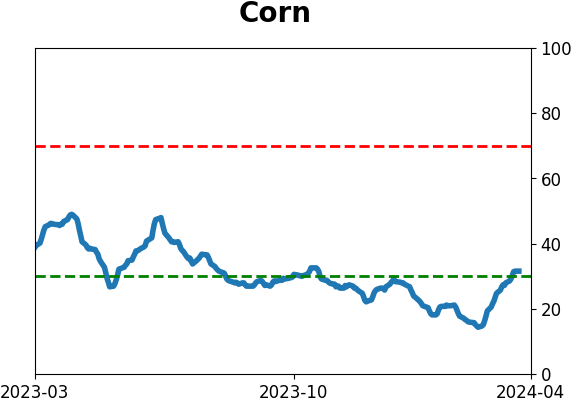
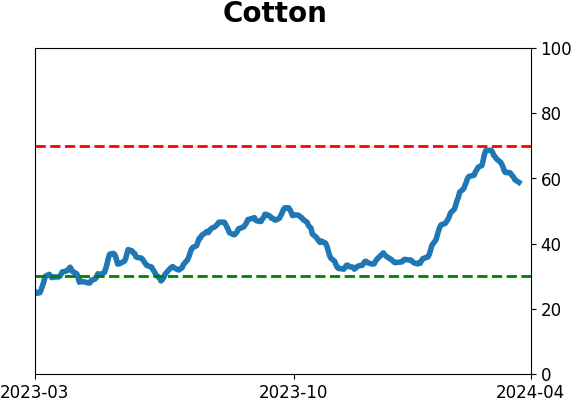
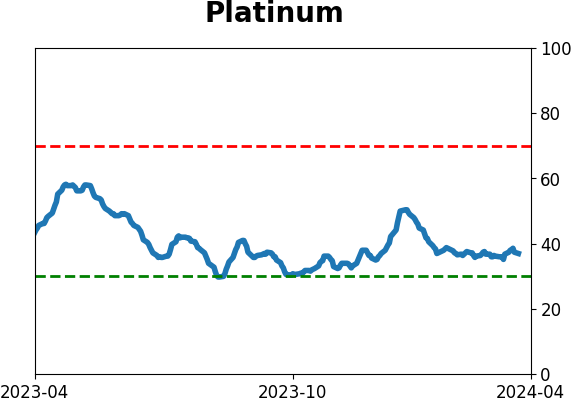
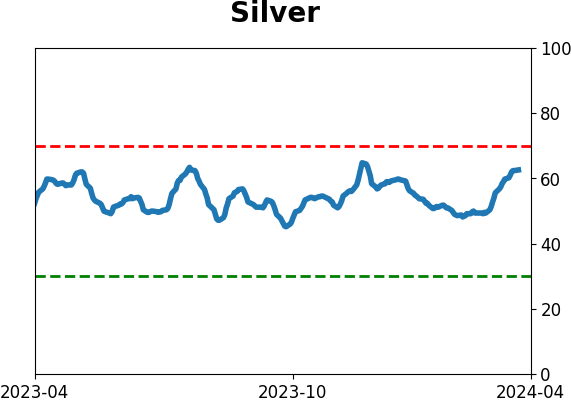
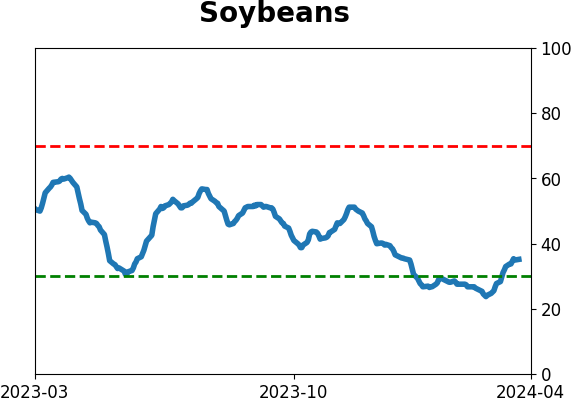
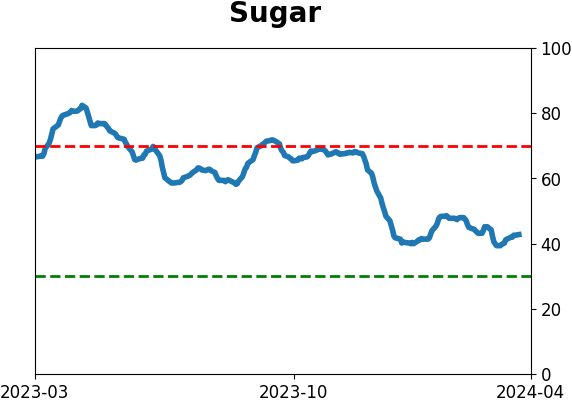
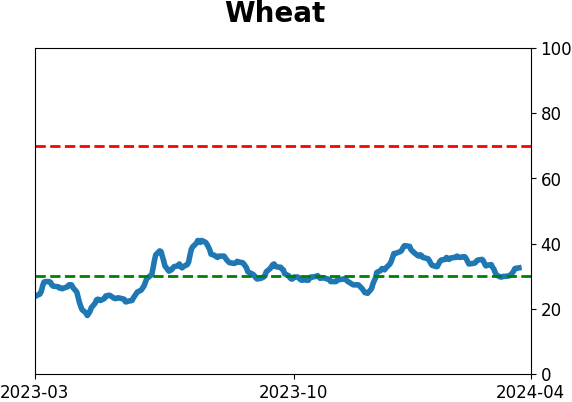
Agriculture

|
|
Research
By Jason Goepfert
BOTTOM LINE
It's been 100 days since the S&P 500 bottomed in October 2023. During that 100 days, the S&P's gains have been exceptionally strong, and there have been nearly a dozen sessions with more than 80% of NYSE volume flowing into advancing issues. Other strong and broad 100-day rallies off a low preceded even more gains.
FORECAST / TIMEFRAME
None
|
Key points:
- The S&P 500 has gone 100 days since its October 2023 low
- Performance during the rally has been exceptional, with large gains and many sessions with broad participation
- Other 100-day rallies off a low that were strong and broad preceded even more gains, almost without exception
An exceptional 100-day rally
It's now been 100 days since the bottom in the world's most benchmarked equity index. And oh, what a hundred days it's been.
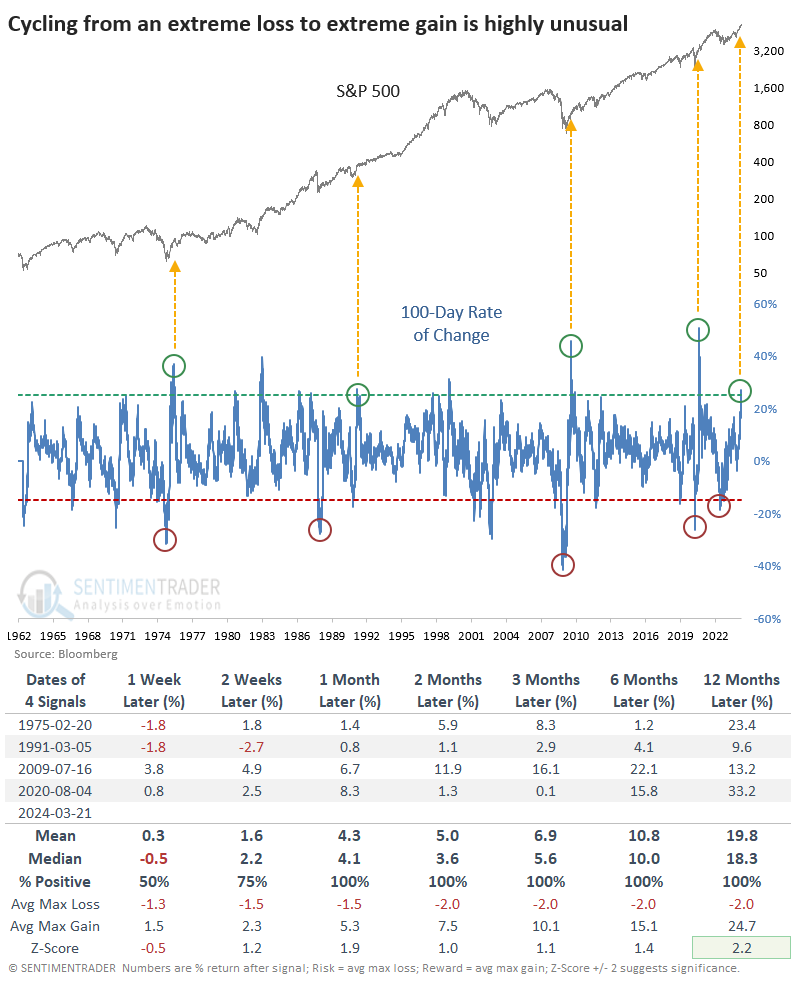
The S&P 500 fell to a 100-day low on October 27, 2023, and it's been almost straight up since then. Its reaction since that point has been impressive enough to be an anomaly.
Cycling from a rolling 100-day rate of change of less than -15% to greater than +25% has occurred only at some of the most significant inflection points in the past 60+ years. None of the signals suffered anything larger than a -3.5% drawdown within the following year.
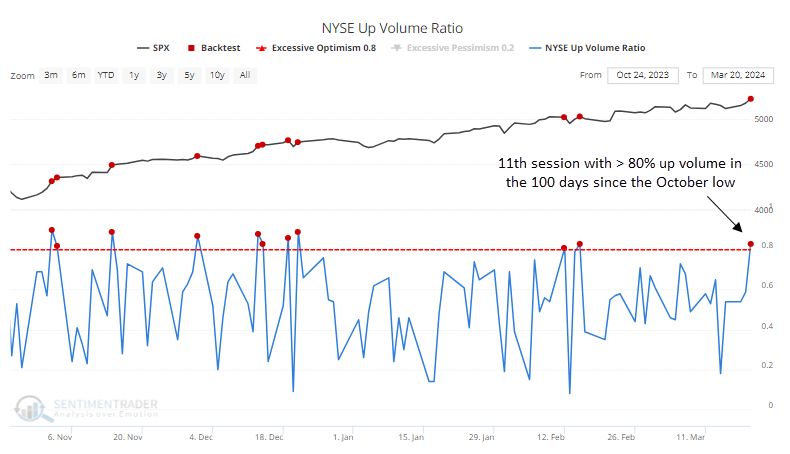
After a modest scare in January, what's also been impressive about the rally is how broad it's been. Since the October low, there have been 11 days when more than 80% of volume on the NYSE flowed into advancing issues.
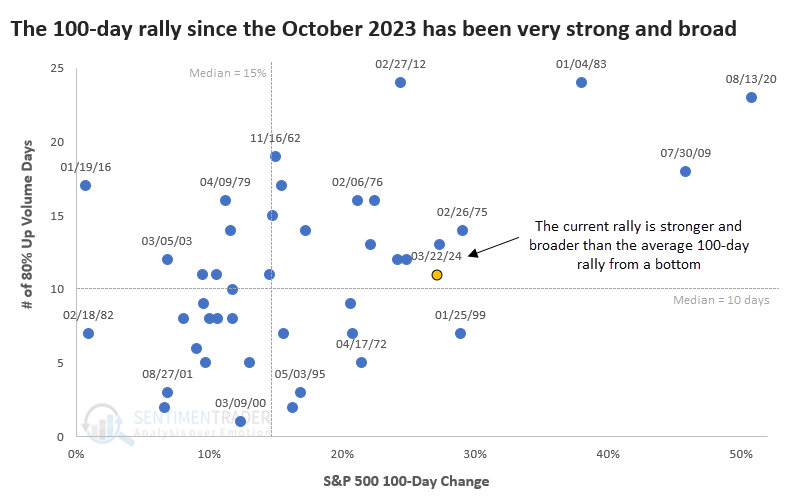
When we look at every time the S&P 500 traveled 100 days from at least a 100-day low, we can see how strong the current rally has been.
The x-axis on the scatter plot below shows the magnitude of every 100-day rally, and the y-axis shows how many days enjoyed more than 80% Up Volume. The further to the upper-right a dot is, the more powerful and broad the 100-rally off a low.
Strong and broad rallies = more gains
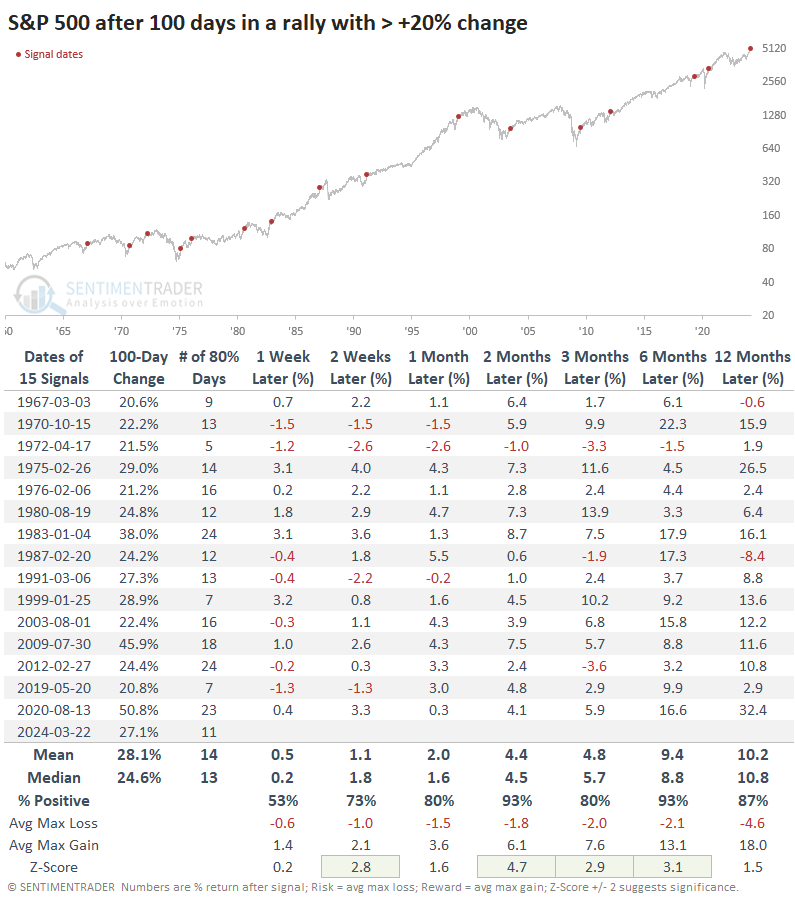
Let's look at these factors individually and then combine them to see how the S&P performed afterward. First, the table below shows every 100-day rally when the S&P gained at least 20%. Returns were excellent, with a high win rate and average return. There was only a single slight loss two or six months later, in 1972.
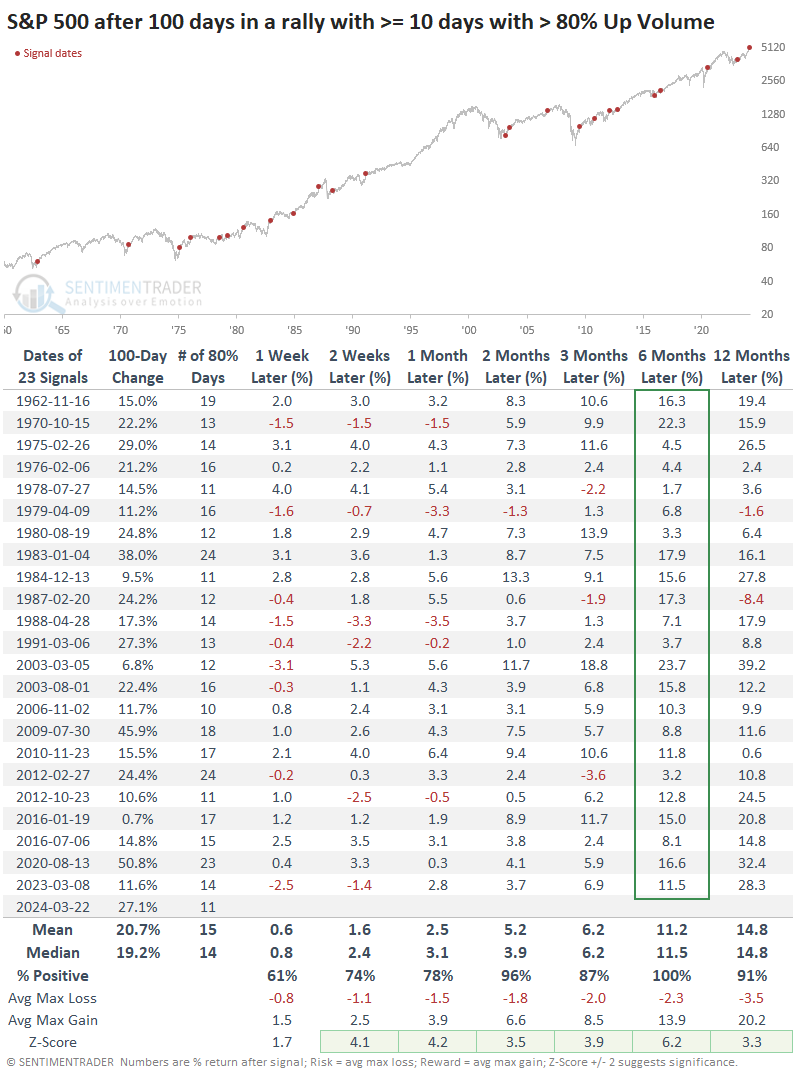
Next, we can see that there were more 100-day rallies (of any magnitude) that had at least 10% of sessions with more than 80% of volume flowing into advancing securities. Again, returns were impressive - most notably six months later, when all 23 signals enjoyed a positive return and an absurdly high average return and risk/reward skew.
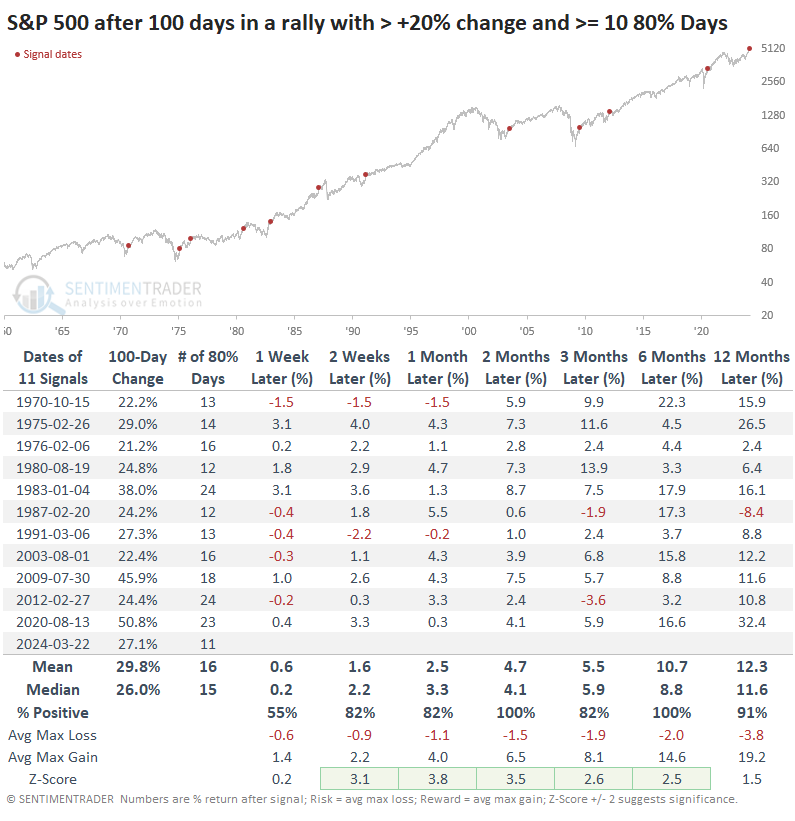
The table below combines both studies. There isn't much to nitpick about these returns, as they were exceptional. The only one that preceded major trouble was in 1987, but that took more than six months to develop.
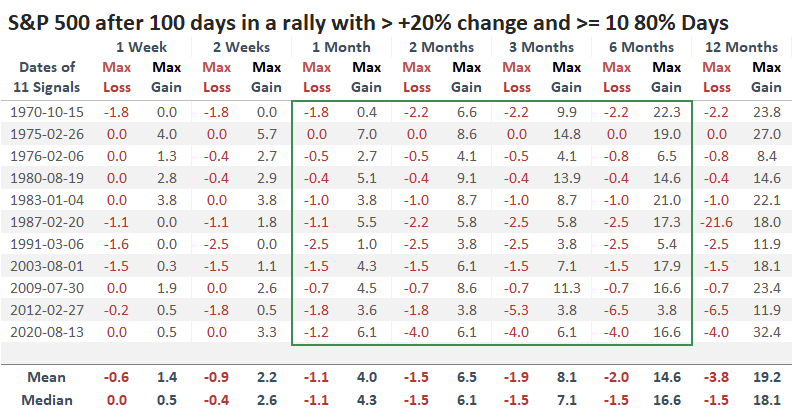
The table of maximum losses and gains across time frames shows that from one through six months later, anything more than even a -3% pullback was rare, while gains were impressive.
The only cold water we could throw on this is that only one other instance was triggered when the S&P 500 was trading at a new high, in February 2012. While the S&P didn't fall apart after that, it struggled to rally, and the risk/reward was inverted up to six months later.
Also, in the scatter plot above, the dot next to the current rally was the rally in February 1987, when the S&P gained 24% in the 100 days off the prior low and enjoyed 12 sessions with at least 80% up volume. After that signal, the S&P also didn't fall apart (until October) but also had some trouble holding any gains.
What the research tells us...
The most benchmarked equity index in the world has made it to the 100-day mark of a rally from a significant low, which is a notable achievement. It's especially notable just how strong and broad the rally has been because similar behavior preceded lasting and significant gains the other times it occurred.
There isn't much to complain about with this behavior other than the sample size (we always want as large a sample as possible), and the two most similar cases preceded limited gains (but also limited losses, at least for six months). The strength and breadth of this rally is another positive sign for stocks.
Indicators at Extremes
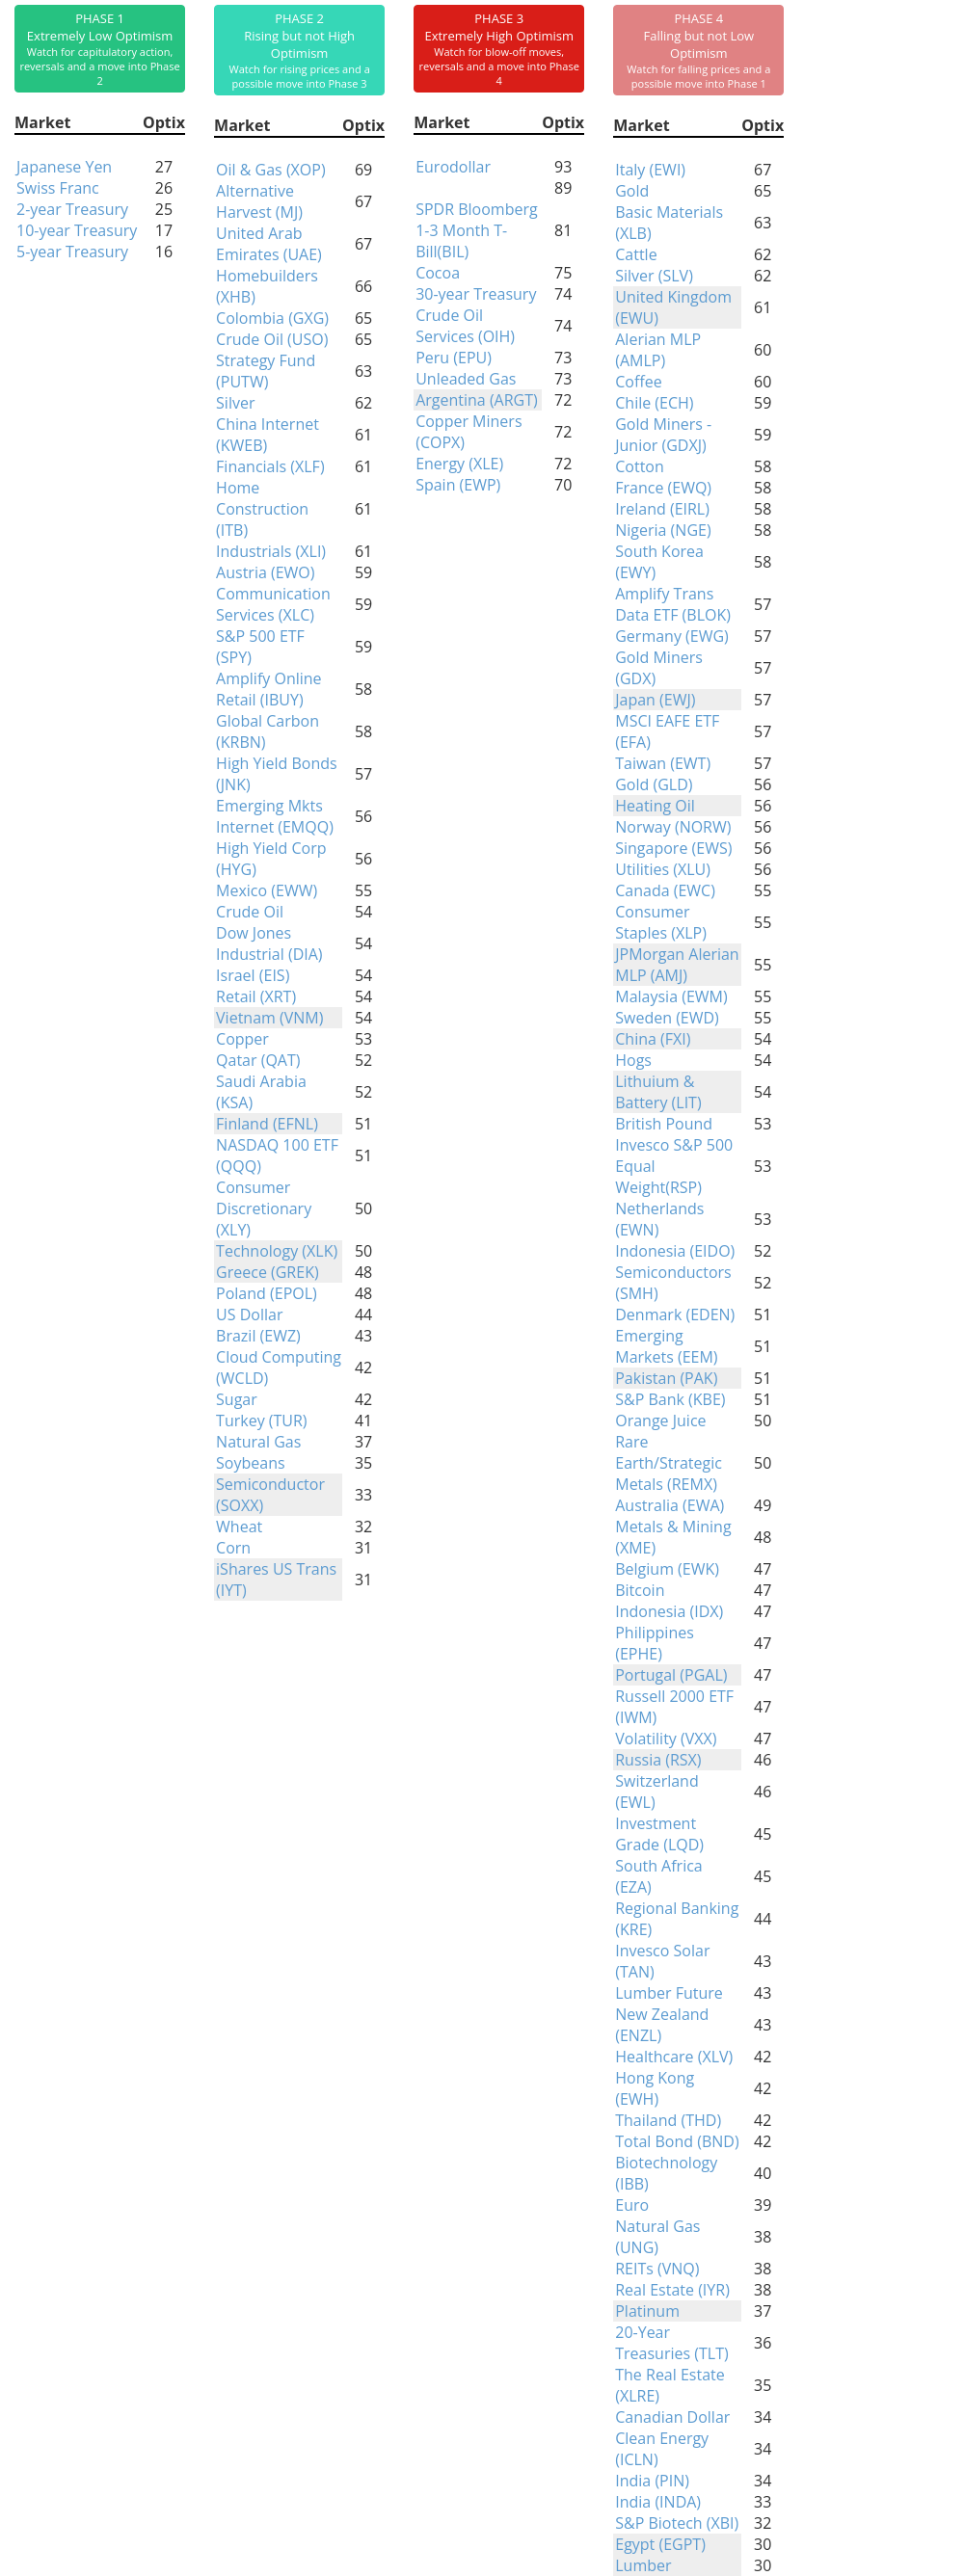
Phase Table
Ranks
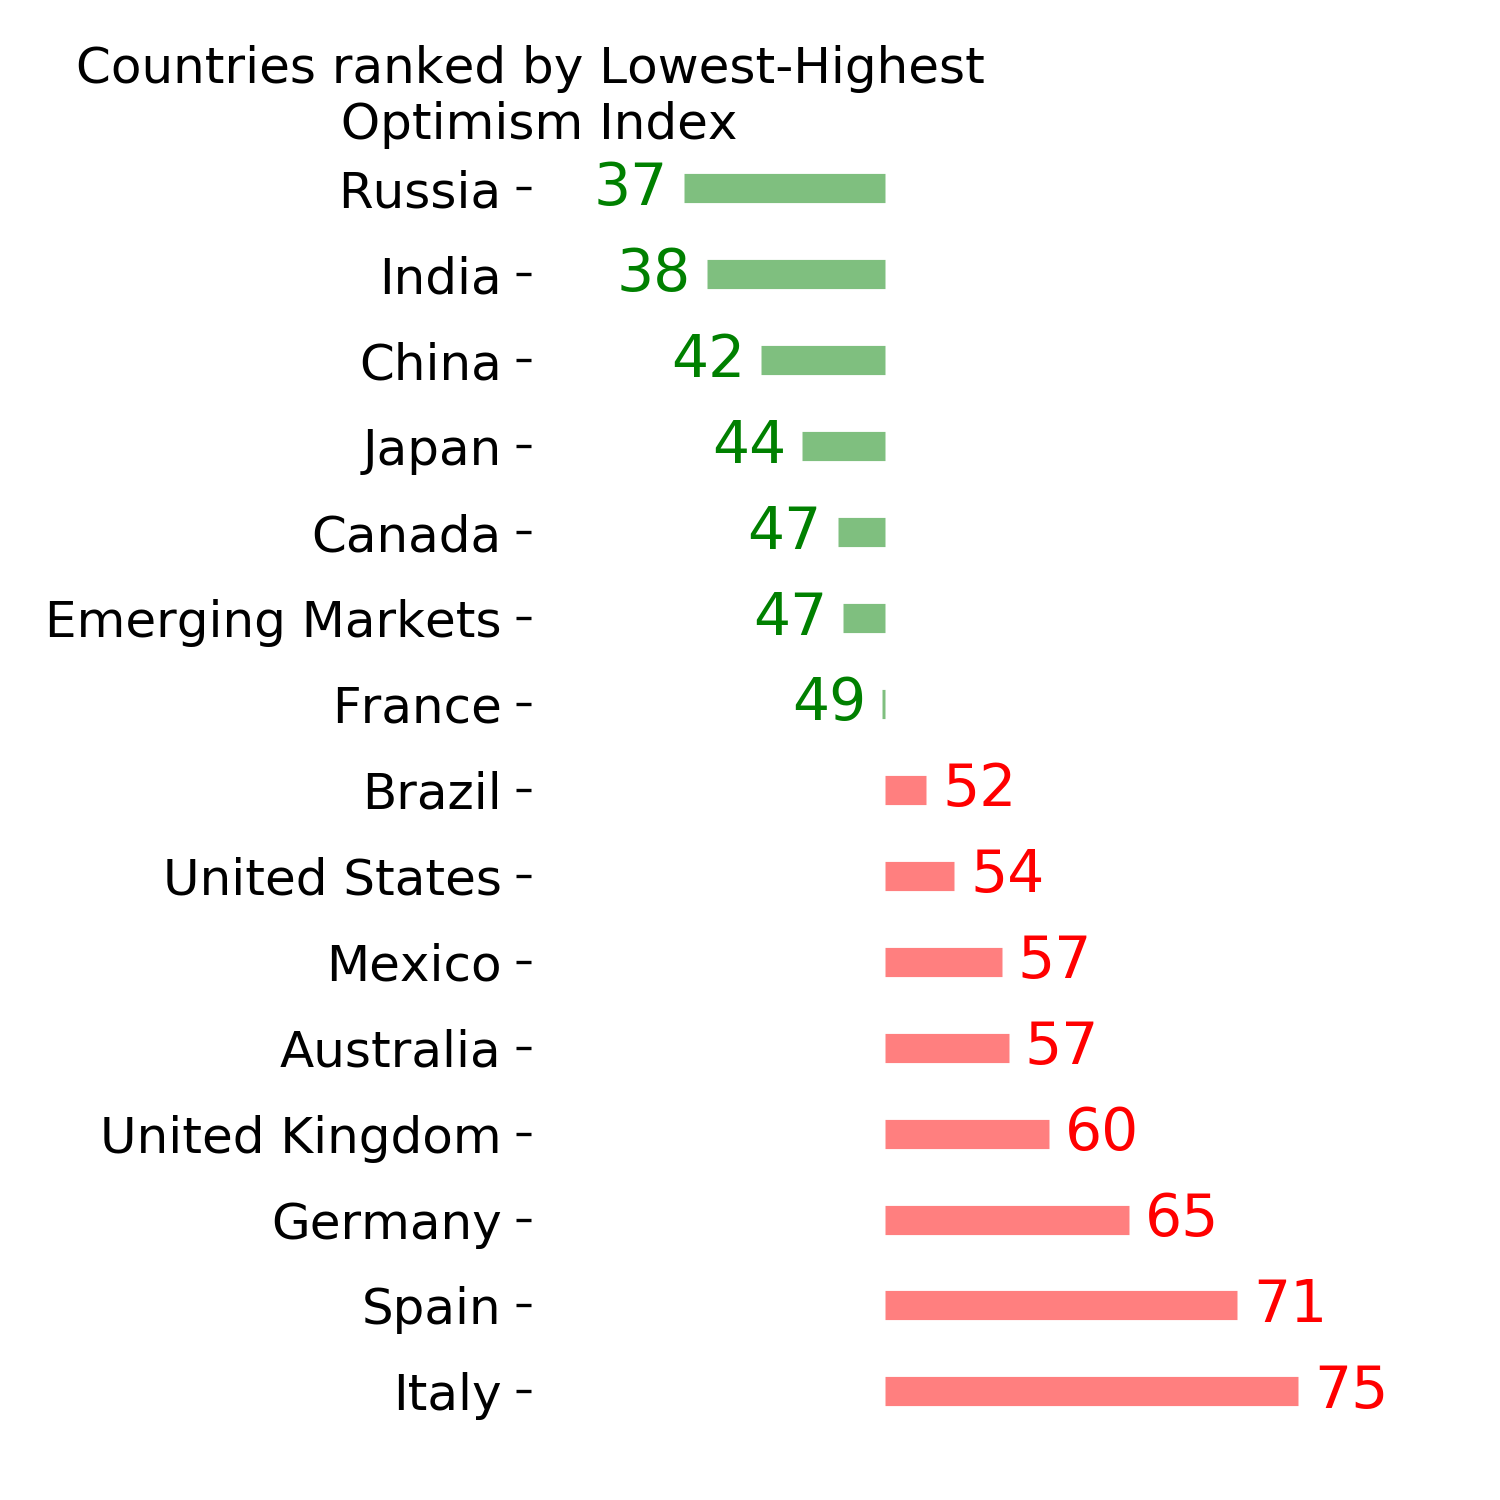
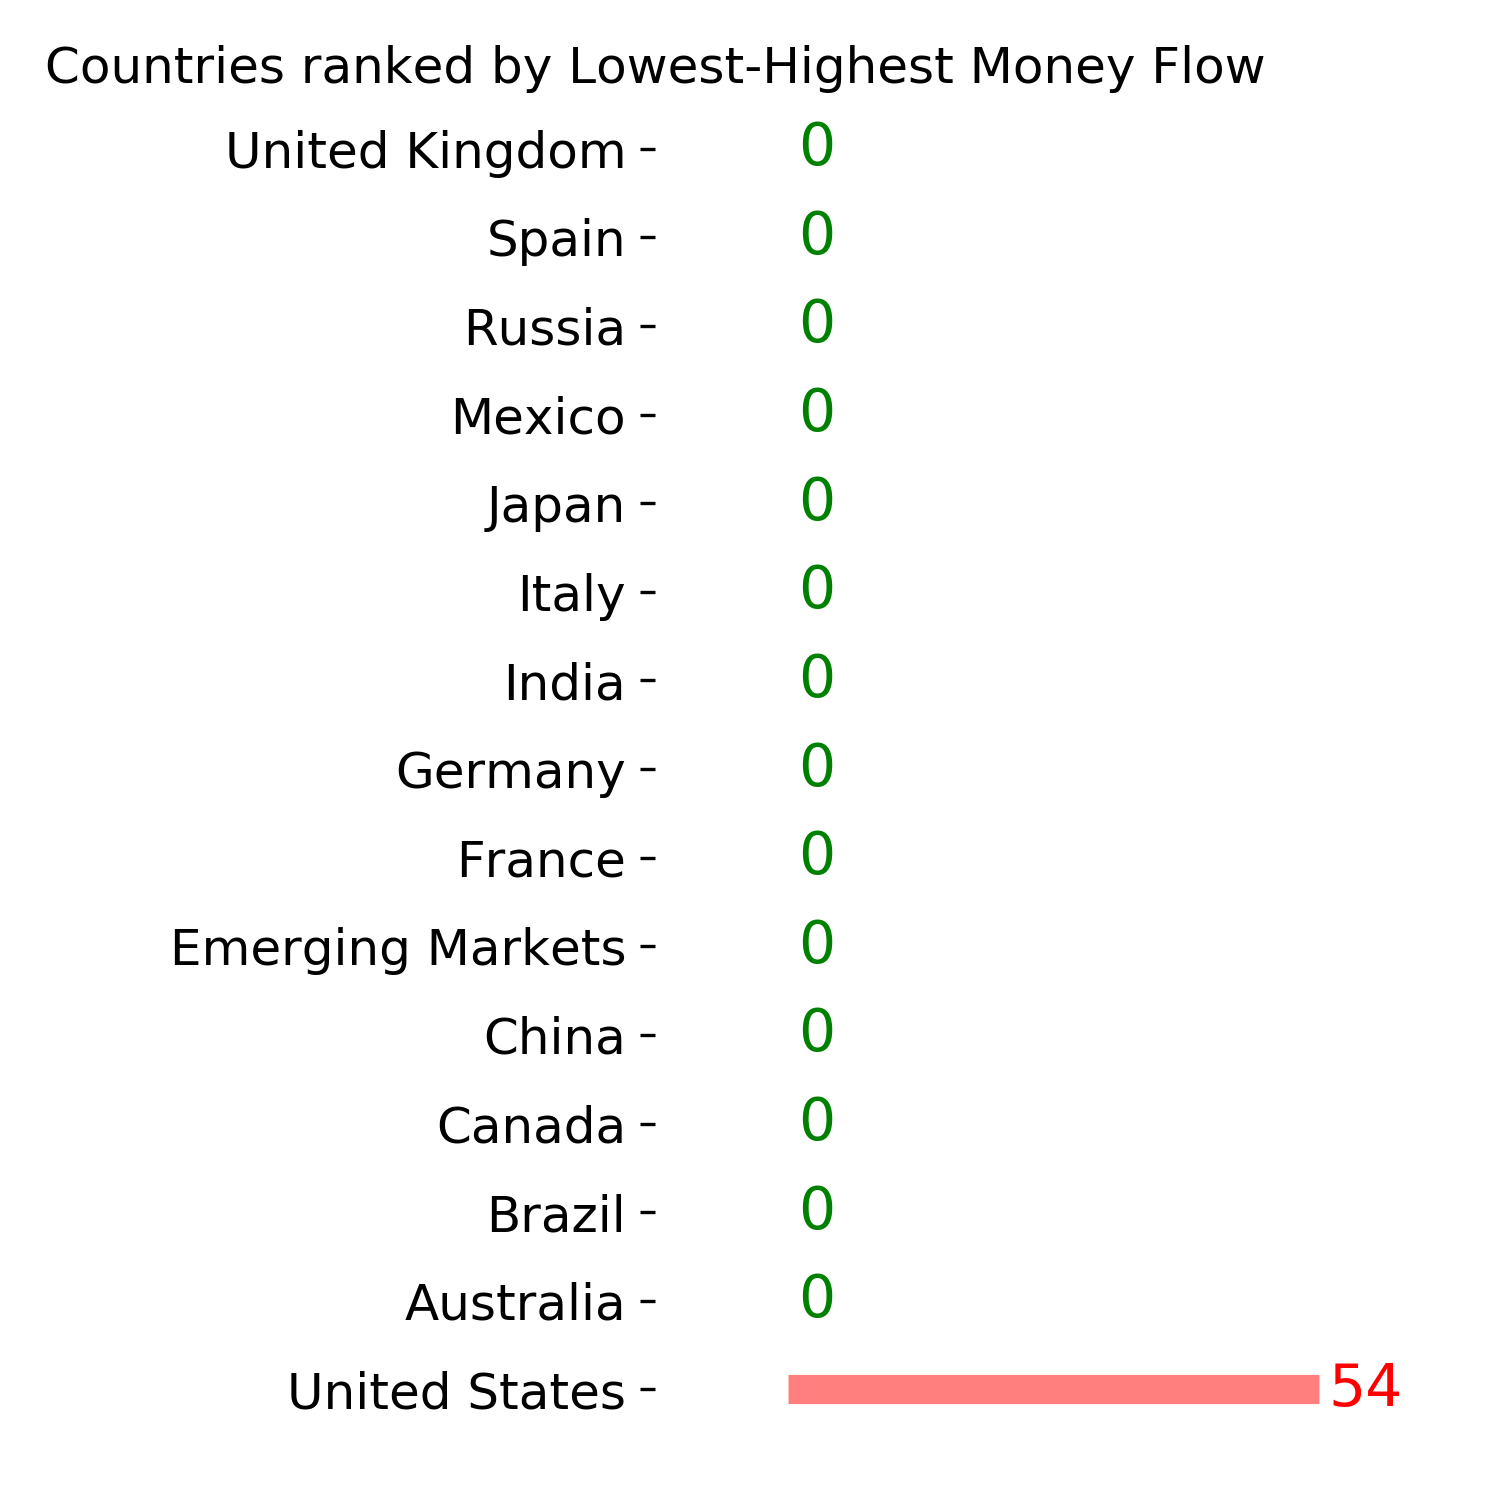
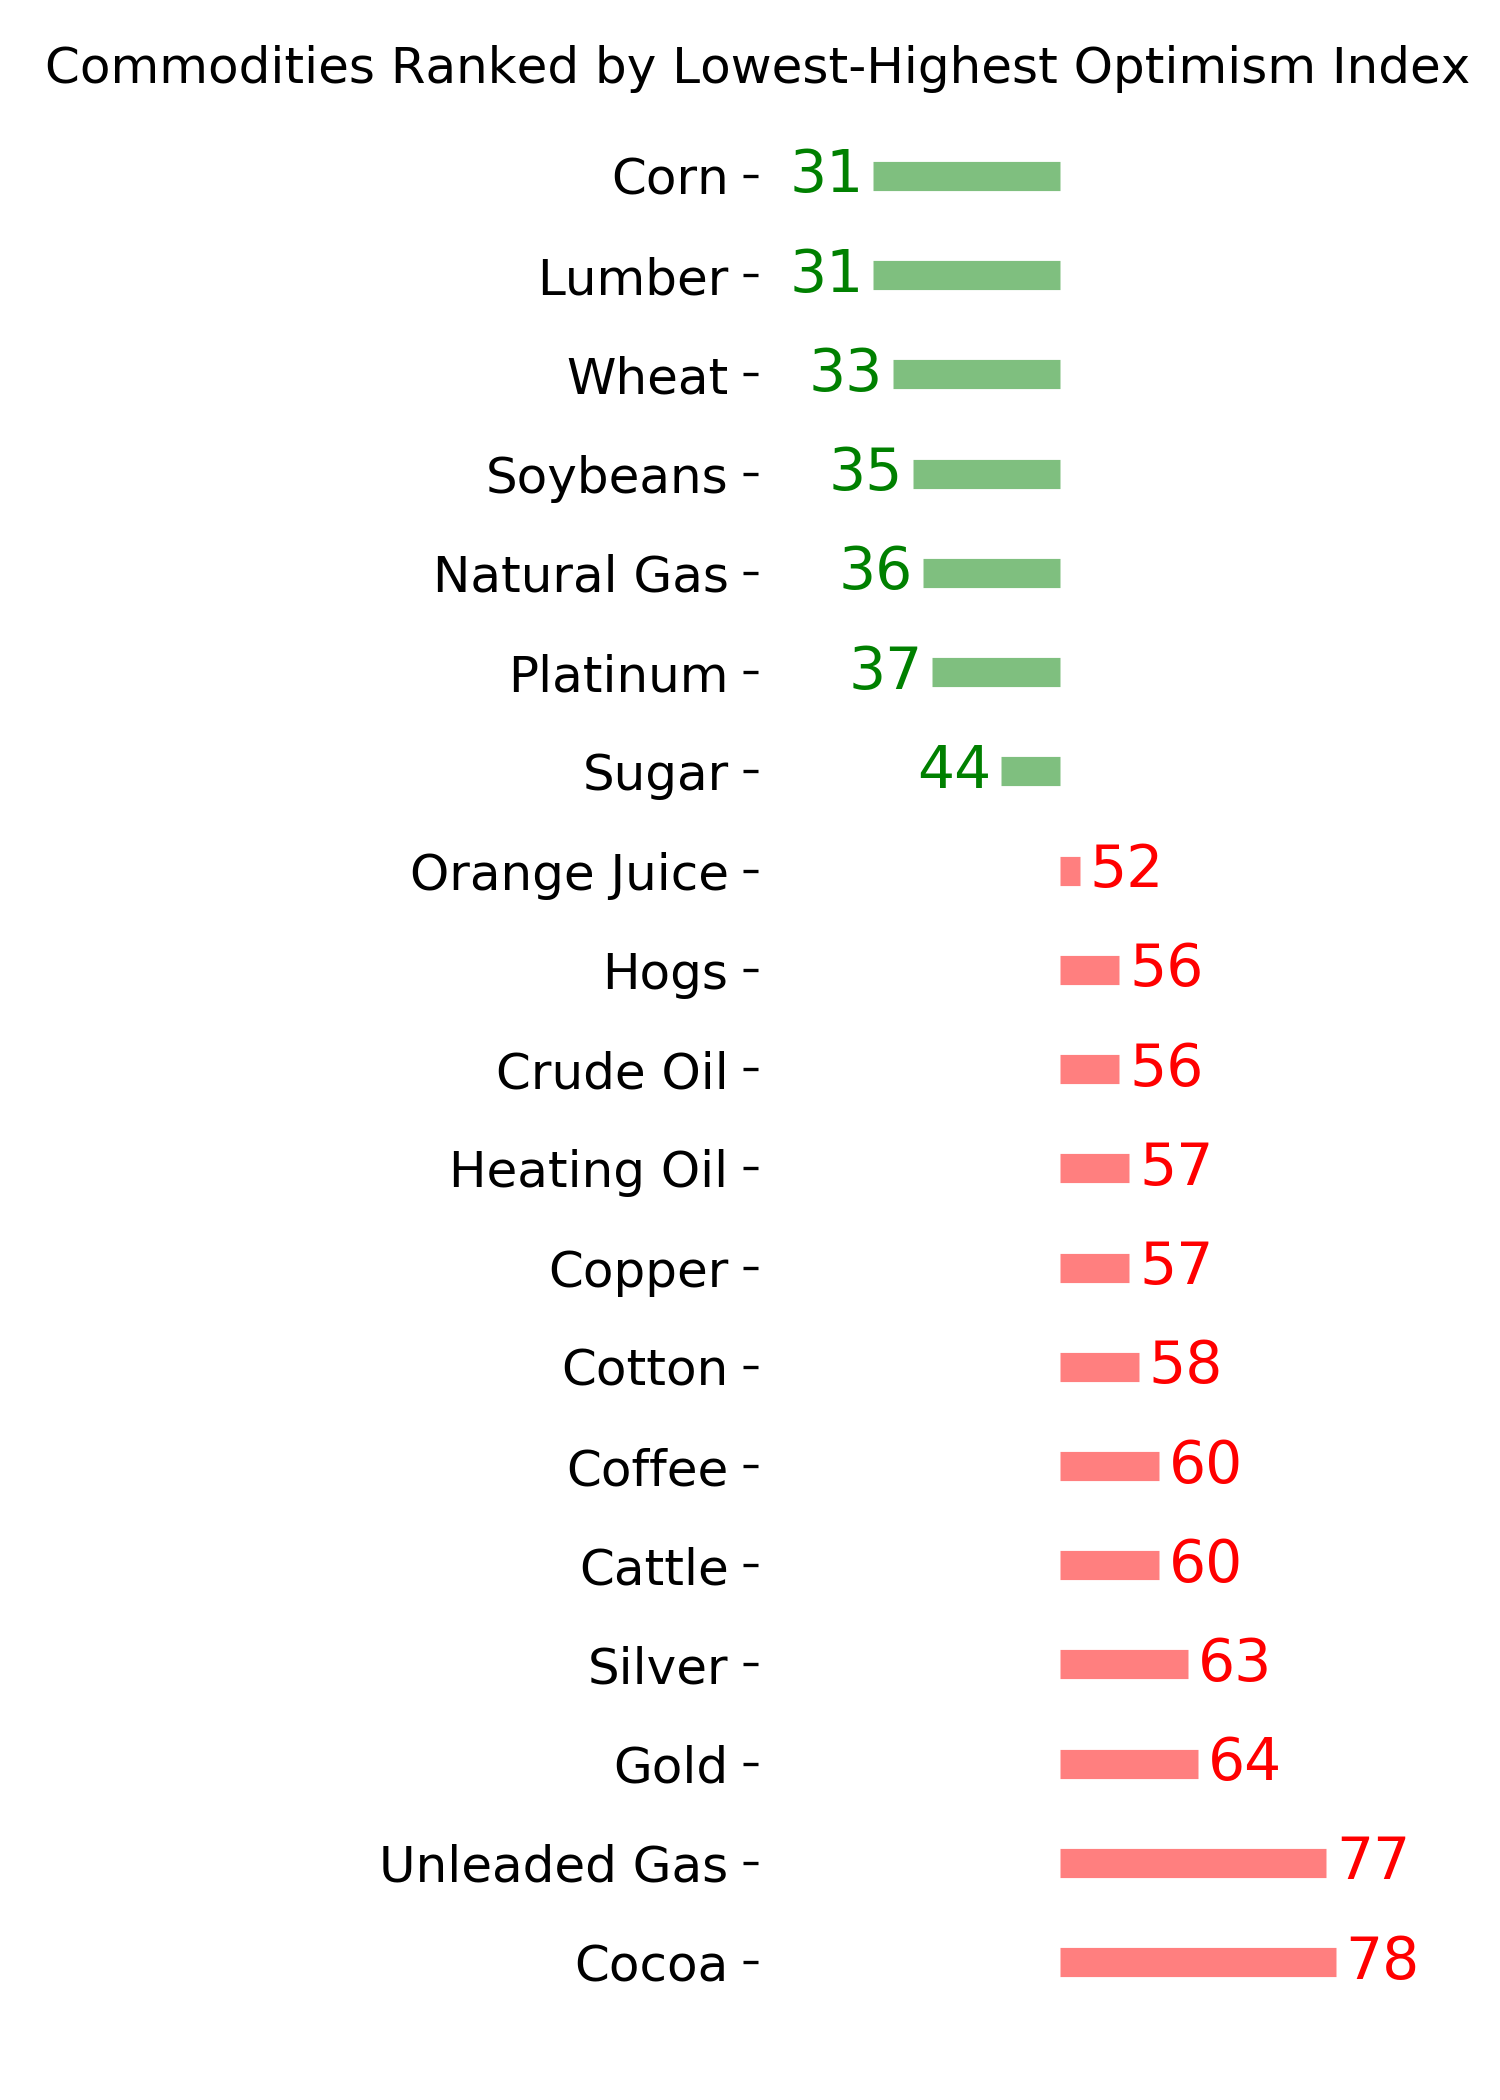
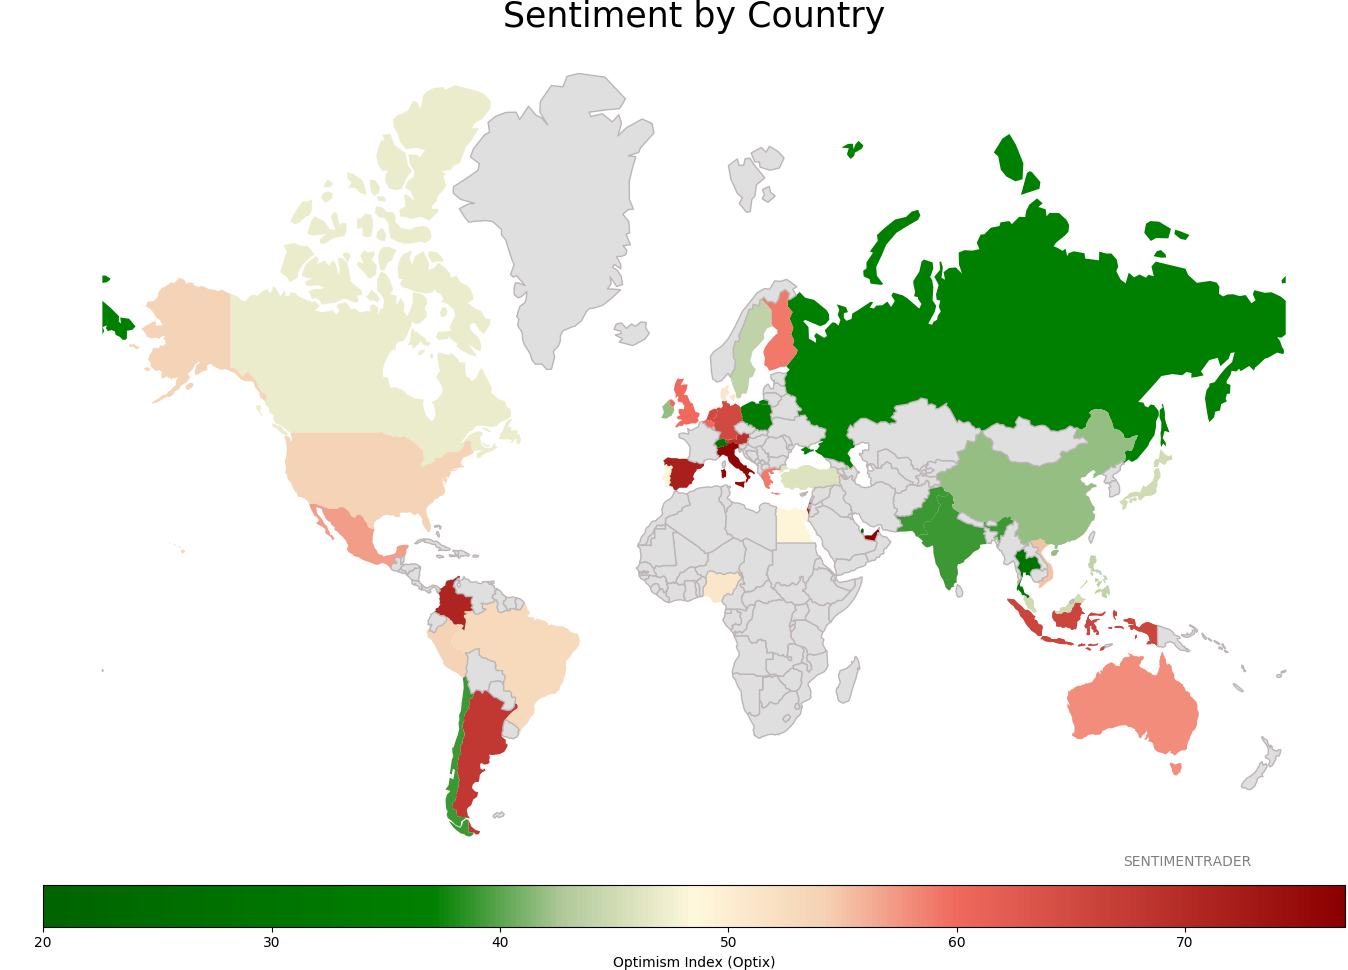
Sentiment Around The World
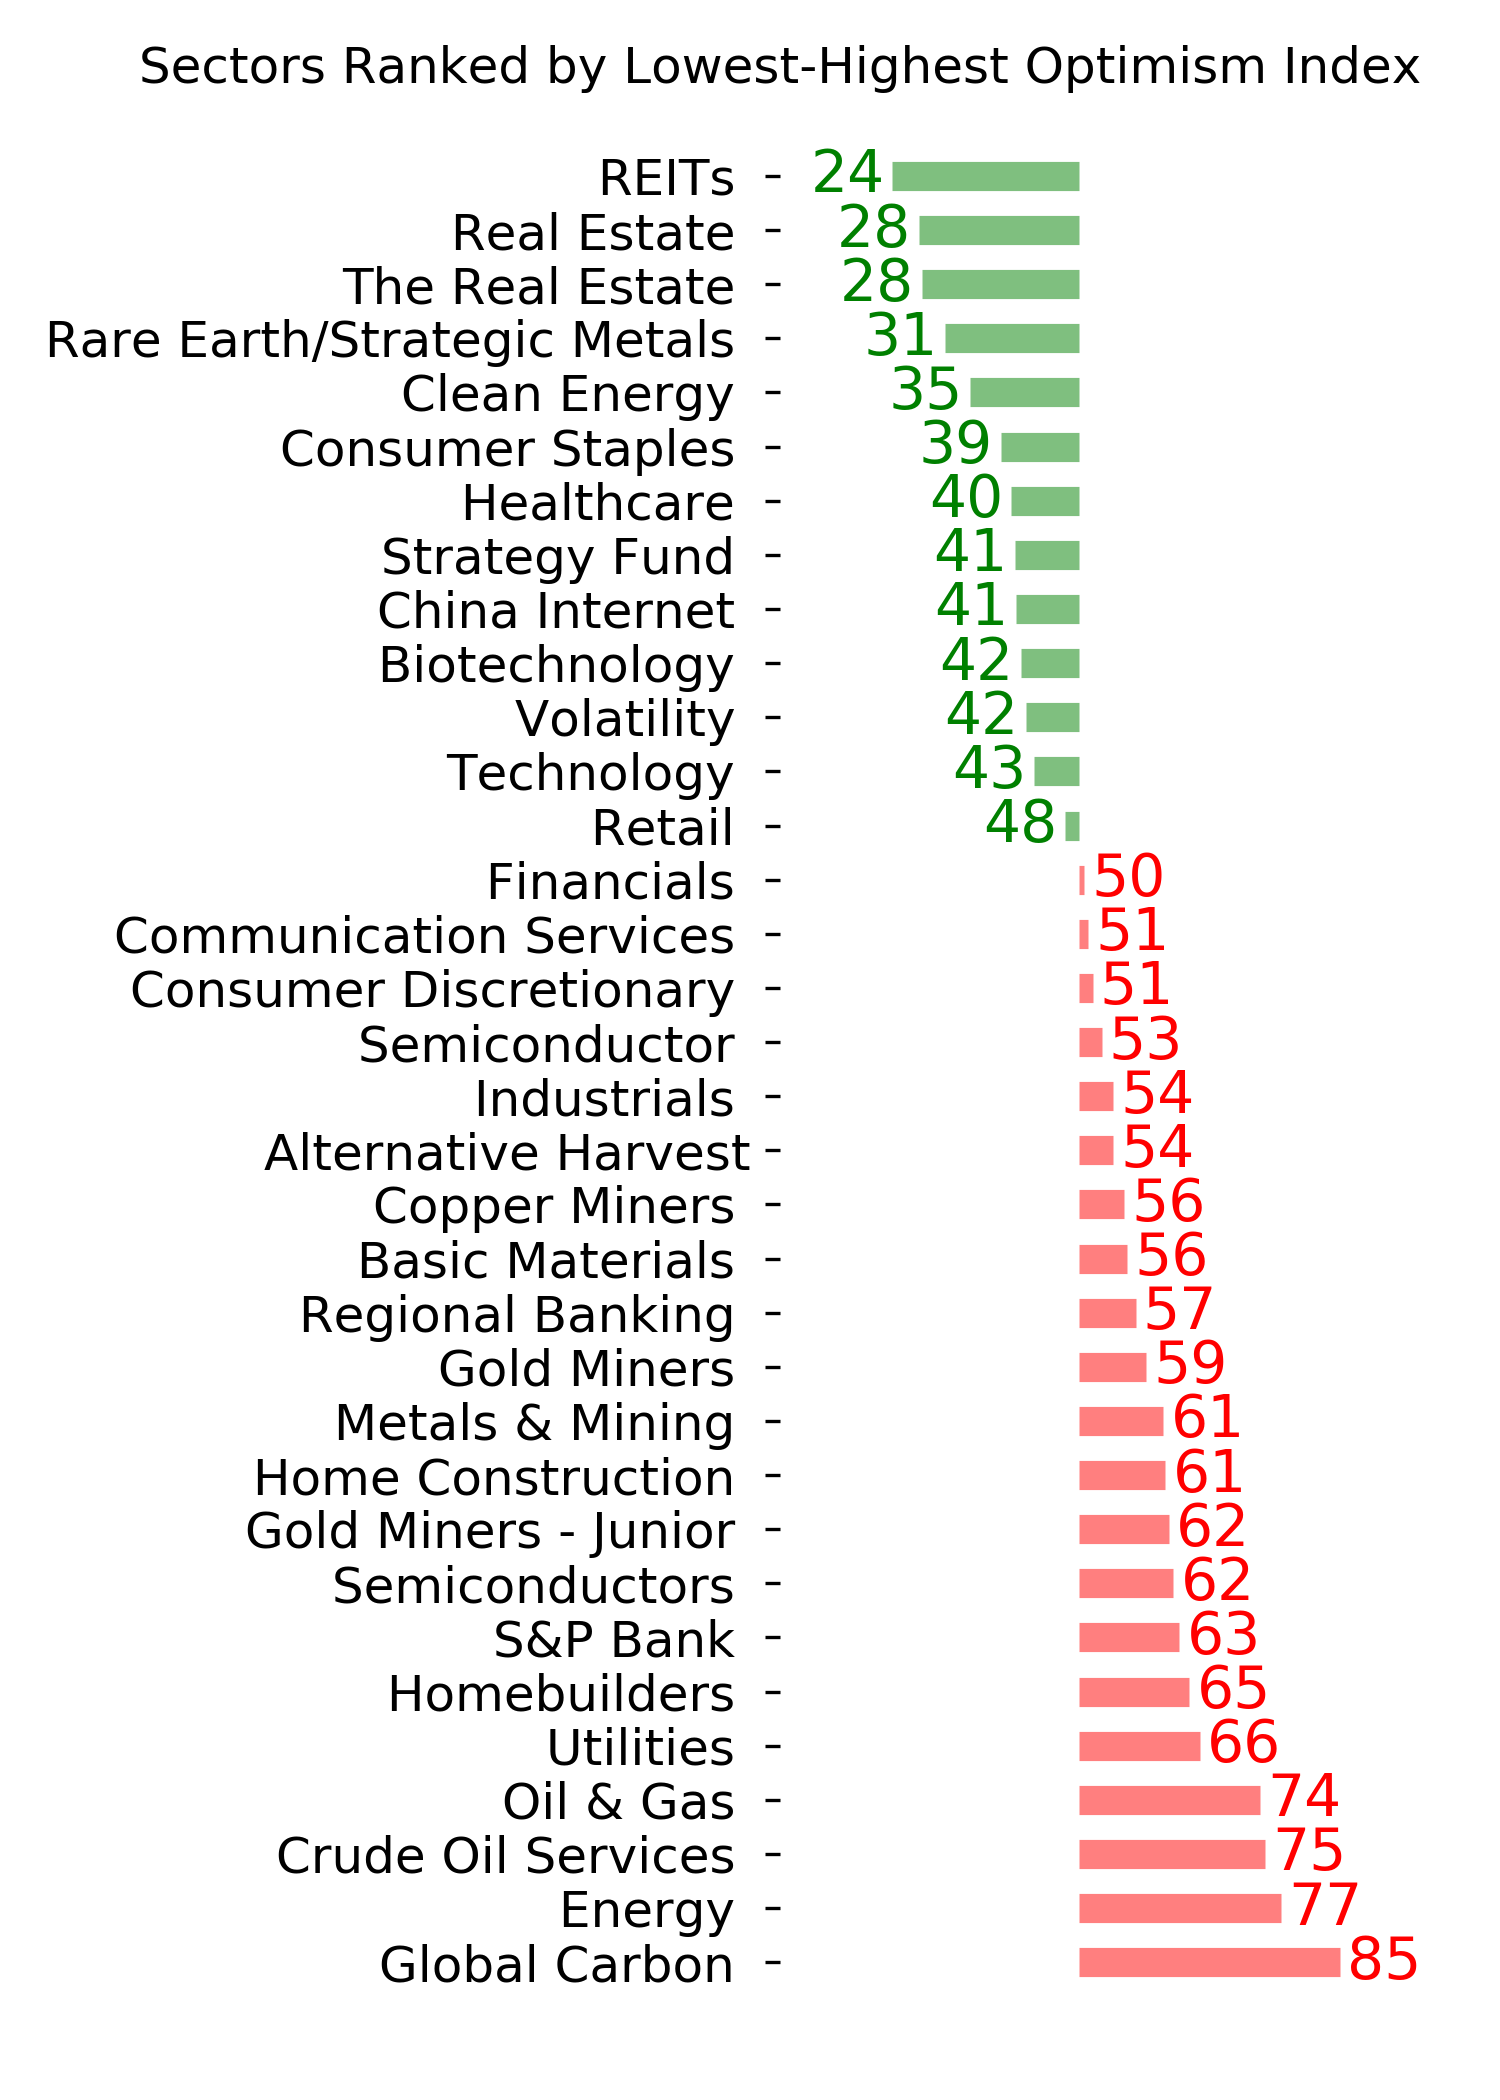
Optimism Index Thumbnails
|
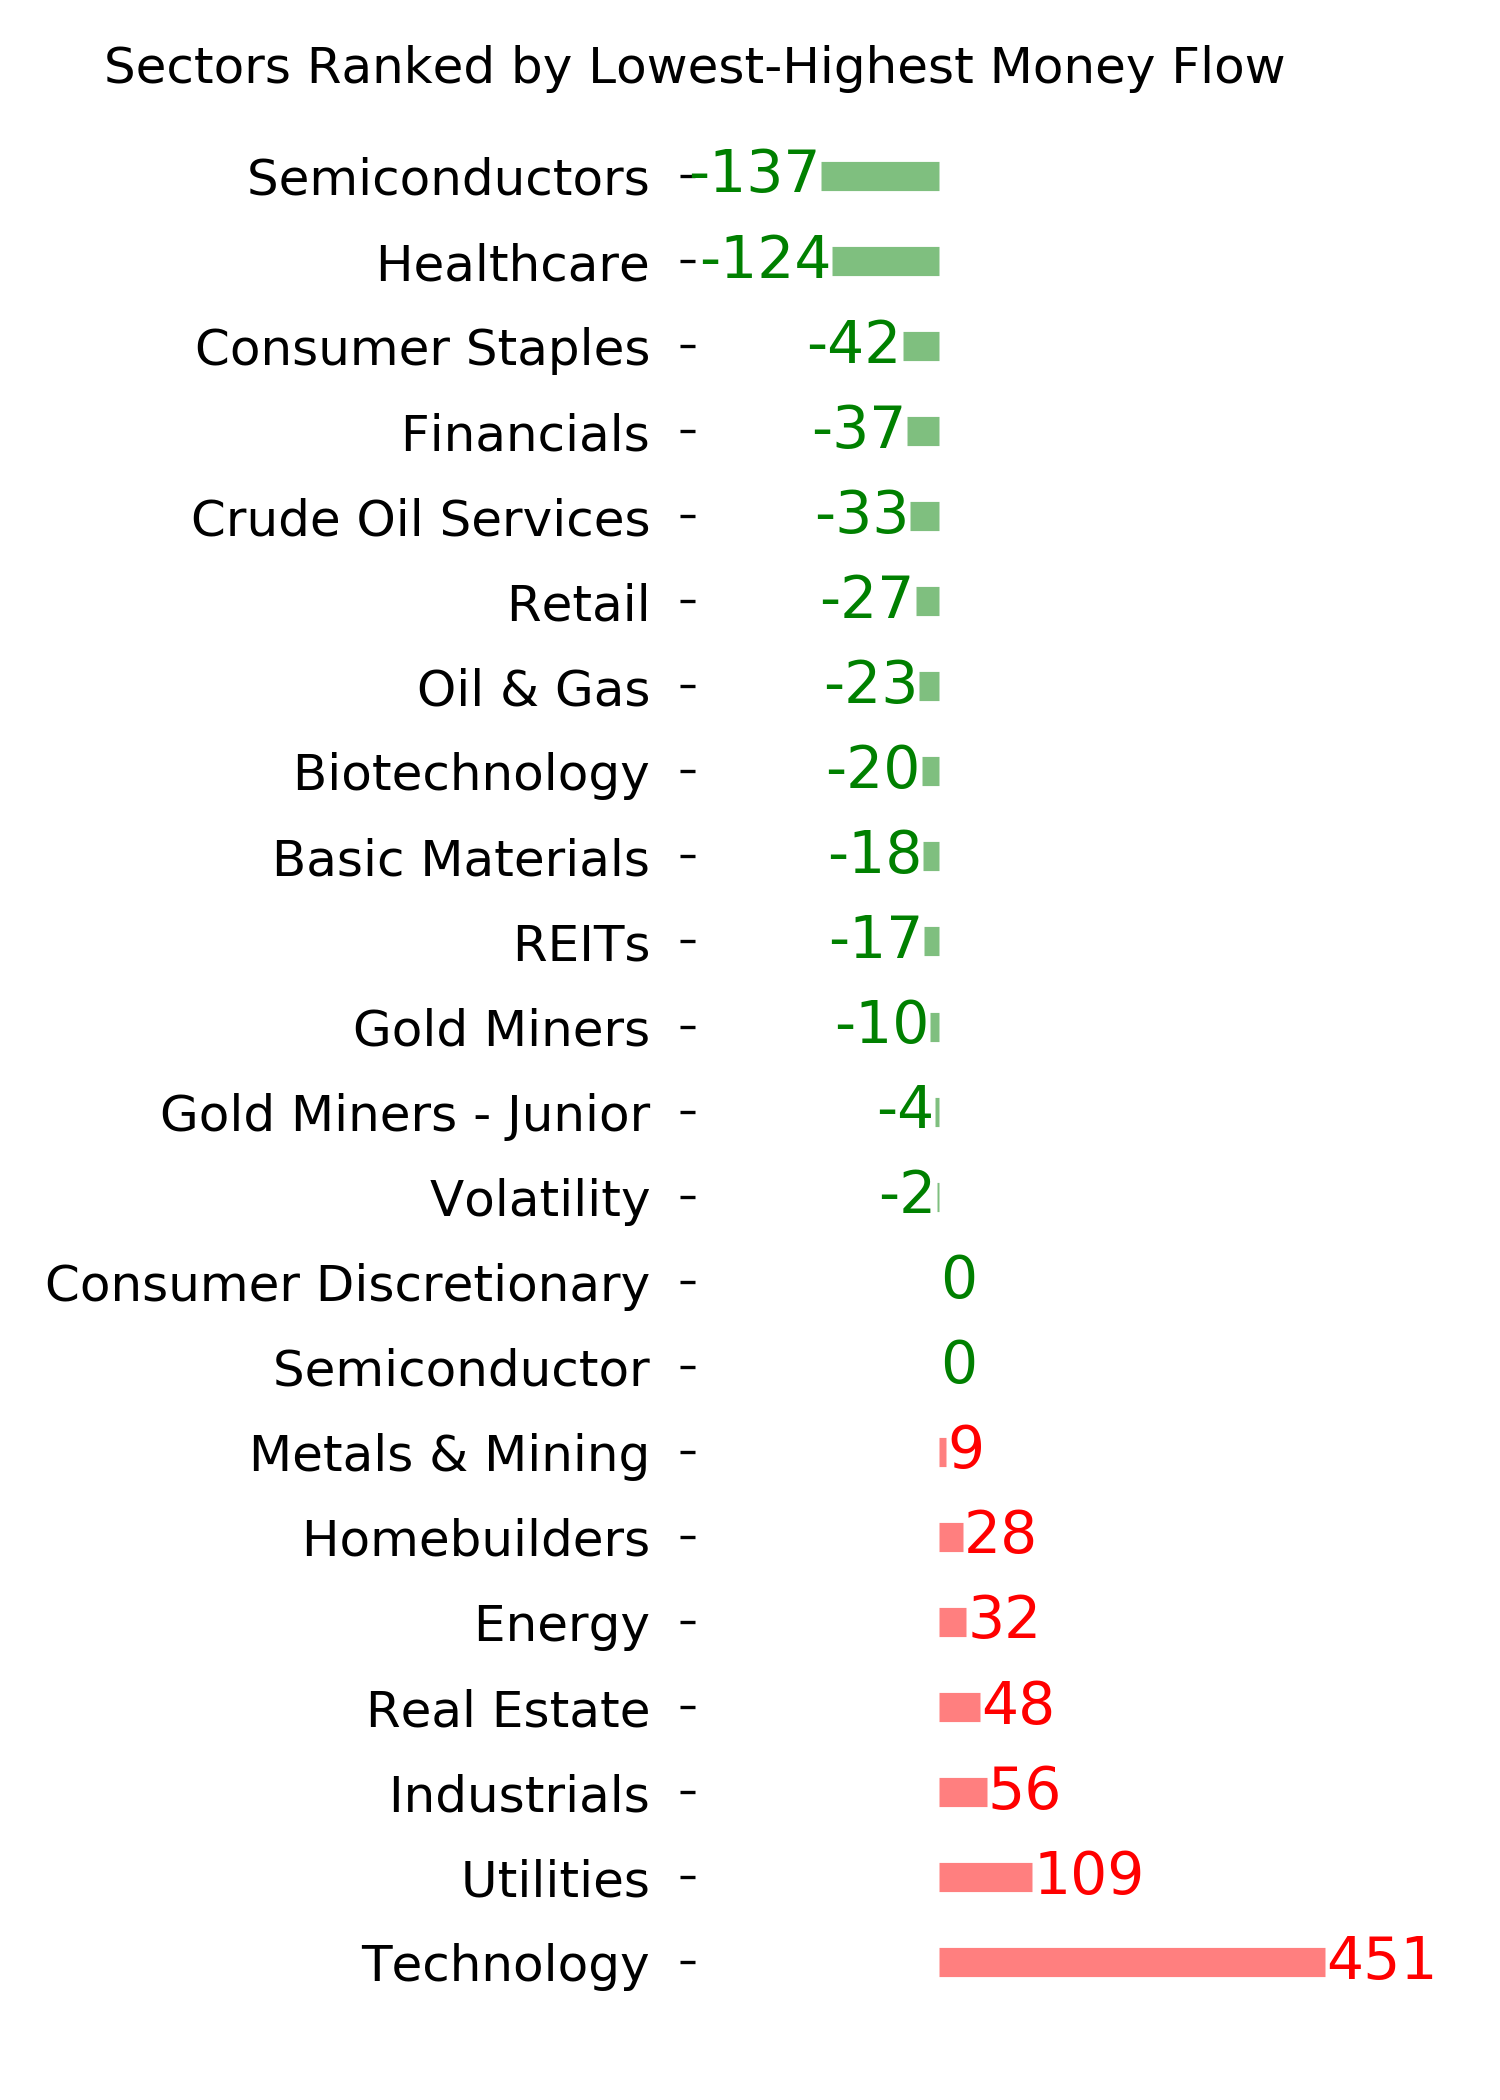
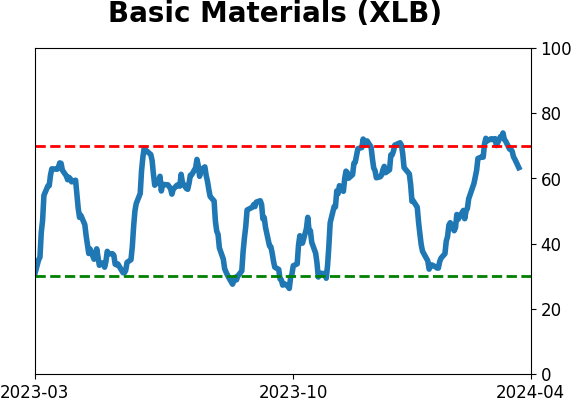
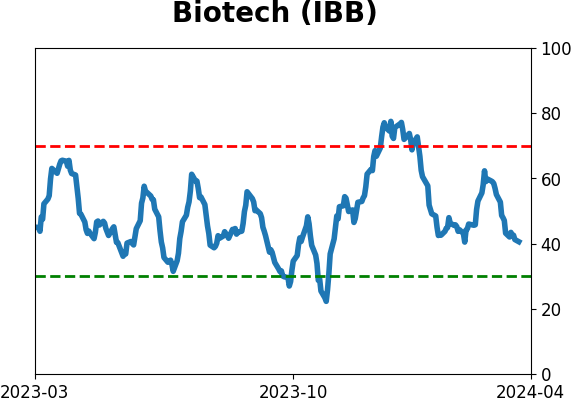
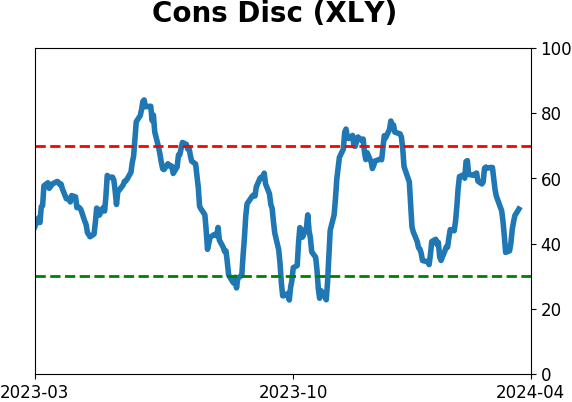
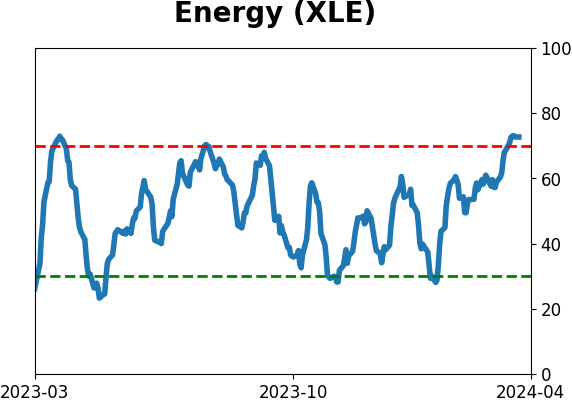
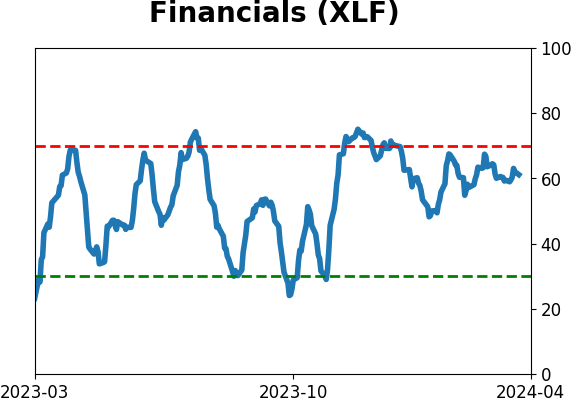
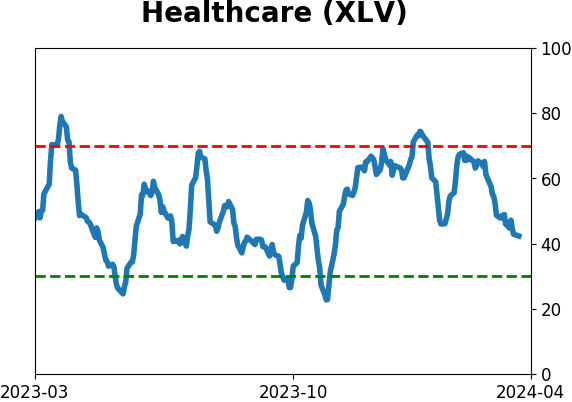
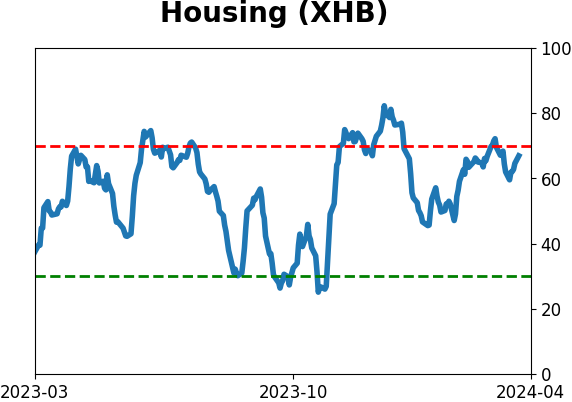
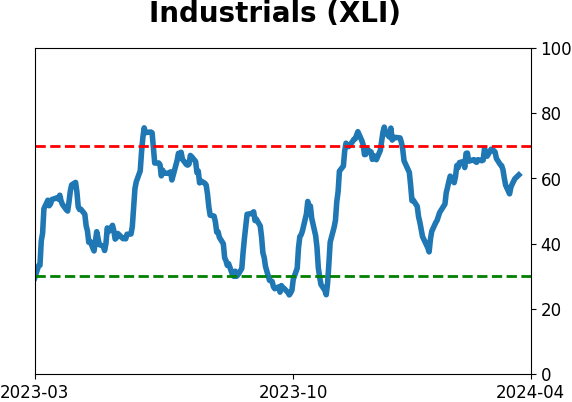
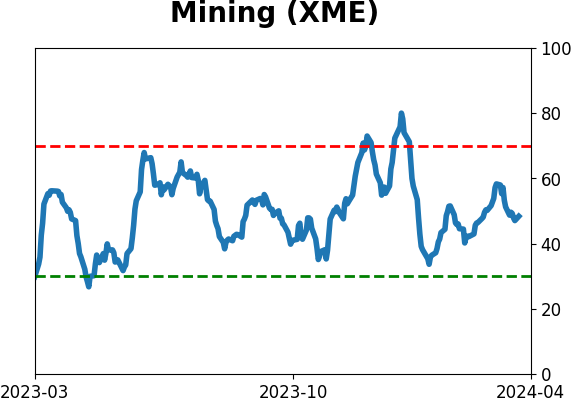
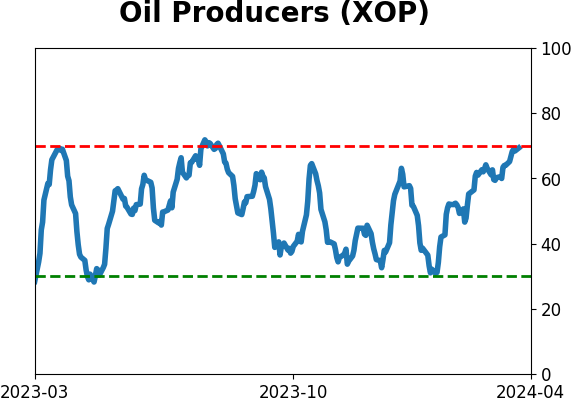
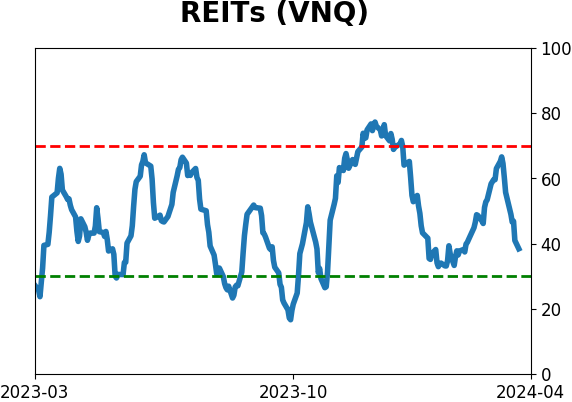
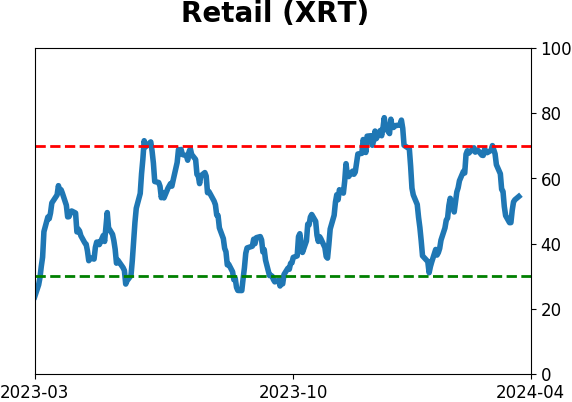
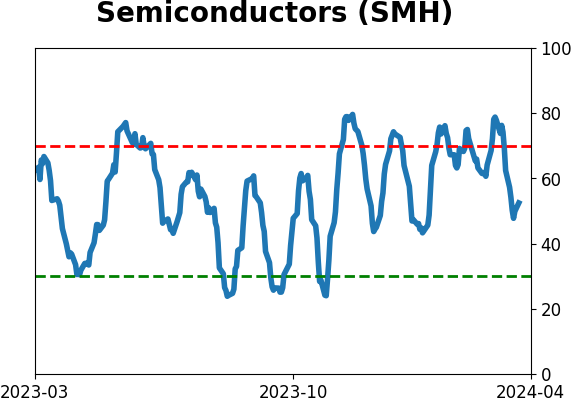
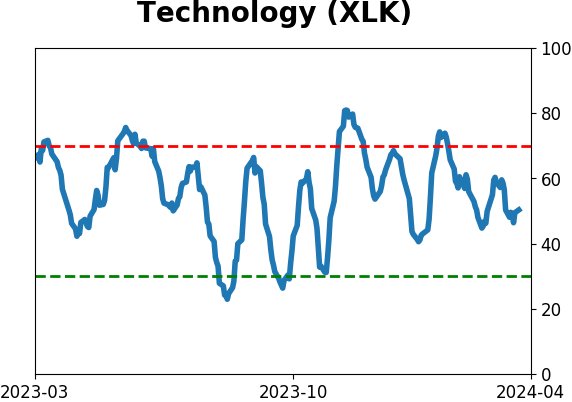
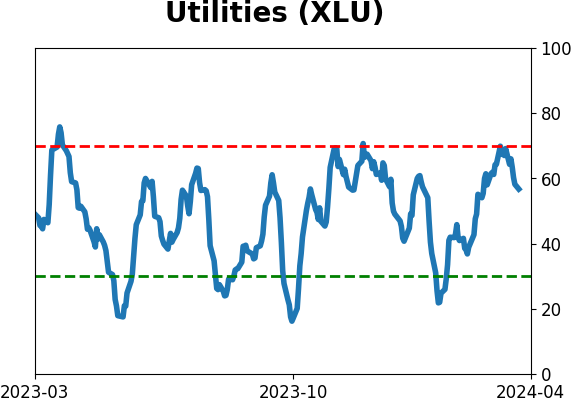
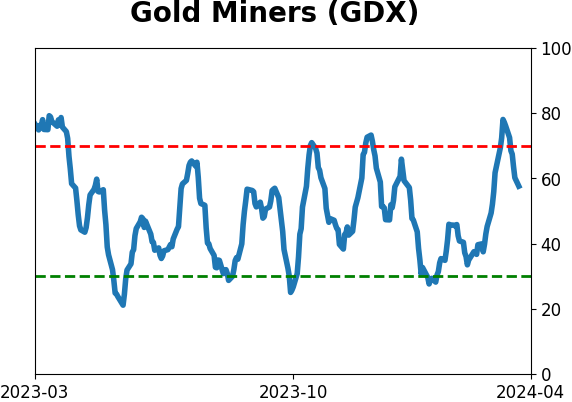
Sector ETF's - 10-Day Moving Average
|
|
|
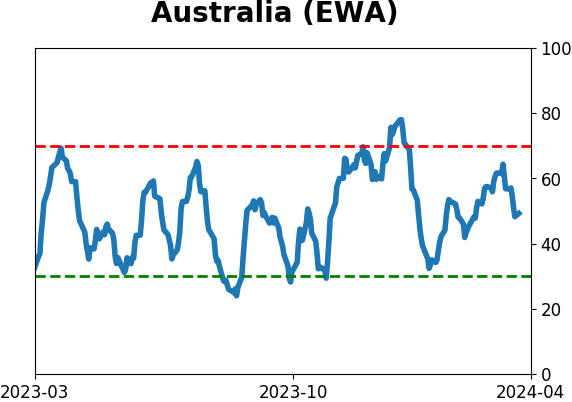
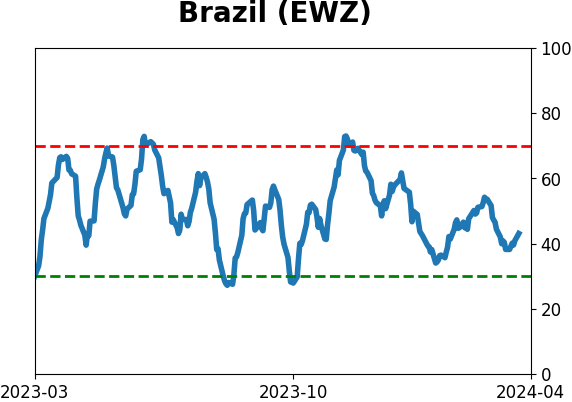
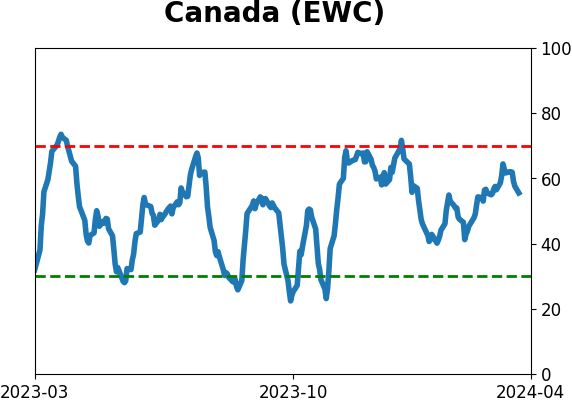
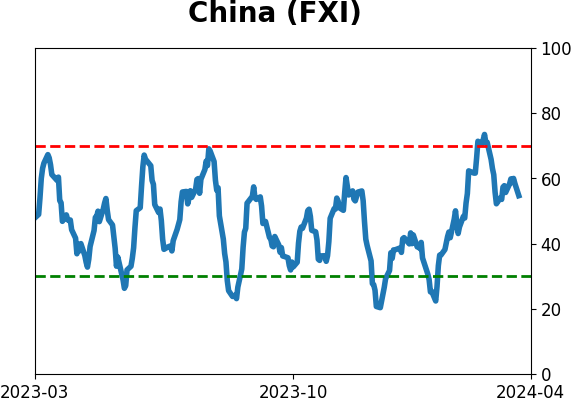
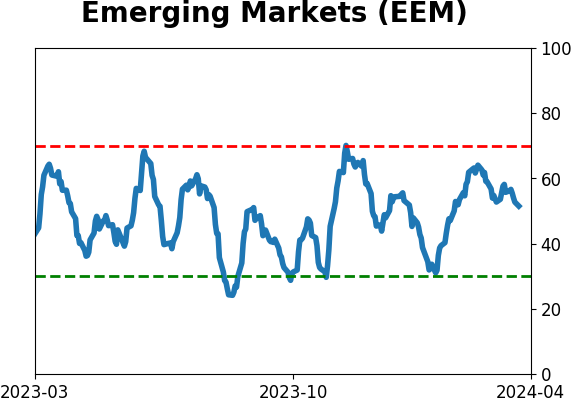
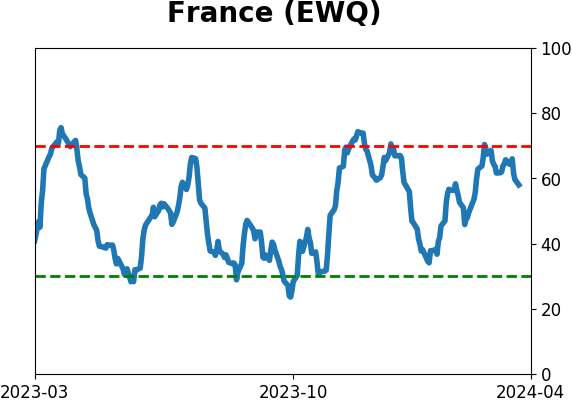
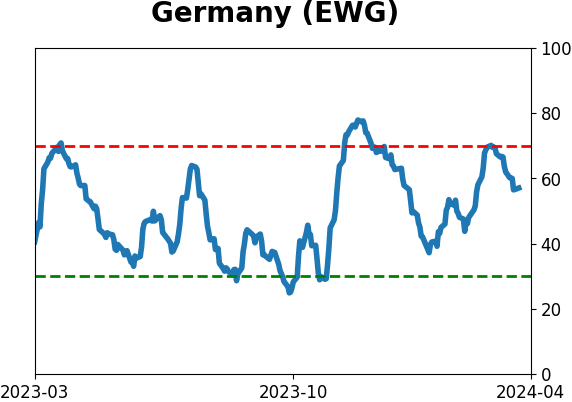
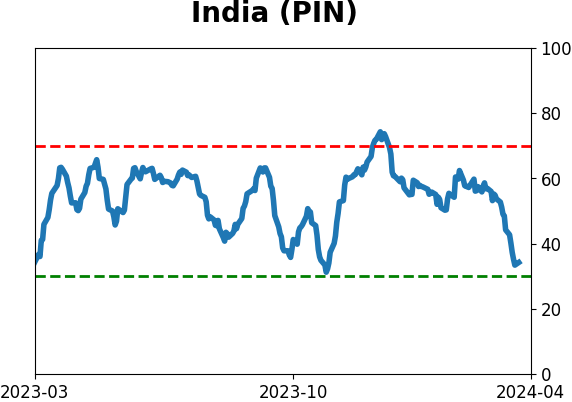
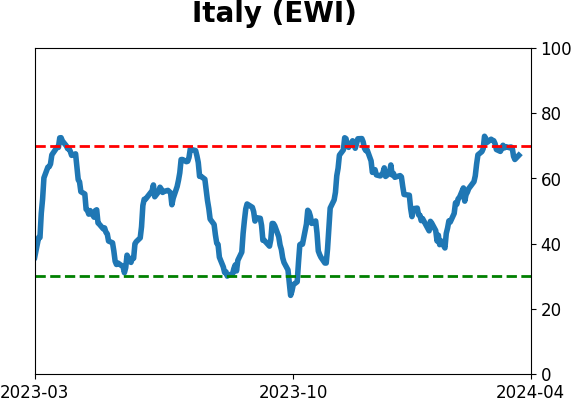
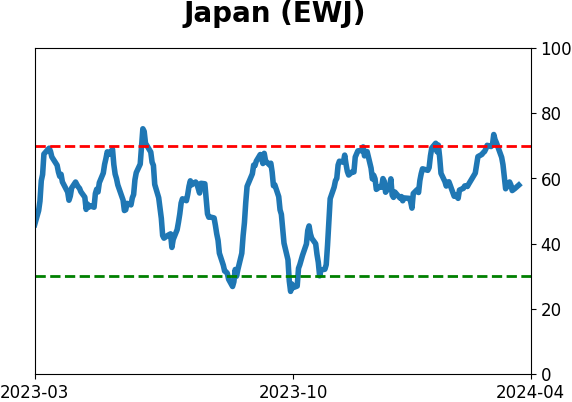
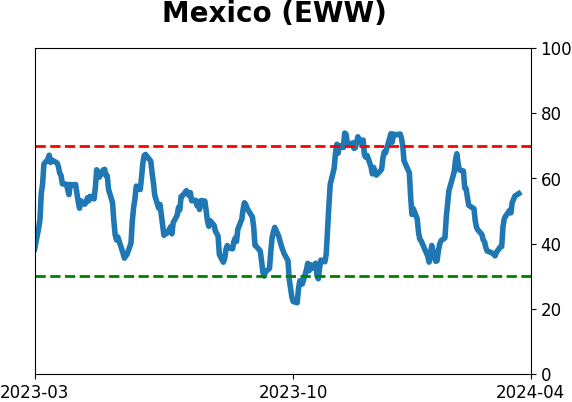
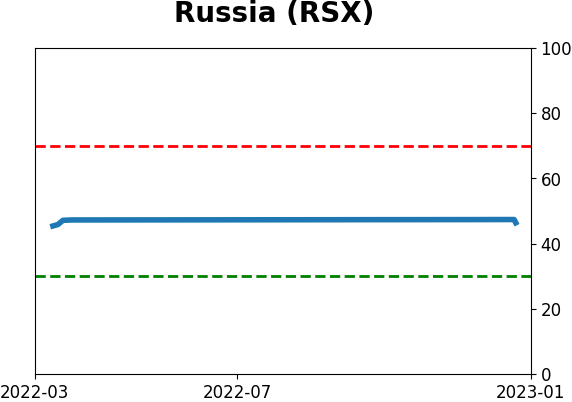
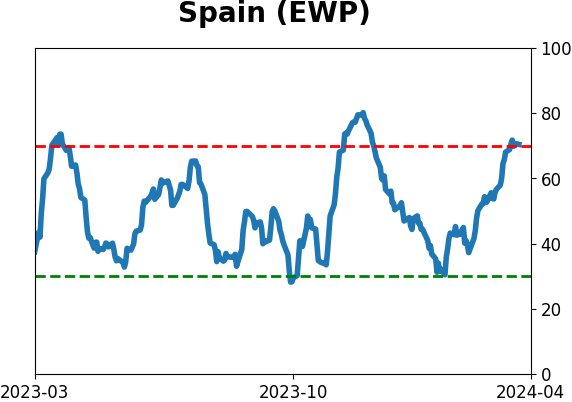
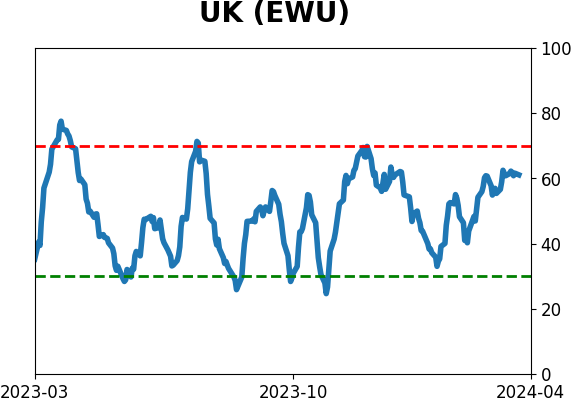
Country ETF's - 10-Day Moving Average
|
|
|
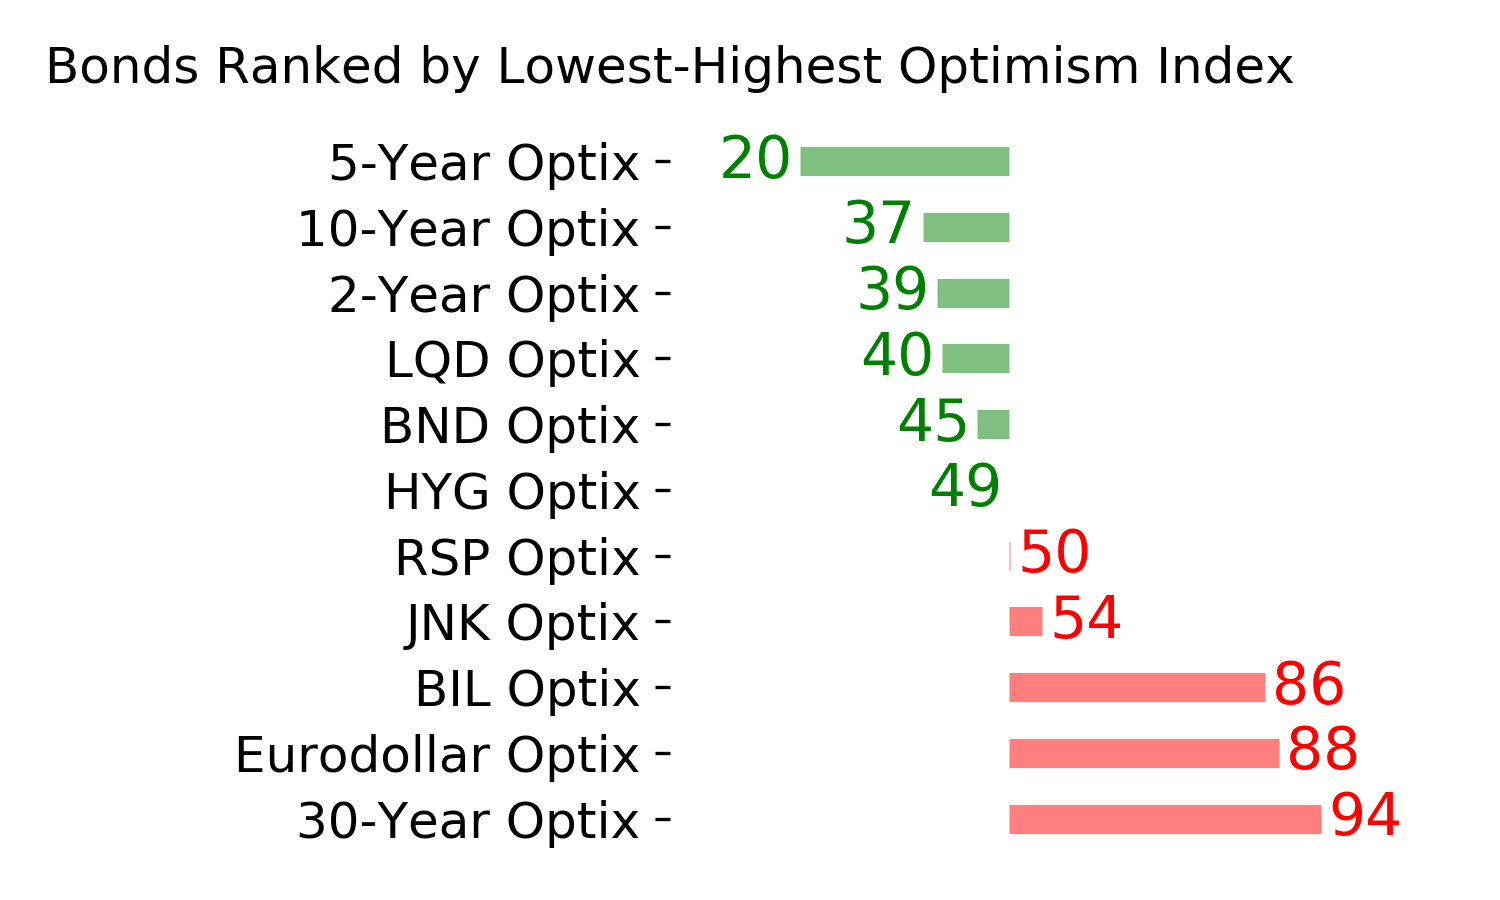
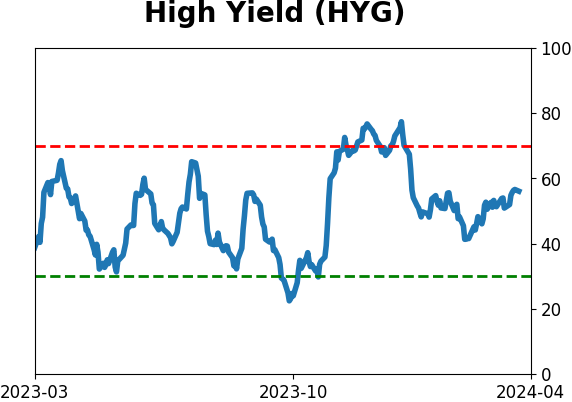
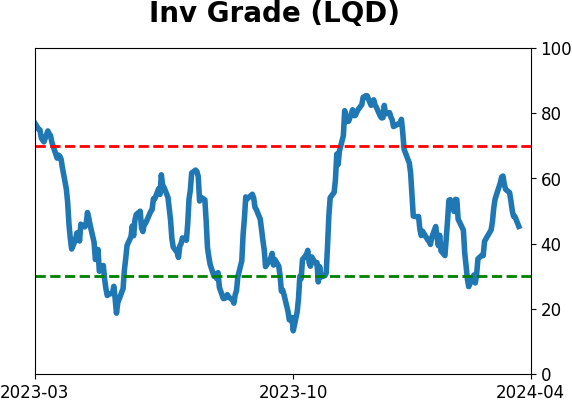
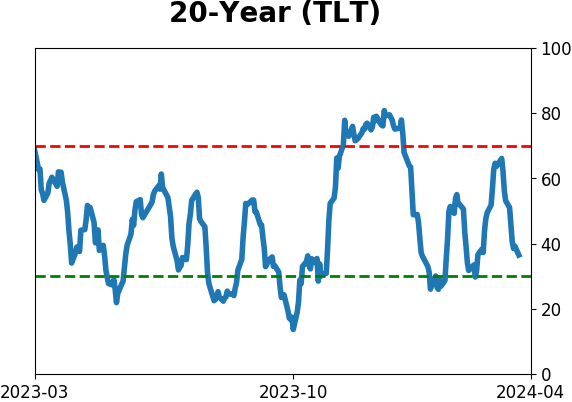
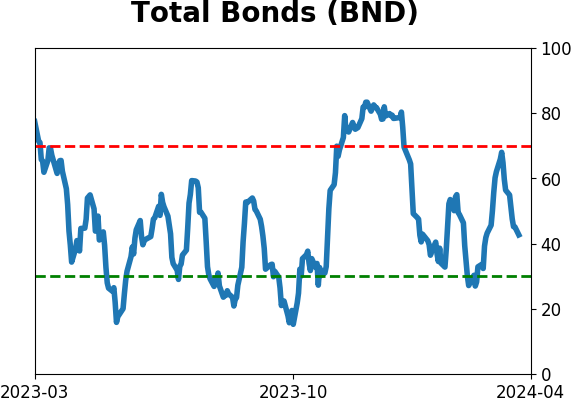
Bond ETF's - 10-Day Moving Average
|
|
|
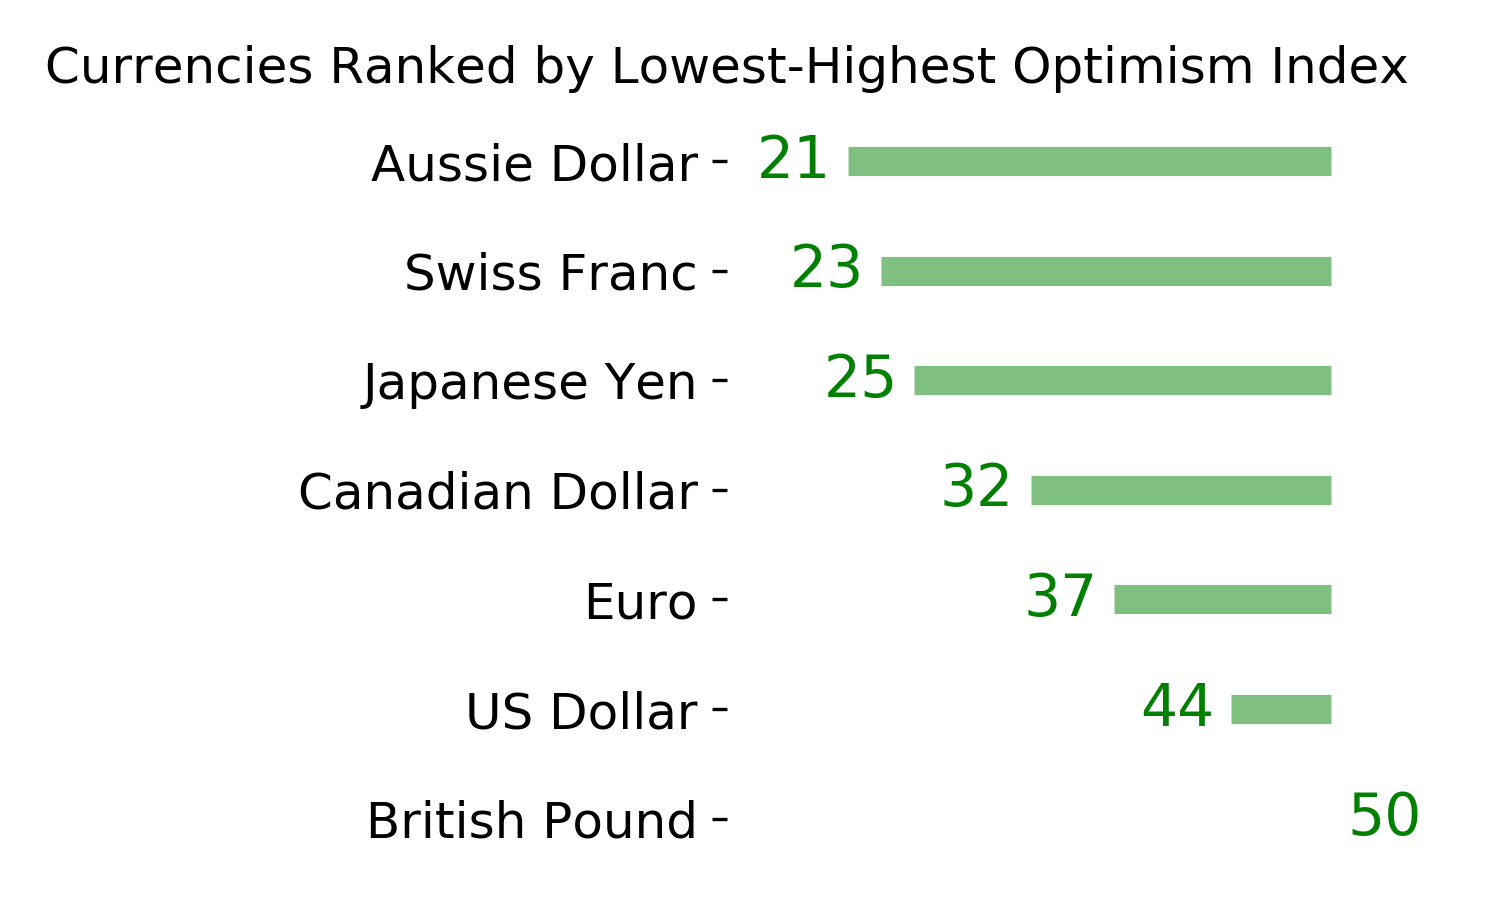
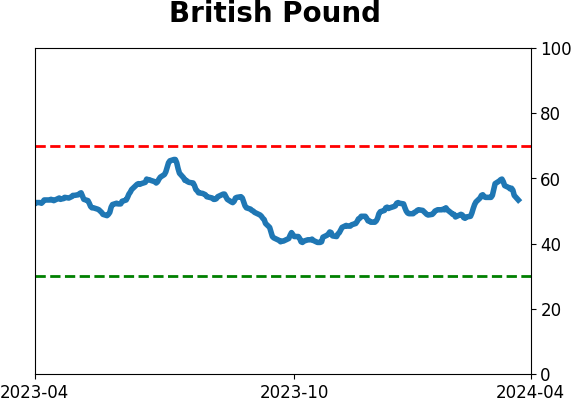
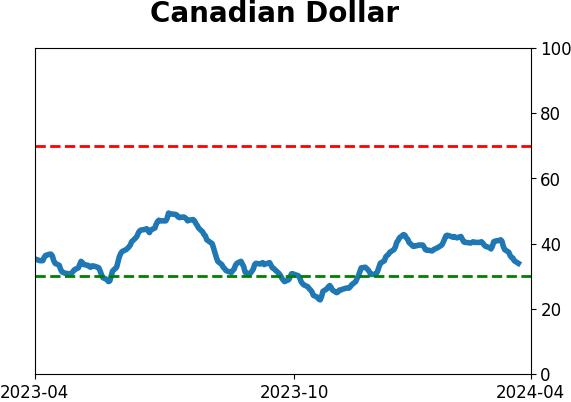
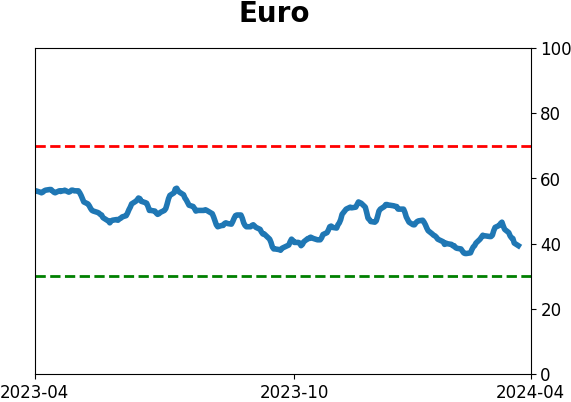
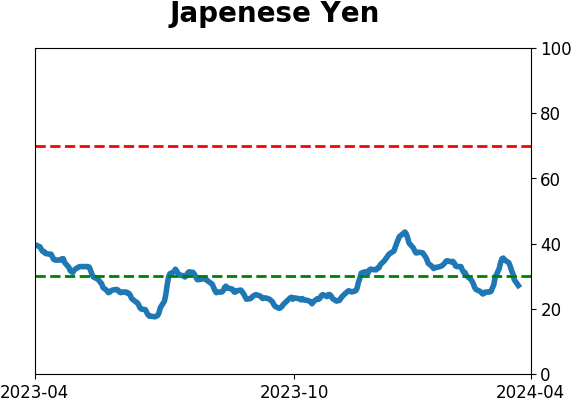
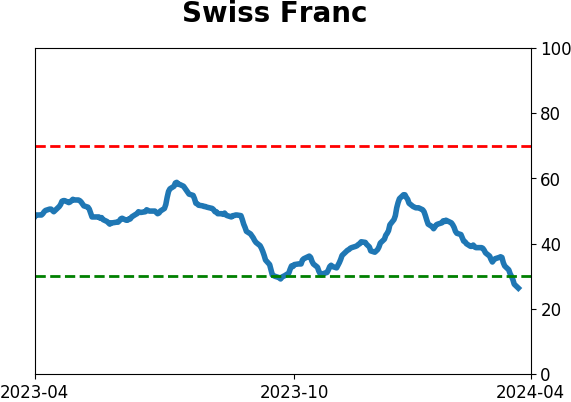
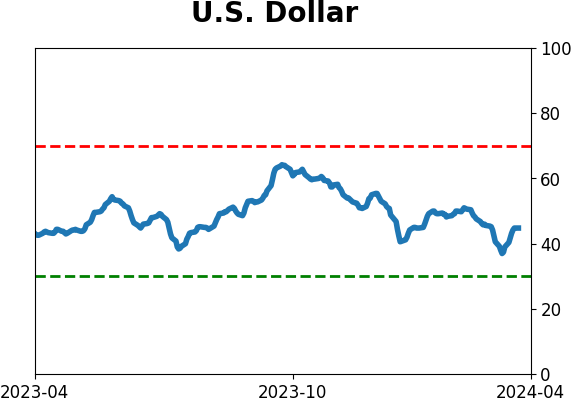
Currency ETF's - 5-Day Moving Average
|
|
|
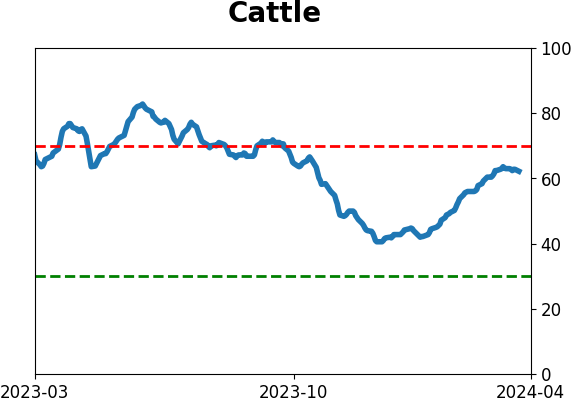
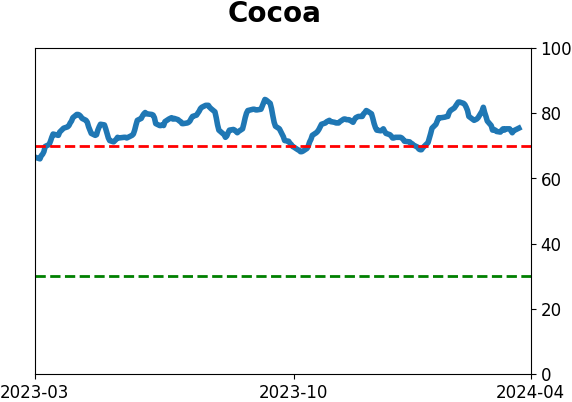
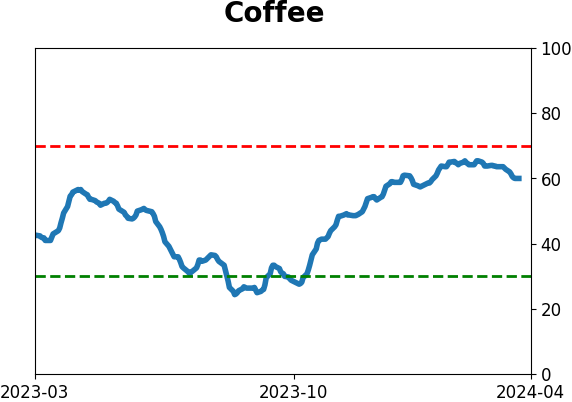
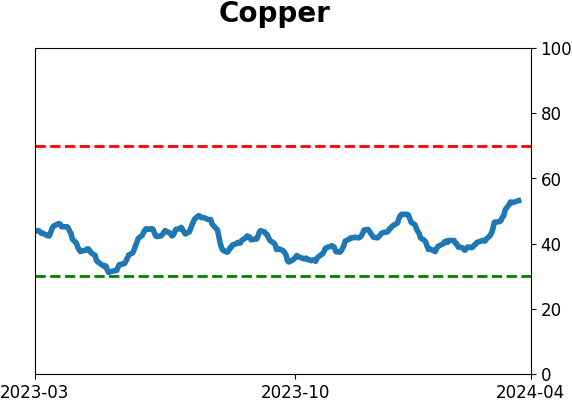
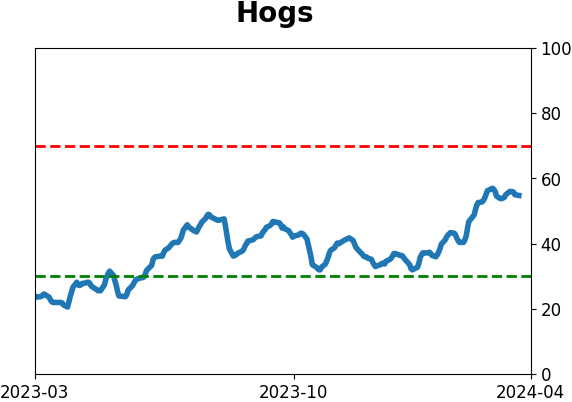
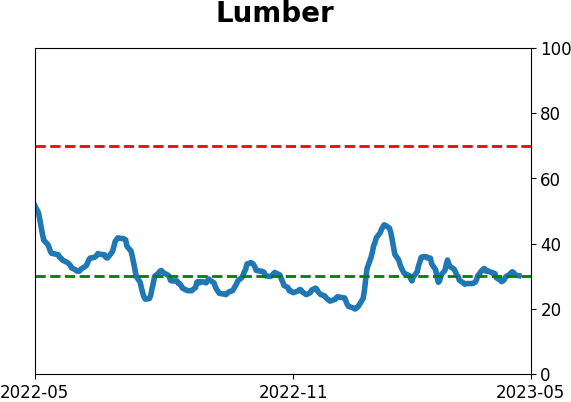
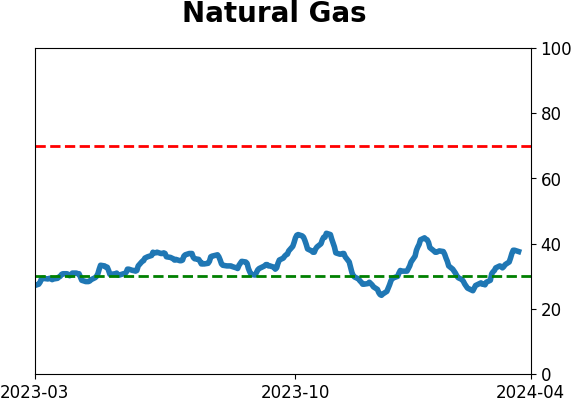
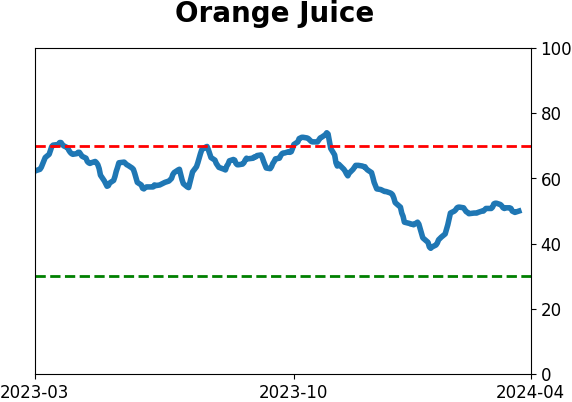
Commodity ETF's - 5-Day Moving Average
|
|