Headlines
|
|
An odd - but effective - combination of indicators still unfavorable for bonds:
It is not advisable to rely solely on seasonality or the copper/gold ratio to trade bonds. However, a simple combination of the two has done a pretty good job keeping investors on the right side of t-bonds over the long term. This piece lays out the details.
|
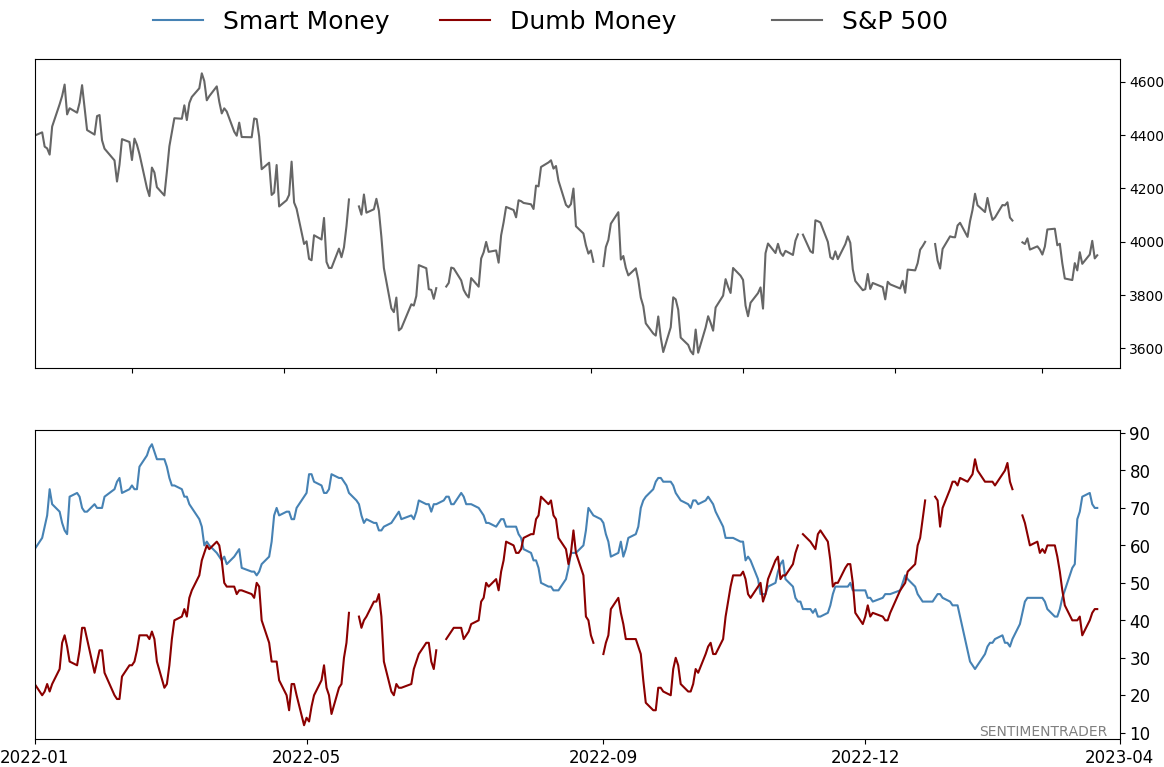
Smart / Dumb Money Confidence
|
Smart Money Confidence: 70%
Dumb Money Confidence: 43%
|
|
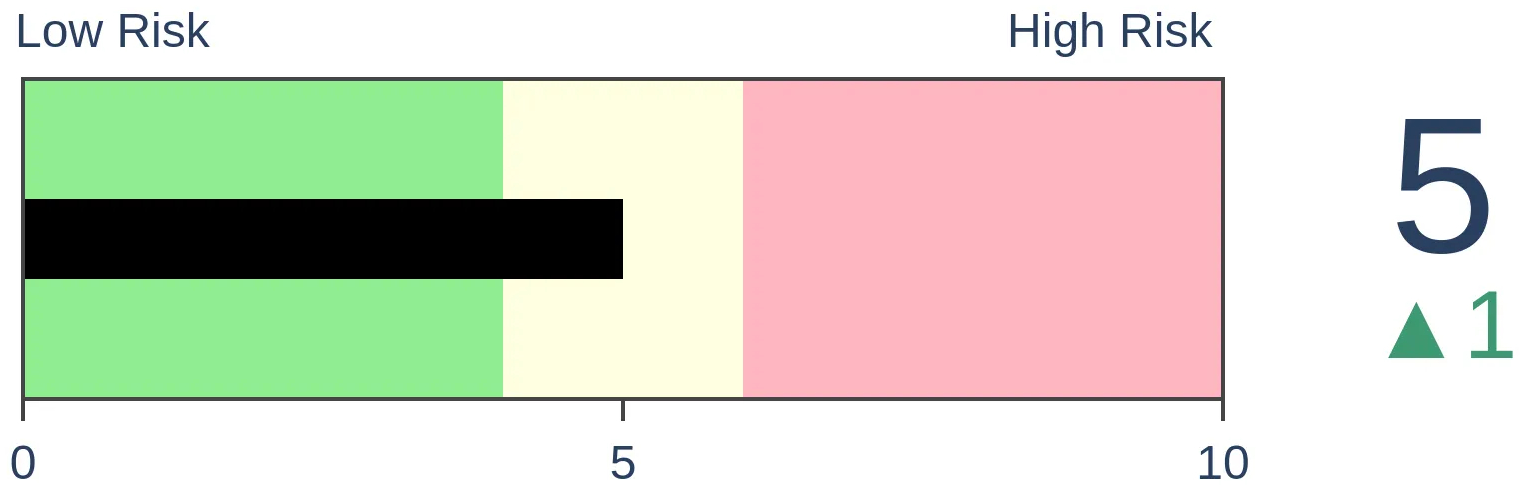
Risk Levels
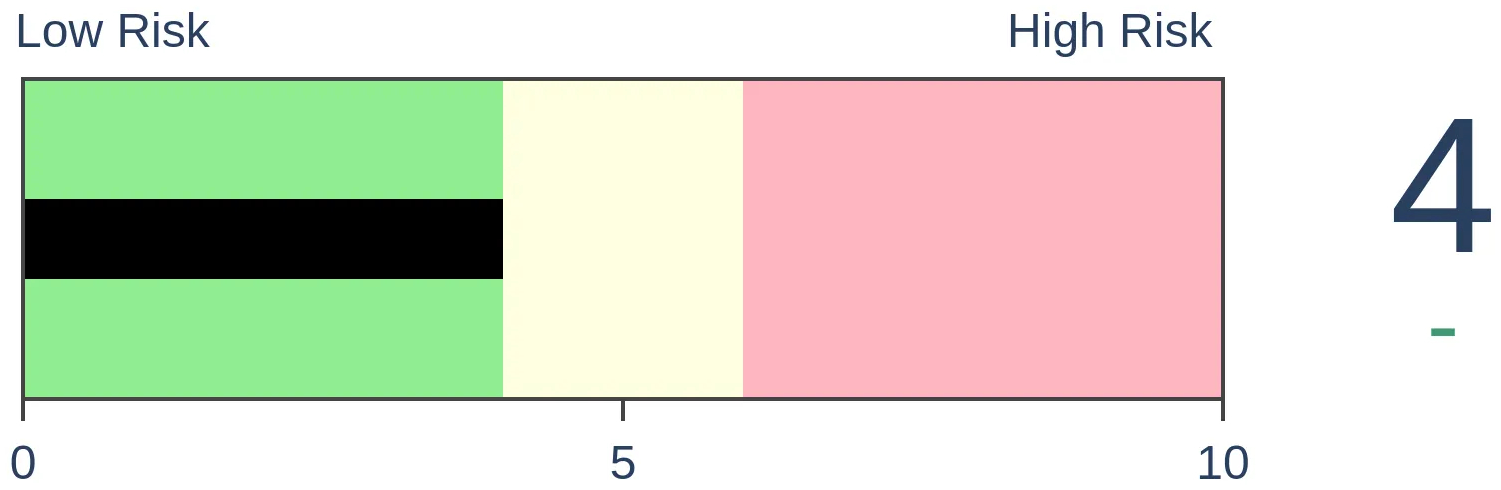
Stocks Short-Term
|
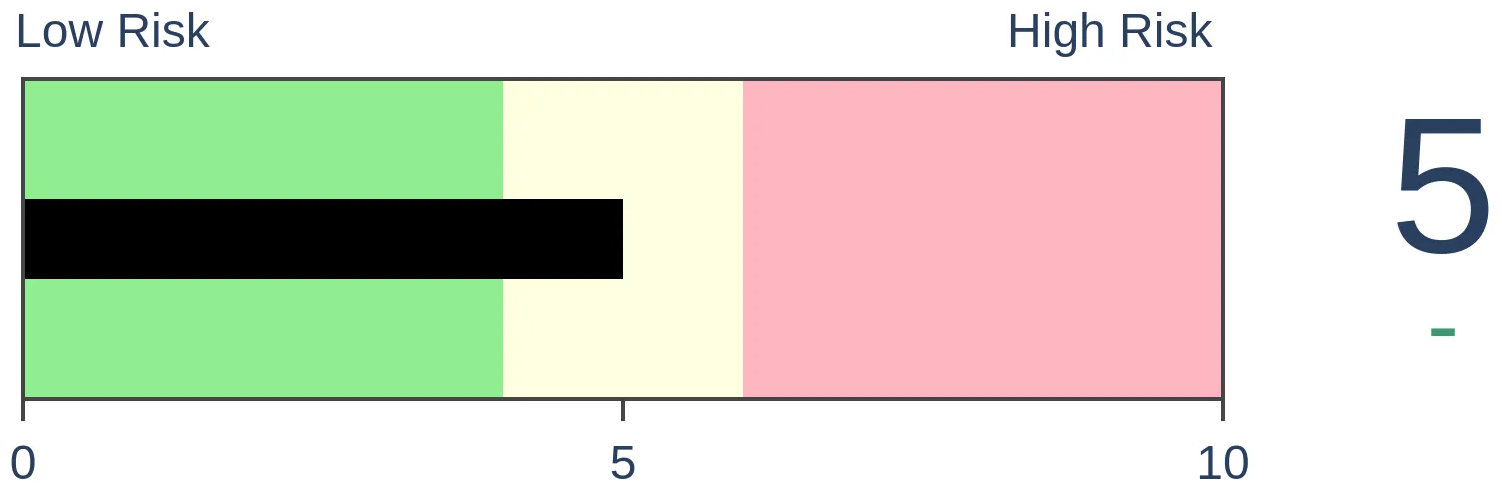
Stocks Medium-Term
|
|
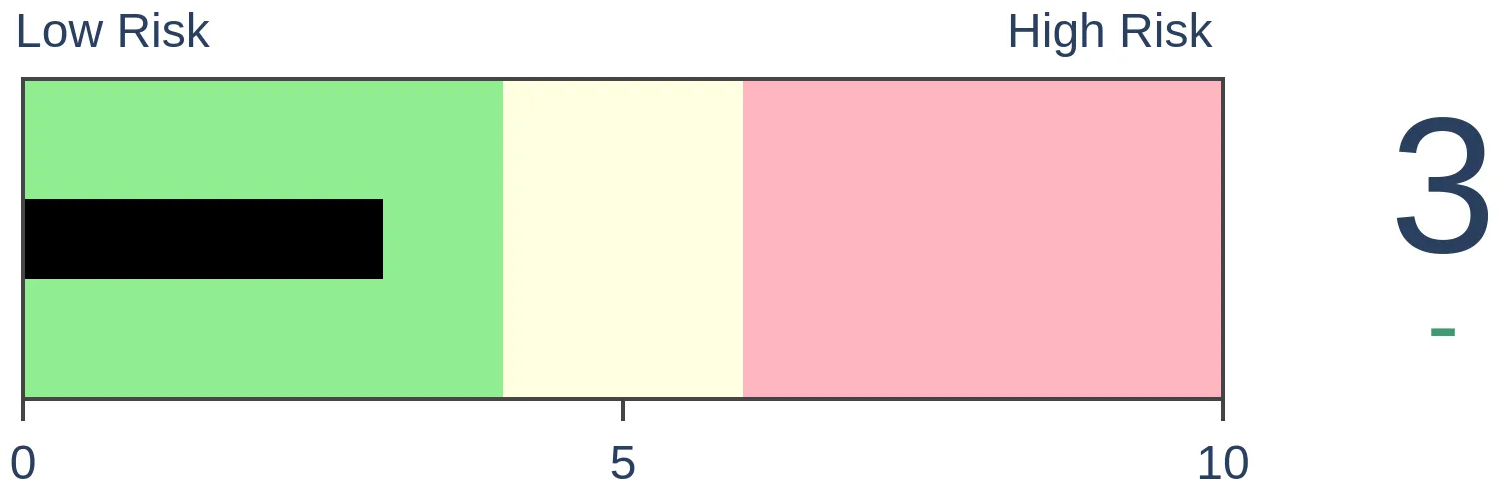
Bonds
|
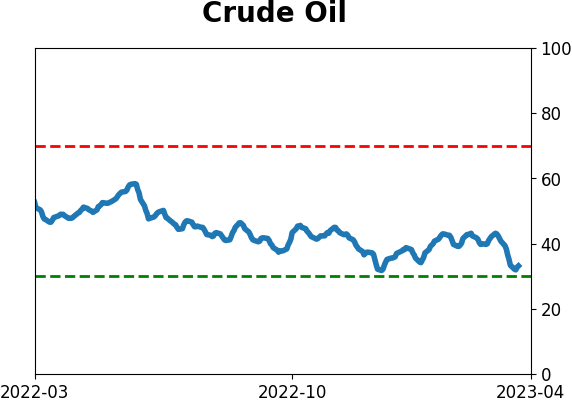
Crude Oil
|
|
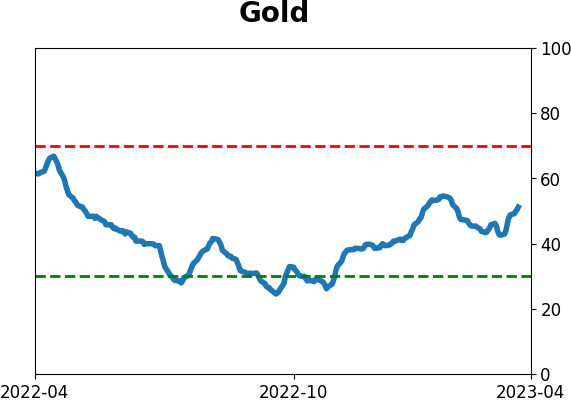
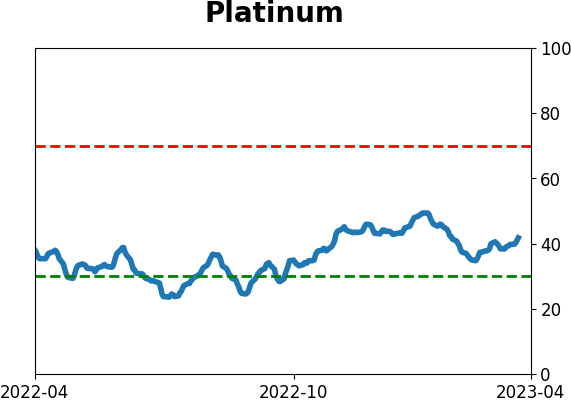
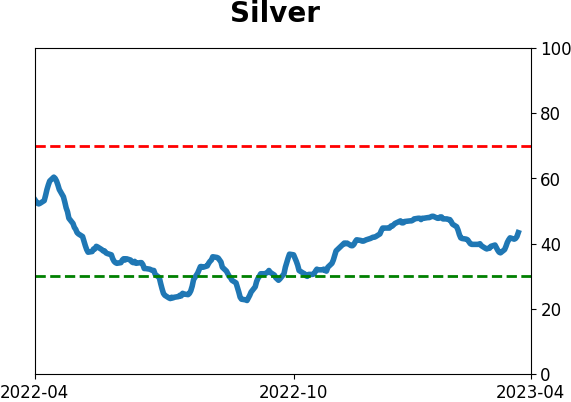
Gold

|
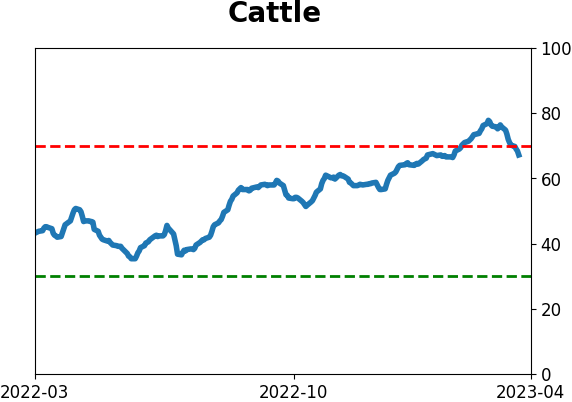
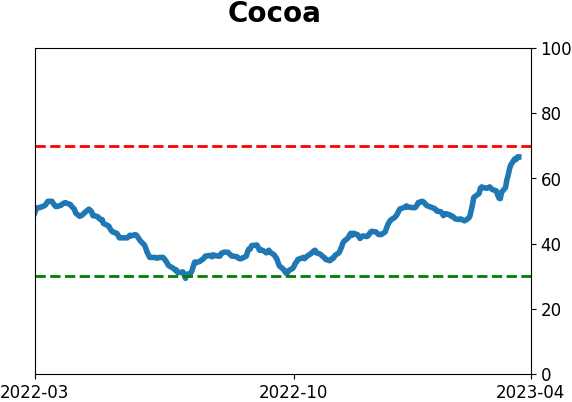
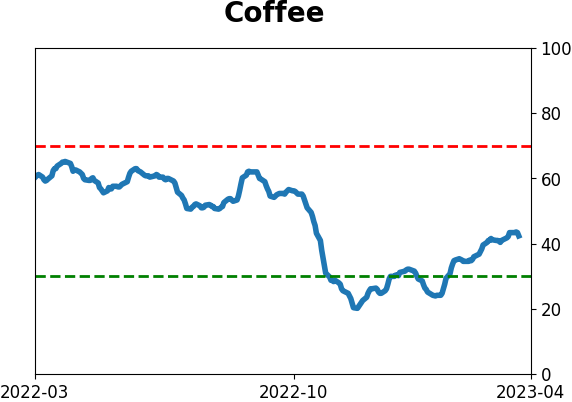
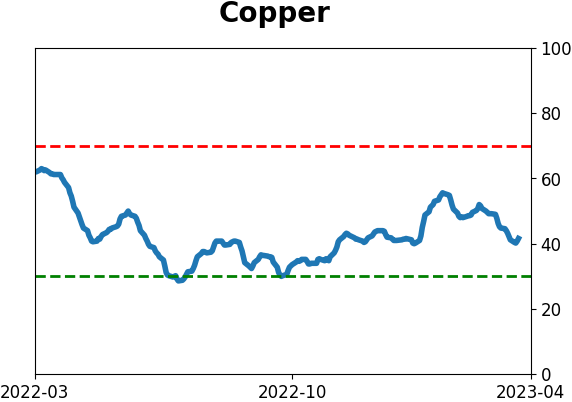
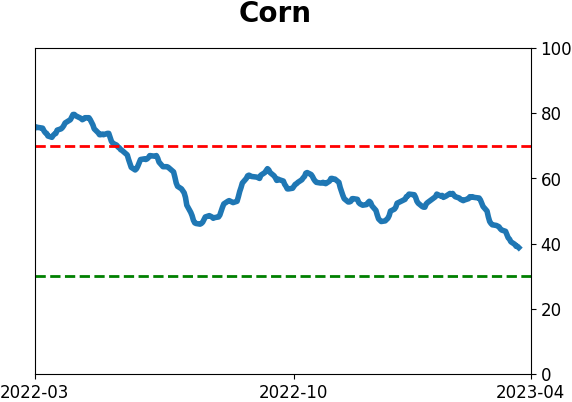
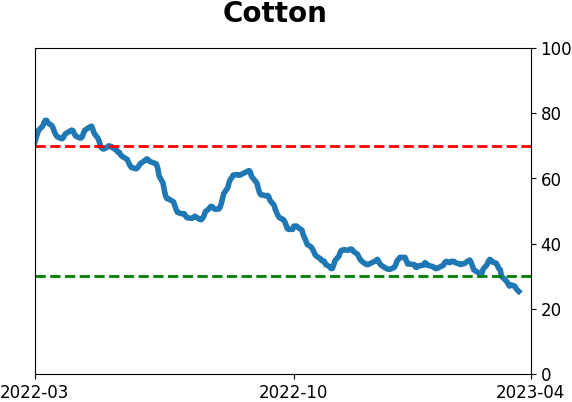
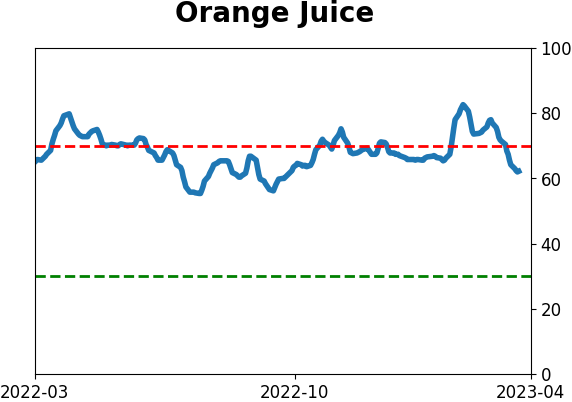
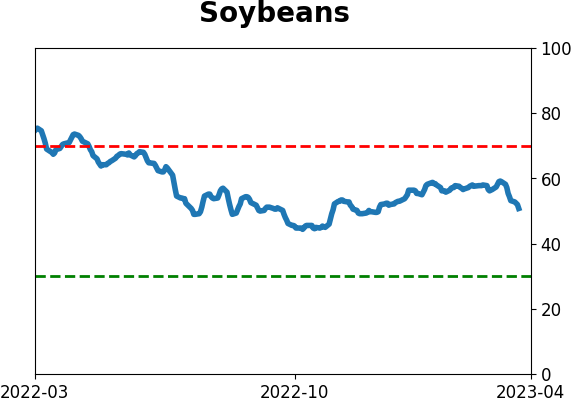
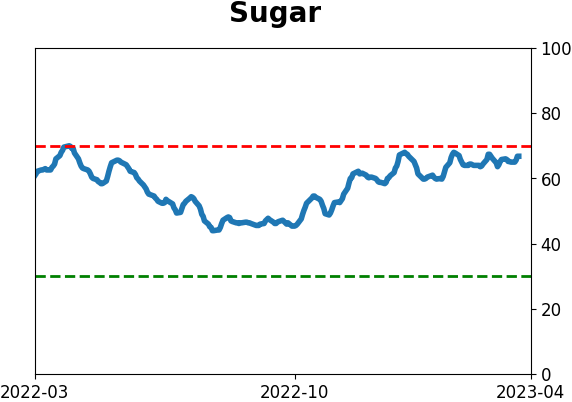
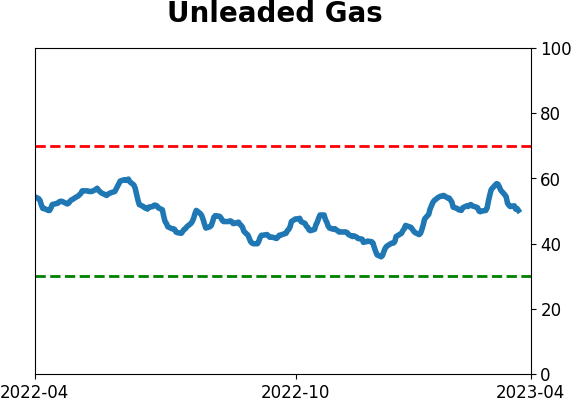
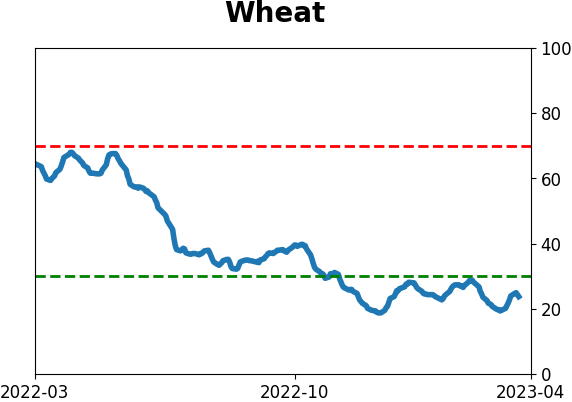
Agriculture

|
|
Research
By Jay Kaeppel
BOTTOM LINE
It is not advisable to rely solely on seasonality or the copper/gold ratio to trade bonds. However, a simple combination of the two has done a pretty good job keeping investors on the right side of t-bonds over the long term. This piece lays out the details.
FORECAST / TIMEFRAME
None
|
Key points
- T-bonds have long shown a tendency to decline during the first three months of the year
- Extreme readings in the copper/gold ratio have a history of highlighting reversals in bond prices (due to its high historical correlation to interest rates)
- When either of these indicators is unfavorable, t-bonds typically struggle
The data we will use
To track t-bond performance, we use a continuous type contract from Bloomberg that follows the daily change in price for 30-year treasury bond futures. Each 1-point movement in the price of the contract is worth $1,000. Note that this contract has recently begun to include holidays if any electronic trading occurs on that day.
T-bonds remain within a seasonally unfavorable period
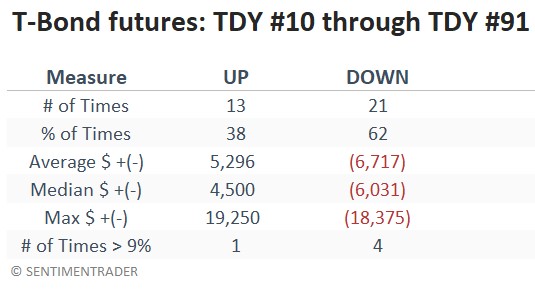
The chart below shows the annual seasonal trend for ticker TLT. An unfavorable period extends from the close of Trading Day of Year (TDY) #10 through TDY #91. For 2023 this period extends from the close on 2023-01-17 through 2023-05-09. We are presently roughly halfway through this period.
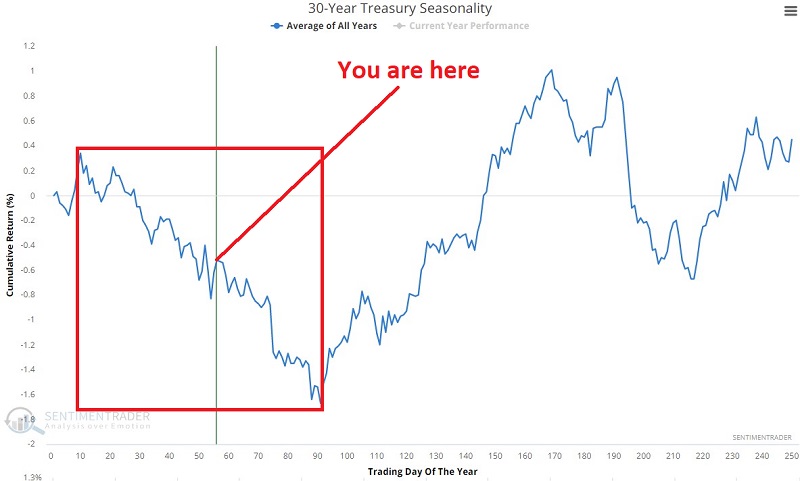
Each point for a t-bond futures contract is worth $1,000. If the price rises one point, a trader holding a long position gains $1,000; if the price falls one point, a trader holding a long position loses $1,000. The chart below displays the cumulative $ return for t-bond futures if held long only from TDY #10 through TDY #91 every year starting in 1989.
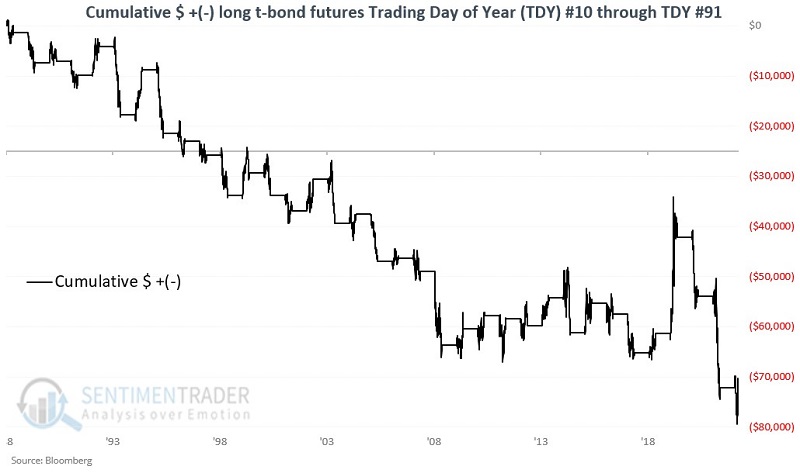
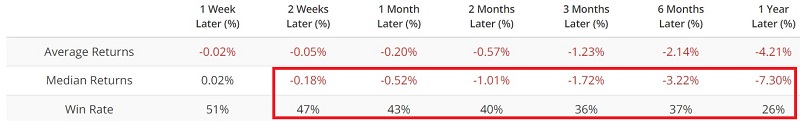
The table below summarizes t-bond performance.
T-bonds and the copper/gold ratio
The chart below (courtesy of cfainstitute.org) displays the recent history of the copper/gold ratio and the 10-year treasury yield.
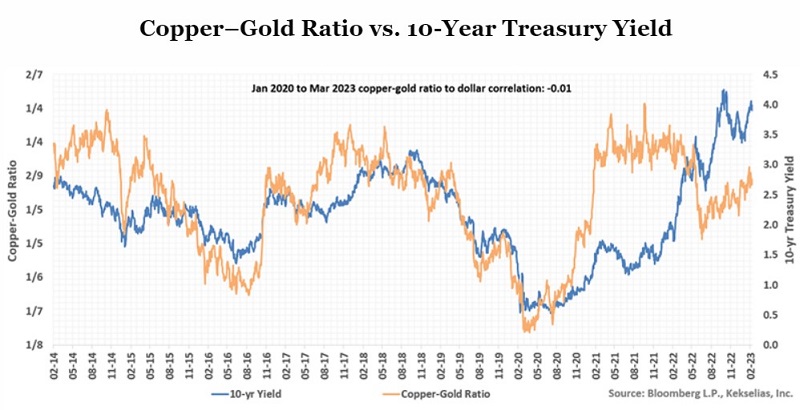
Treasury yields and the copper/gold ratio have typically enjoyed a reasonably strong correlation. However, that correlation has weakened some since January 2020. Nevertheless, when the copper/gold ratio reaches an extreme and reverses, t-bond prices also typically reverse.
The chart below highlights all days when the Sentimentrader copper/gold ratio indicator was below 0.20, with the 30-year treasury future price in the top clip. Note the tendency for t-bond price weakness following such readings.
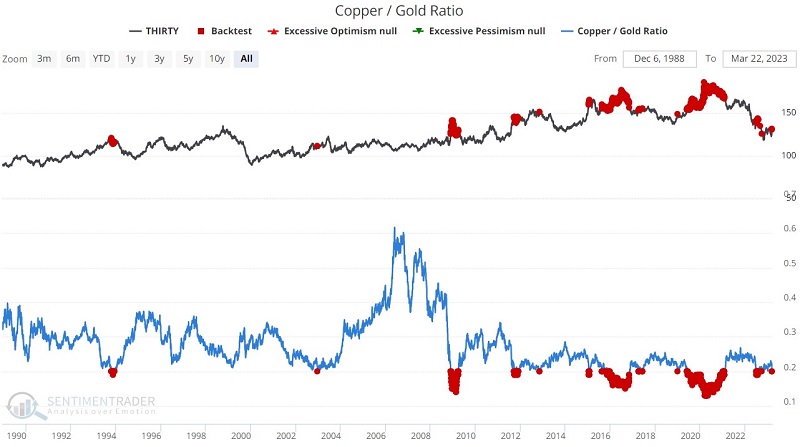
The table below summarizes t-bond performance following copper/gold ratio readings below 0.20.
Combining seasonality and the copper/gold ratio in a Combined Model
For this test, we will create a two indicator Combined Model. The first indicator is bearish the Trading Day of Year is between #10 and #91. The second indicator is bearish if the Copper/Gold Ratio indicator has been below 0.20 within the last year.
Specifically:
A = If today is between TDY #10 and TDY #91 for t-bond futures then A = -1 else A = 0
B = If the copper/gold ratio yesterday was below 0.20, then B = 252; If not, then if yesterday's value for B was > 0, then B = B -1 until B counts down to 0 OR another copper/gold ratio reading below 0.20 resets B to 252
C = If B > 0 then C = -1
D = A + C
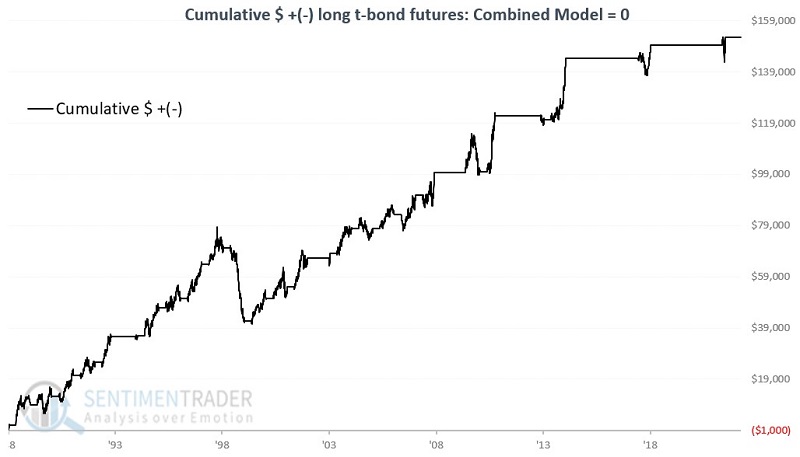
For any given day, Variable D can equal 0, -1, or -2. Let's look at t-bond performance based on daily readings. To review, to hold a value of 0 (which in this case is considered bullish), the trading day of the year must be less than ten or greater than 91, AND the copper/gold ratio must not have dropped below 0.20 during the last 252 trading days.
The chart below displays the cumulative $ +(-) from holding a long position in t-bond futures only on days when Variable D = 0.
The chart below displays the cumulative $ +(-) from holding a long position in t-bond futures only on days when Variable D < 0.
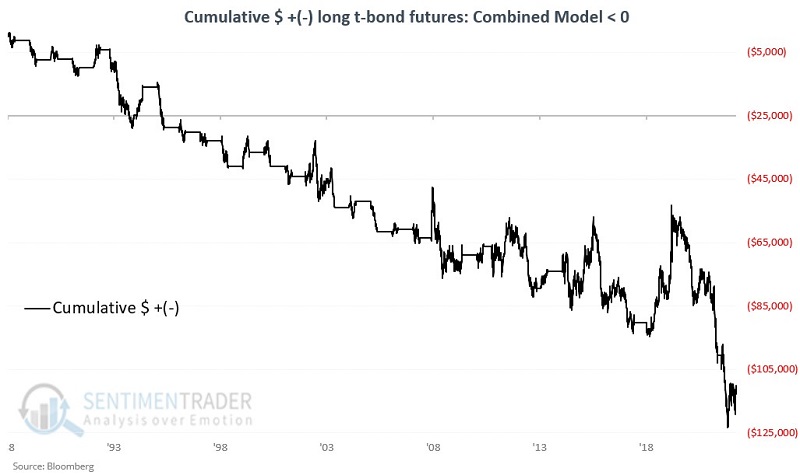
Since January 1989, cumulative results are as follows:
- Variable D = 0 +$152,466
- Variable D < 0 (-$112,778)
What the research tells us…
At the moment, we are between Trading Day of Year #10 and Trading Day of Year #91, so Variable A = -1 and will remain that way through the close on 2023-05-09, at which point it will revert to 0. The copper/gold ratio fell to 0.1983 on 2023-03-17, so Variable C will remain at -1 for 252 days from that date. As a result, the Combined Model = -2. Does that mean that t-bonds are doomed to continue falling for another year? Not at all. But based on the results above, this somewhat crude model remains firmly on the unfavorable side of the fence for t-bonds.
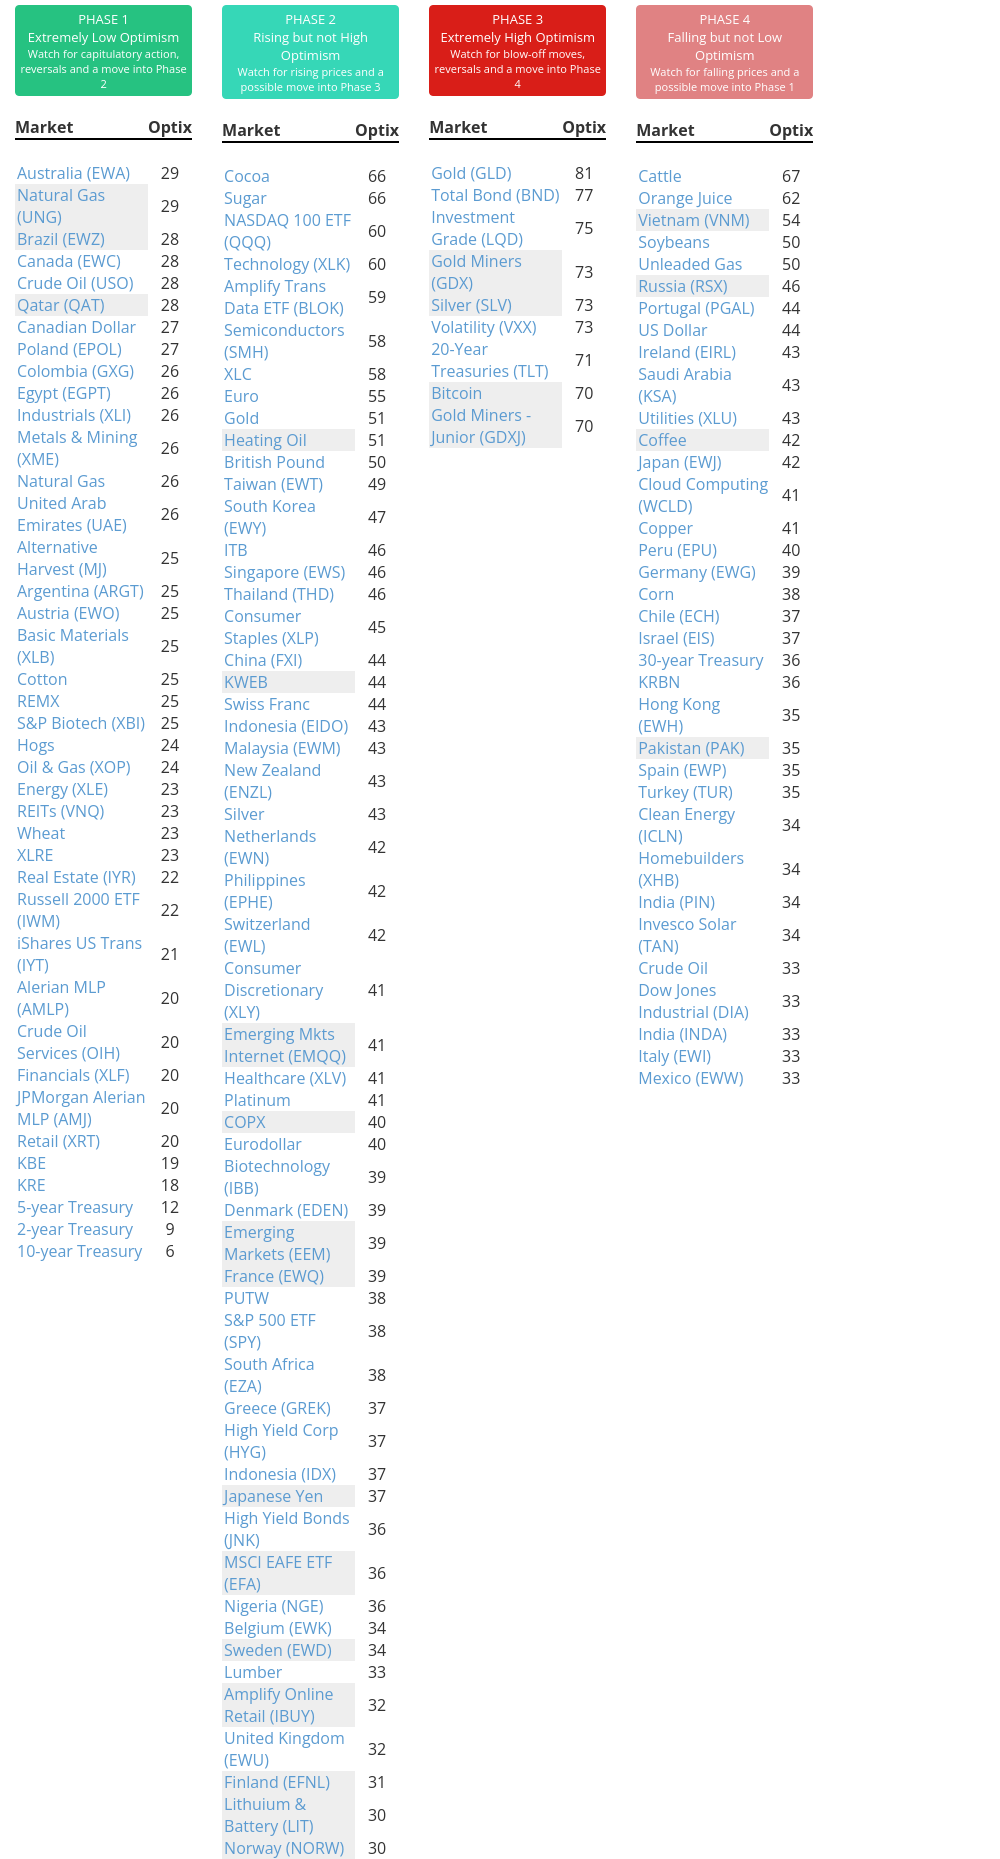
Indicators at Extremes
Phase Table
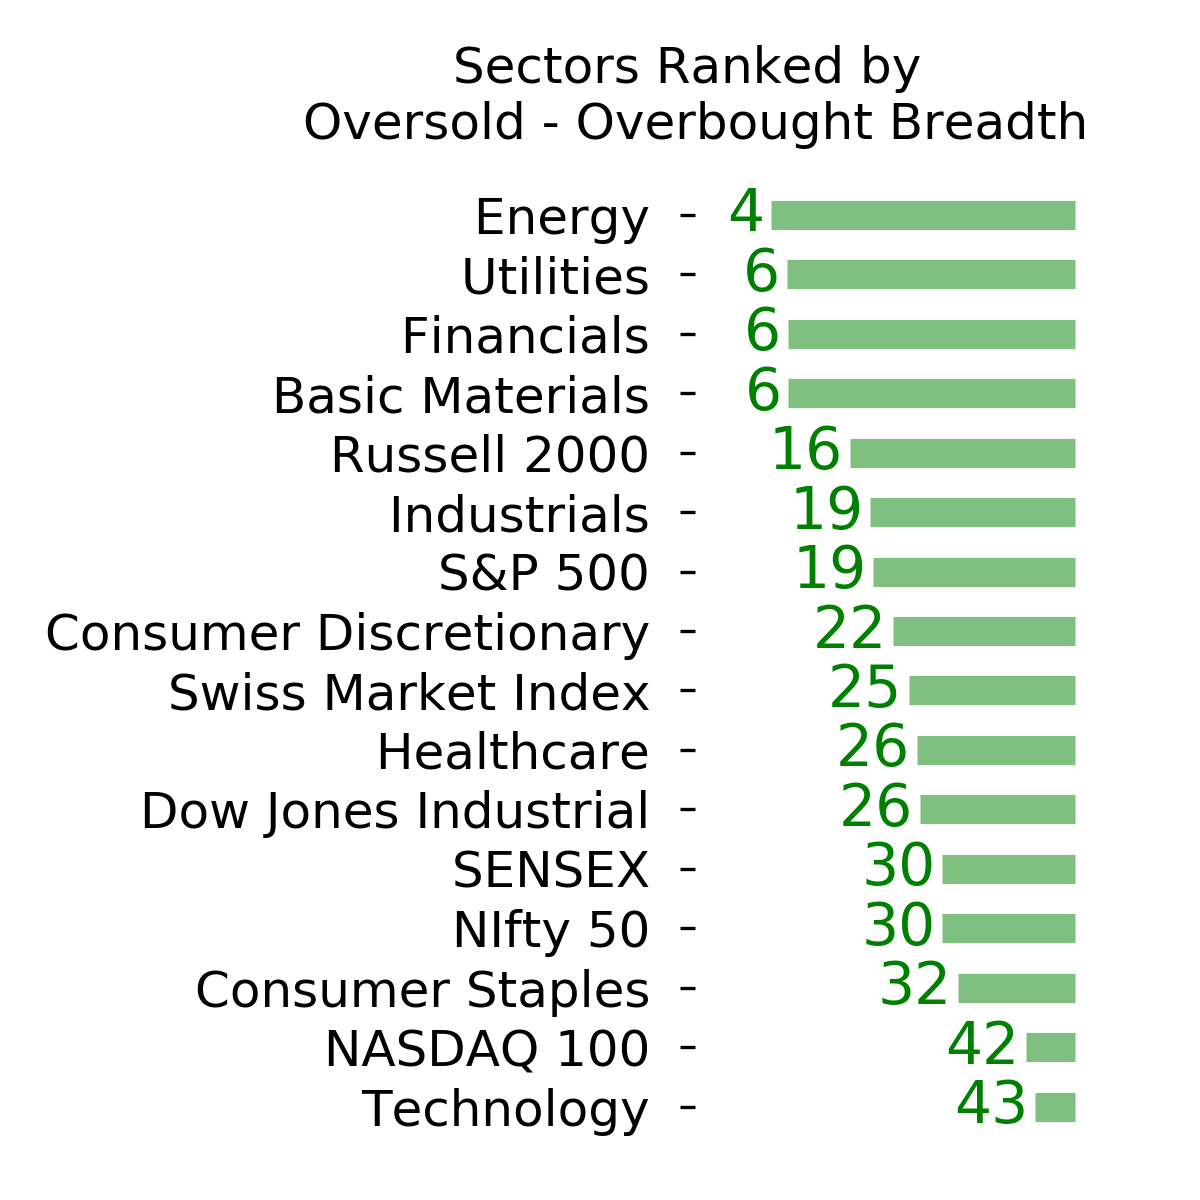
Ranks
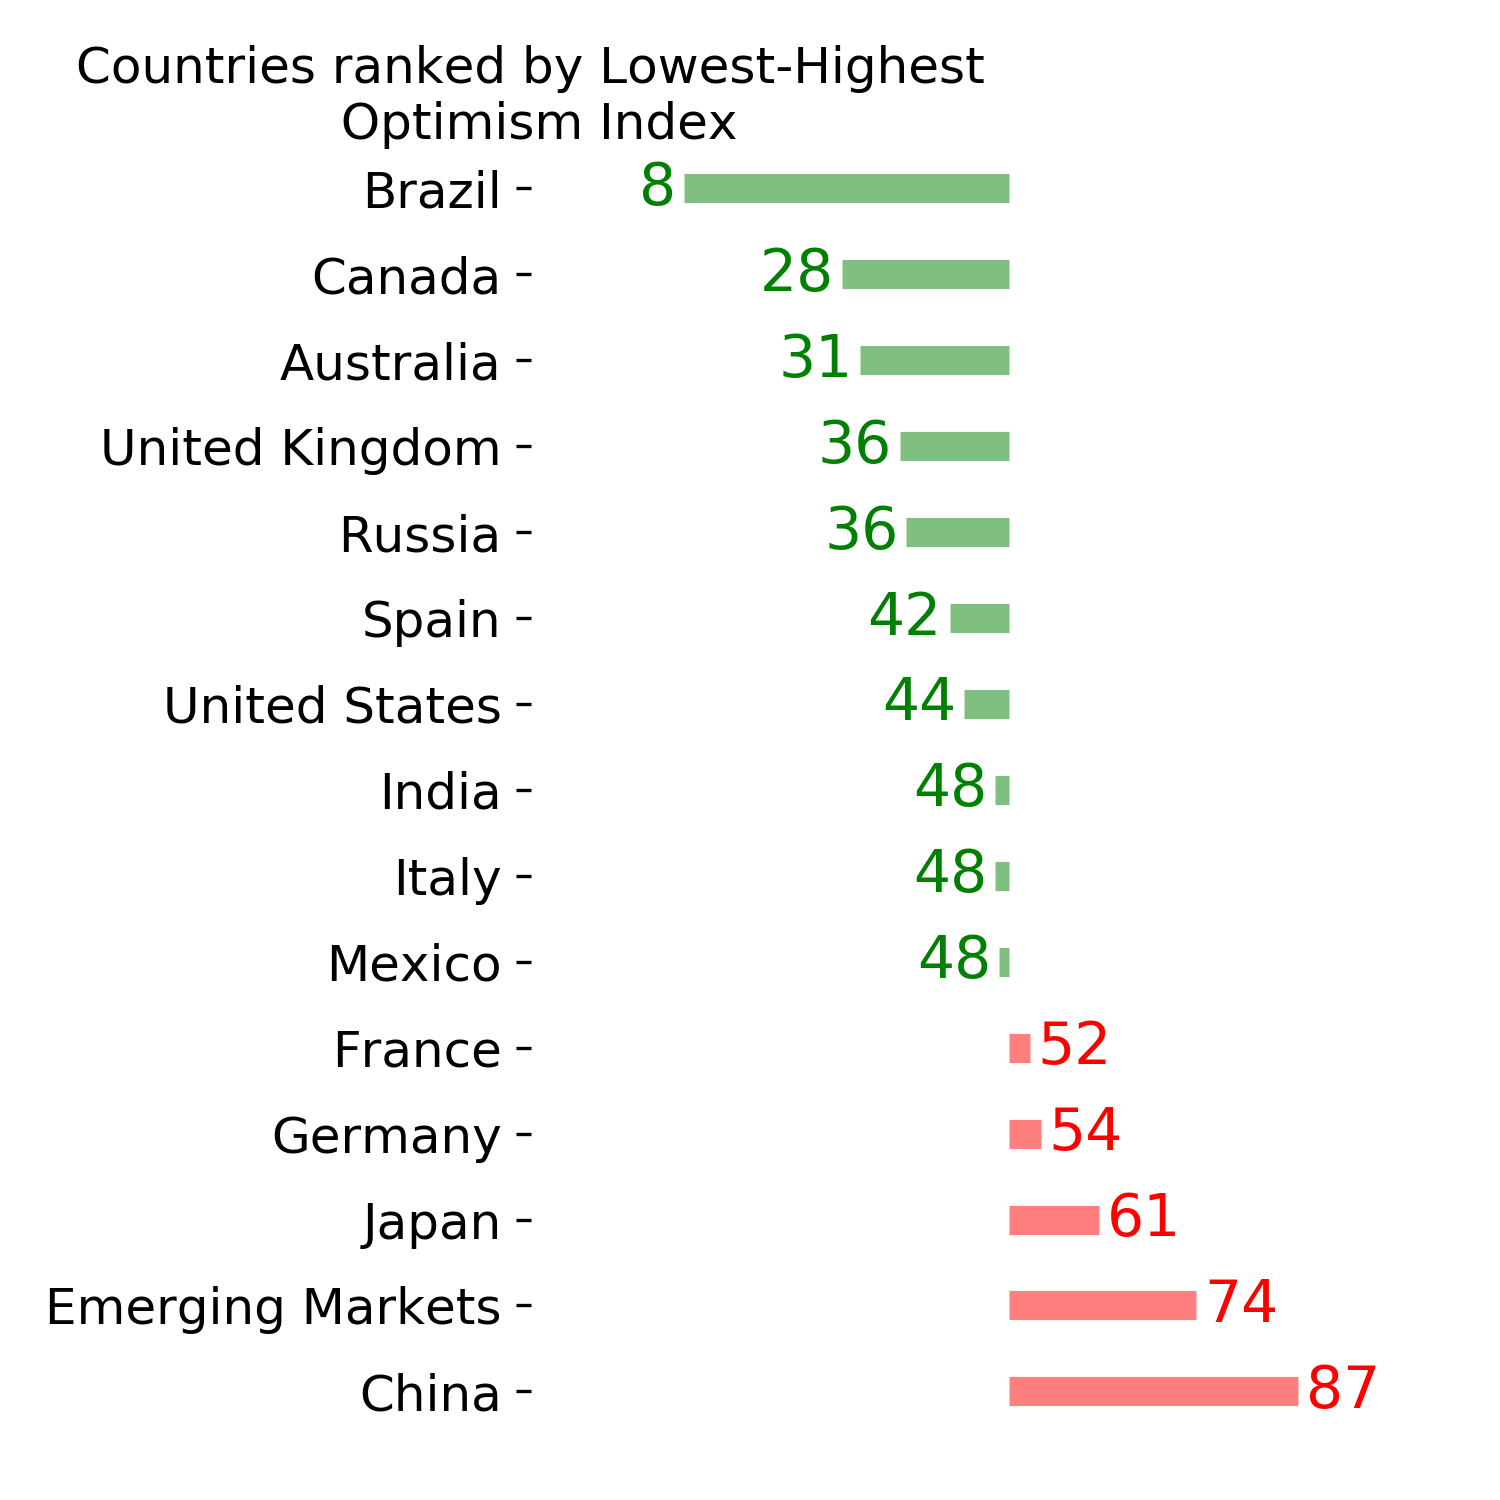
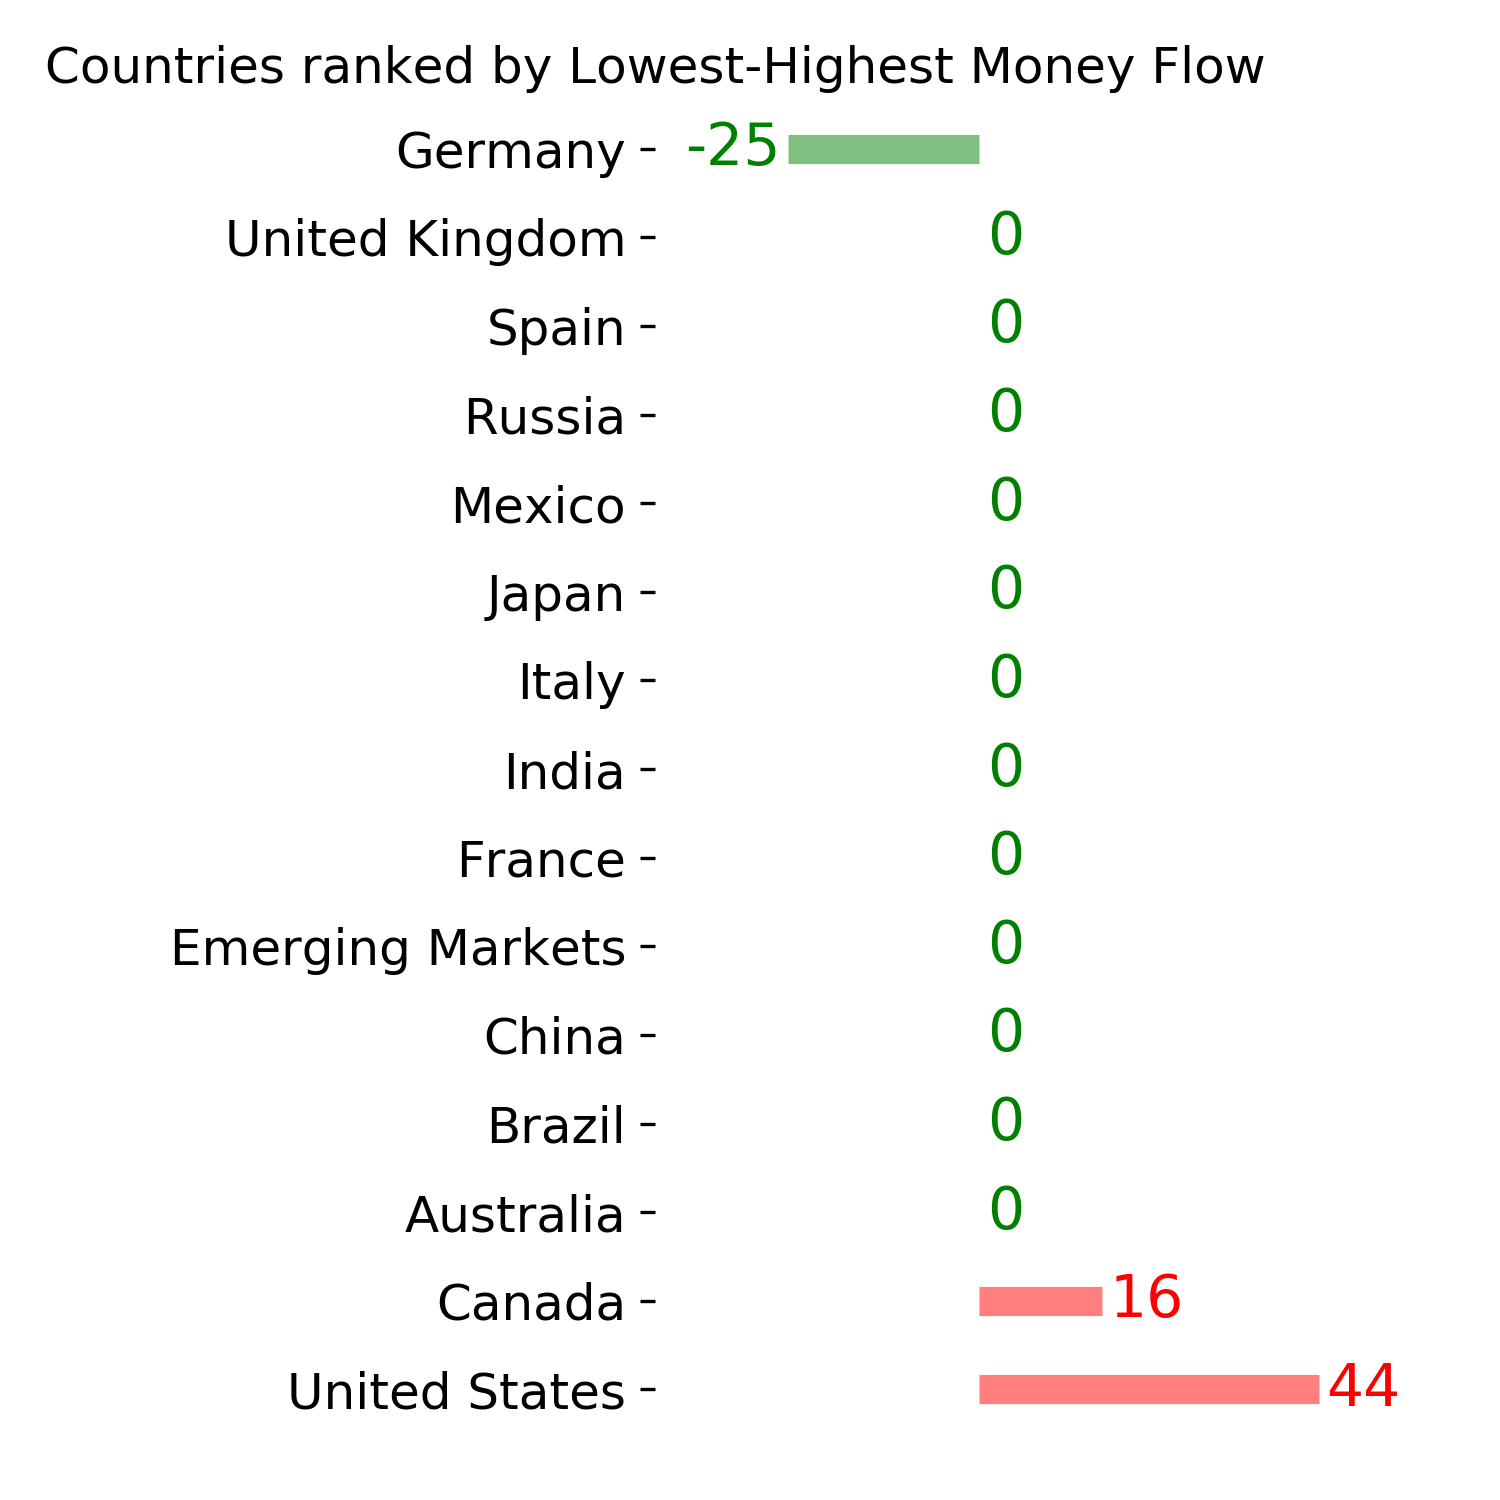
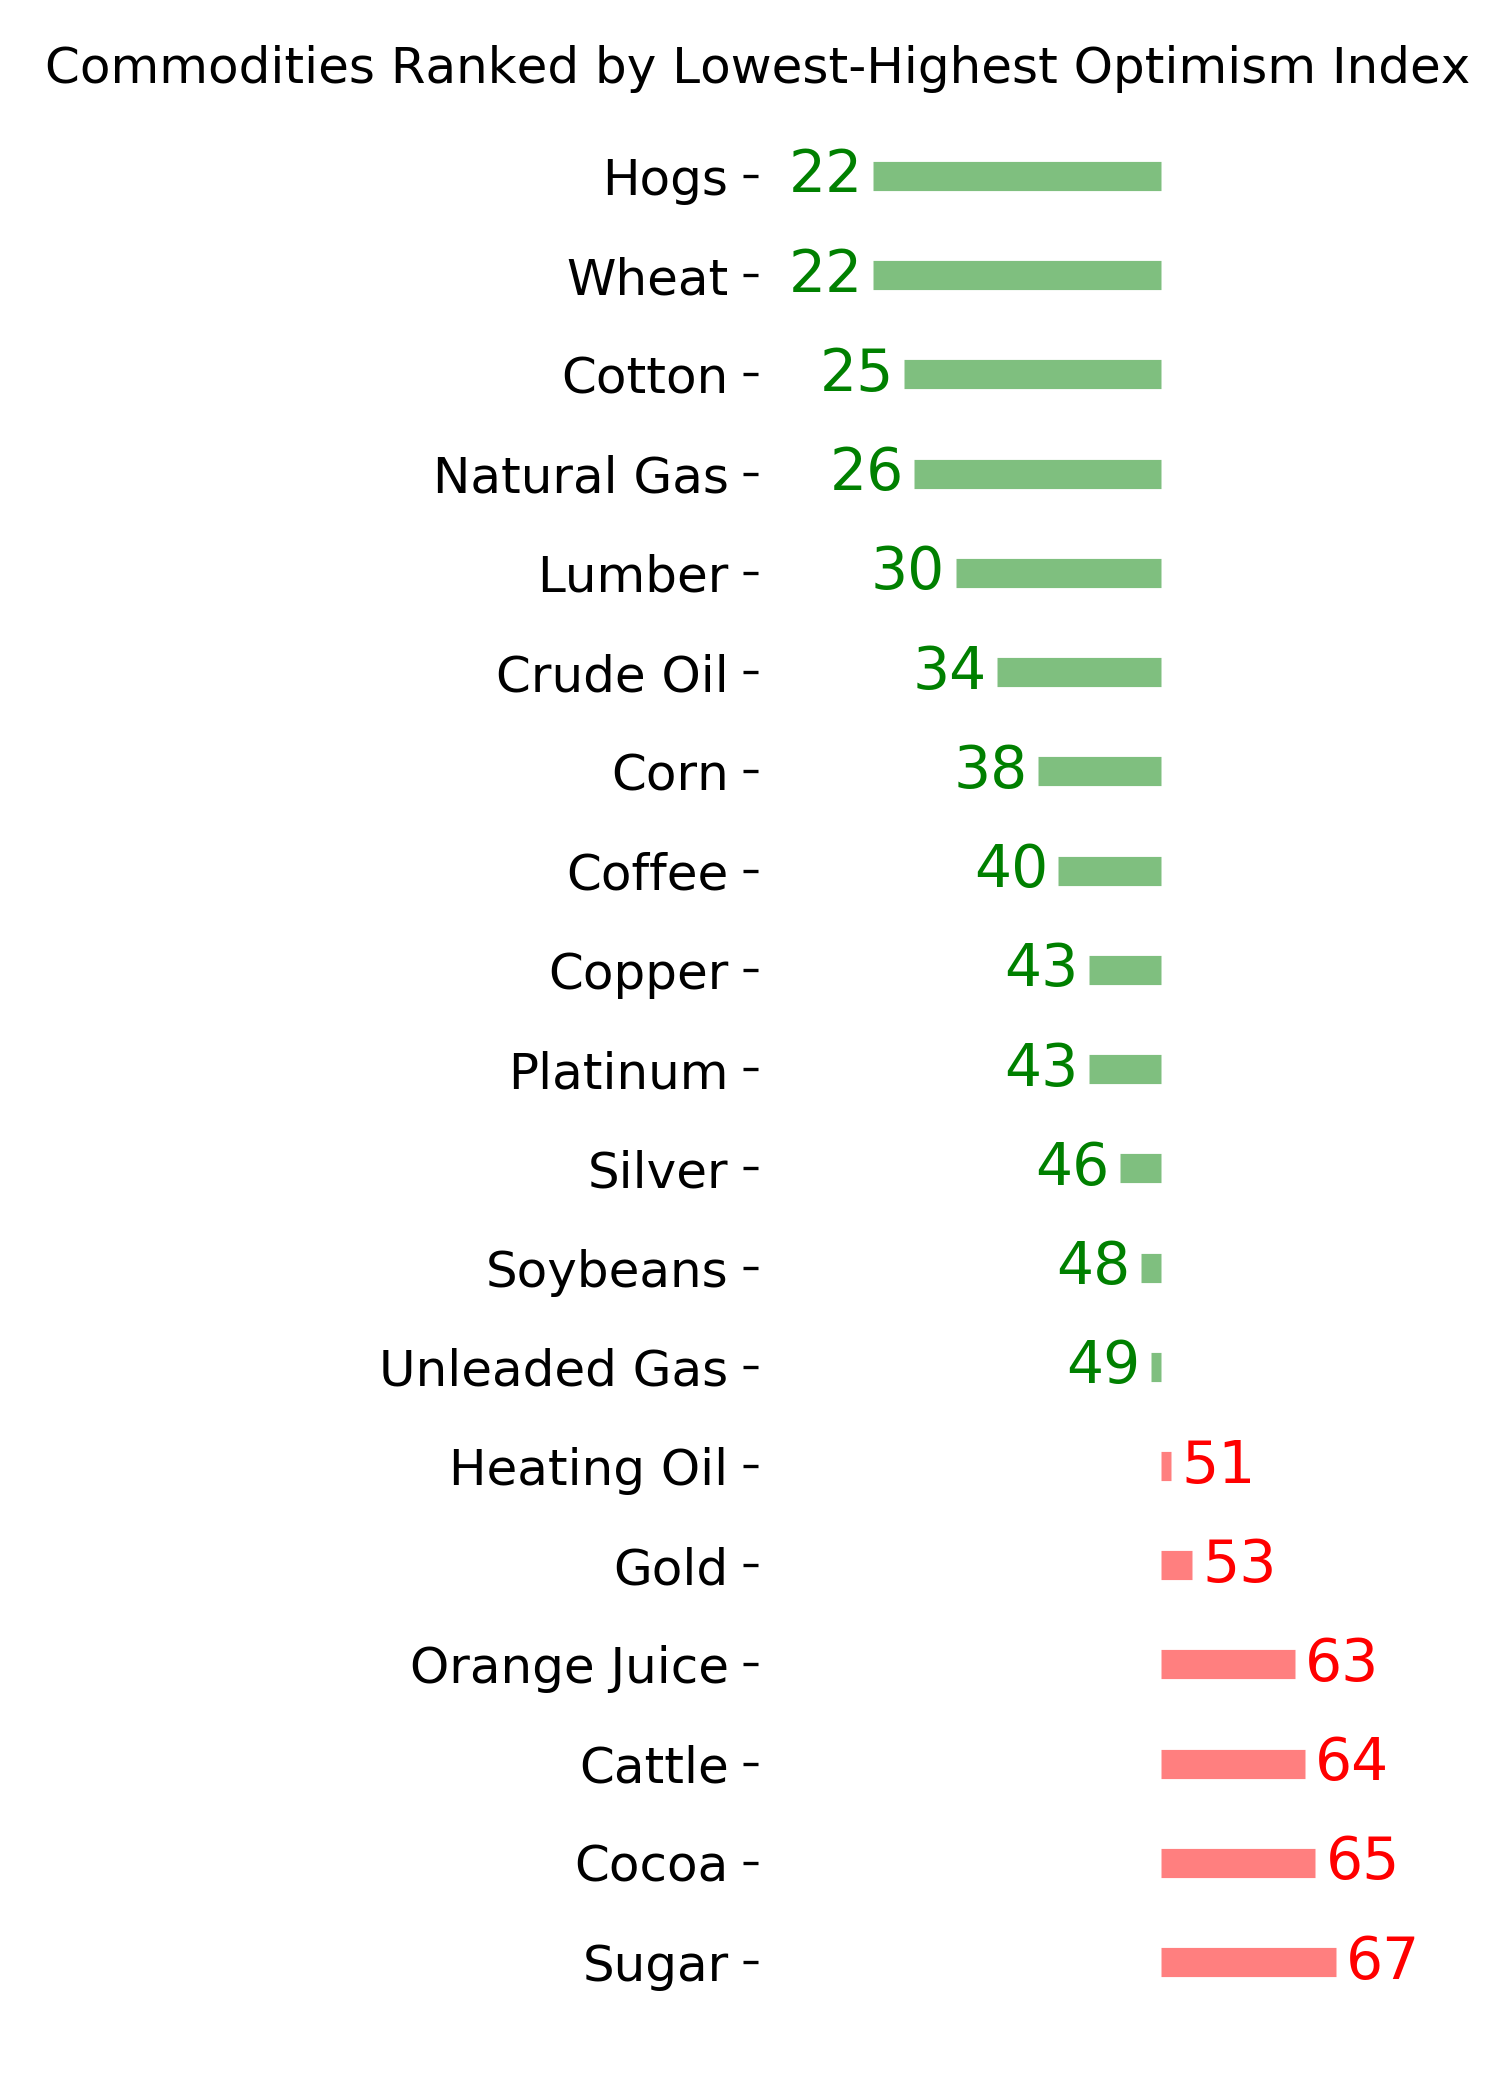
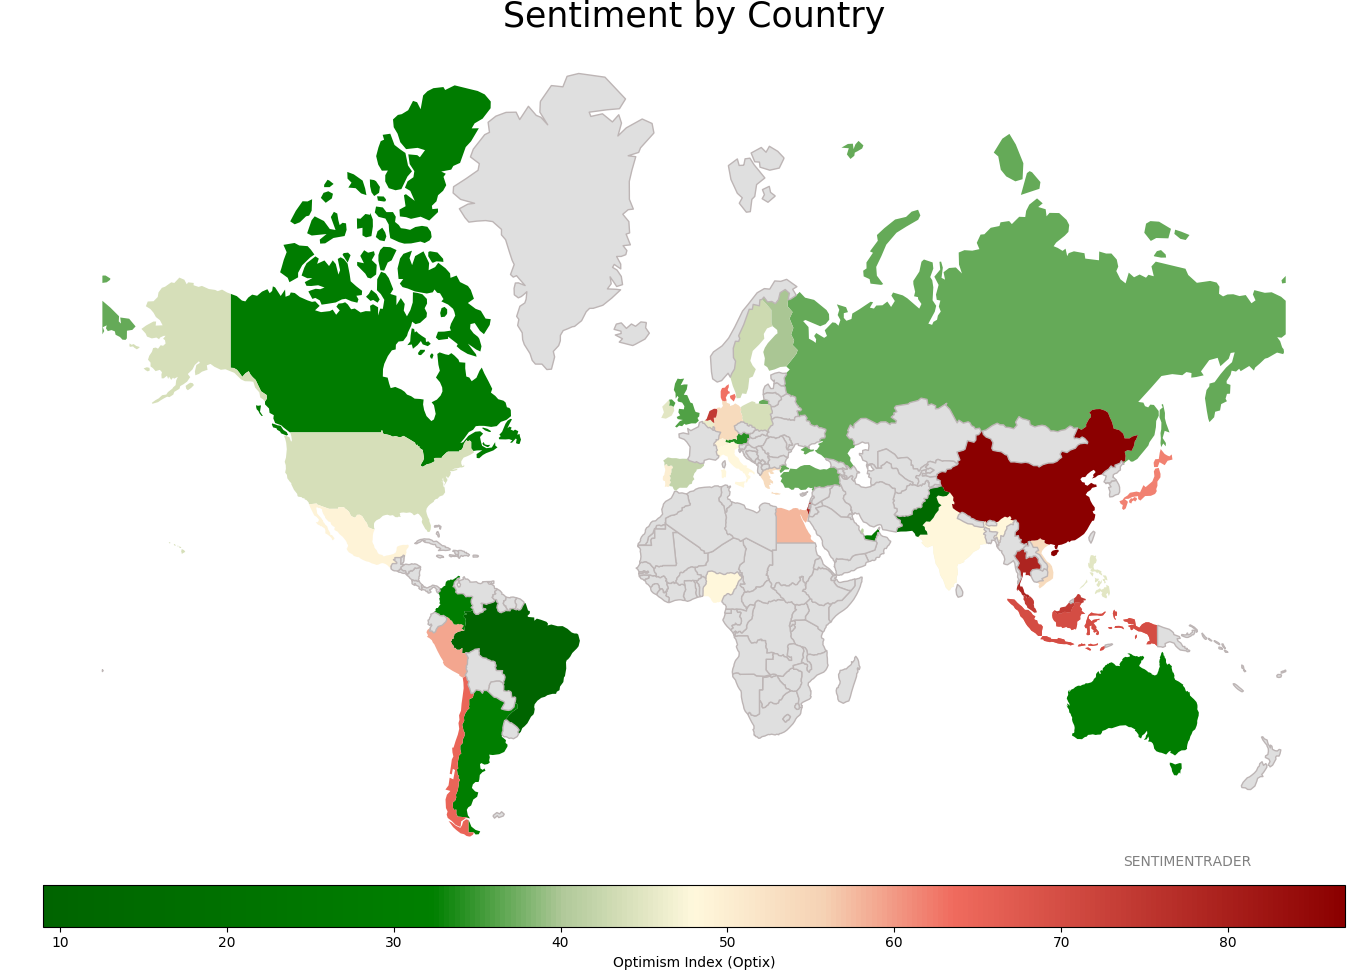
Sentiment Around The World
Optimism Index Thumbnails
|
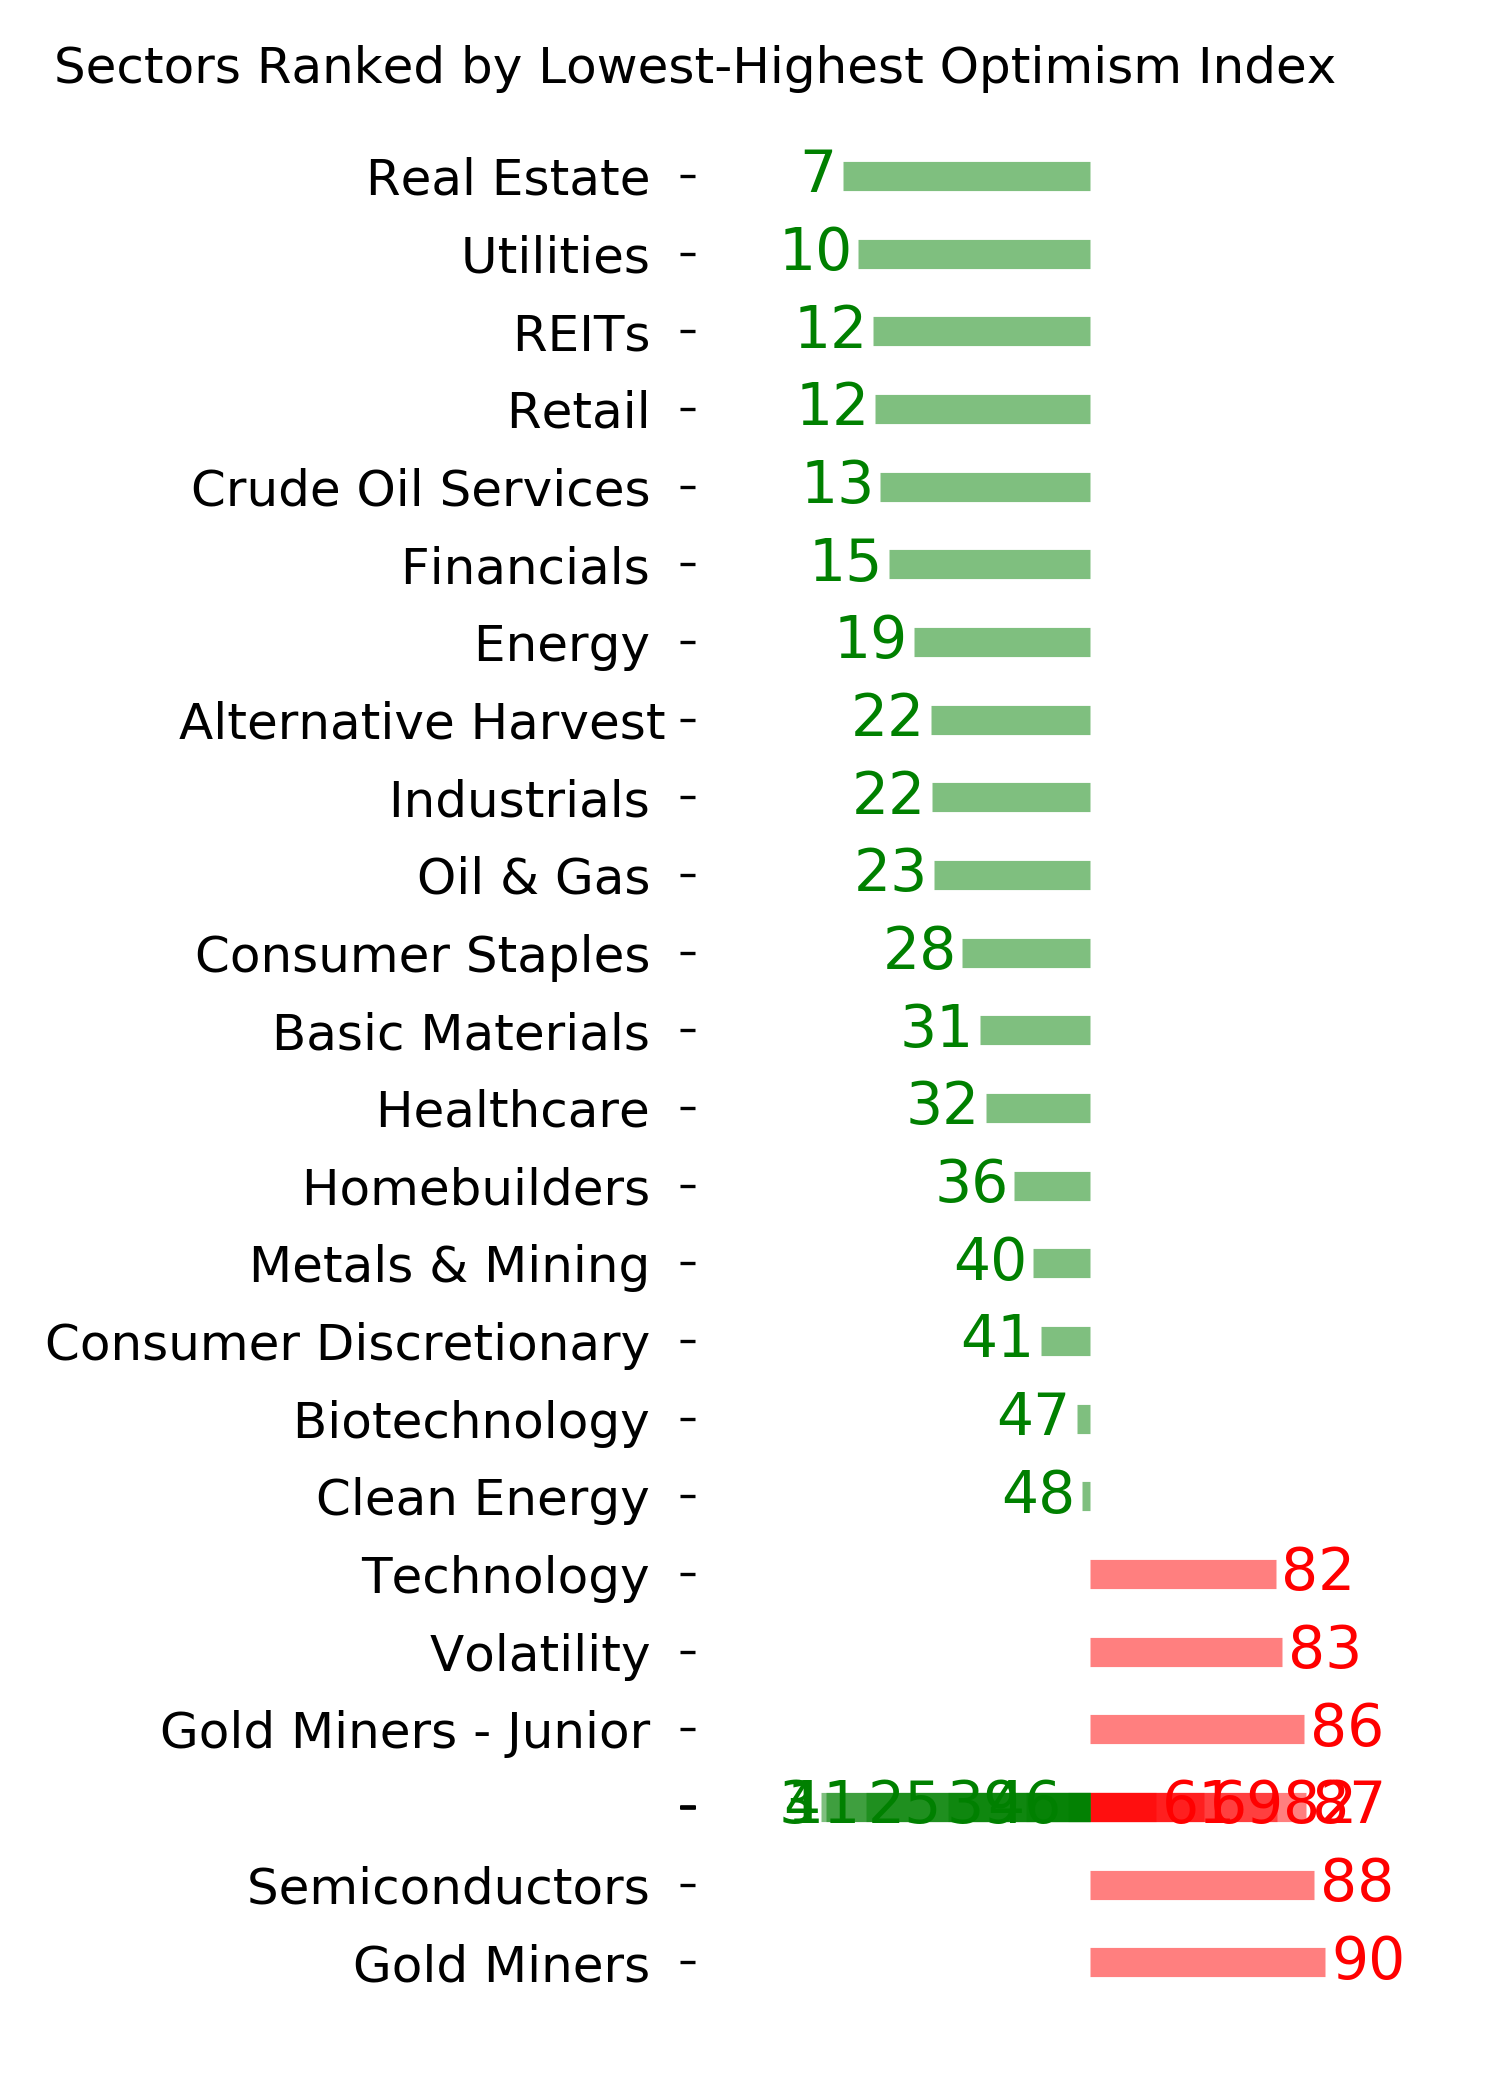
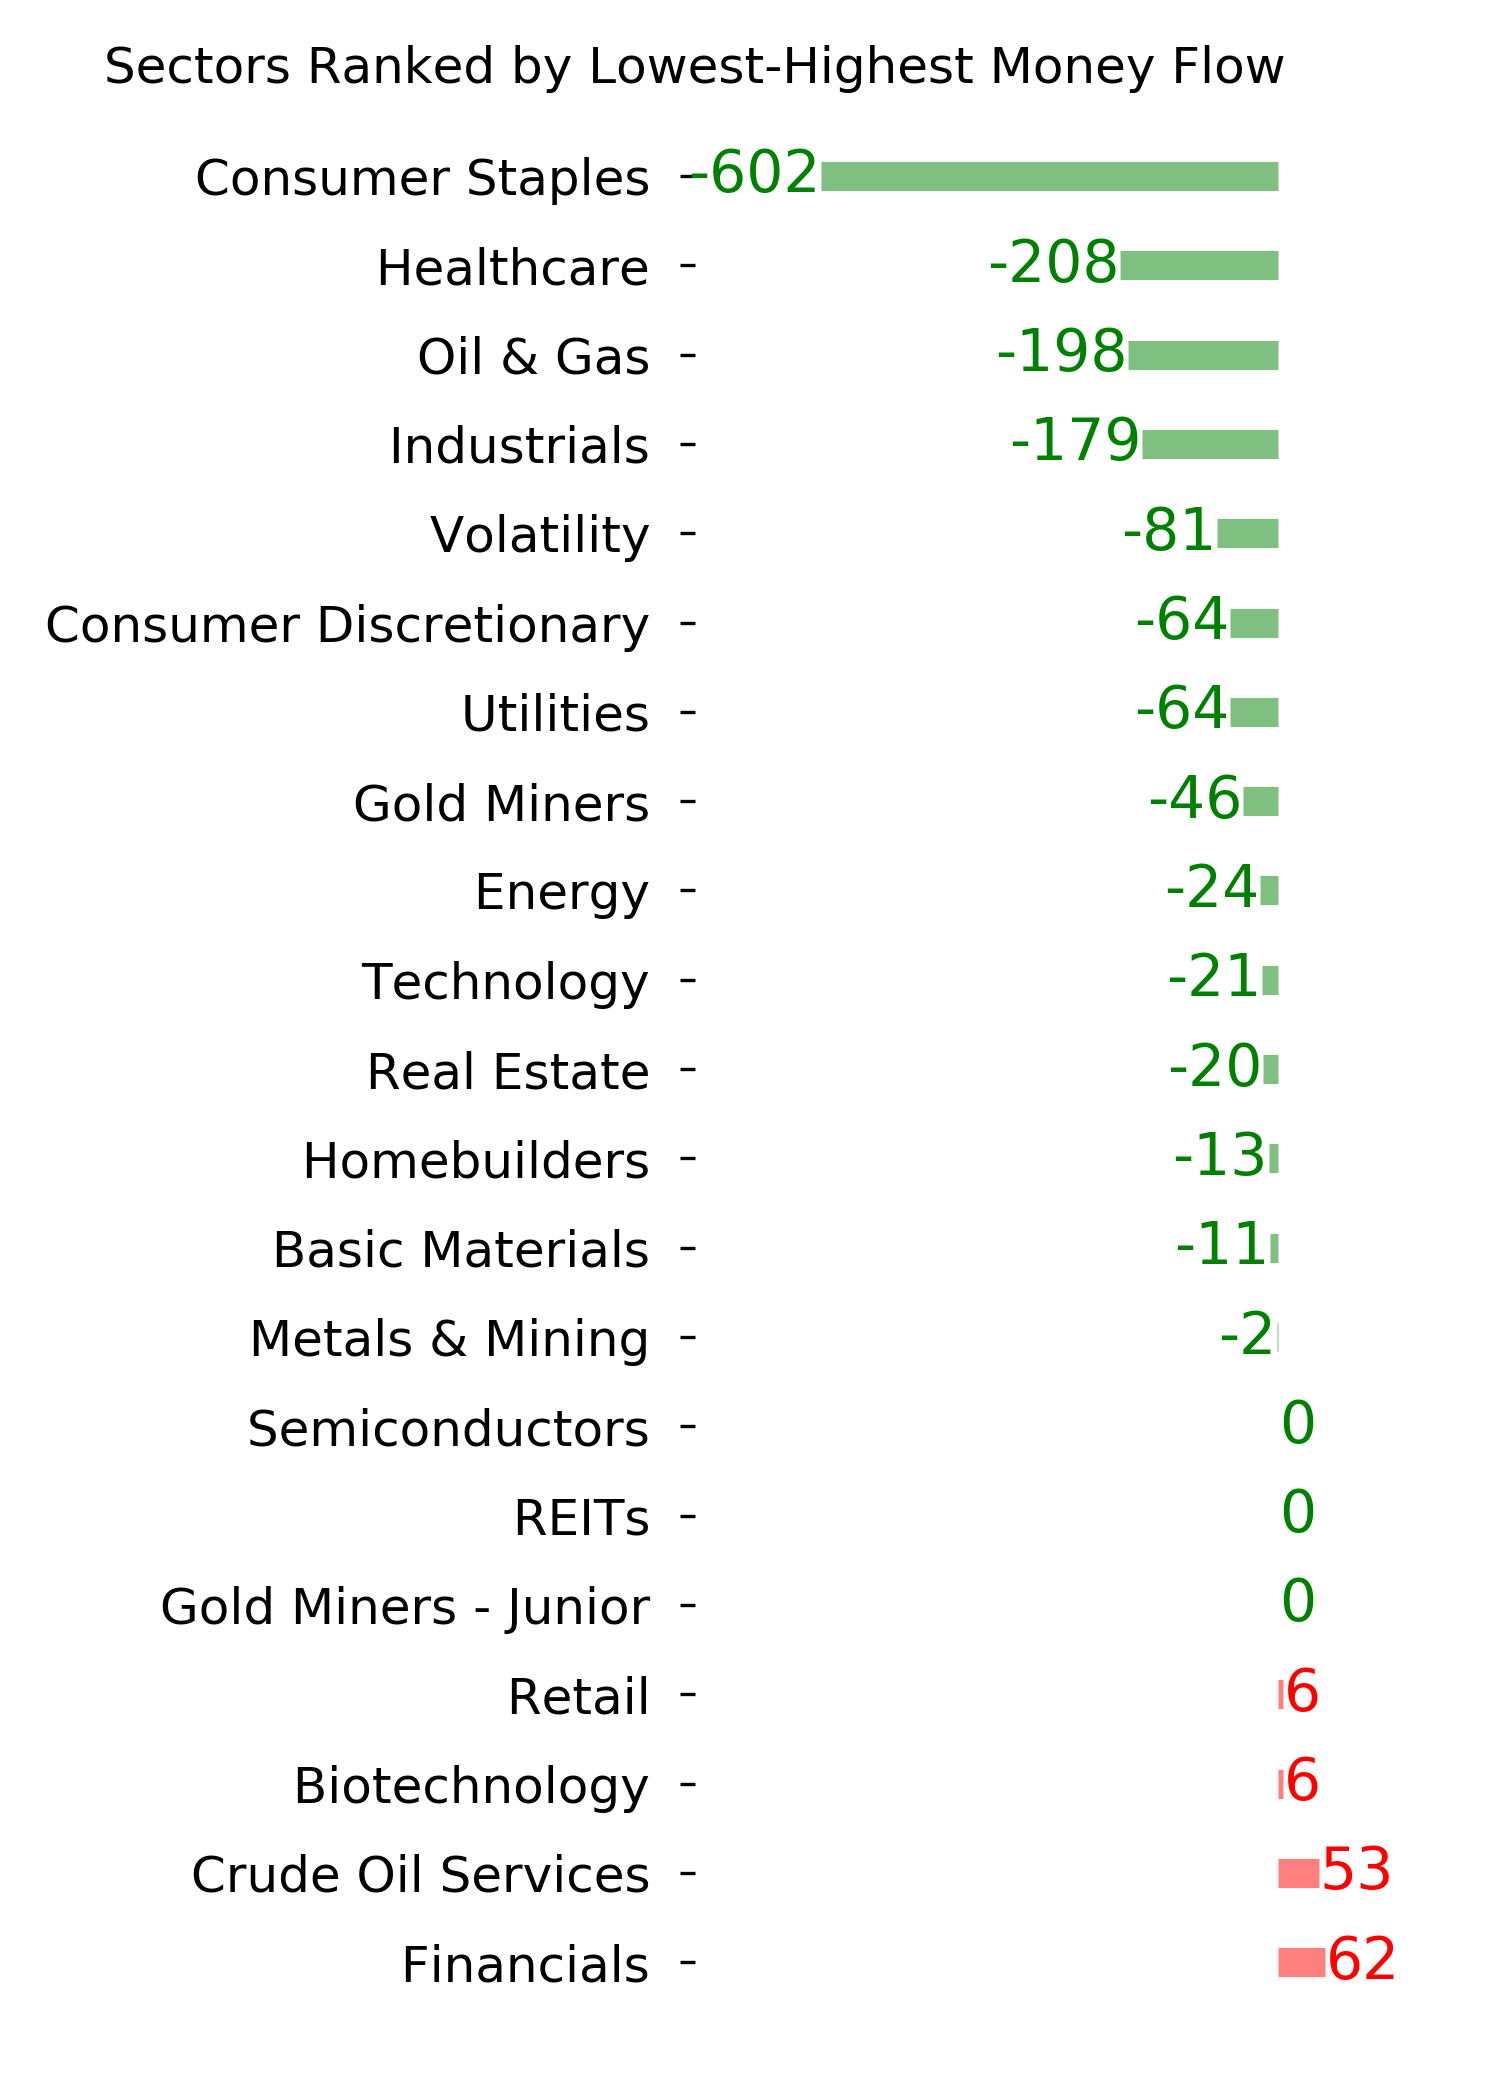
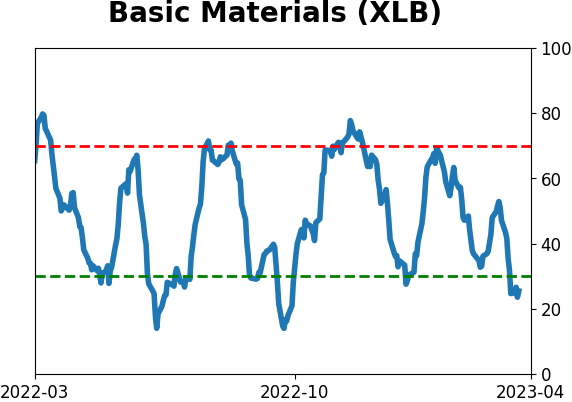
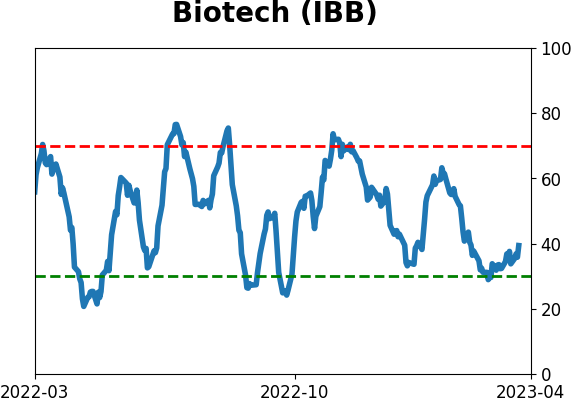
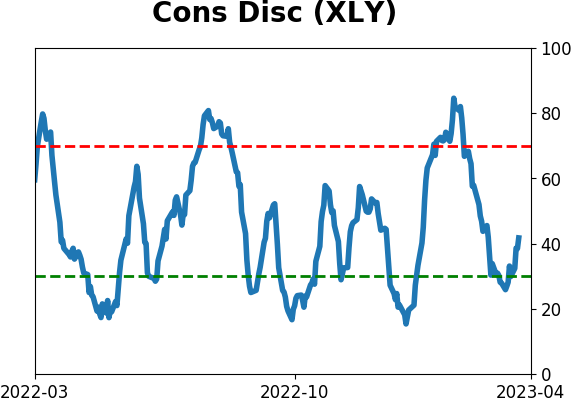
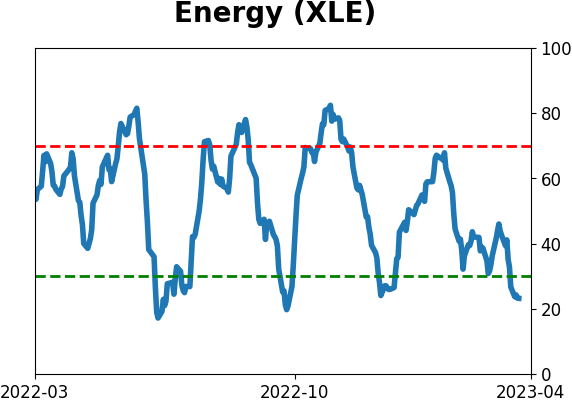
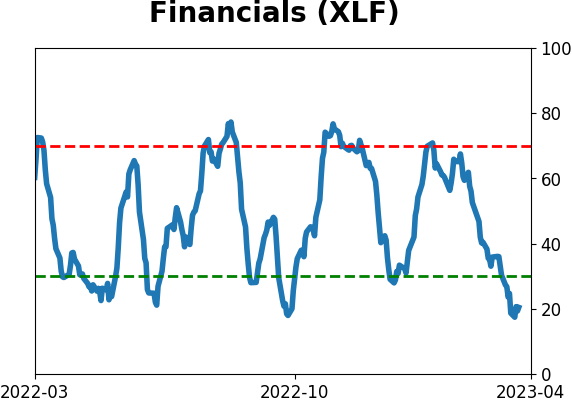
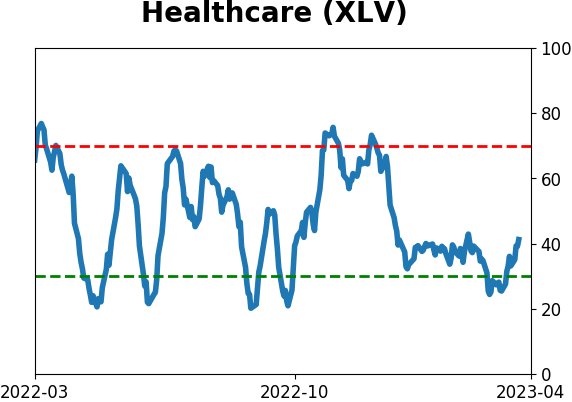
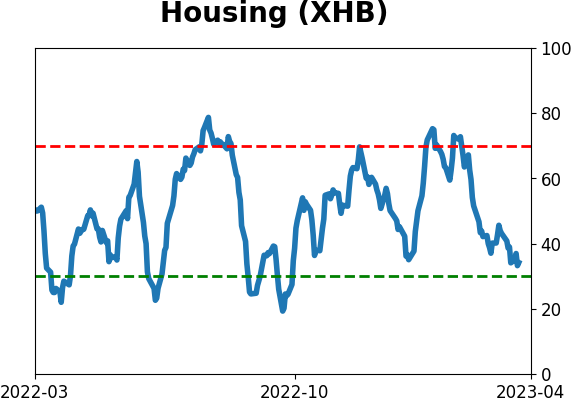
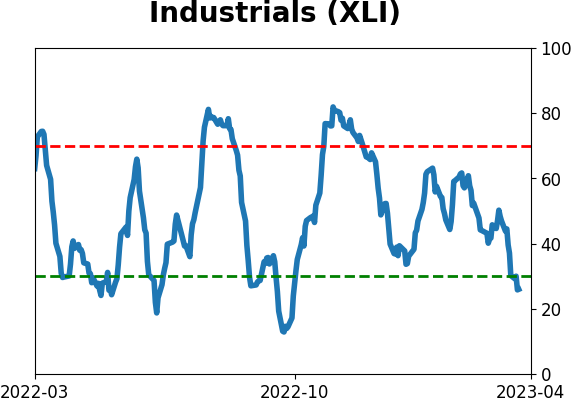
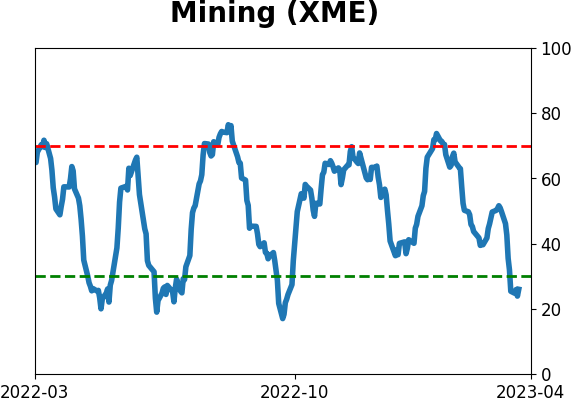
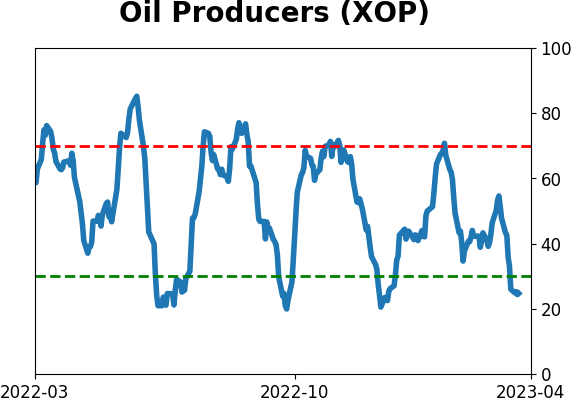
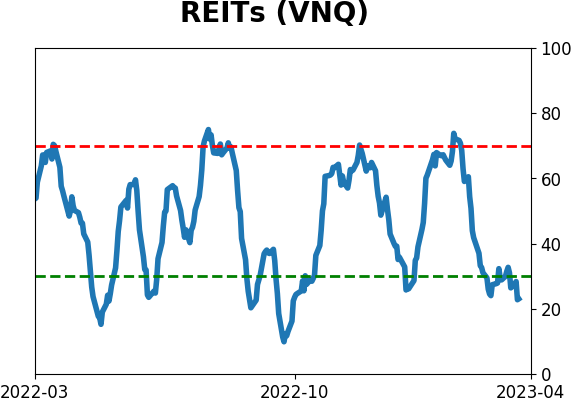
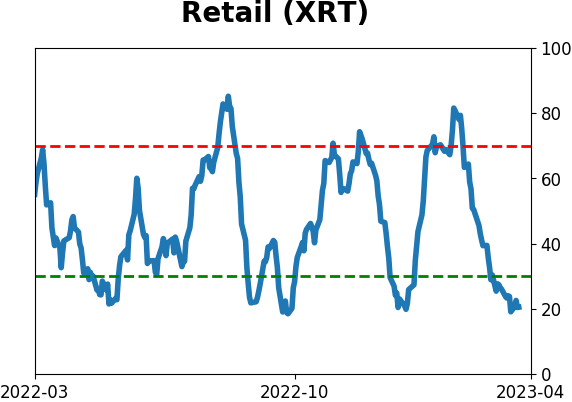
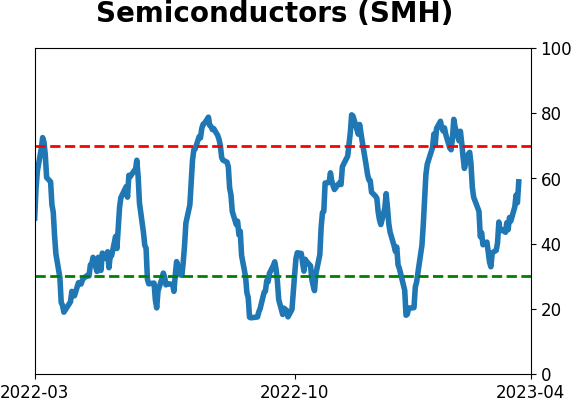
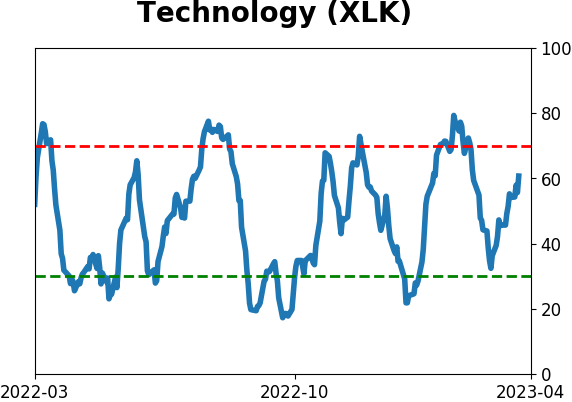
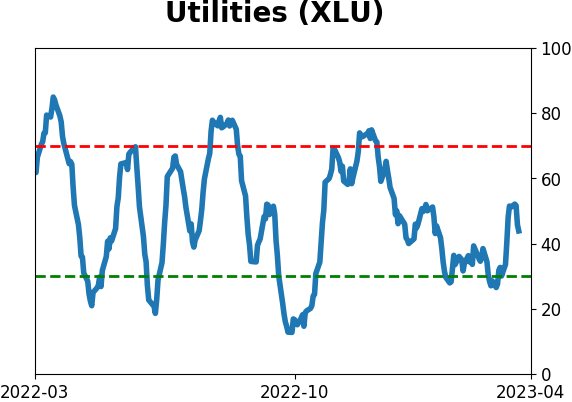
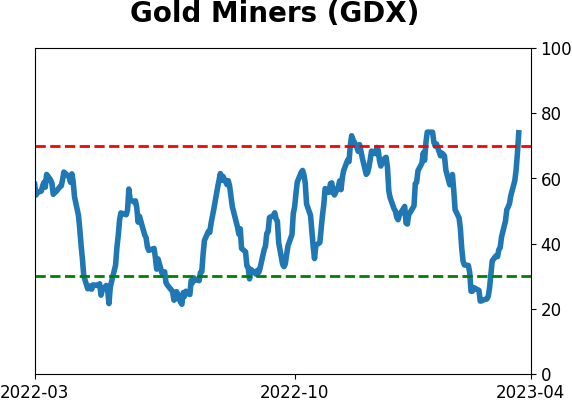
Sector ETF's - 10-Day Moving Average
|
|
|
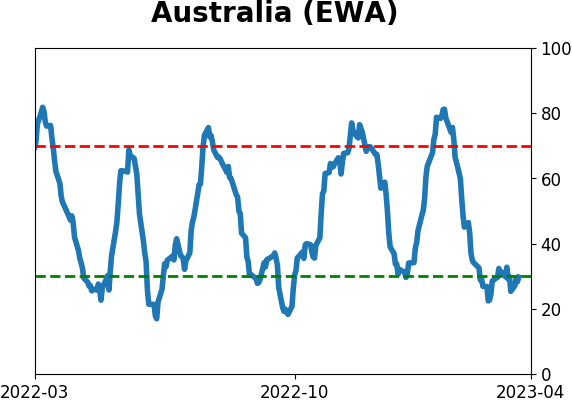
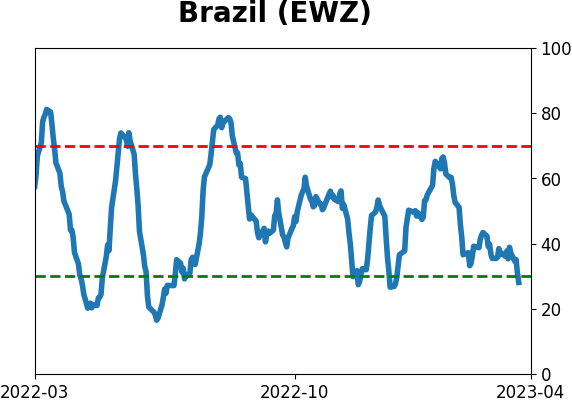
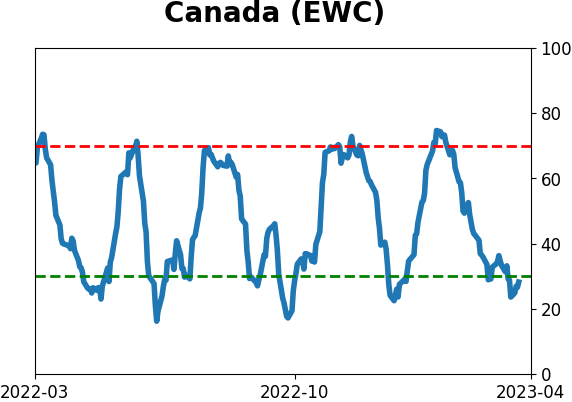
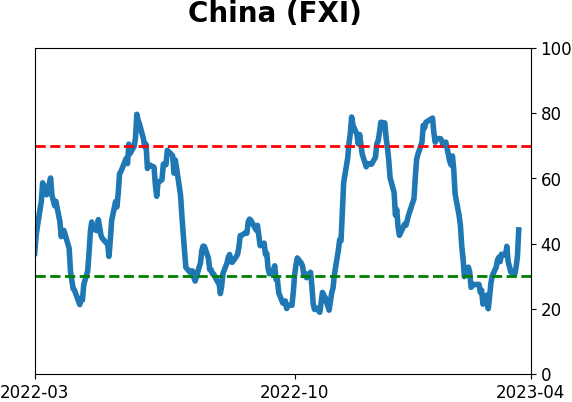
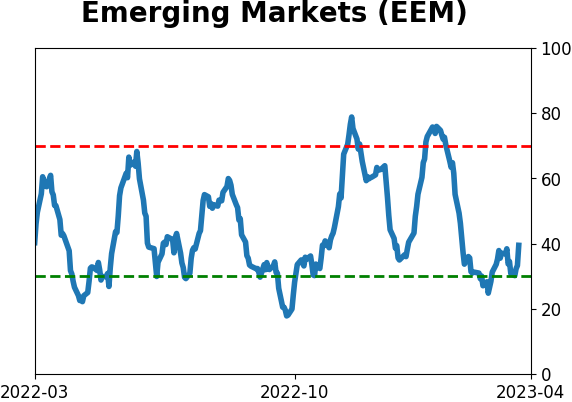
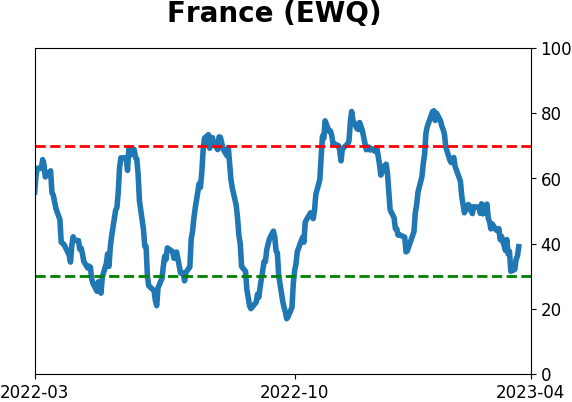
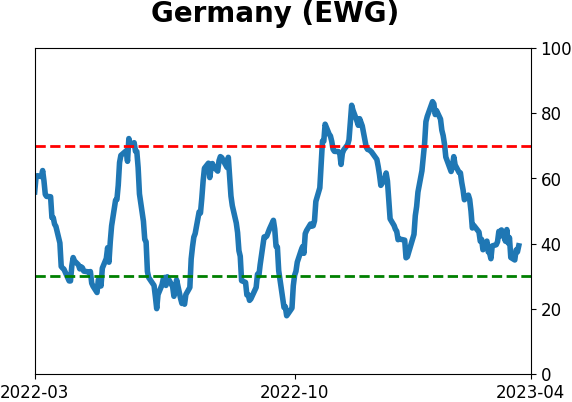
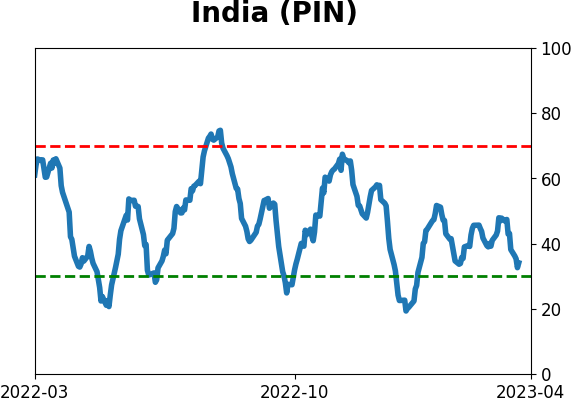
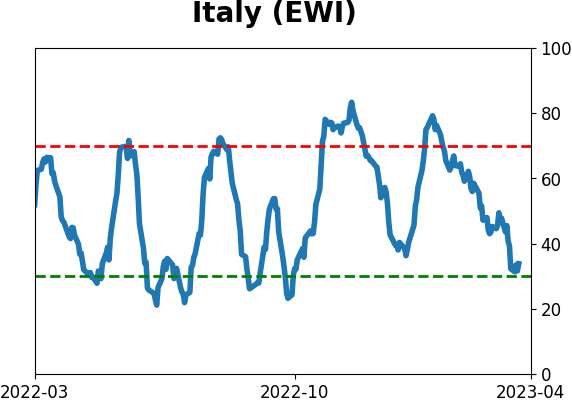
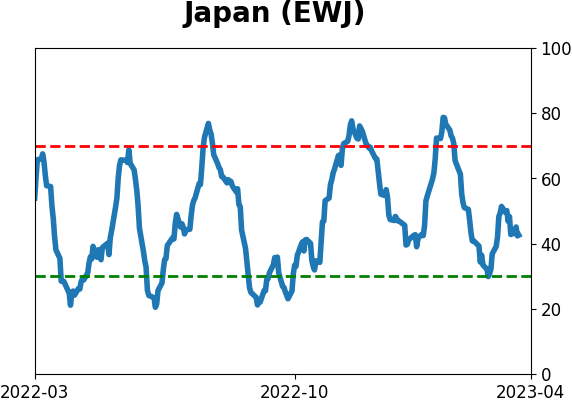
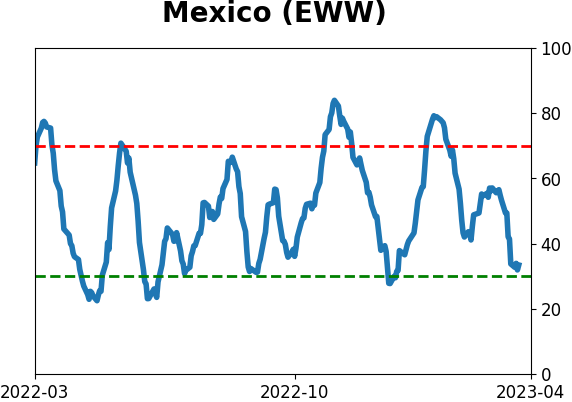
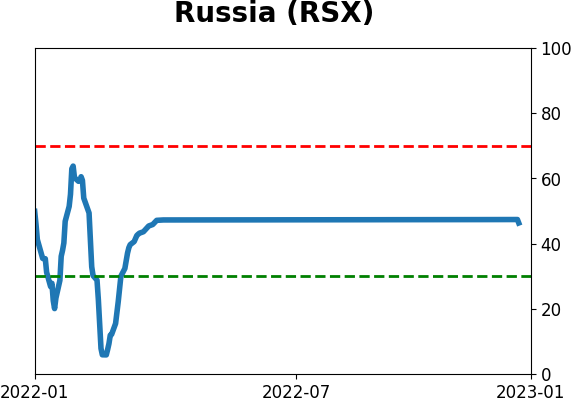
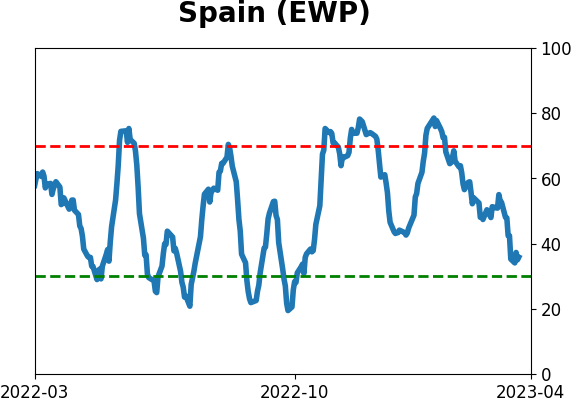
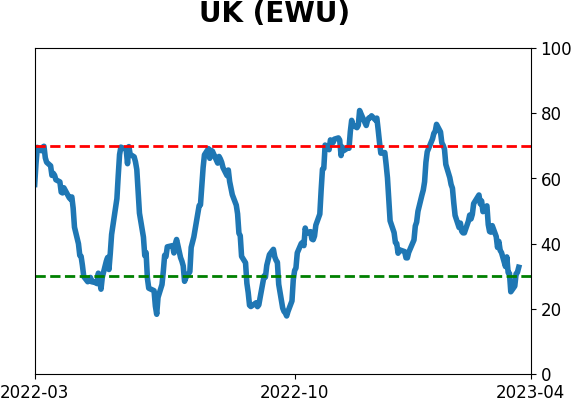
Country ETF's - 10-Day Moving Average
|
|
|
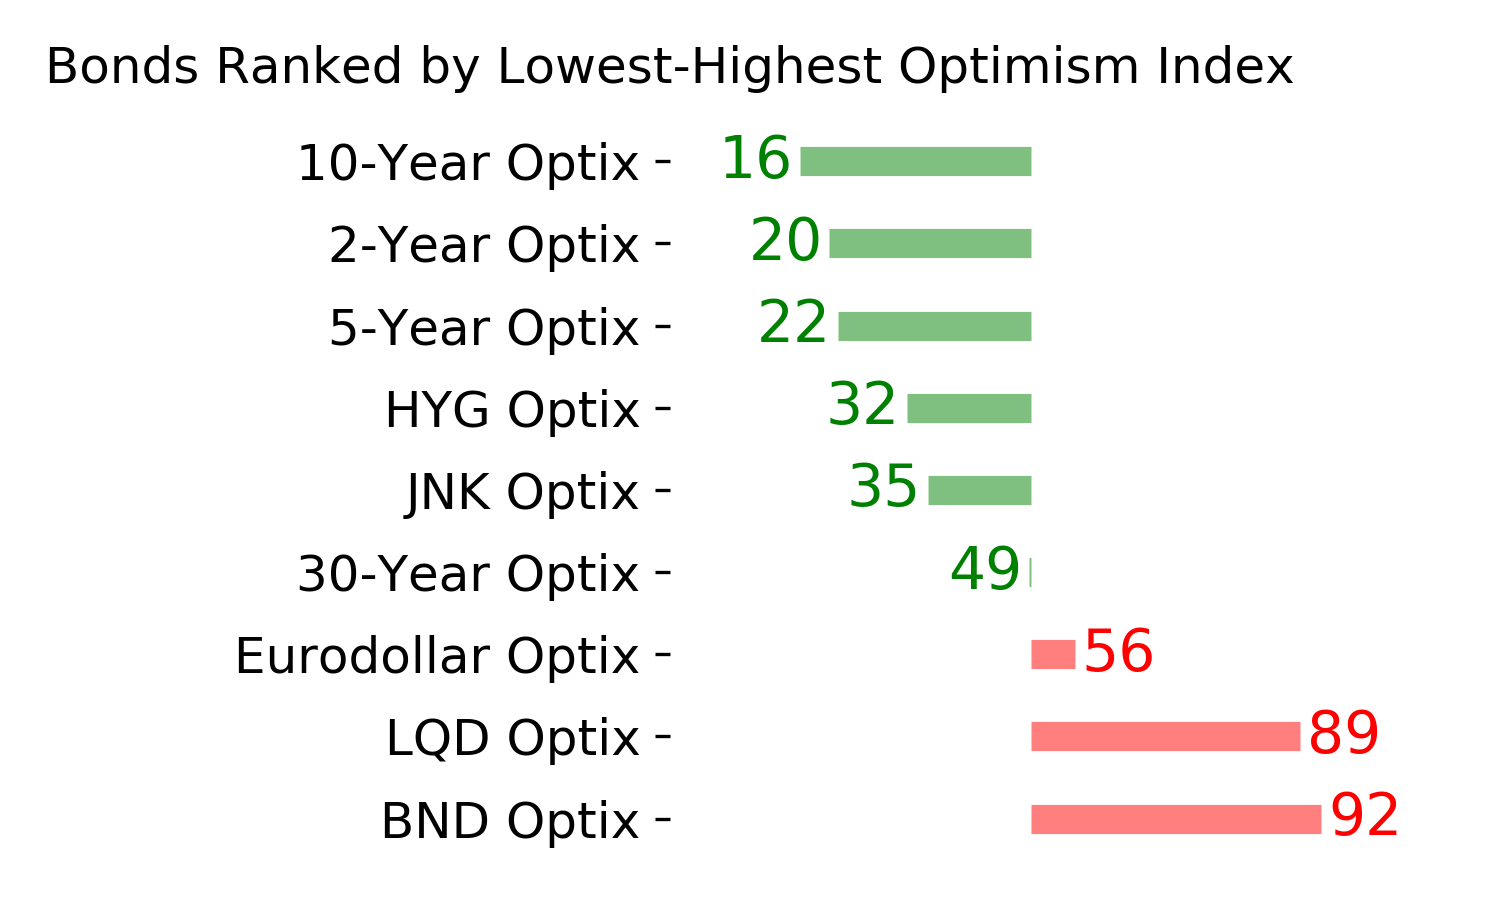
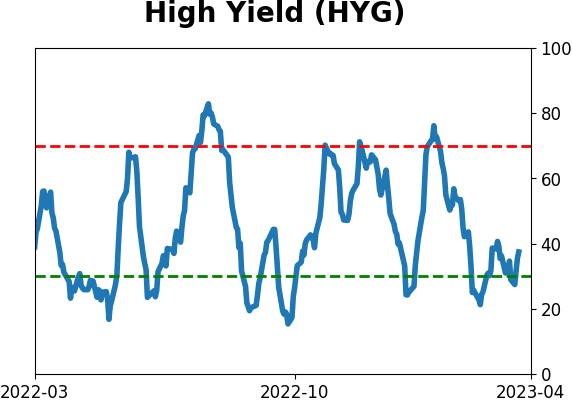
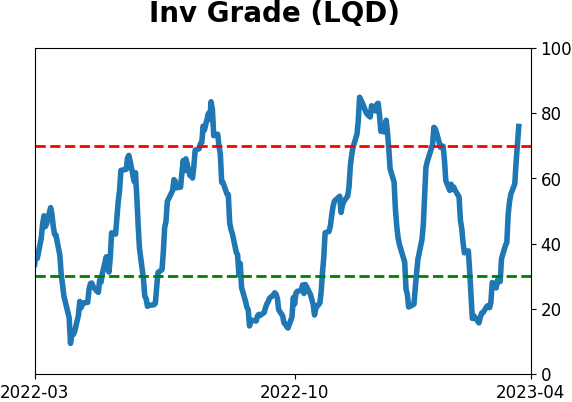
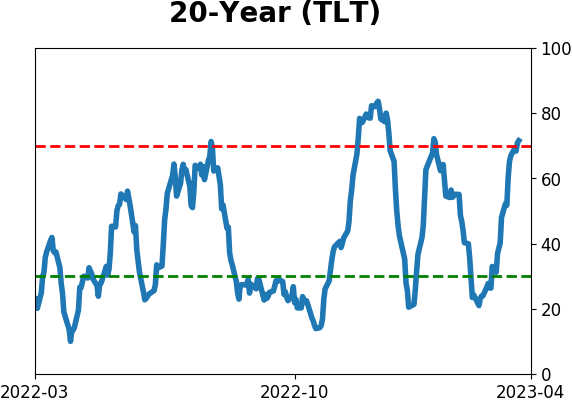
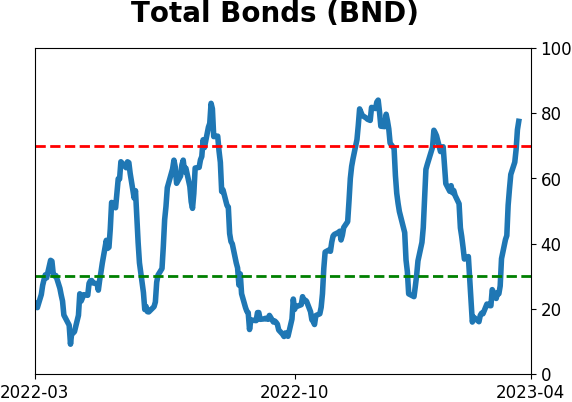
Bond ETF's - 10-Day Moving Average
|
|
|
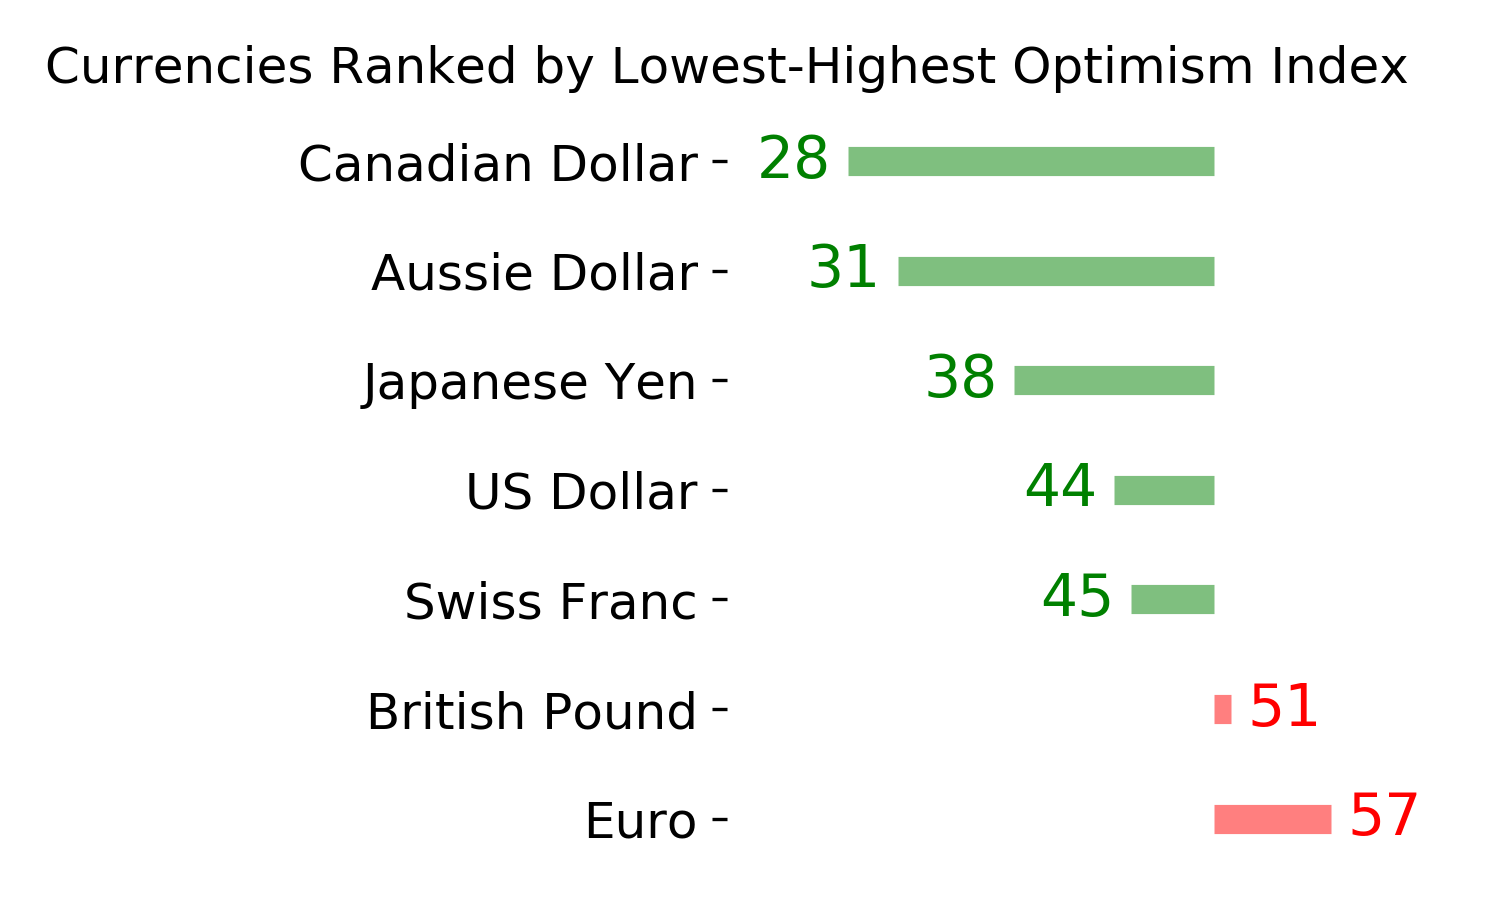
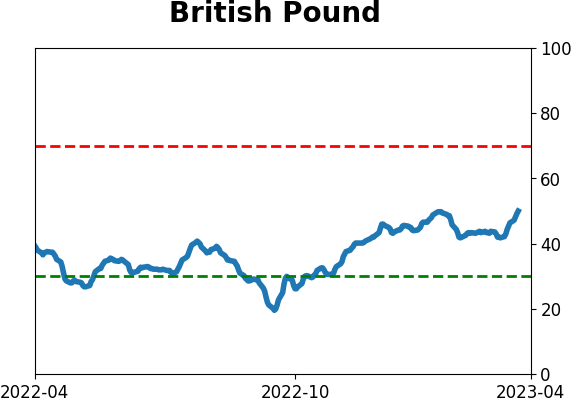
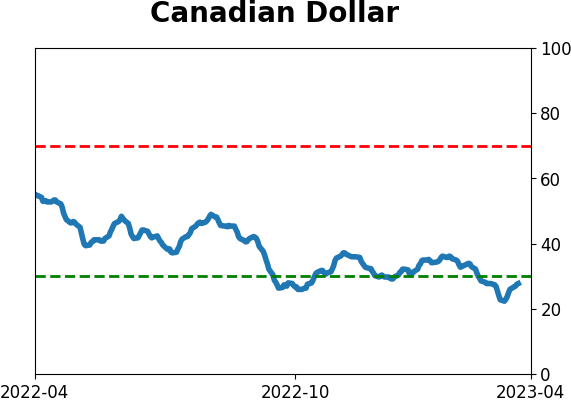
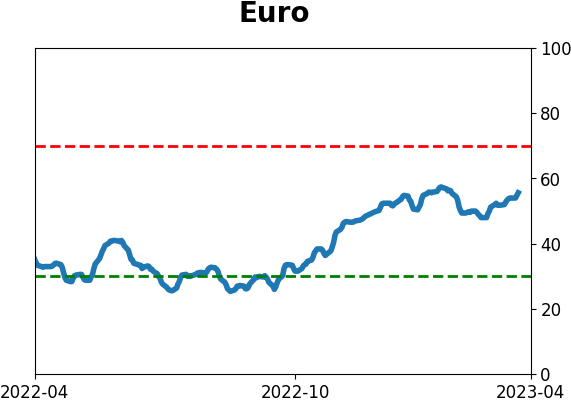
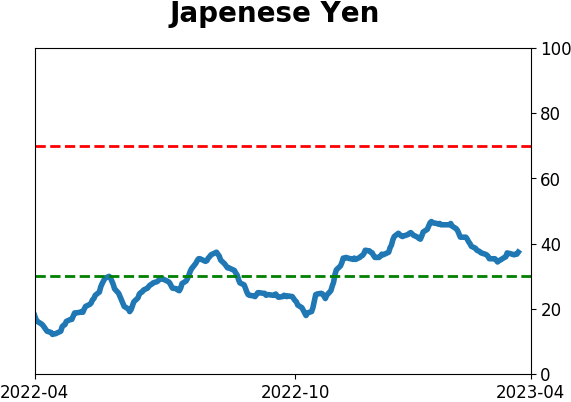
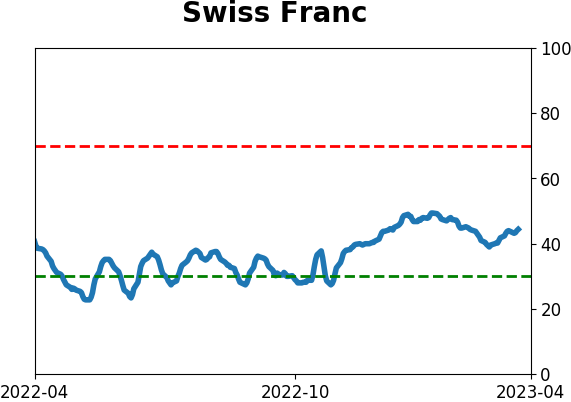
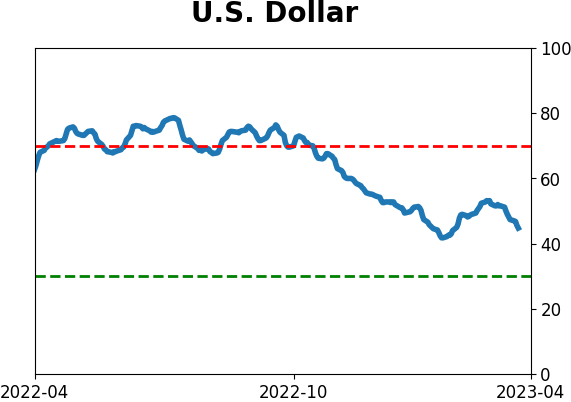
Currency ETF's - 5-Day Moving Average
|
|
|
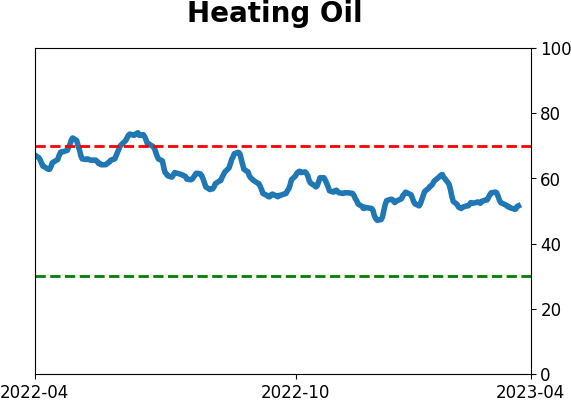
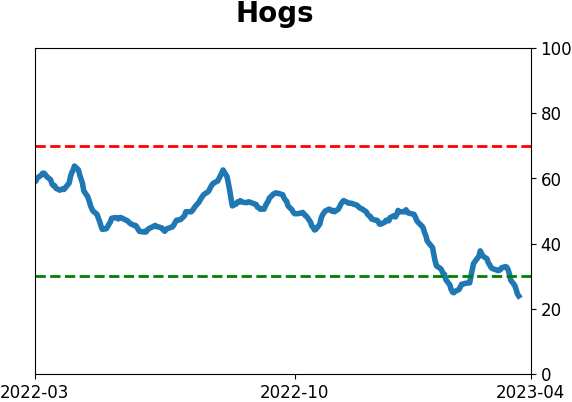
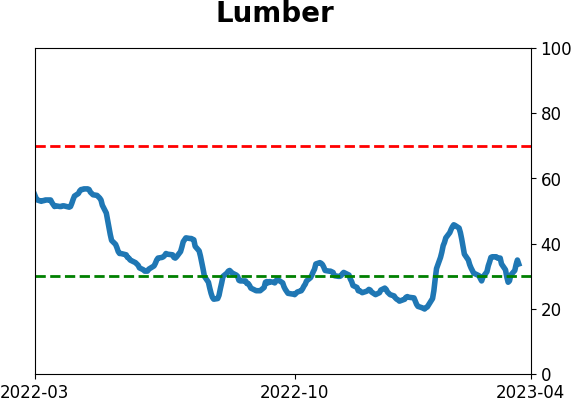
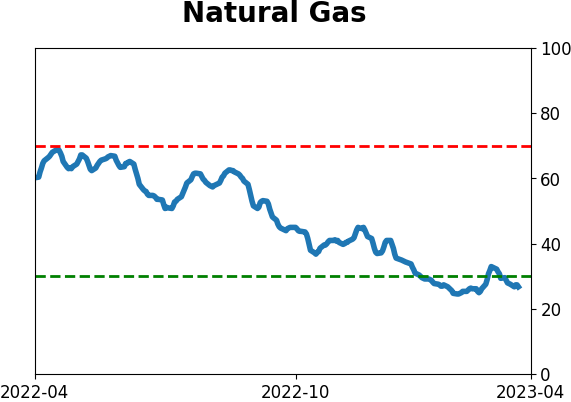
Commodity ETF's - 5-Day Moving Average
|
|