Headlines
|
|
S&P 500 is following through like it did in similar years:
The S&P 500 suffered persistent selling through mid-March. Going back to 1928, there have been more than a dozen years with price action that was highly correlated to 2022. Those years showed a strong tendency to rally into late June. It has already seen 1% rallies on 5 out of the past 6 sessions.
|
Smart / Dumb Money Confidence
|
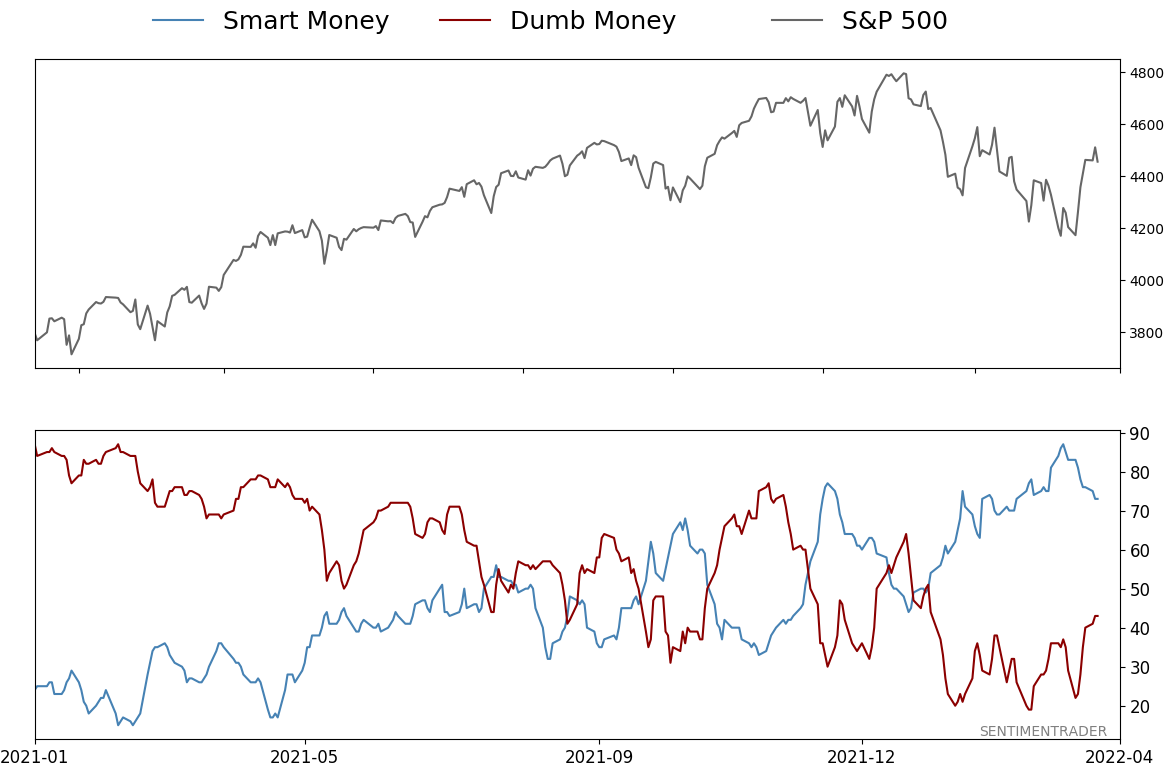
Smart Money Confidence: 73%
Dumb Money Confidence: 43%
|
|
Risk Levels
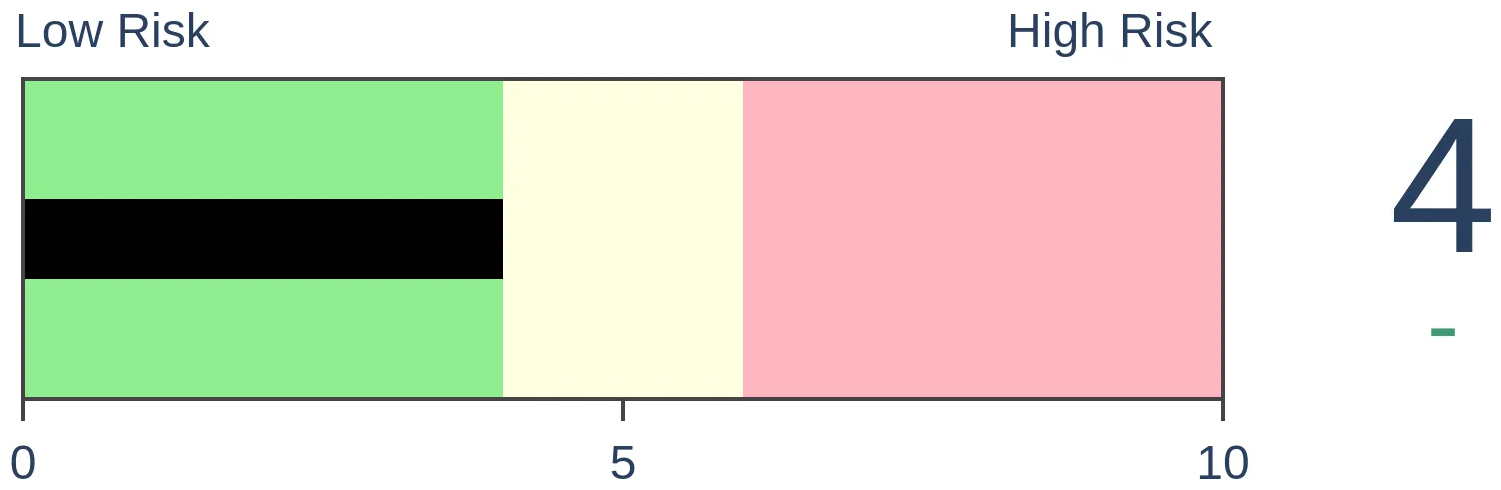
Stocks Short-Term
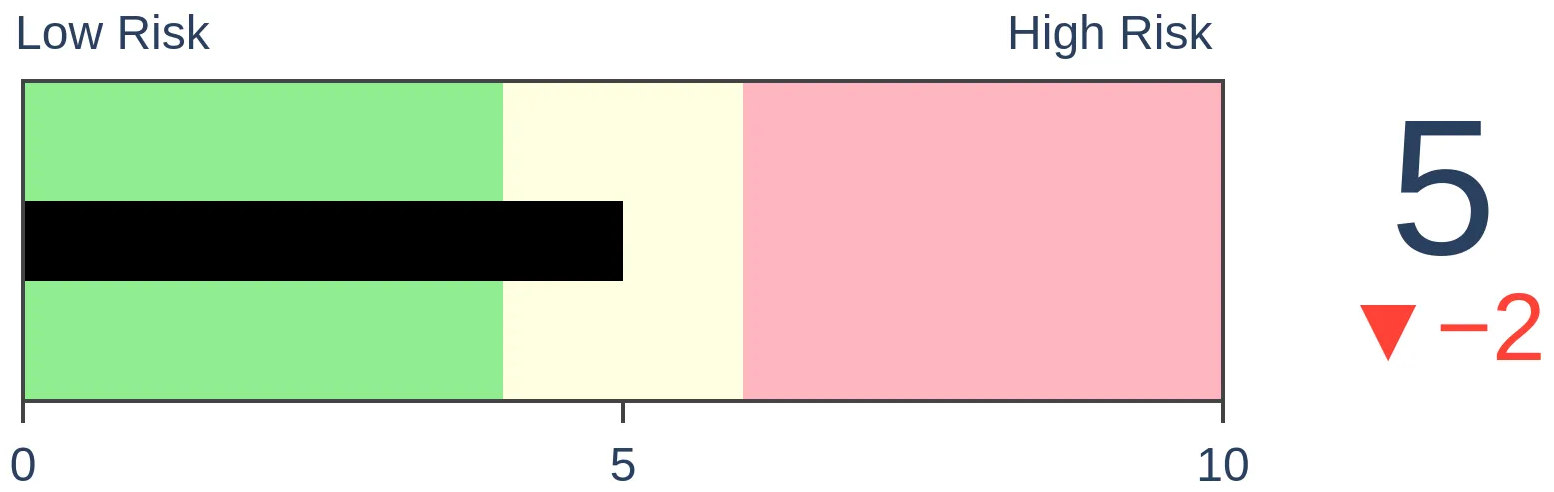
|
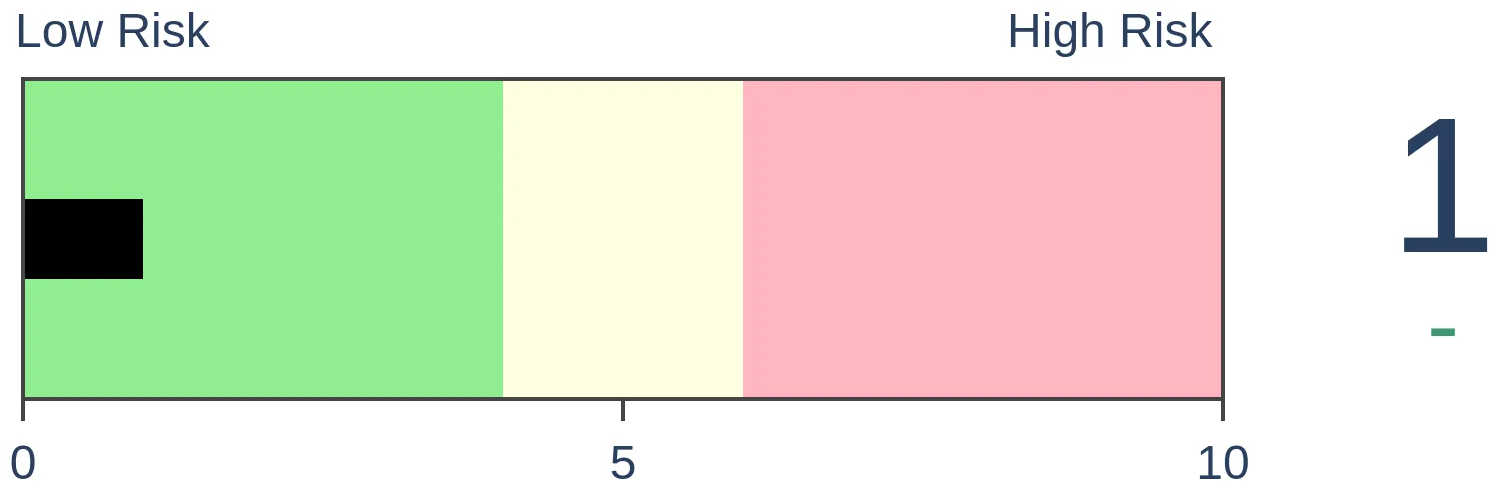
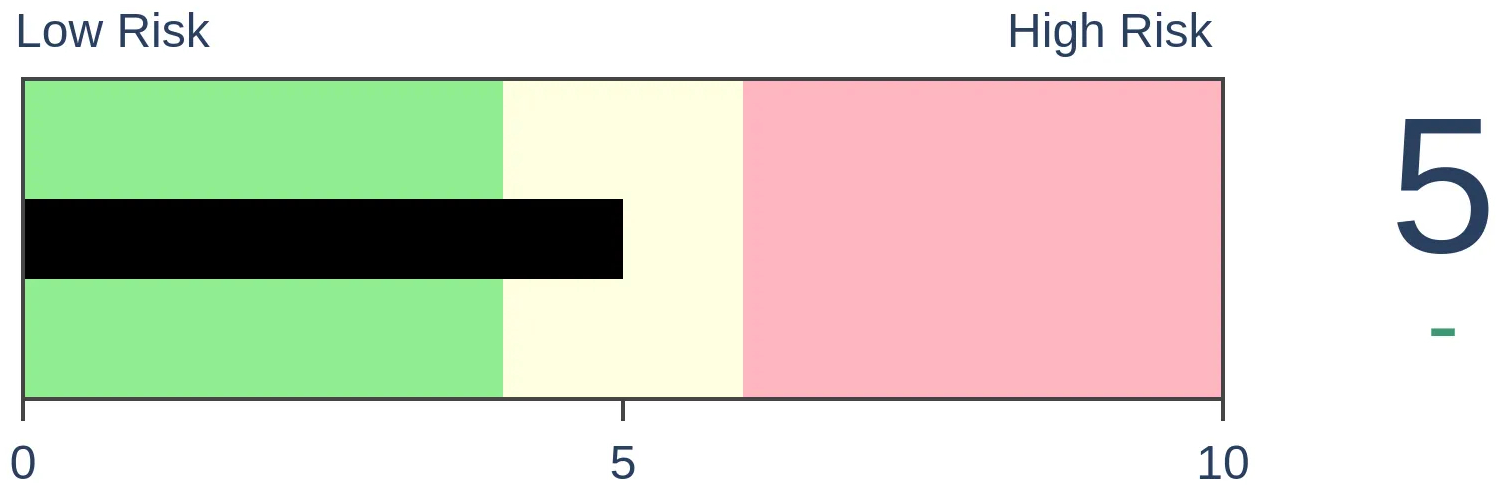
Stocks Medium-Term

|
|
Bonds
|
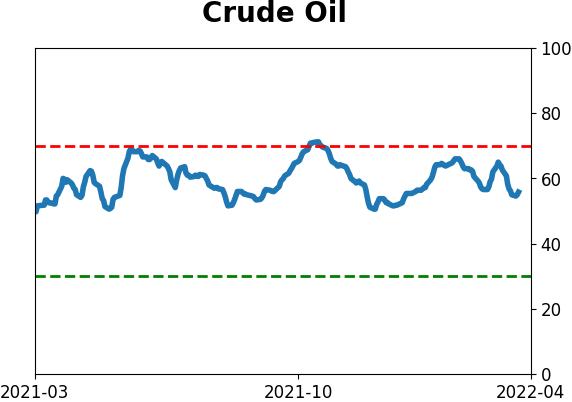
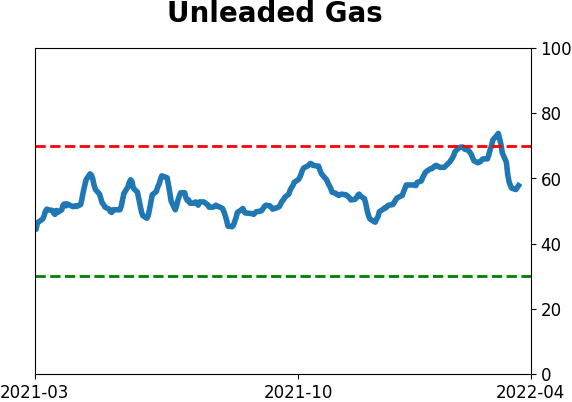
Crude Oil
|
|
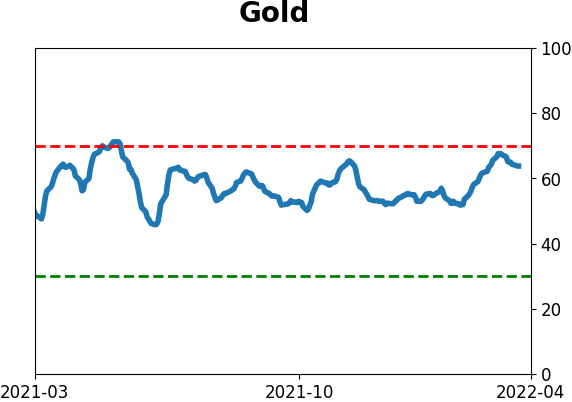
Gold
|
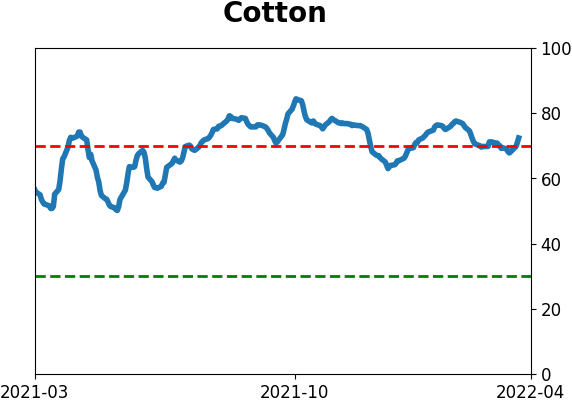
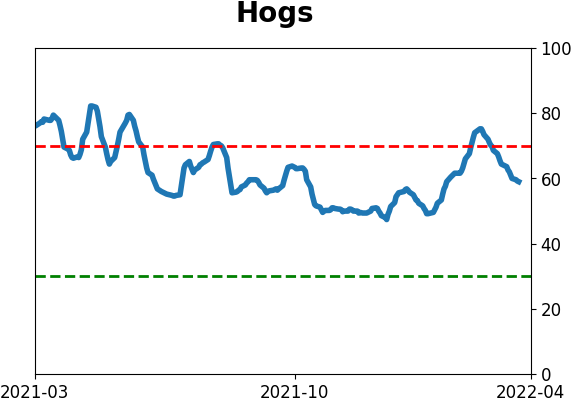
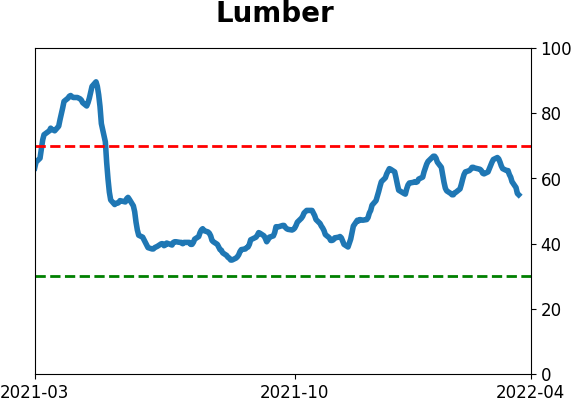
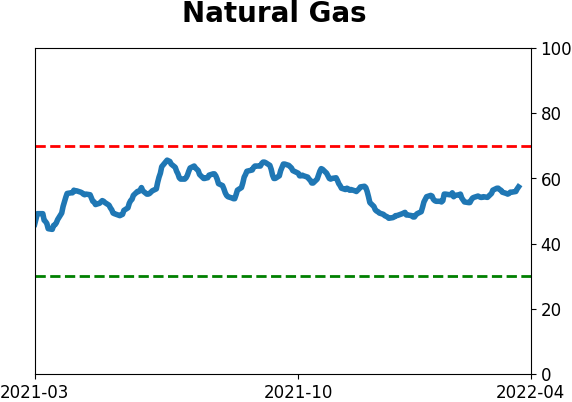
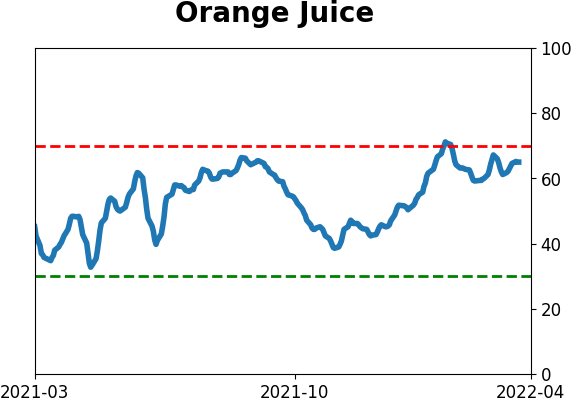
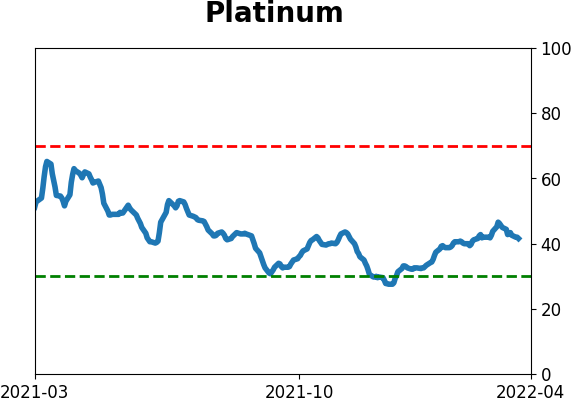
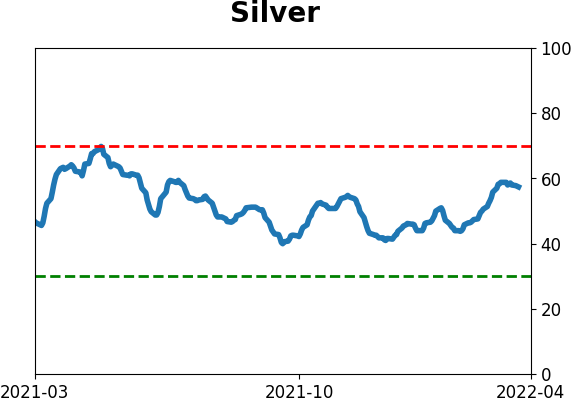
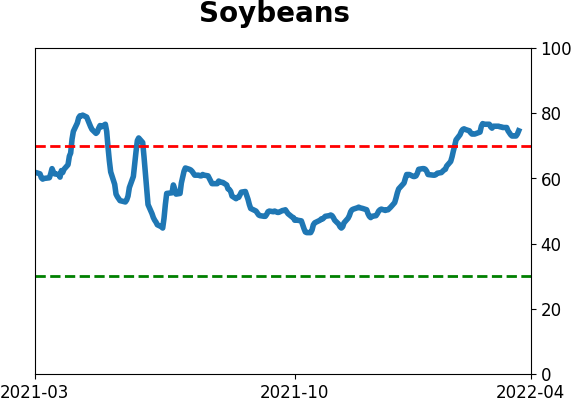
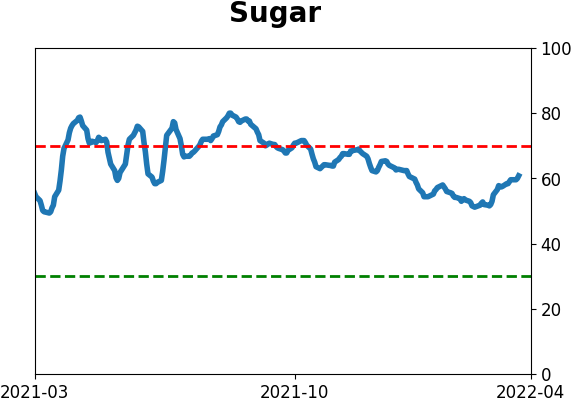
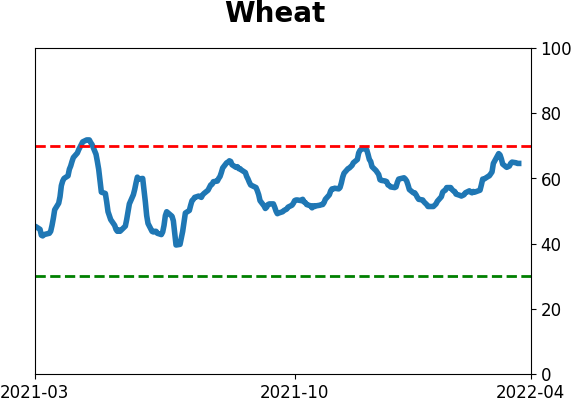
Agriculture

|
|
Research
By Jason Goepfert
BOTTOM LINE
The S&P 500 suffered persistent selling through mid-March. Going back to 1928, there have been more than a dozen years with price action that was highly correlated to 2022. Those years showed a strong tendency to rally into late June. It has already seen 1% rallies on 5 out of the past 6 sessions.
FORECAST / TIMEFRAME
SPY -- Up, Medium-Term
|
Key points:
- The S&P 500 has suffered a persistent decline heading into mid-March
- There have been more than a dozen other years with highly correlated YTD price action to 2022
- Those precedents consistent preceded gains through June
The most similar years to 2022 tended to bottom about now
The seasonal trends for many equity ETFs and indexes are about to turn from poor or neutral to positive as we enter the spring months. Seasonality alone, especially in stock indexes, is a shaky leg to stand on, but combined with other factors can be a helpful tool.
If we look at the year-to-date loss in the S&P 500 and compare it to other years, we can objectively find periods when poor returns and seasonality combined forces. The chart below shows the S&P in 2022 and an average of 14 other years with more than a +0.7 correlation to this year (on a scale from -1.0 to +1.0).
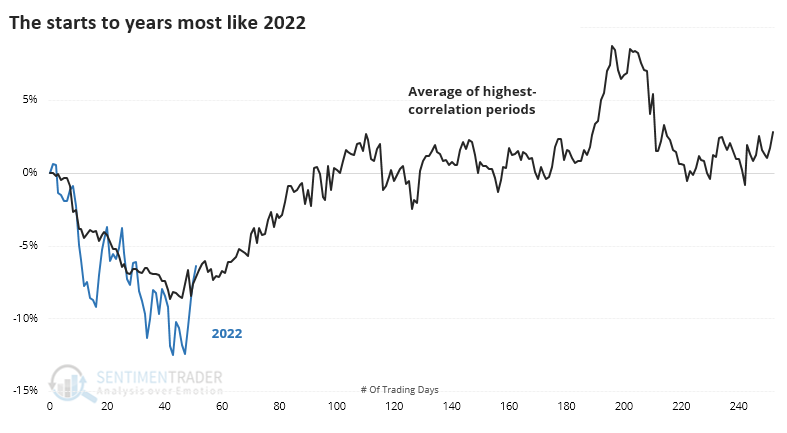
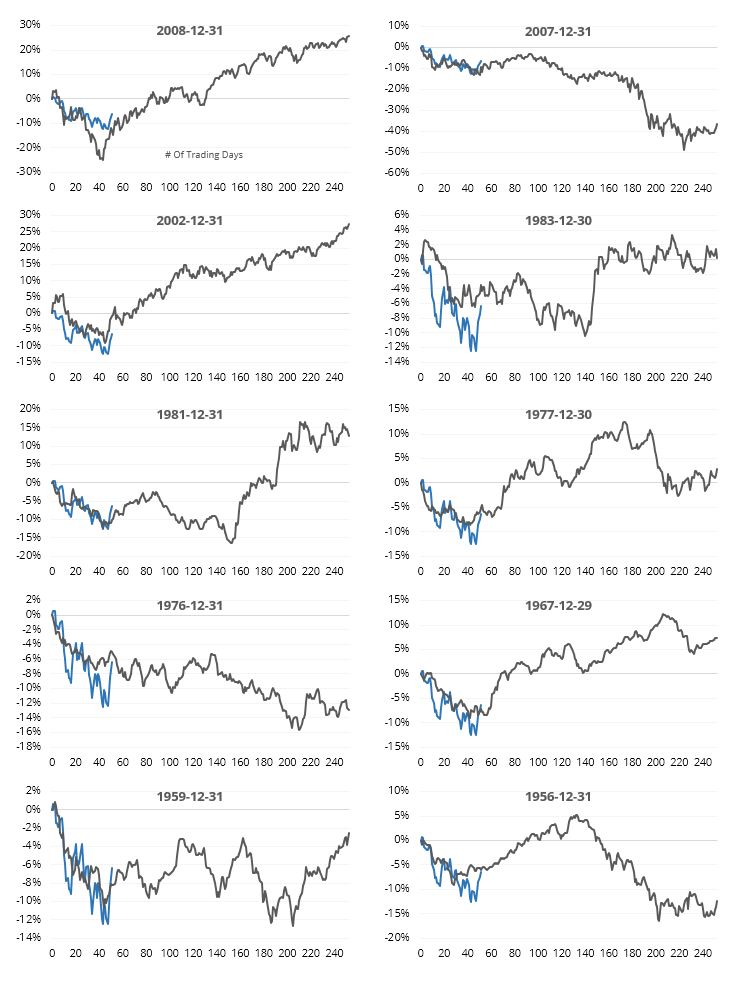
Many of them bottomed right about where we did this year and typically carried higher into early summer. The 10 most recent years with high correlations are below. Only 1976 suffered an immediate rejection and lower lows. The others rallied for about 30 days before failing, if they did at all.
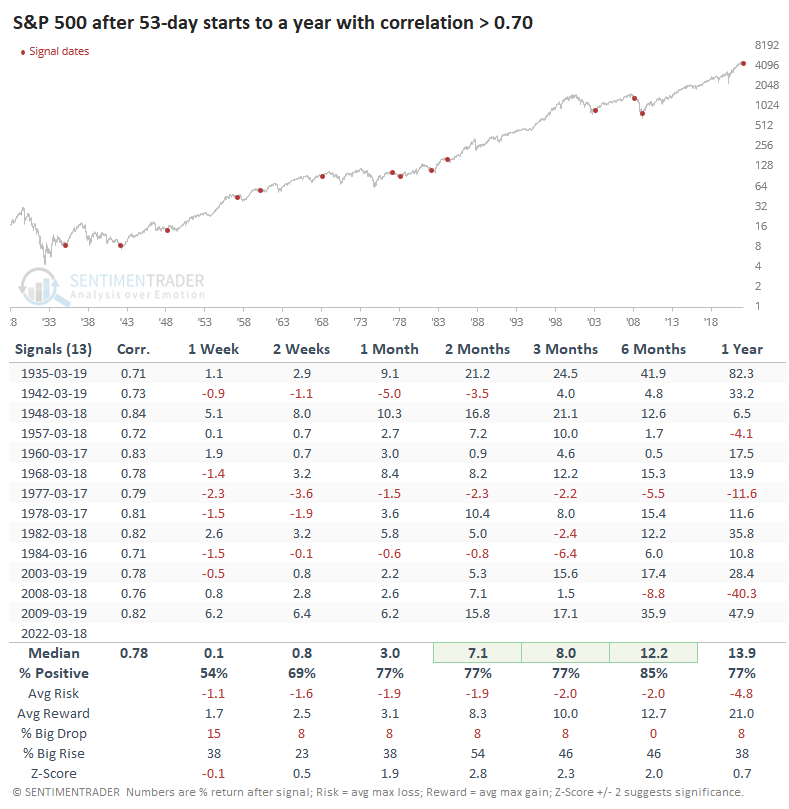
As always, we're more concerned with where we may be going instead of where we've been. The table below shows the S&P's returns after those periods ended. Out of the 13 years with a YTD correlation greater than +0.70, 11 of them showed gains during the next 6 months. Median returns were significantly above random over the next 1-6 months.
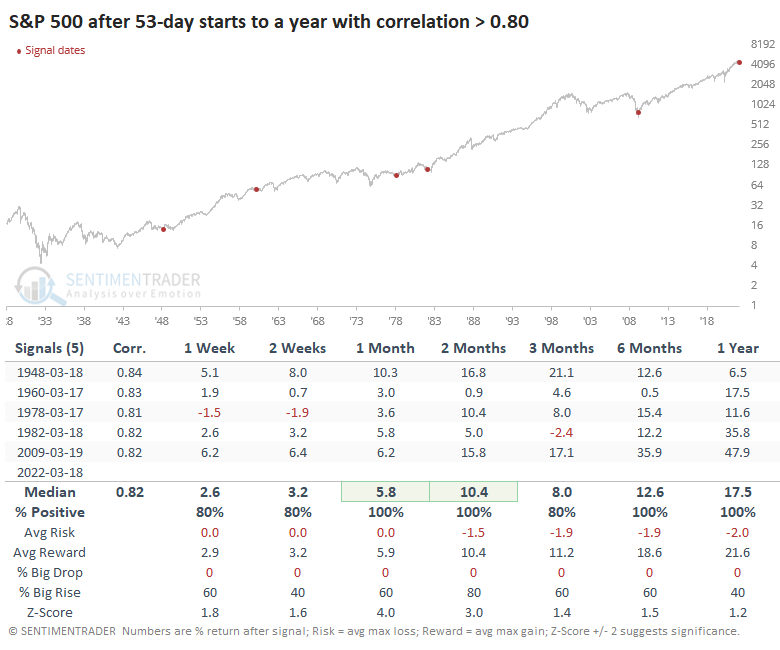
Out of that sample, there were a handful of years with the highest correlations, above +0.80. Those all showed gains in the months ahead.
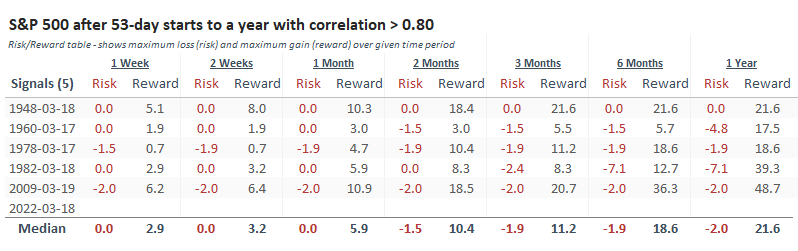
The Risk/Reward Table shows all were heavily skewed to the "reward" side for the next few months. None of the 5 suffered a decline larger than -2.4% at any point within the next 3 months, while all of them enjoyed gains of at least +5.5% at some point by late June. The usual caveats about tiny samples sizes apply.
Already surging
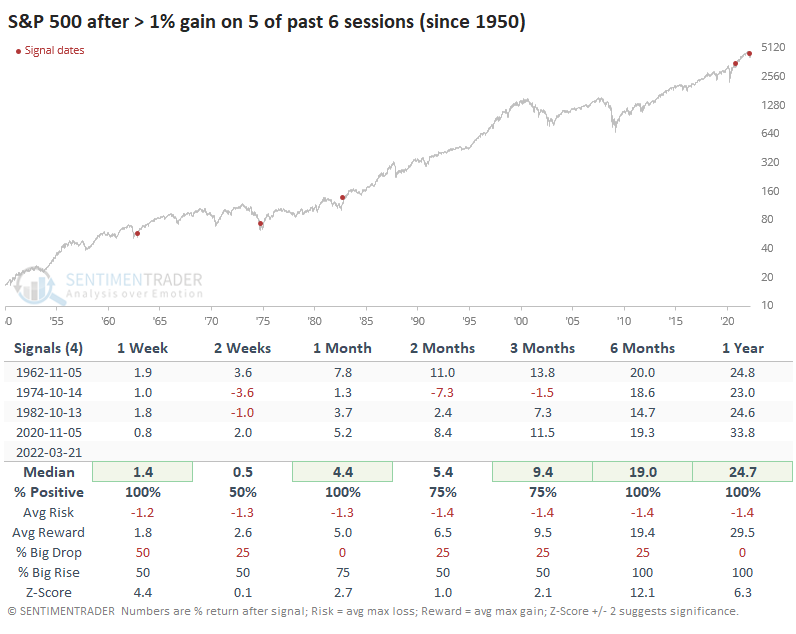
One of the stats making the rounds today is that the S&P 500 has eagerly followed through on recent gains, with 5 of the last 6 sessions showing a gain great than 1%. The last 4 instances all marked major buying thrusts, with further gains of at least 23% over the next year.
That leaves out the volatile 1930s, however. While a few of them preceded major gains in the months ahead, most of them showed the opposite.
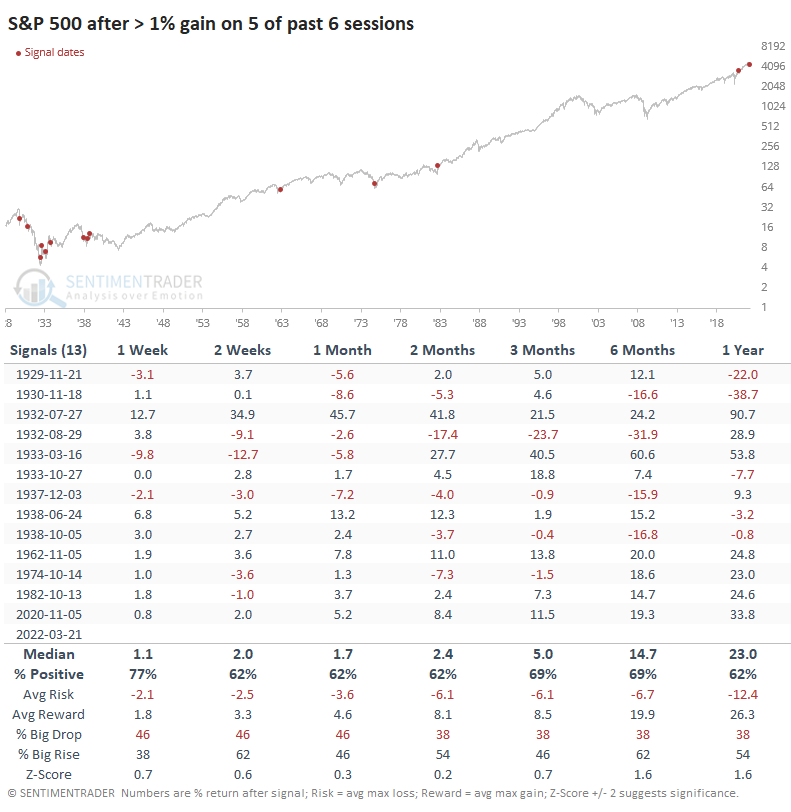
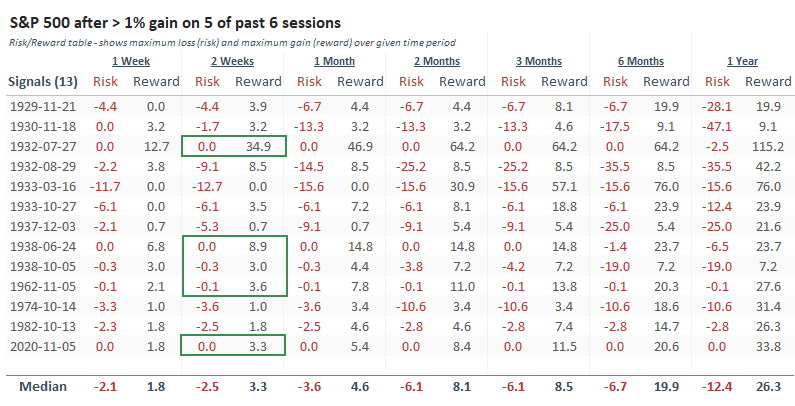
While not at all a perfect indicator, watching the risk/reward over the next couple of weeks was a decent guide for the likelihood of a sustained rally. If buyers continued to push, and sellers stayed away, long-term returns were more robust.
What the research tells us...
We've seen in recent studies that the length, magnitude, and type of decline we've seen since the peak has a high probability of enjoying a multi-week to multi-month rebound. We'll just have to see whether that allows for new highs or ultimately fails. Now, we have an additional tailwind of a positive seasonal bias. The risk/reward continues to point higher over a short- to medium-term time frame.
Active Studies
| Time Frame | Bullish | Bearish | | Short-Term | 4 | 0 | | Medium-Term | 24 | 2 | | Long-Term | 15 | 5 |
|
Indicators at Extremes
Portfolio
| Position | Description | Weight % | Added / Reduced | Date | | Stocks | 21.6% RSP, 5.1% IEMG | 26.7 | Added 5.3% | 2022-03-18 | | Bonds | 32.7% BND, 7.1% SCHP | 40.1 | Added 8.3% | 2021-10-26 | | Commodities | GCC | 2.4 | Reduced 2.1%
| 2020-09-04 | | Precious Metals | GDX | 4.6 | Reduced 4.2% | 2021-05-19 | | Special Situations | 7.6% KWEB, 4.9% XBI, 3.7% XLE, 1.8% PSCE | 18.0 | Added 4.6% | 2022-02-24 | | Cash | | 7.9 | | |
|
Updates (Changes made today are underlined)
We had a volatile few weeks into mid-March, and it was enough to trigger a number of extremes. Most of the studies we've looked at have had a clear bullish edge over a multi-month time frame. I'd typically be more proactive instead of reactive with changes in positions, adding exposure into weakness instead of strength, but during an unhealthy environment like we're in, I tend to be more conservative. I did add some exposure to emerging markets, choosing a fund with the least exposure to China, since I already have exposure there with KWEB. It's still heavily weighted to that market. The only other times the MSCI Emerging Markets Index has had a weekly reversal like this week were October 2008, October 2011, and August 2015, all leading to long-term gains. RETURN YTD: +0.6% 2021: +8.7%, 2020: +8.1%, 2019: +12.6%, 2018: +0.6%, 2017: +3.8%, 2016: +17.1%, 2015: +9.2%, 2014: +14.5%, 2013: +2.2%, 2012: +10.8%, 2011: +16.5%, 2010: +15.3%, 2009: +23.9%, 2008: +16.2%, 2007: +7.8%
|
|
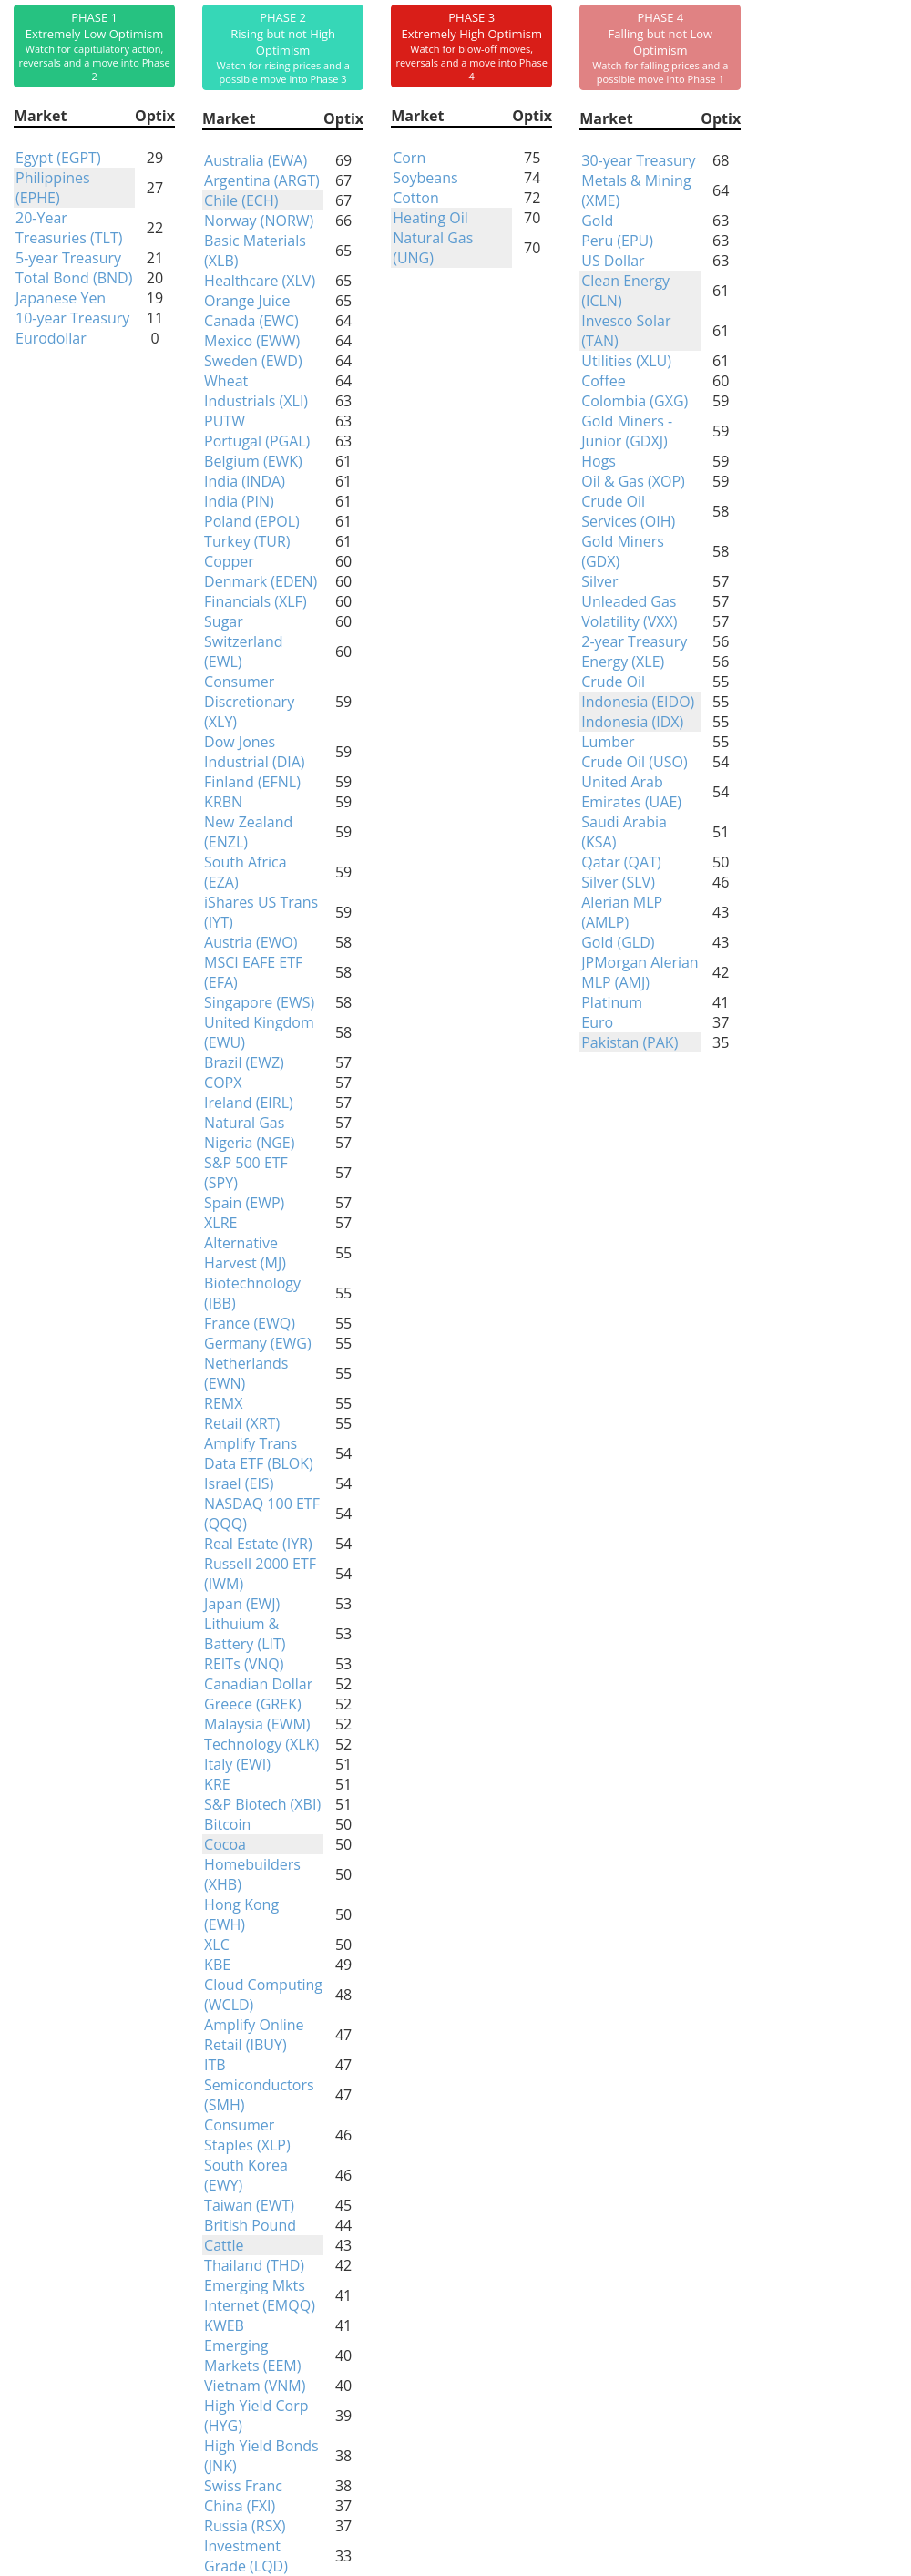
Phase Table
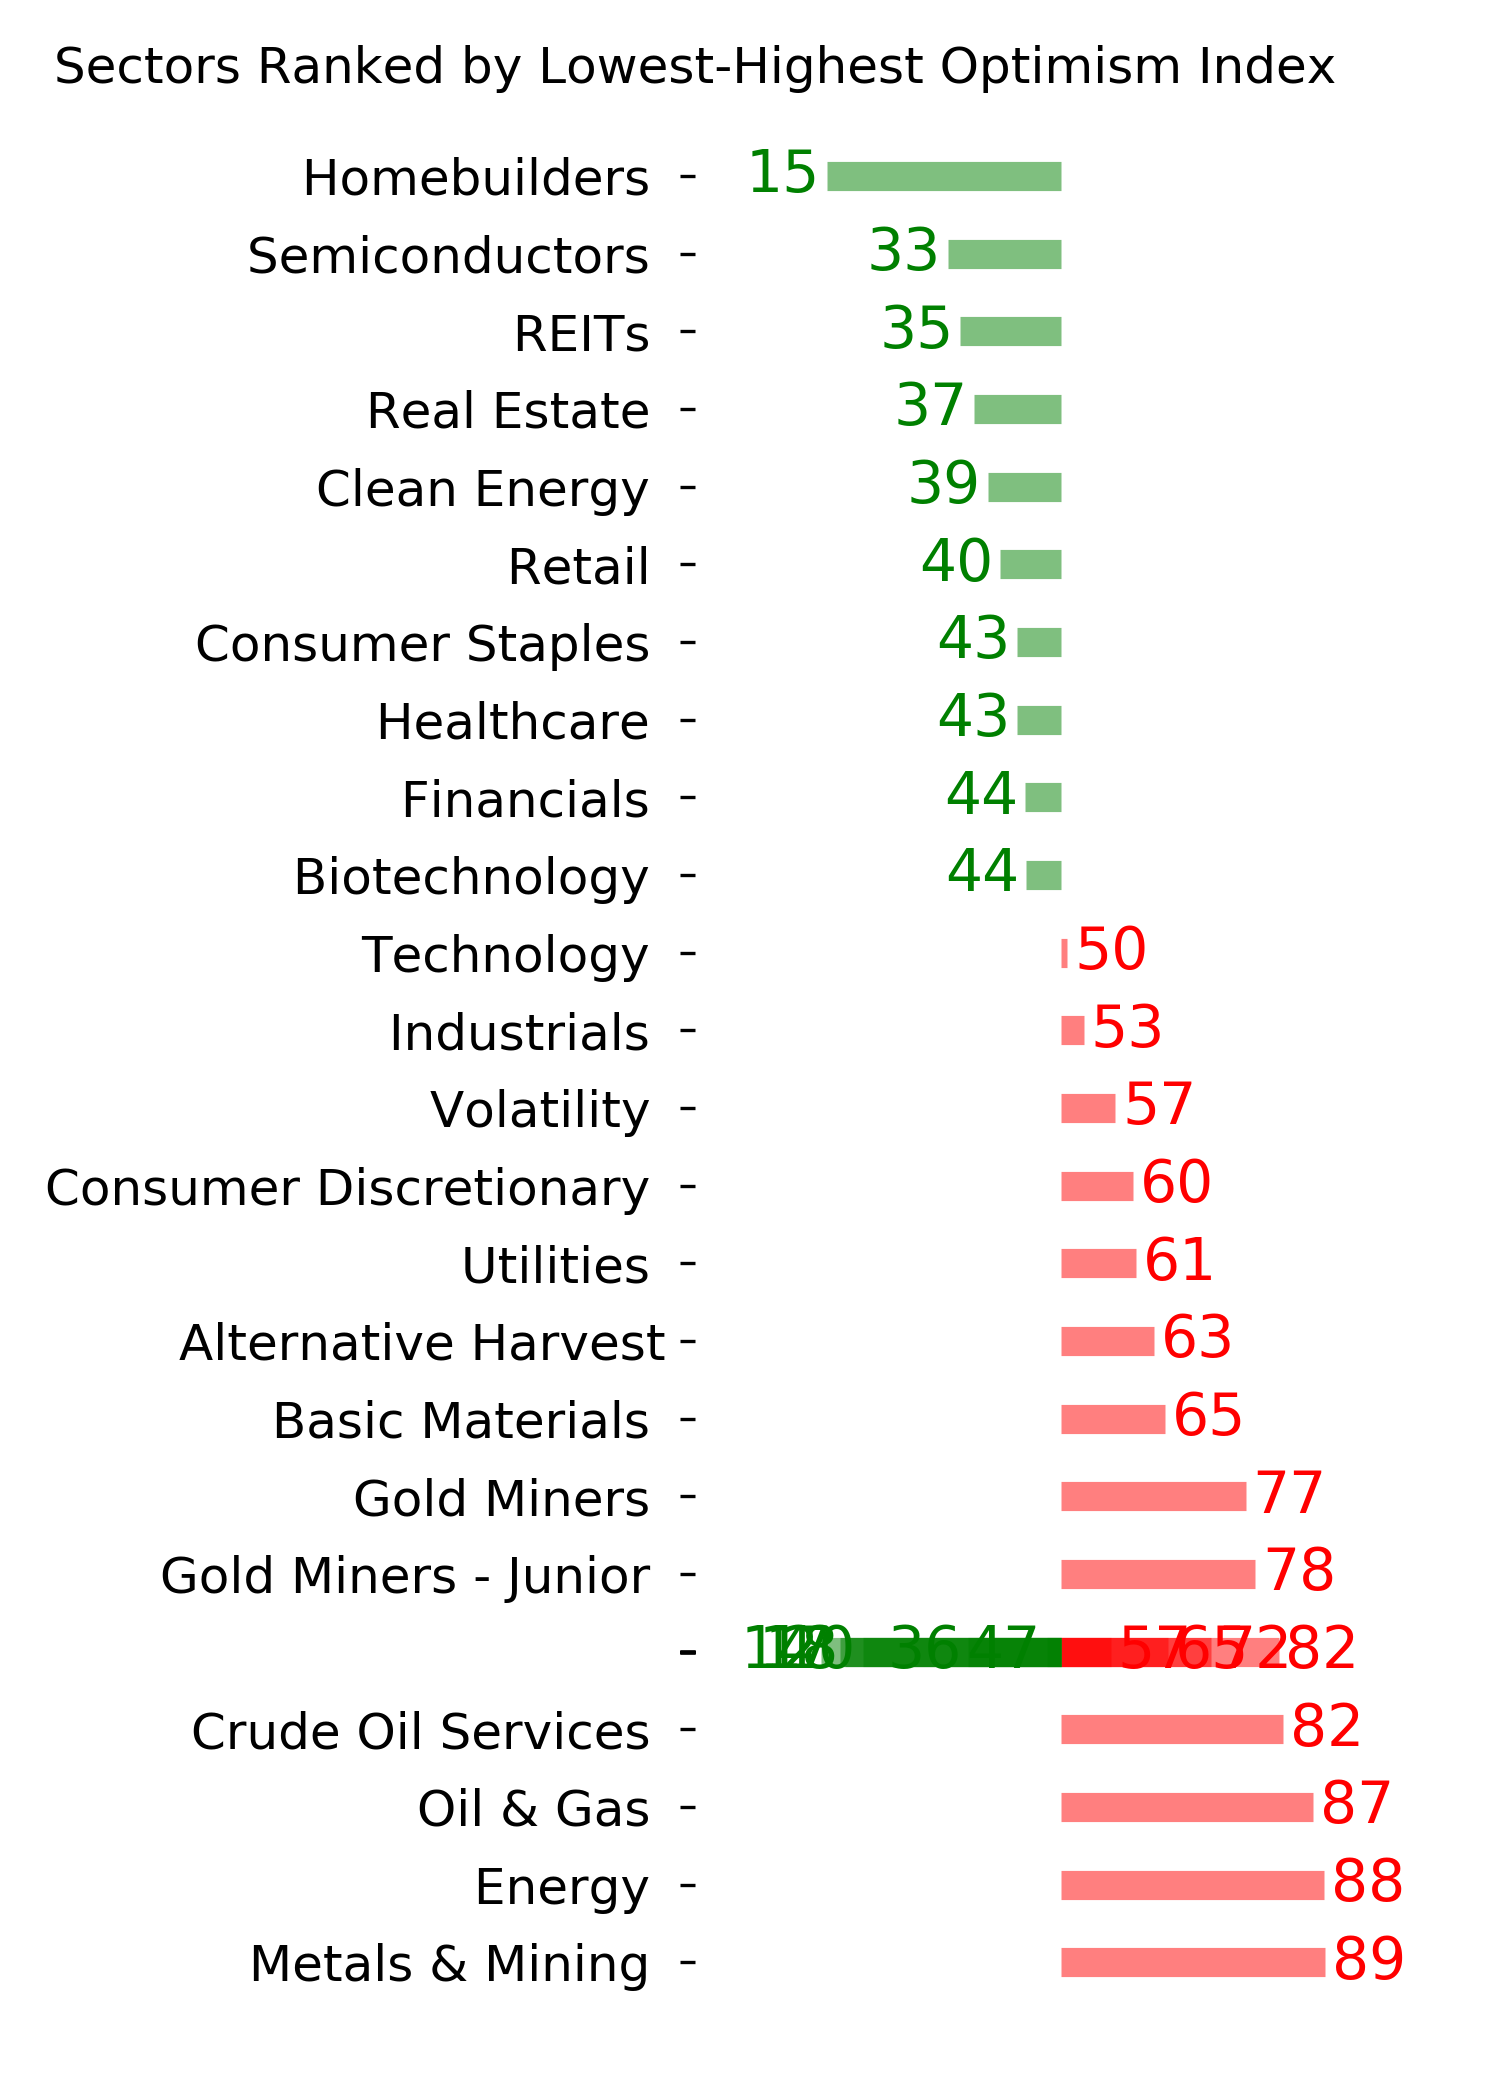
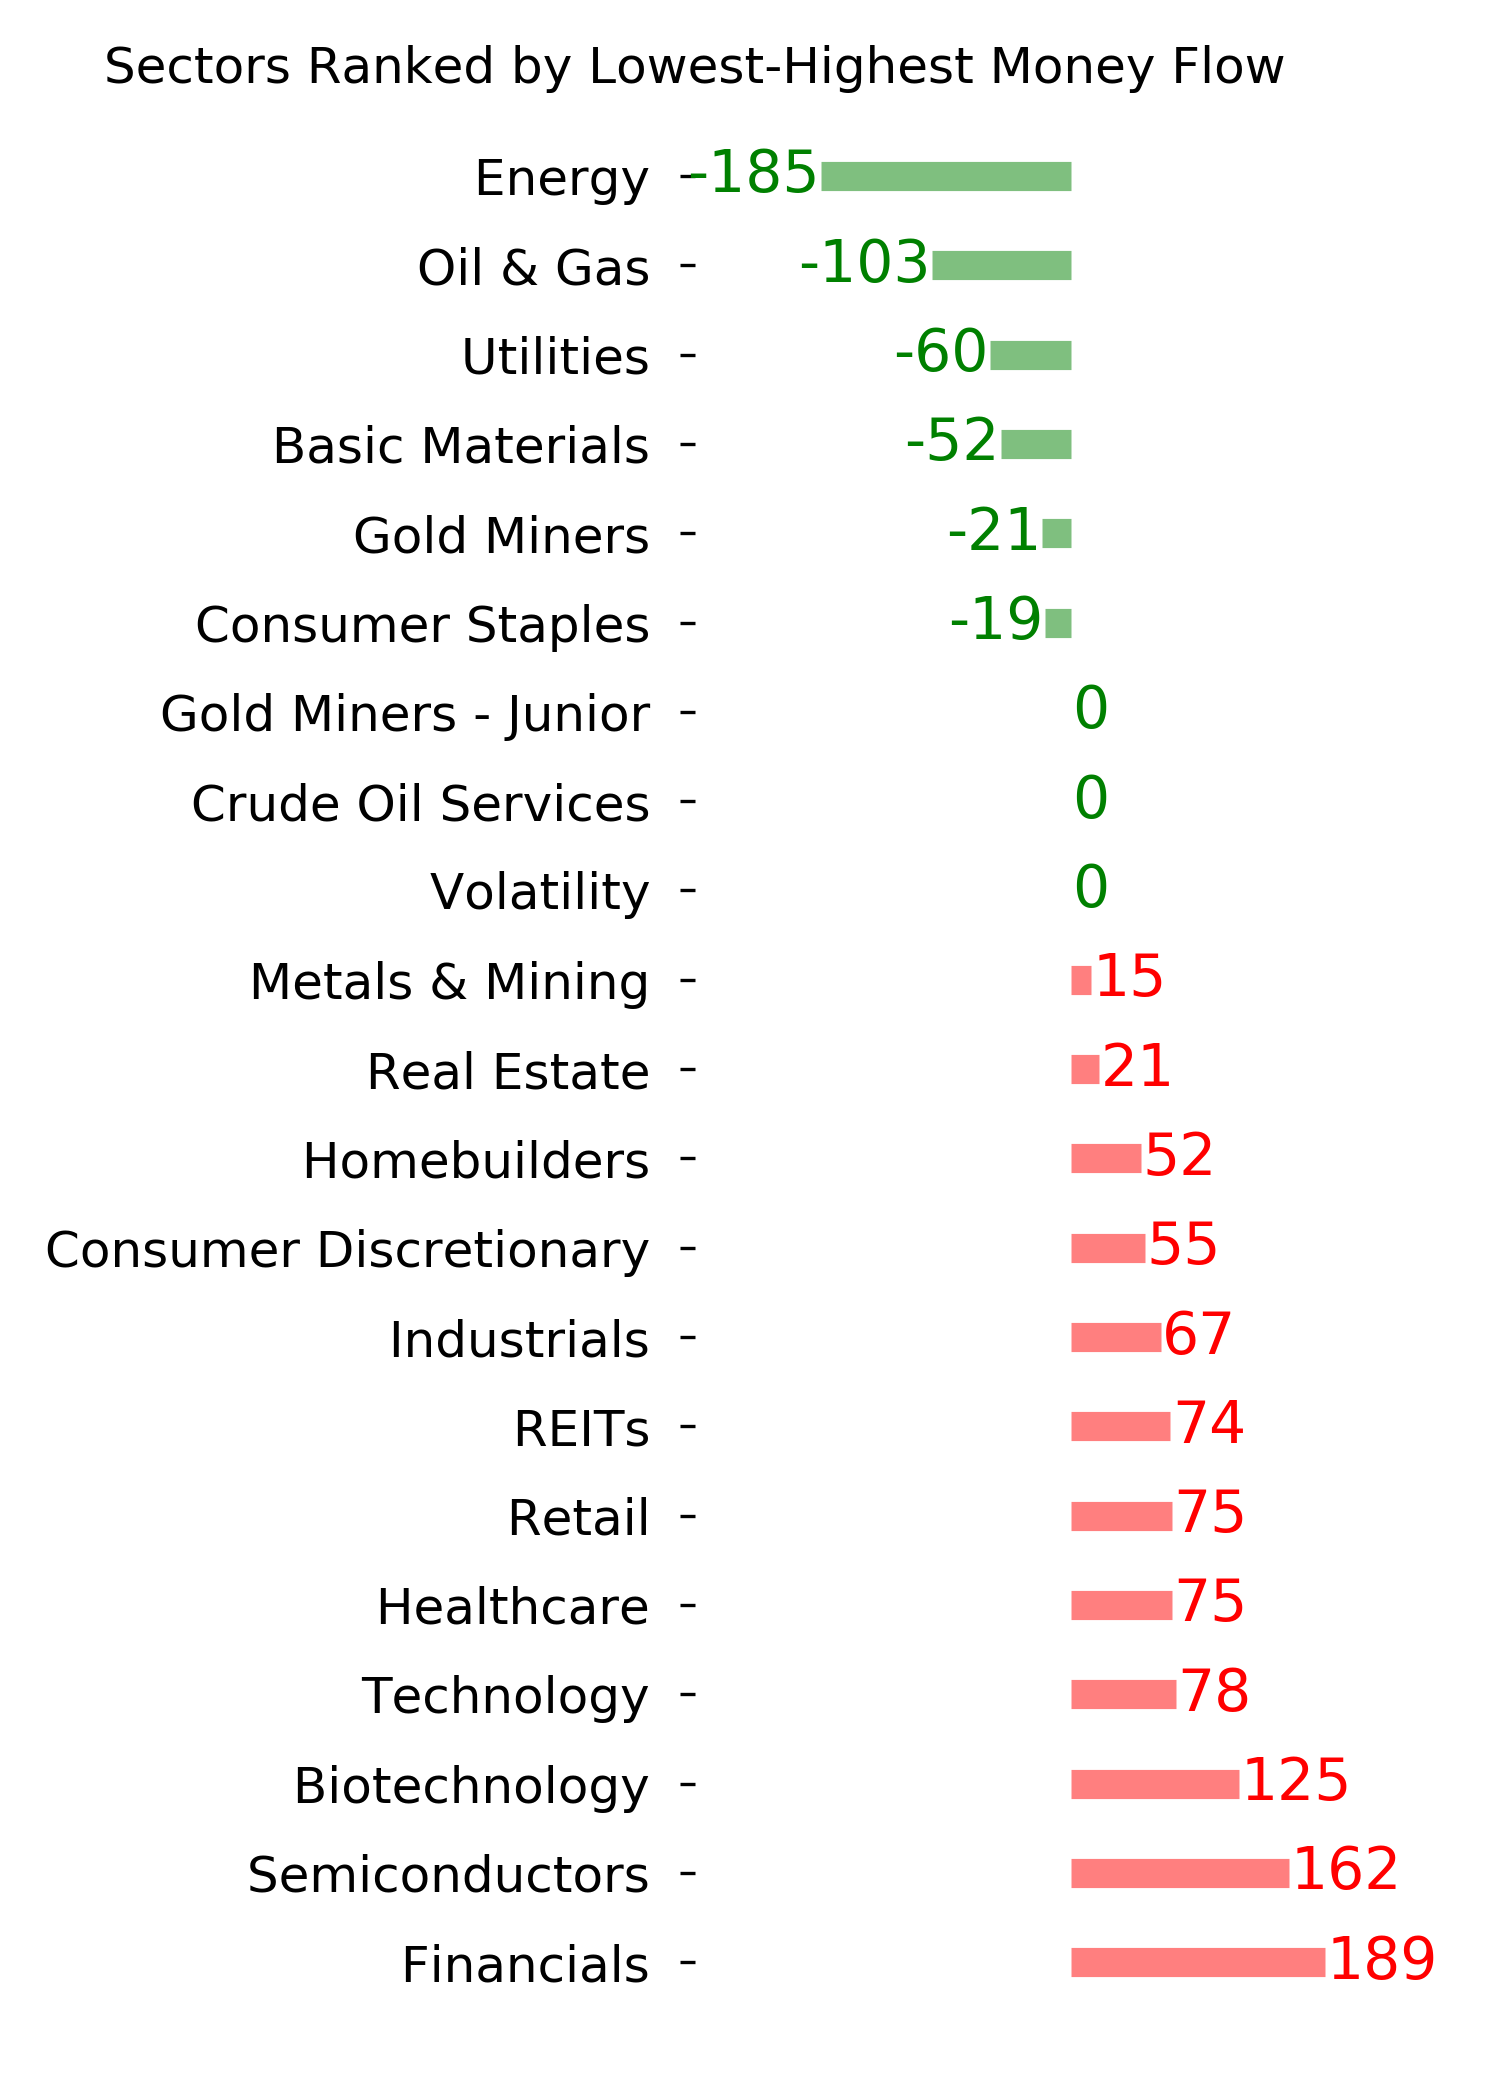
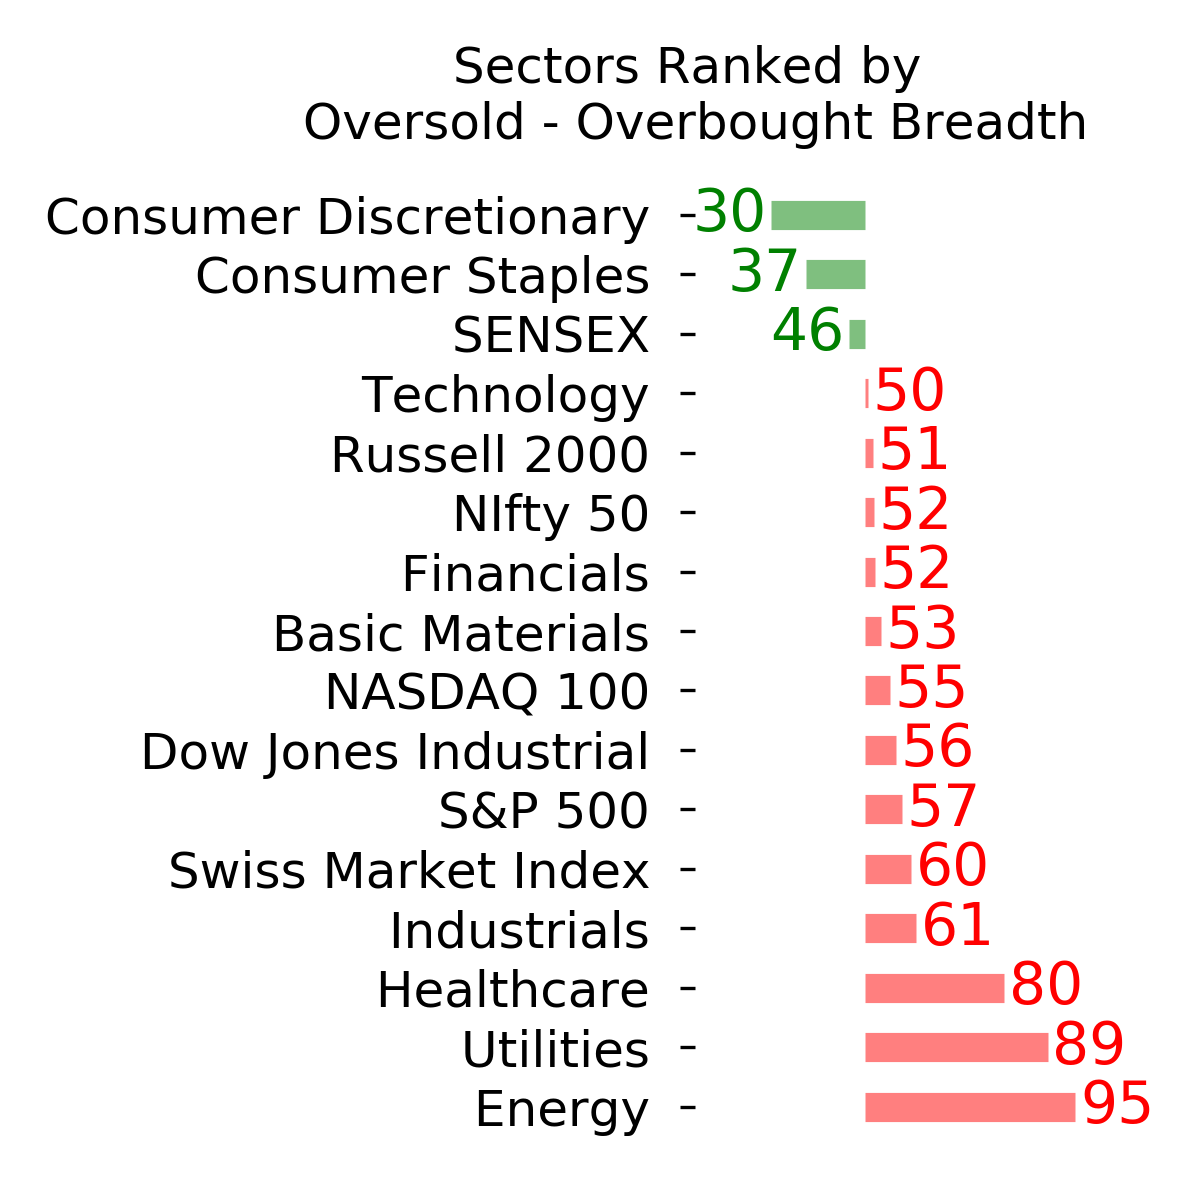
Ranks
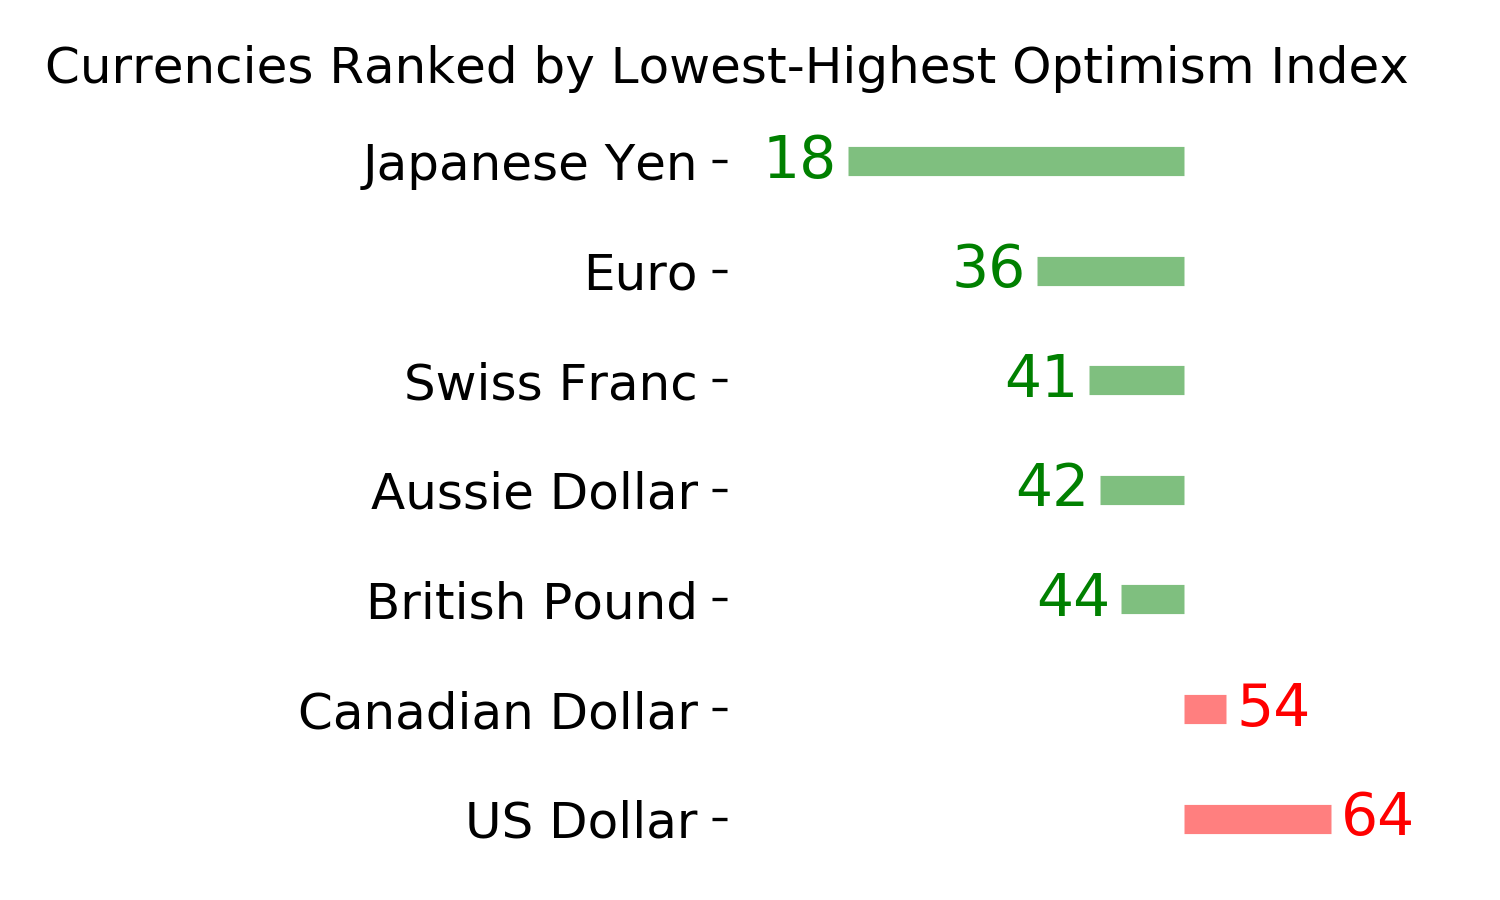
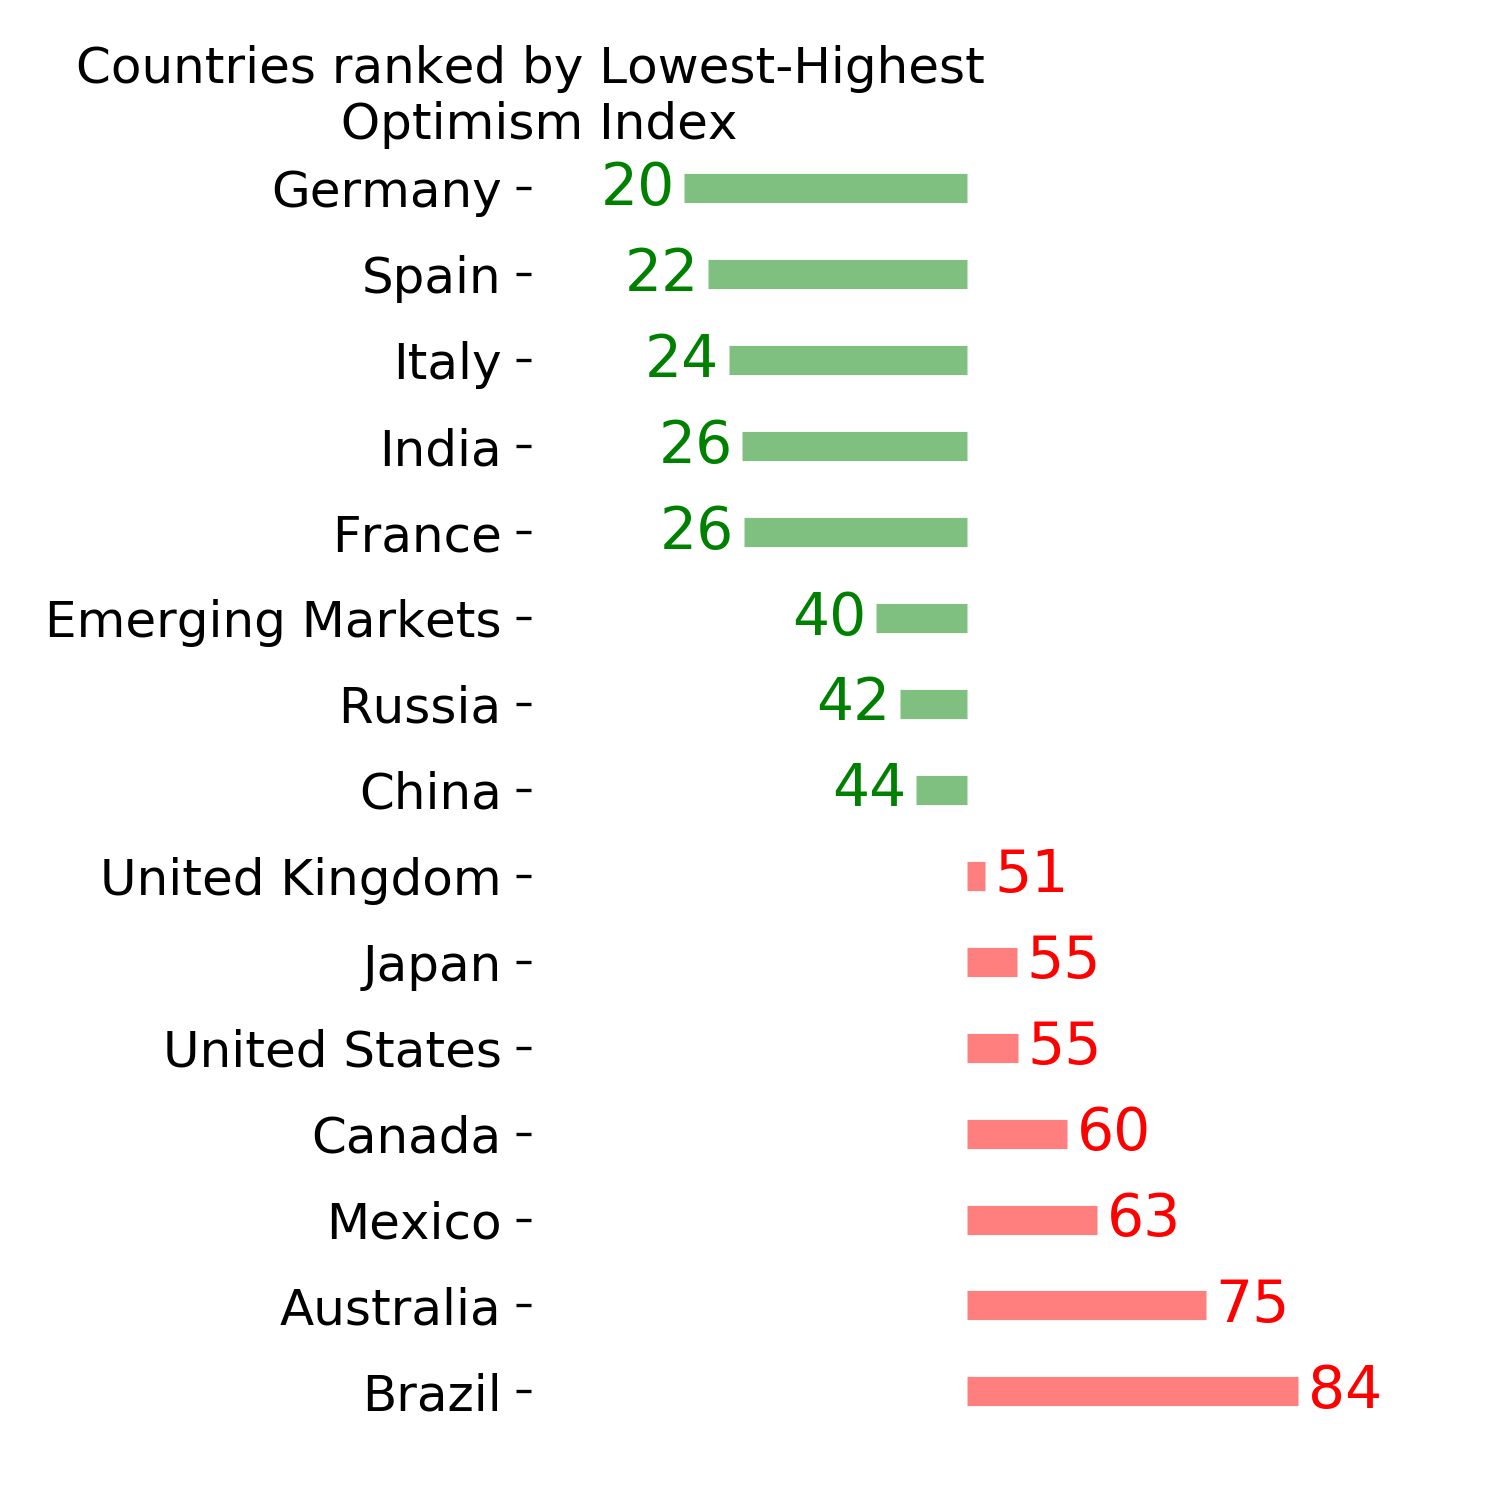
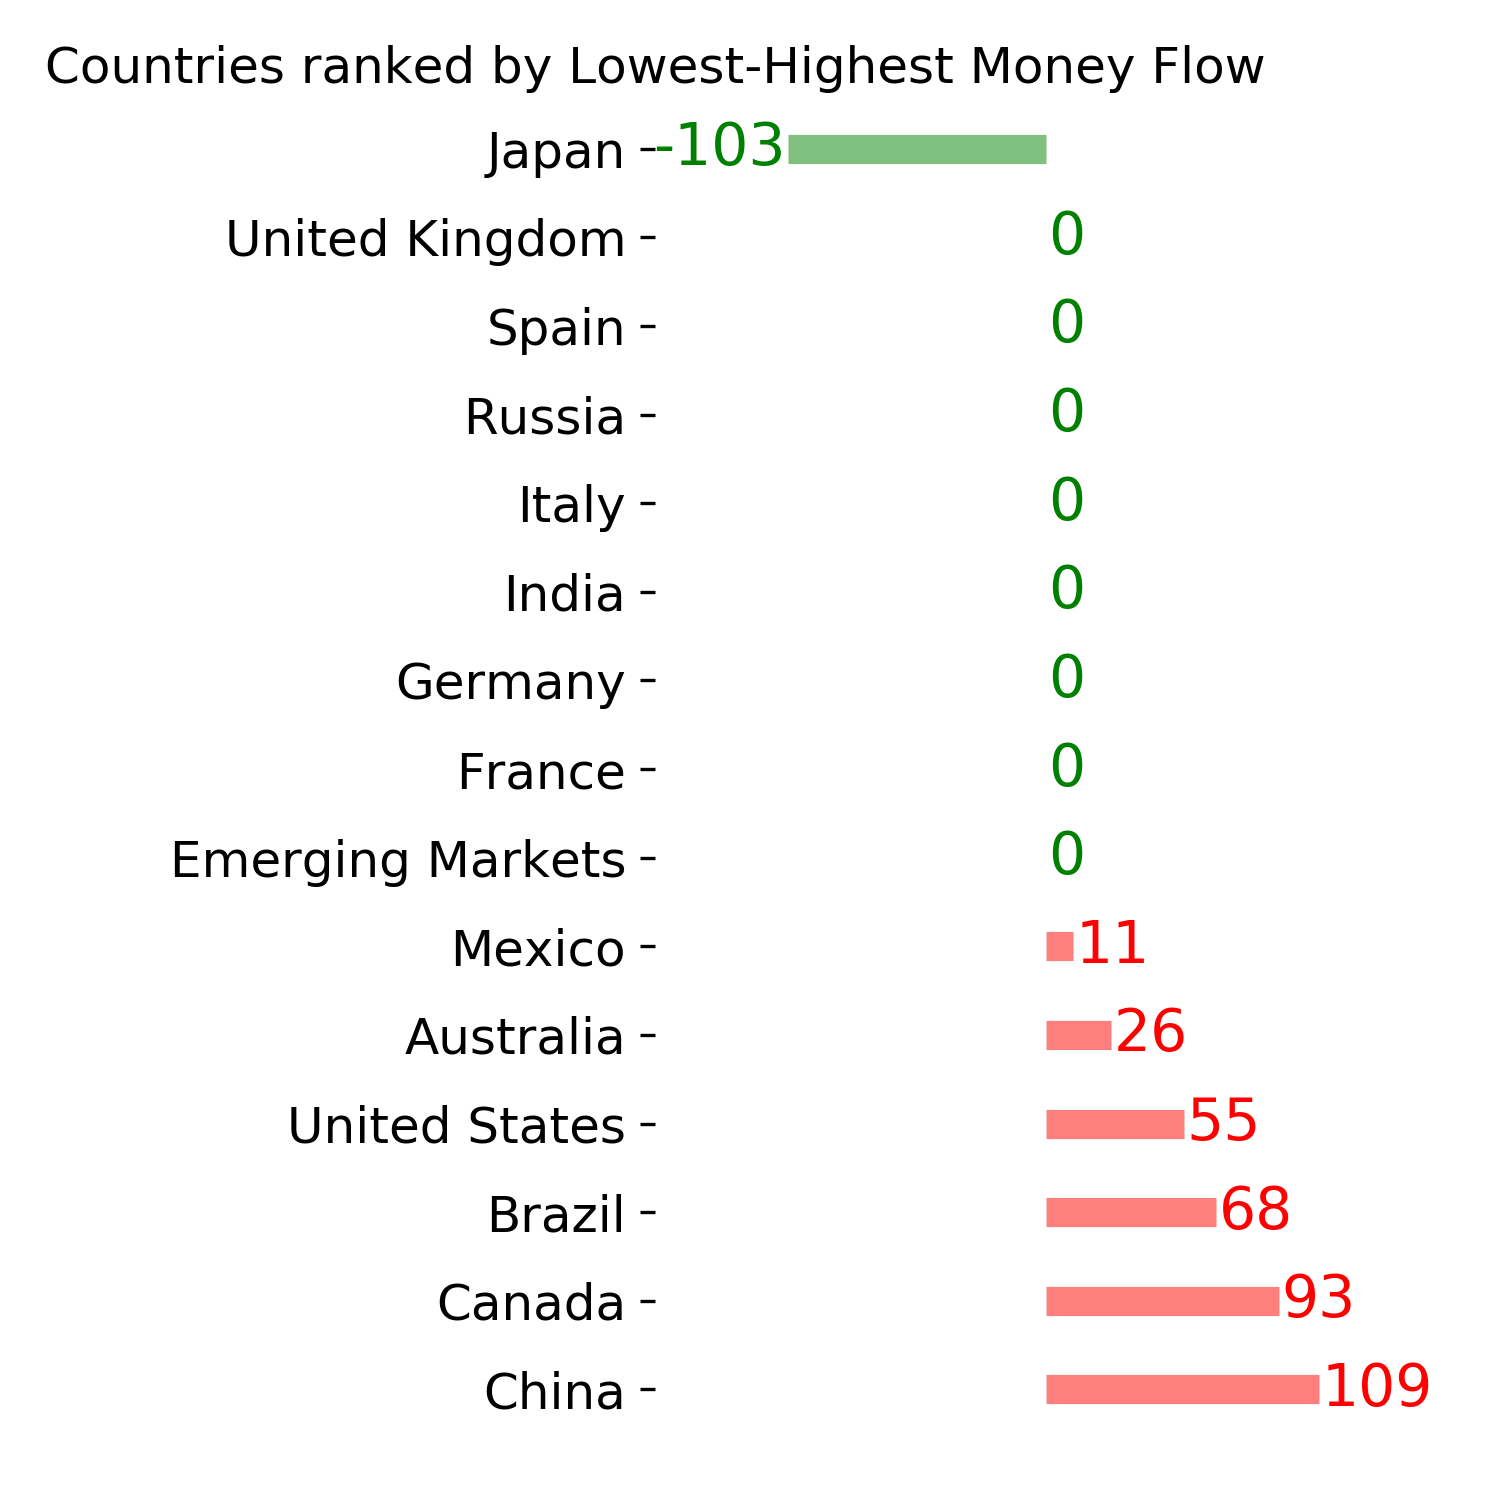
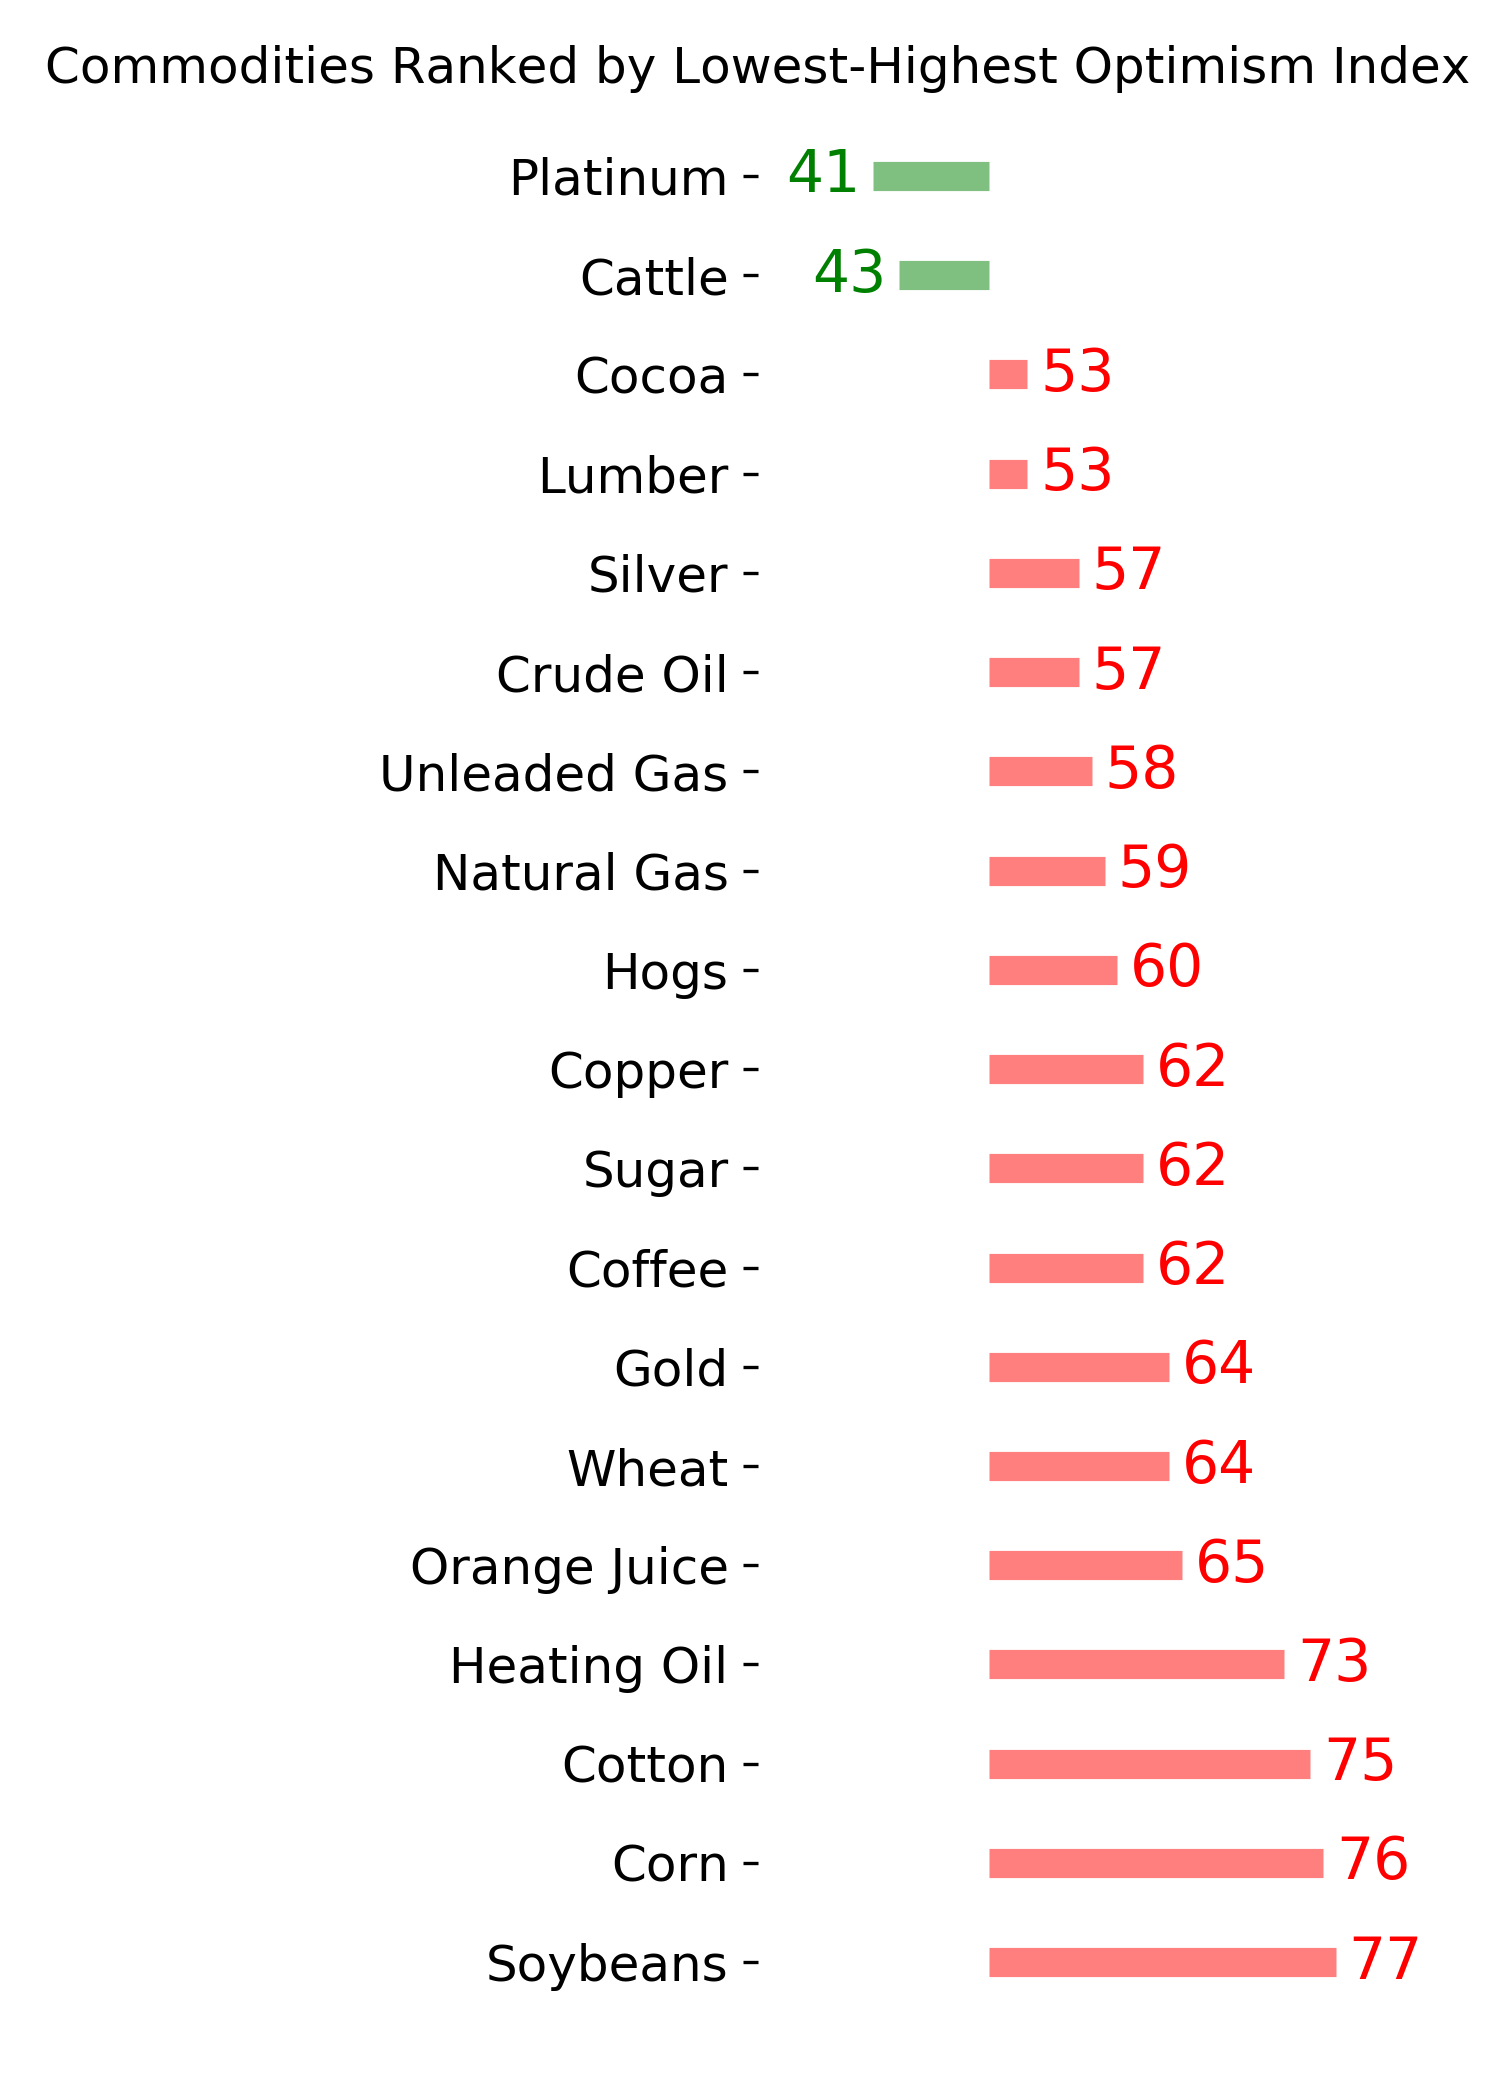
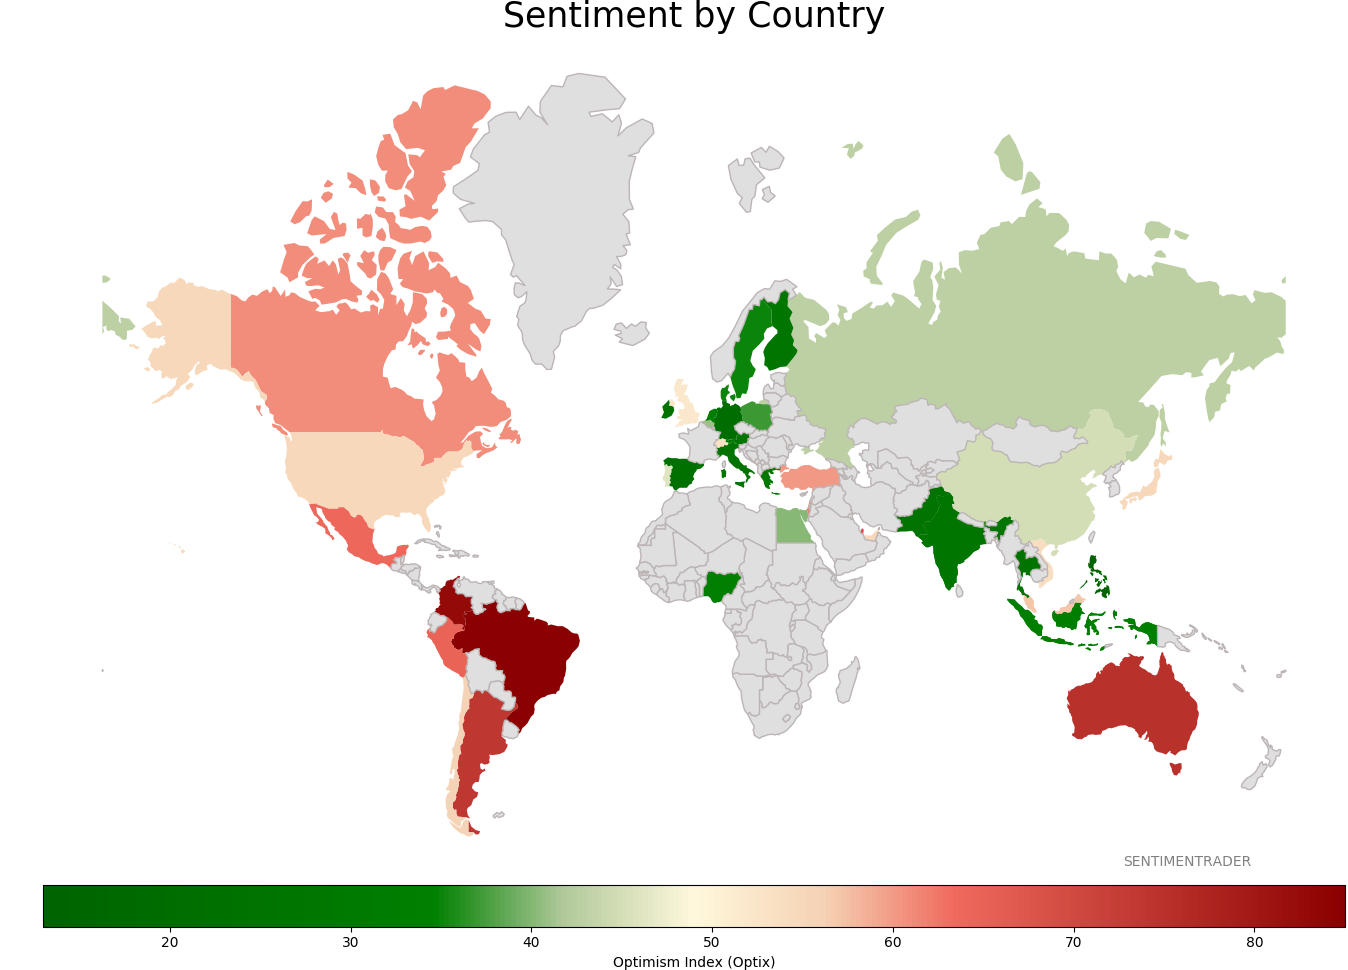
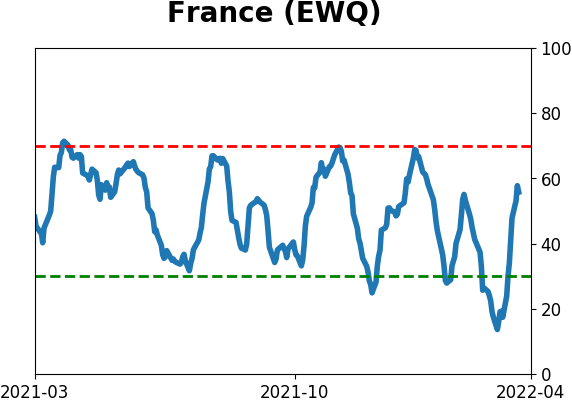
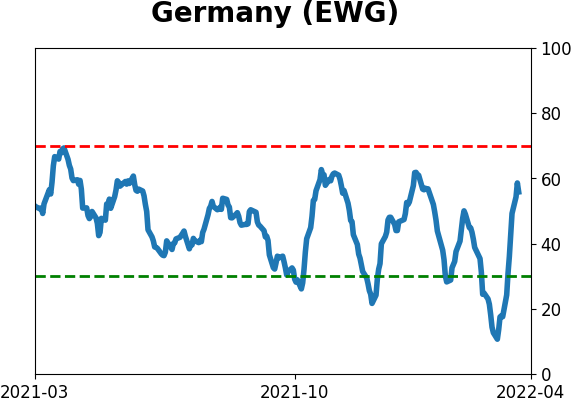
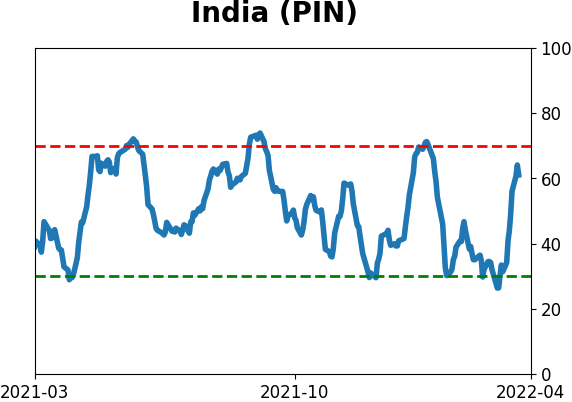
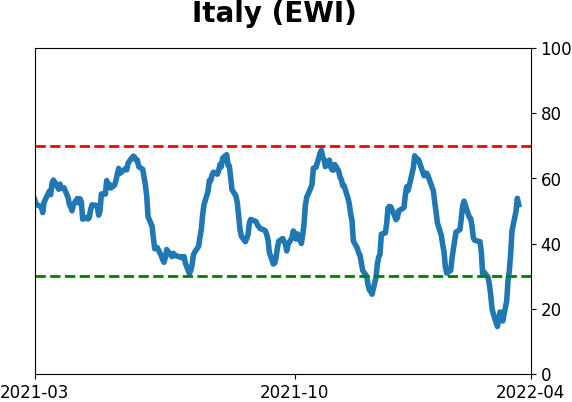
Sentiment Around The World
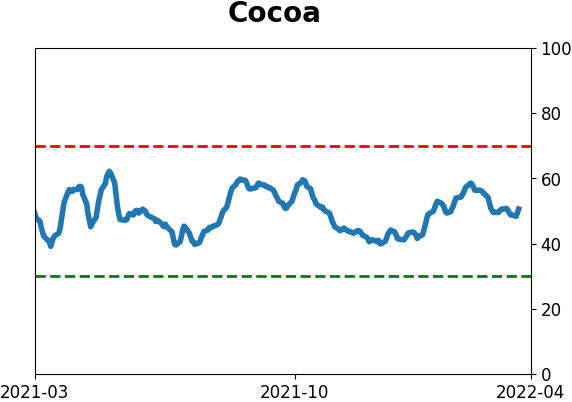
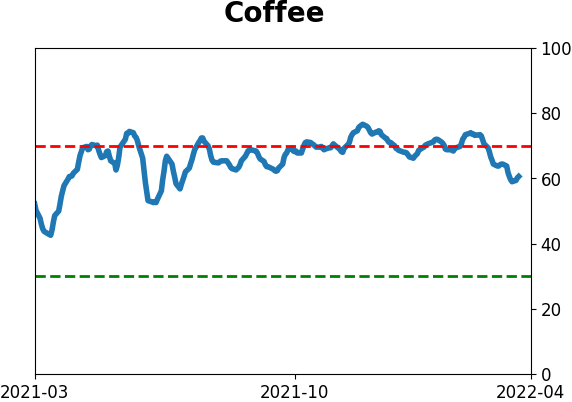
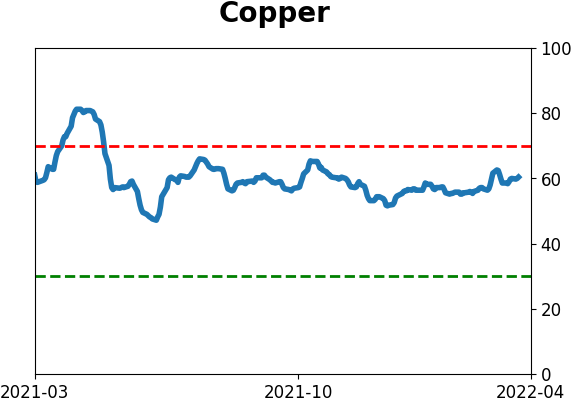
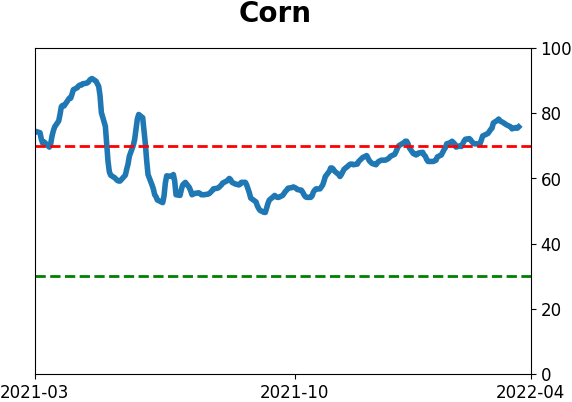
Optimism Index Thumbnails
|
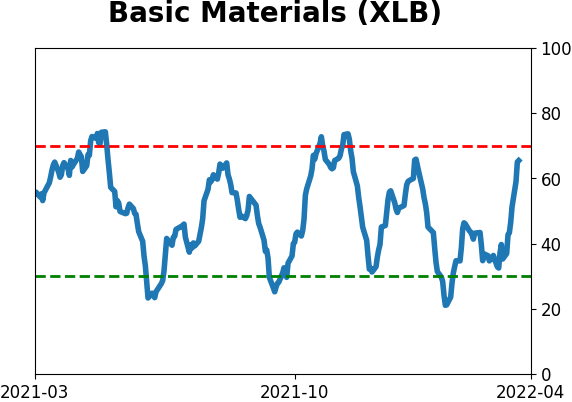
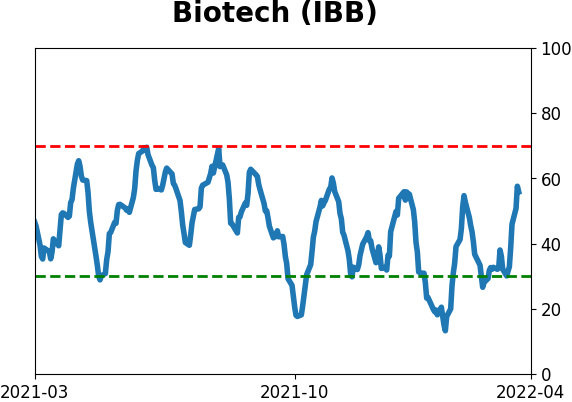
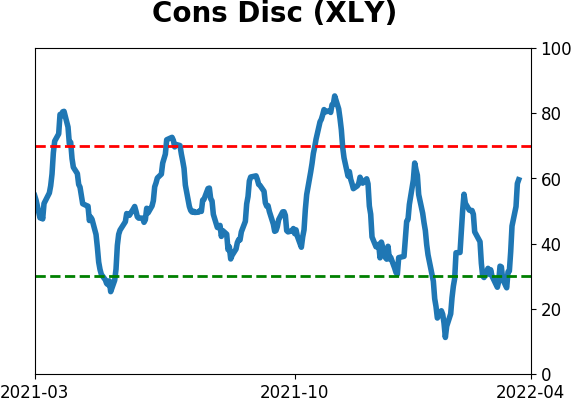
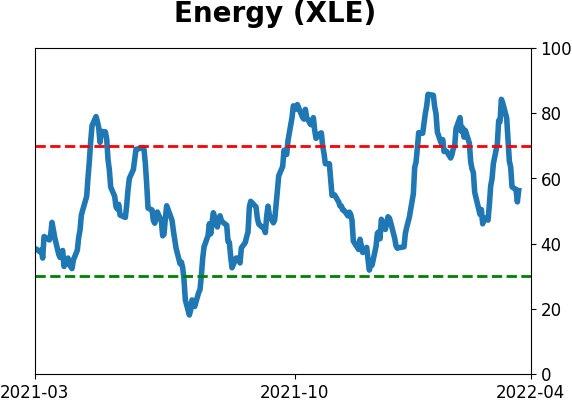
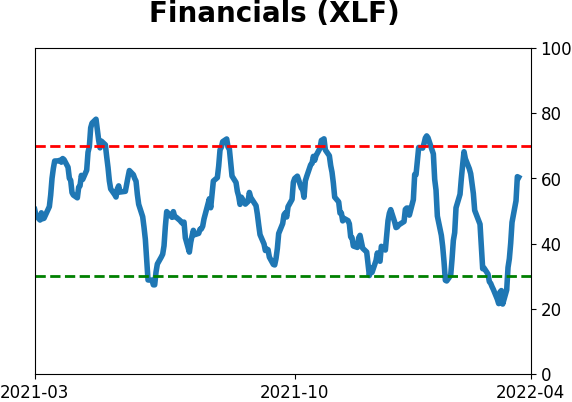
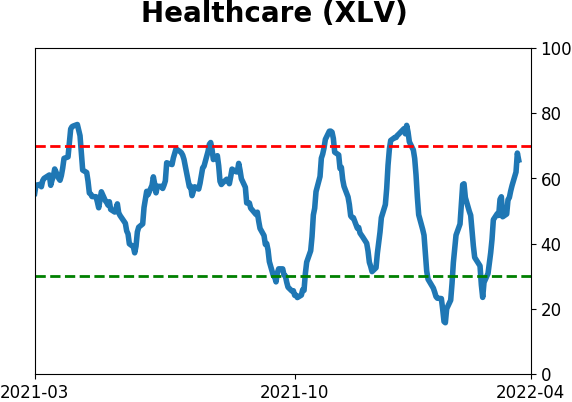
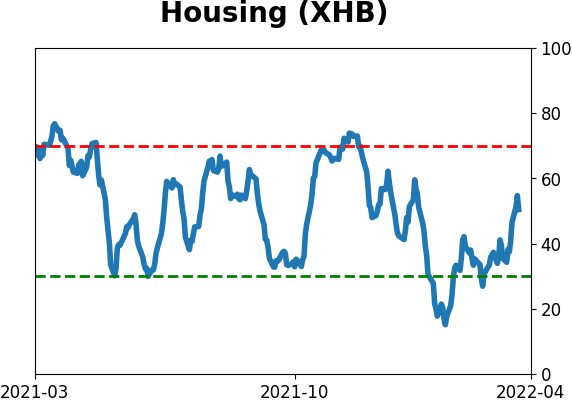
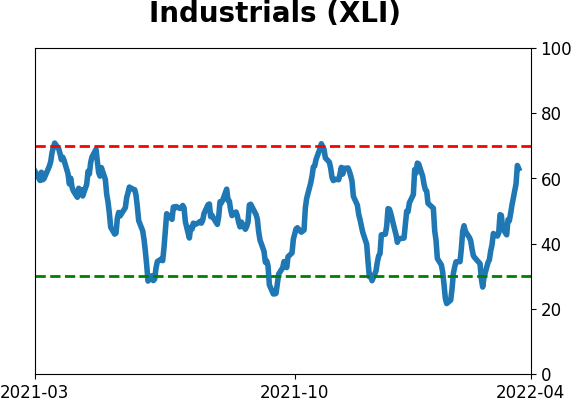
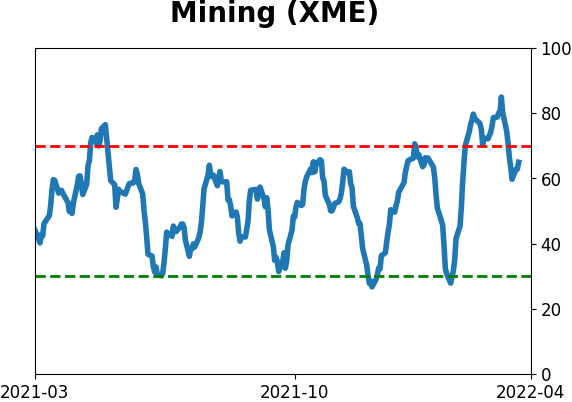
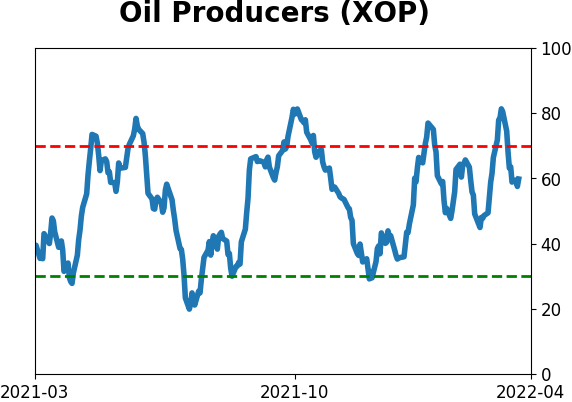
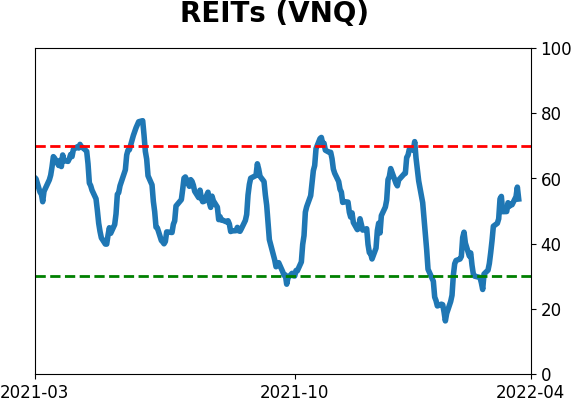
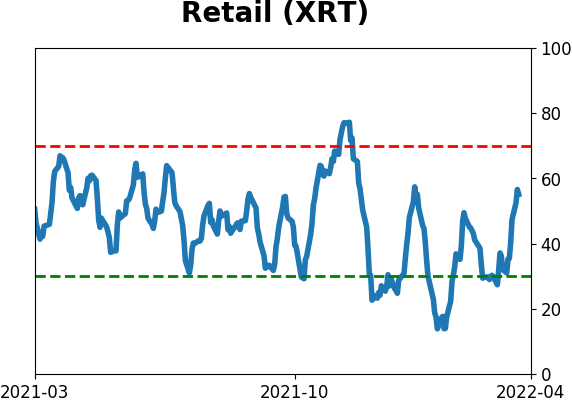
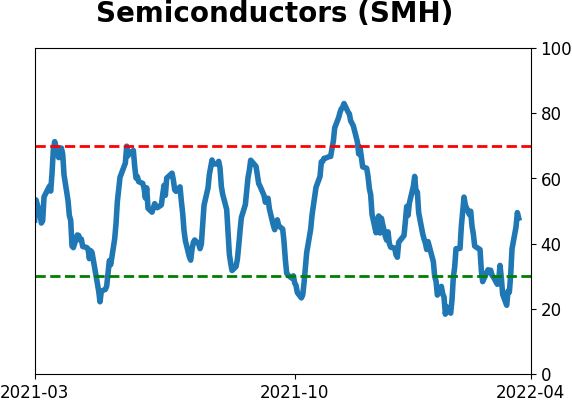
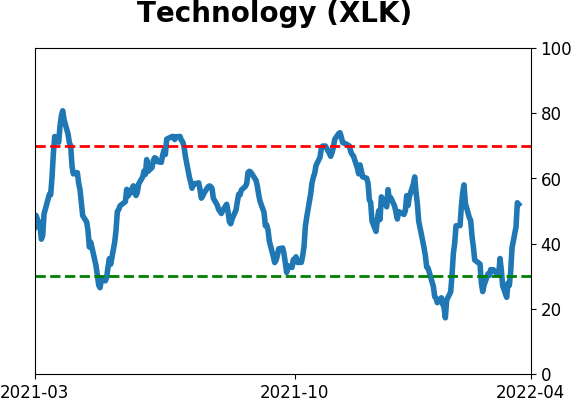
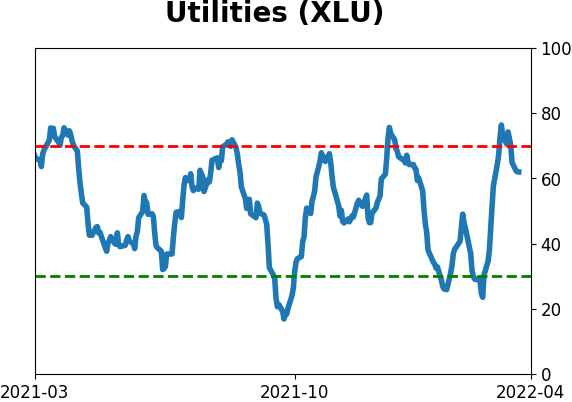
Sector ETF's - 10-Day Moving Average
|
|
|
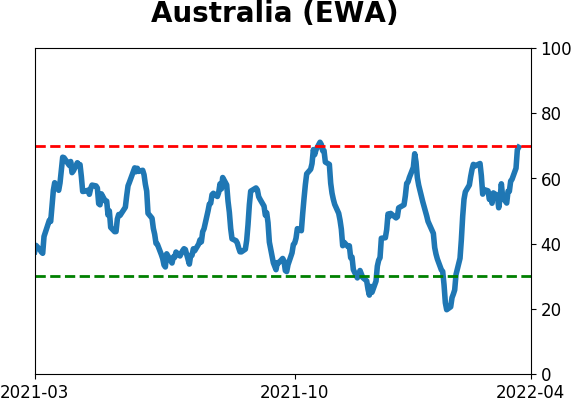
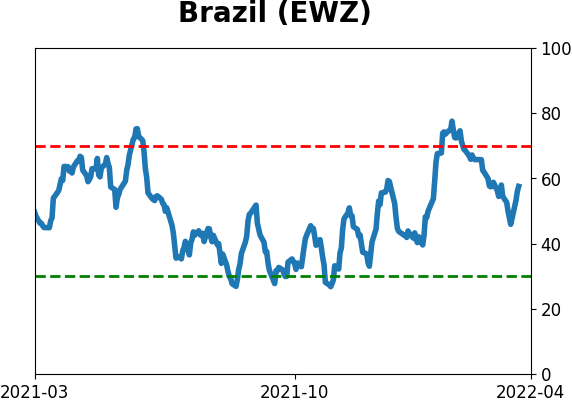
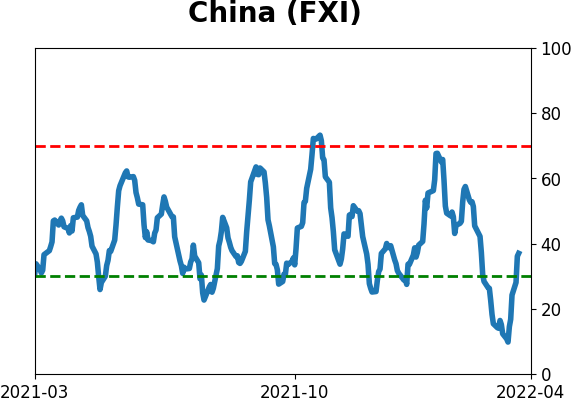
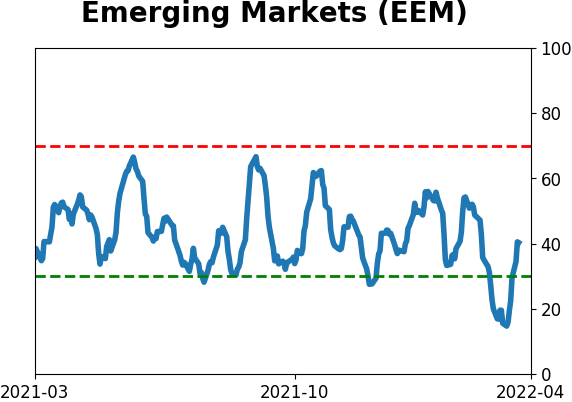
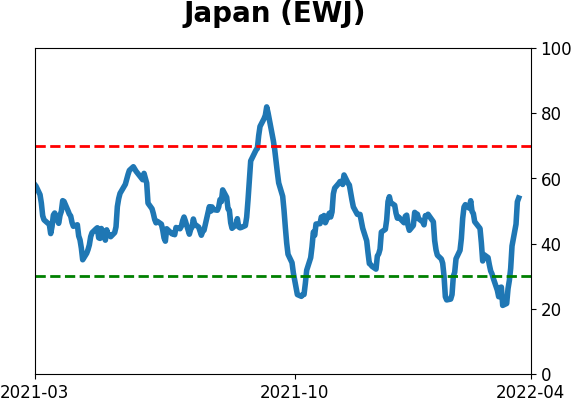
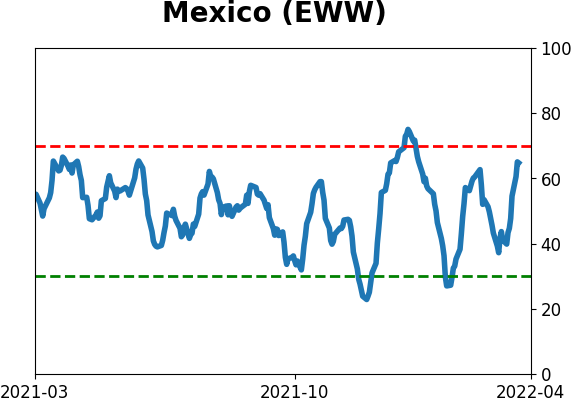
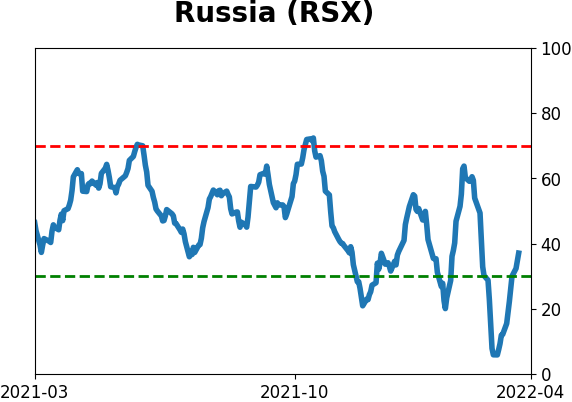
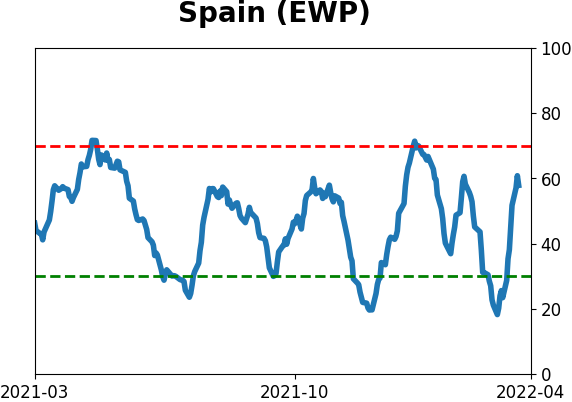
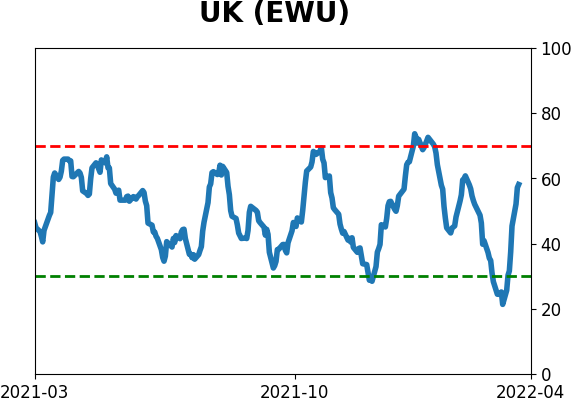
Country ETF's - 10-Day Moving Average
|
|
|
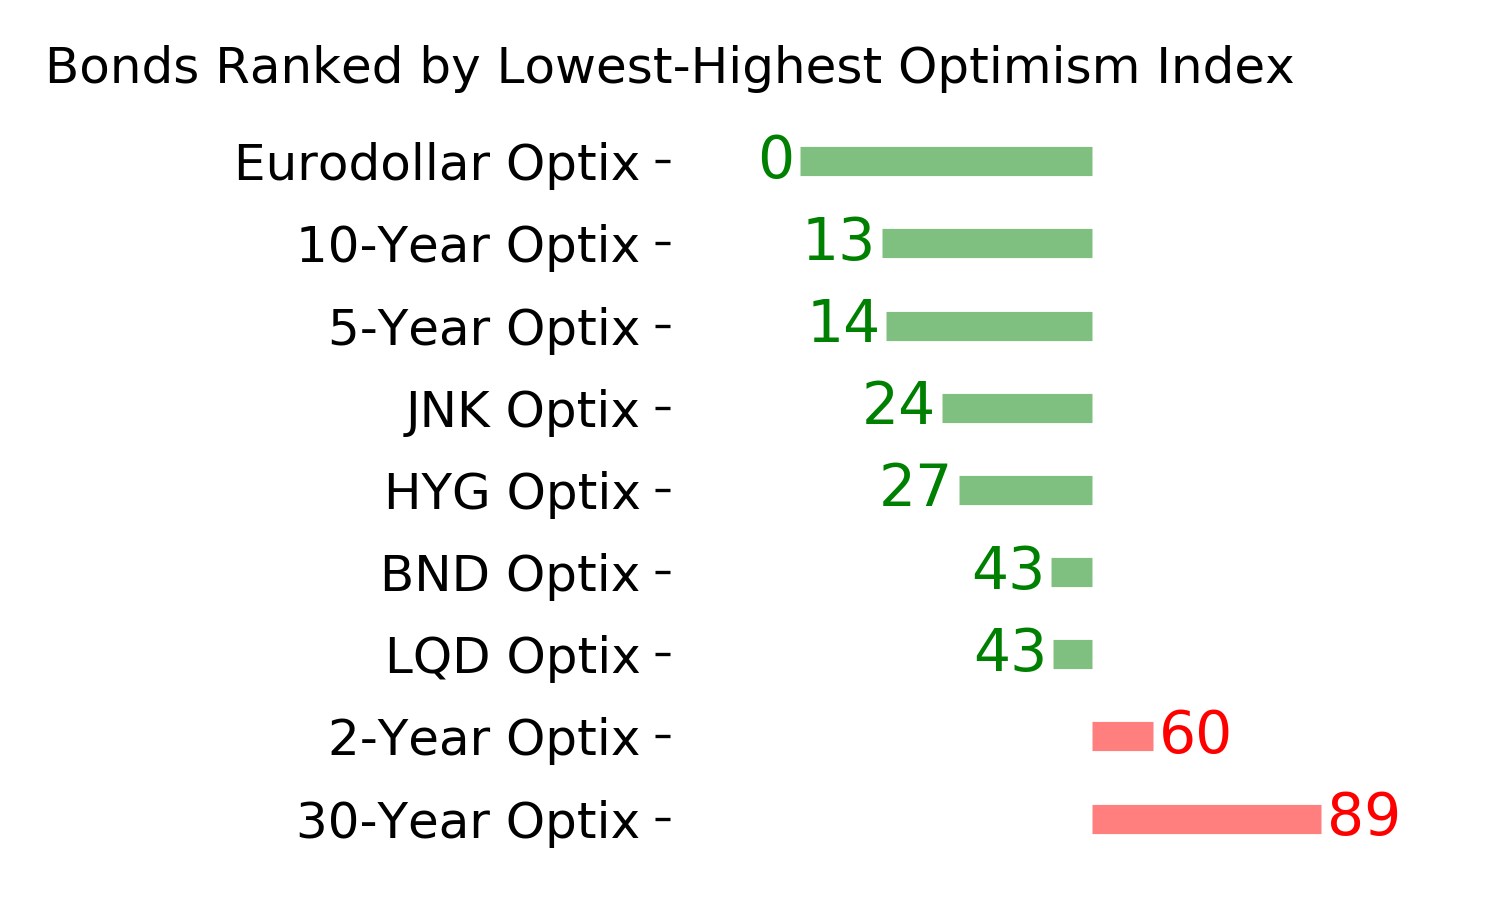
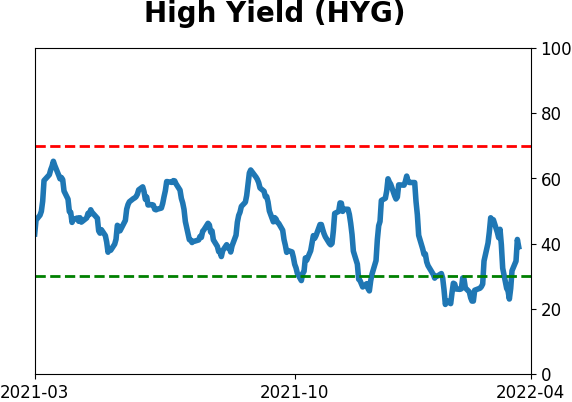
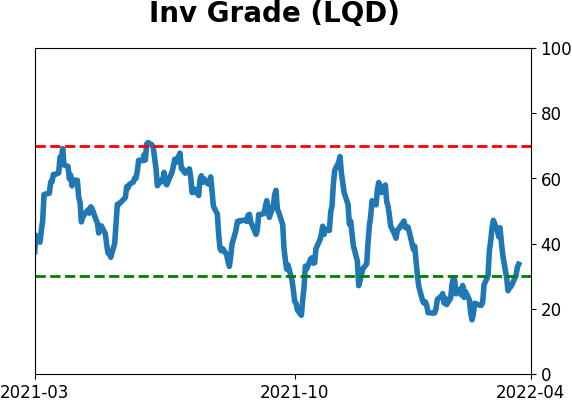
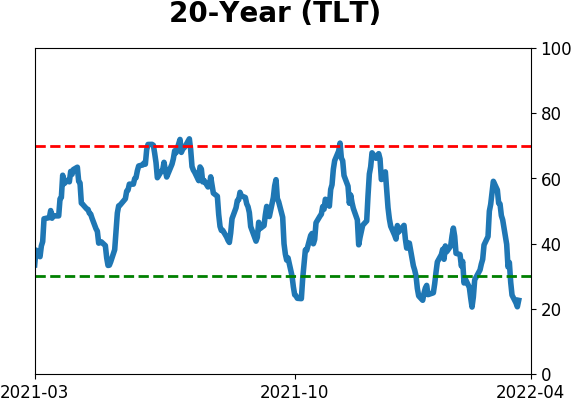
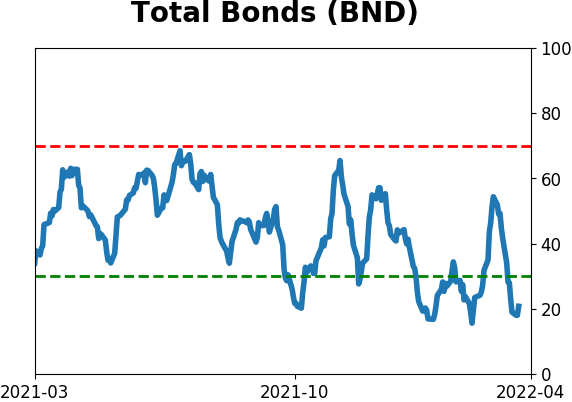
Bond ETF's - 10-Day Moving Average
|
|
|
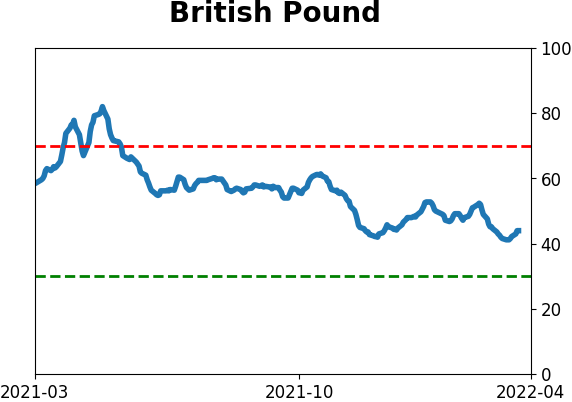
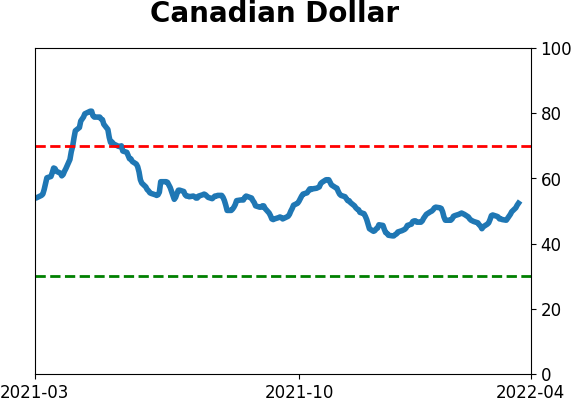
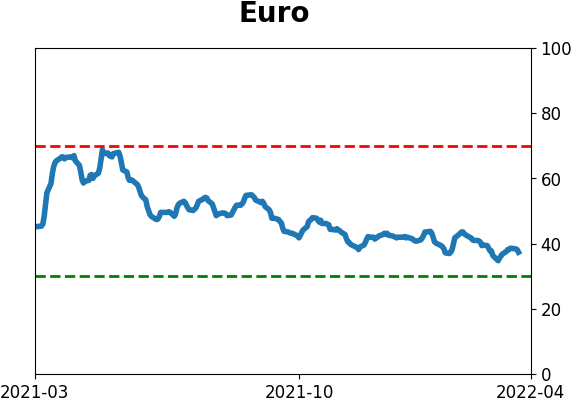
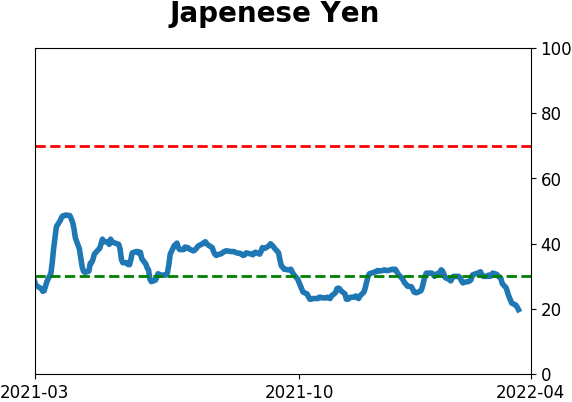
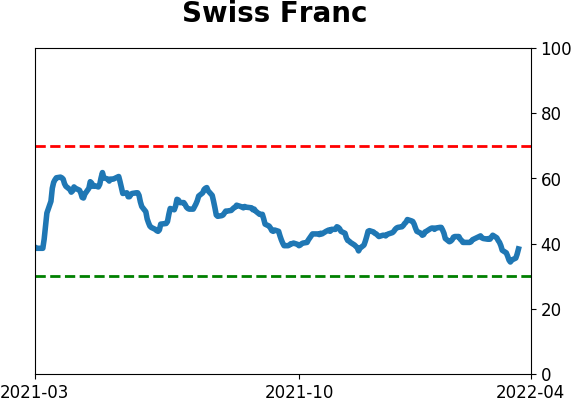
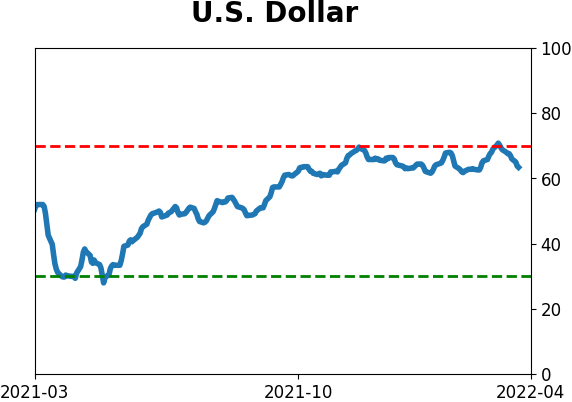
Currency ETF's - 5-Day Moving Average
|
|
|
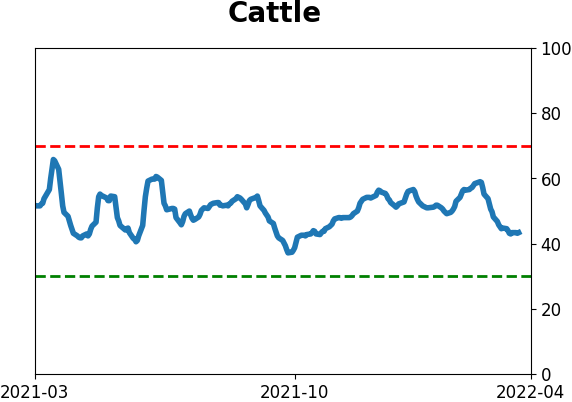
Commodity ETF's - 5-Day Moving Average
|
|