Headlines
|
|
The relative plunge in small cap stocks as a harbinger:
In a matter of weeks, the ratio of Small-Cap to Large-Cap stocks cratered from a 200-day high to a 200-day low. Such an abrupt about-face is considered a warning sign, but over the past five decades, in particular, it preceded gains for the S&P 500, the most-benchmarked index in the world.
|
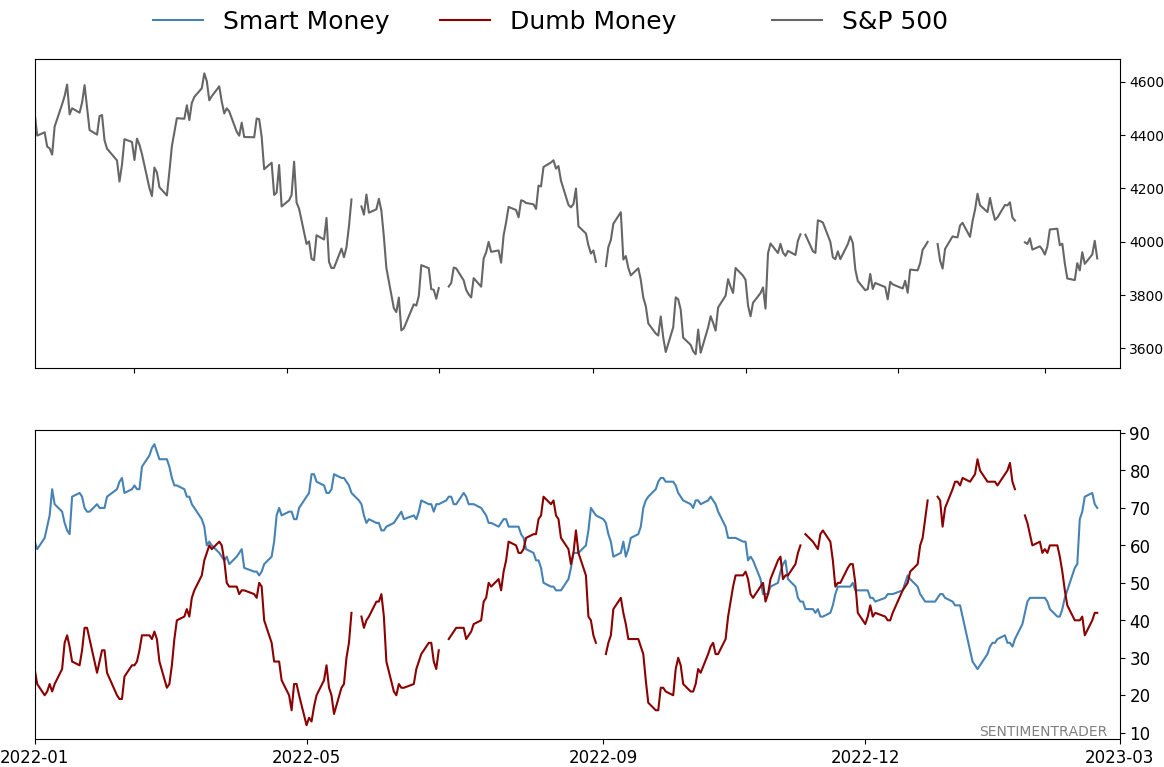
Smart / Dumb Money Confidence
|
Smart Money Confidence: 70%
Dumb Money Confidence: 42%
|
|
Risk Levels
Stocks Short-Term
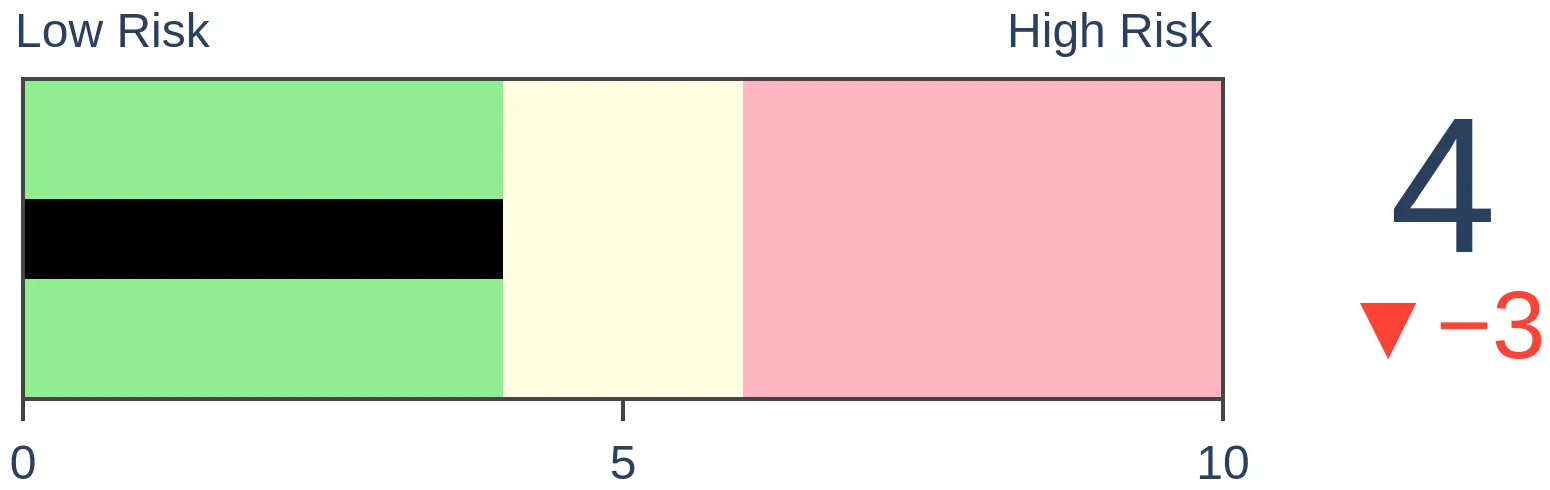
|
Stocks Medium-Term

|
|
Bonds
|
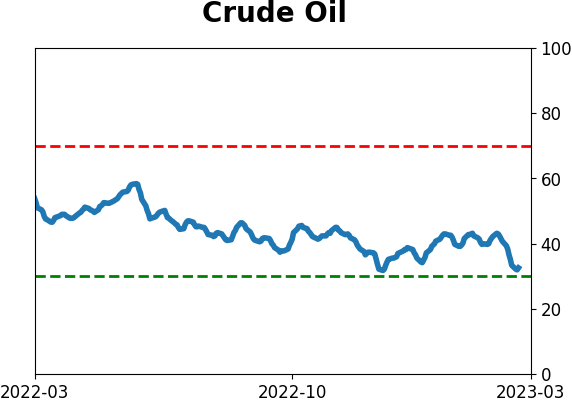
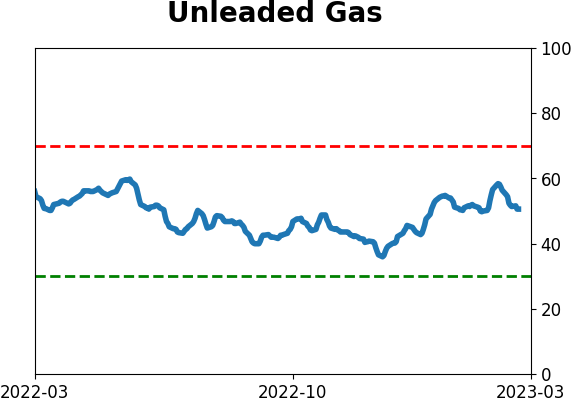
Crude Oil
|
|
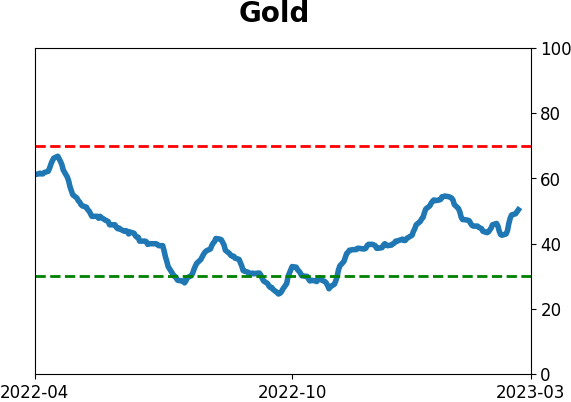
Gold
|
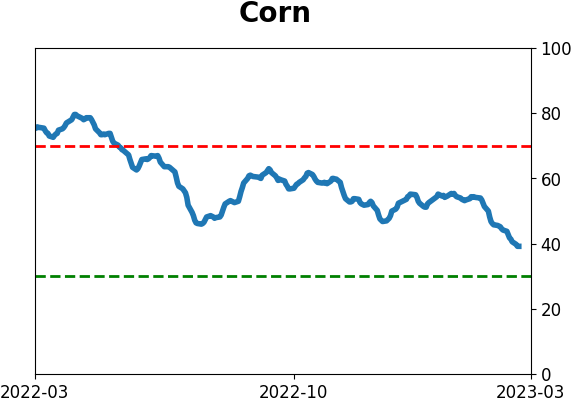
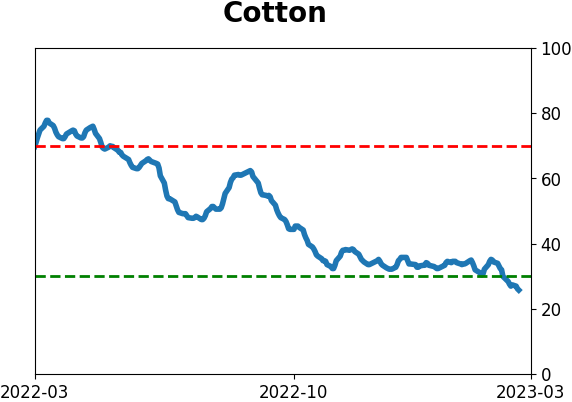
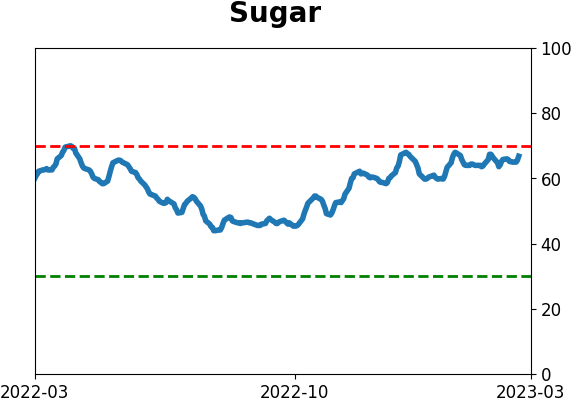
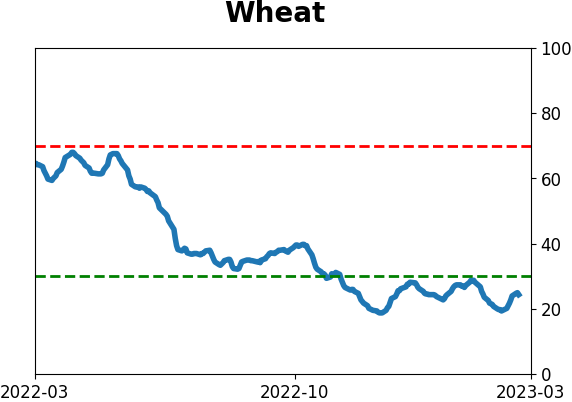
Agriculture

|
|
Research
By Jason Goepfert
BOTTOM LINE
In a matter of weeks, the ratio of Small-Cap to Large-Cap stocks cratered from a 200-day high to a 200-day low. Such an abrupt about-face is considered a warning sign, but over the past five decades, in particular, it preceded gains for the S&P 500, the most-benchmarked index in the world.
FORECAST / TIMEFRAME
None
|
Key points:
- The ratio of Small-Cap to Large-Cap stocks has cycled from a 200-day high to a 200-day low
- Underperforming small stocks is considered to be a warning sign for the economy and stocks in general
- Historically, cycles like this preceded further relative weakness for small stocks, but the S&P 500 did fine
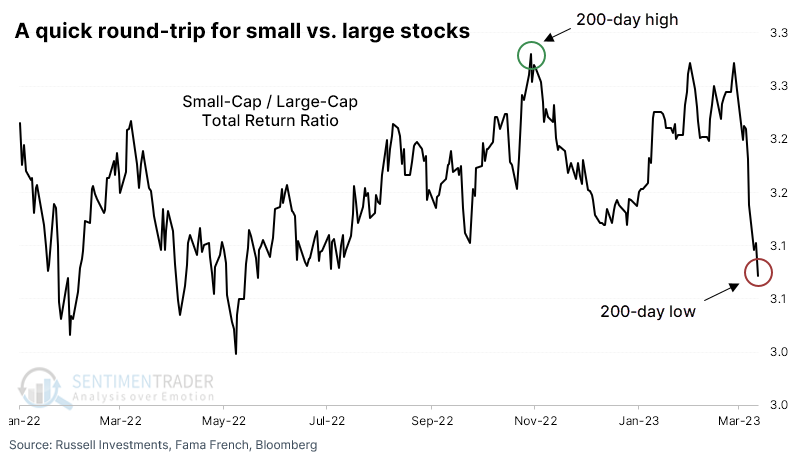
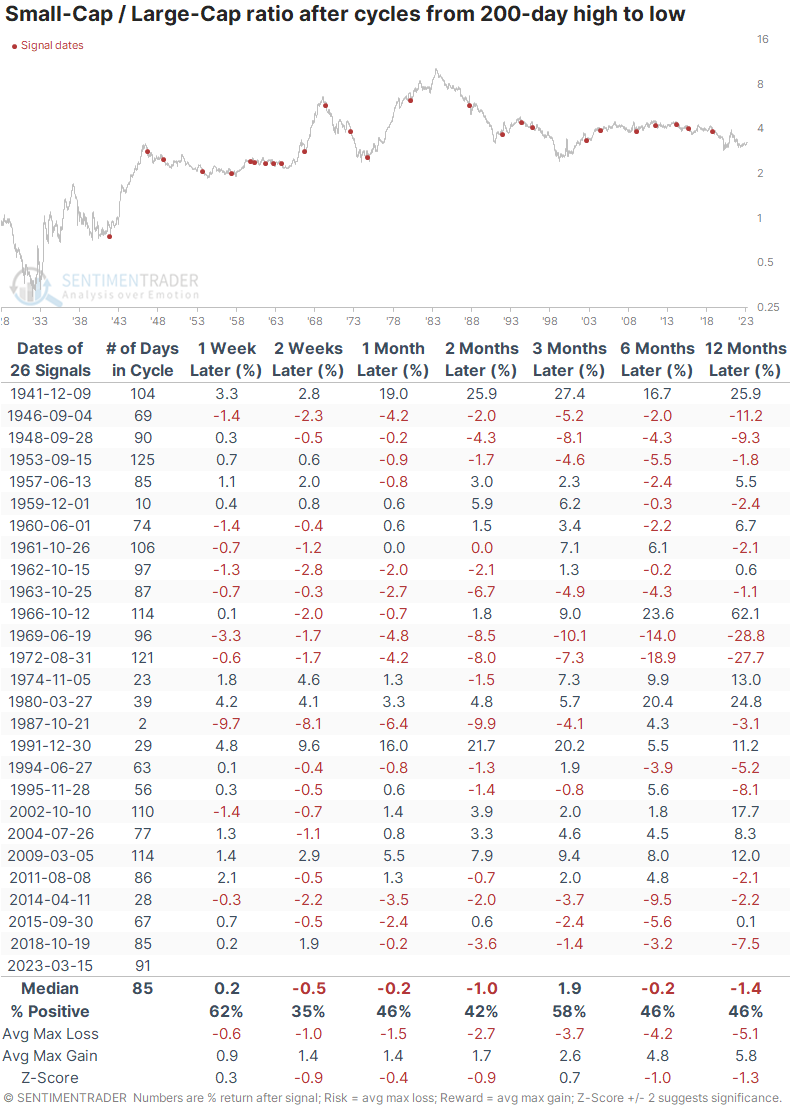
The ratio of Small-Caps to Large-Caps has made an abrupt about-face
Small-caps have been hammered in recent weeks, thanks partly to struggling Financial stocks. Investors have gathered in some of the largest-cap stocks as a sort of haven, sending the ratio between the two factors on a while ride.
The ratio had nearly exceeded its 200-day high just a few short weeks ago, and now it's mired at the lowest level in more than 200 days.
Analysts tend to read a lot into this ratio, assuming that if small stocks struggle against their bigger brethren, it bodes ill for the economy and, thus, the stock market.
There is some evidence that it at least tends to precede more weakness for smaller stocks versus larger ones. After other times the ratio cycled from a 200-day high to a 200-day low, small stocks underperformed most of the time over the next couple of months.
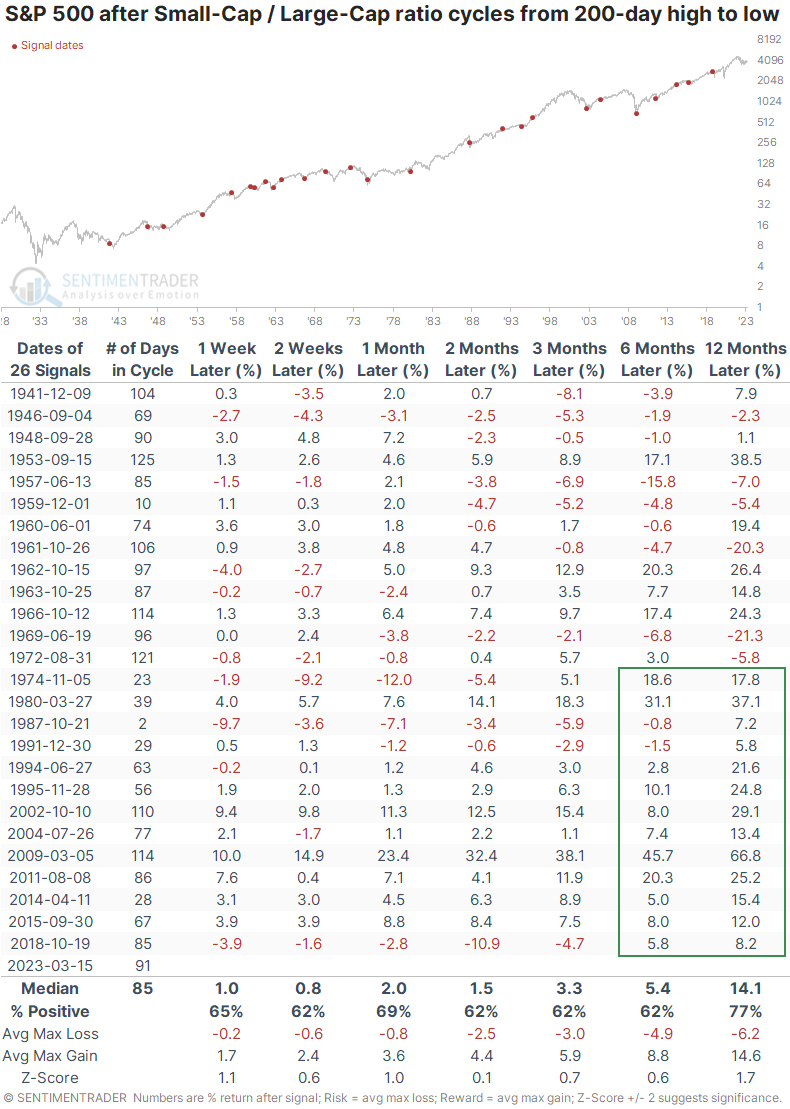
As an indicator for the S&P 500, the most benchmarked index in the world, it wasn't a very accurate warning. The S&P rose more than 60% of the time across all time frames, which isn't great given the long-term upward bias. Its average return was only modestly above random, and the risk versus reward was nothing special.
On the plus side, losses tended to be pretty limited, at least over the medium term, and three months later, there were no double-digit losses. Over the past 50 years, these signals almost exclusively preceded gains over the next 6-12 months.
What the research tells us...
The absolute collapse of Small-Cap stocks relative to Large-Caps is a cause for concern for many. While it has been a decent signal that smaller stocks may continue to underperform larger ones, it leaves much to be desired as a market environment signal. If anything, in recent decades, this kind of behavior has preceded above-average returns and with good consistency. It does not appear effective as a warning for the economy or, more clearly, the most benchmarked index in the world.
Indicators at Extremes
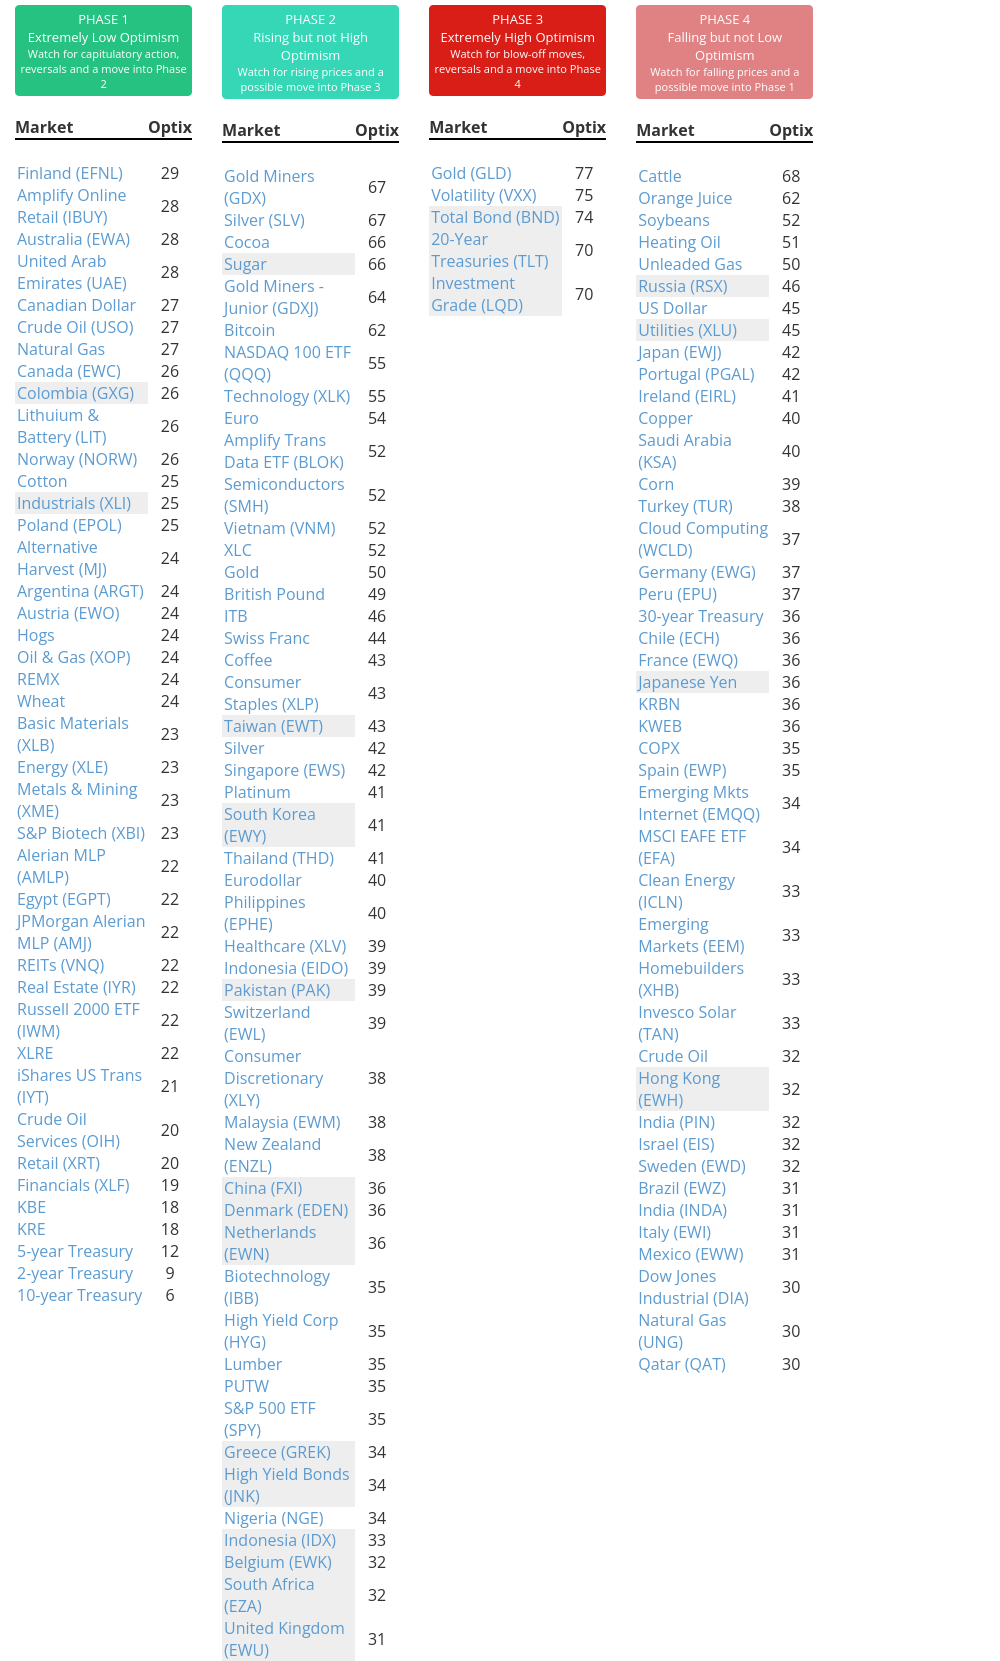
Phase Table
Ranks
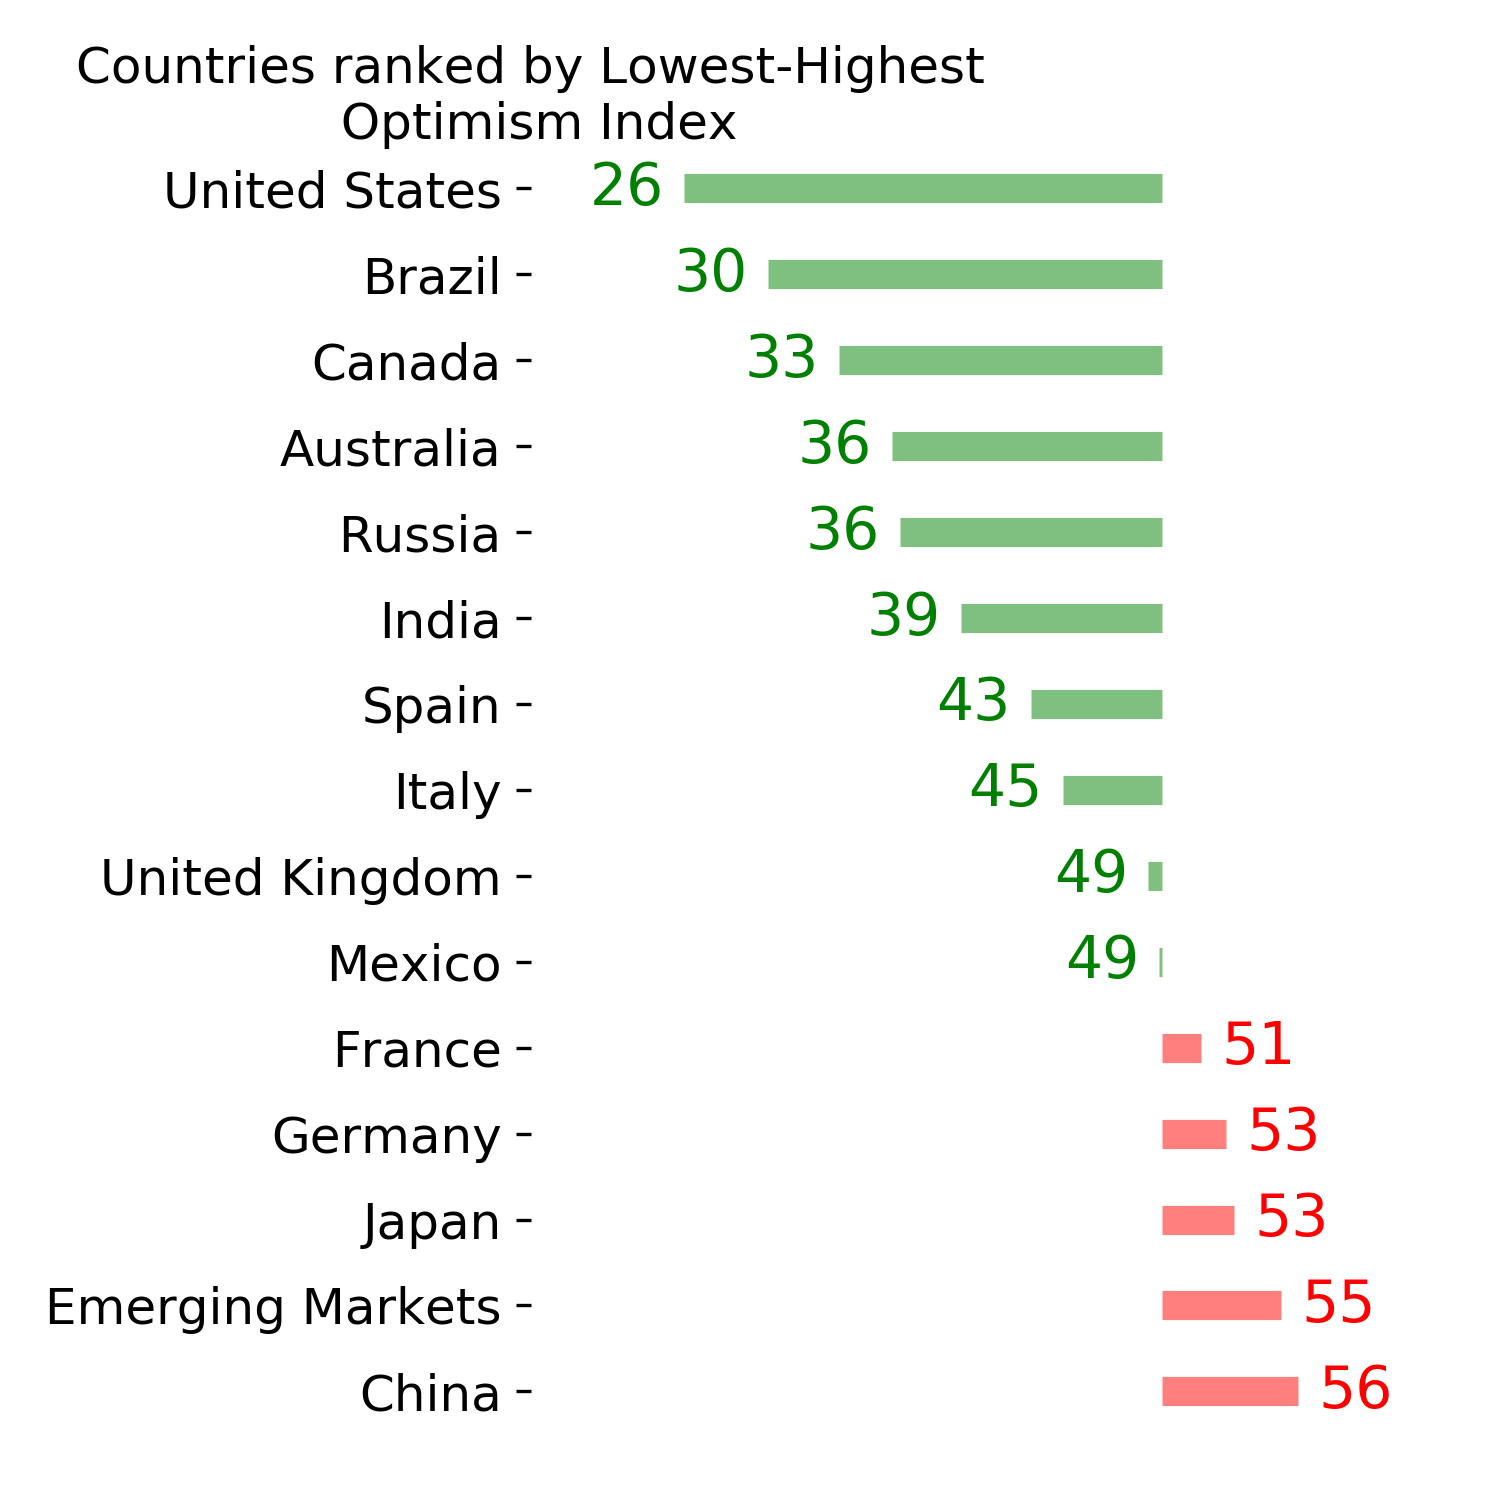
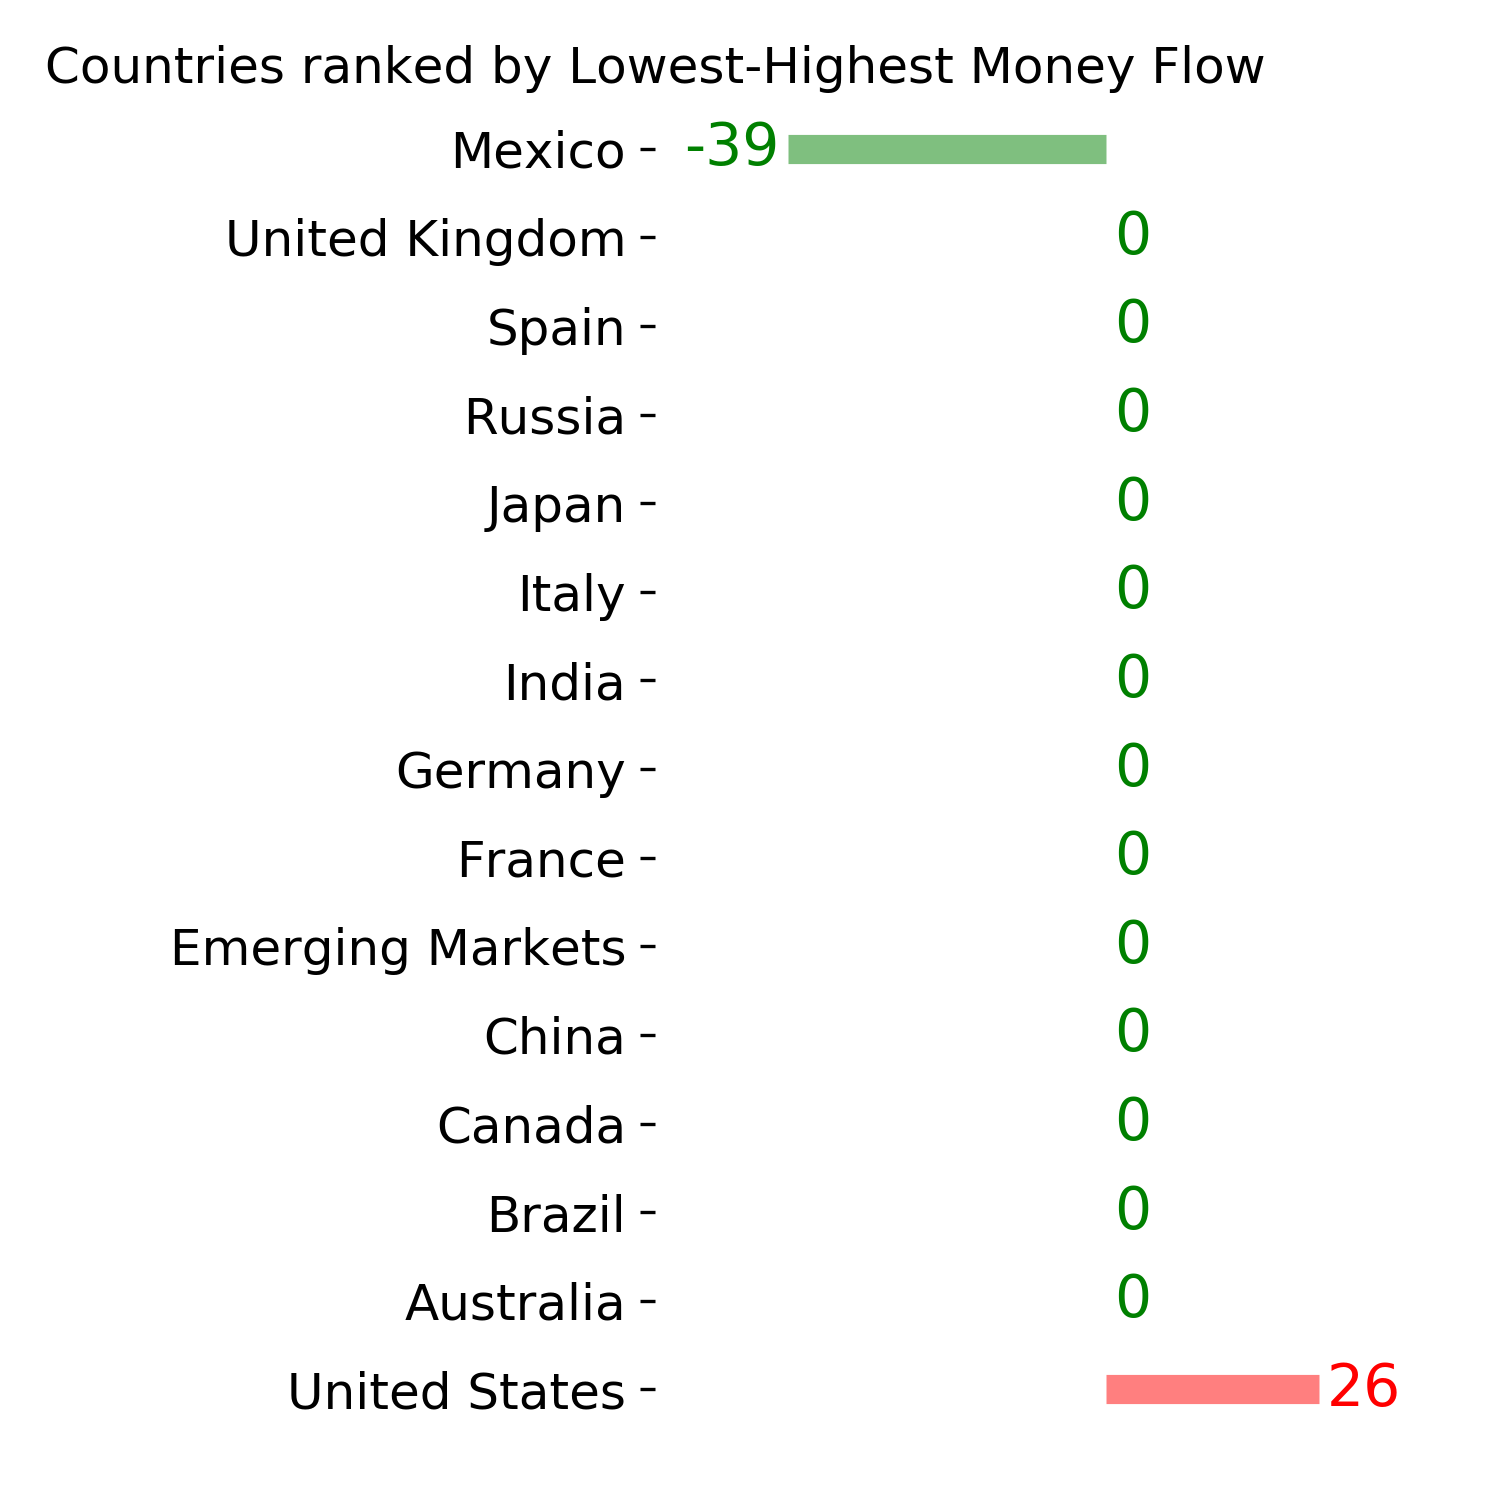
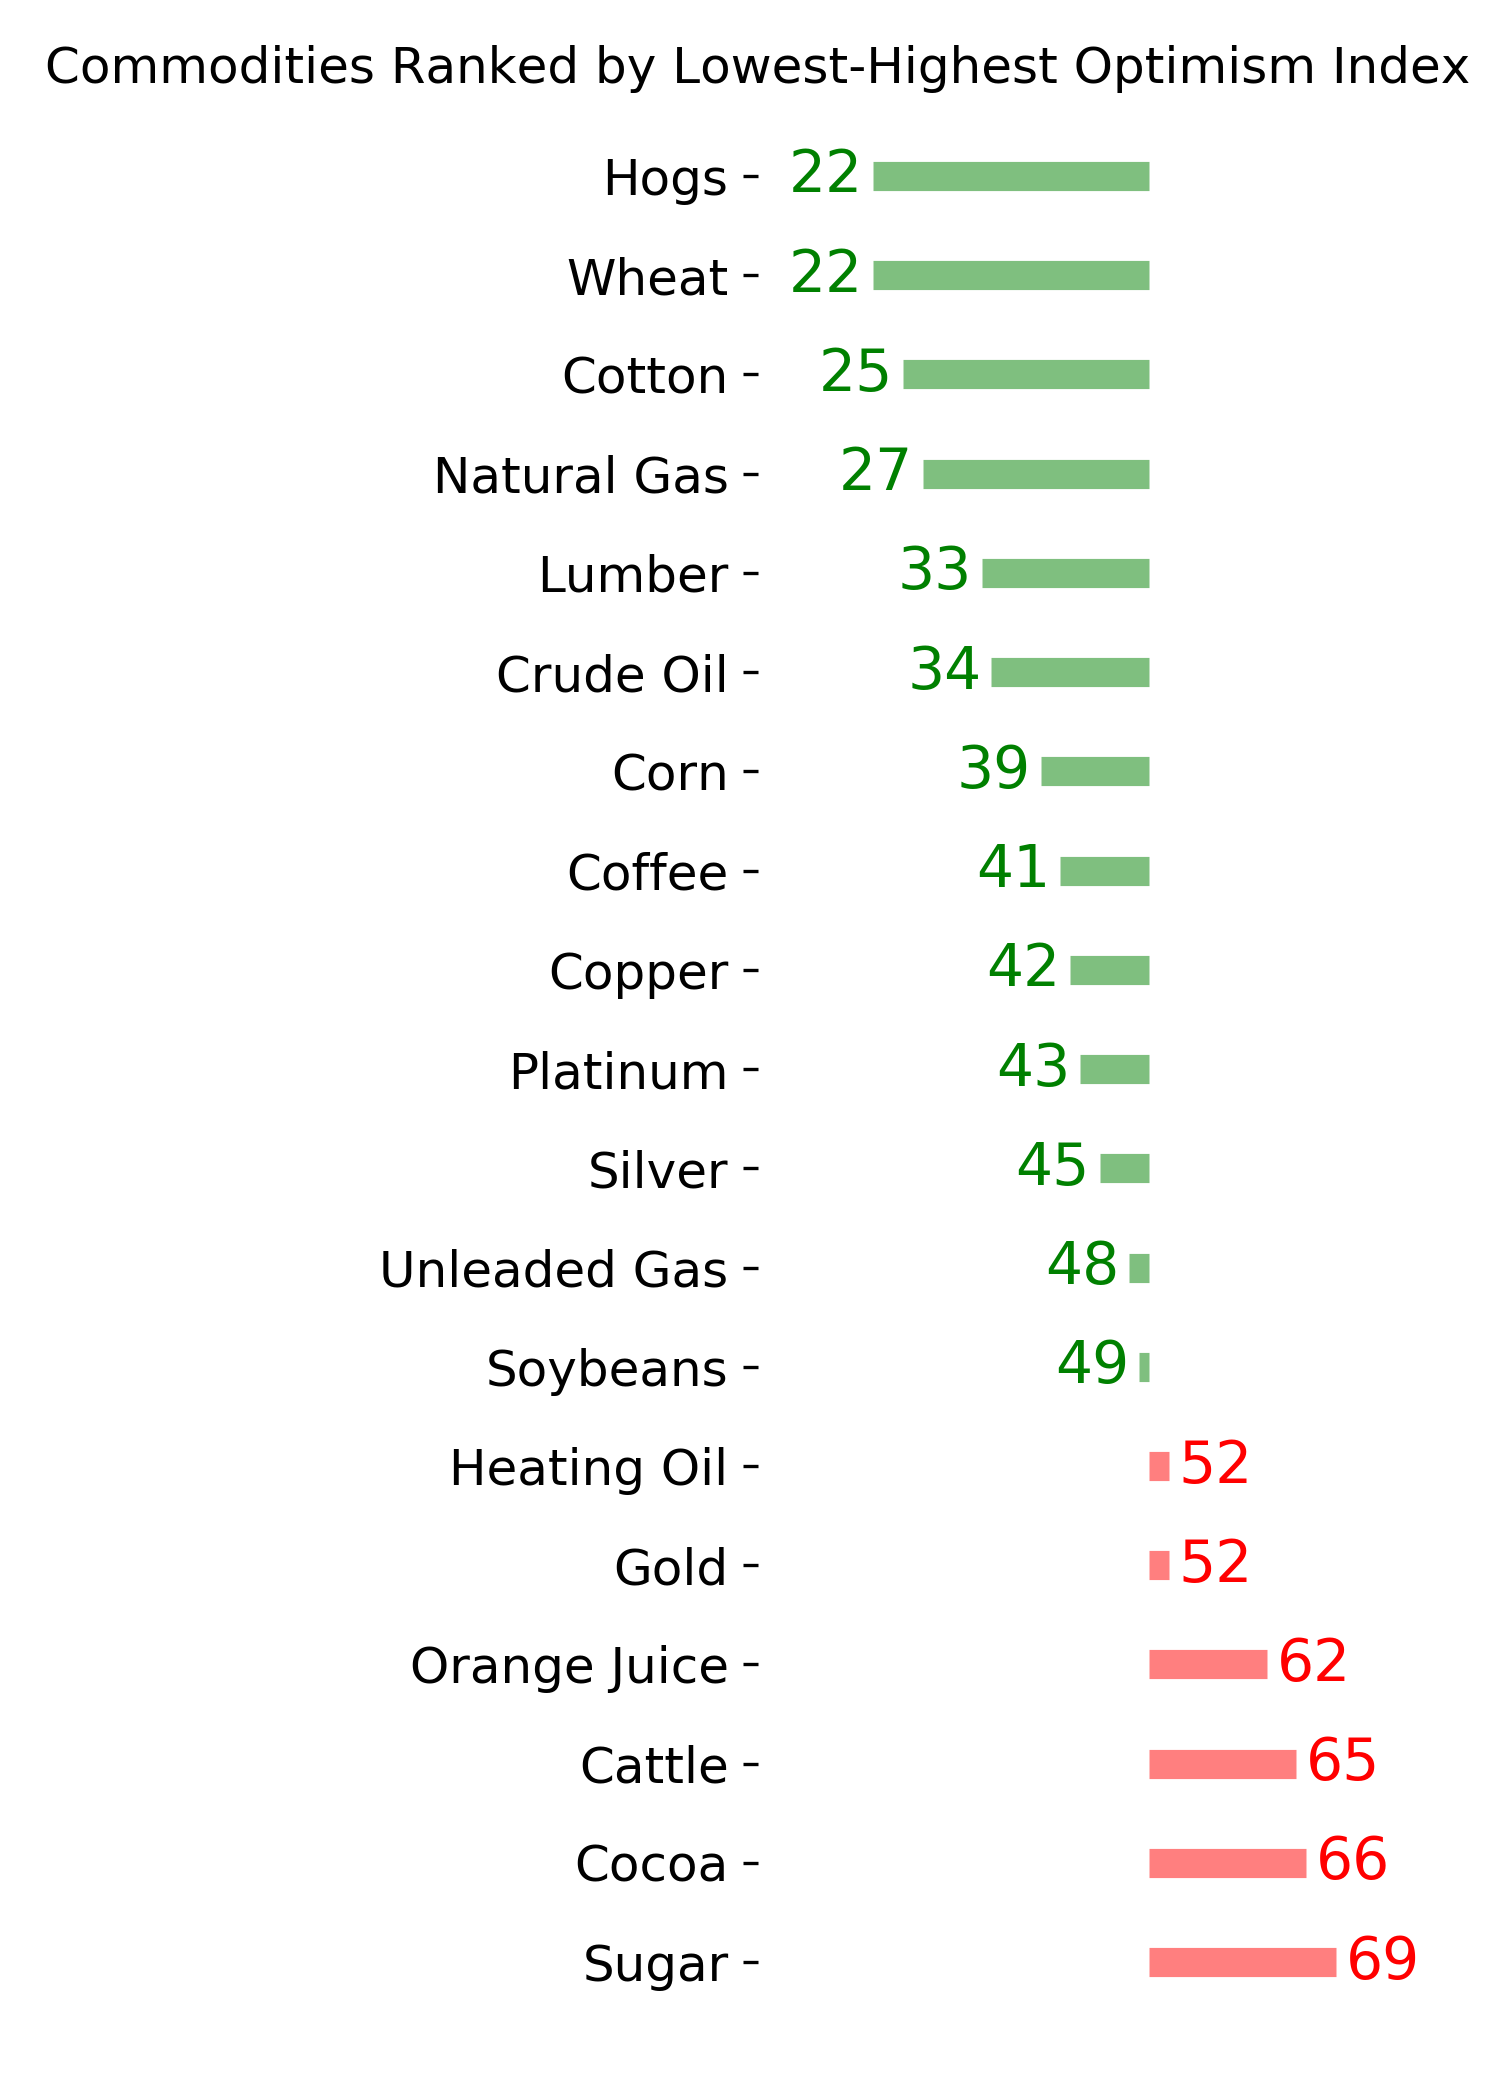
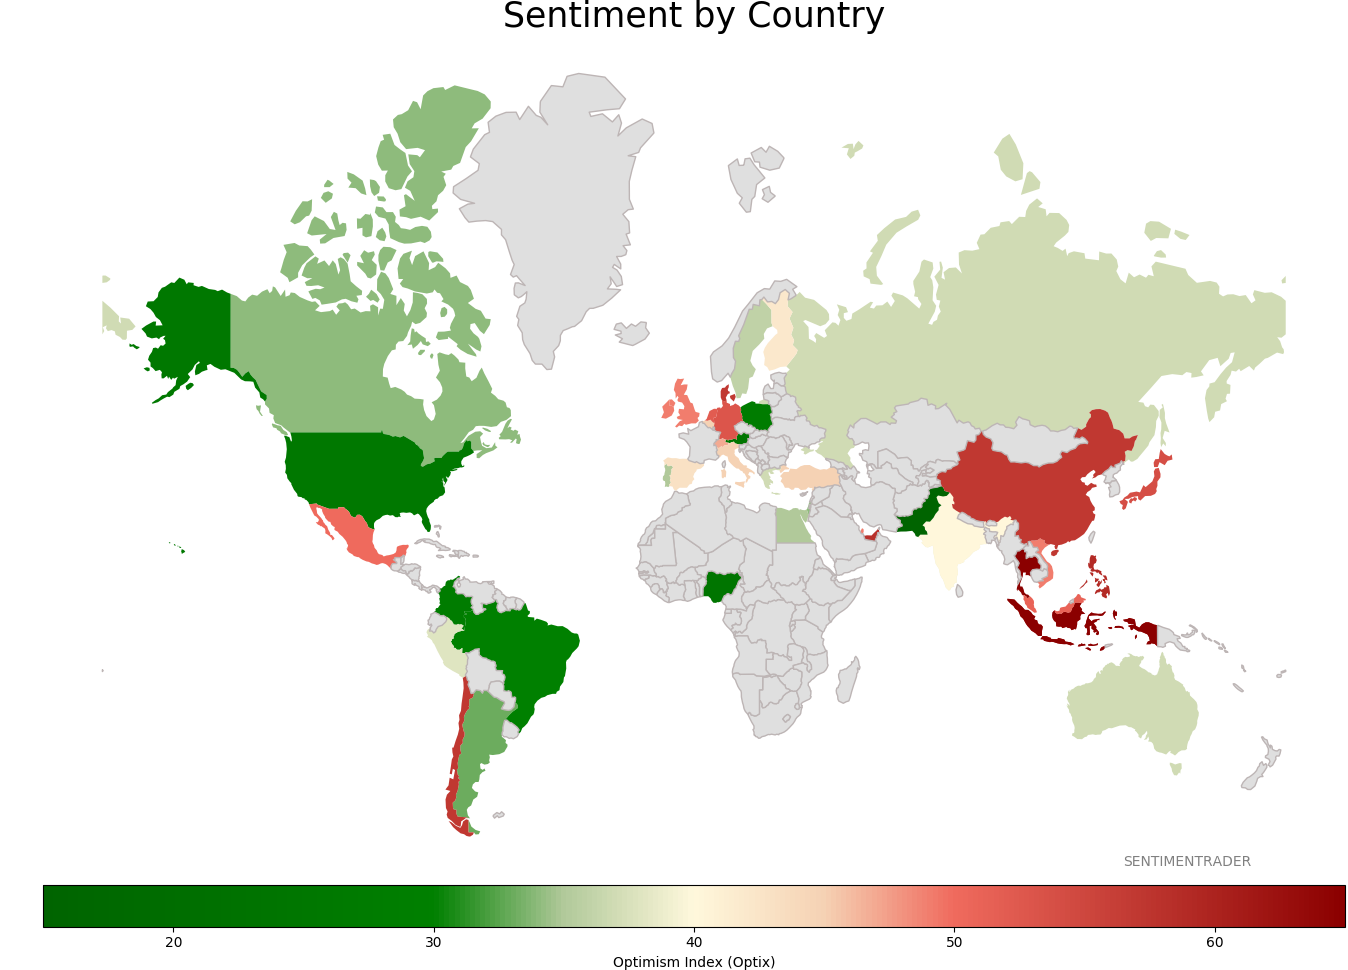
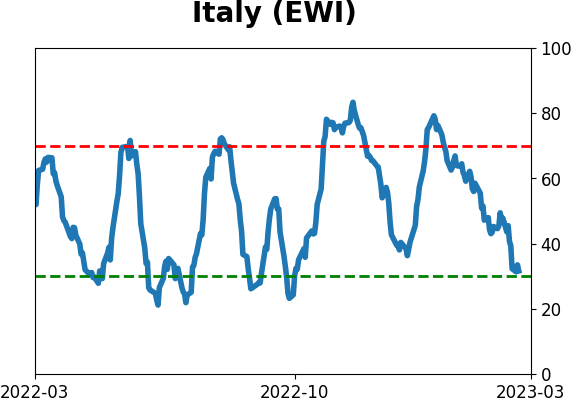
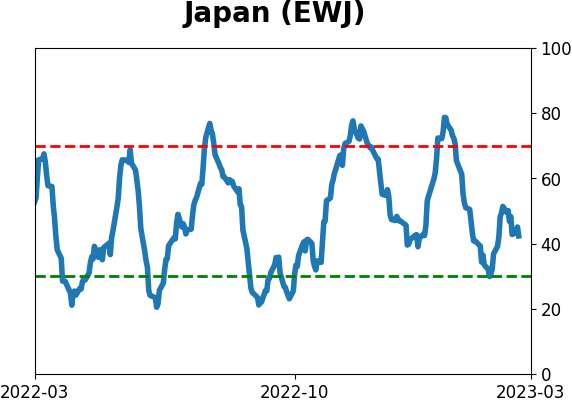
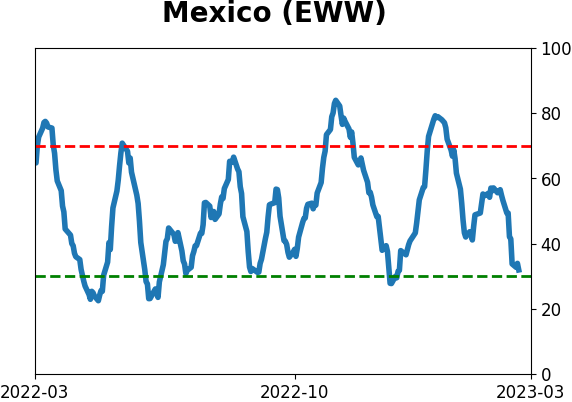
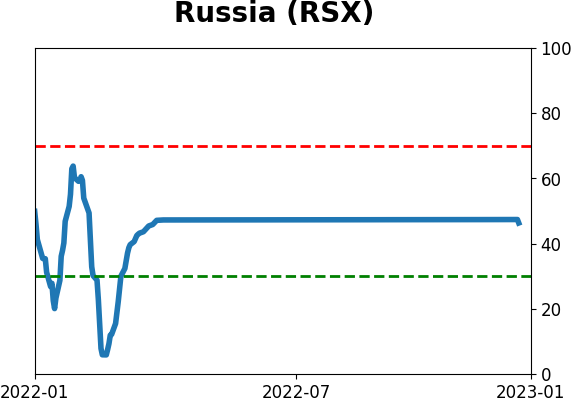
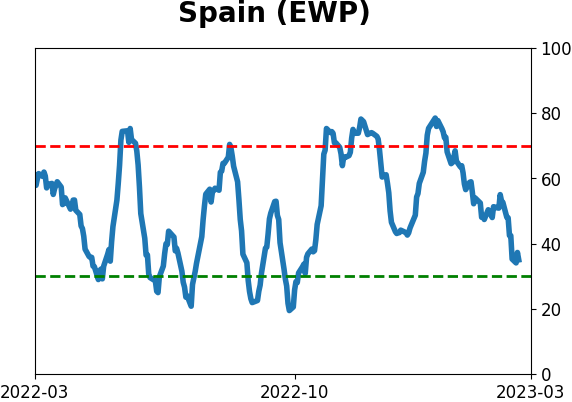
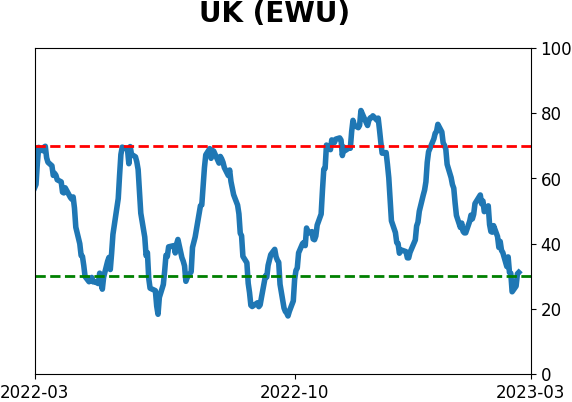
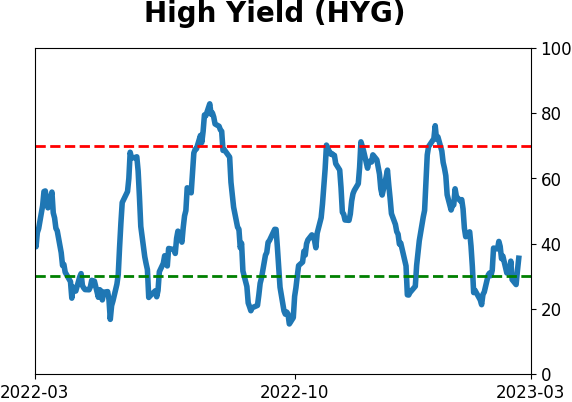
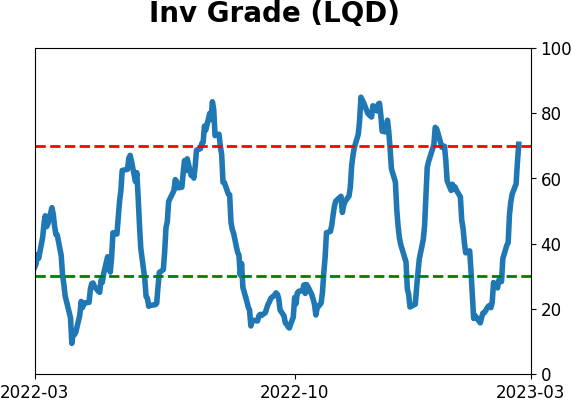
Sentiment Around The World
Optimism Index Thumbnails
|
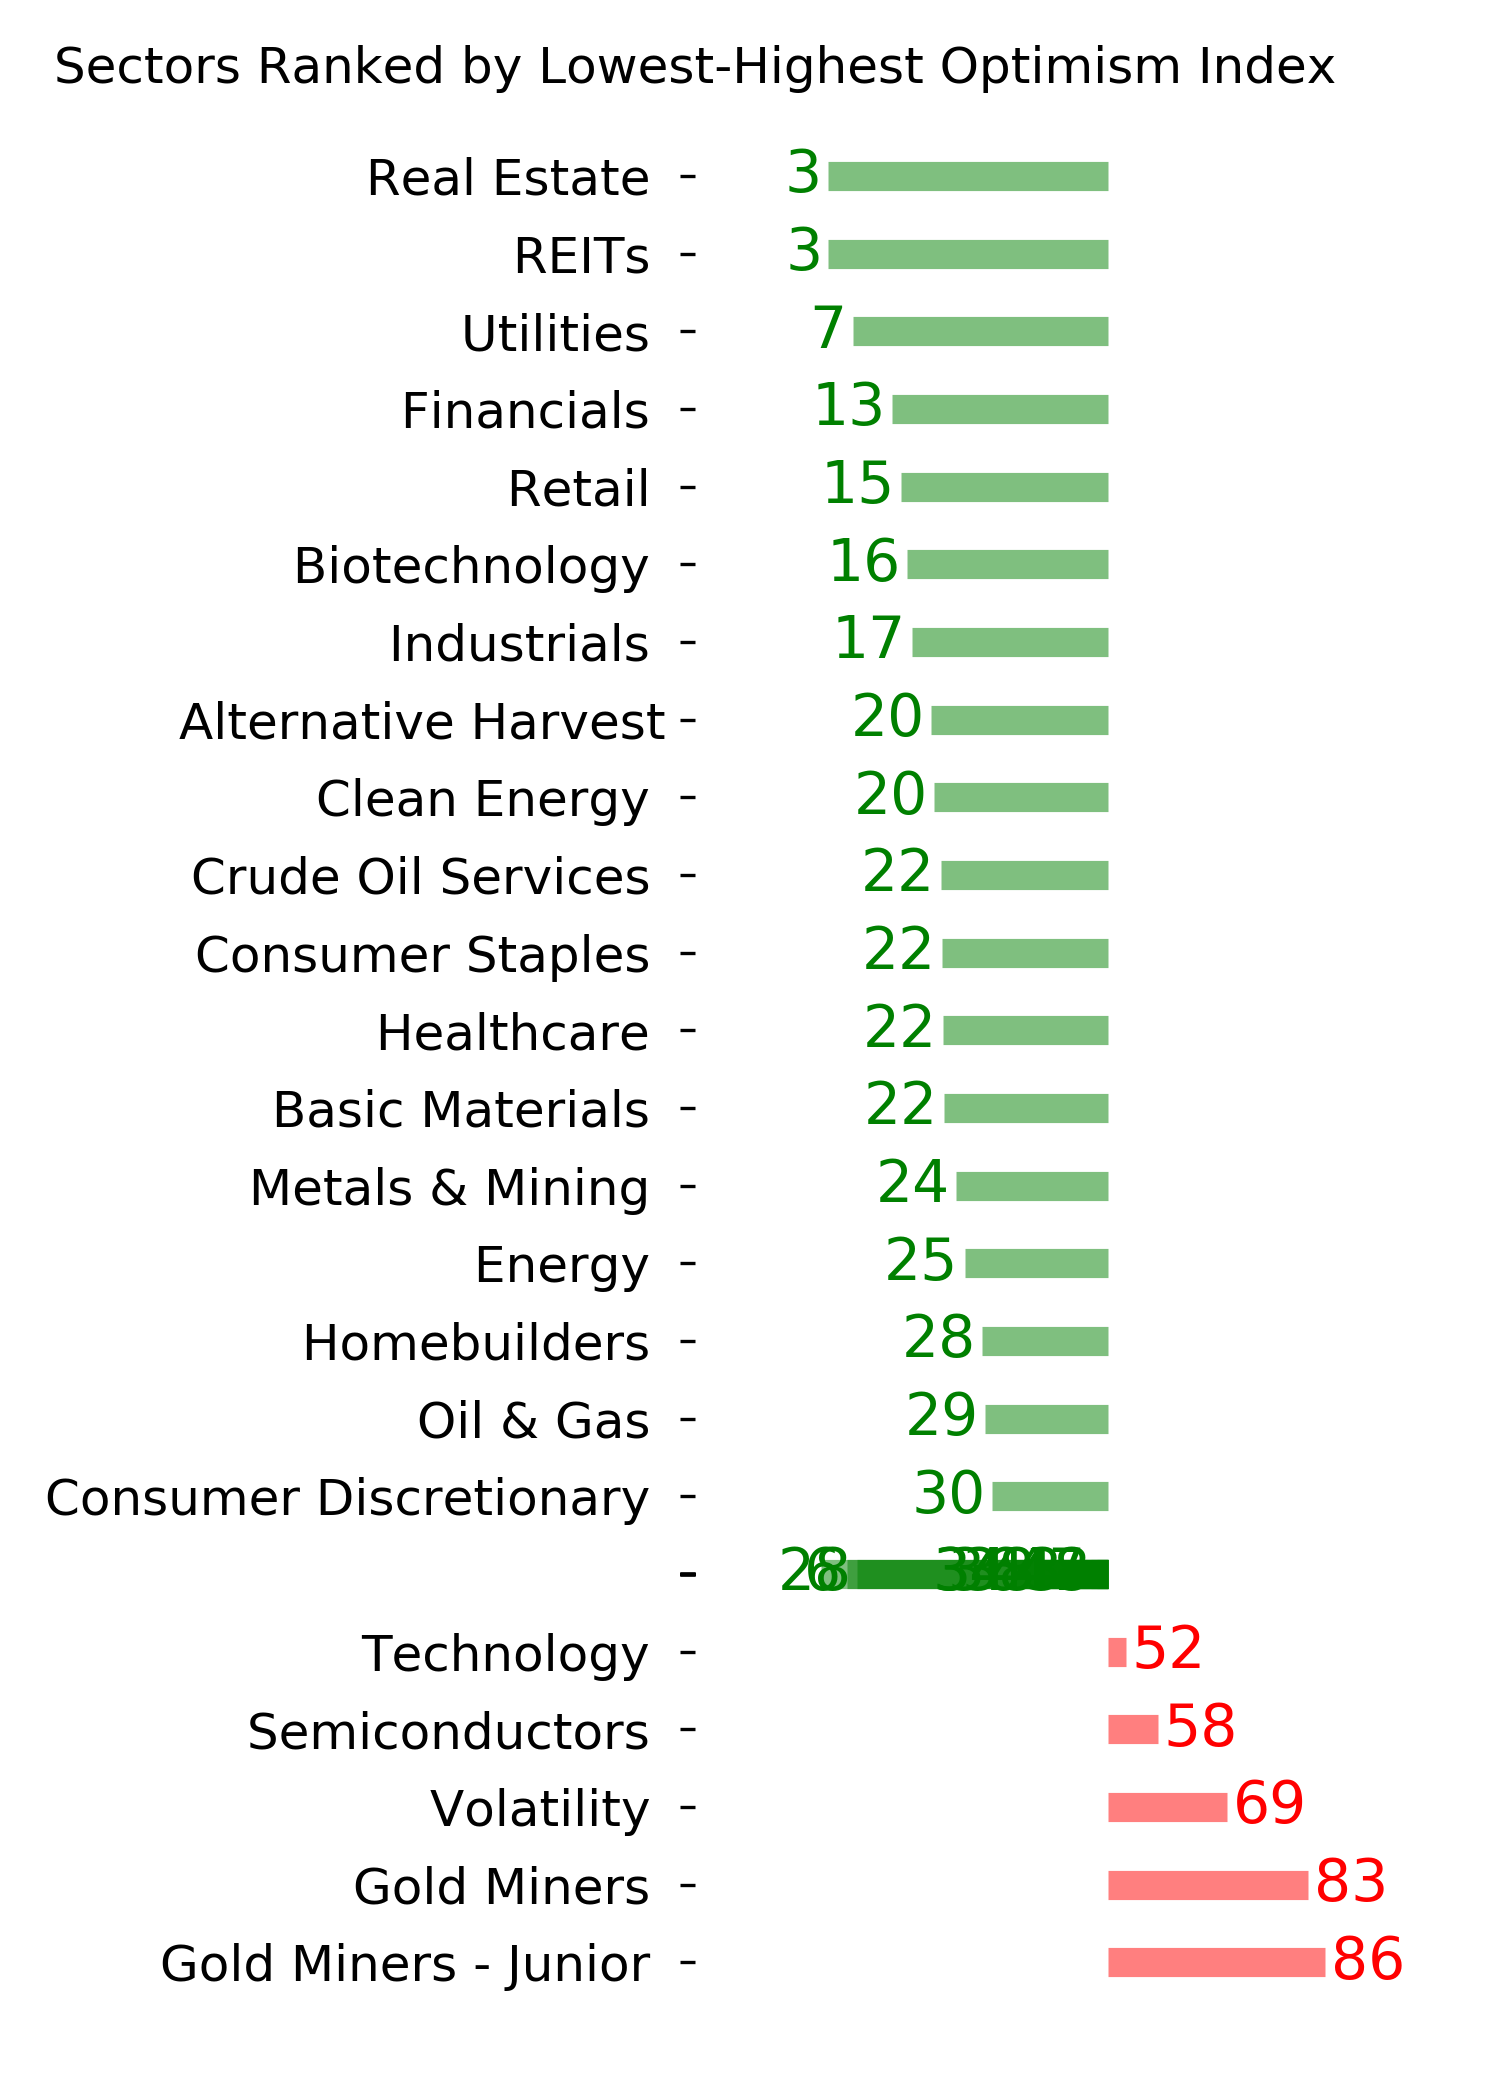
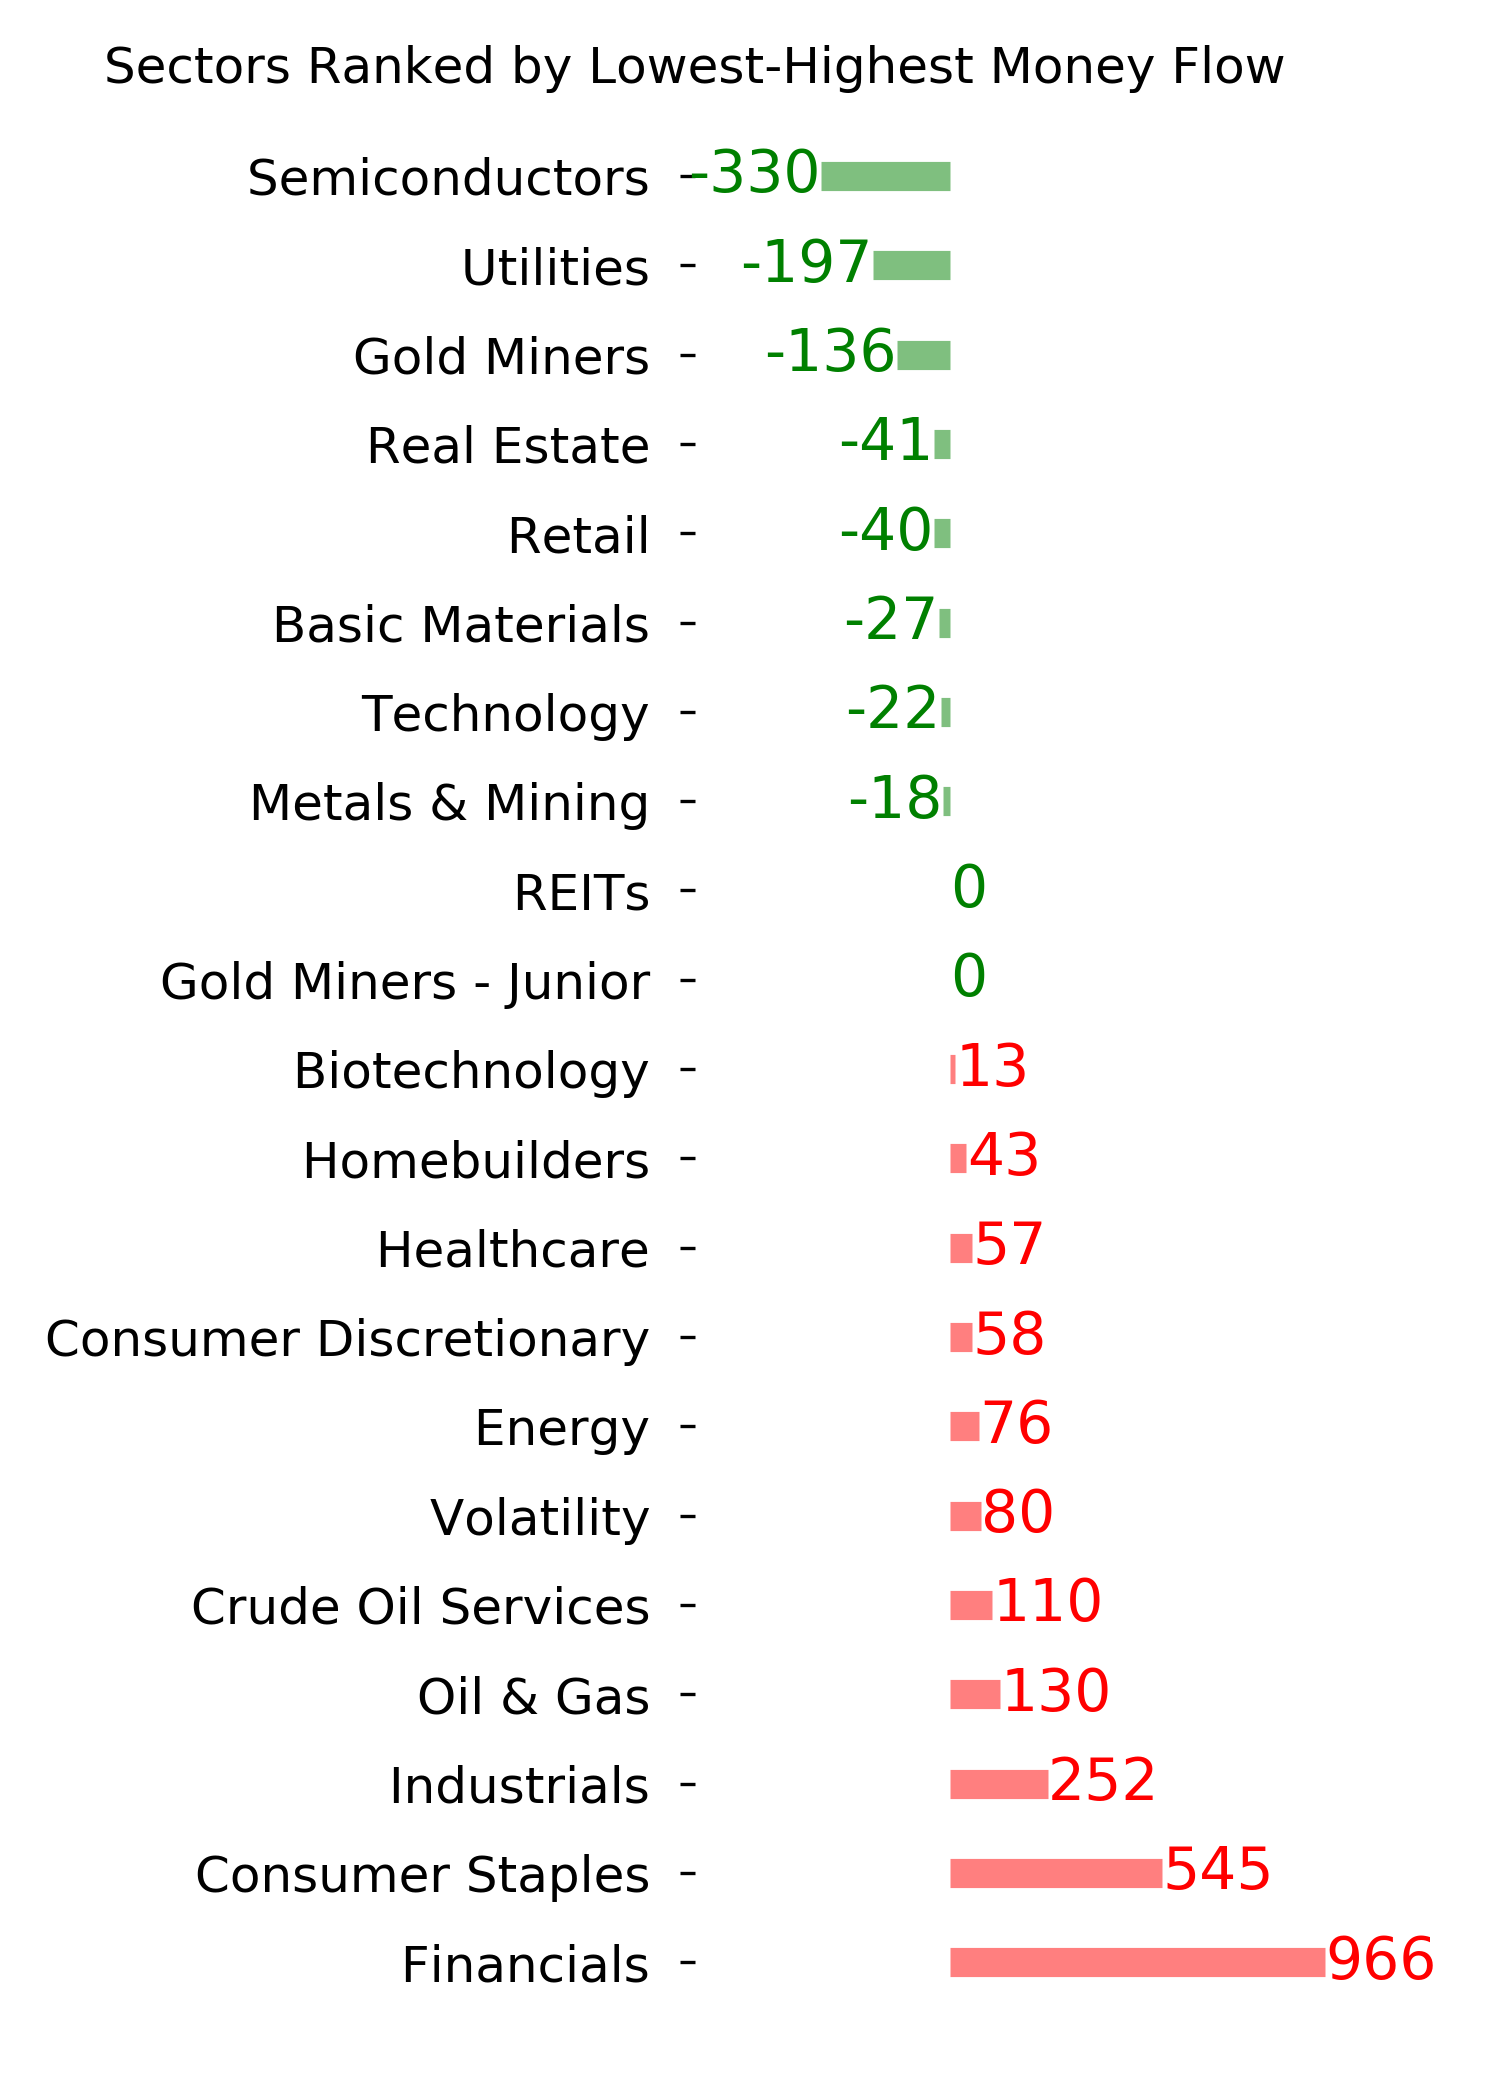
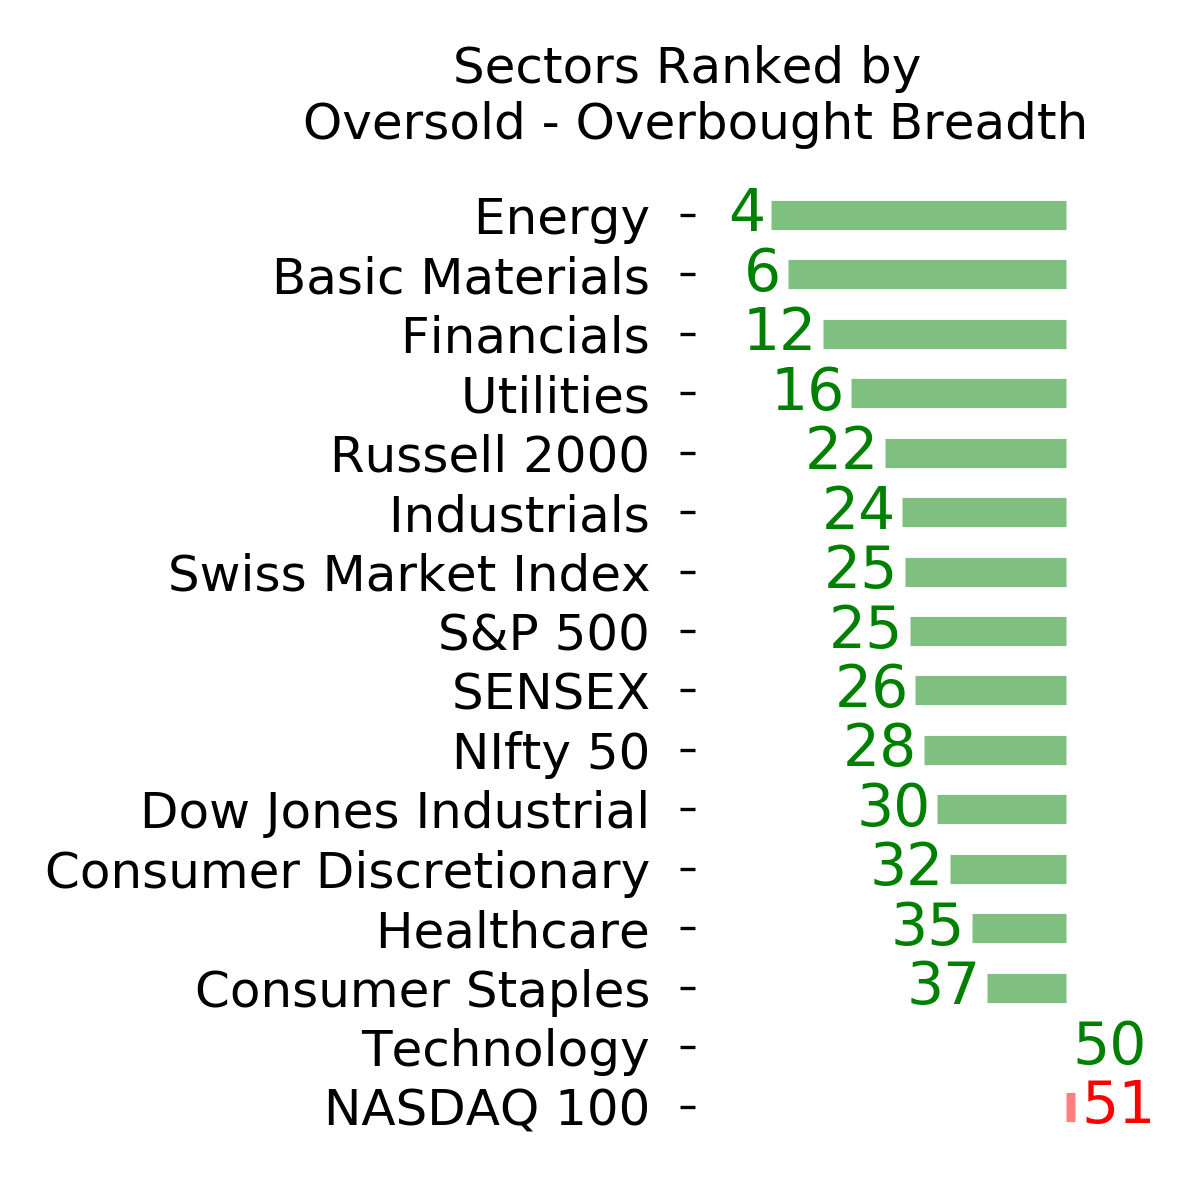
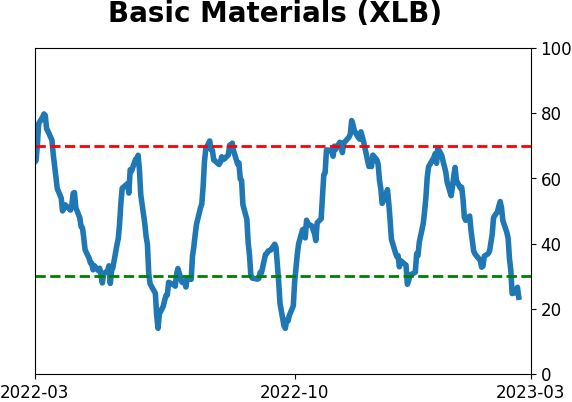
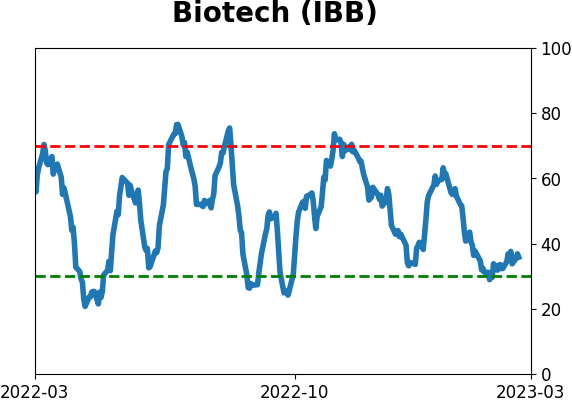
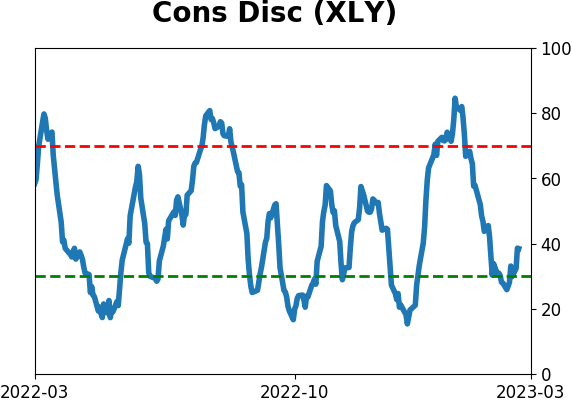
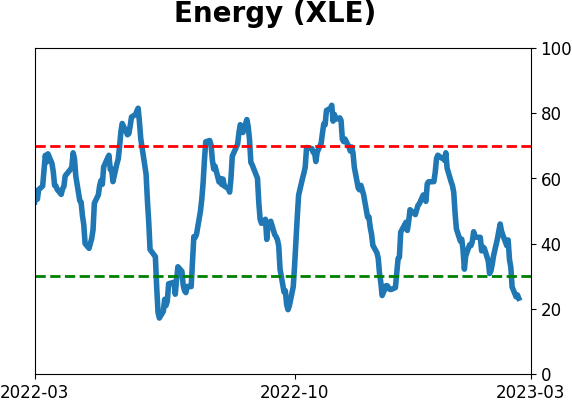
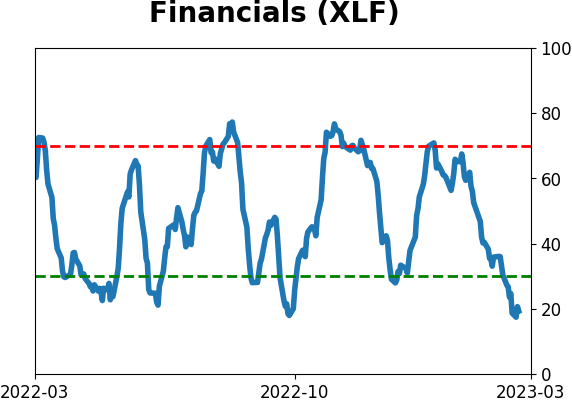
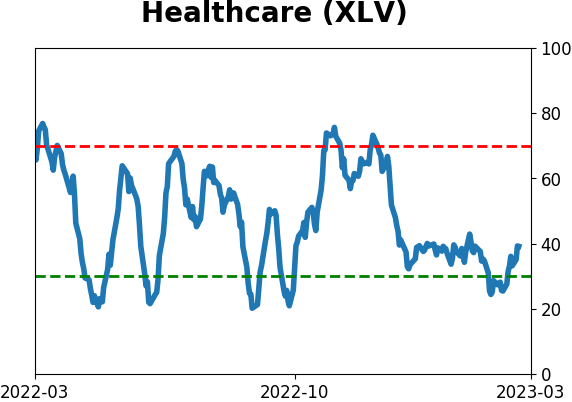
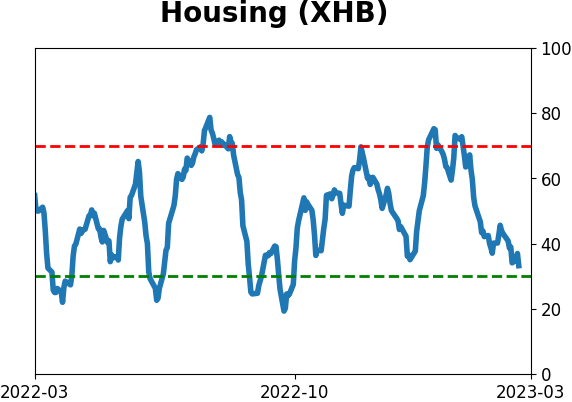
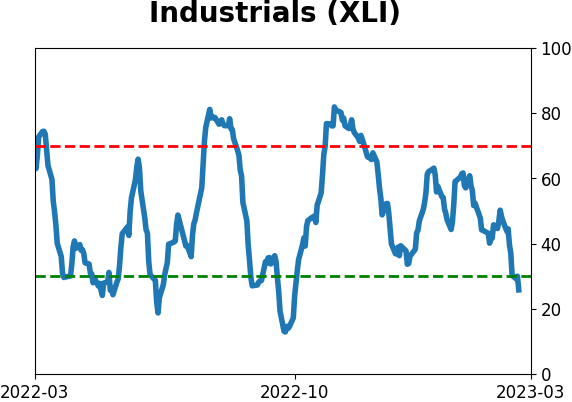
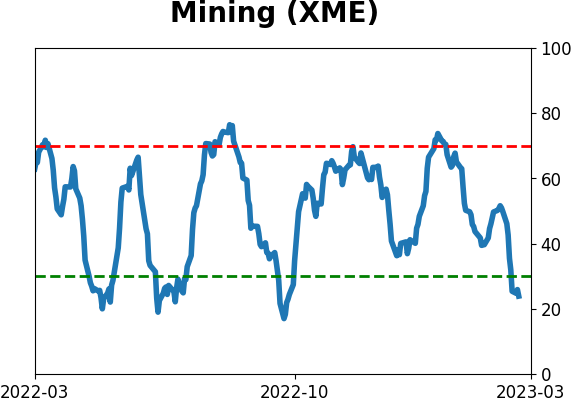
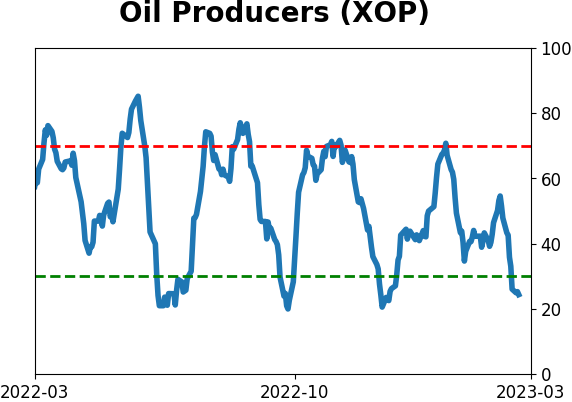
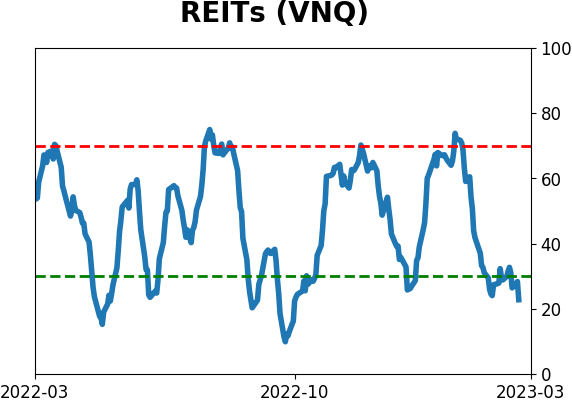
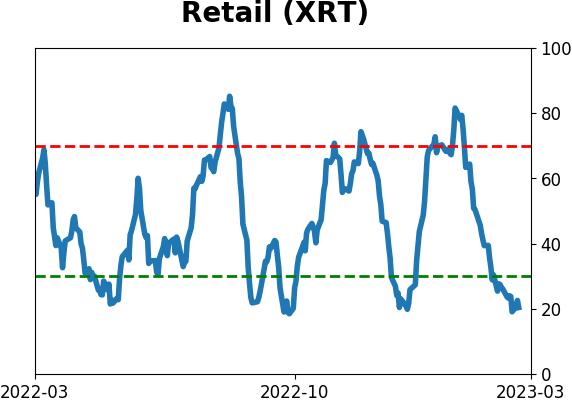
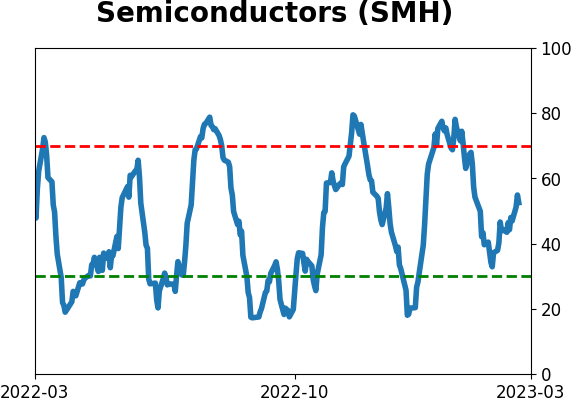
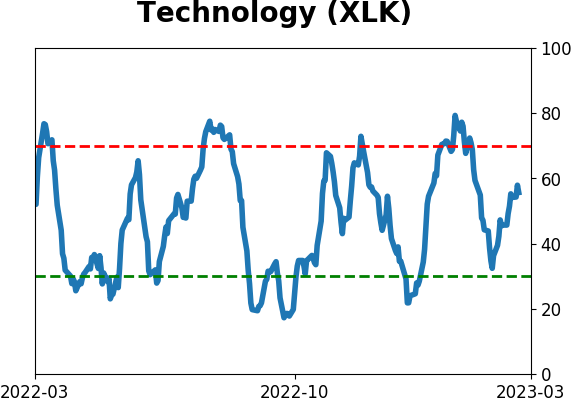
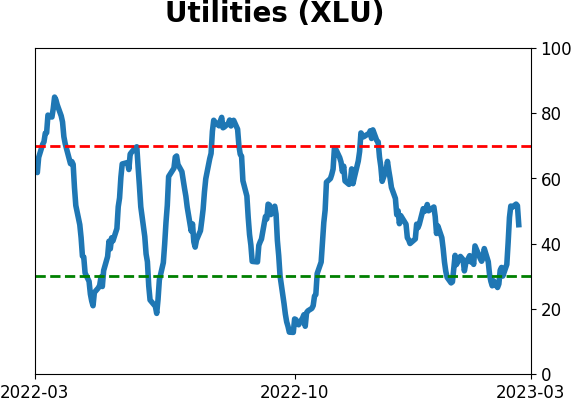
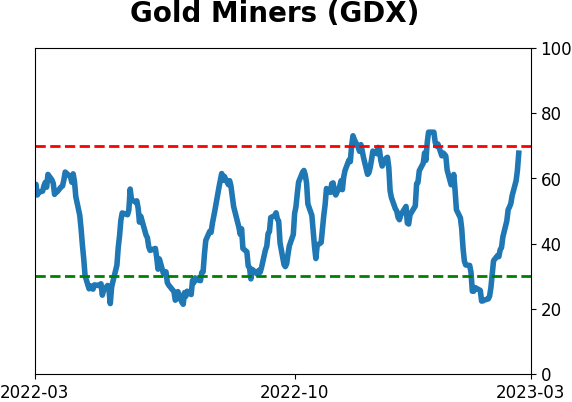
Sector ETF's - 10-Day Moving Average
|
|
|
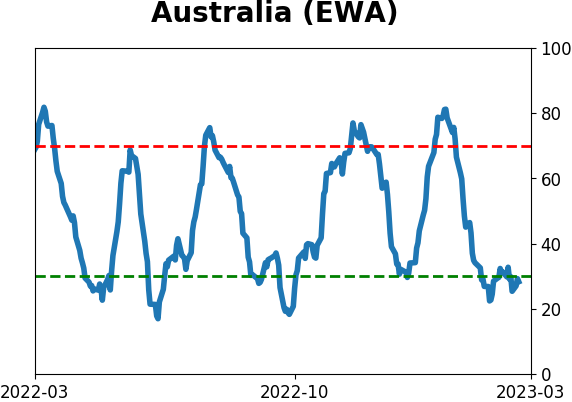
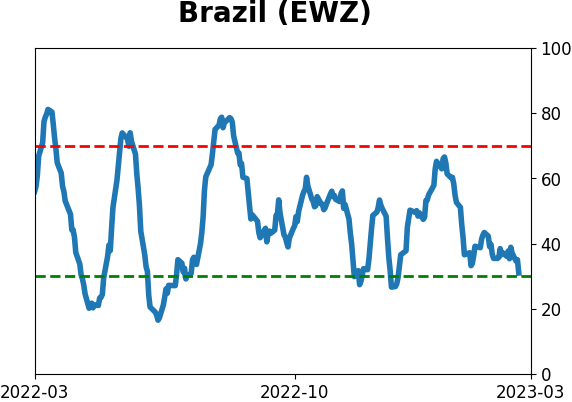
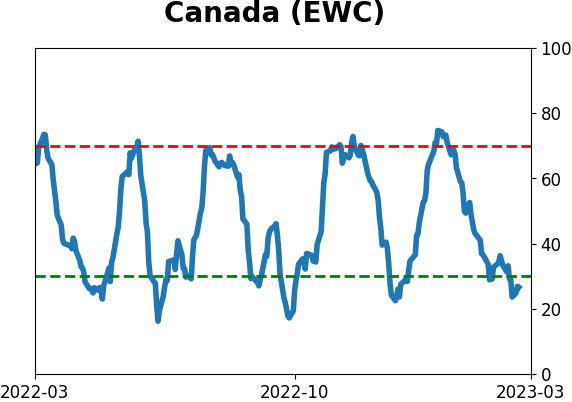
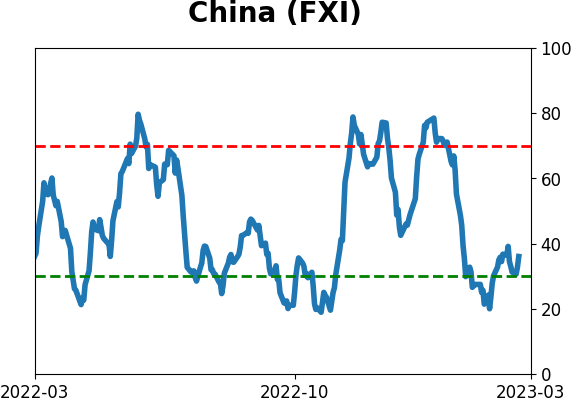
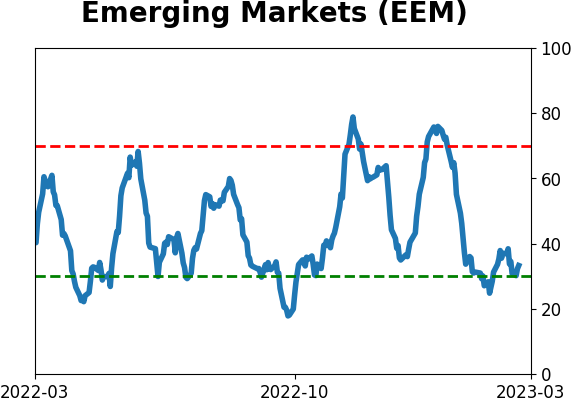
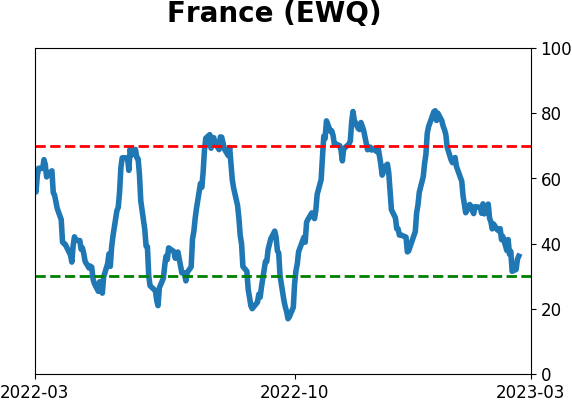
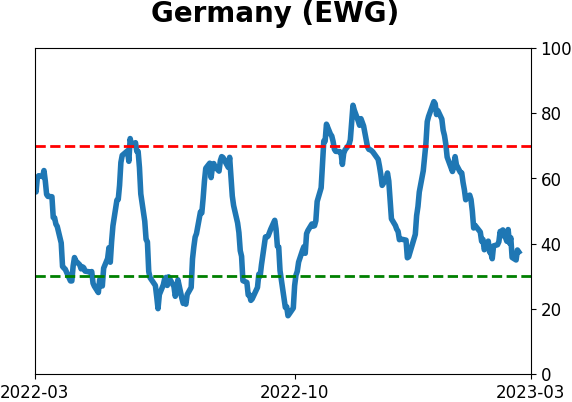
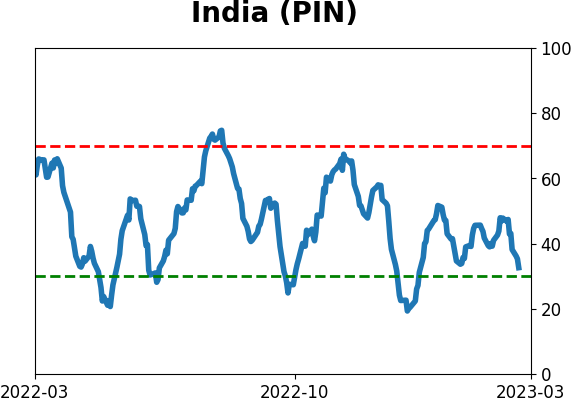
Country ETF's - 10-Day Moving Average
|
|
|
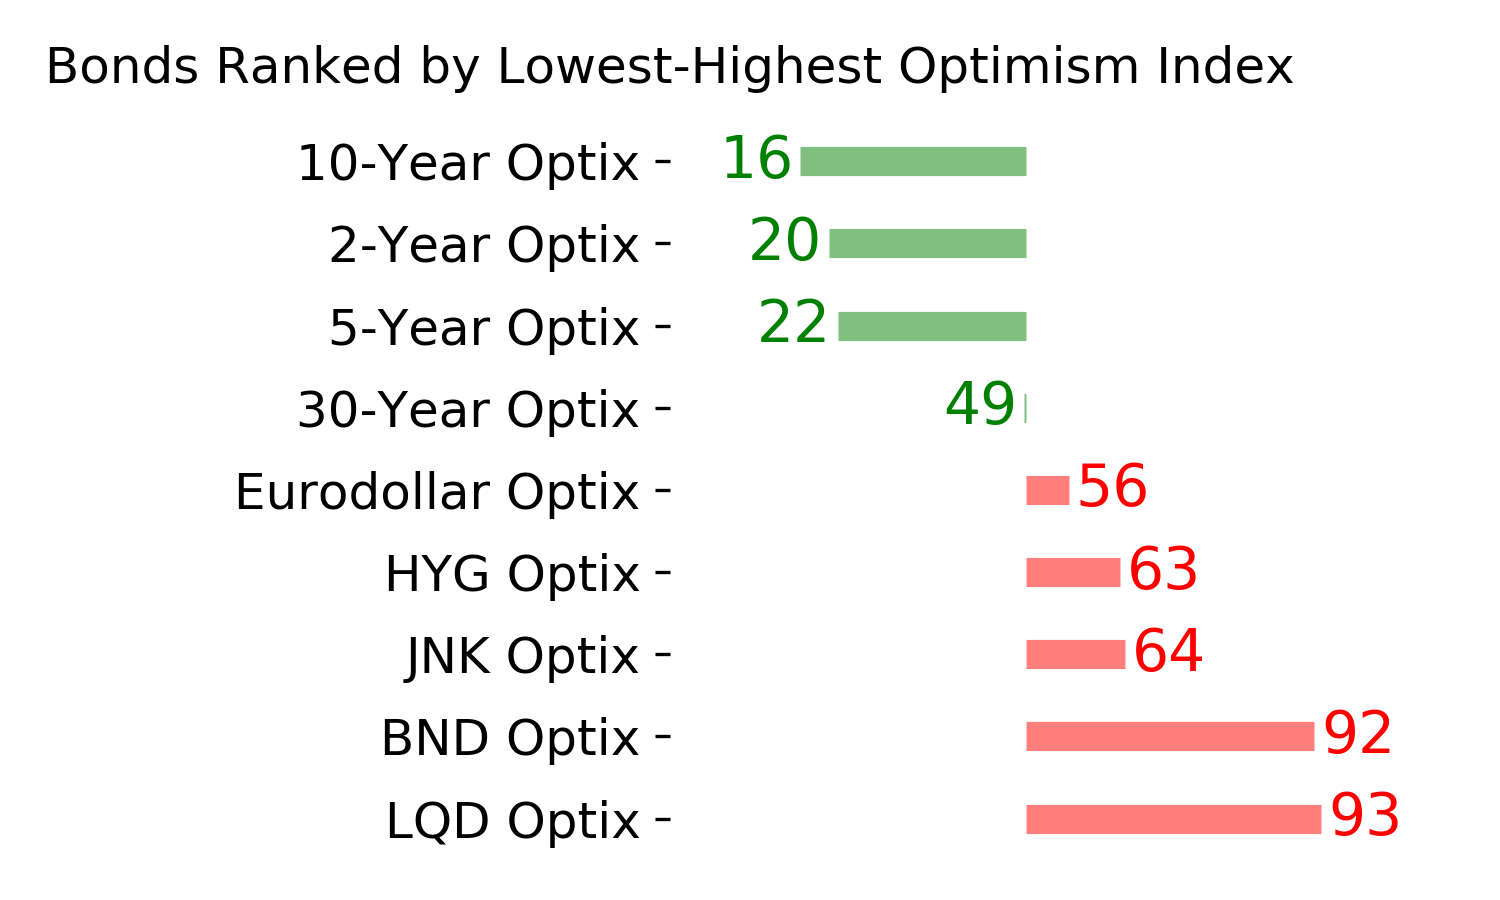
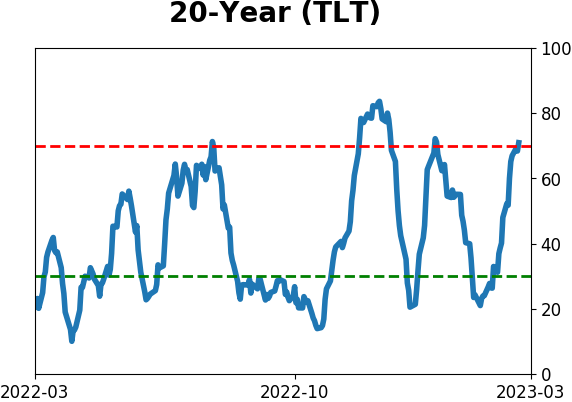
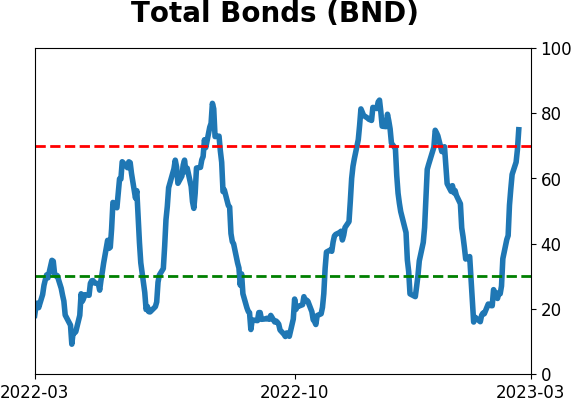
Bond ETF's - 10-Day Moving Average
|
|
|
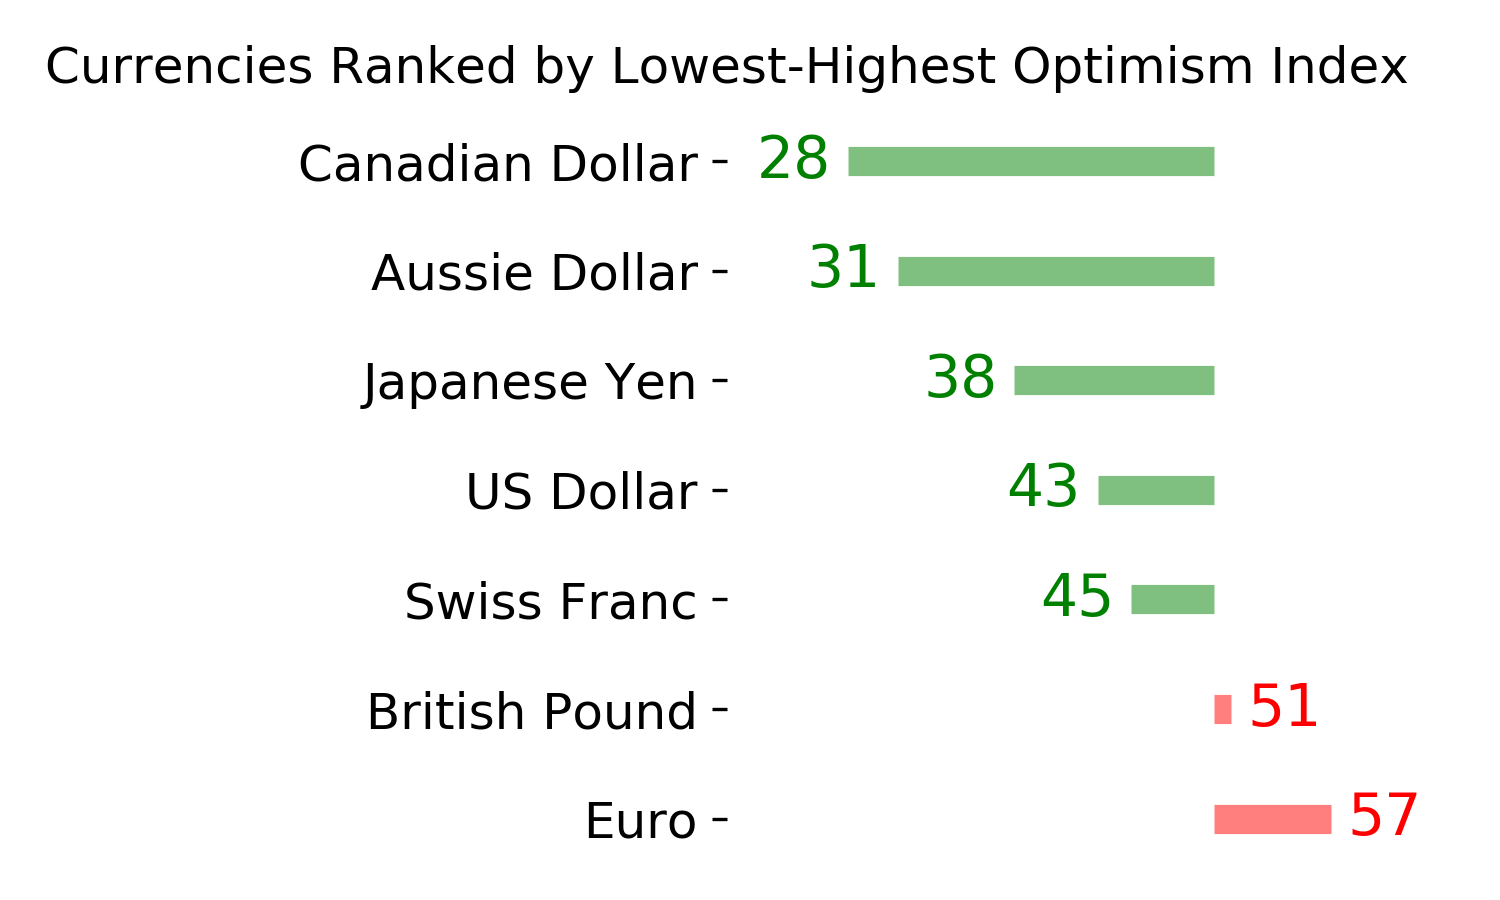
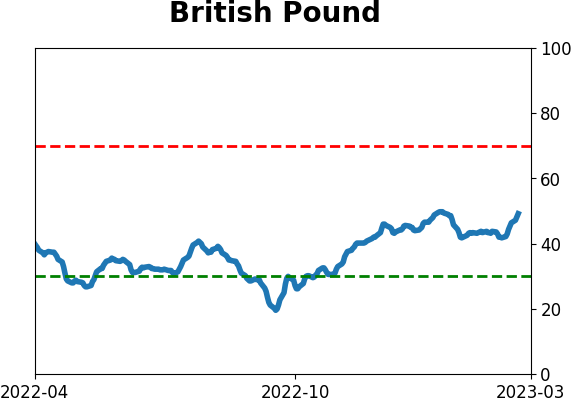
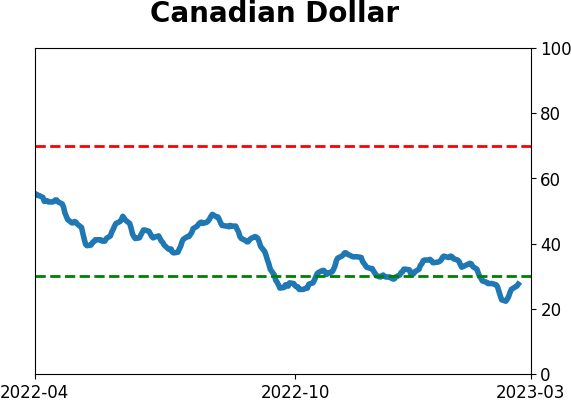
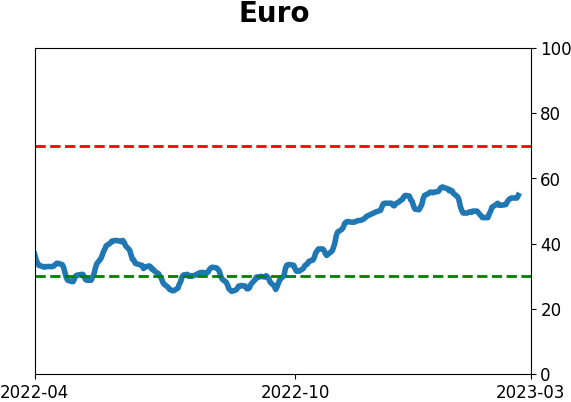
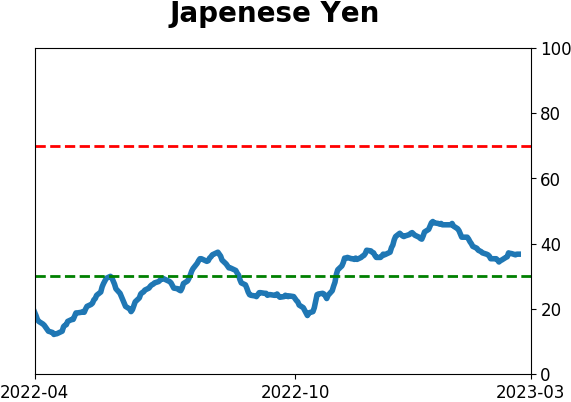
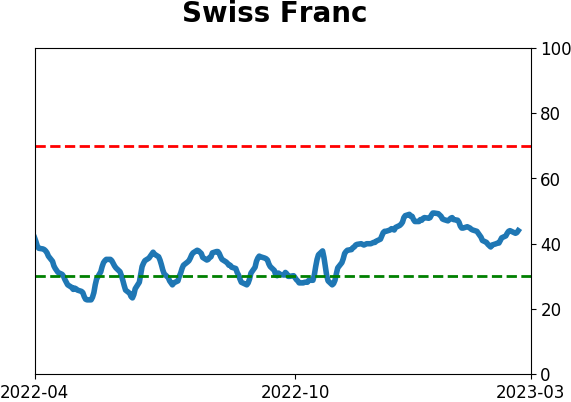
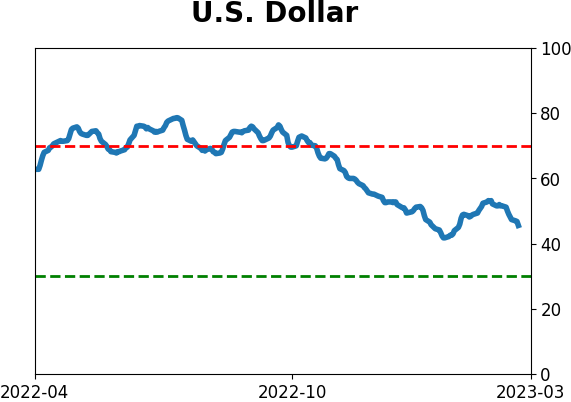
Currency ETF's - 5-Day Moving Average
|
|
|
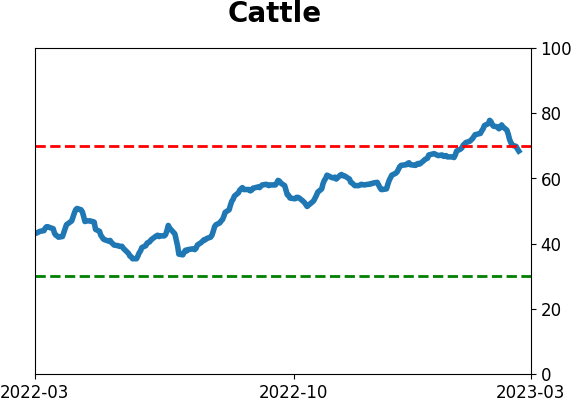
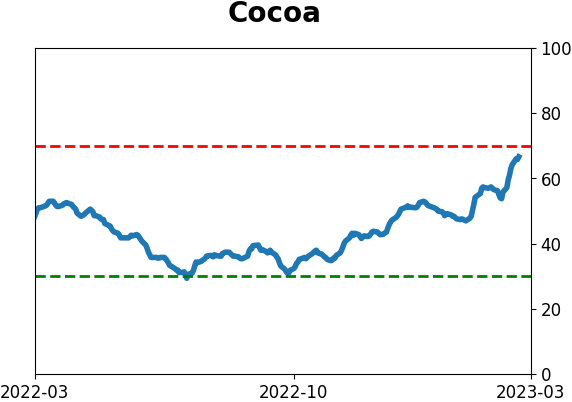
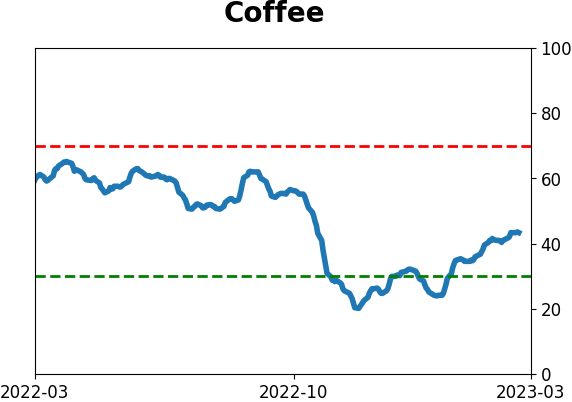
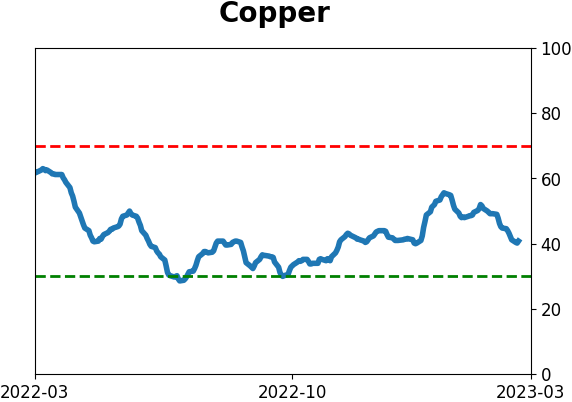
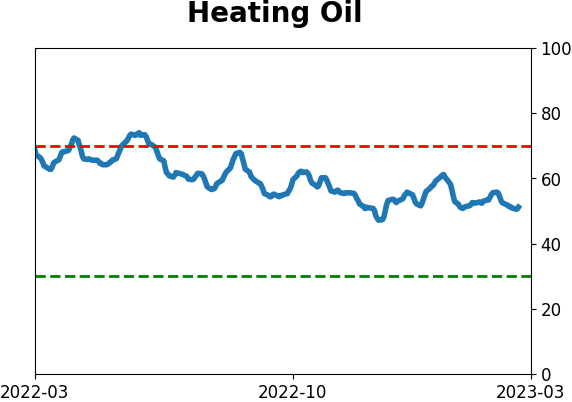
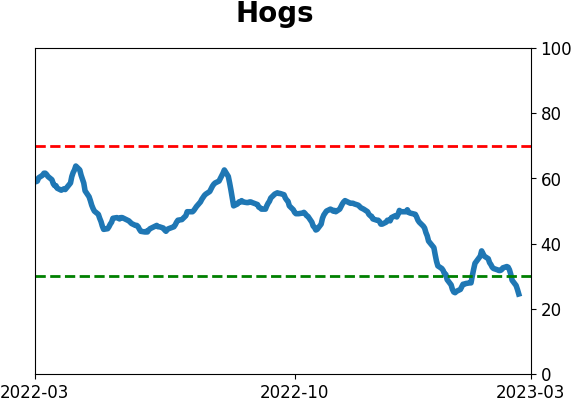
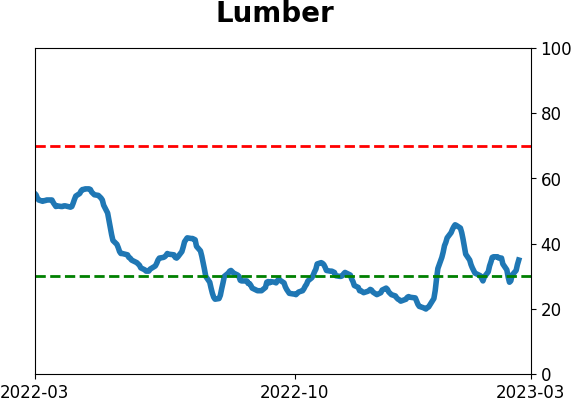
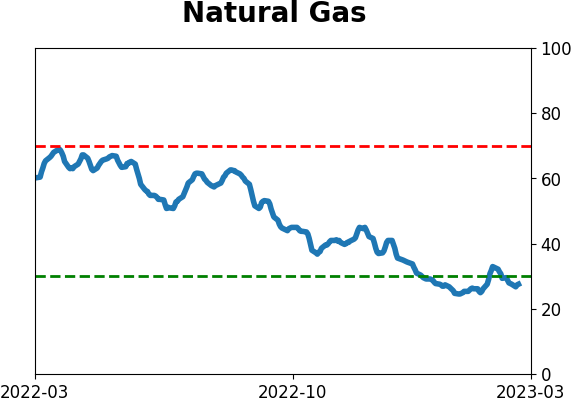
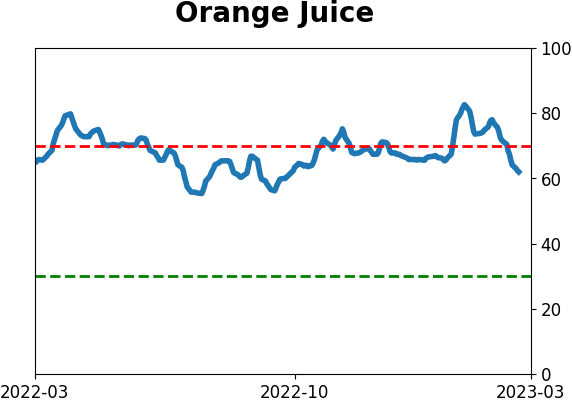
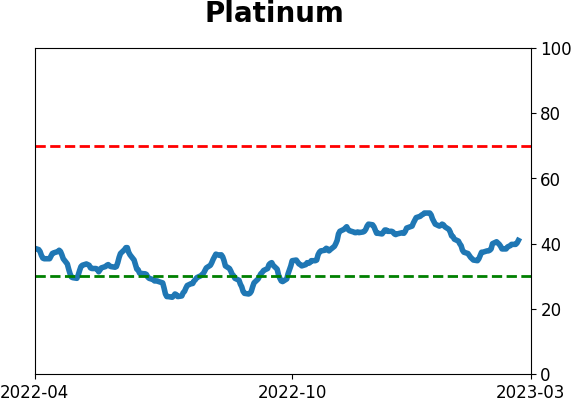
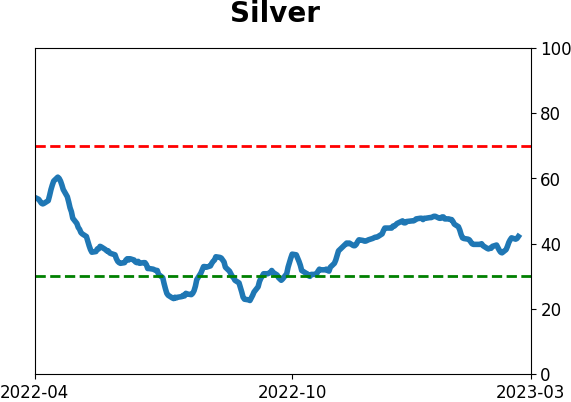
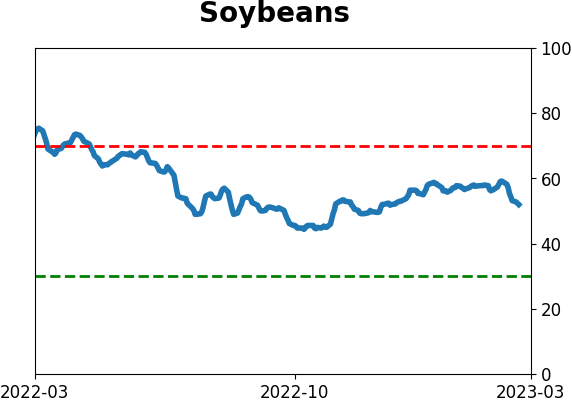
Commodity ETF's - 5-Day Moving Average
|
|