Headlines
|
|
It's time to keep an eye on the energy sector:
The energy sector is presently testing significant upside resistance. The combination of a favorable price trend and the most favorable seasonal period of the year suggests that traders be prepared to jump in if price can punch through to the upside.
|
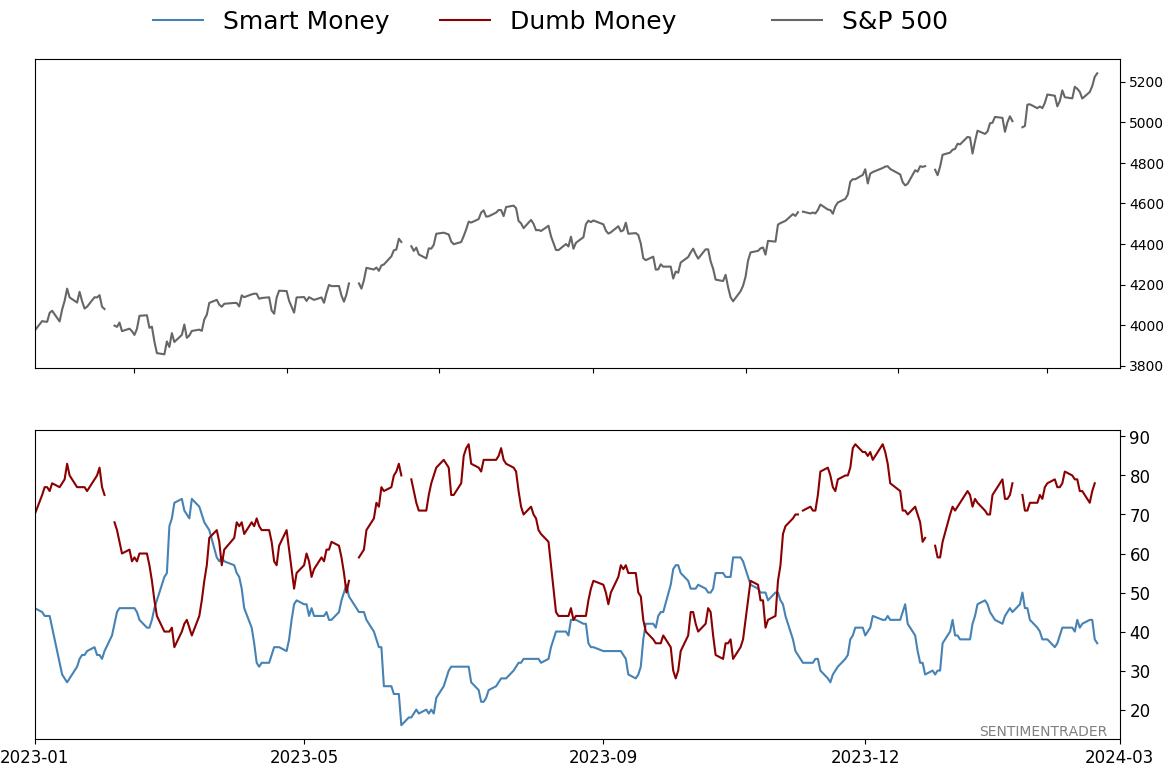
Smart / Dumb Money Confidence
|
Smart Money Confidence: 37%
Dumb Money Confidence: 78%
|
|
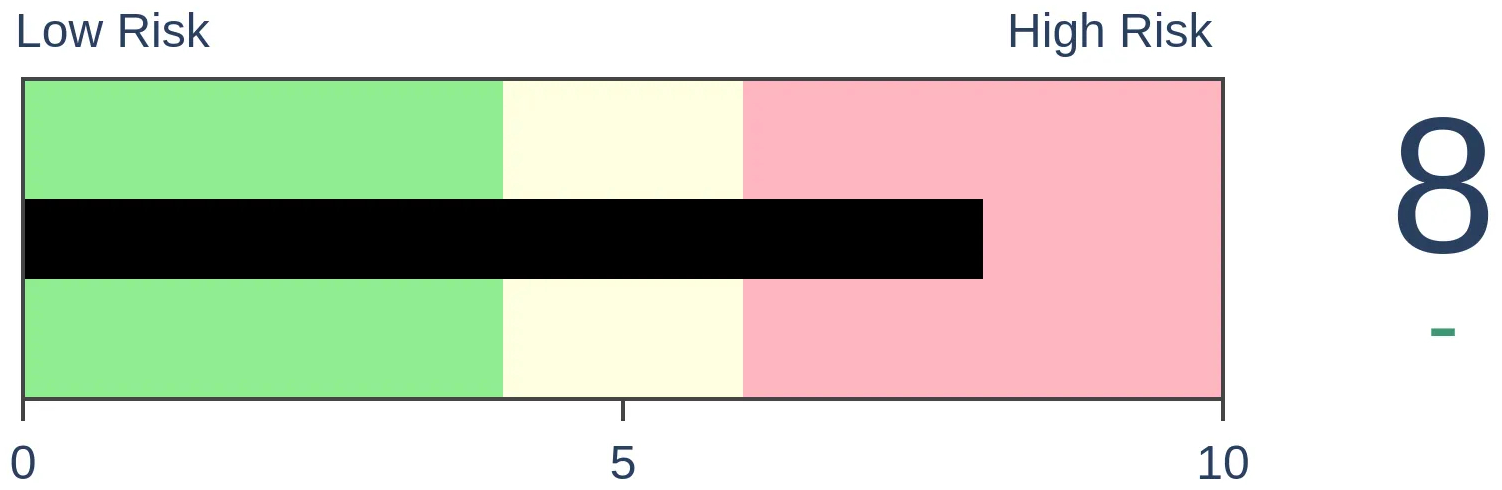
Risk Levels
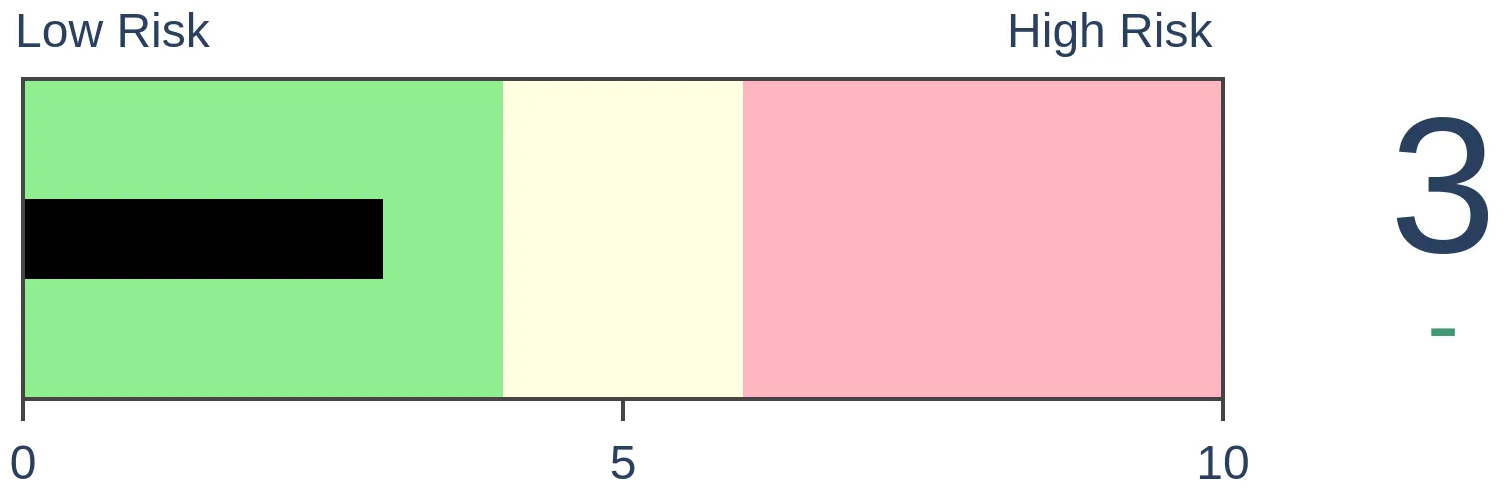
Stocks Short-Term

|
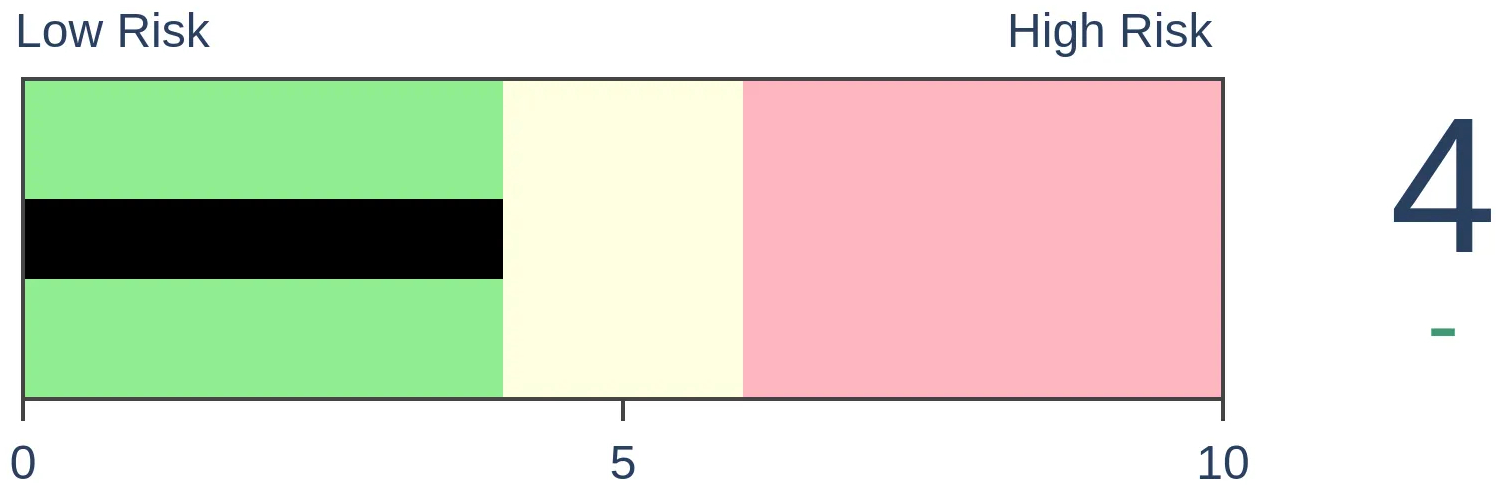
Stocks Medium-Term
|
|
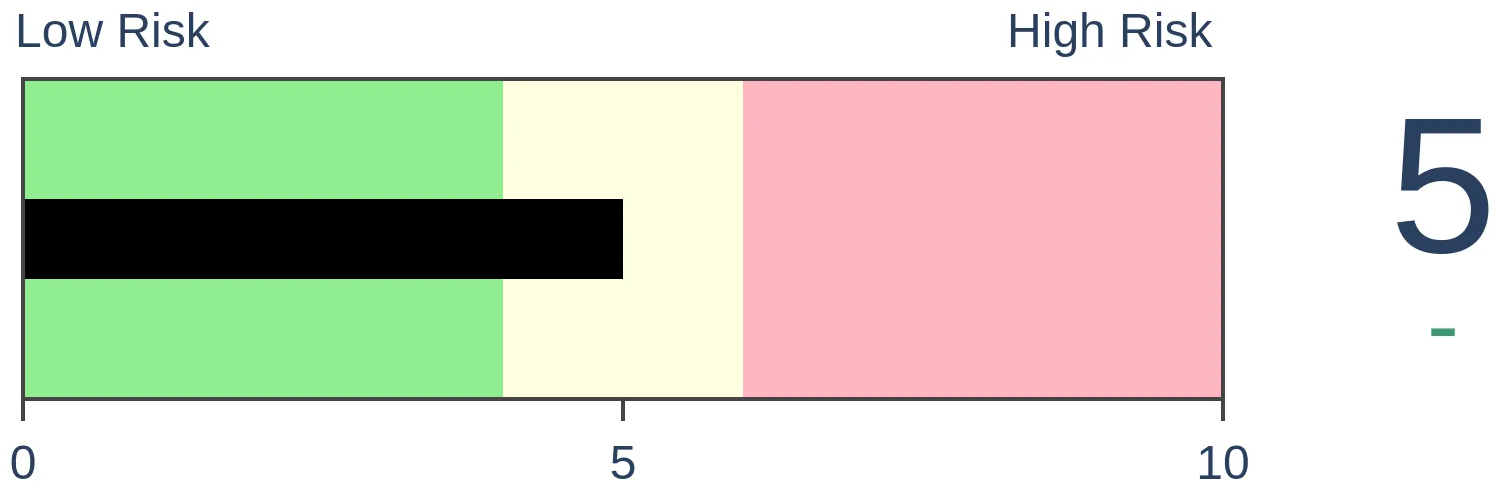
Bonds
|
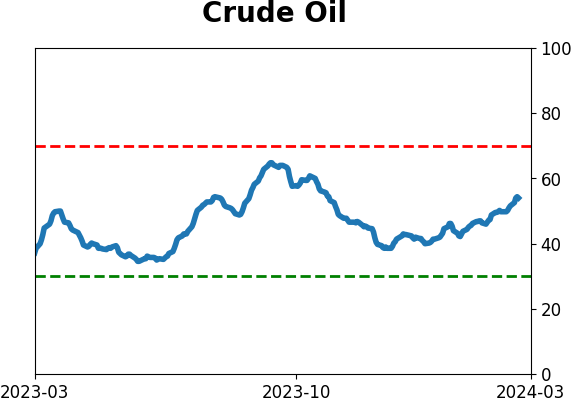
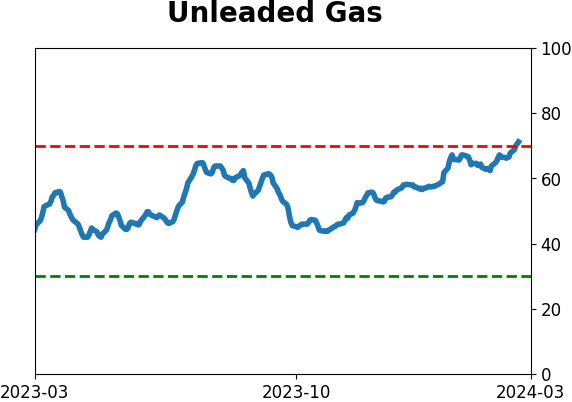
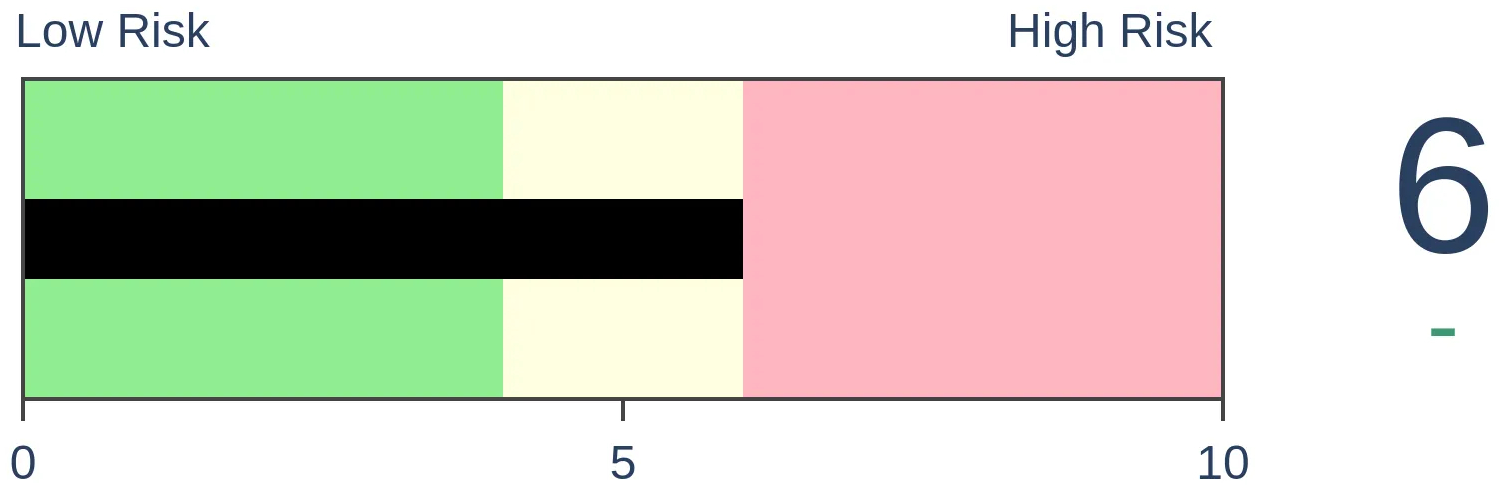
Crude Oil
|
|
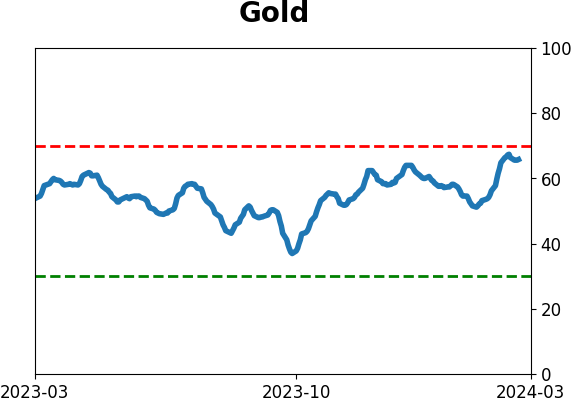
Gold
|
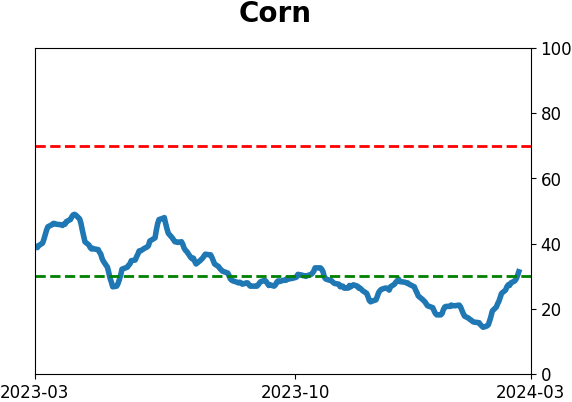
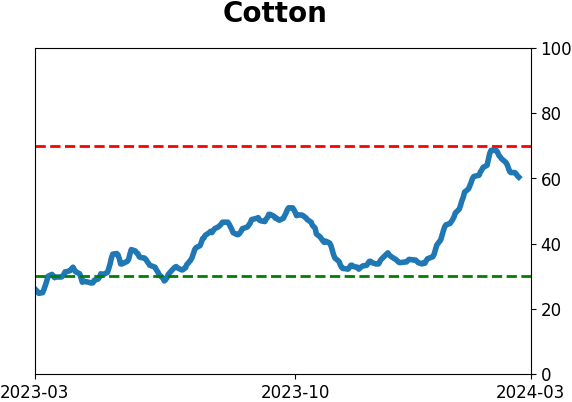
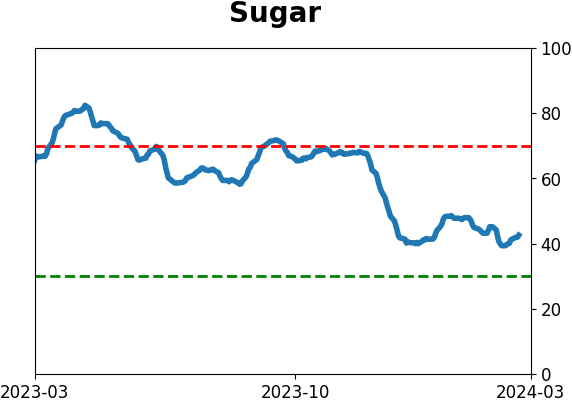
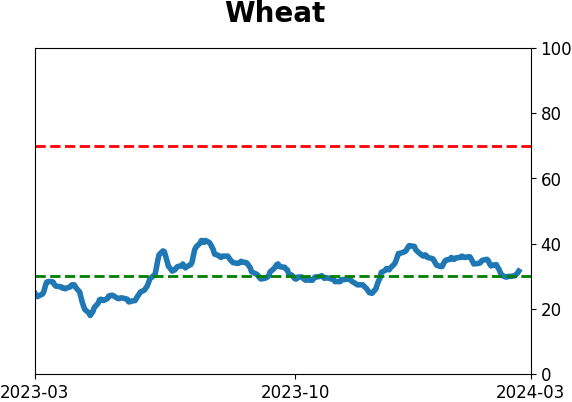
Agriculture
|
|
Research
By Jay Kaeppel
BOTTOM LINE
The energy sector is presently testing significant upside resistance. The combination of a favorable price trend and the most favorable seasonal period of the year suggests that traders be prepared to jump in if price can punch through to the upside.
FORECAST / TIMEFRAME
None
|
Key points
- The energy sector has rallied over 15% since mid-January
- On a chart, the sector appears to be running into resistance
- History suggests that traders pay close attention and continue to give the bullish case the benefit of the doubt
The energy sector has a mixed history
The chart below displays the price action for the iShares Energy ETF (ticker XLE) since it started trading in 1998. This energy ETF enjoyed a strong price uptrend for much of the first decade of existence. Since then - much like emerging markets and the German stock market - the energy sector has traded sideways for over 16 years.
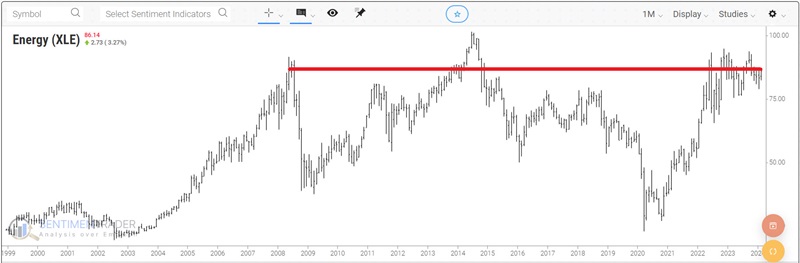
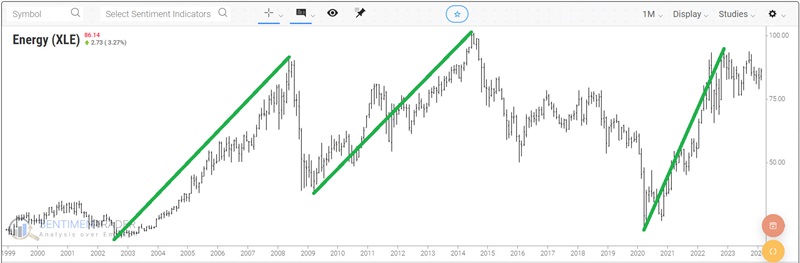
This long period of large price swings, with essentially nothing to show for it, causes many to be wary of the energy sector. However, as shown in the chart below, the fact remains that "when it goes, it really goes."
Despite its lack of net upside in the past 16 years, this sector can offer terrific trading opportunities. In the shorter-term daily chart below, we see that XLE a) has enjoyed a nice run so far in 2024 and b) is facing some apparent upside resistance.
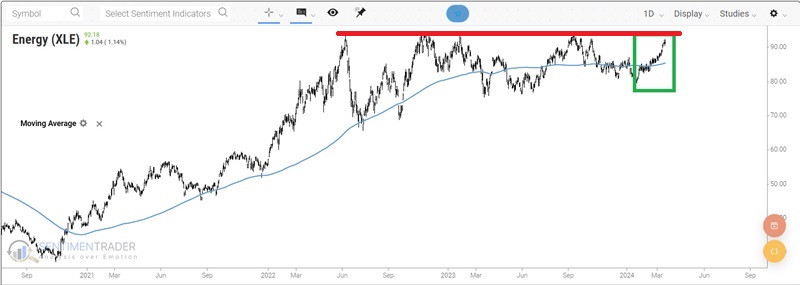
The question on traders' minds is, "Can the rally in energy break through resistance and continue?" A bit of history suggests that traders continue to give the bullish case the benefit of the doubt and that much higher prices may be seen IF XLE can cross above resistance.
The most favorable period of the year
The chart below displays the annual seasonal trend for the iShares Energy ETF (ticker XLE) and highlights the period that extends from the close on Trading Day of the Year (TDY) #56 through TDY #110.
For 2024, this period extends from the close on 2024-03-21 through 2024-06-07.
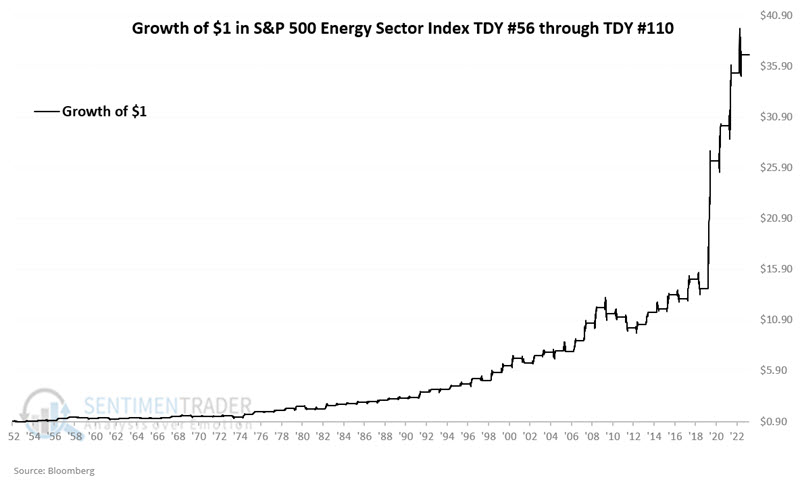
To get the complete long-term picture, let's first look at the S&P 500 Energy Sector index performance starting in 1952. The chart below displays the hypothetical growth of $1 invested in the energy sector index only during this seasonal period every year.
The chat below displays the same results on a logarithmic scale.
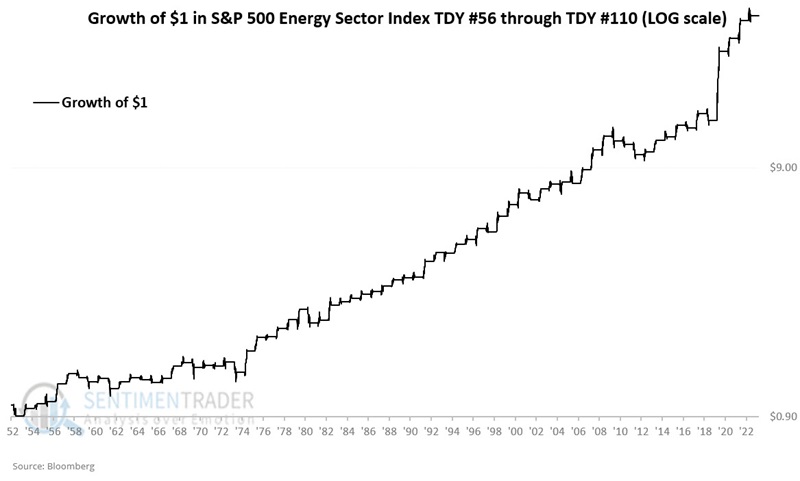
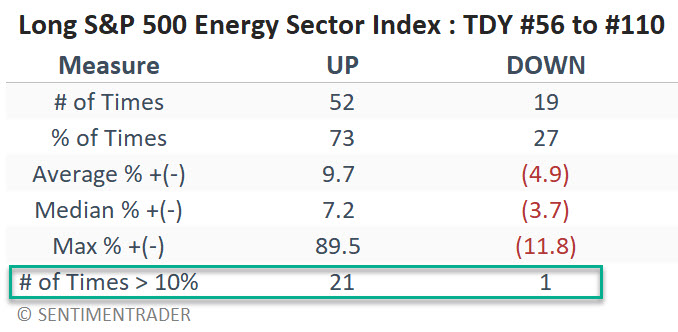
Like many seasonal trends, the equity curve above clearly trends from lower left to upper right, suggesting a true long-term "edge." However, the seemingly steady nature of this rise belies the fact that it has shown a gain "only" 73% of the time, i.e., in any given year, anything can happen. On the plus side, if we look only at moves of 10% or more during this seasonal period, 21 were to the plus side, and only one (-11.8% -1981) was to the downside.
The table below summarizes historical sector performance during this period.
Using XLE for trading purposes
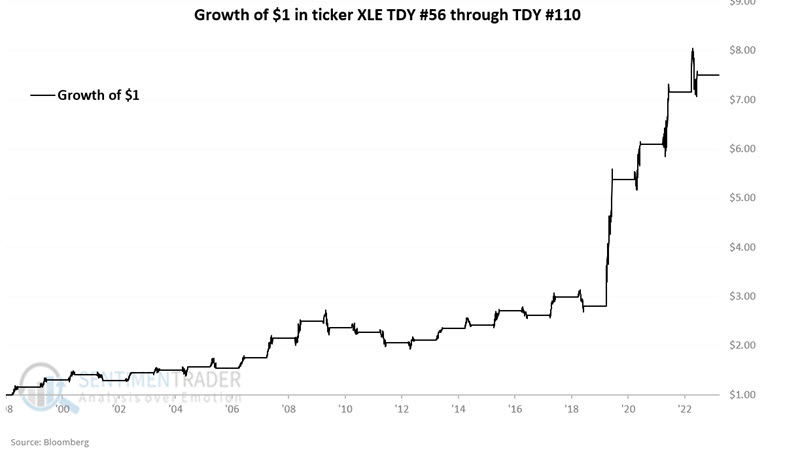
Looking at index data is helpful in gaining a long-term perspective. However, for a more "real-world" test, let's look at the performance of ticker XLE. The chart below displays the hypothetical growth of $1 invested in ticker XLE only during the TDY #56 through TDY #110 period every year since XLE started trading in 1998.
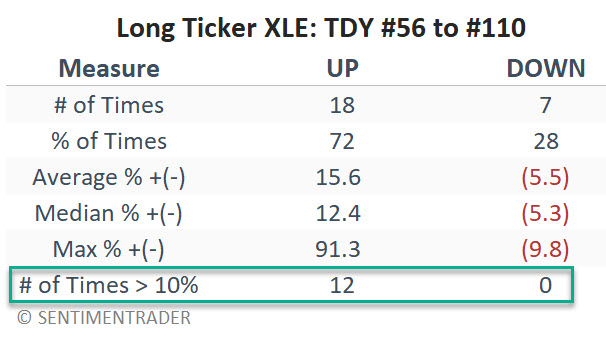
The table below summarizes historical sector performance during this period. In general, the message is the same as above: Roughly seven out of ten years see a gain, but when the sector makes a big move (10% or more), the results skew heavily to the positive side.
What the research tells us…
The bad news is that the energy sector is facing an area of significant price resistance. The good news is that the energy sector is already in an established uptrend as a favorable seasonal period approaches. This is the preferred setup for exploiting any seasonal trend (i.e., price is "doing what it's supposed to be doing."). That said, no seasonal pattern is guaranteed to follow its historical norm.
Historical seasonal results skew to the favorable side, with just less than 3 out of 4 years showing a gain during the TDY #56 to #110 period. Likewise, moves greater than 10% or more during this period favor the winning side by 21 to 1 for the sector index itself and 12 to 0 for XLE since it started trading in the late 1990s.
These results suggest a strong chance that XLE will break out above resistance and run higher. That said, traders must decide if they will jump in before an actual breakout or if they will wait for the sector to "prove itself" first. In either case, traders are never relieved of their responsibility to allocate capital intelligently and to manage risk ruthlessly.
Indicators at Extremes
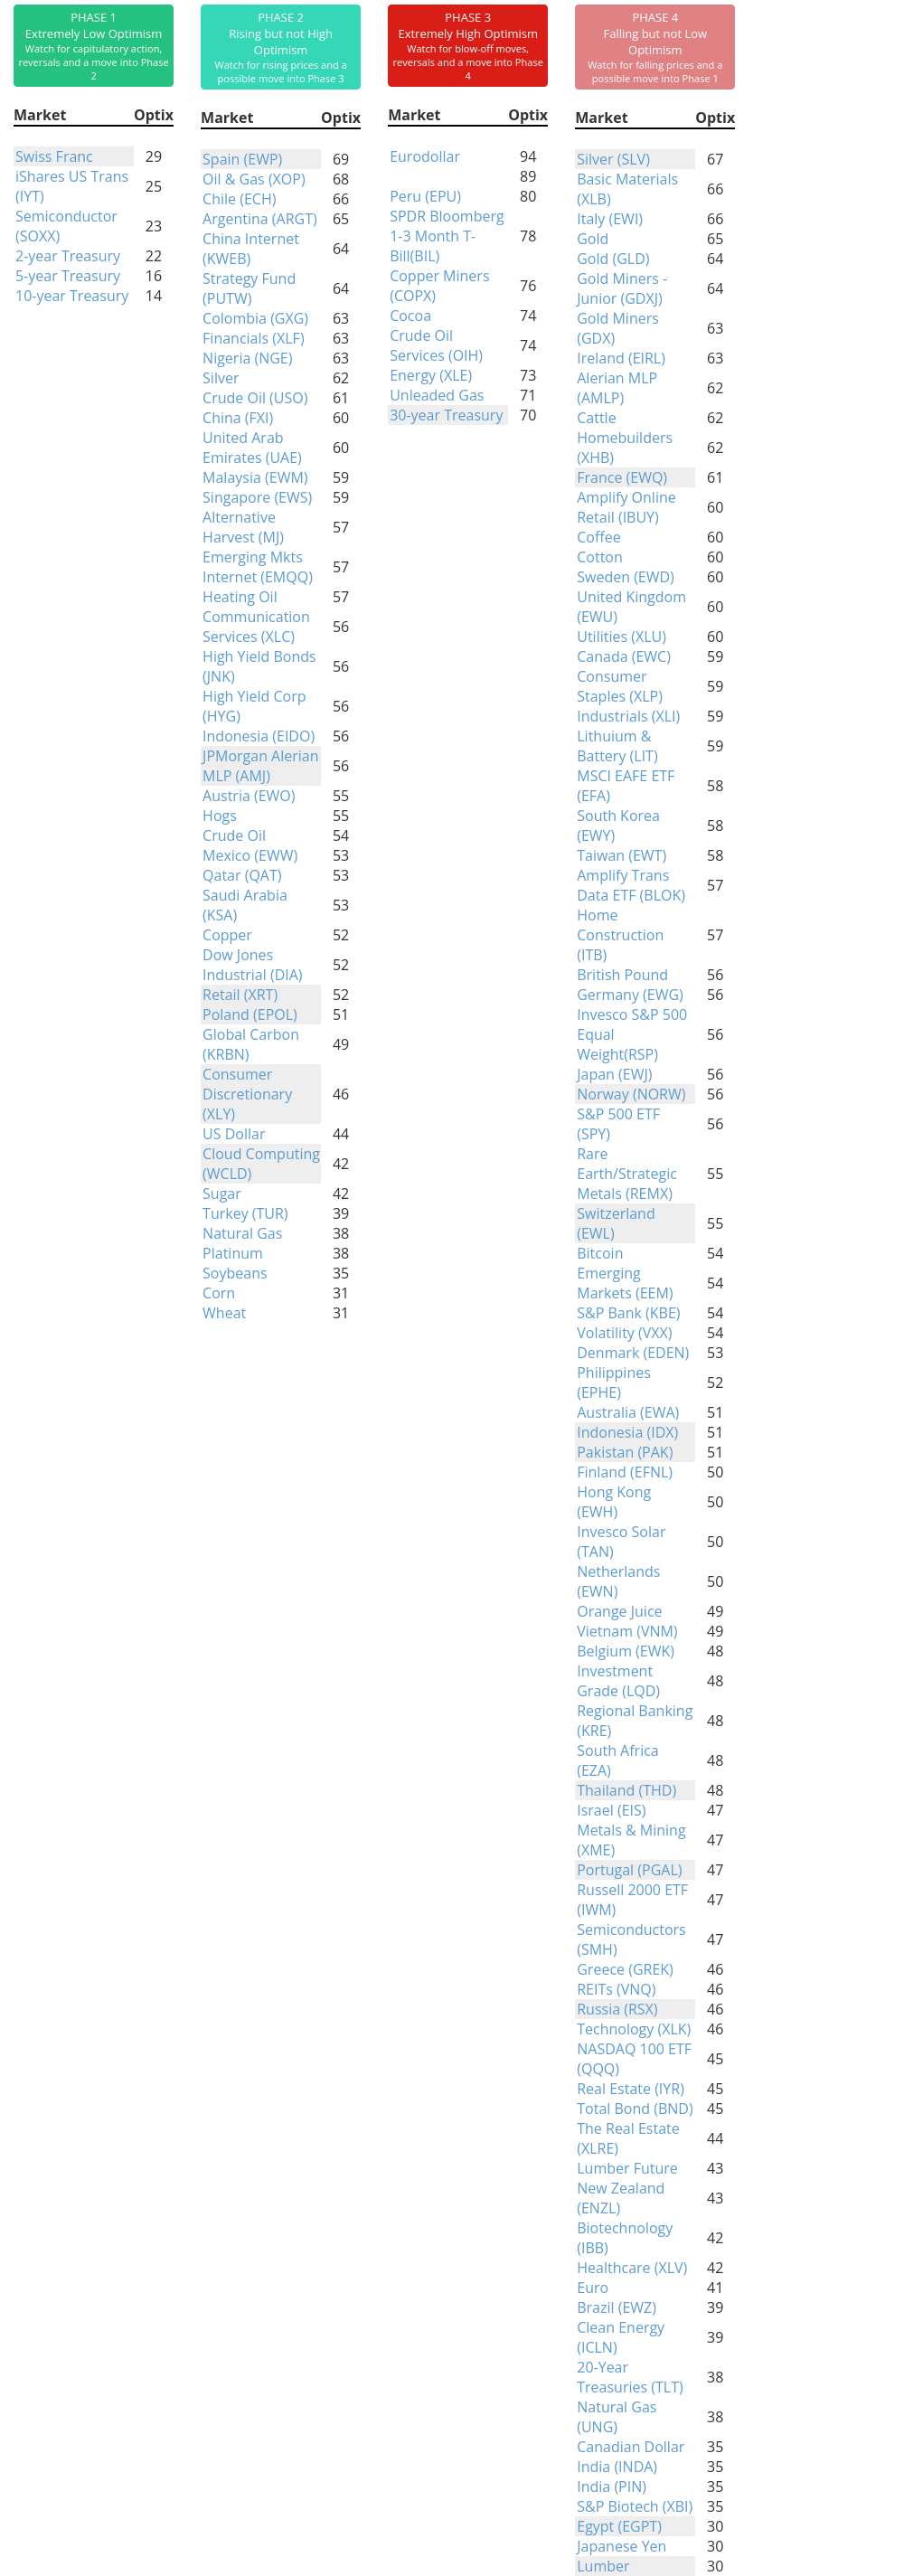
Phase Table
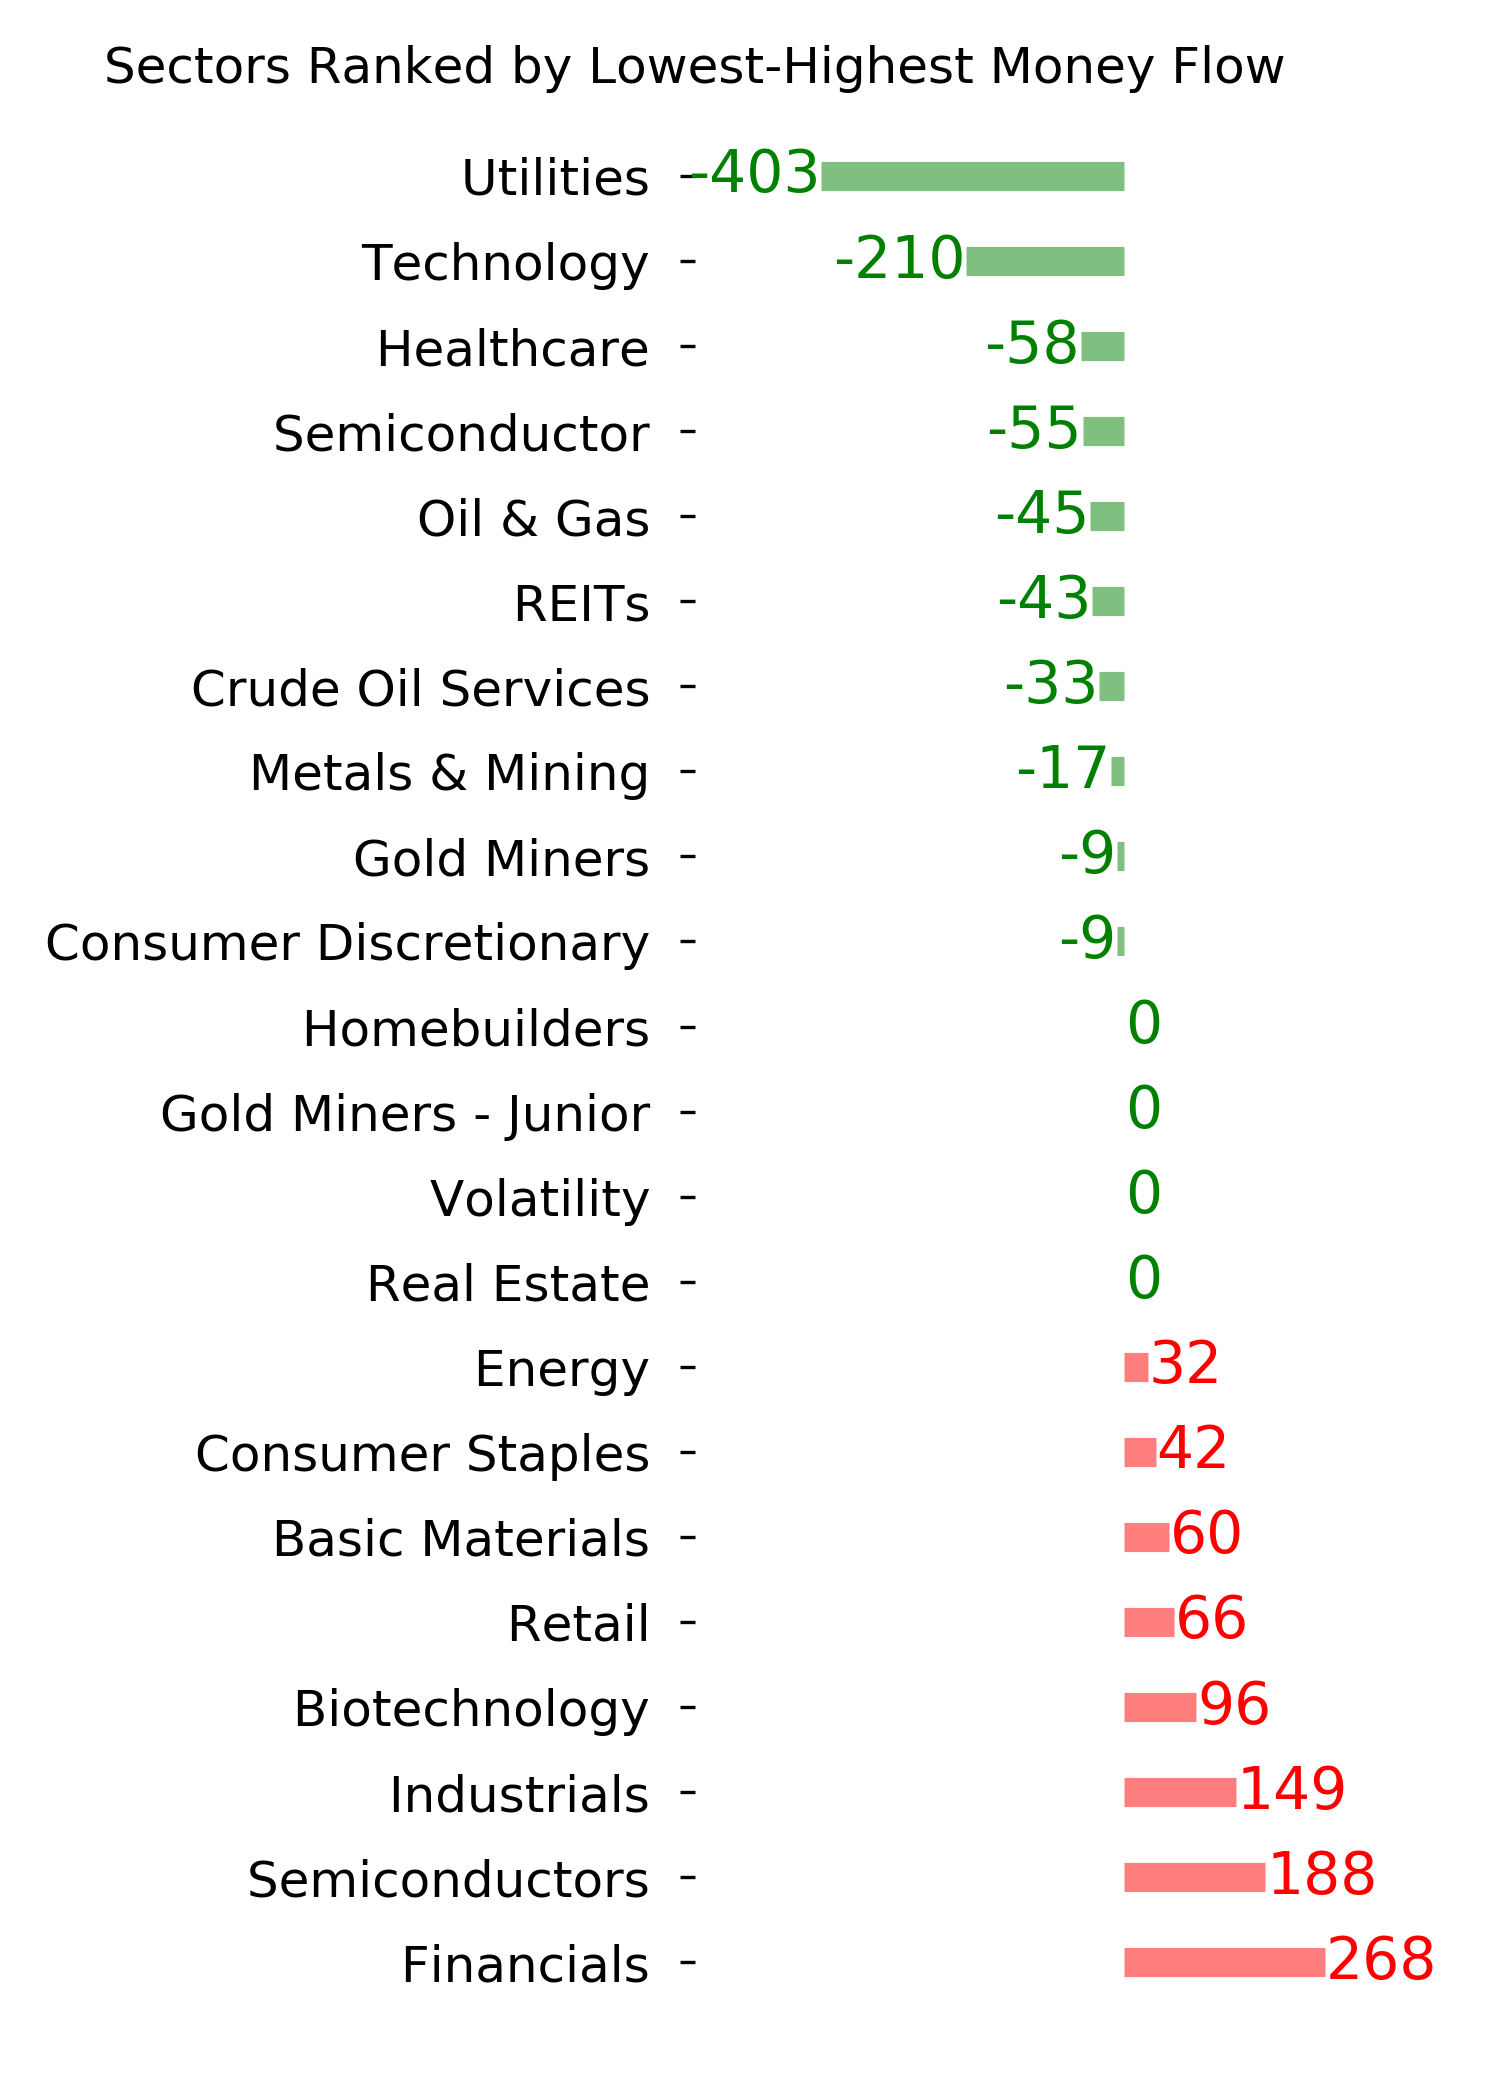
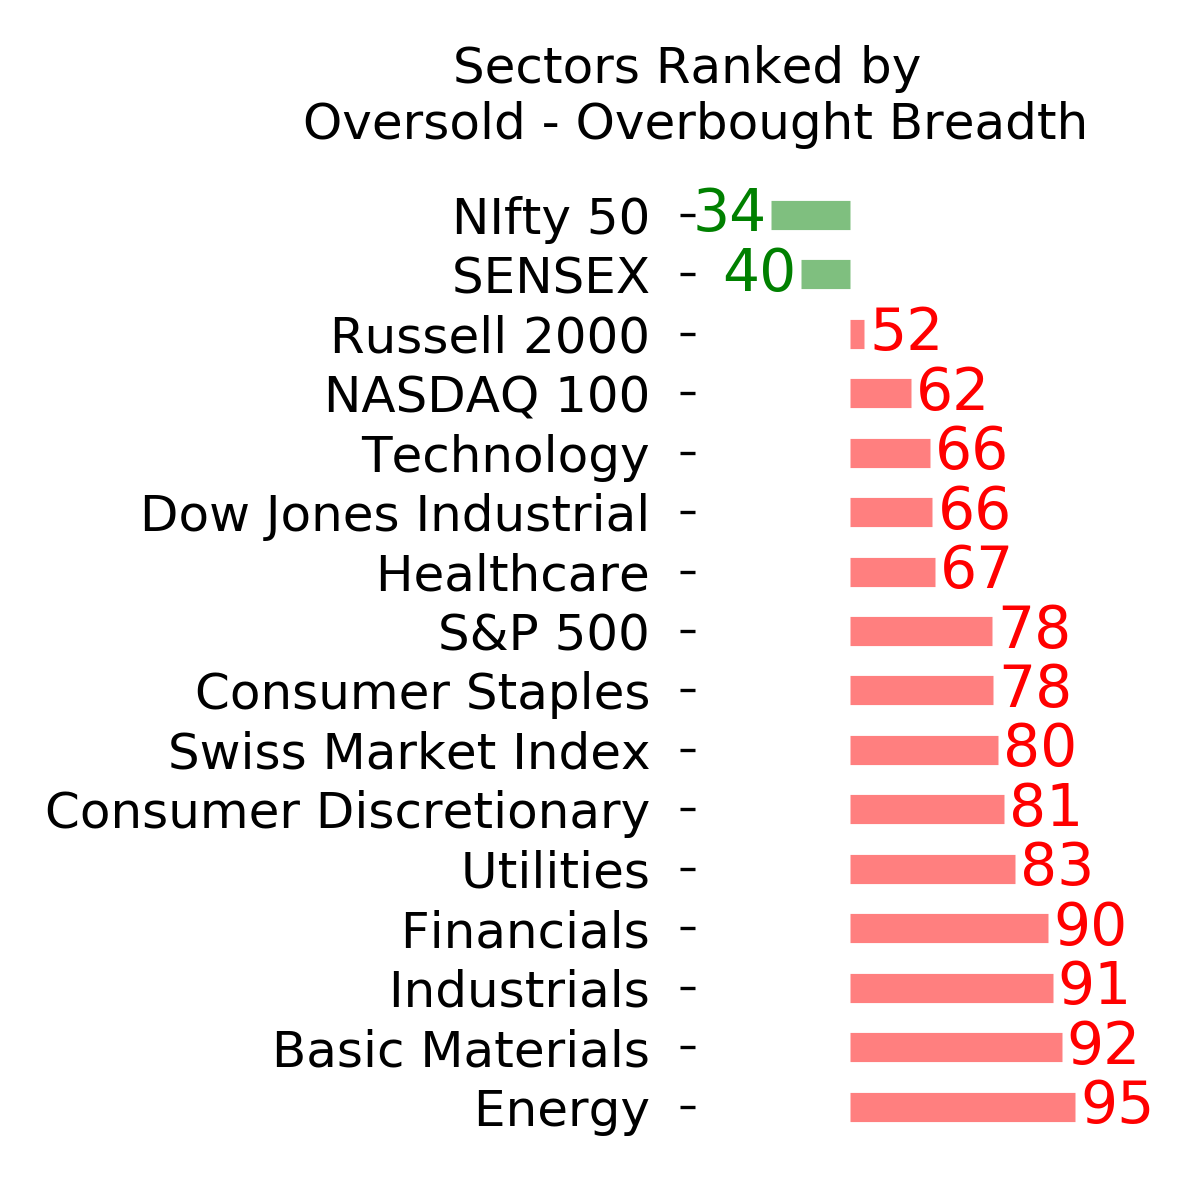
Ranks
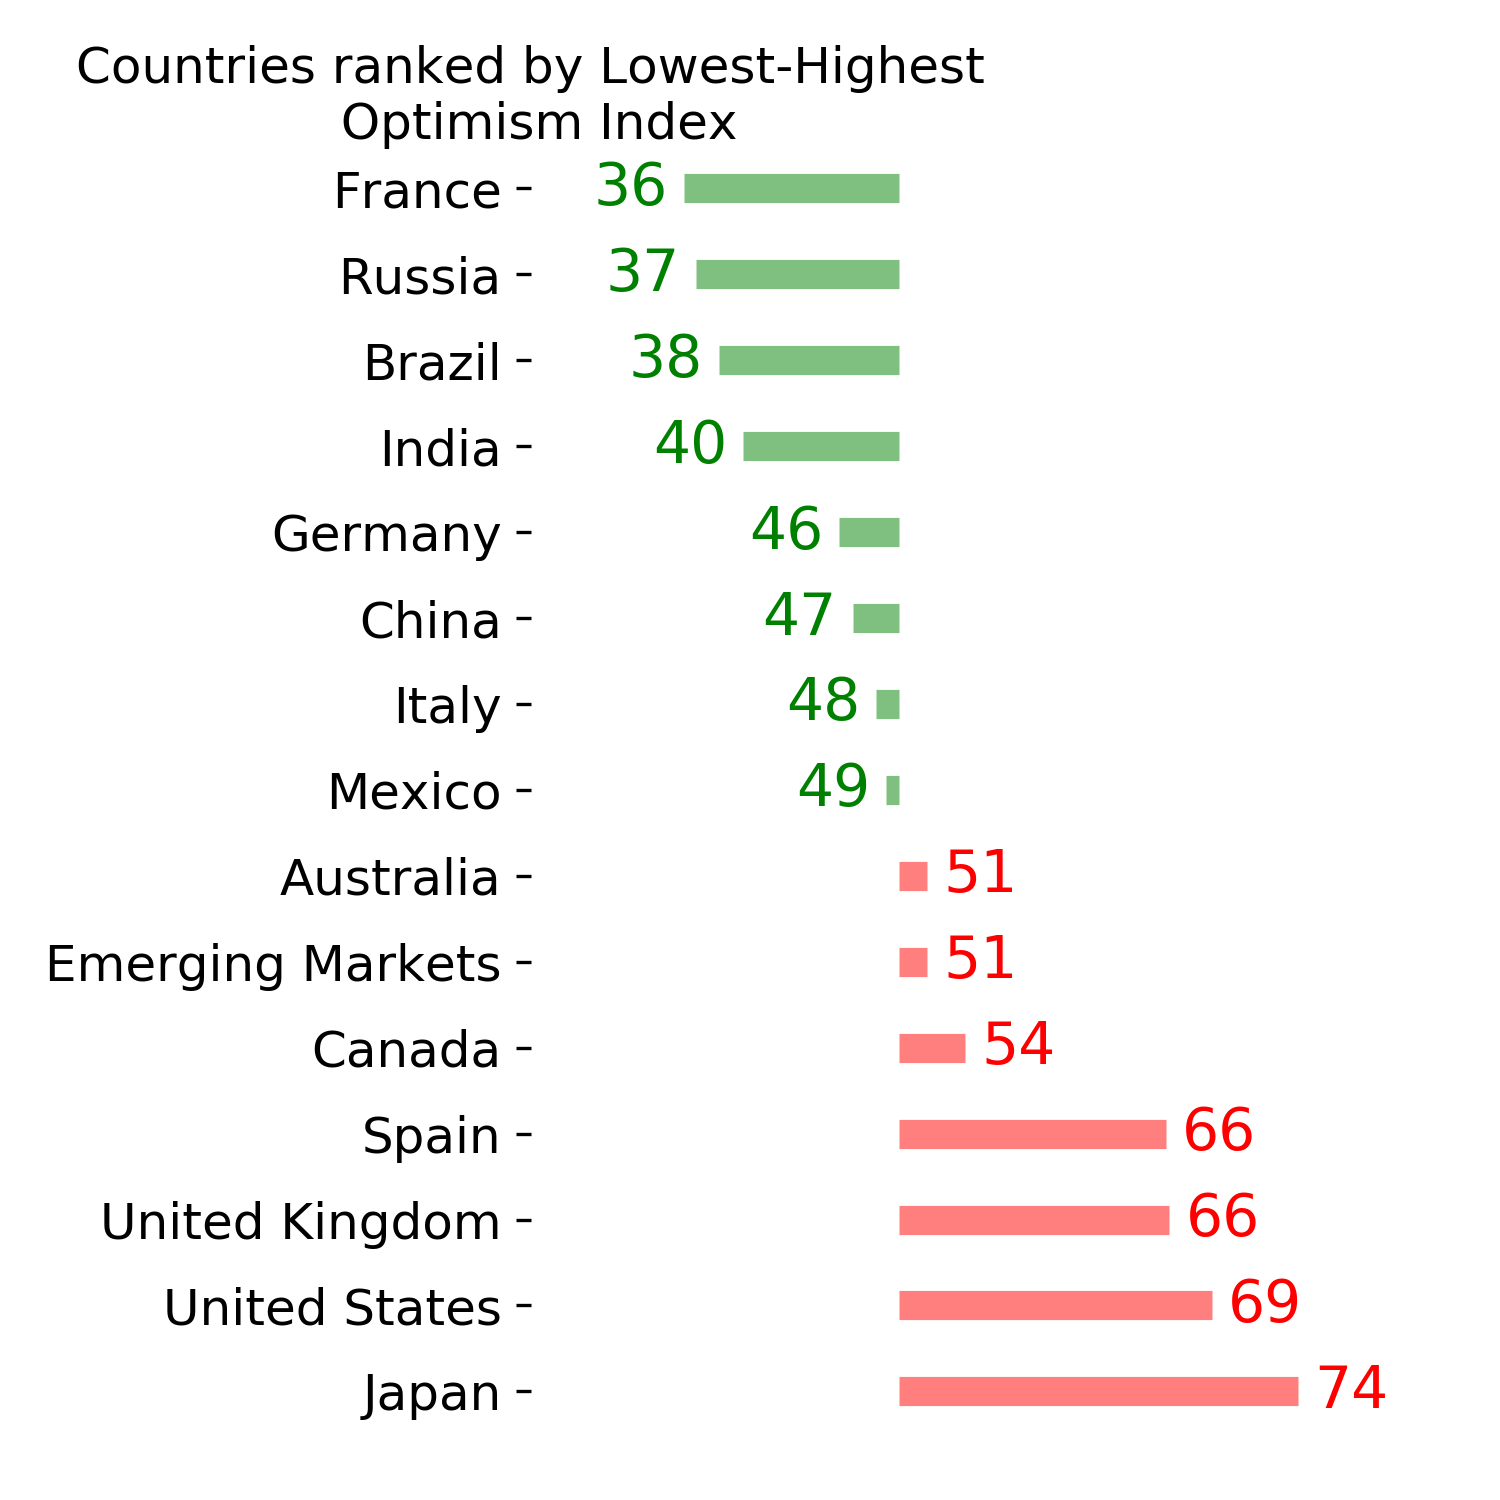
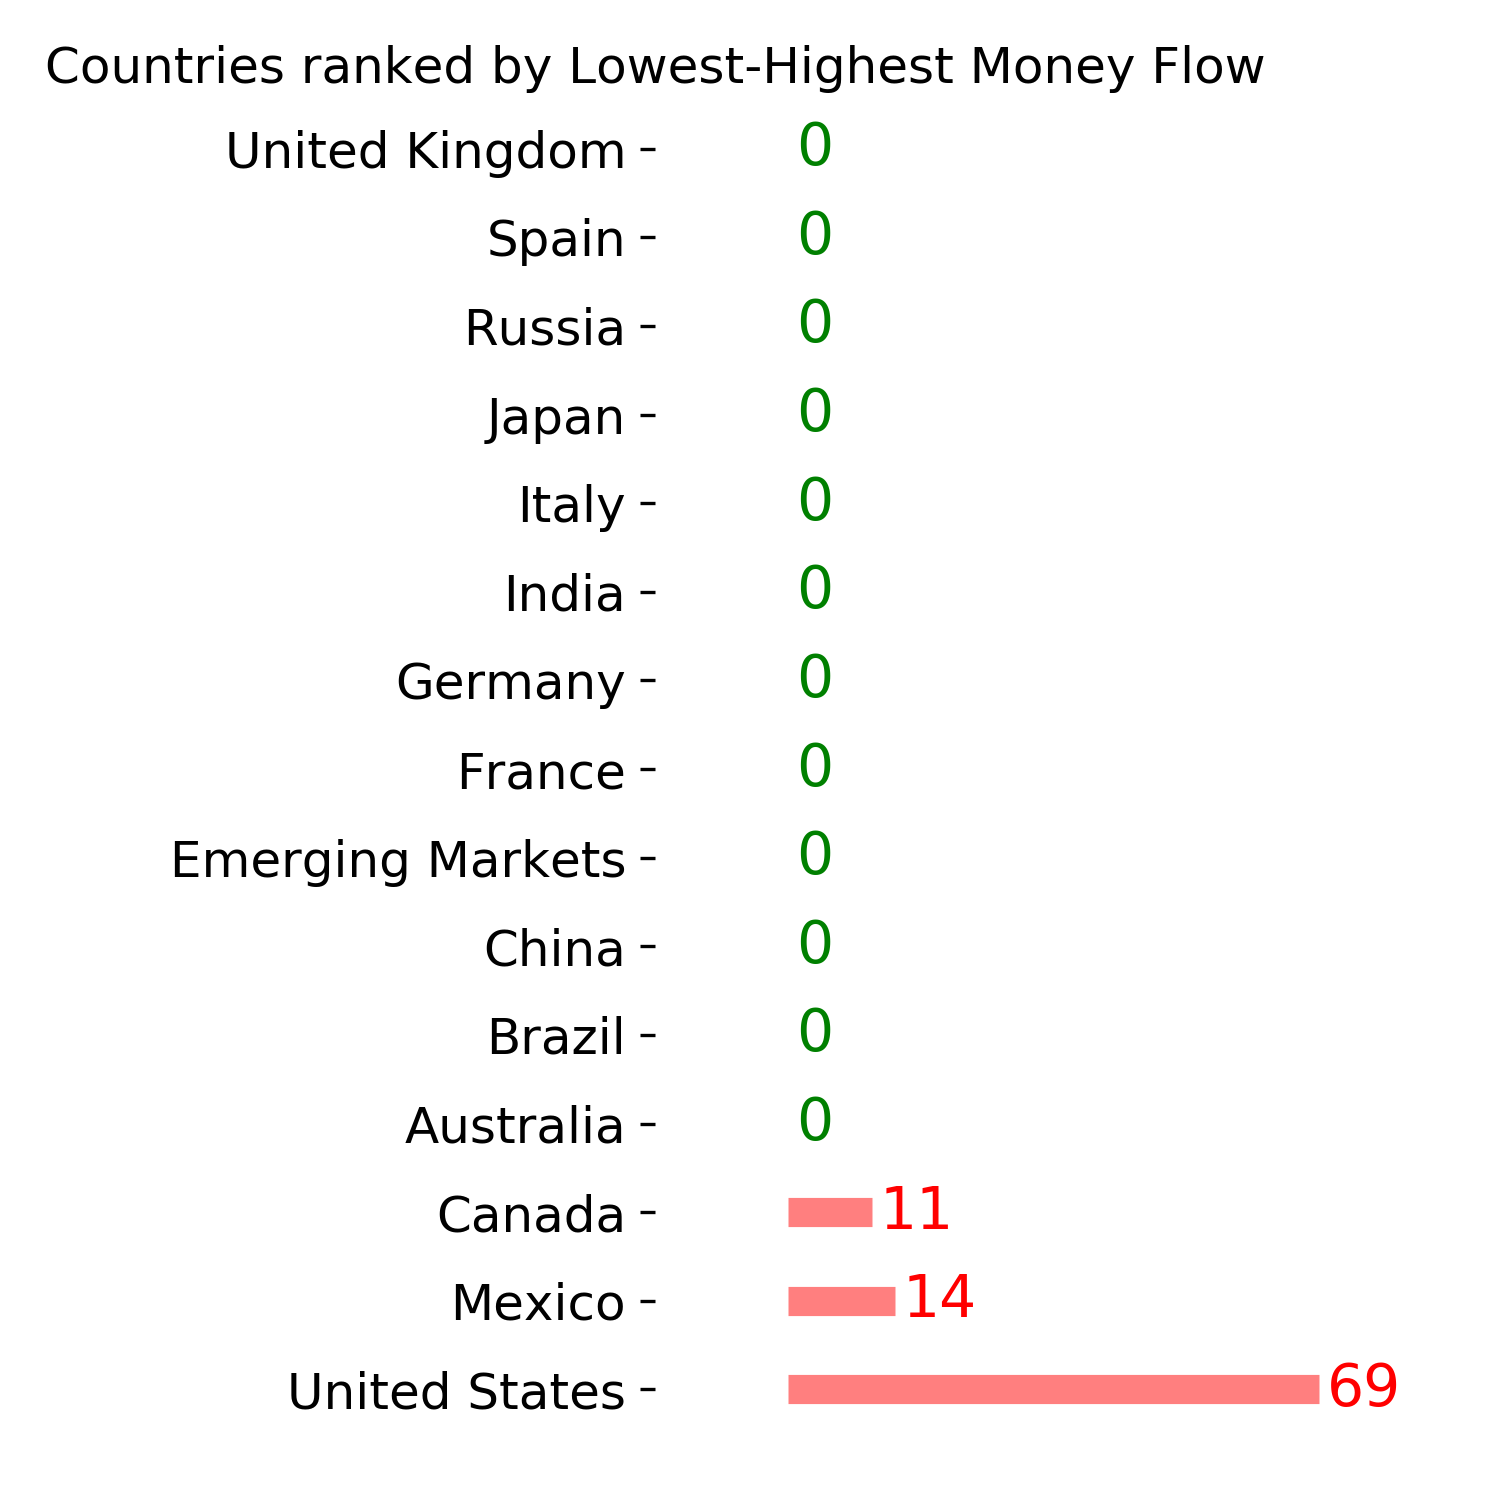
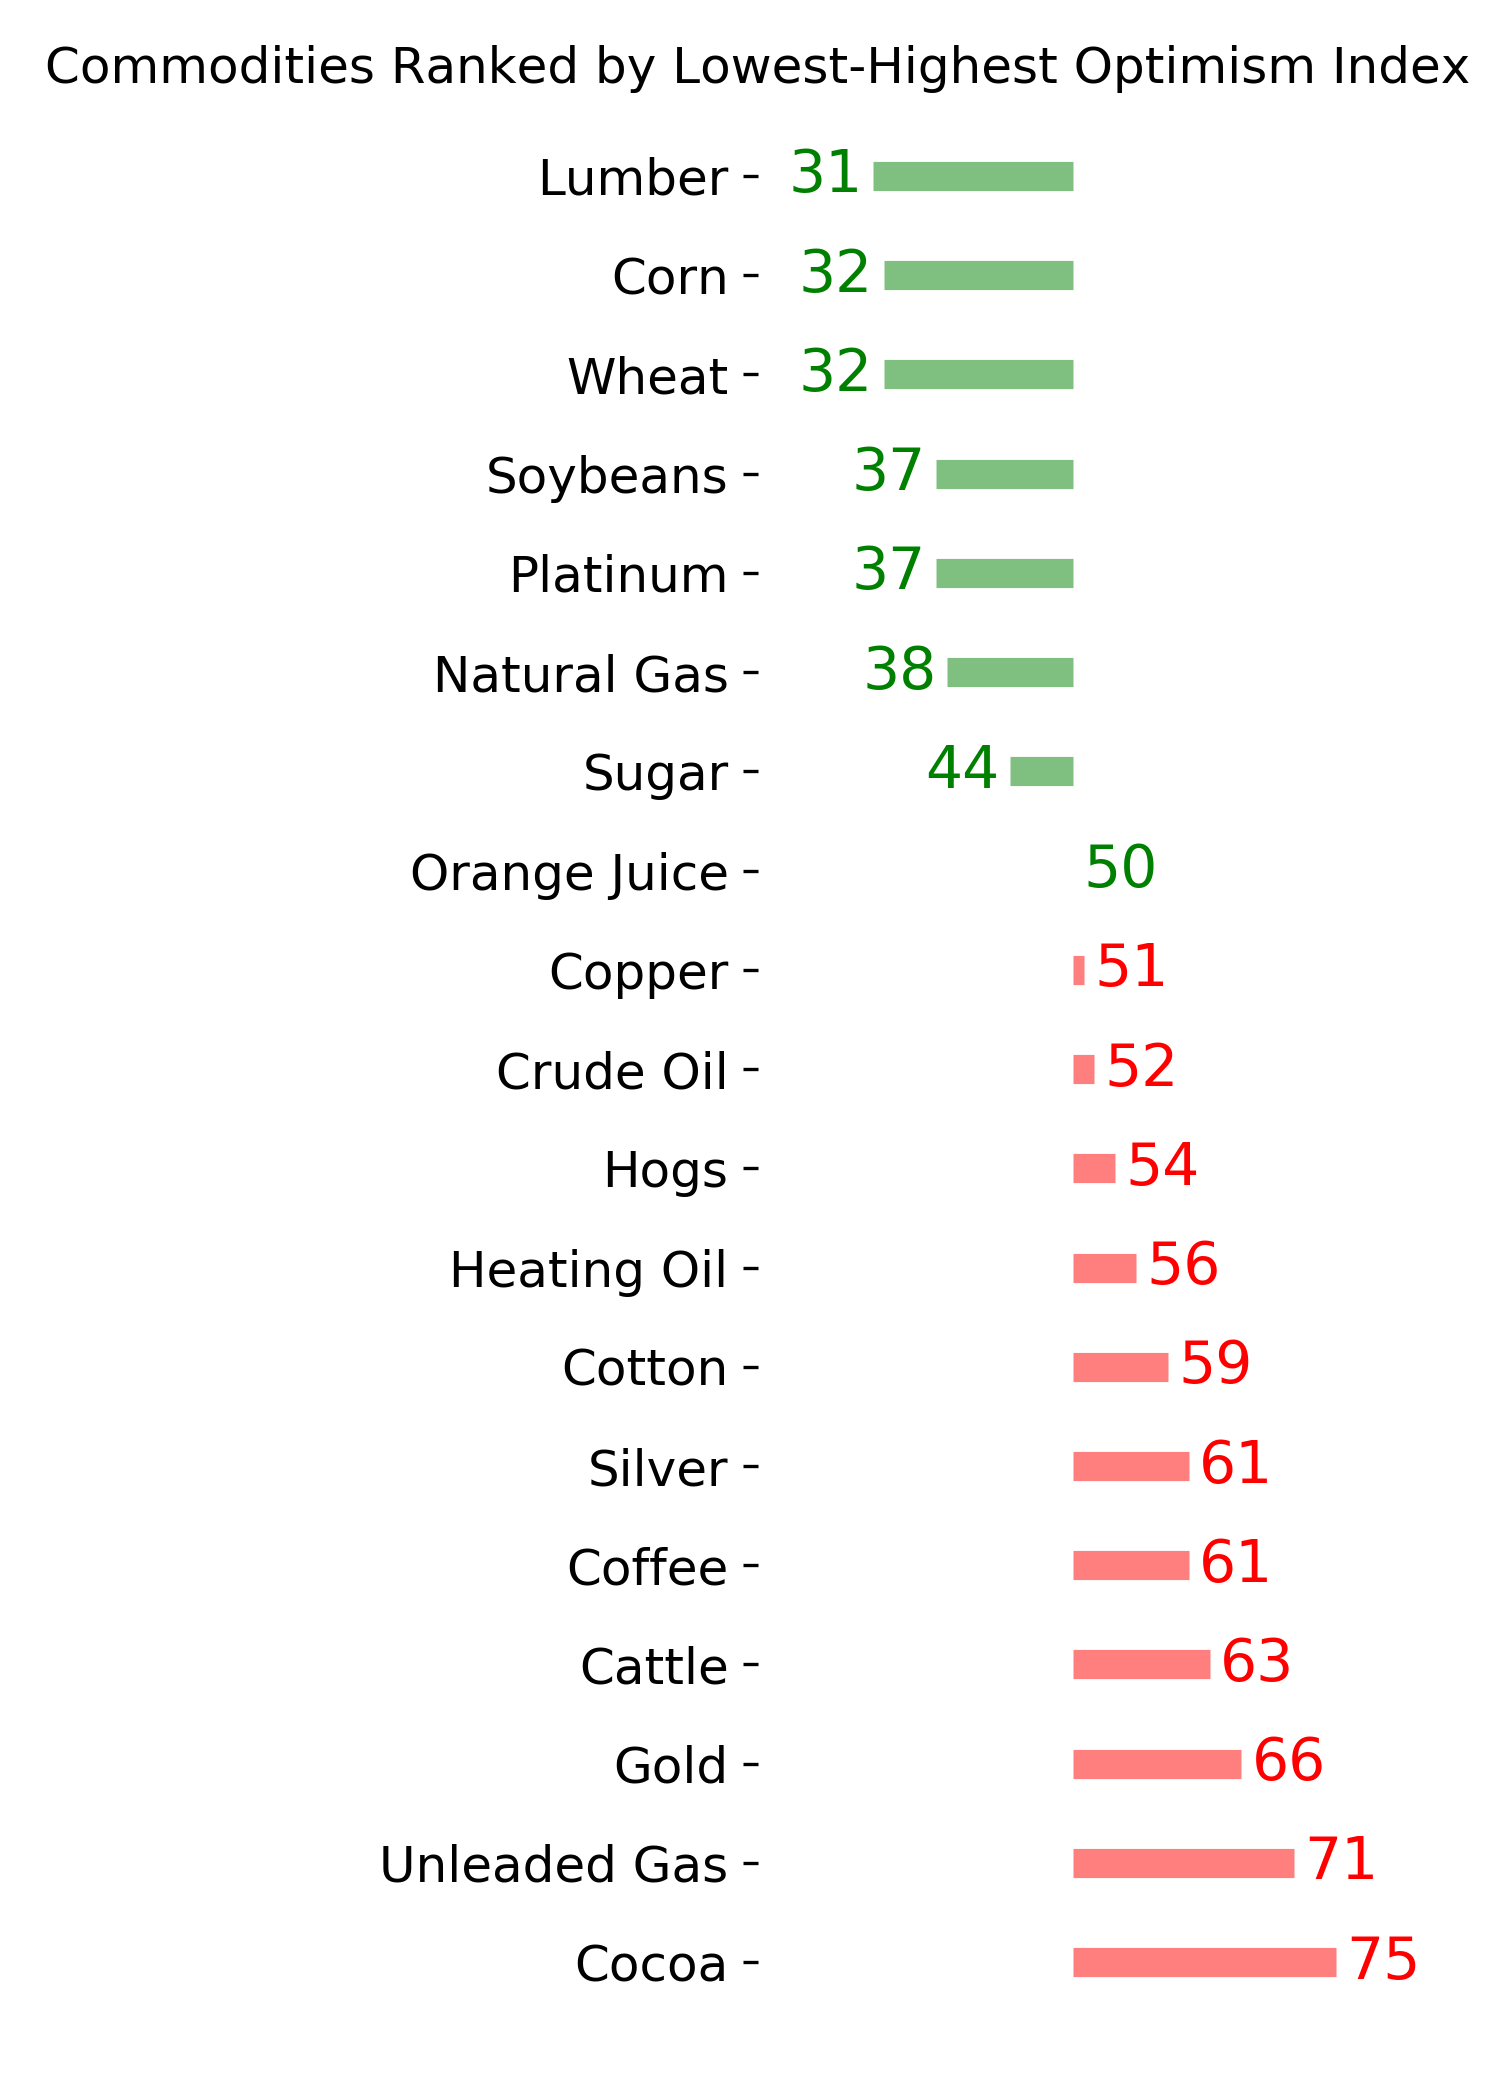
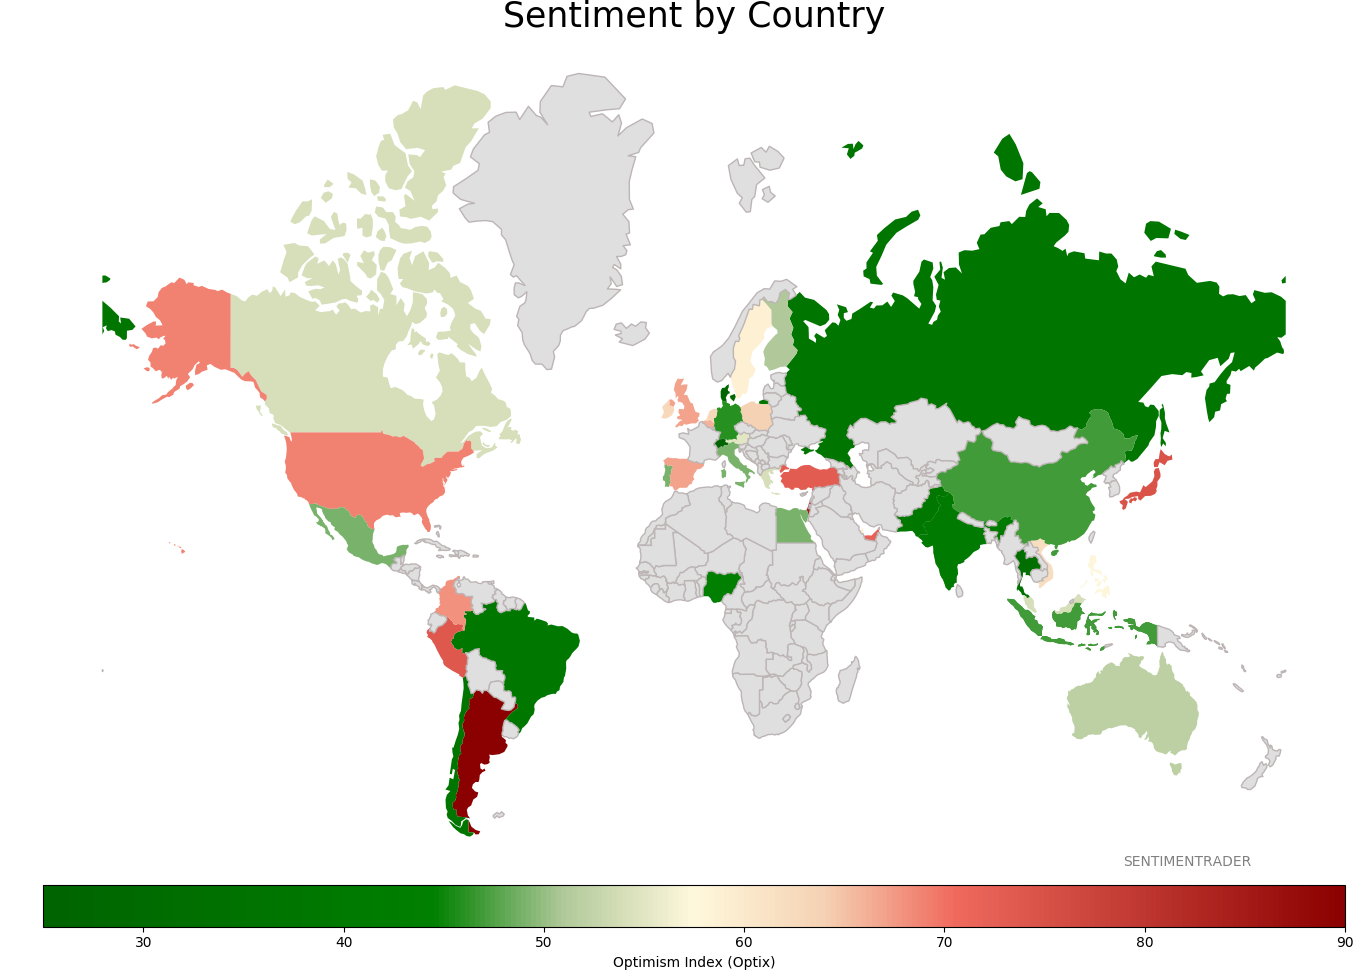
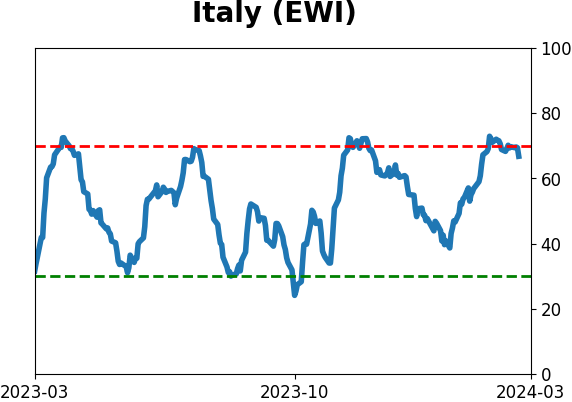
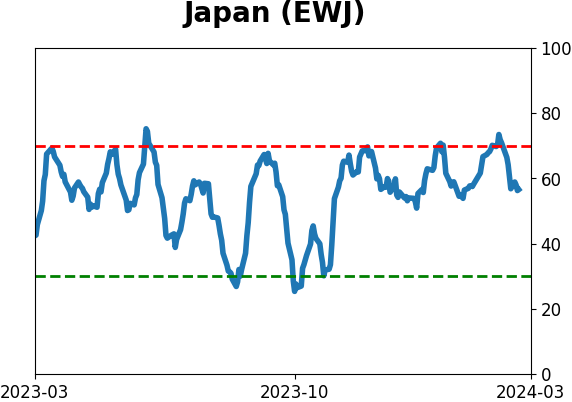
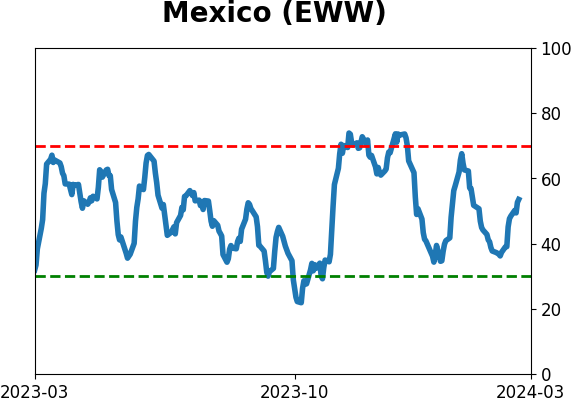
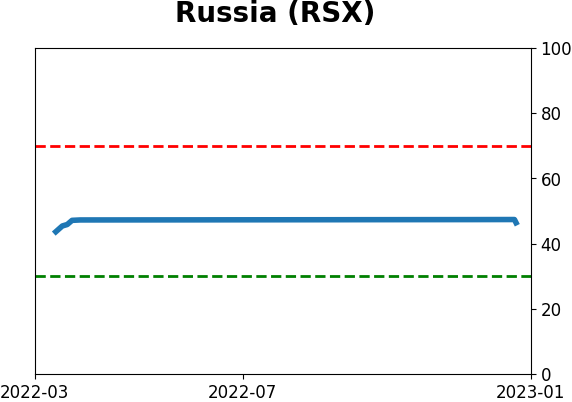
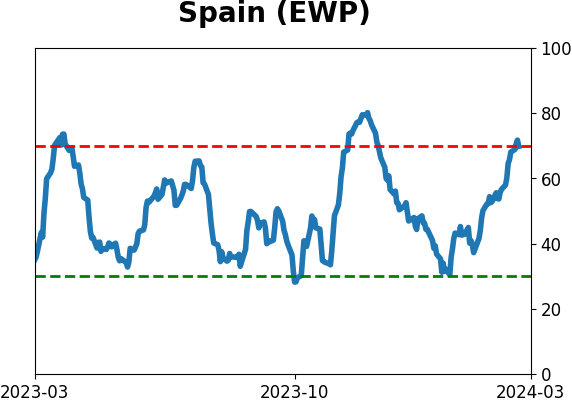
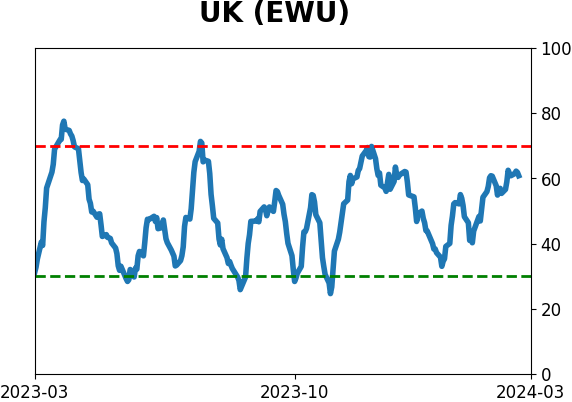
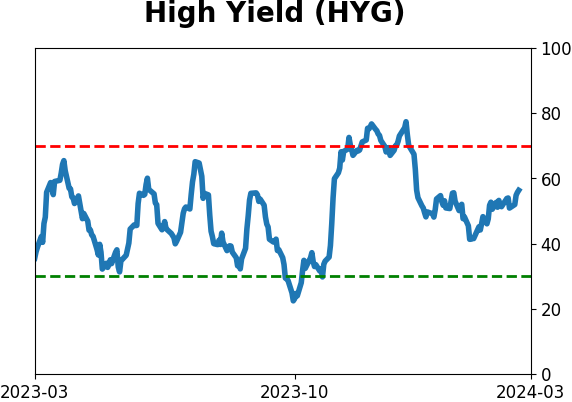
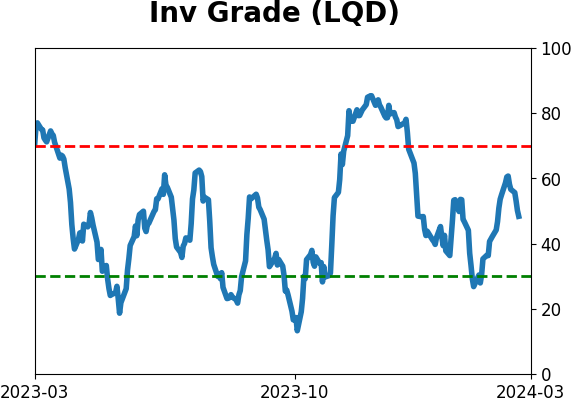
Sentiment Around The World
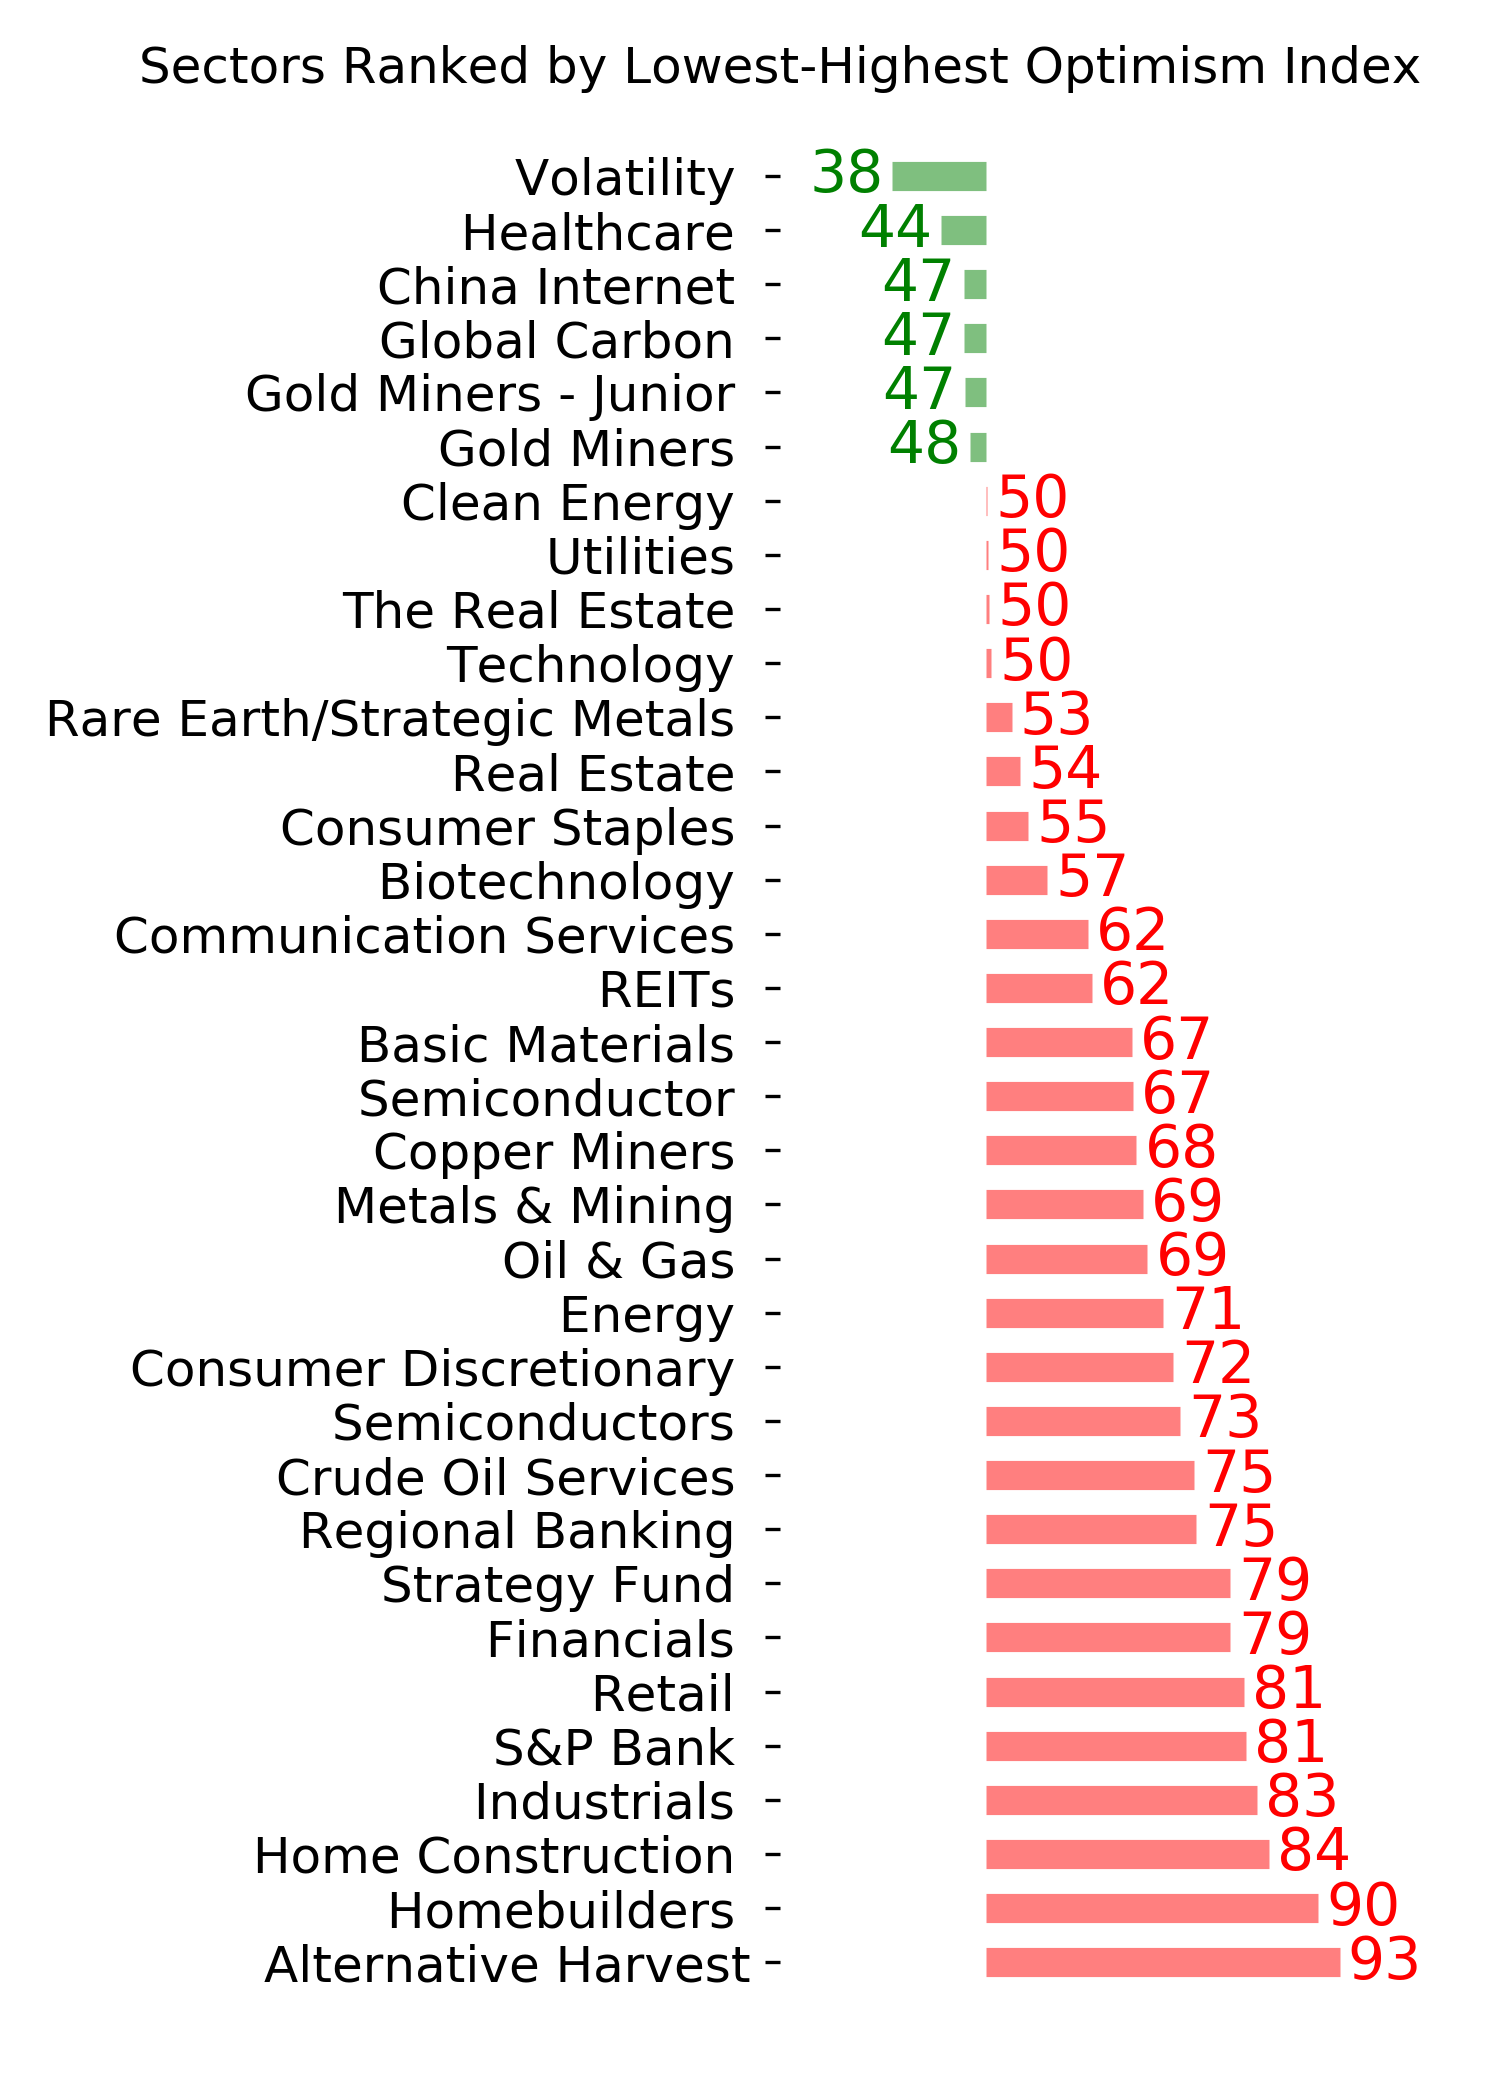
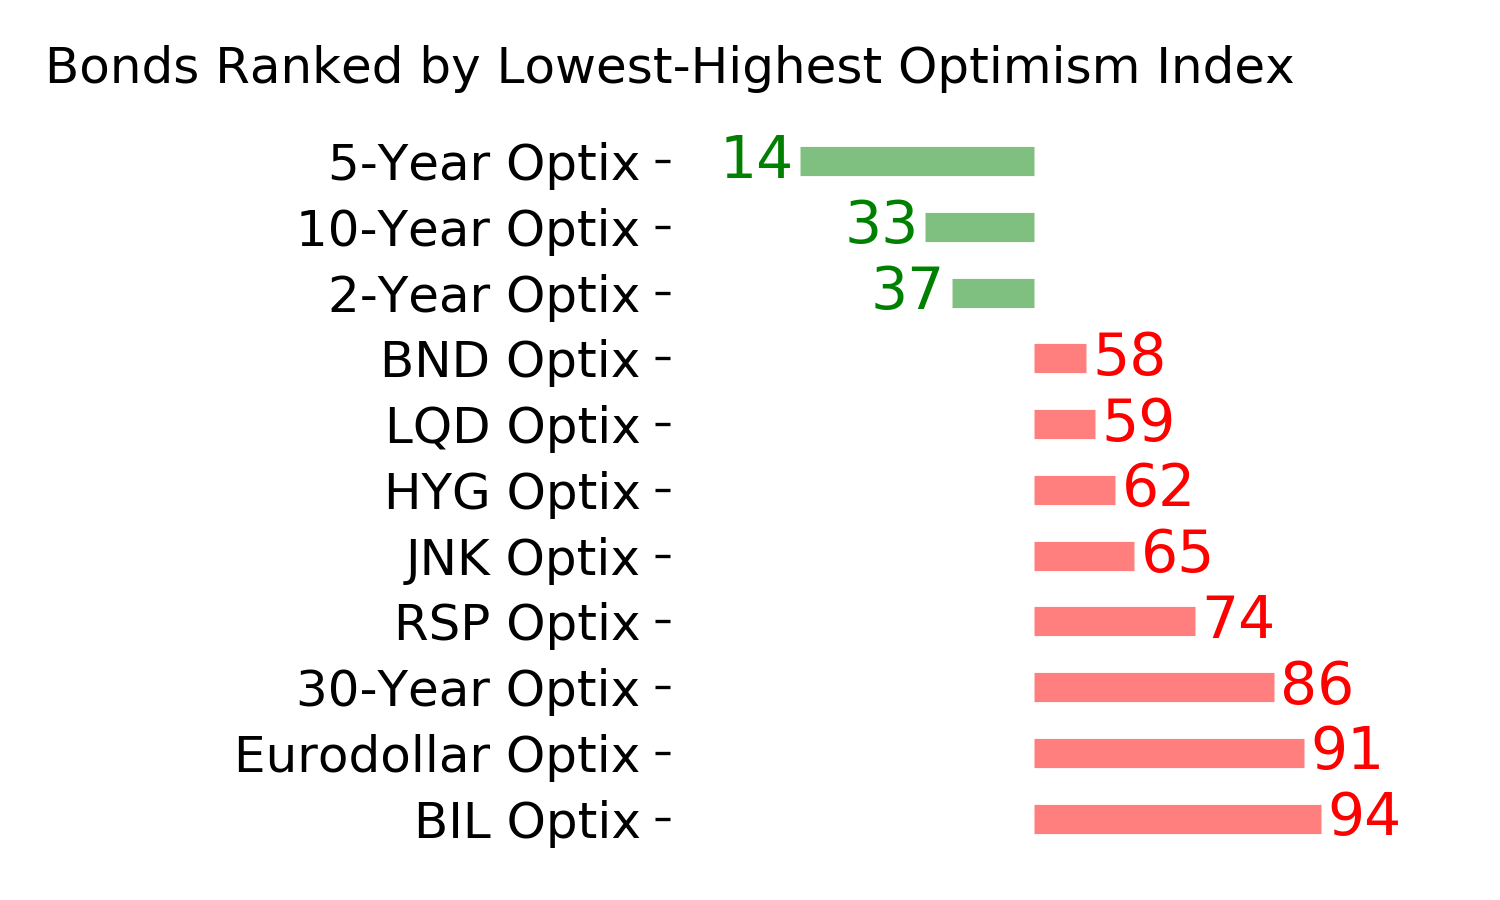
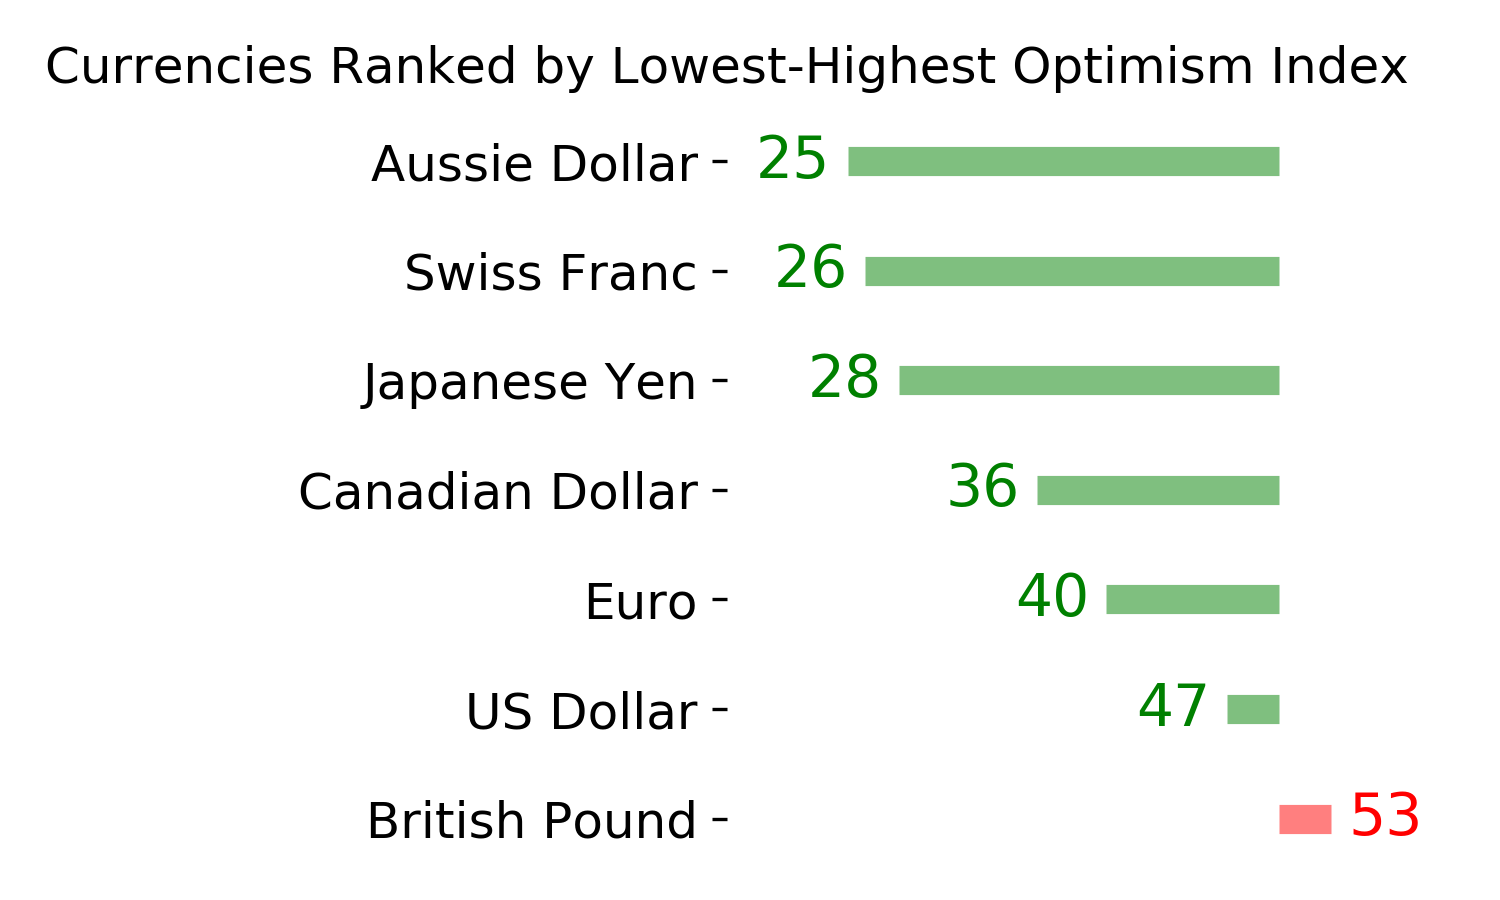
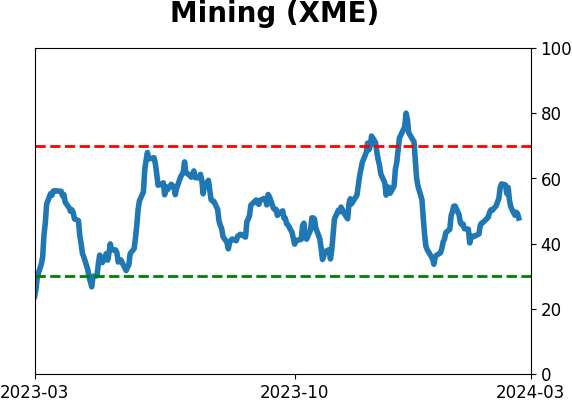
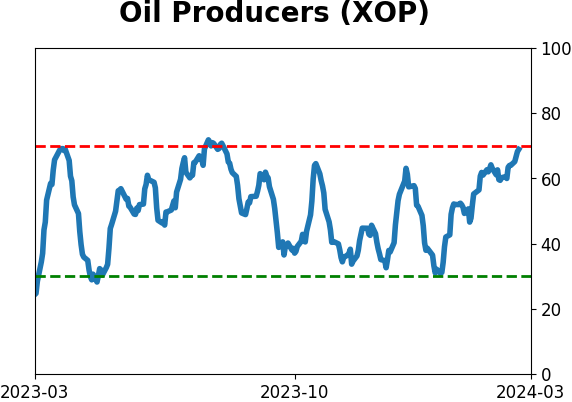
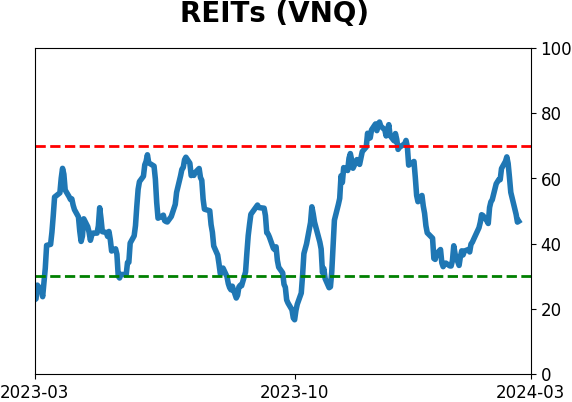
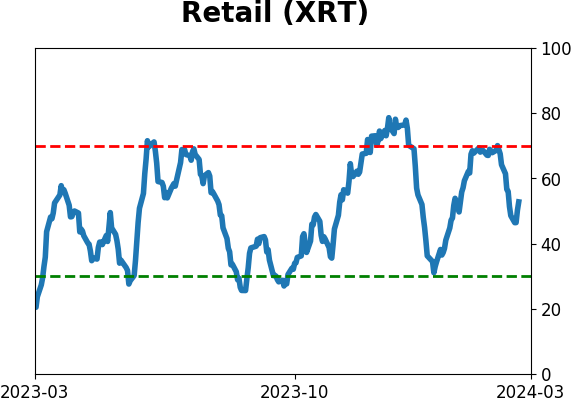
Optimism Index Thumbnails
|
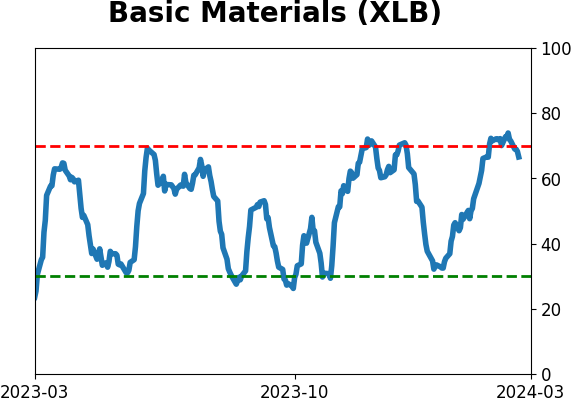
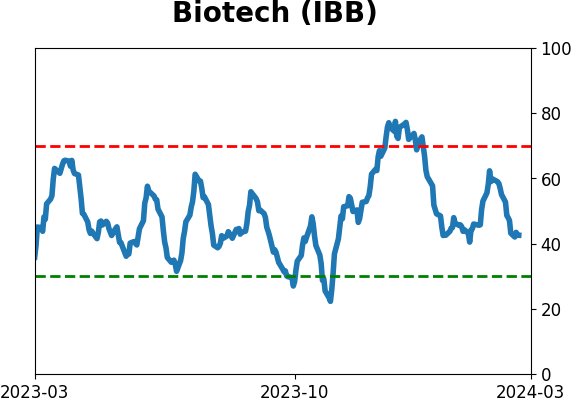
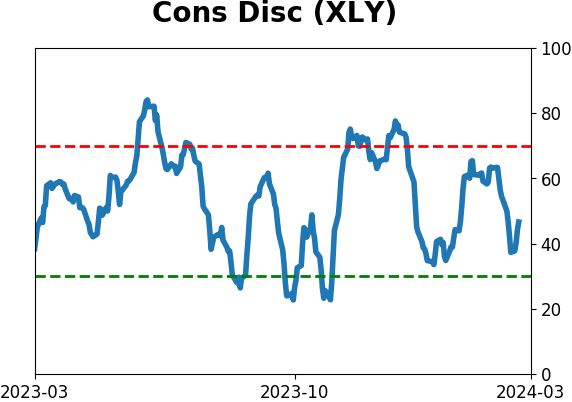
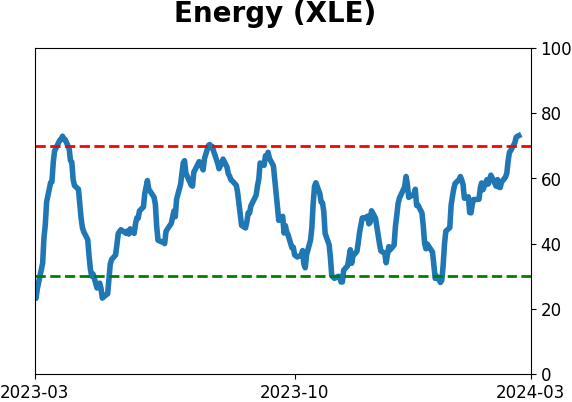
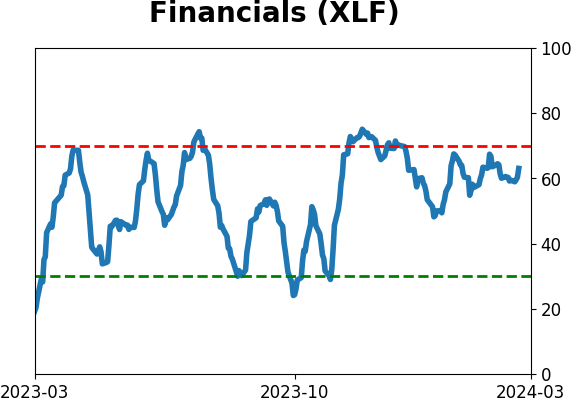
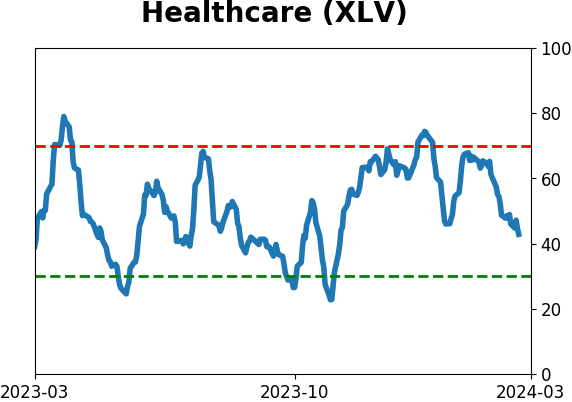
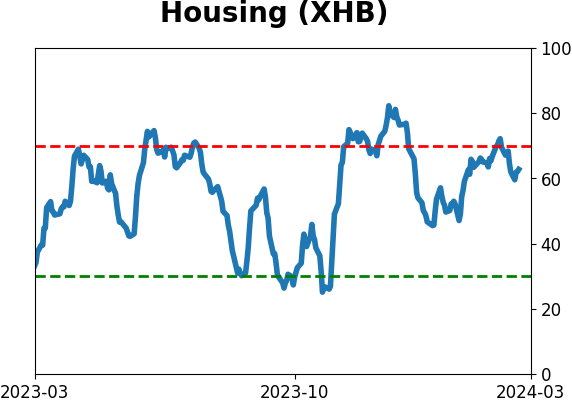
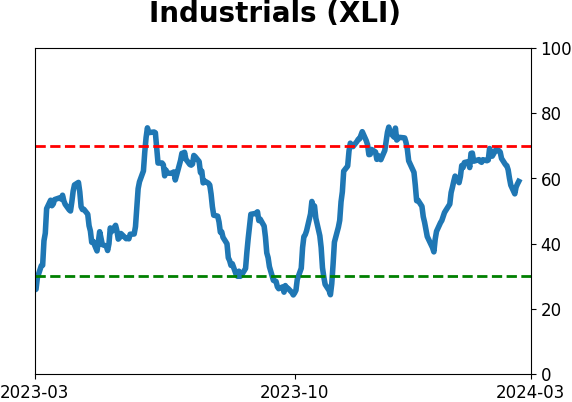
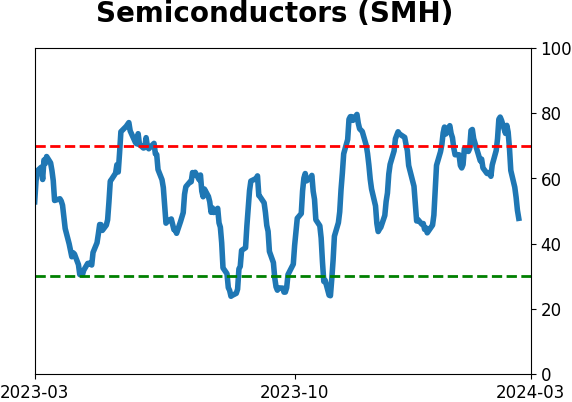
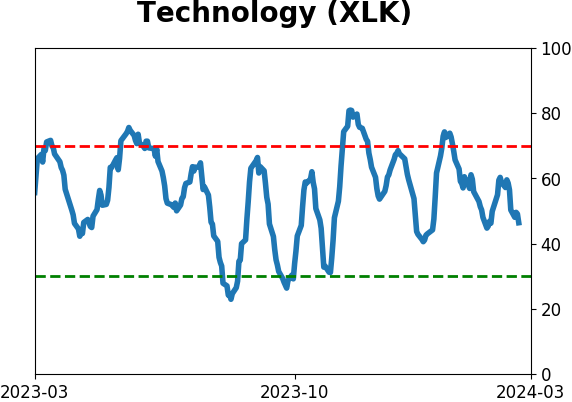
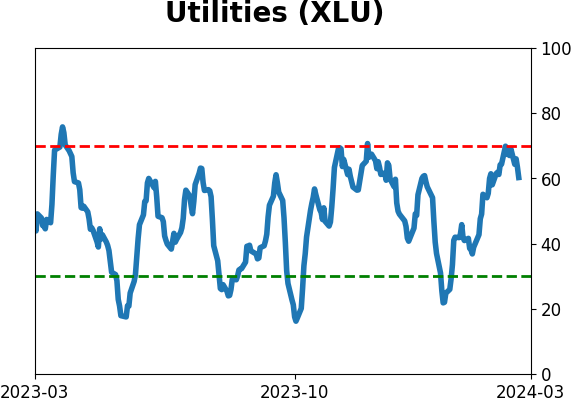
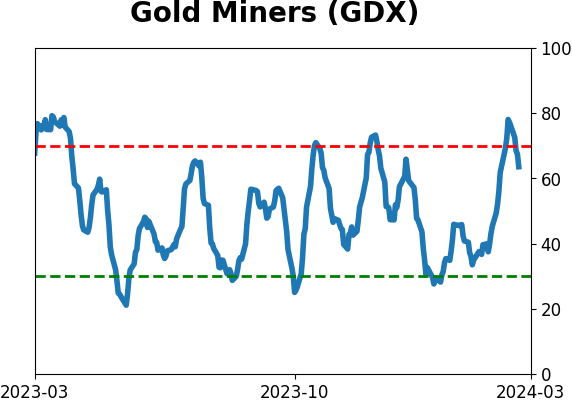
Sector ETF's - 10-Day Moving Average
|
|
|
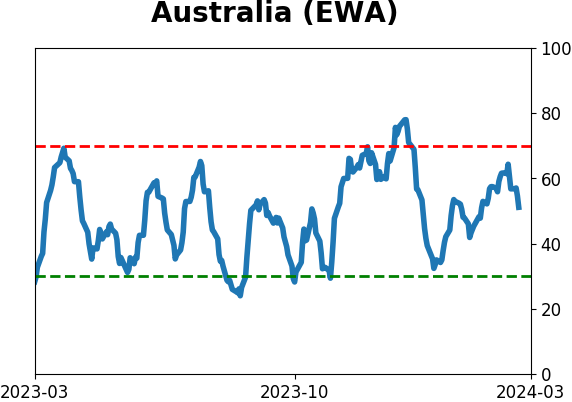
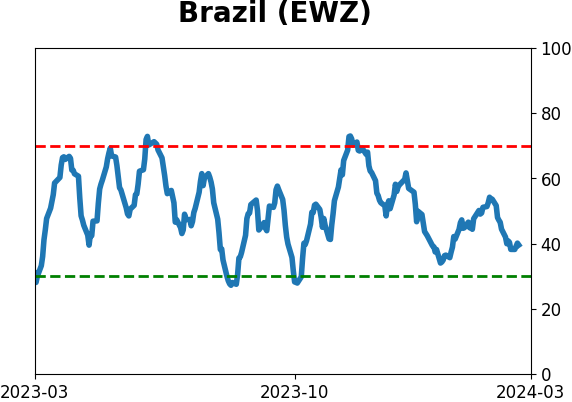
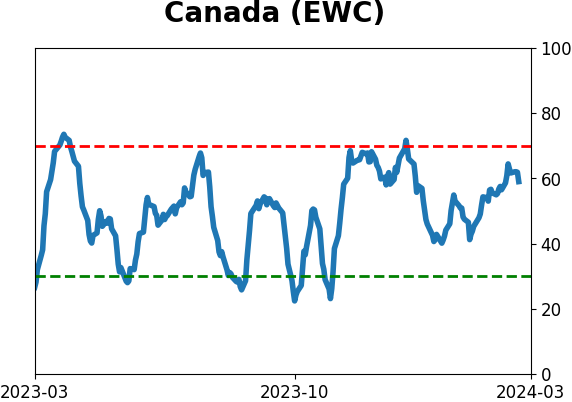
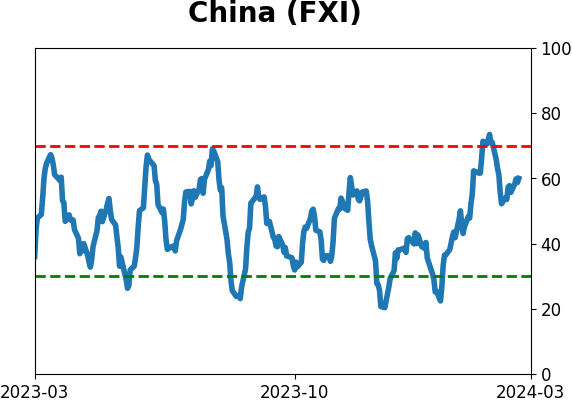
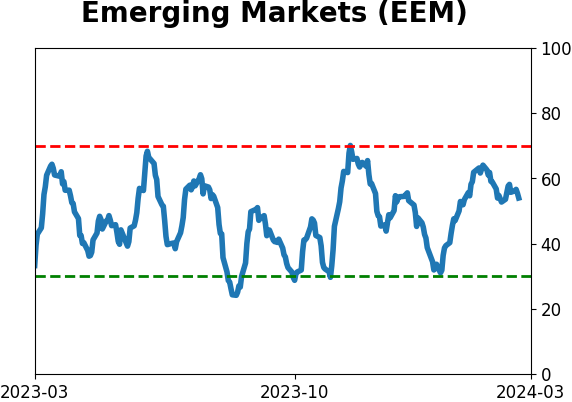
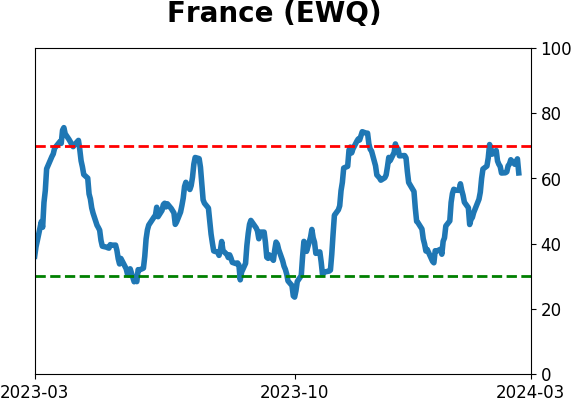
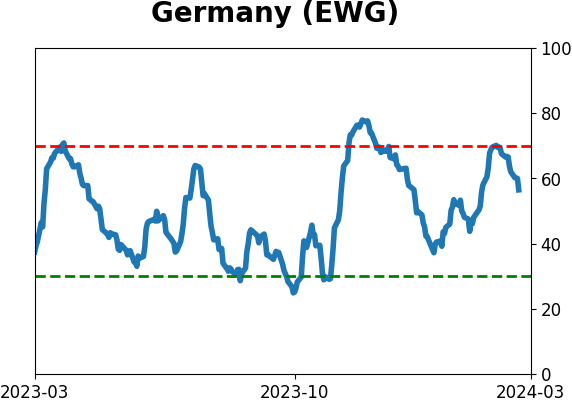
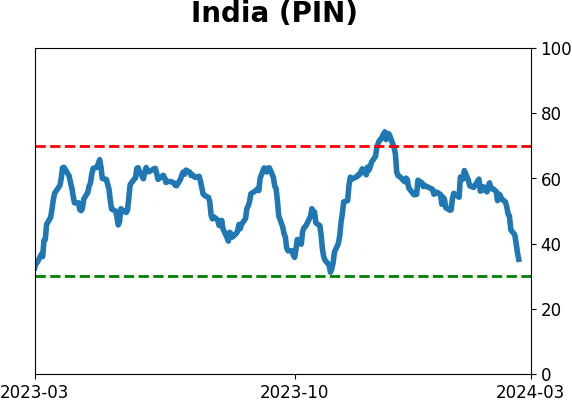
Country ETF's - 10-Day Moving Average
|
|
|
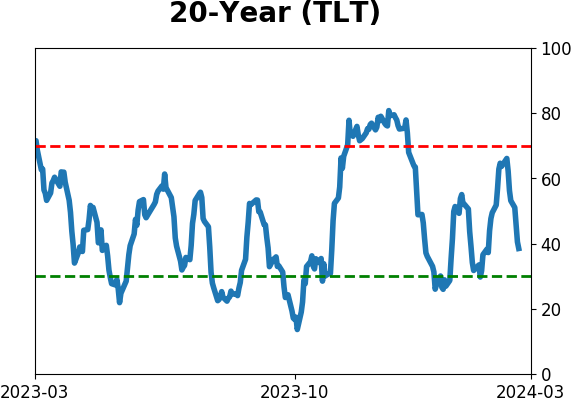
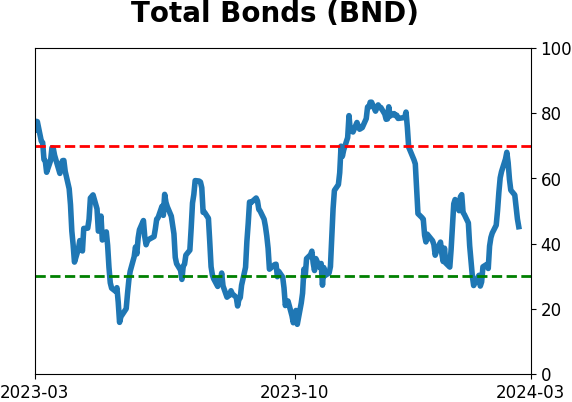
Bond ETF's - 10-Day Moving Average
|
|
|
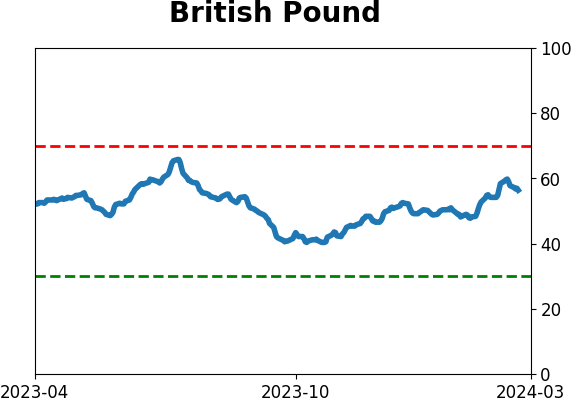
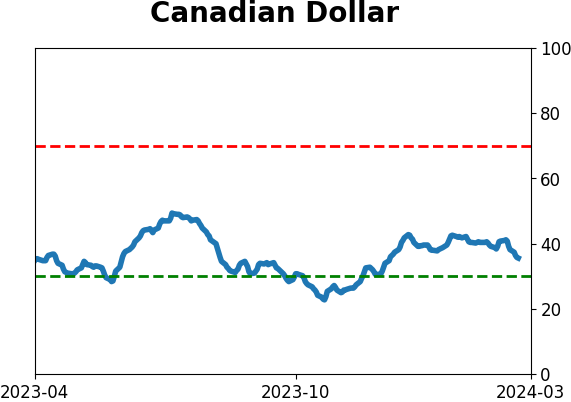
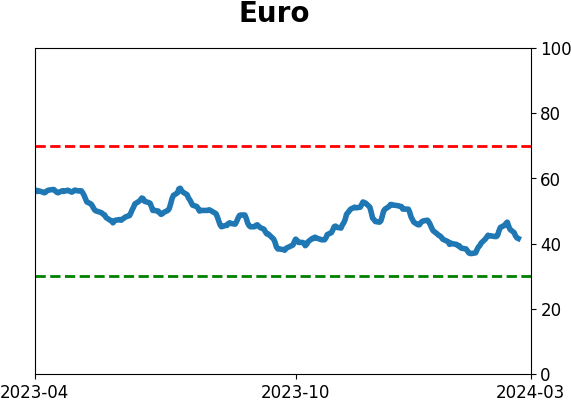
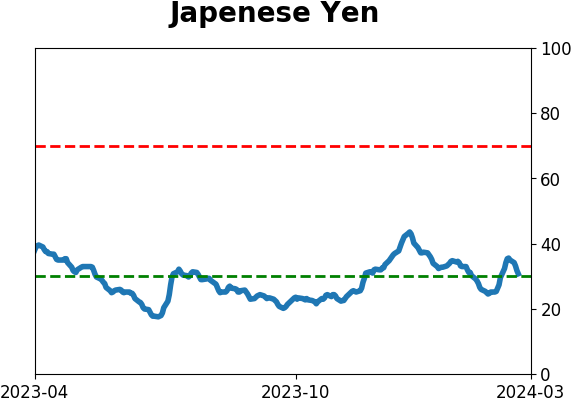
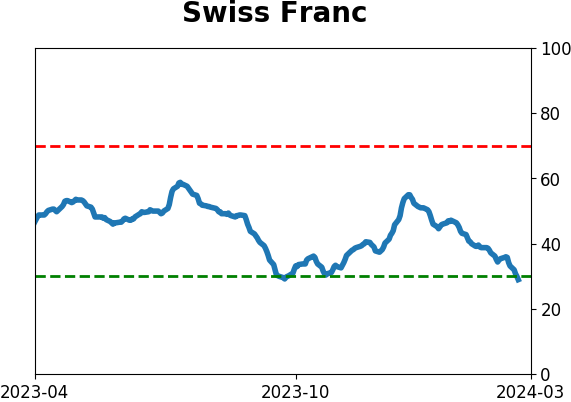
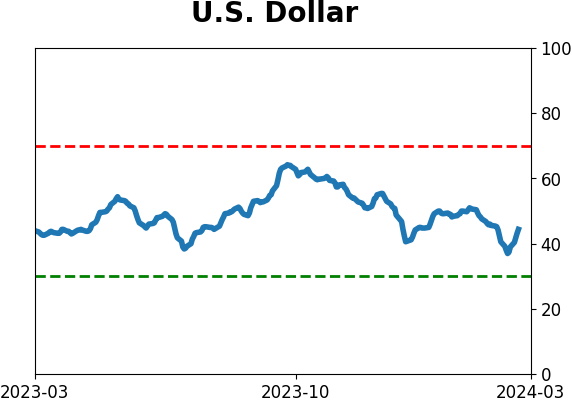
Currency ETF's - 5-Day Moving Average
|
|
|
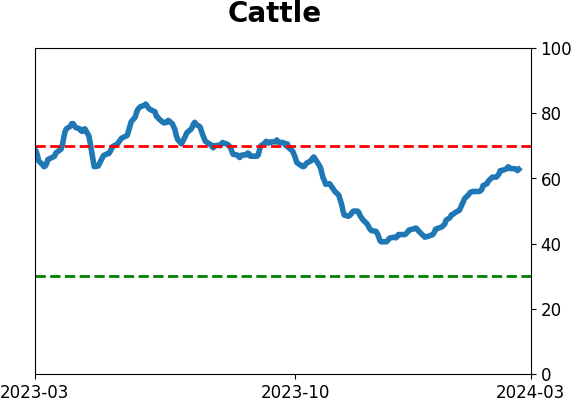
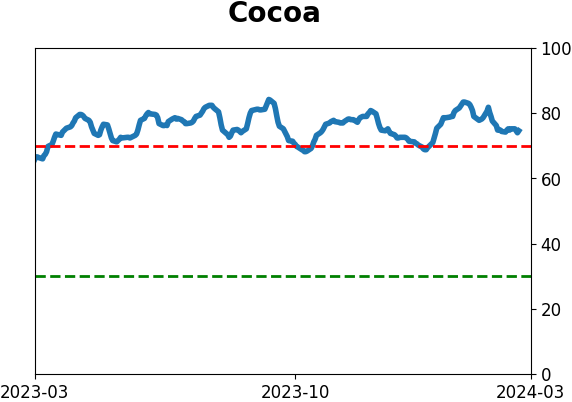
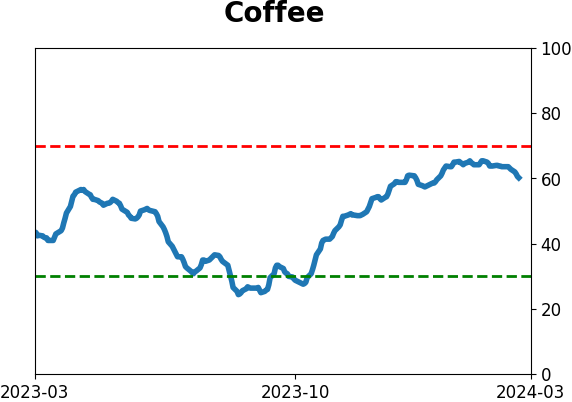
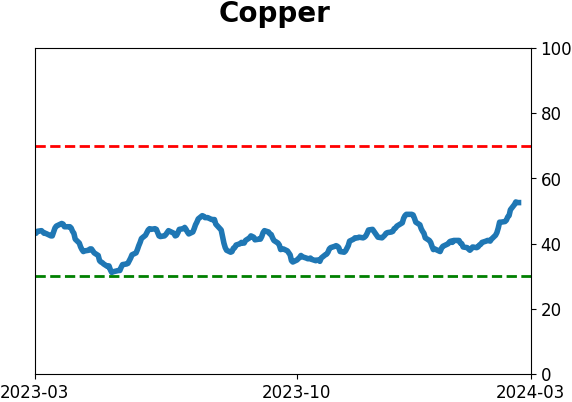
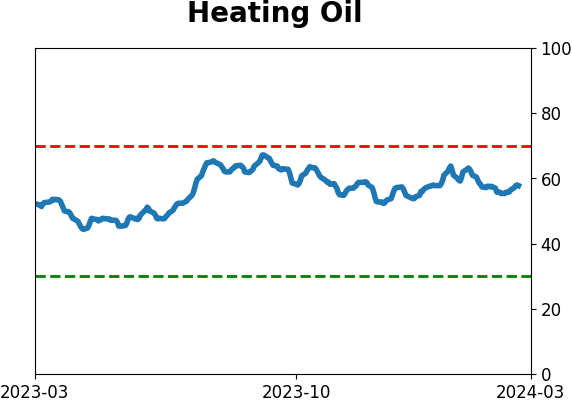
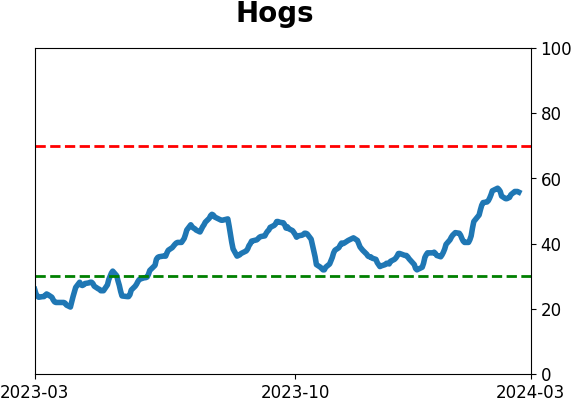
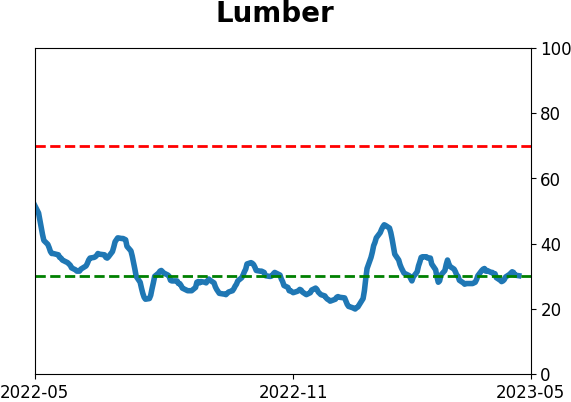
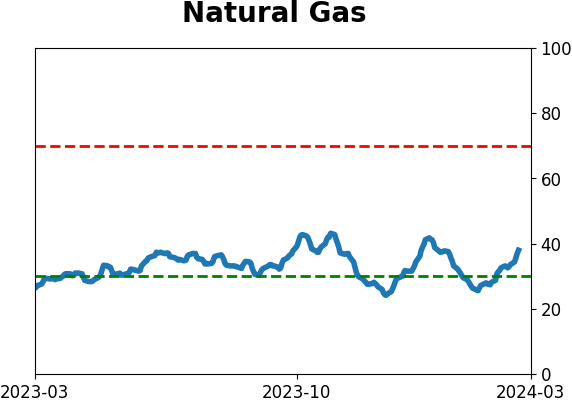
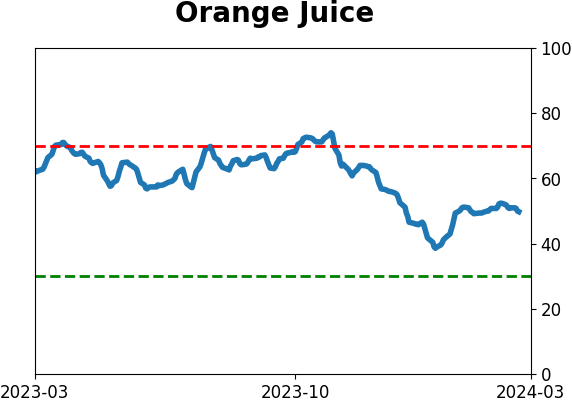
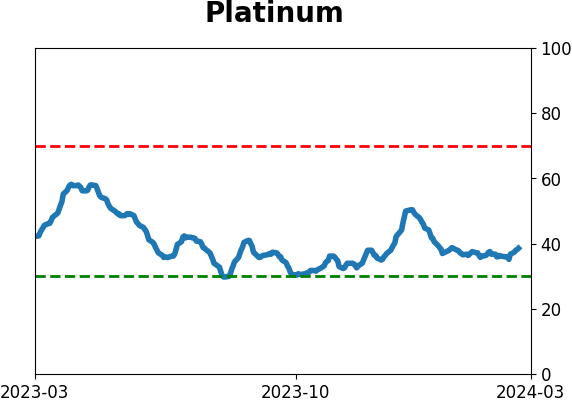
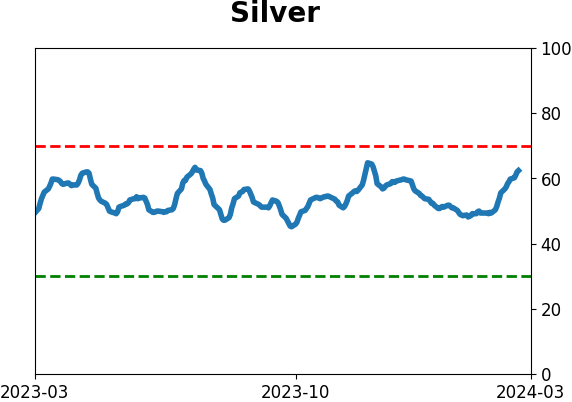
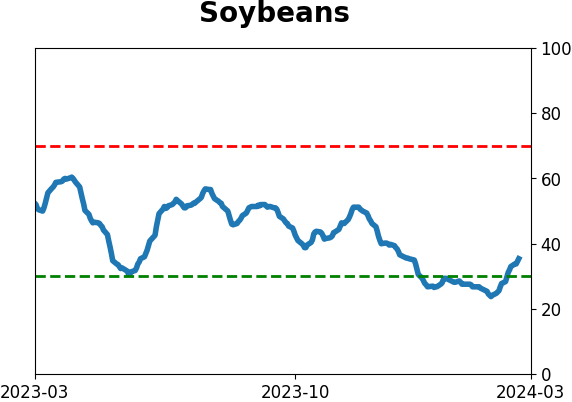
Commodity ETF's - 5-Day Moving Average
|
|