Headlines
|
|
The Typical Sentiment Cycle is turning:
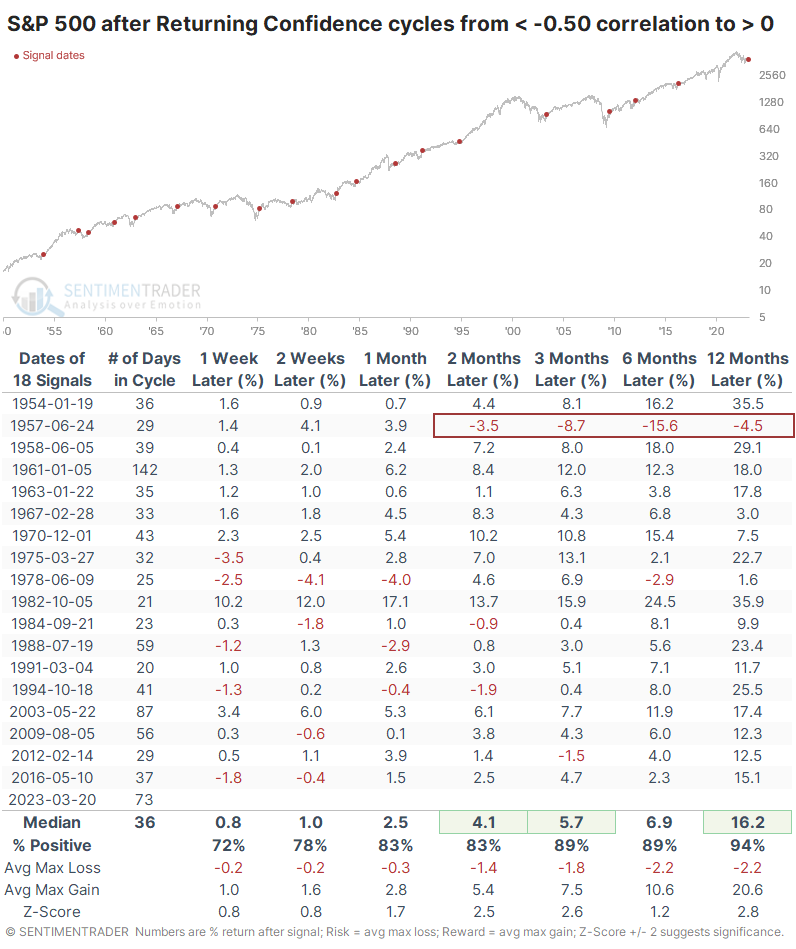
When we look at the price action of the S&P 500 versus the Typical Sentiment Cycle, it is looking more and more like the Returning Confidence part of the cycle. This is a stark change from prior months when Discouragement was evident. After similar cycles, future returns in the index were excellent, but only since 1950.
|
Smart / Dumb Money Confidence
|
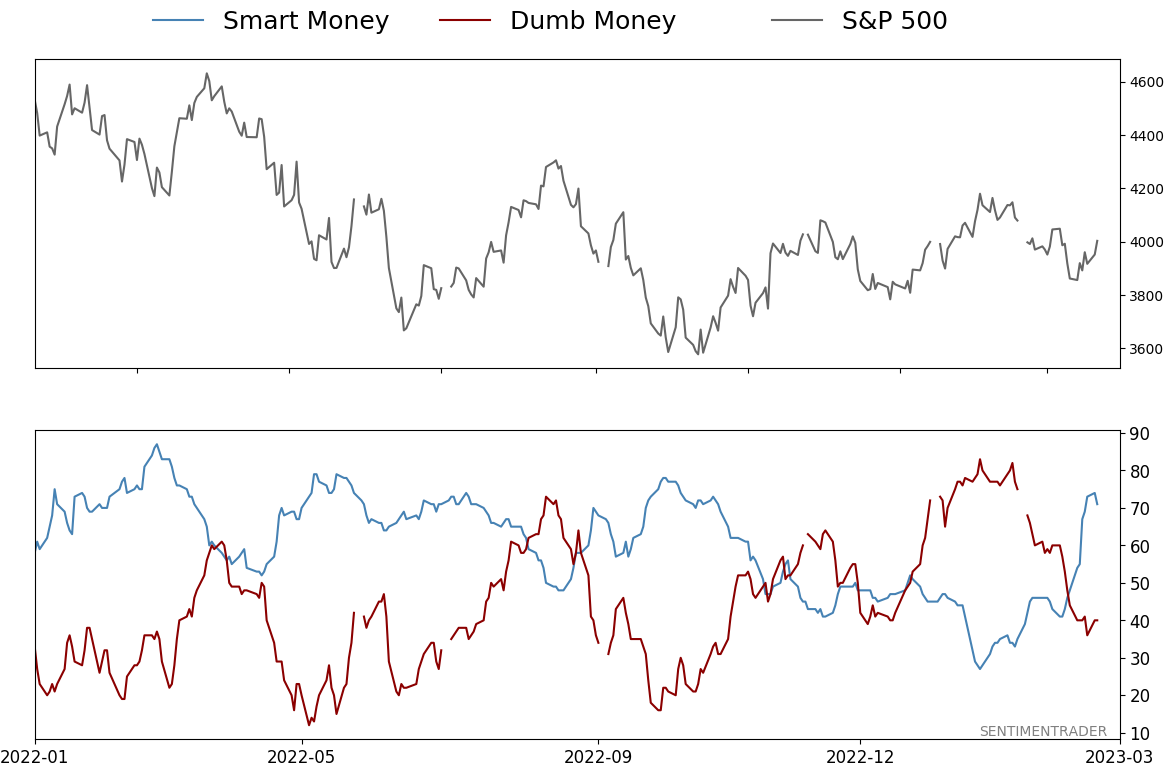
Smart Money Confidence: 71%
Dumb Money Confidence: 40%
|
|
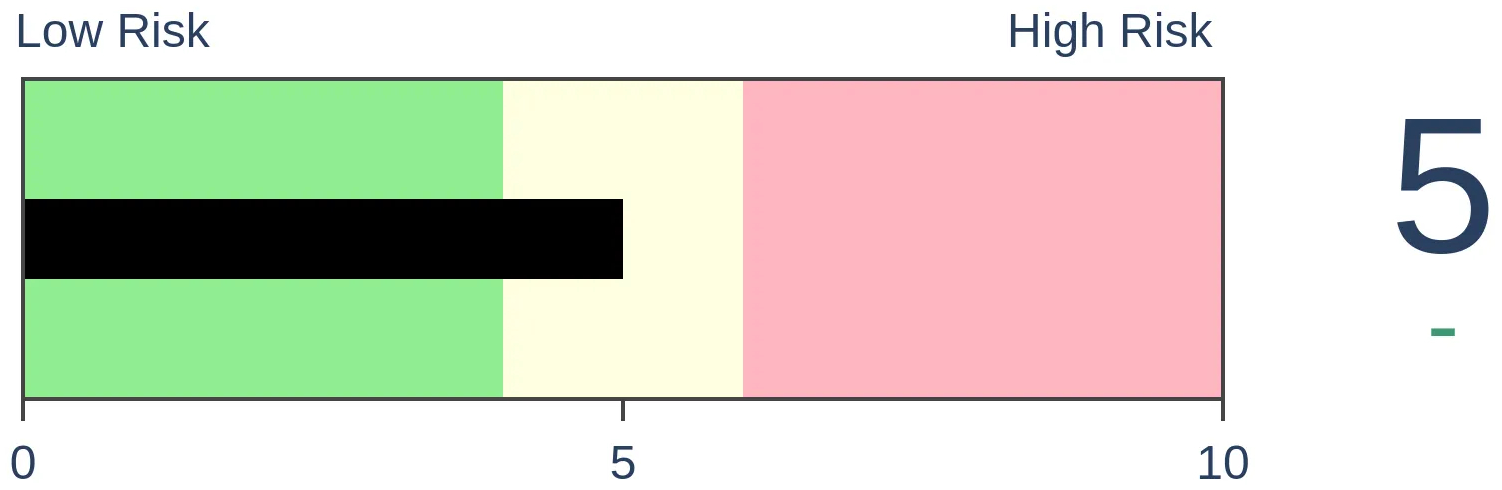
Risk Levels
Stocks Short-Term
|
Stocks Medium-Term
|
|
Bonds

|
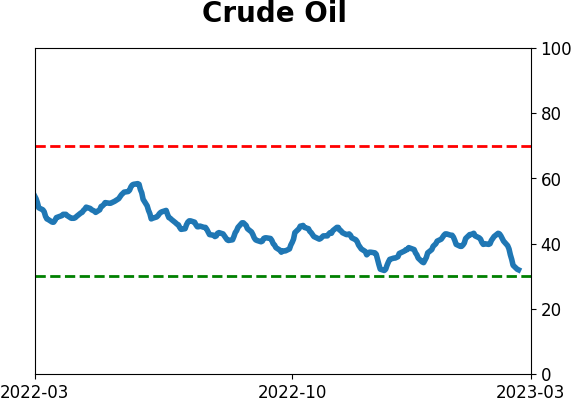
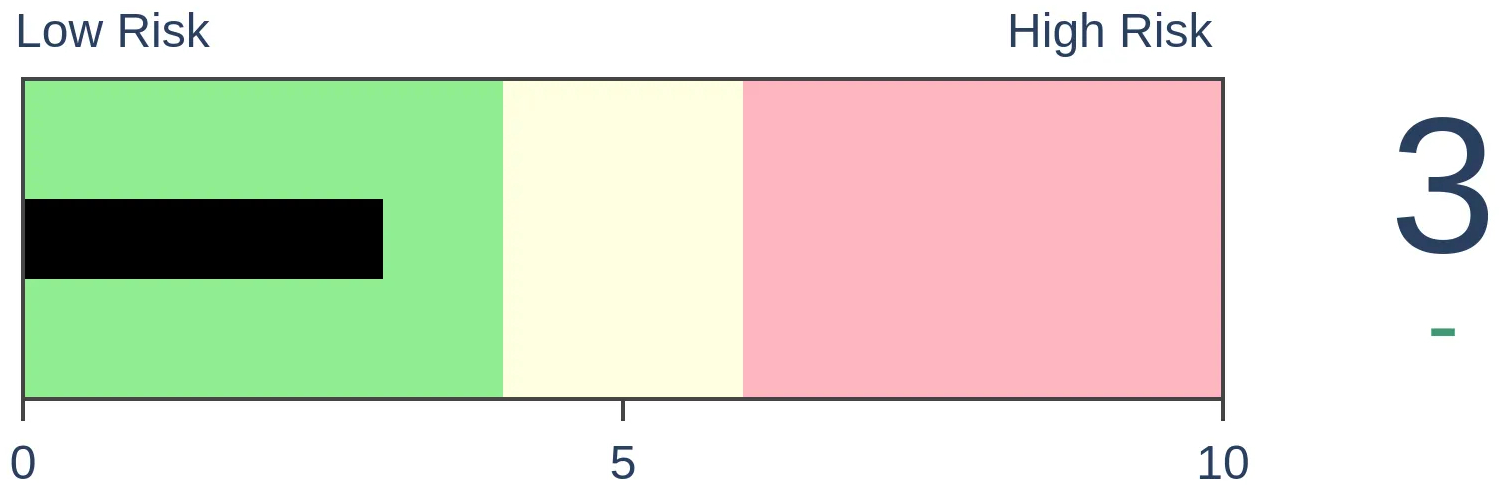
Crude Oil
|
|
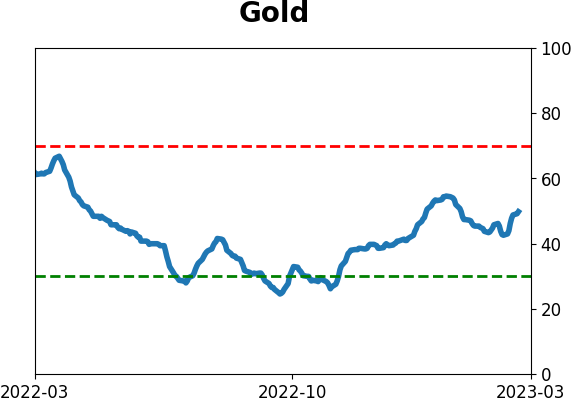
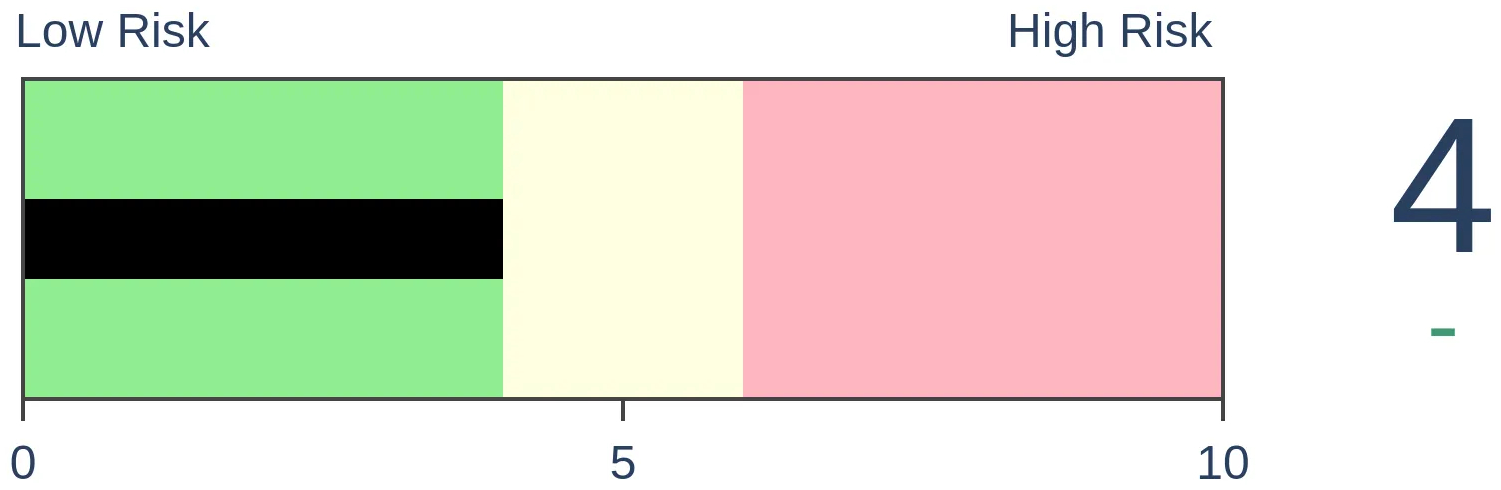
Gold

|
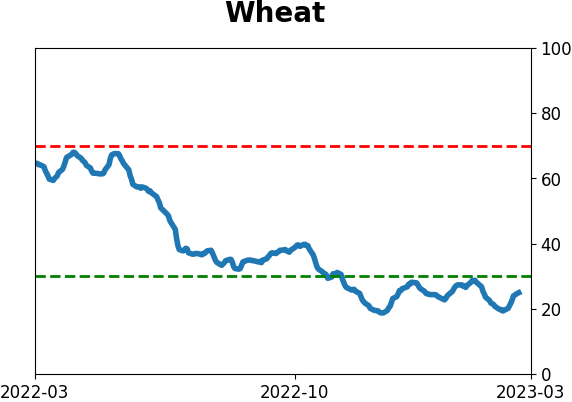
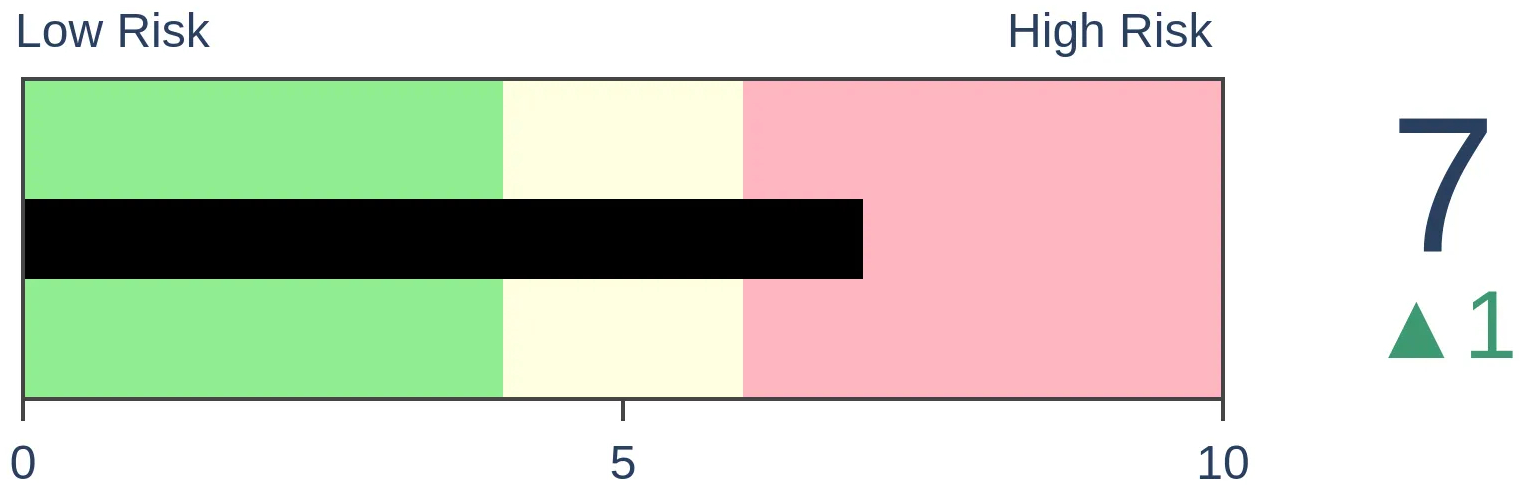
Agriculture
|
|
Research
By Jason Goepfert
BOTTOM LINE
When we look at the price action of the S&P 500 versus the Typical Sentiment Cycle, it is looking more and more like the Returning Confidence part of the cycle. This is a stark change from prior months when Discouragement was evident. After similar cycles, future returns in the index were excellent, but only since 1950.
FORECAST / TIMEFRAME
None
|
Key points:
- Last year, S&P 500 price action showed a high and protracted correlation to Discouragement in the Typical Sentiment Cycle
- It has since turned, and correlations are pointing to the Returning Confidence part of the Cycle
- After similar behavior, the S&P performed very well over the medium term, but only since 1950
The Typical Sentiment Cycle is turning
Last October, we saw that according to the Typcial Sentiment Cycle, investors had been woefully discouraged for a historic length of time.
A popular heuristic uses some version of the Cycle popularized by Justin Mamis in his 1999 book, The Nature of Risk. The Mamis chart encompasses the price path of U.S. stocks from roughly May 1990 through March 1991.

There are essentially four major parts to the Cycle:
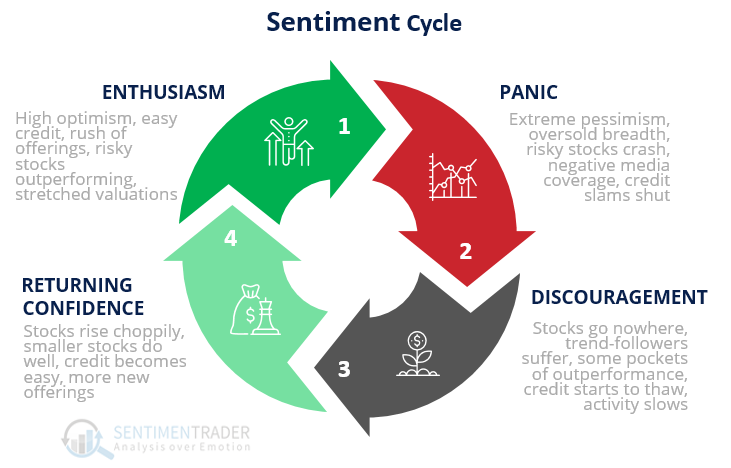
1. Enthusiasm - High optimism, easy credit, a rush of offerings, risky stocks outperforming, stretched valuations
2. Panic - Extreme pessimism, oversold breadth, risky stocks crash, negative media coverage, credit slams shut
3. Discouragement - Stocks go nowhere, trend-followers suffer, some pockets of outperformance, credit starts to thaw, activity slows
4. Returning Confidence - Stocks rise choppily, smaller stocks do well, credit becomes easy, more new offerings
When we looked at this in October, the price action of the S&P 500 had been highly correlated to the Discouragement phase for months. Discouragement is basically the opposite of Returning Confidence.
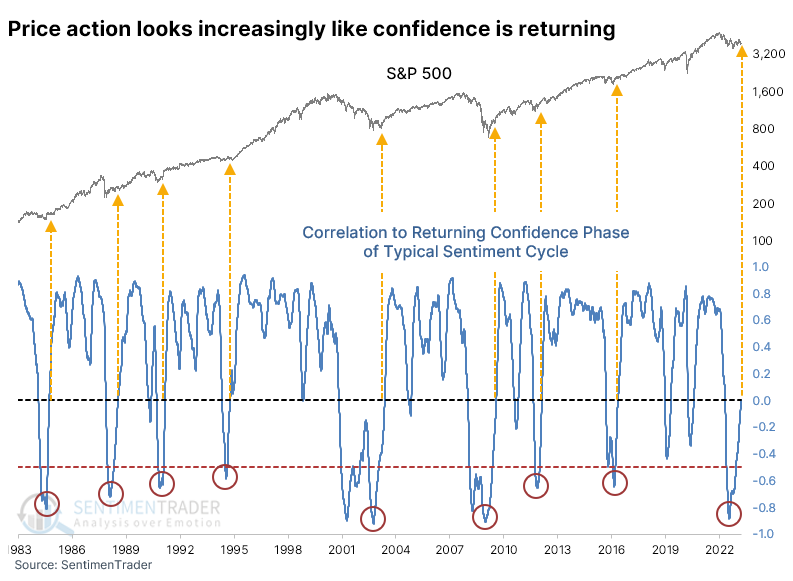
Price action is starting to look more like confidence is returning
Despite all the challenges over the past month, price action is starting to align with Returning Confidence more closely. After the correlation dived to one of the lowest levels in decades, it has since recovered to zero. Qualitatively, smaller stocks are not doing well, and credit is not becoming easy, so those are signs of the cycle that we're not seeing right now.
But for these purposes, we're only looking at the S&P's price action and comparing it to the "ideal" price pattern from the Mamis example of the Typical Sentiment Cycle.
When the S&P's price action suffers a very negative correlation to Returning Confidence and then recovers to zero, its future returns were above average and showed a decent probability of being positive.
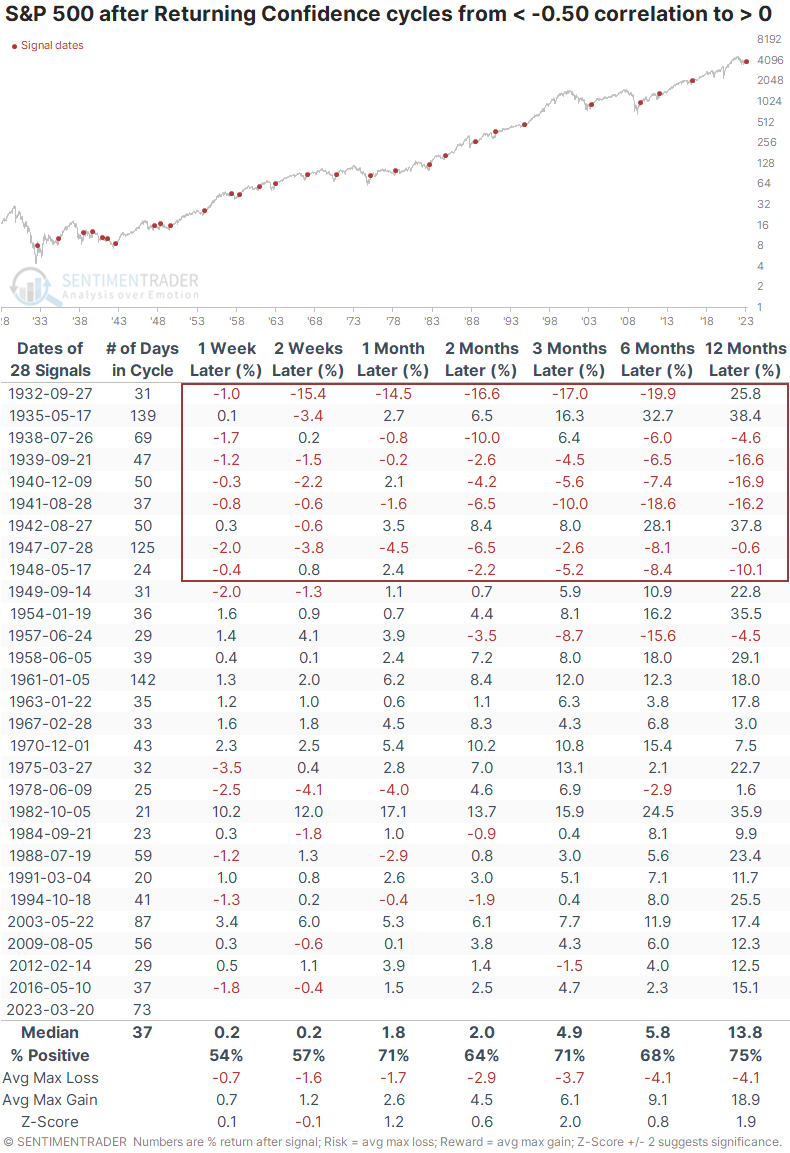
Almost all the medium- to long-term losses were concentrated in the 1930s and 40s. If we look at modern markets since 1950, there was essentially only a single failure. Other than the signal in 1957, there were two negligible losses three or six months later. All the other signals sported a positive return, with a shallow average risk versus potential reward.
What the research tells us...
On a shorter-term basis, sentiment has quickly dipped back toward pessimism. But that's part of a larger pattern since last summer and fall. When we take a longer-term look at how the price action has unfolded, it has cycled from almost the opposite of what happens when investors are becoming confident to more so. While that didn't prevent some quick failures long ago, since 1950, similar behavior has led almost universally to gains over the medium- to long-term.
The past month has understandably generated angst, as it has exceeded prior reactions at the beginnings of new bull markets, which is a worry. But the longer-term pattern still looks similar to other periods of prolonged unease followed by returning confidence, which has a good record at preceding gains.
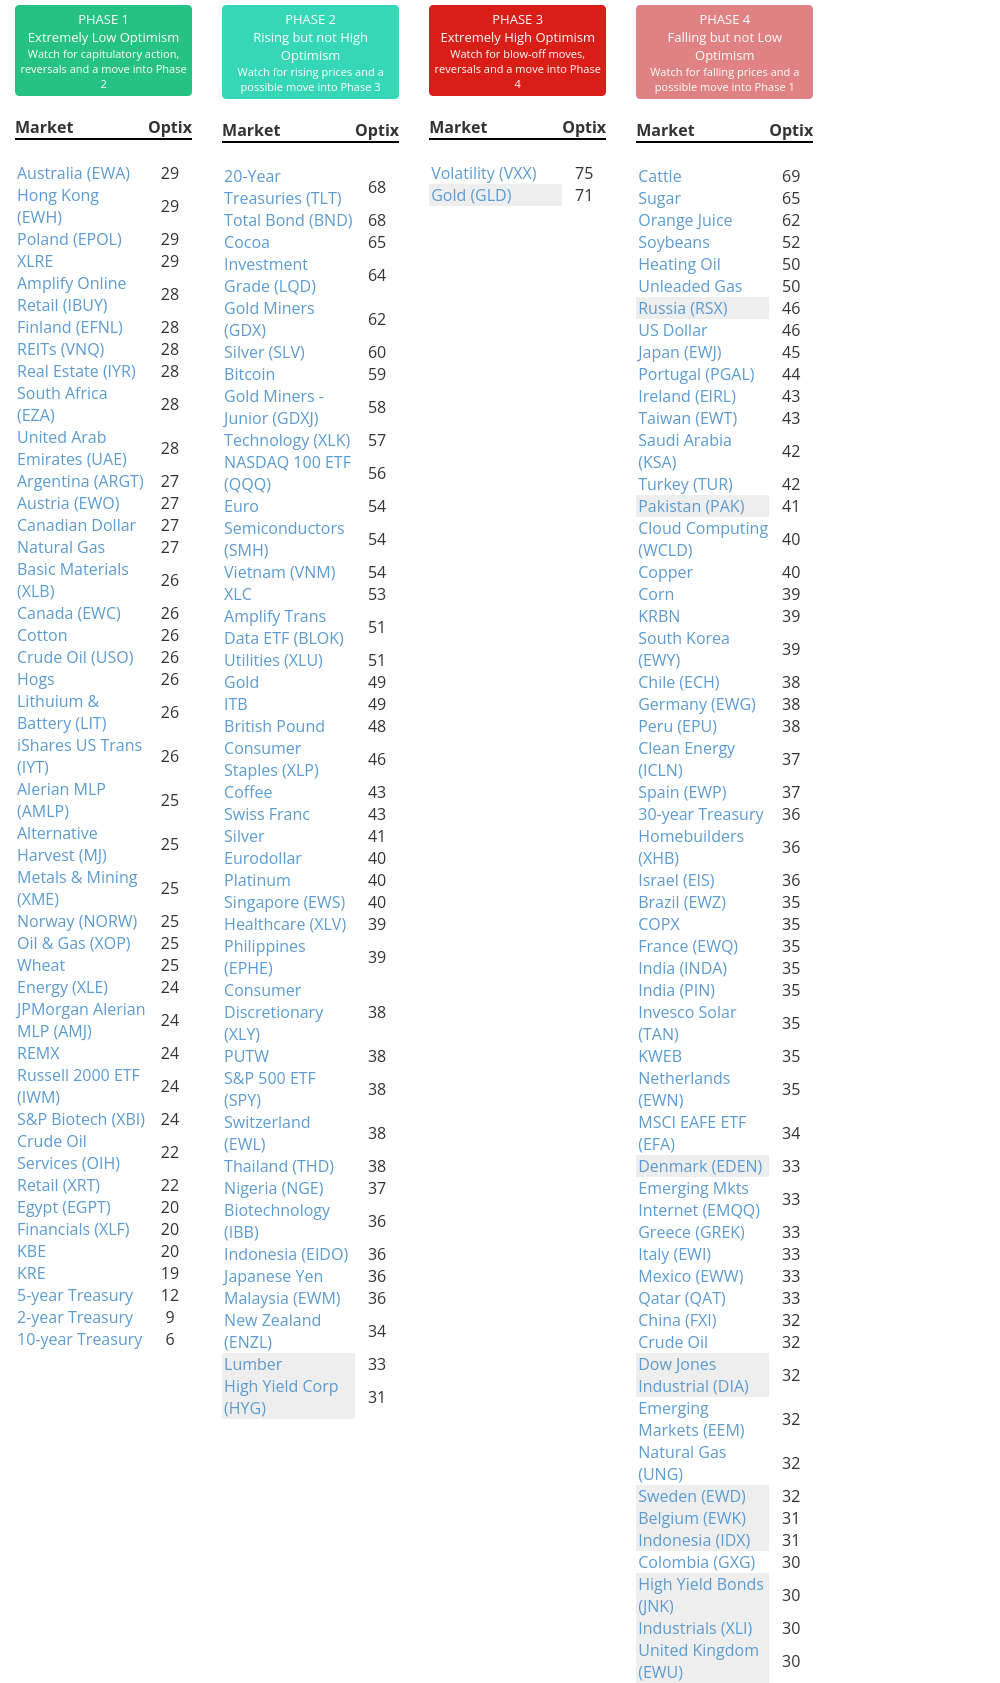
Indicators at Extremes
Phase Table
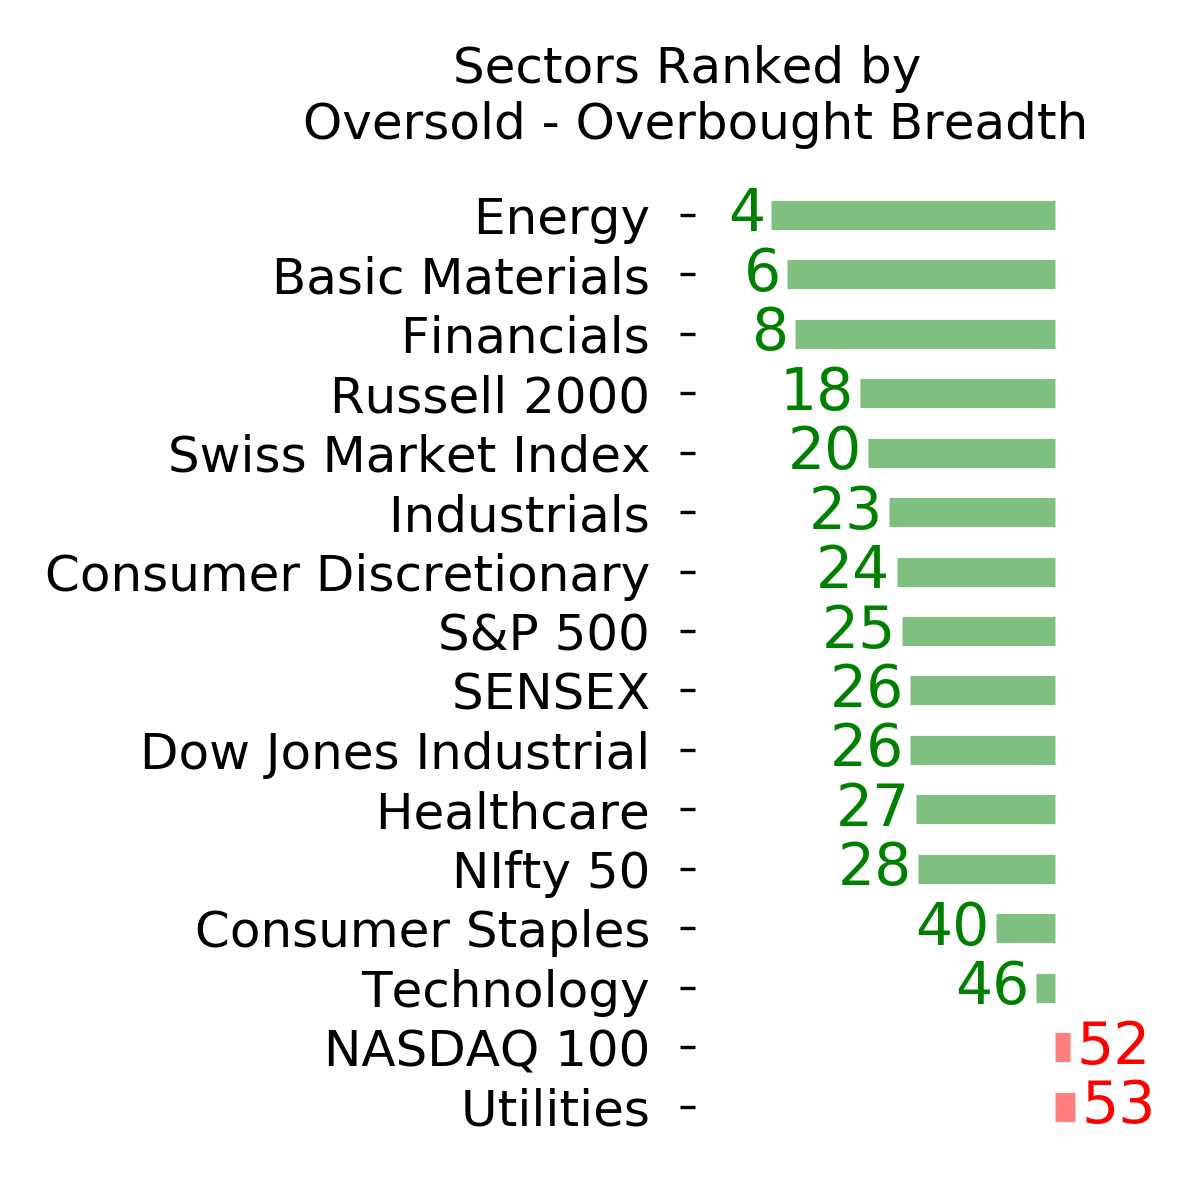
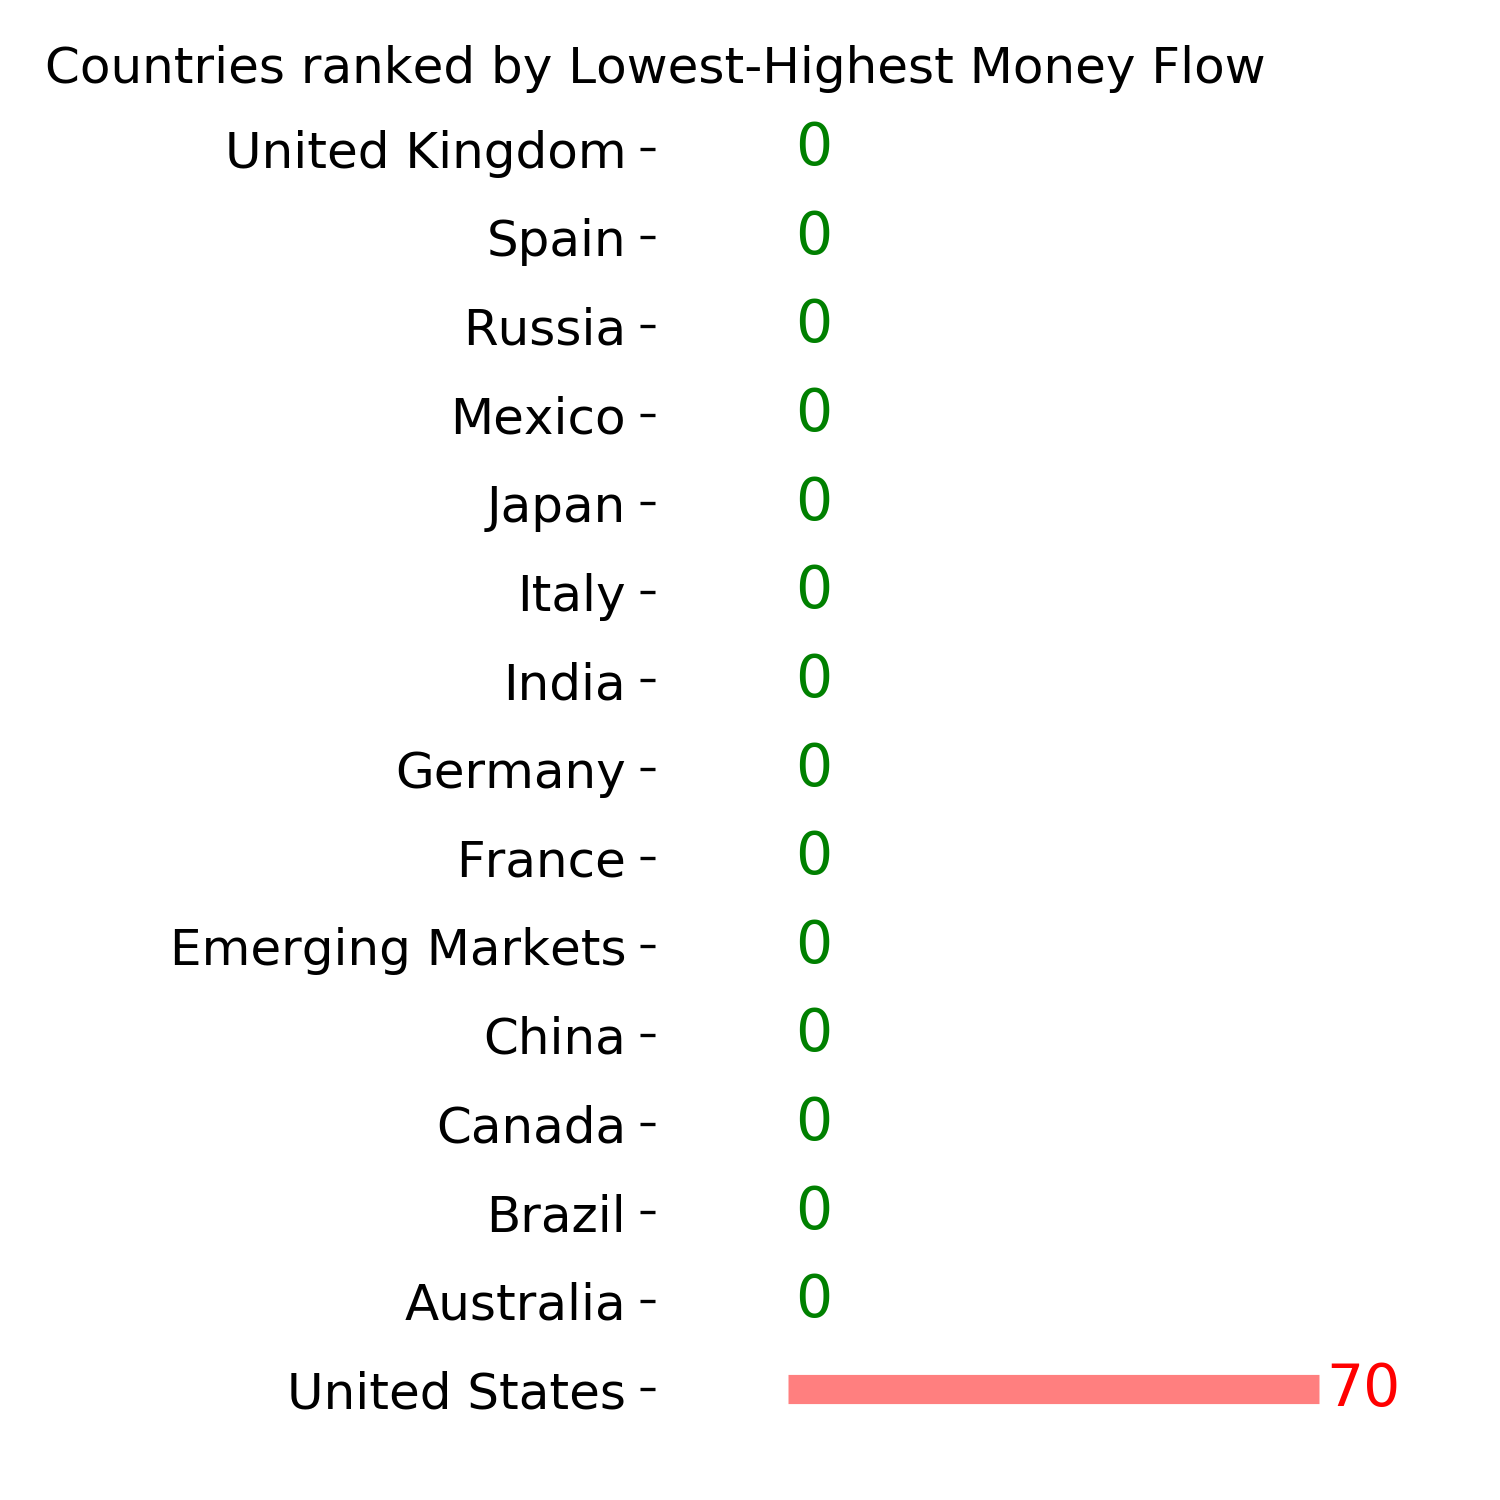
Ranks
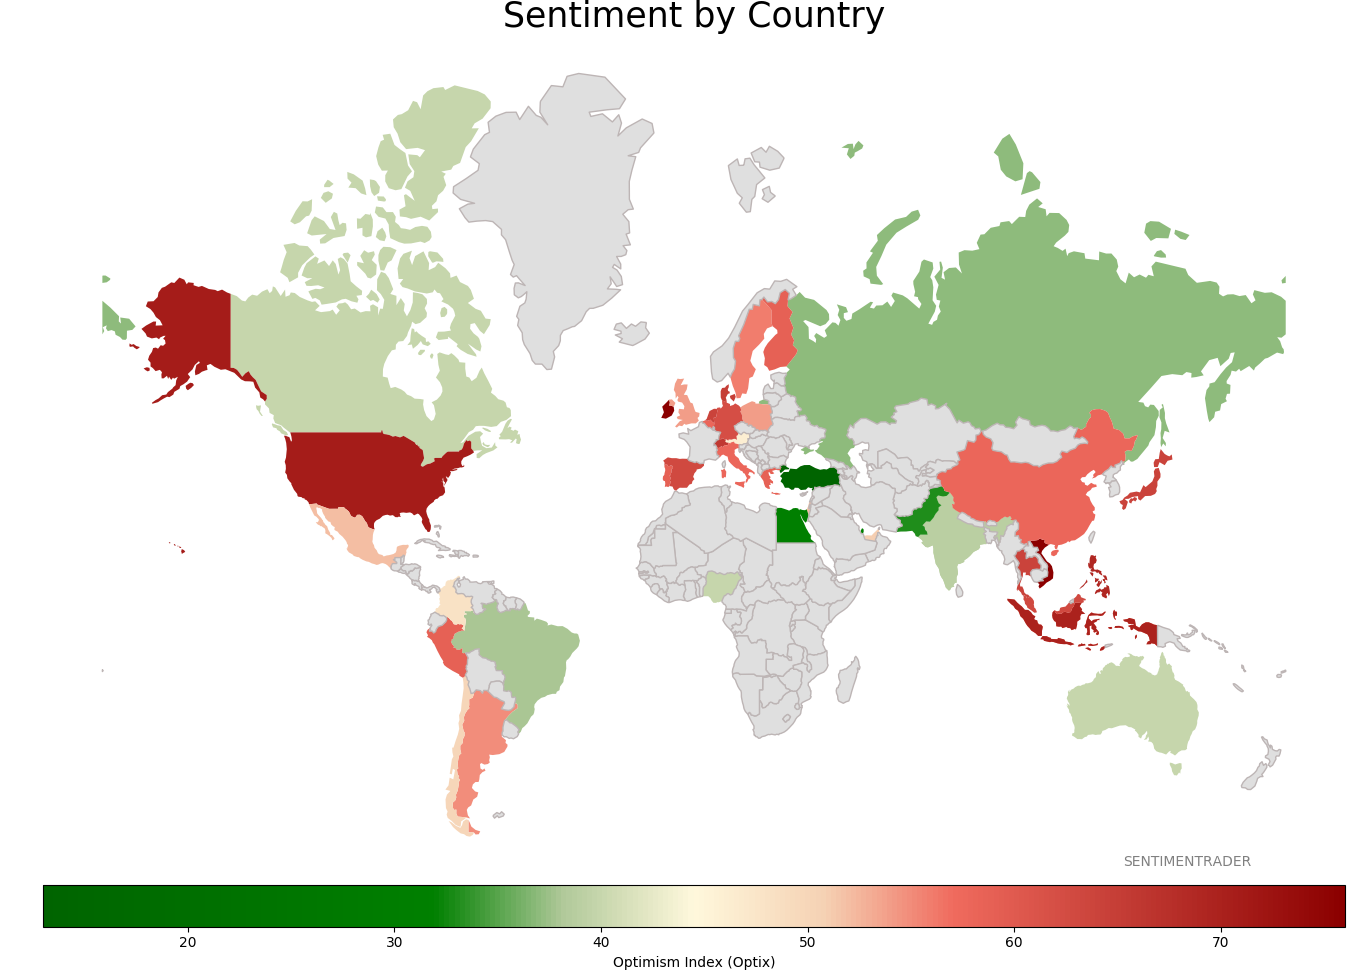
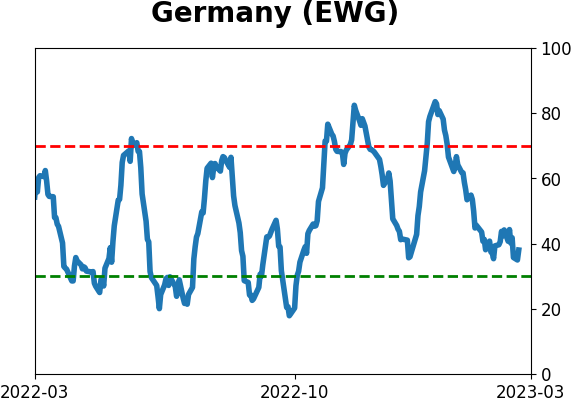
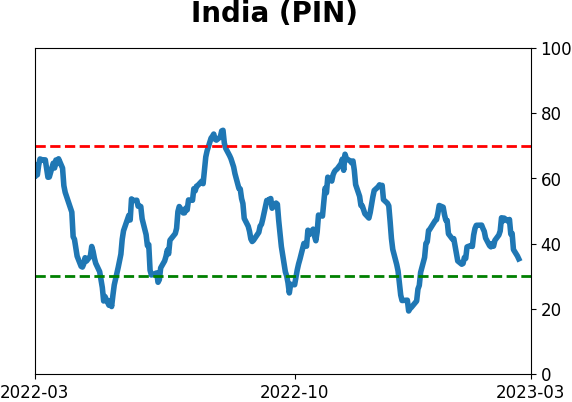
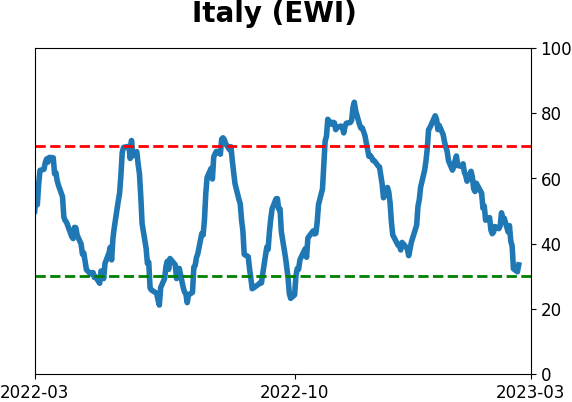
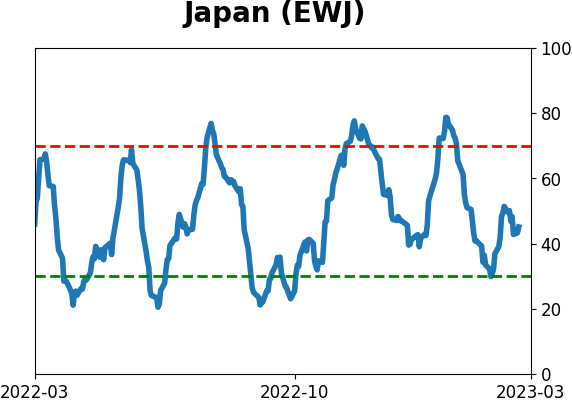
Sentiment Around The World
Optimism Index Thumbnails
|
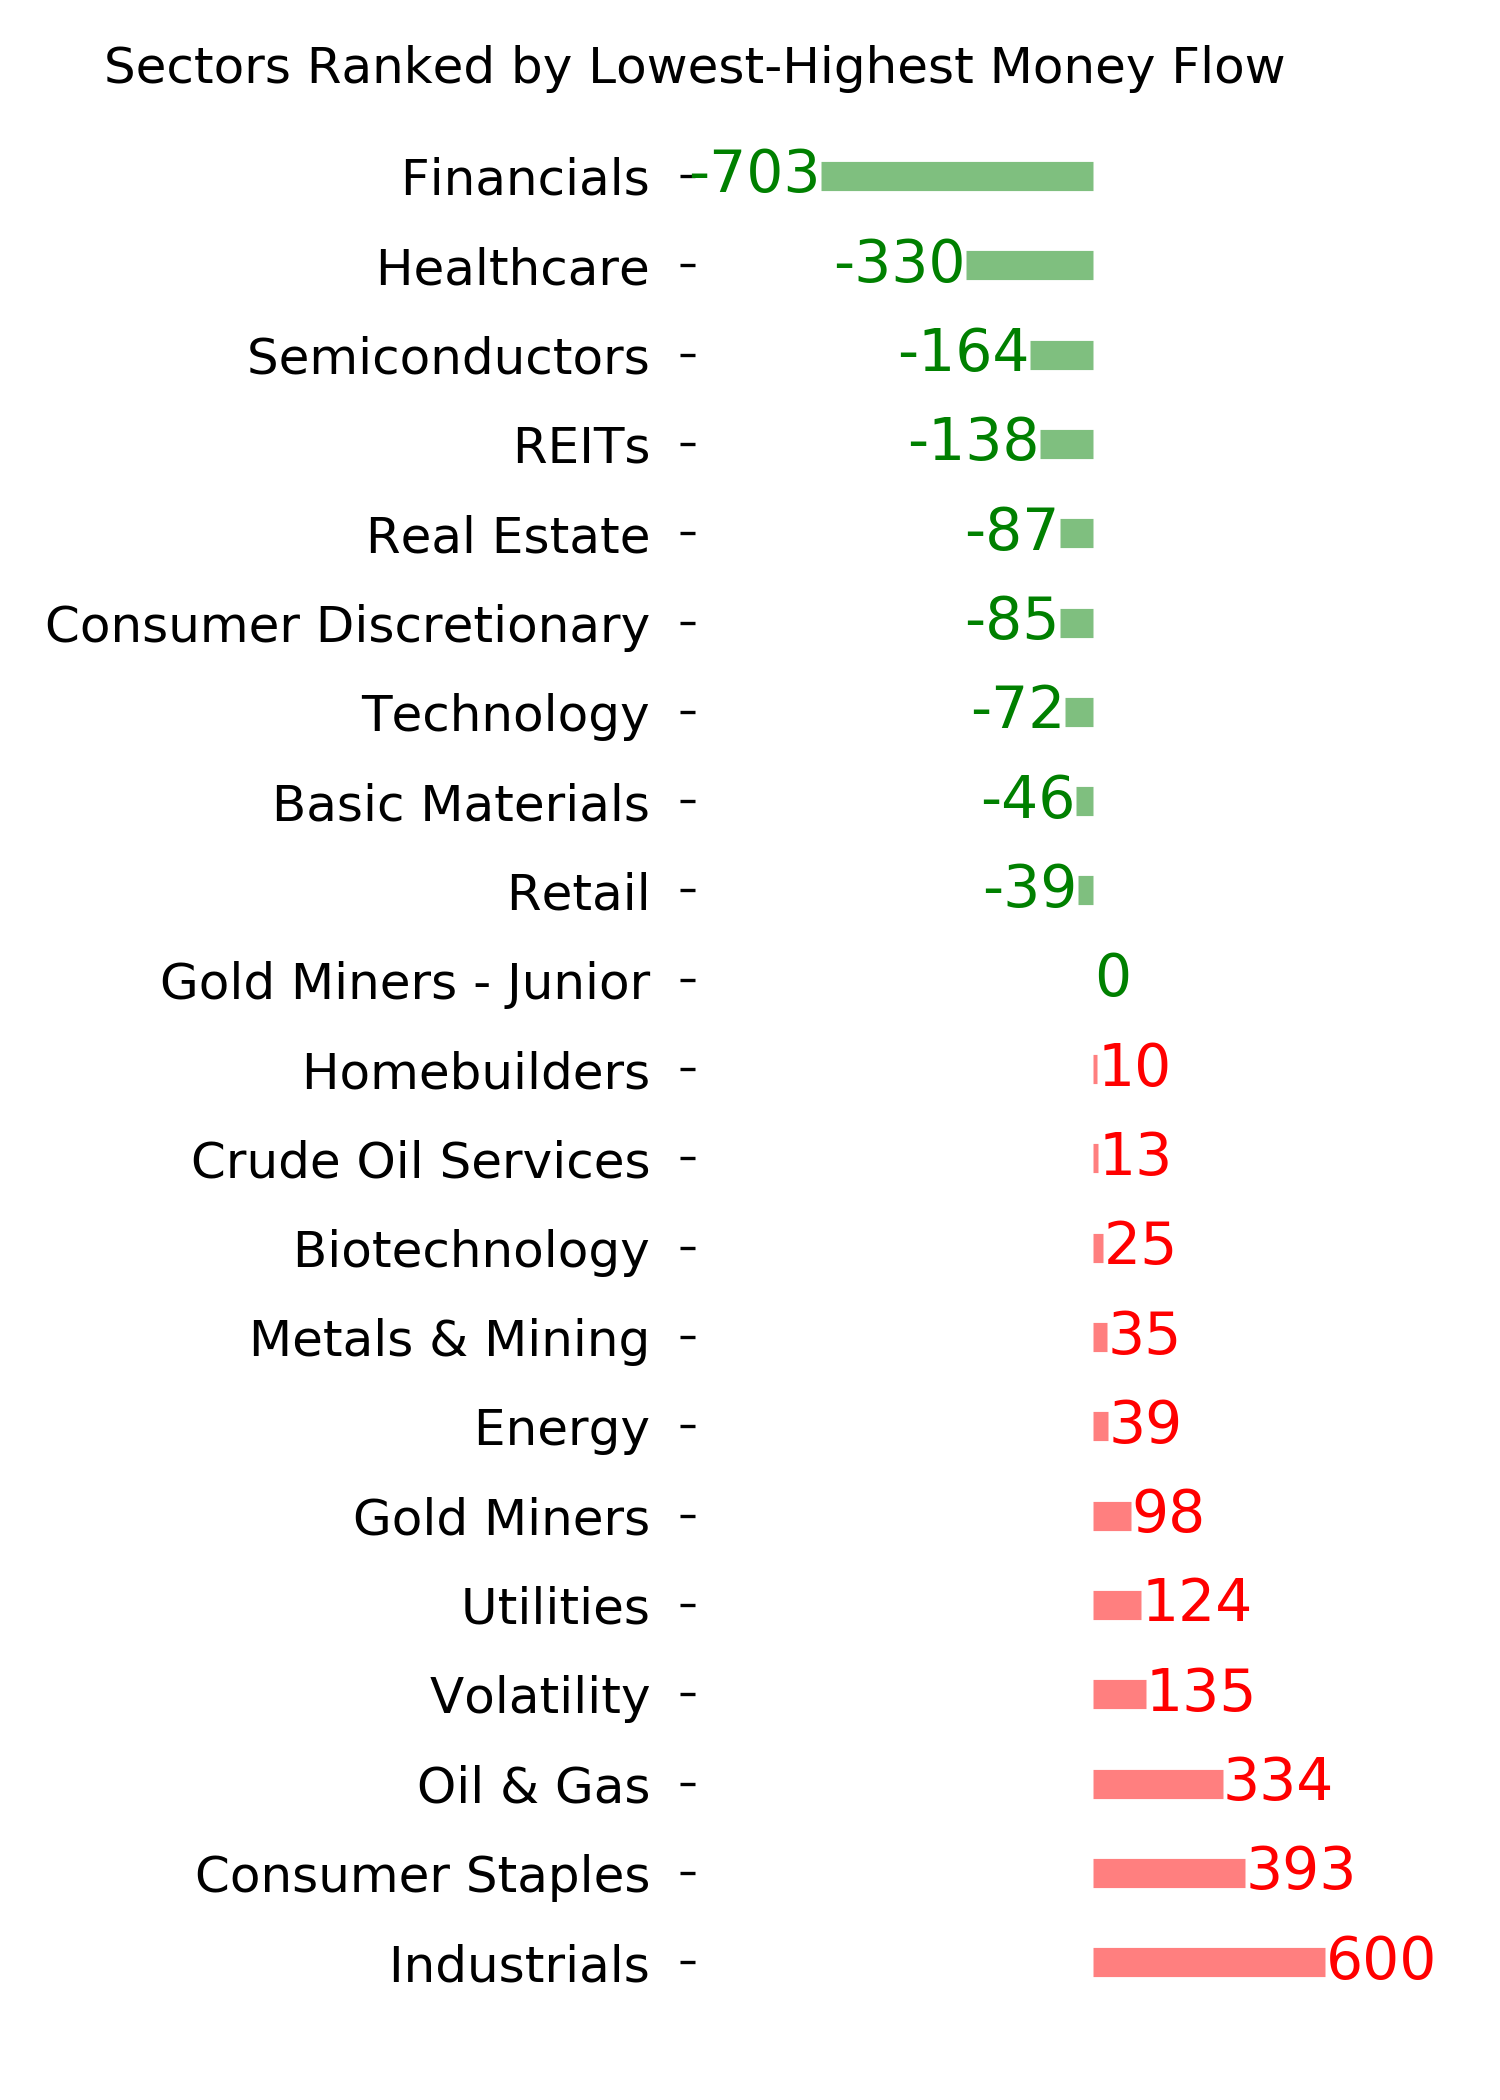
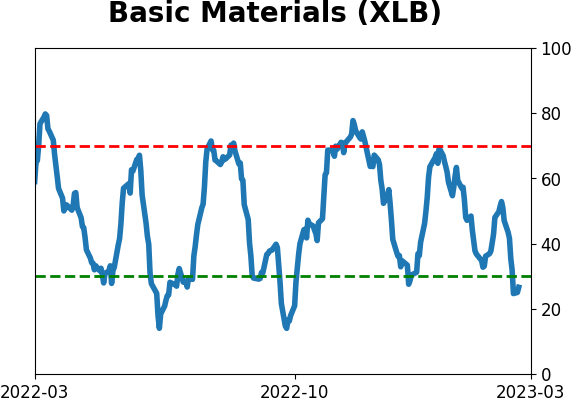
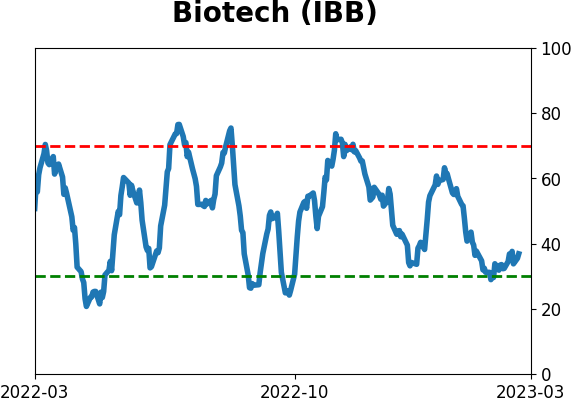
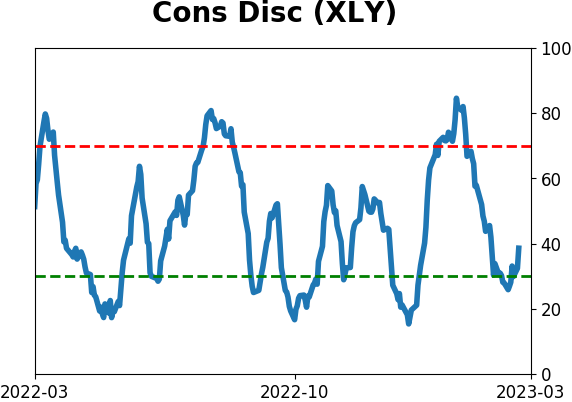
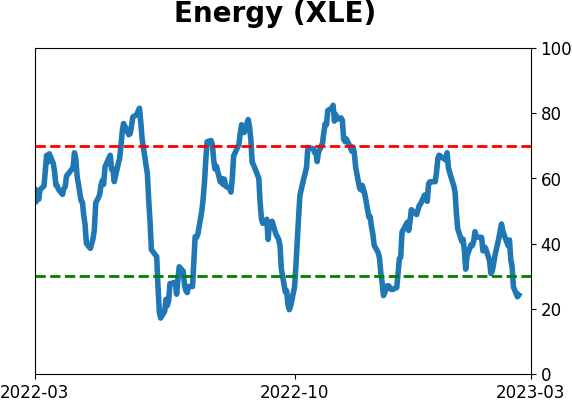
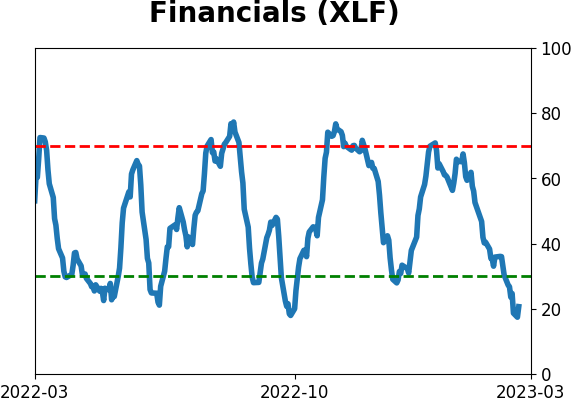
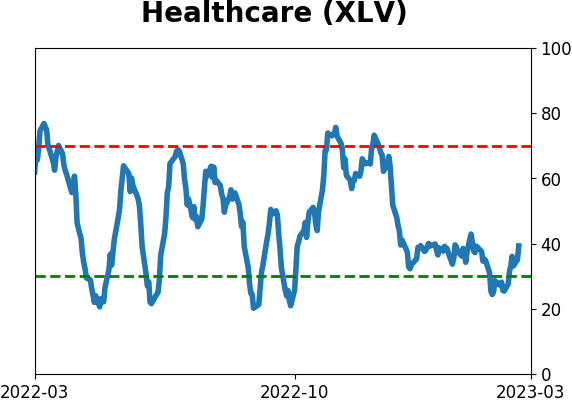
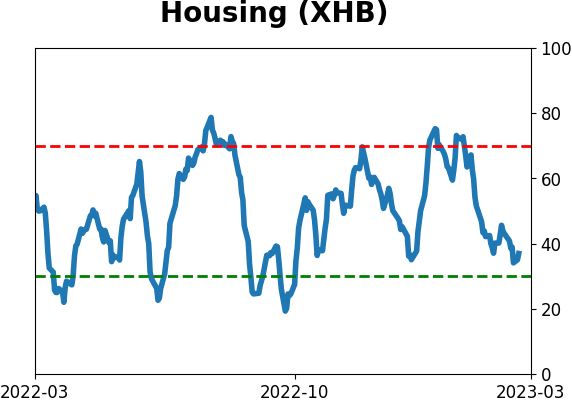
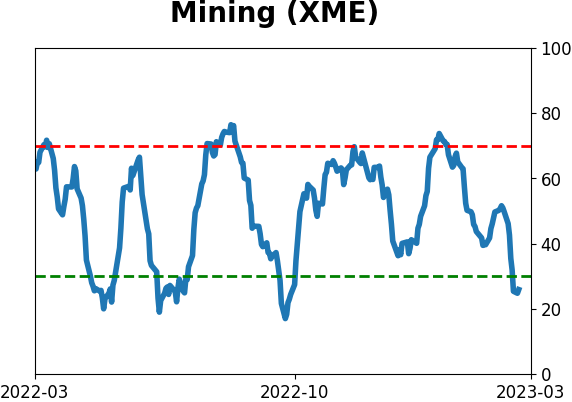
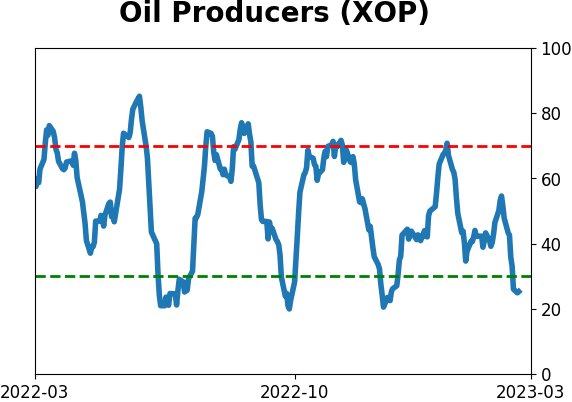
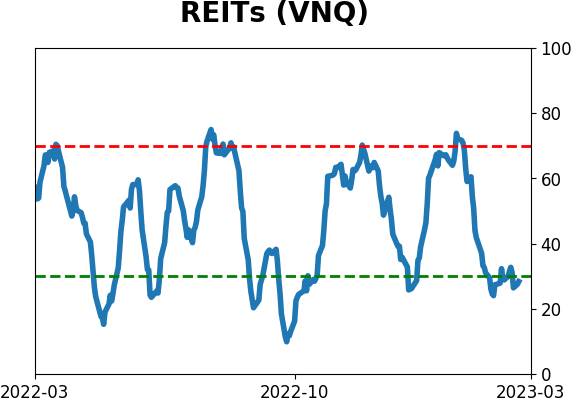
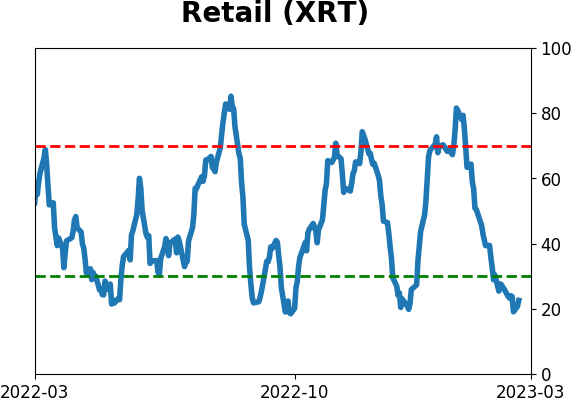
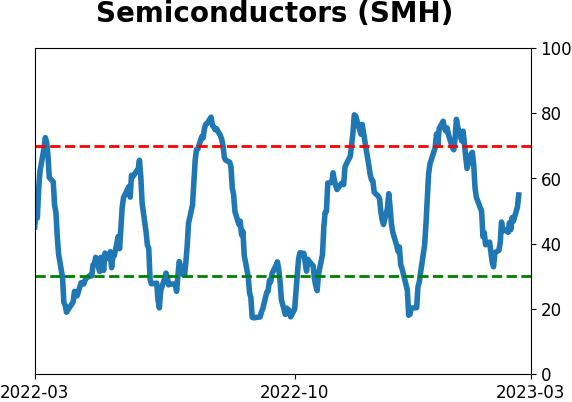
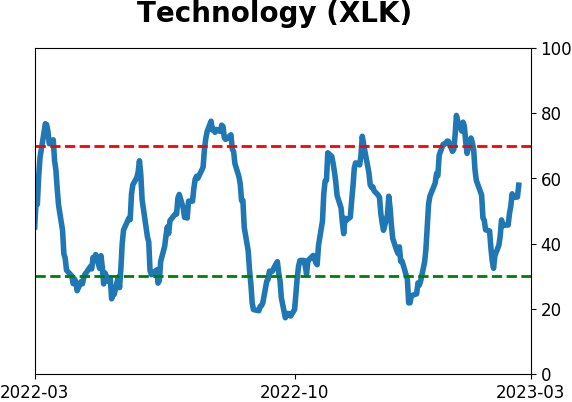
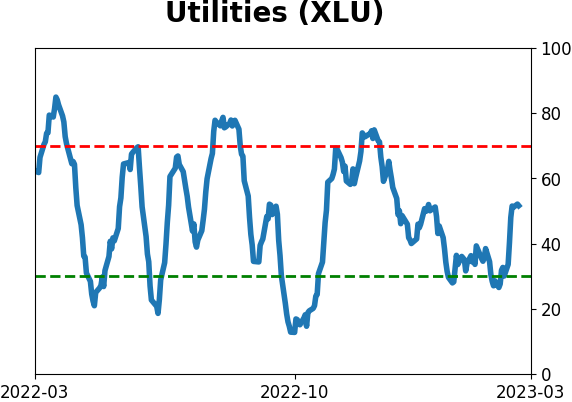
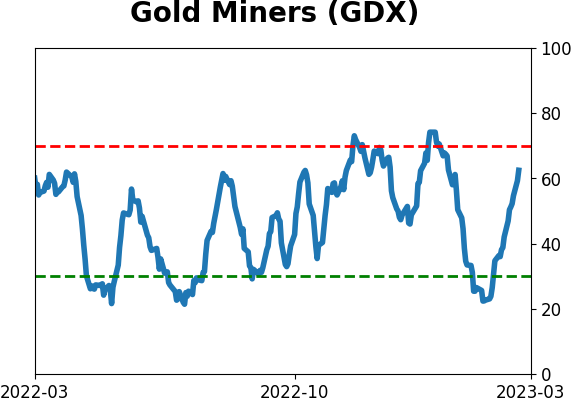
Sector ETF's - 10-Day Moving Average
|
|
|
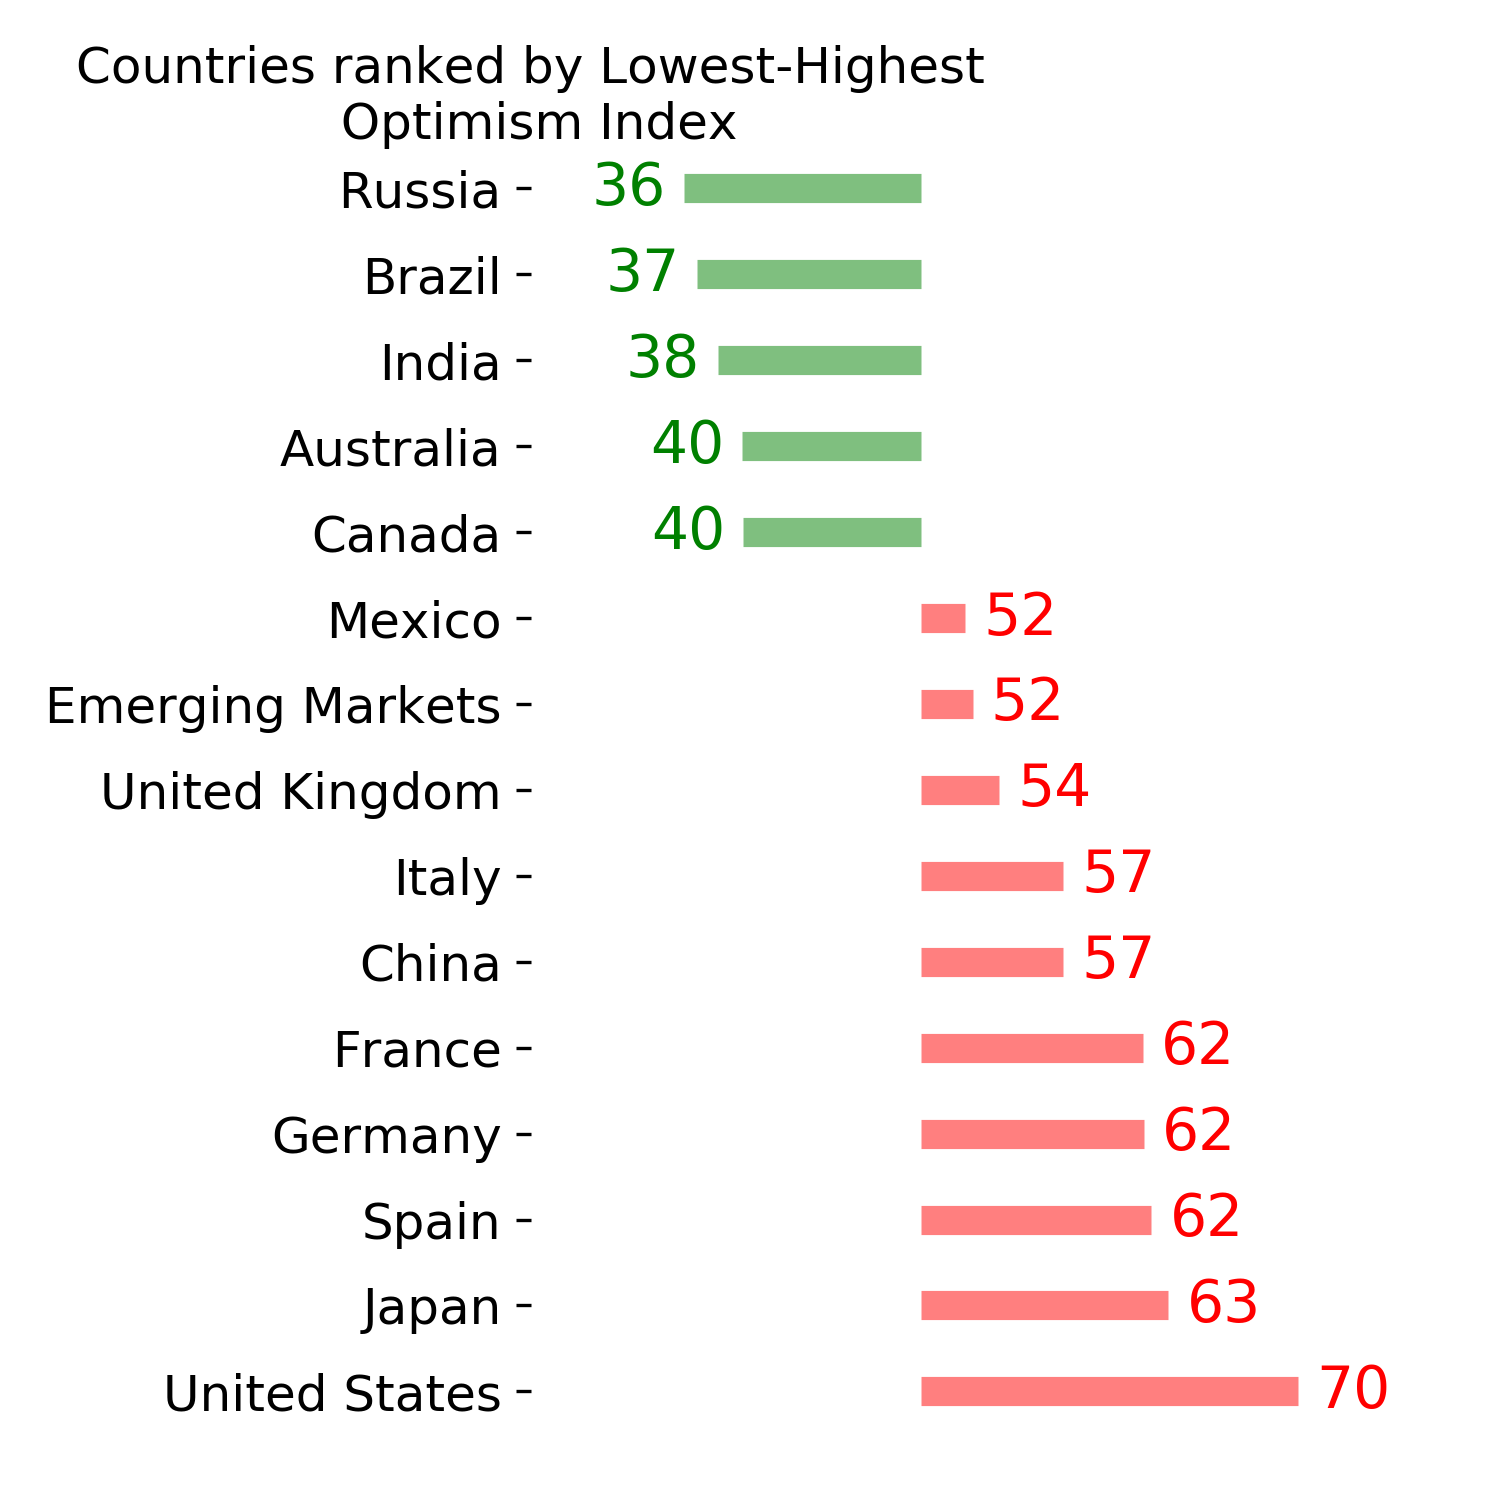
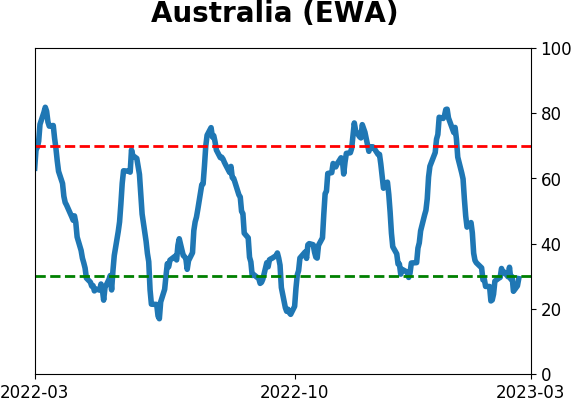
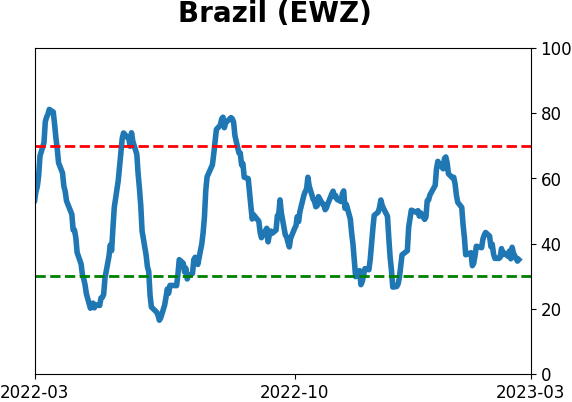
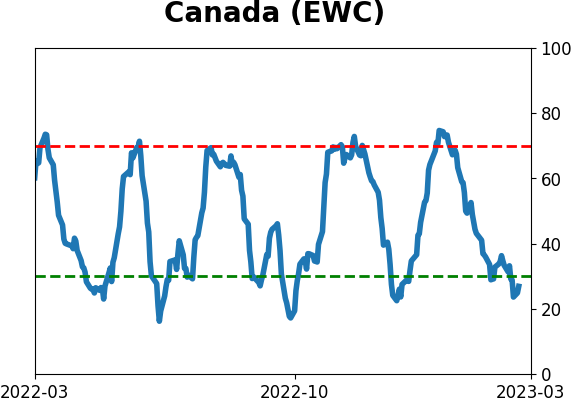
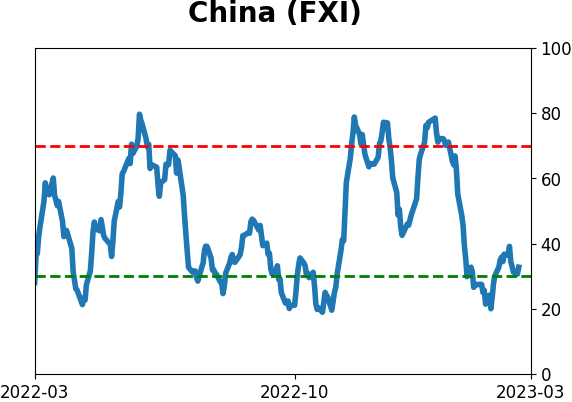
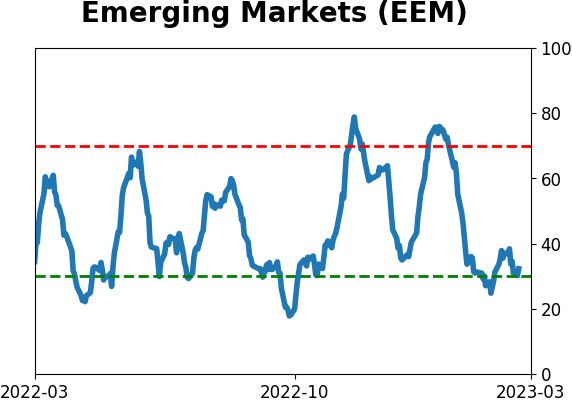
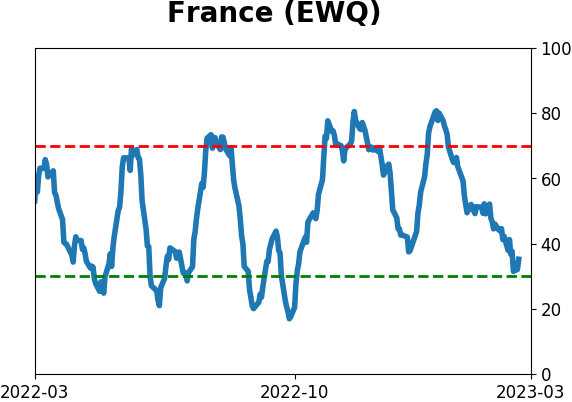
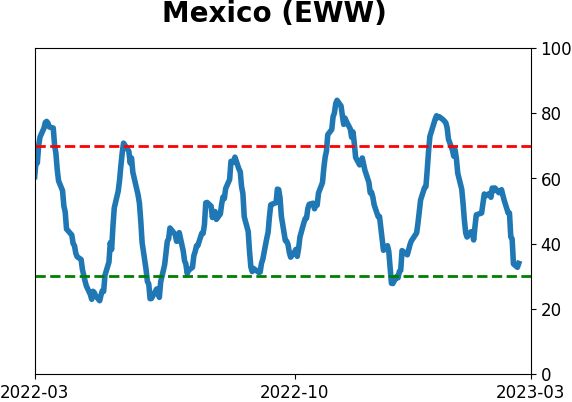
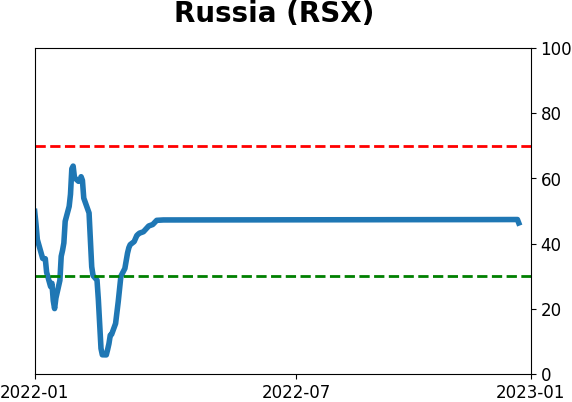
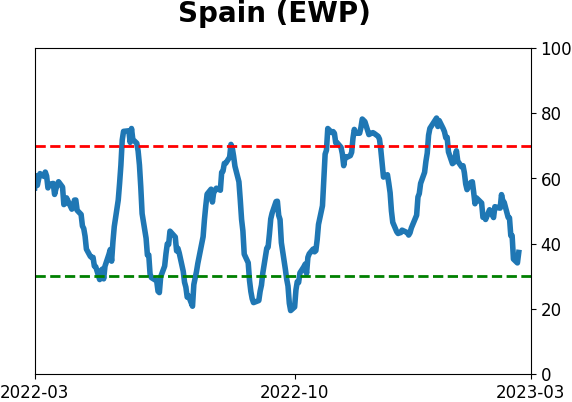
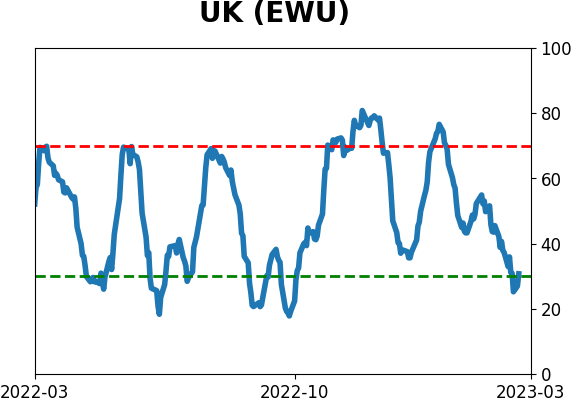
Country ETF's - 10-Day Moving Average
|
|
|
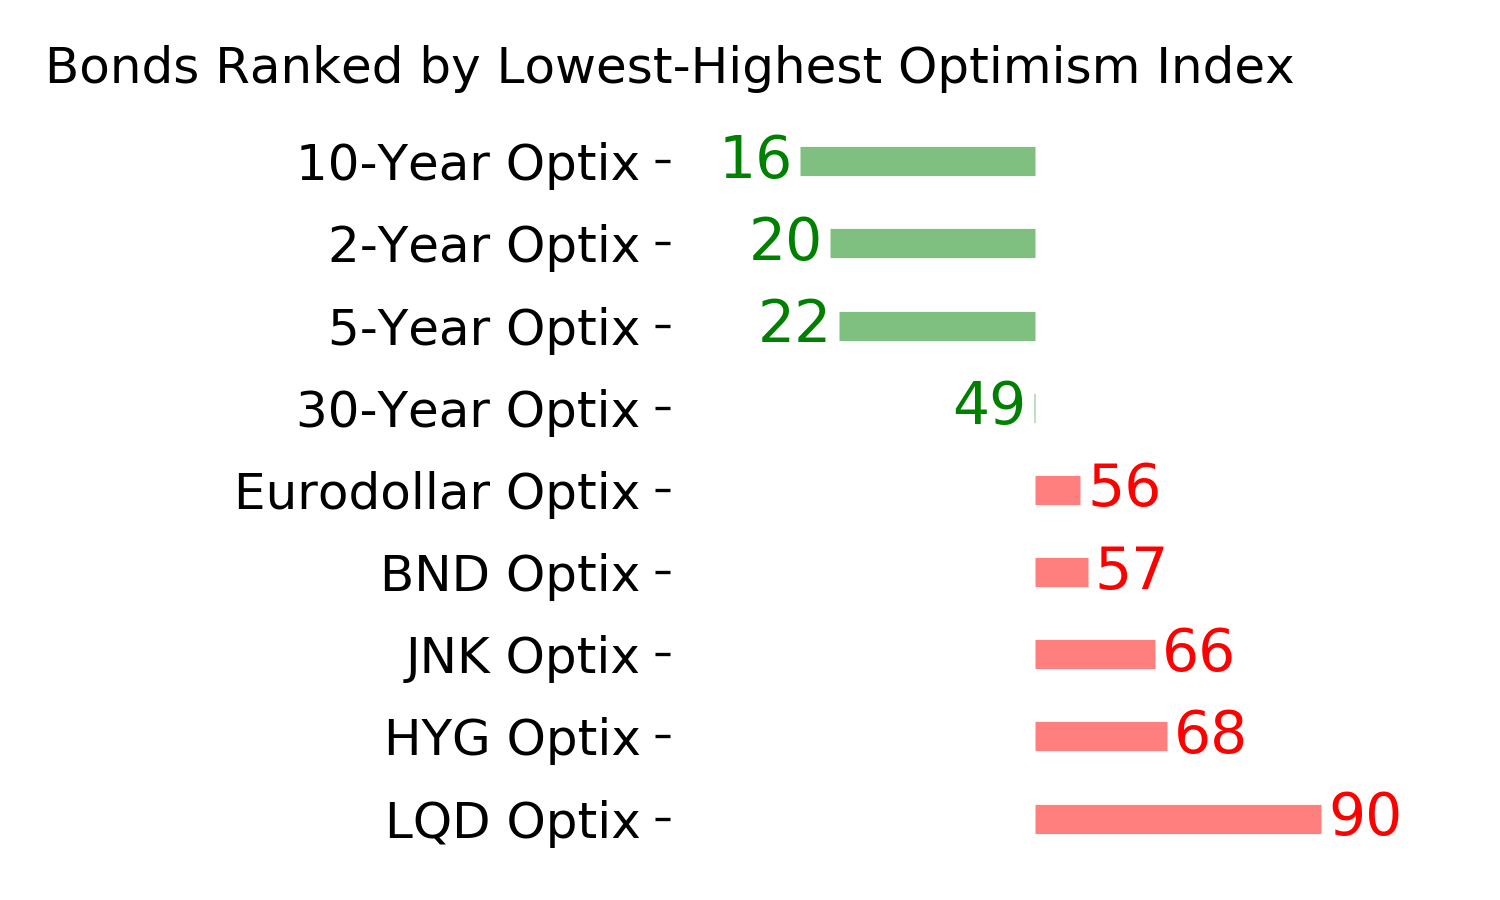
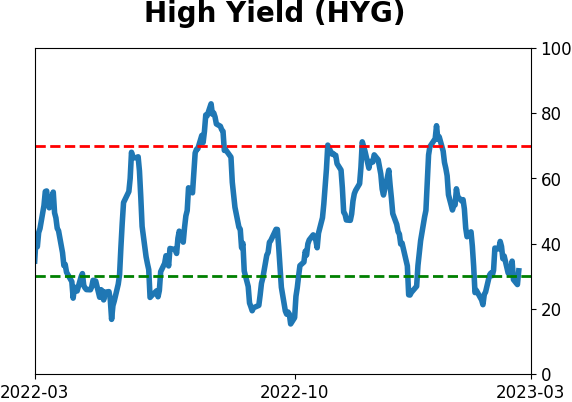
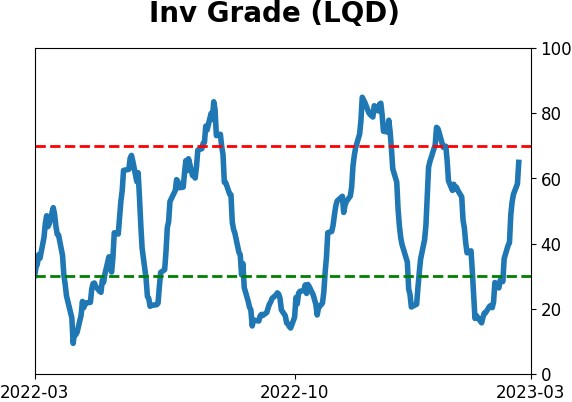
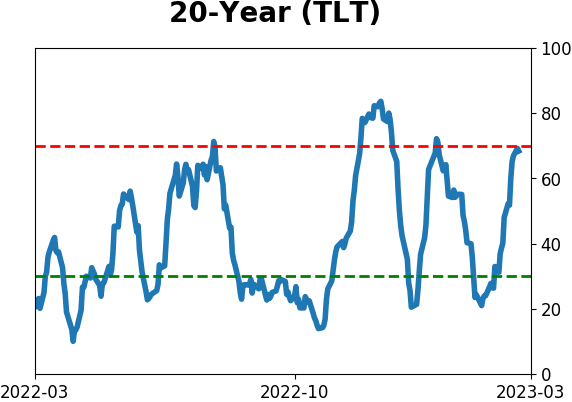
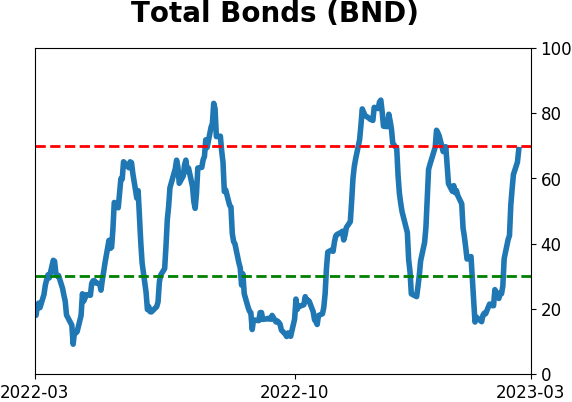
Bond ETF's - 10-Day Moving Average
|
|
|
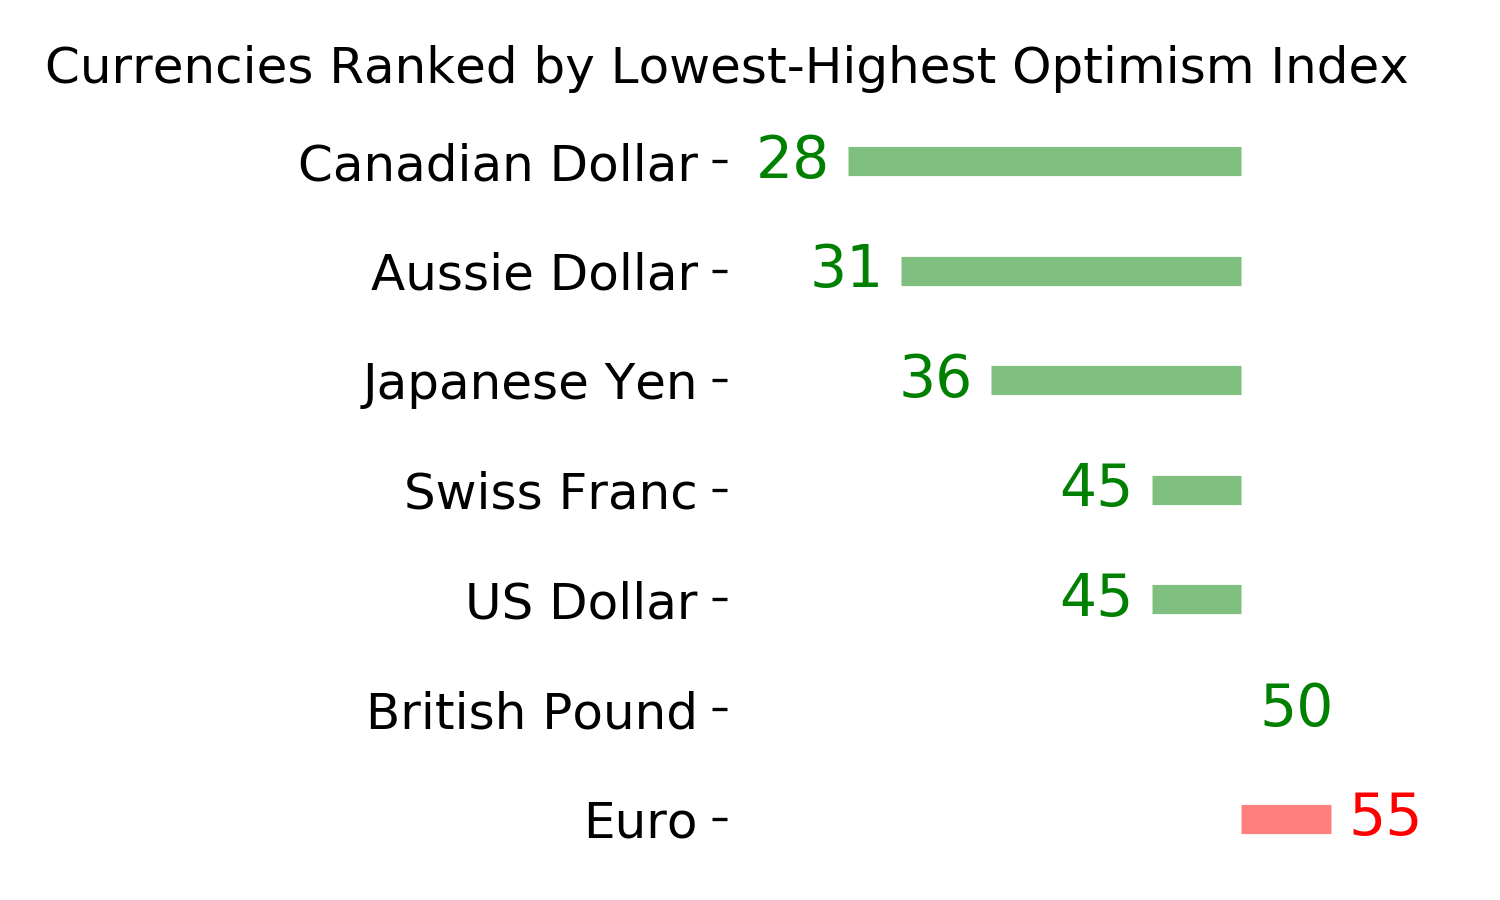
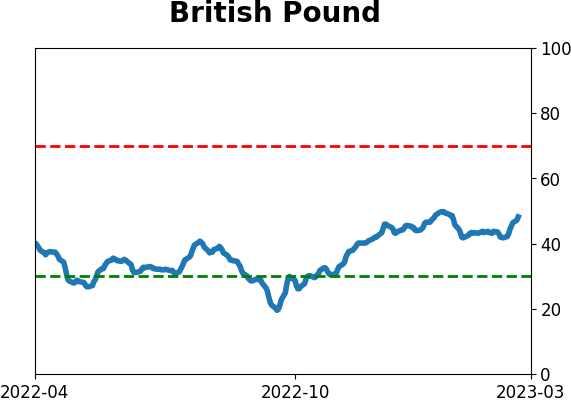
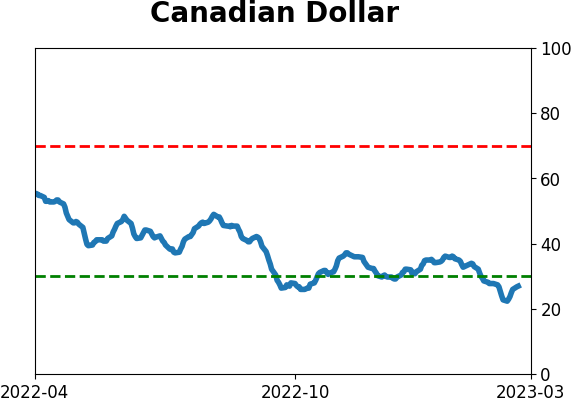
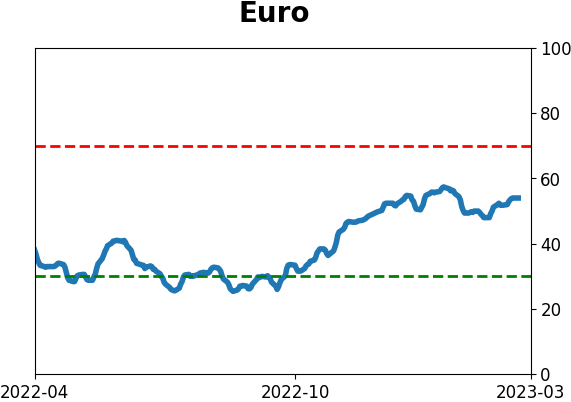
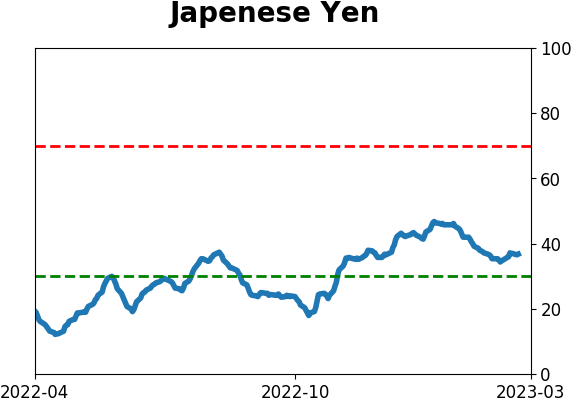
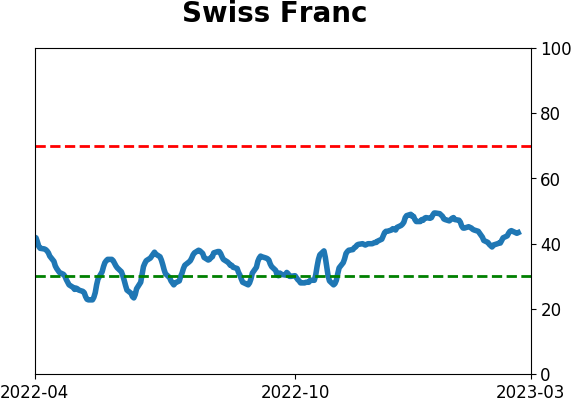
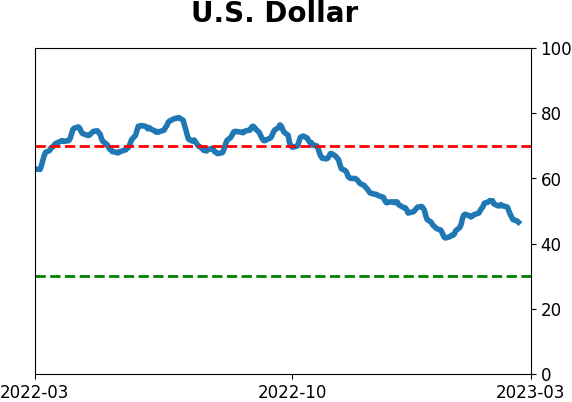
Currency ETF's - 5-Day Moving Average
|
|
|
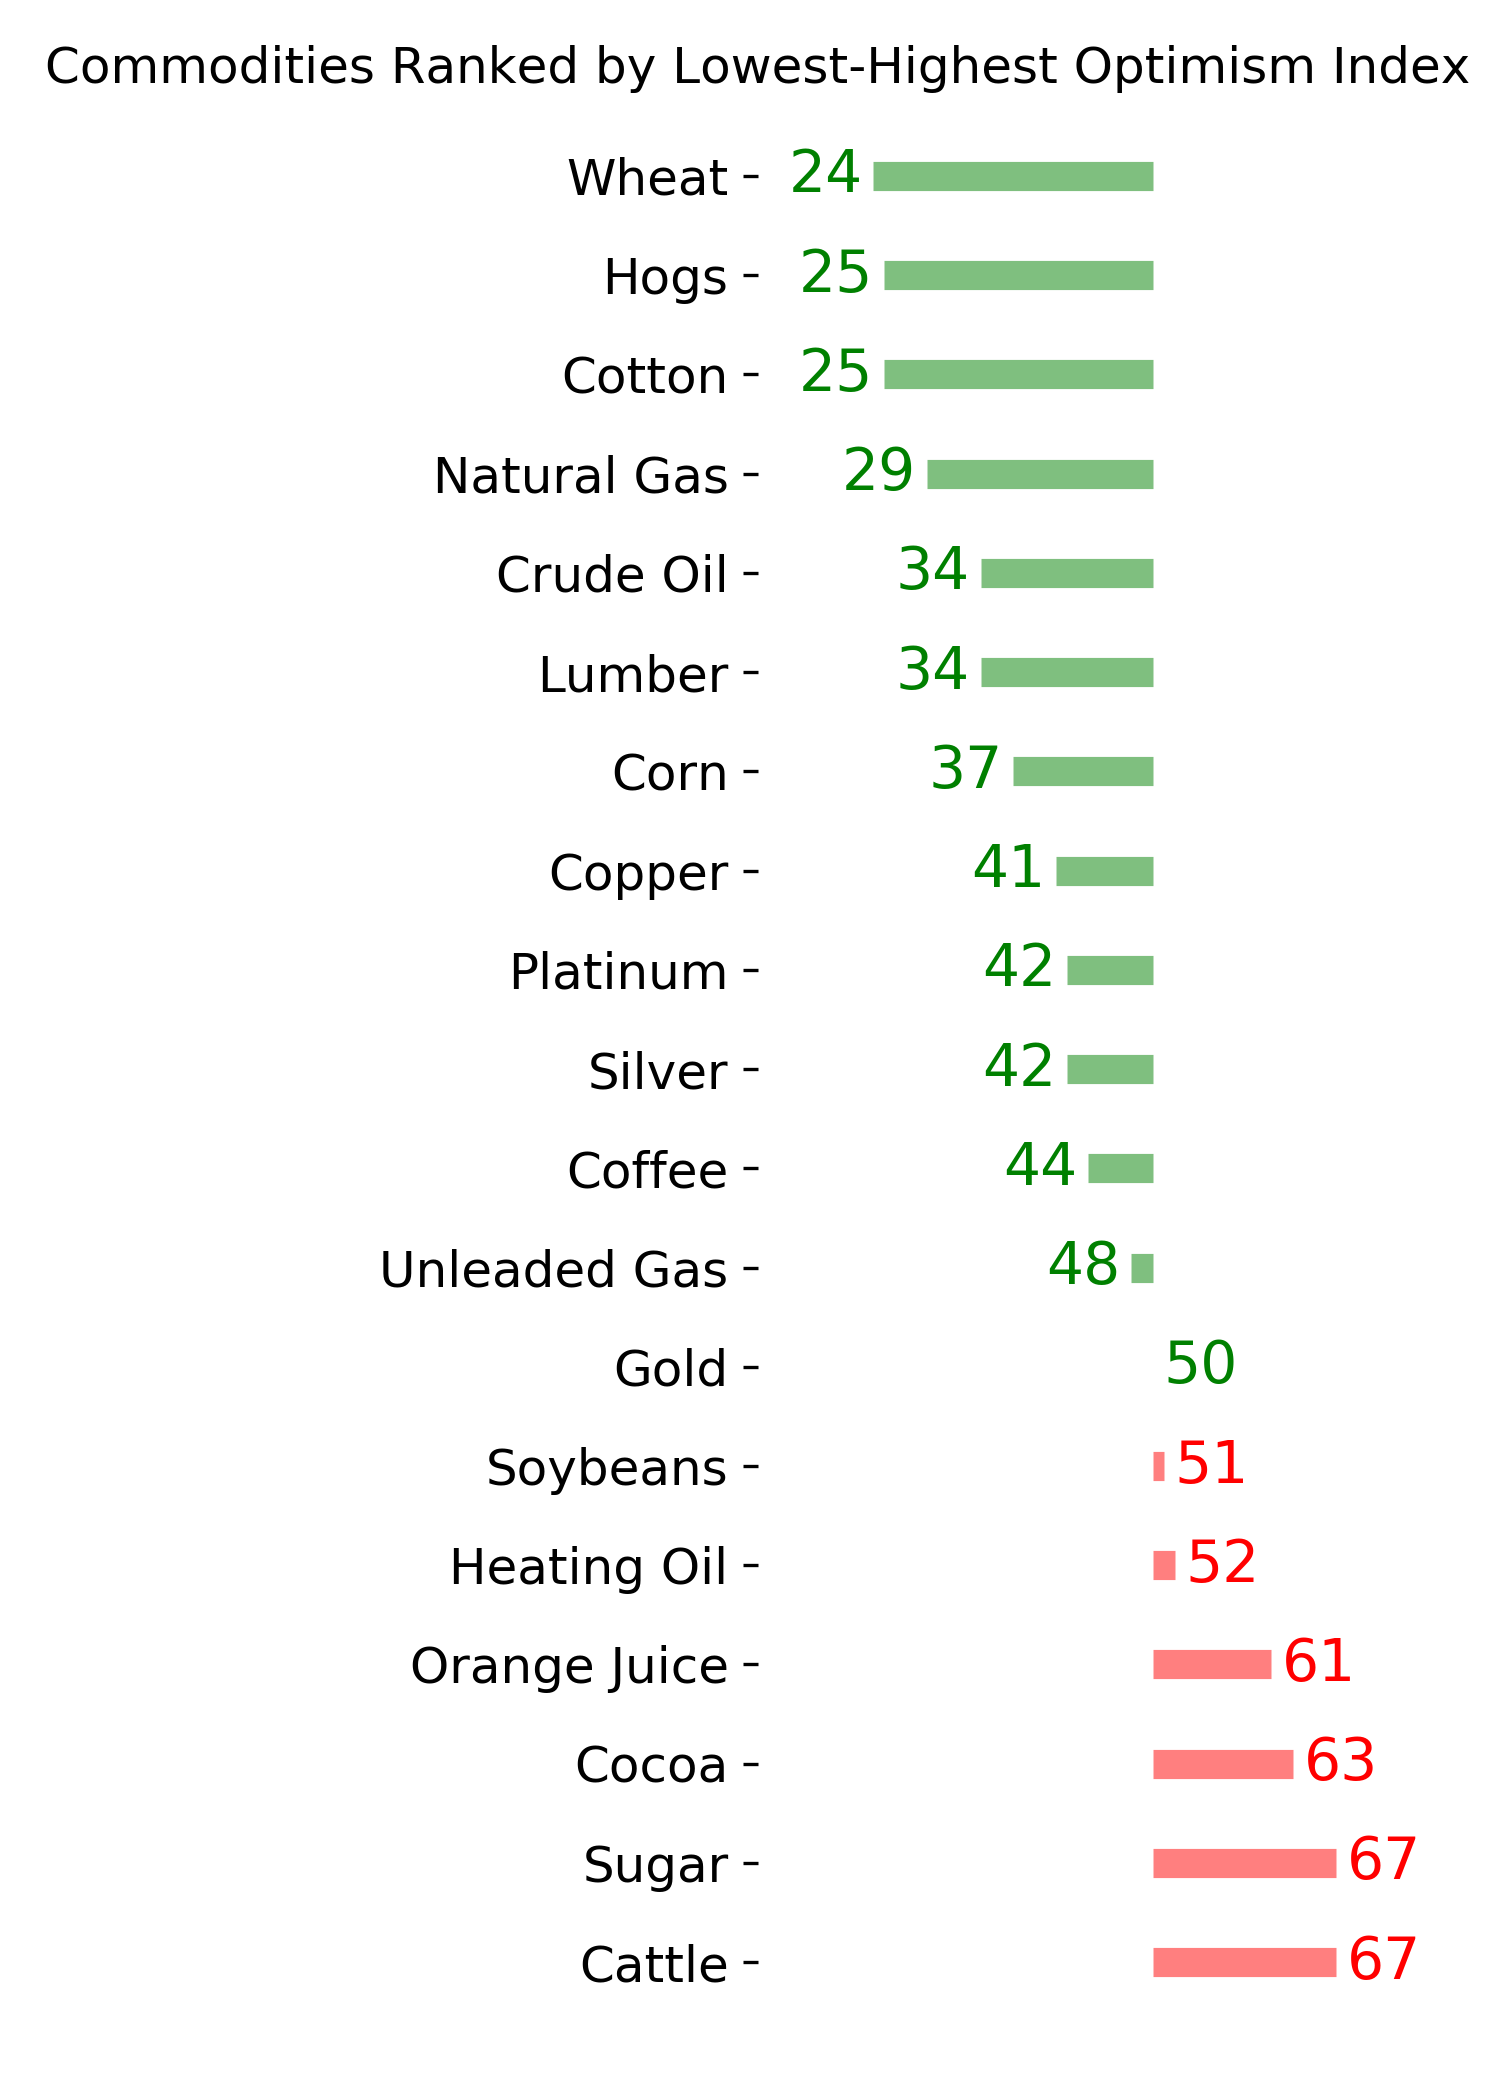
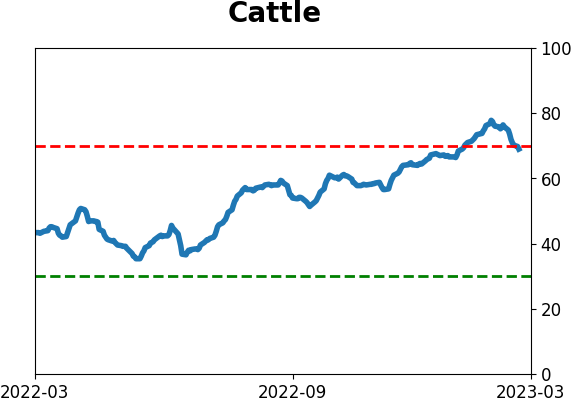
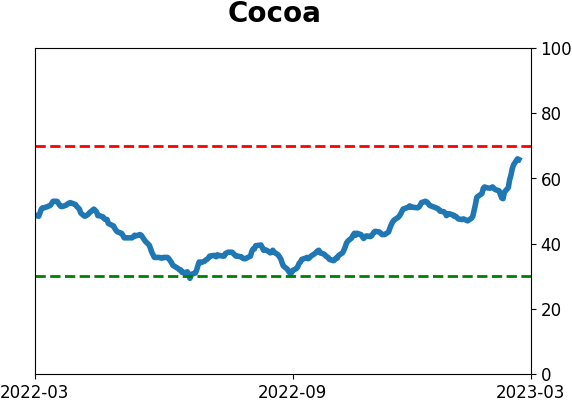
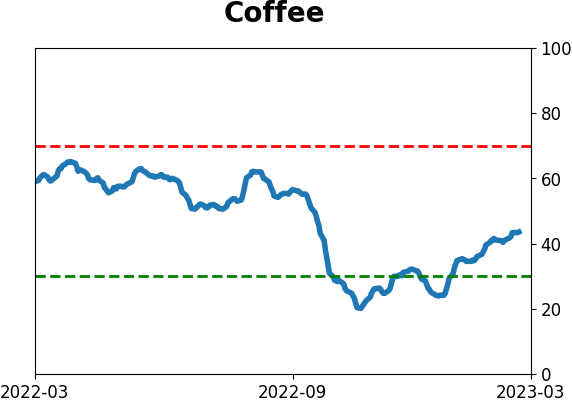
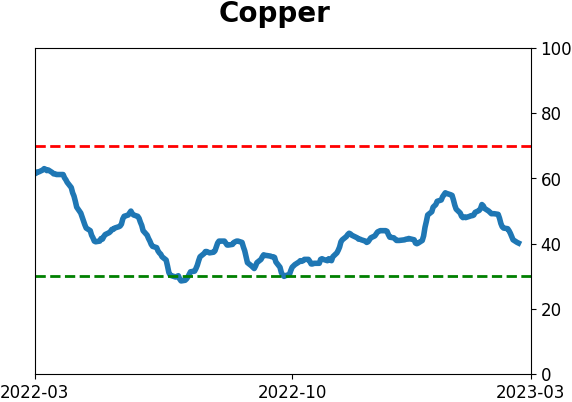
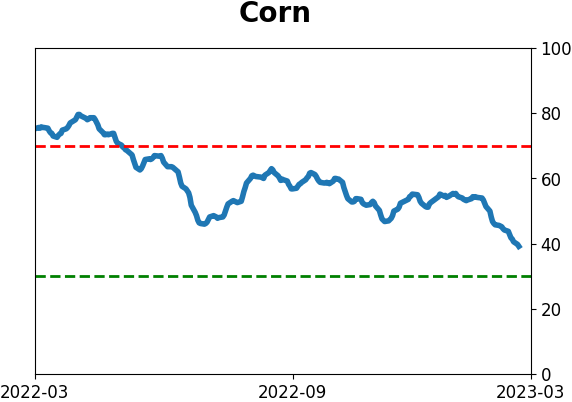
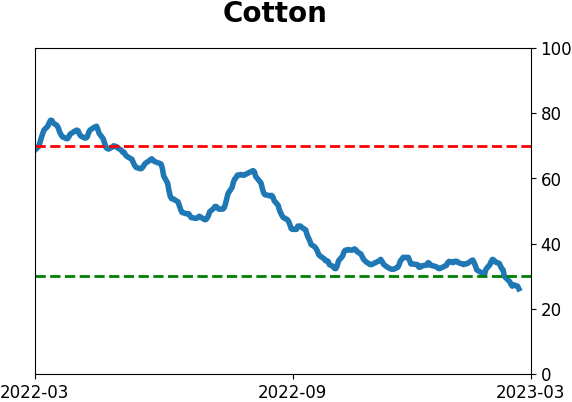
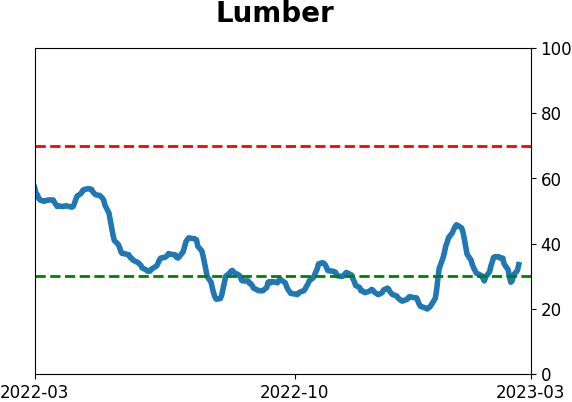
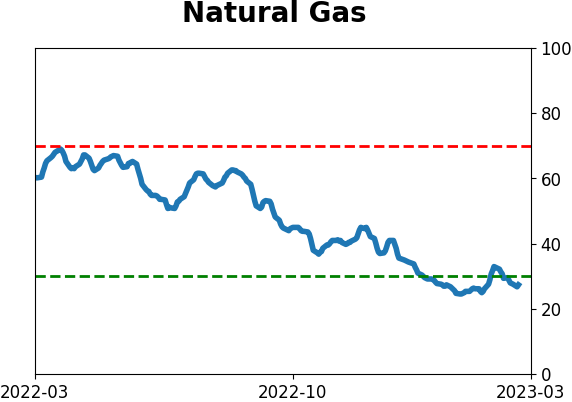
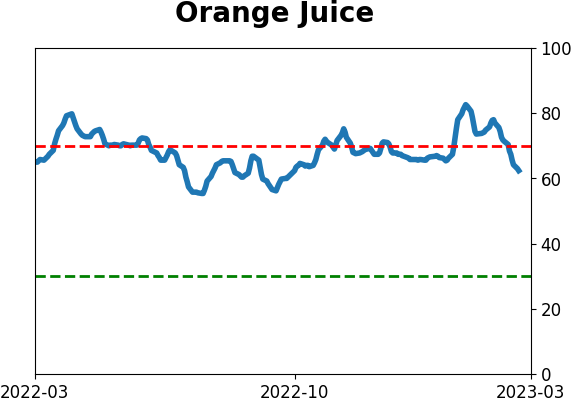
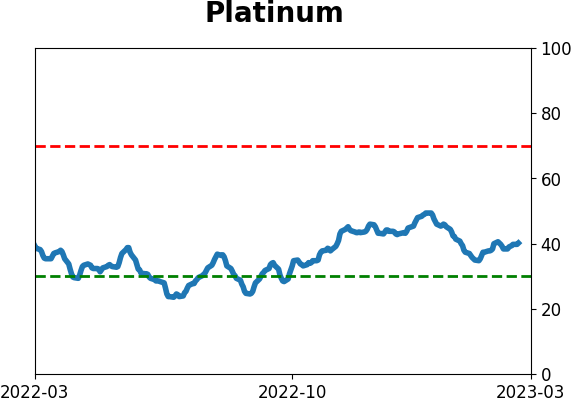
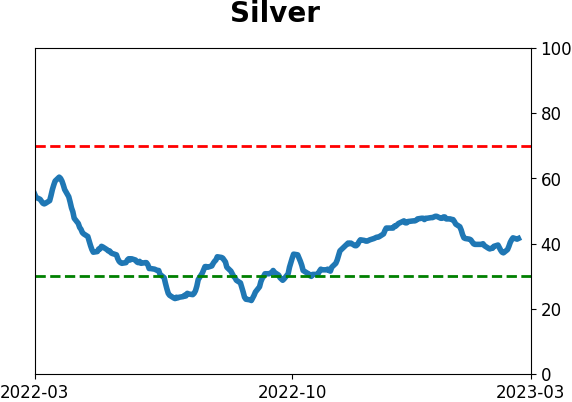
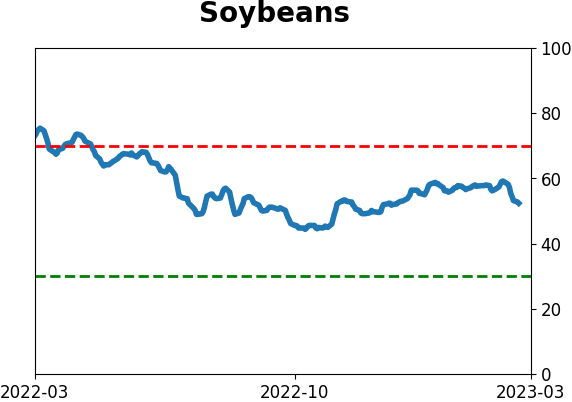
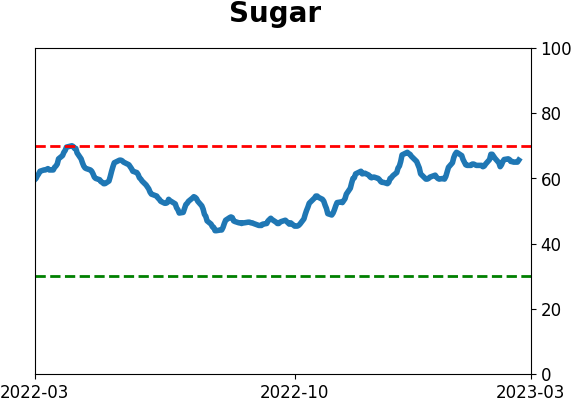
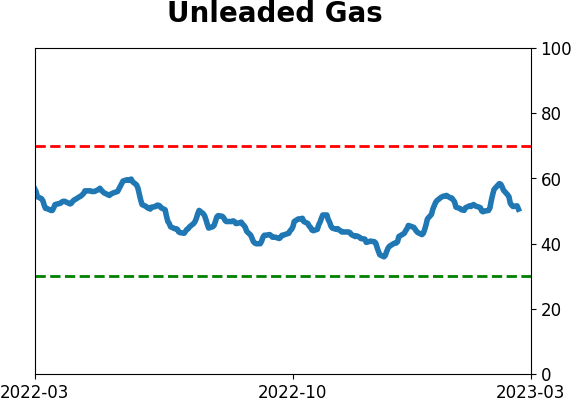
Commodity ETF's - 5-Day Moving Average
|
|