Headlines
|
|
A quick reversal in the Nasdaq McClellan Oscillator:
After reaching an extreme oversold threshold, internal momentum via the McClellan Oscillator on the Nasdaq exchange has cycled into the opposite extreme. That tends to indicate sustained strength. As does the 4 consecutive days with larger than 1% gains, seen only one other time in the index's history.
|
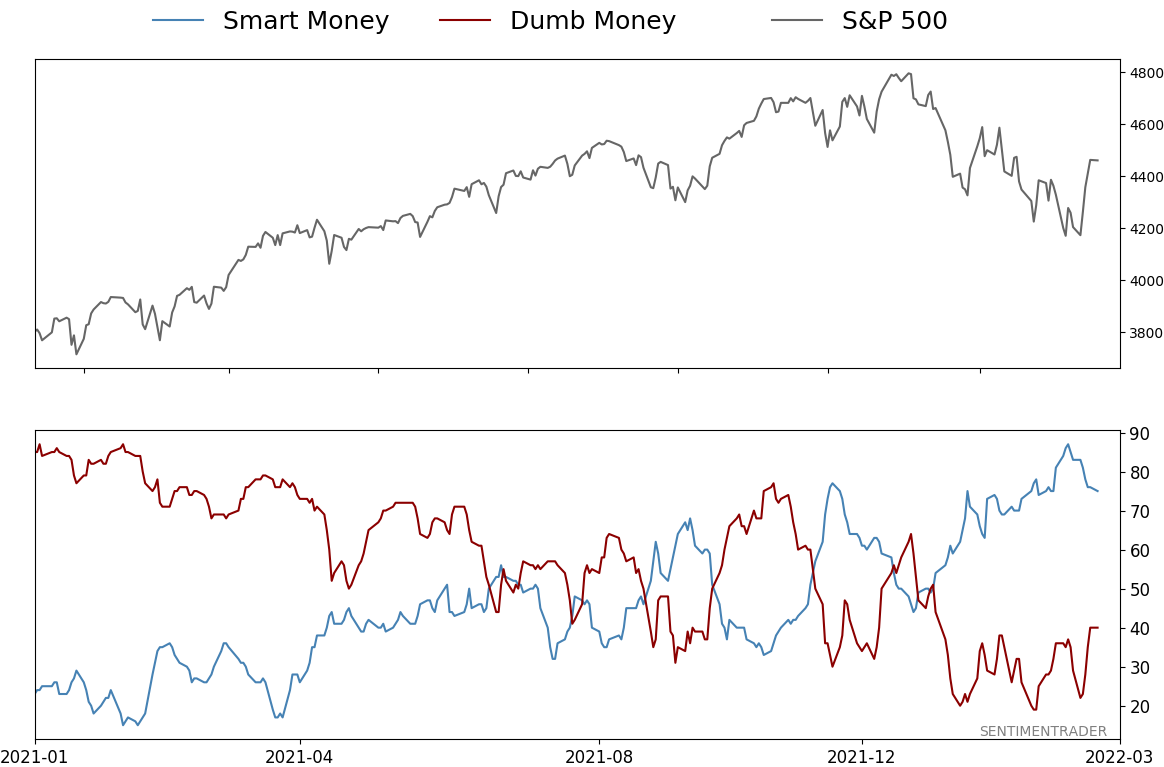
Smart / Dumb Money Confidence
|
Smart Money Confidence: 75%
Dumb Money Confidence: 40%
|
|
Risk Levels
Stocks Short-Term
|
Stocks Medium-Term

|
|
Bonds
|
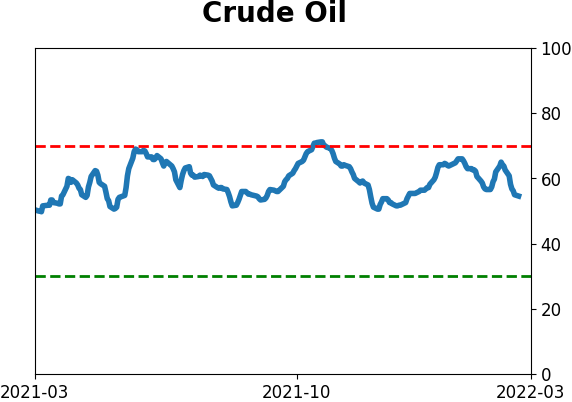
Crude Oil

|
|
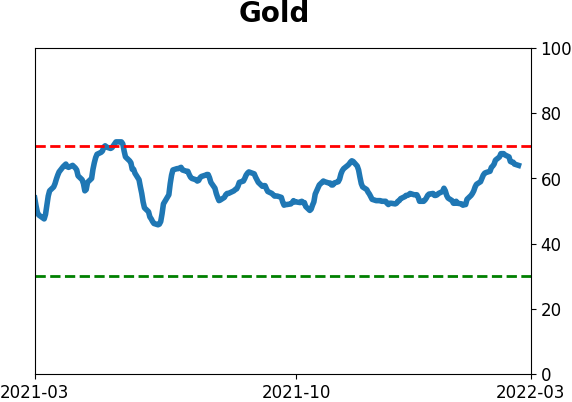
Gold
|
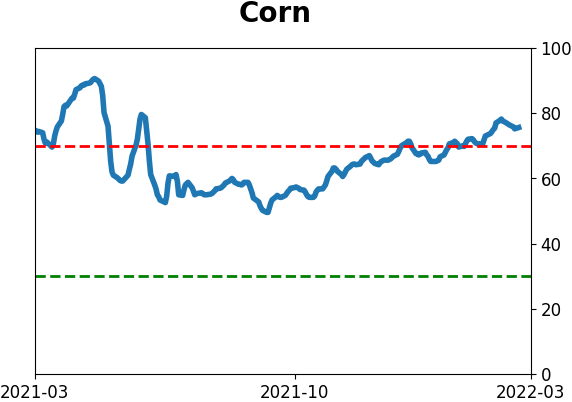
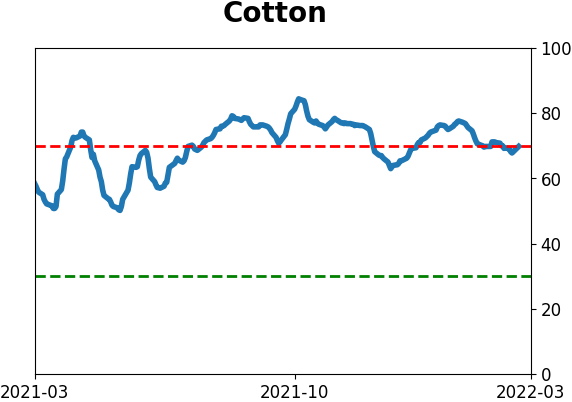
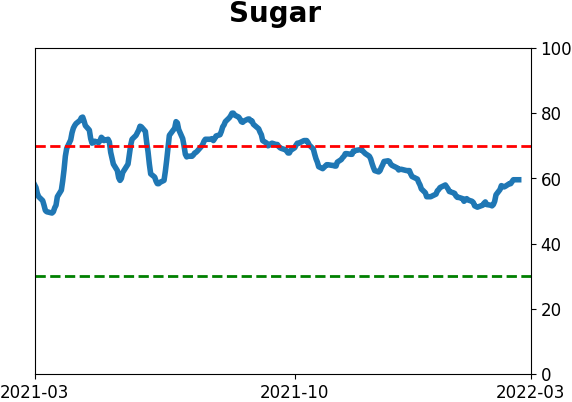
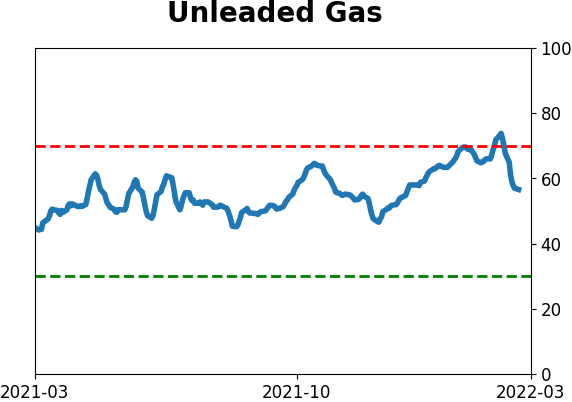
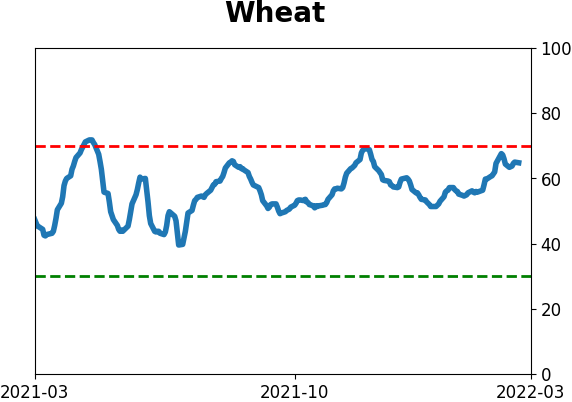
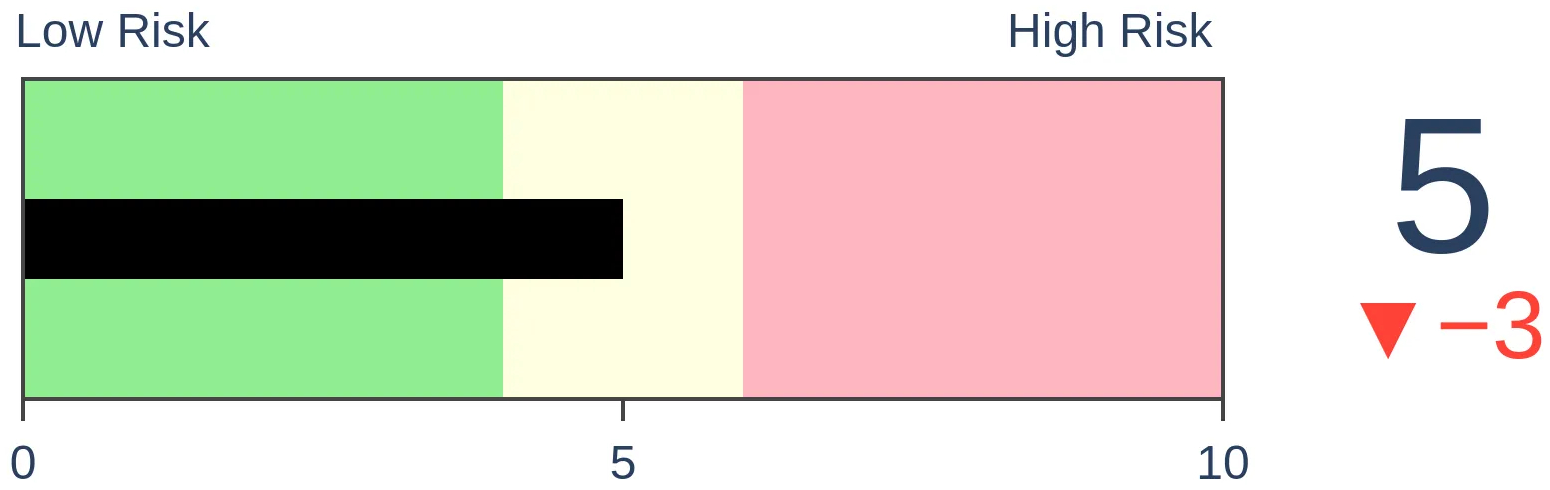
Agriculture
|
|
Research
By Jason Goepfert
BOTTOM LINE
After reaching an extreme oversold threshold, internal momentum via the McClellan Oscillator on the Nasdaq exchange has cycled into the opposite extreme. That tends to indicate sustained strength. As does the 4 consecutive days with larger than 1% gains, seen only one other time in the index's history.
FORECAST / TIMEFRAME
ONEQ -- Up, Long-Term
|
Key points:
- Internal momentum on the Nasdaq has cycled from extreme oversold to extreme overbought
- That has tended to precede sustained rallies (with 2 major exceptions)
- The four straight 1% gains in the Composite argue against a failure
Internals have cycled from one extreme to the other
Ever since we looked at the disaster among stocks trading on the Nasdaq exchange, we've been looking for signs of a recovery. Few signs are better than a thrust of buyers returning quickly and en masse.
There are nascent signs we're seeing that now. The McClellan Oscillator for the Nasdaq has cycled from below -70 to above +70. Over the past 5 years, it has done this only 2 other times, preceding sustained rallies.
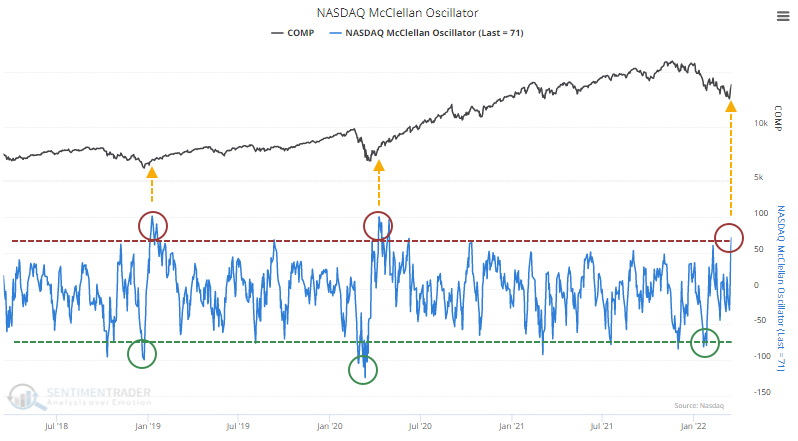
The Nasdaq Composite's returns following all similar reversals over the past 40 years were good, with 14 out of 17 signals showing a positive one-year return, which averaged a robust 17%.
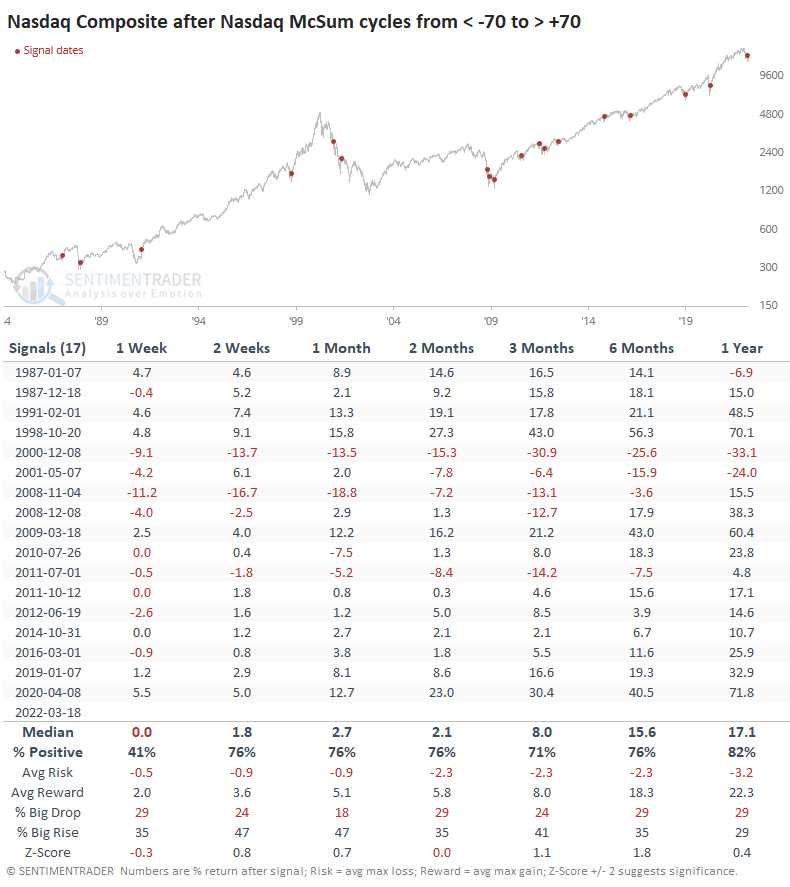
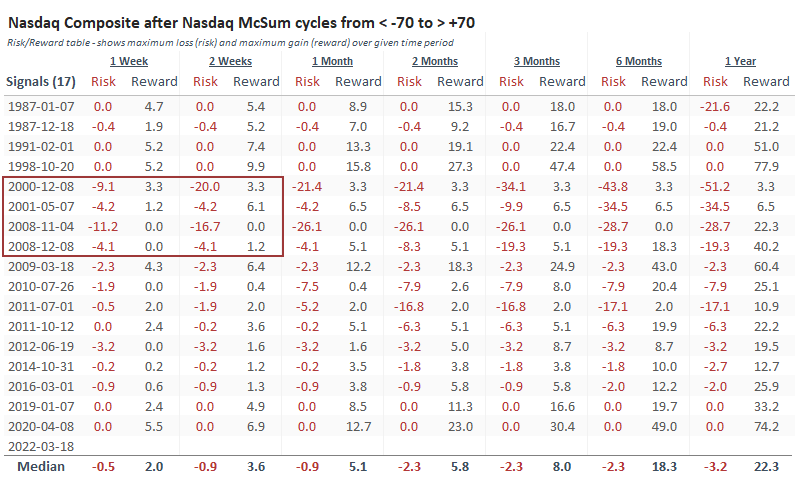
The biggest issue is the post-bubble bear market. That, and the financial crisis, were the only times when sellers returned immediately and in force. It could be argued that it happened in June 2012, which was a false failure.
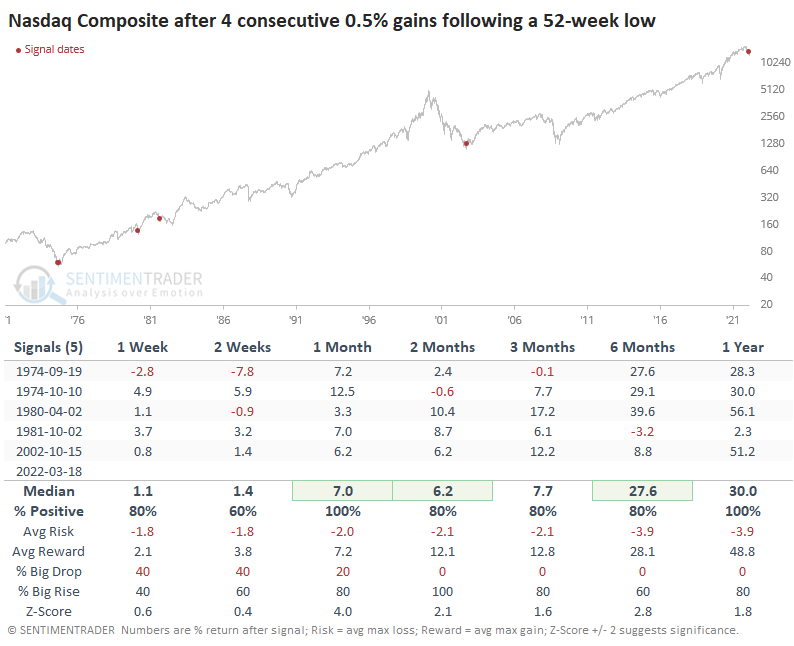
The thrust in price has been impressive and nearly unprecedented. The only other time in its history when the Nasdaq Composite closed at a 52-week low then enjoyed 4 consecutive days with larger than 1% gains was in April 1980. That ended up leading to a further gain of 56% during the following year.
Even if we look at "only" gains of 0.5% on back-to-back-to-back-to-back days, there are few precedents, all leading to further gains.
What the research tells us...
Since we're in the aftermath of a speculative bubble, similar to the 2000-2002 bear market, we need to be on the lookout for high volatility and rally failures. There were multiple false bottoms during that stretch. The persistent follow-through last week was impressive, and it's been an excellent sign in the past. Not only the Composite index rallied, but also many of the member stocks. If we see immediate and heavy selling pressure in the week(s) ahead, then the probability will rise dramatically that there is a long slog ahead.
Active Studies
| Time Frame | Bullish | Bearish | | Short-Term | 4 | 0 | | Medium-Term | 22 | 2 | | Long-Term | 15 | 5 |
|
Indicators at Extremes
Portfolio
| Position | Description | Weight % | Added / Reduced | Date | | Stocks | 21.6% RSP, 5.1% IEMG | 26.7 | Added 5.3% | 2022-03-18 | | Bonds | 32.7% BND, 7.1% SCHP | 40.1 | Added 8.3% | 2021-10-26 | | Commodities | GCC | 2.4 | Reduced 2.1%
| 2020-09-04 | | Precious Metals | GDX | 4.6 | Reduced 4.2% | 2021-05-19 | | Special Situations | 7.6% KWEB, 4.9% XBI, 3.7% XLE, 1.8% PSCE | 18.0 | Added 4.6% | 2022-02-24 | | Cash | | 7.9 | | |
|
Updates (Changes made today are underlined)
We had a volatile few weeks into mid-March, and it was enough to trigger a number of extremes. Most of the studies we've looked at have had a clear bullish edge over a multi-month time frame. I'd typically be more proactive instead of reactive with changes in positions, adding exposure into weakness instead of strength, but during an unhealthy environment like we're in, I tend to be more conservative. I did add some exposure to emerging markets, choosing a fund with the least exposure to China, since I already have exposure there with KWEB. It's still heavily weighted to that market. The only other times the MSCI Emerging Markets Index has had a weekly reversal like this week were October 2008, October 2011, and August 2015, all leading to long-term gains. RETURN YTD: -0.4% 2021: +8.7%, 2020: +8.1%, 2019: +12.6%, 2018: +0.6%, 2017: +3.8%, 2016: +17.1%, 2015: +9.2%, 2014: +14.5%, 2013: +2.2%, 2012: +10.8%, 2011: +16.5%, 2010: +15.3%, 2009: +23.9%, 2008: +16.2%, 2007: +7.8%
|
|
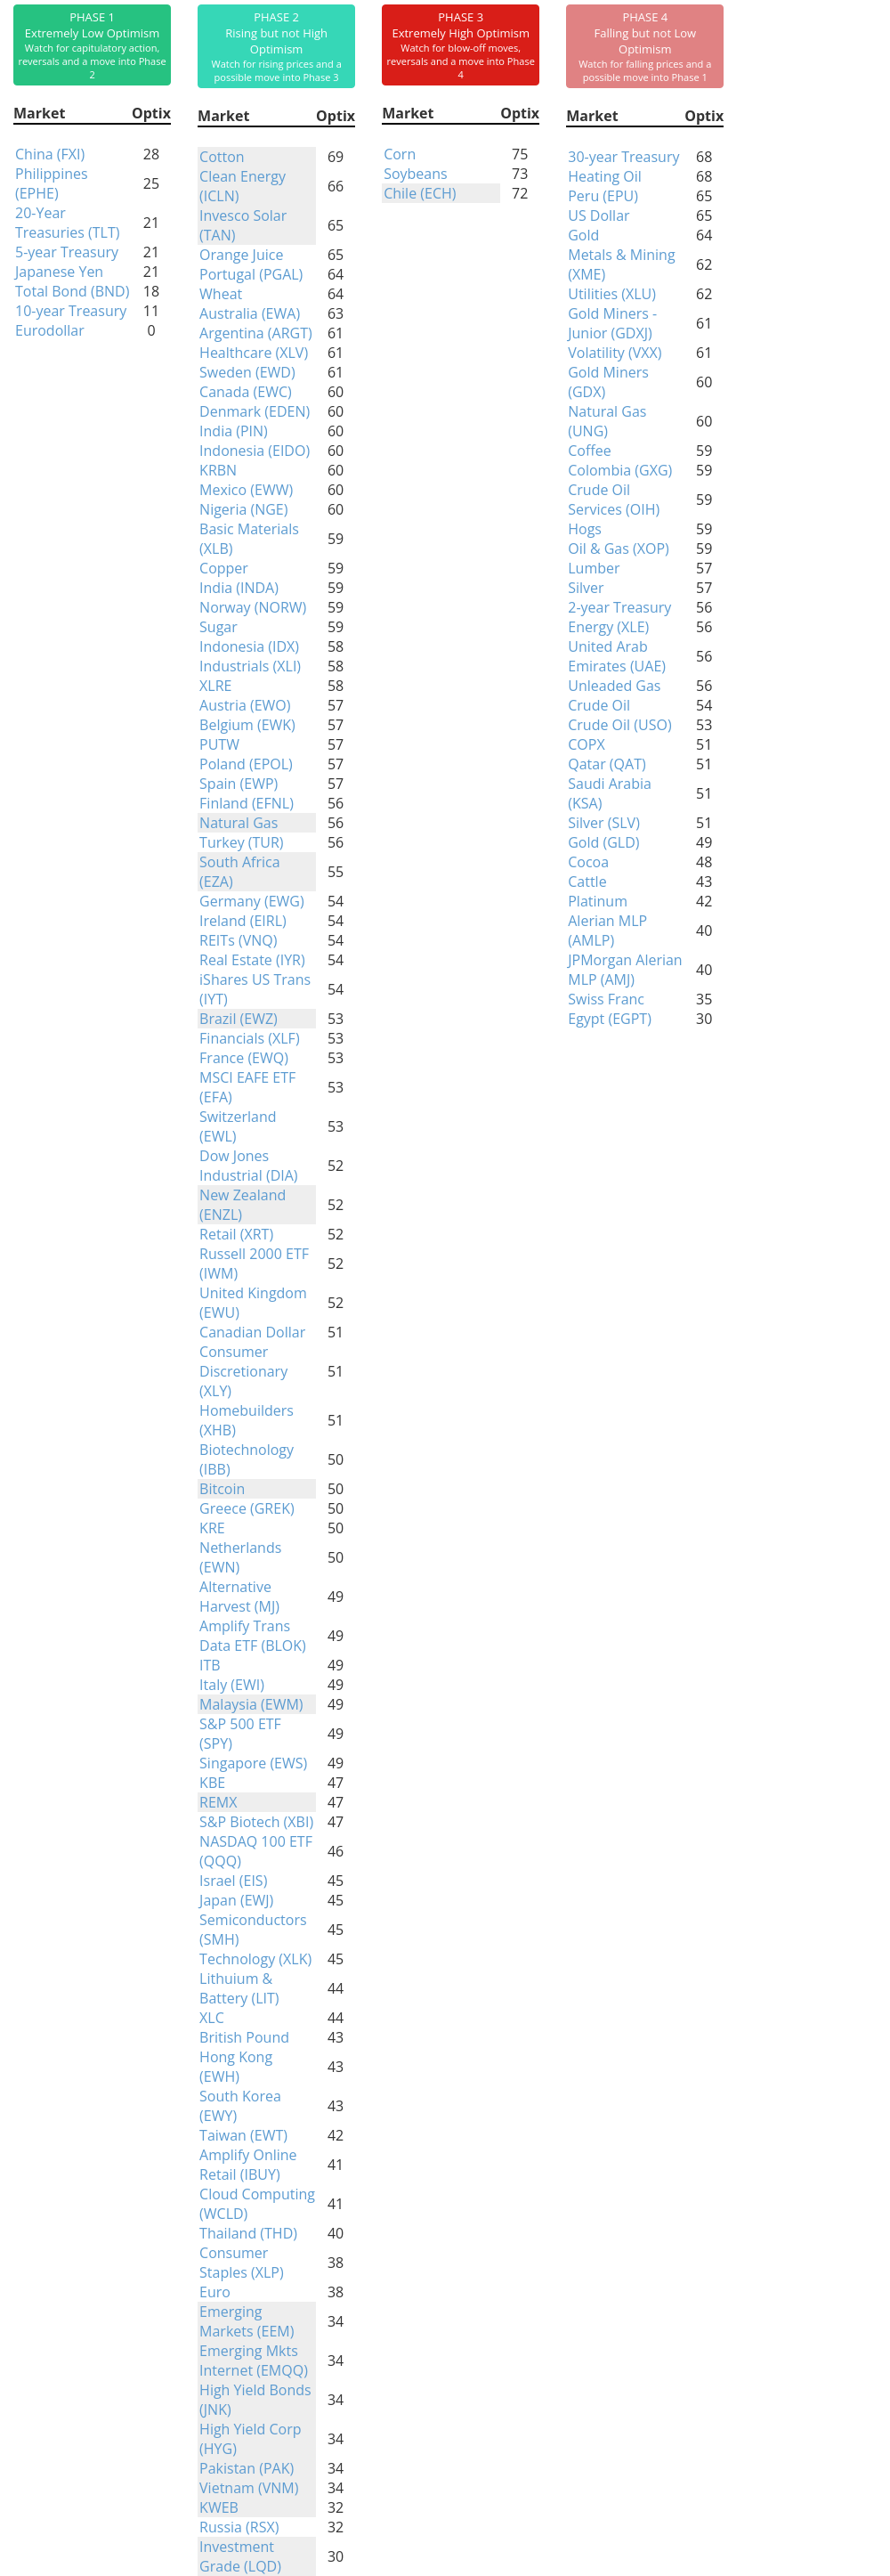
Phase Table
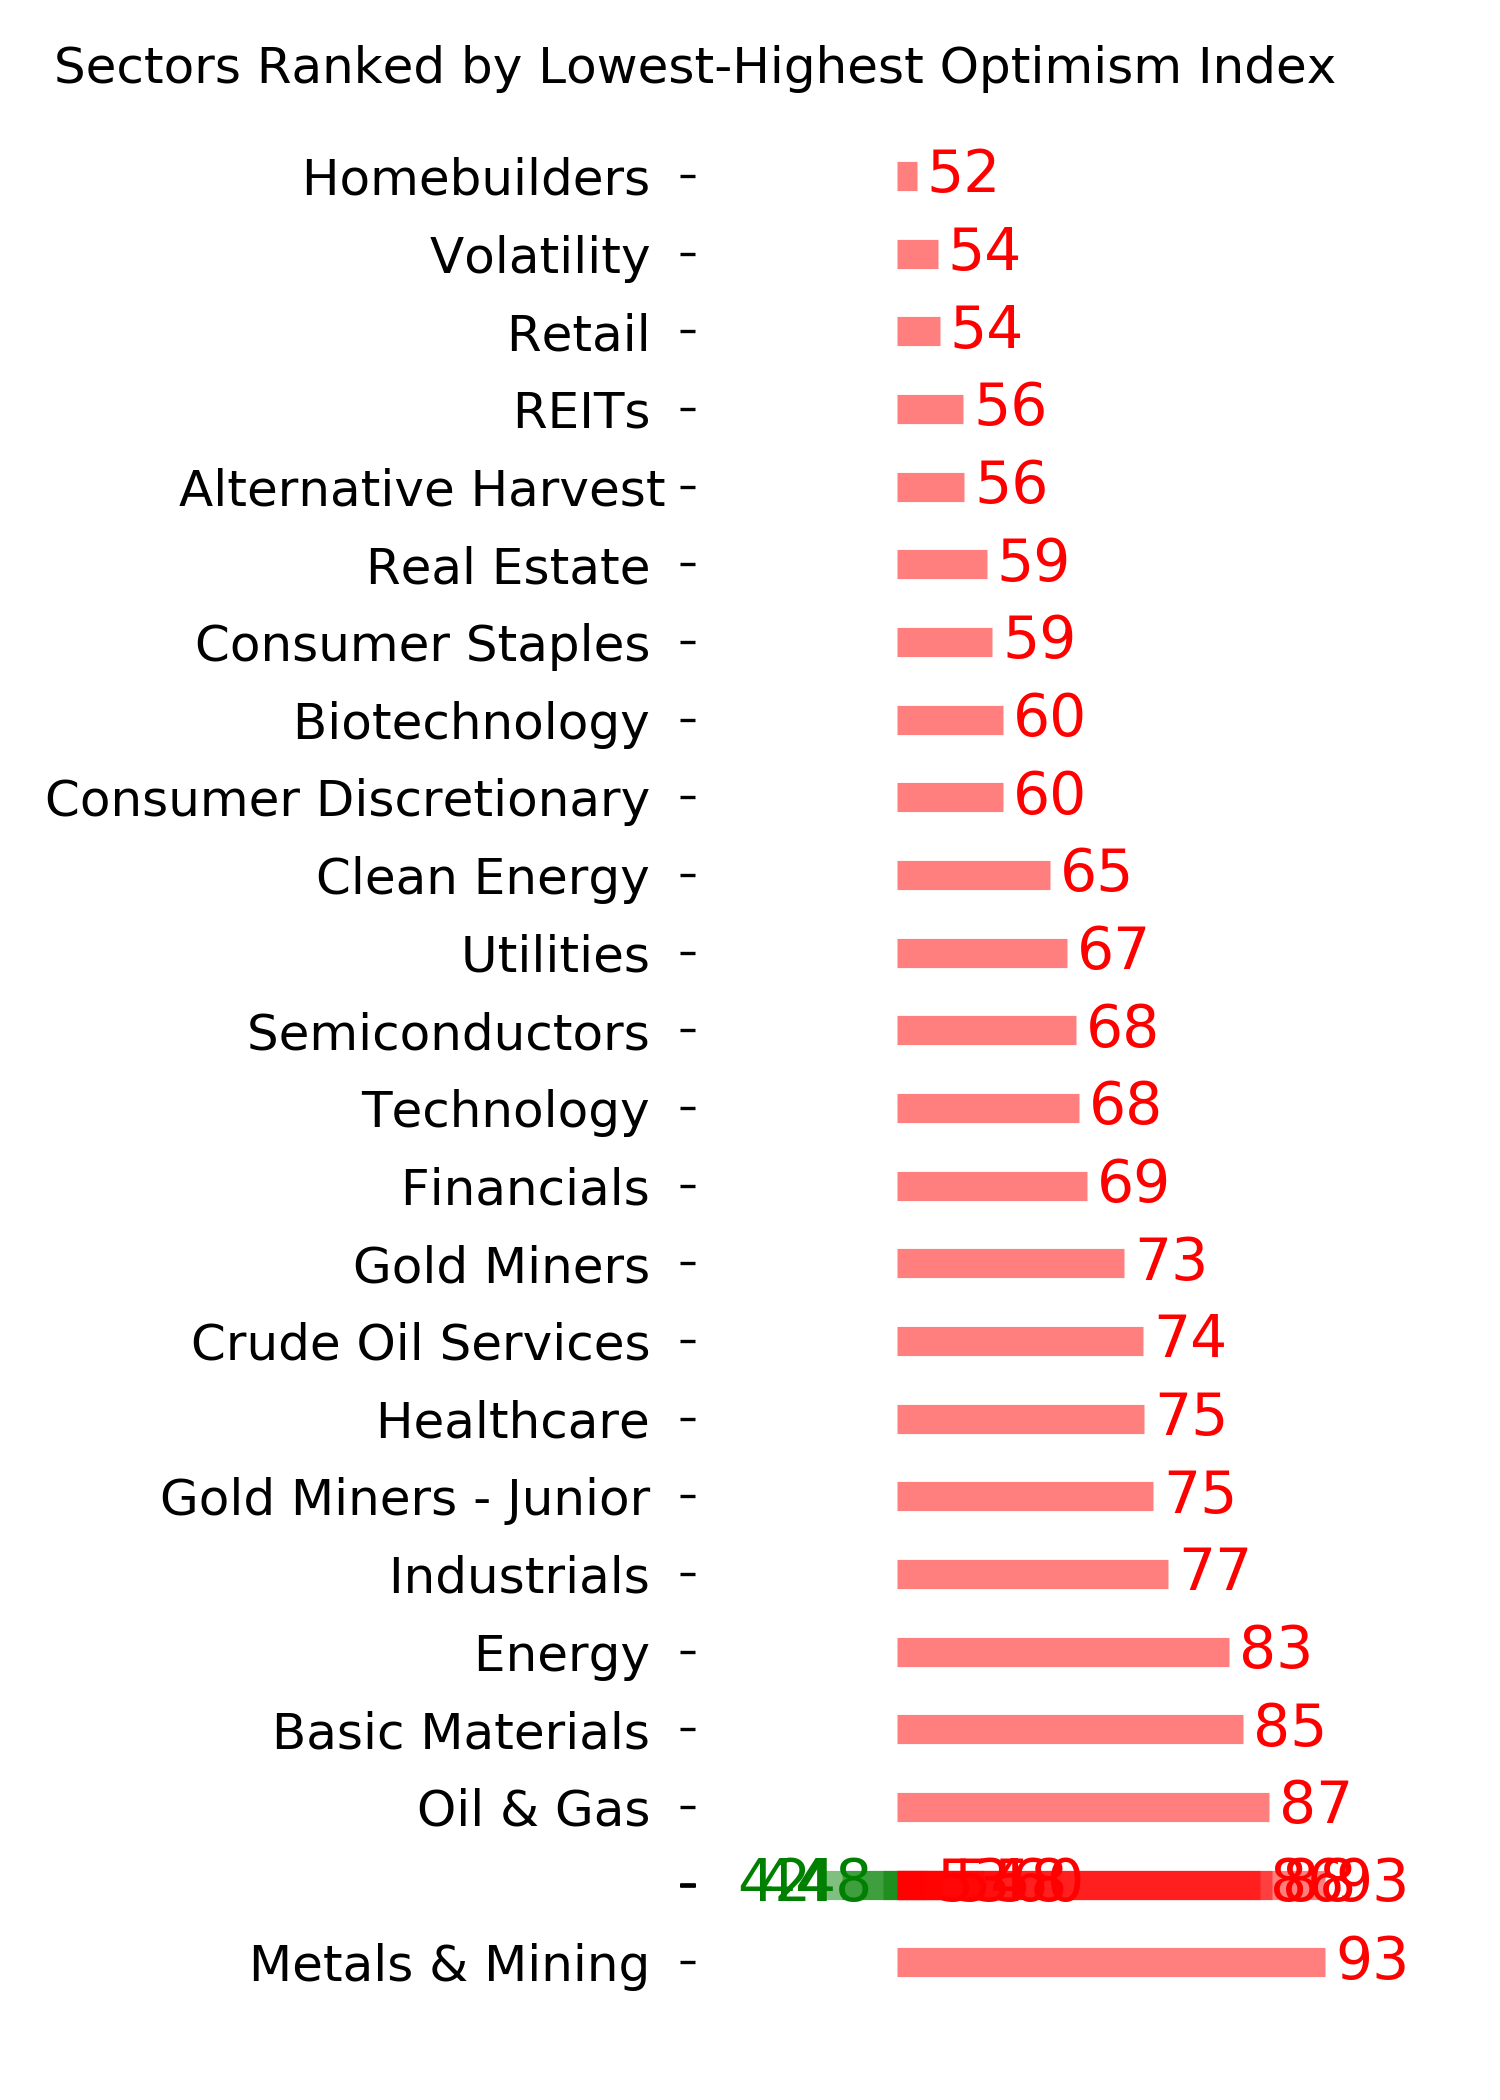
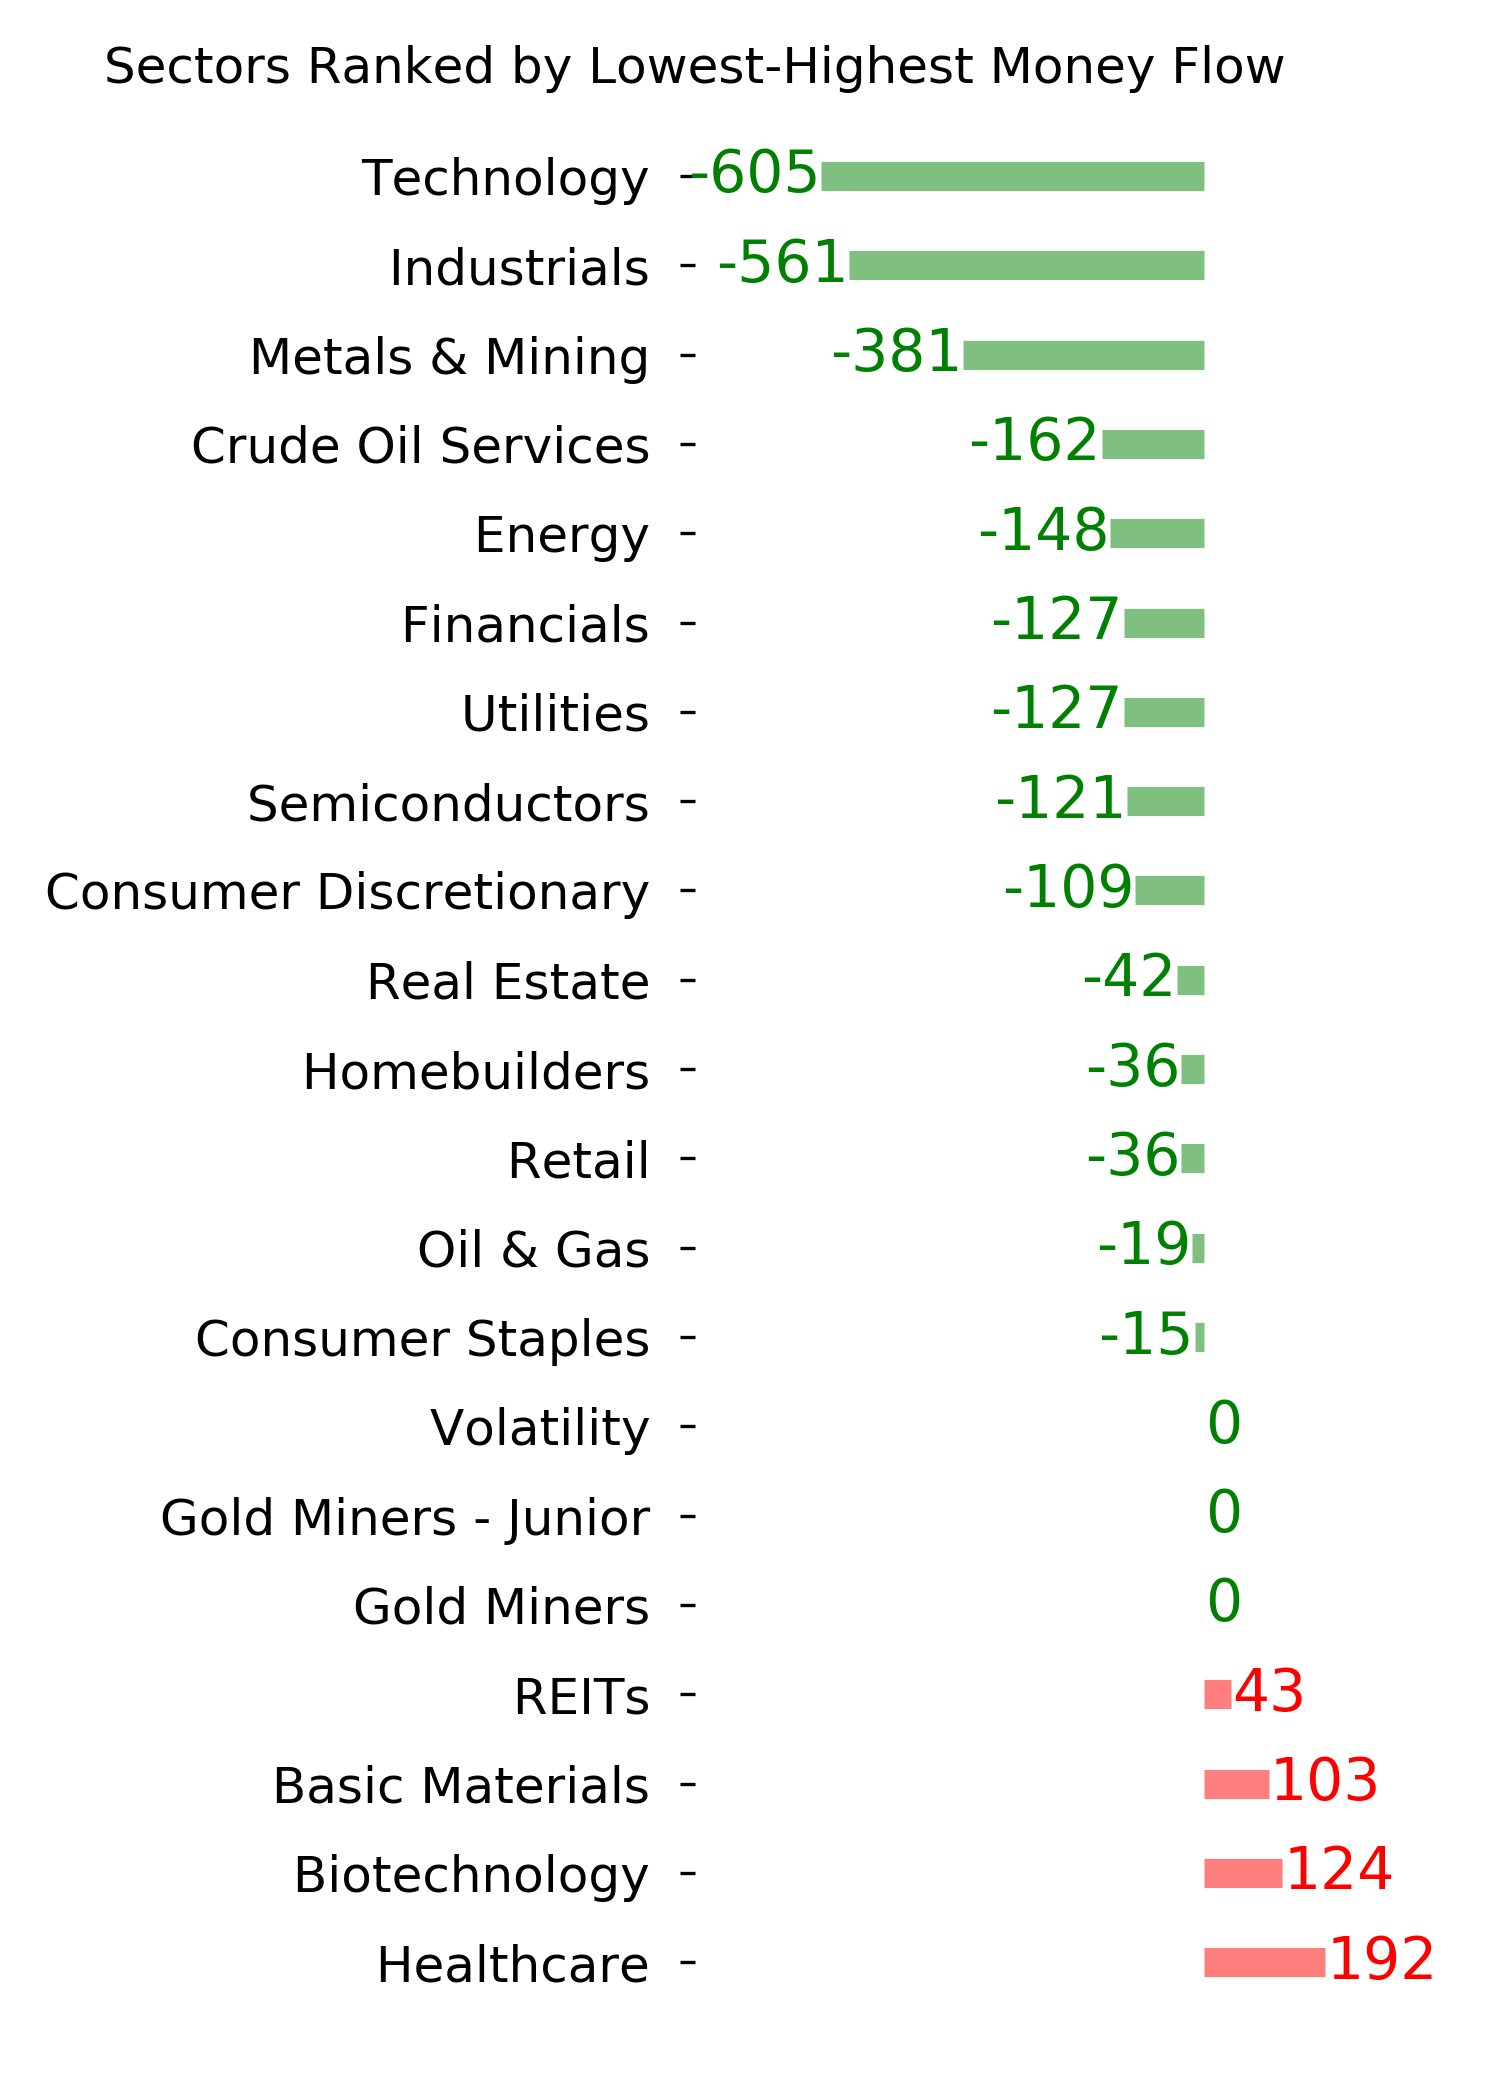
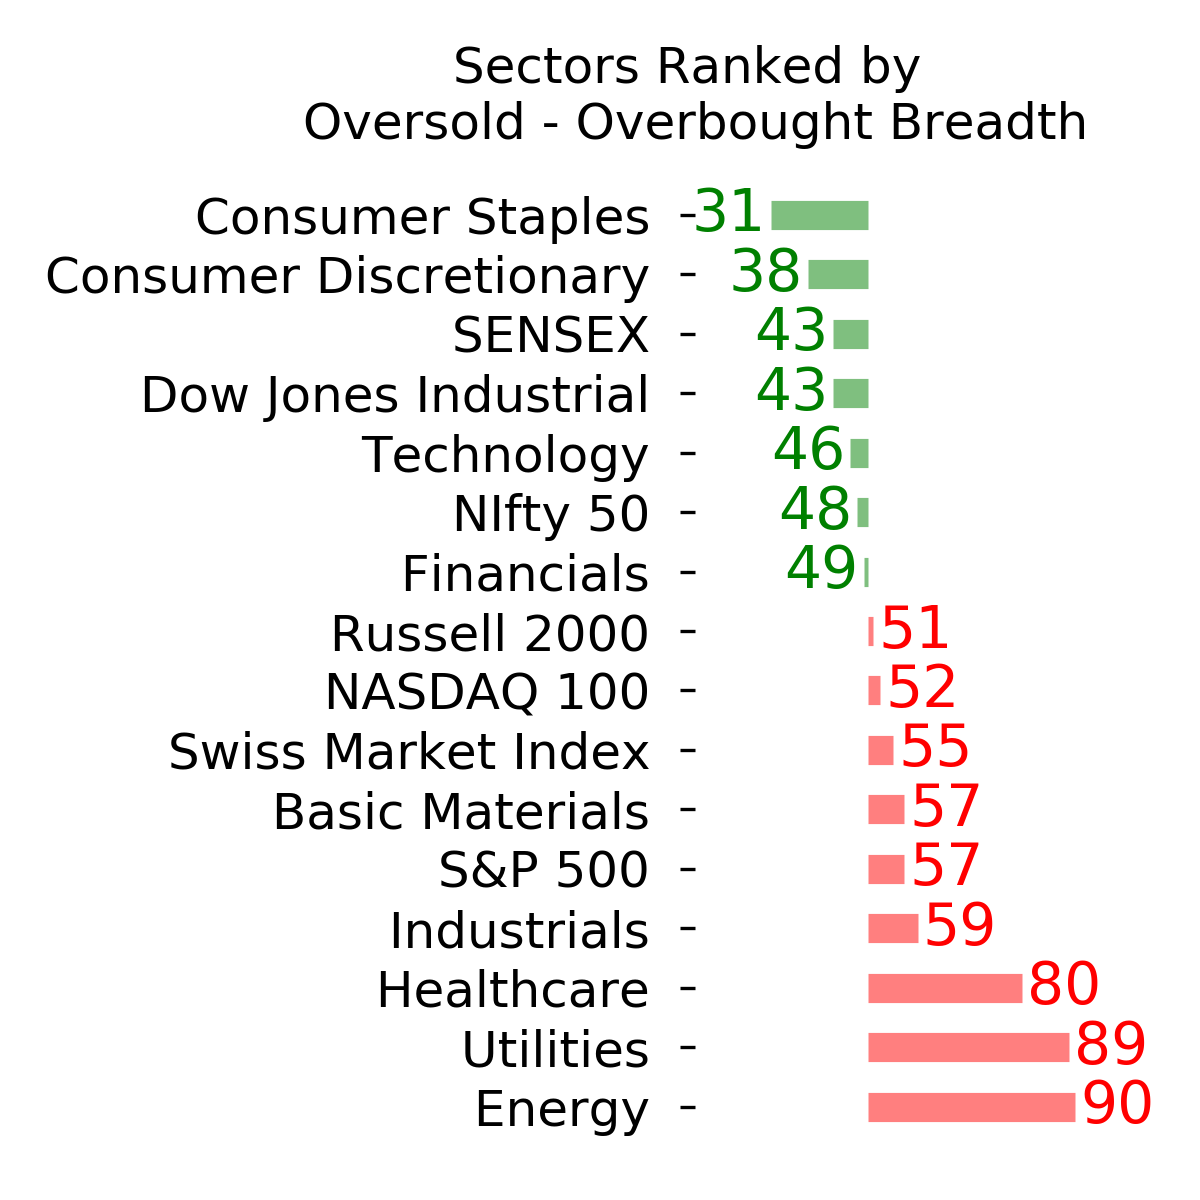
Ranks
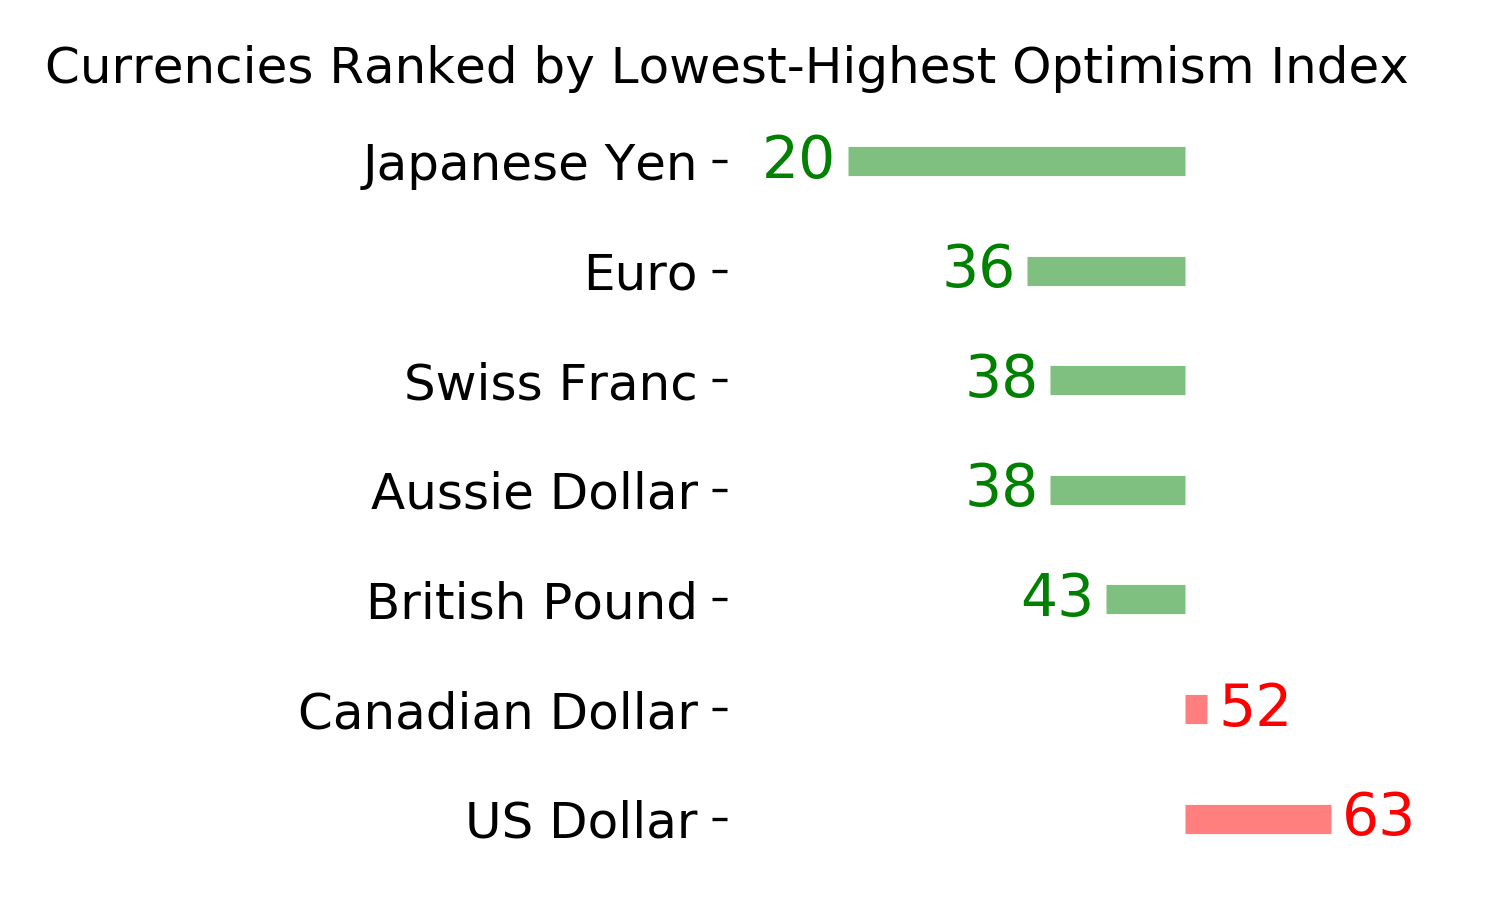
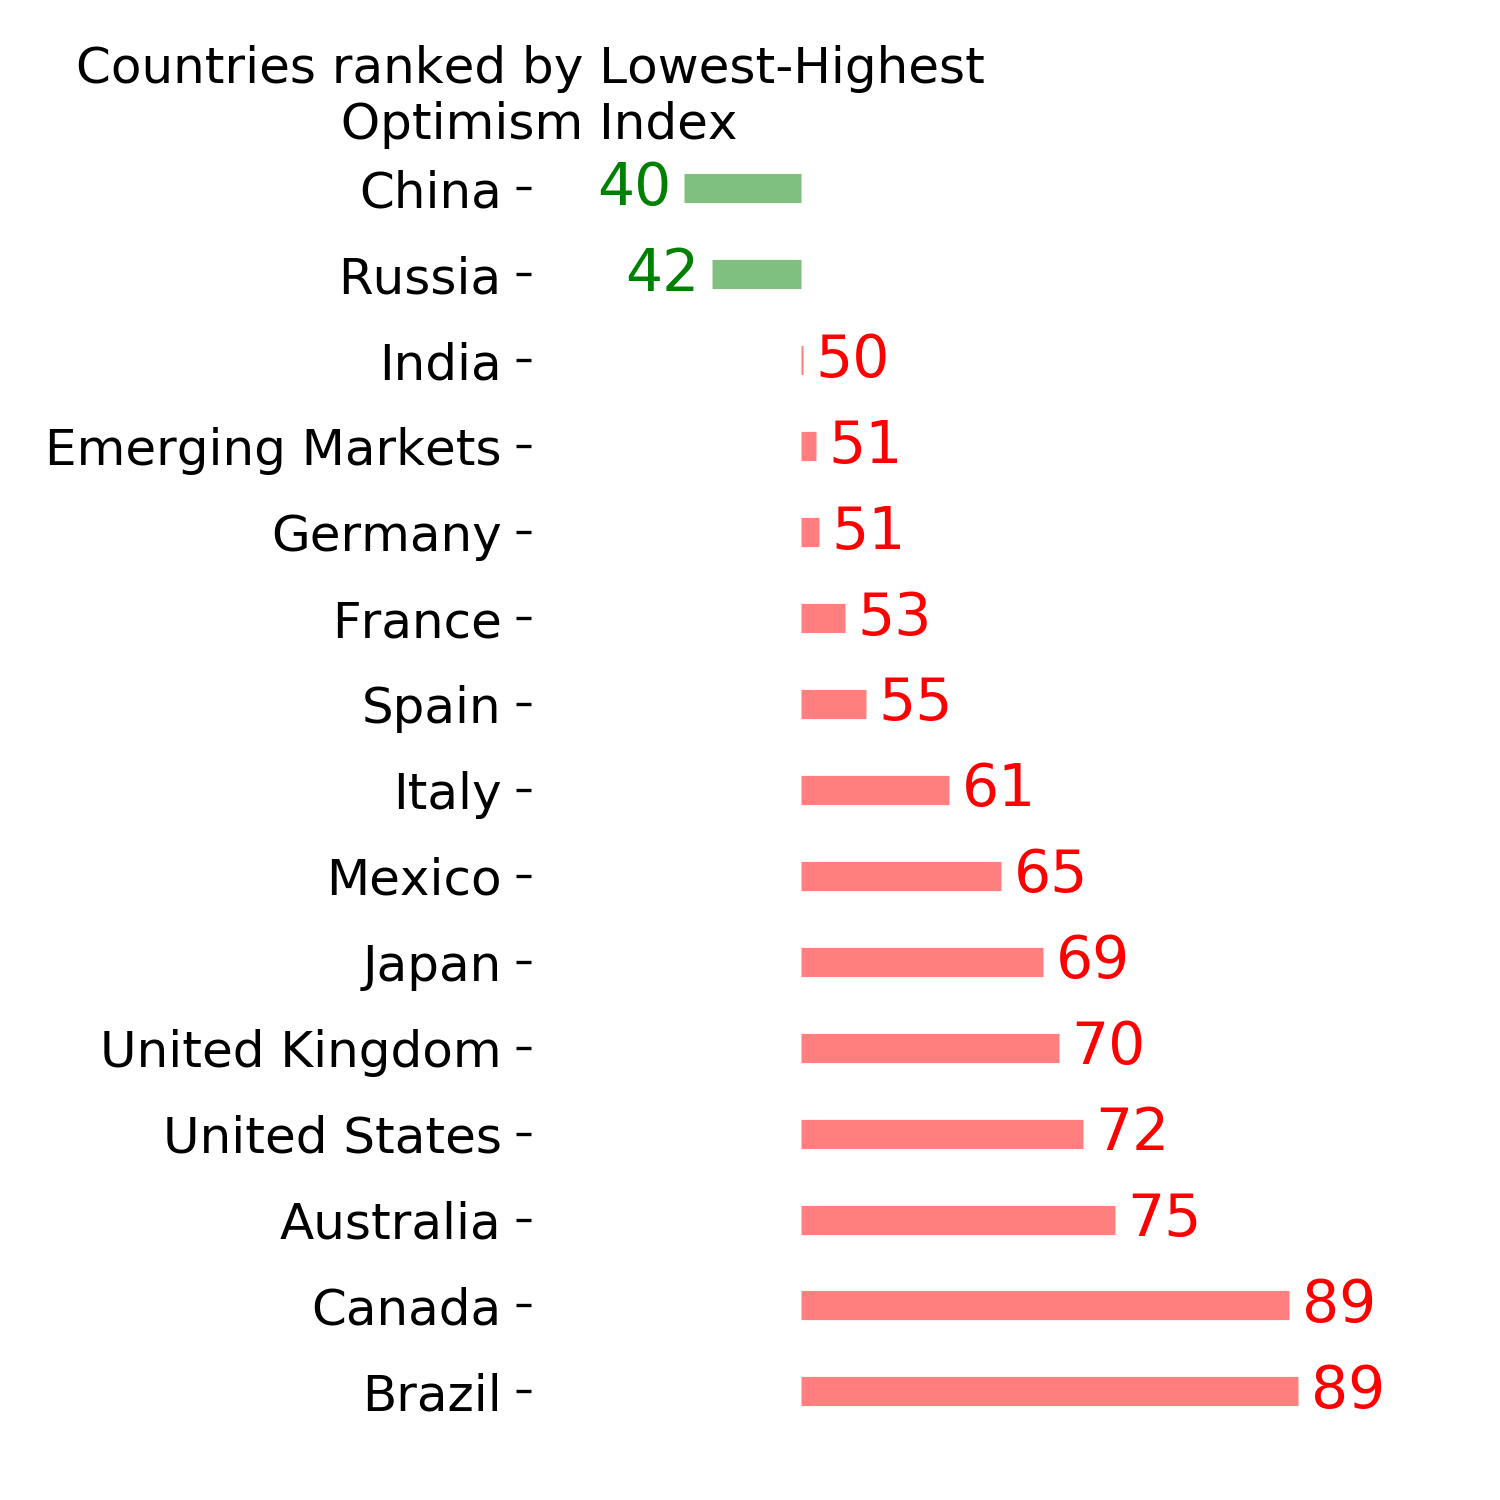
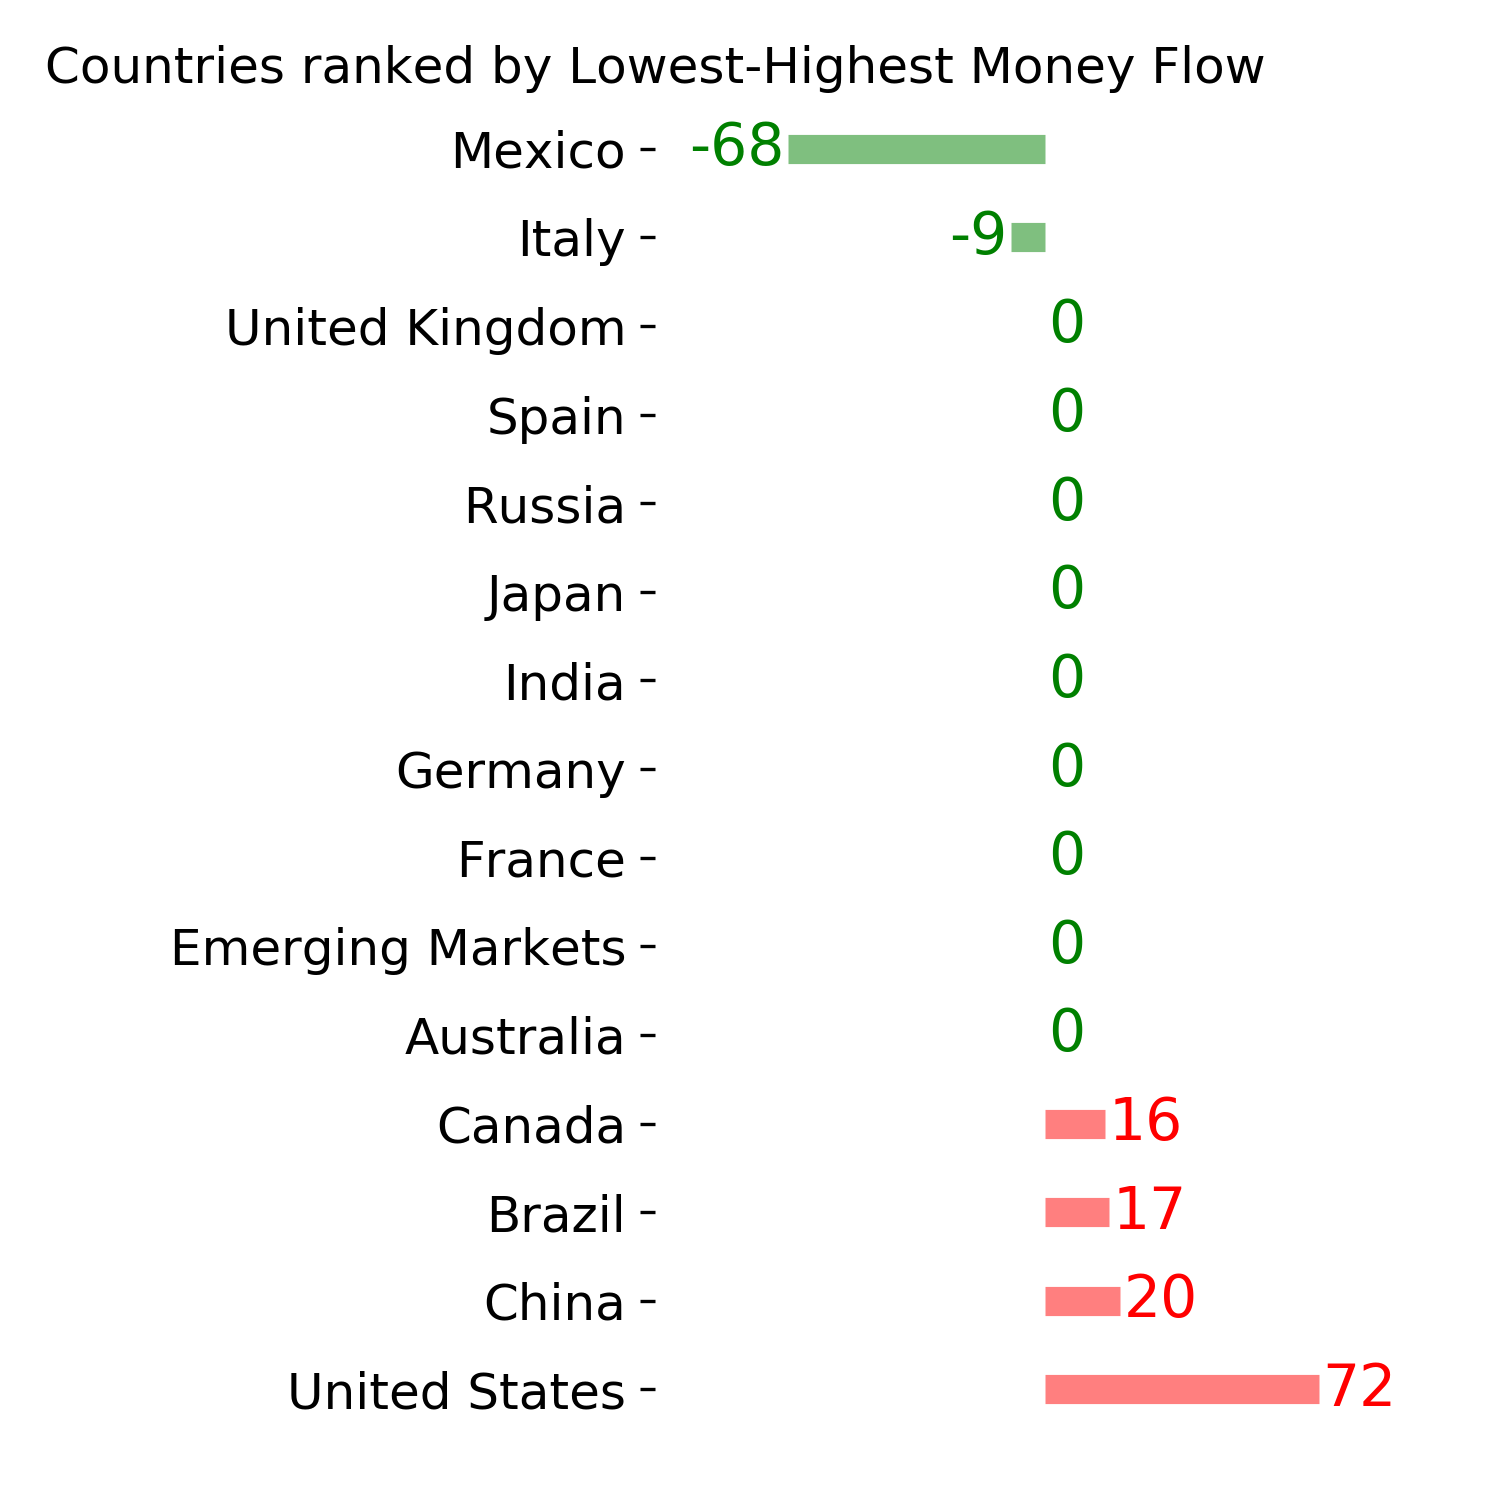
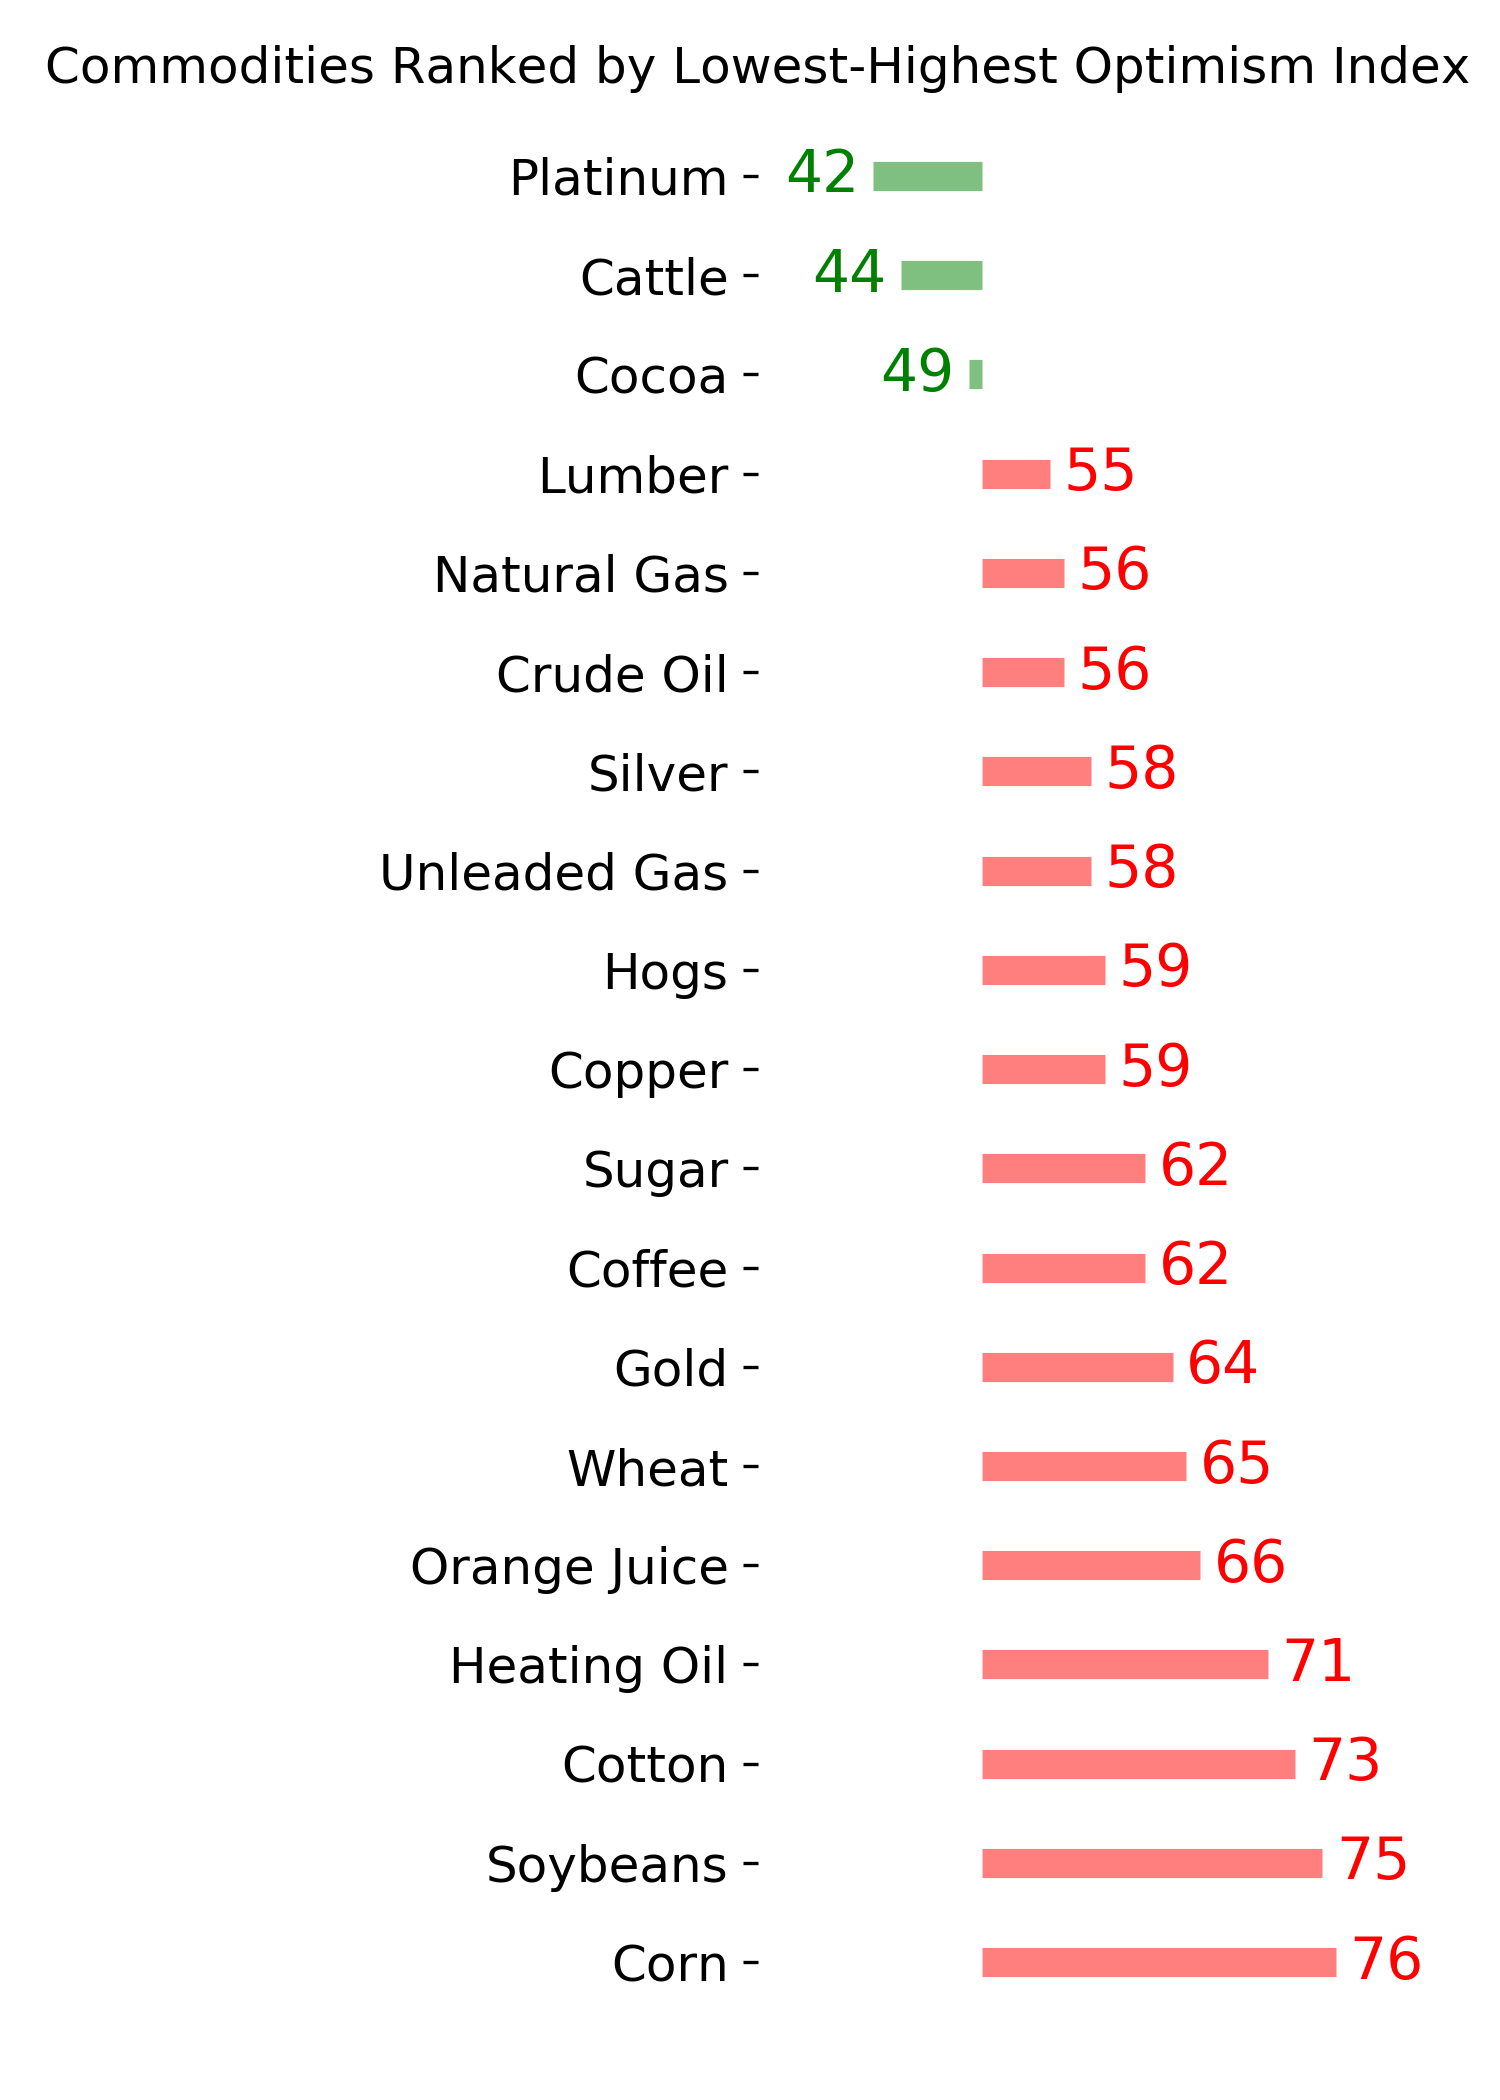
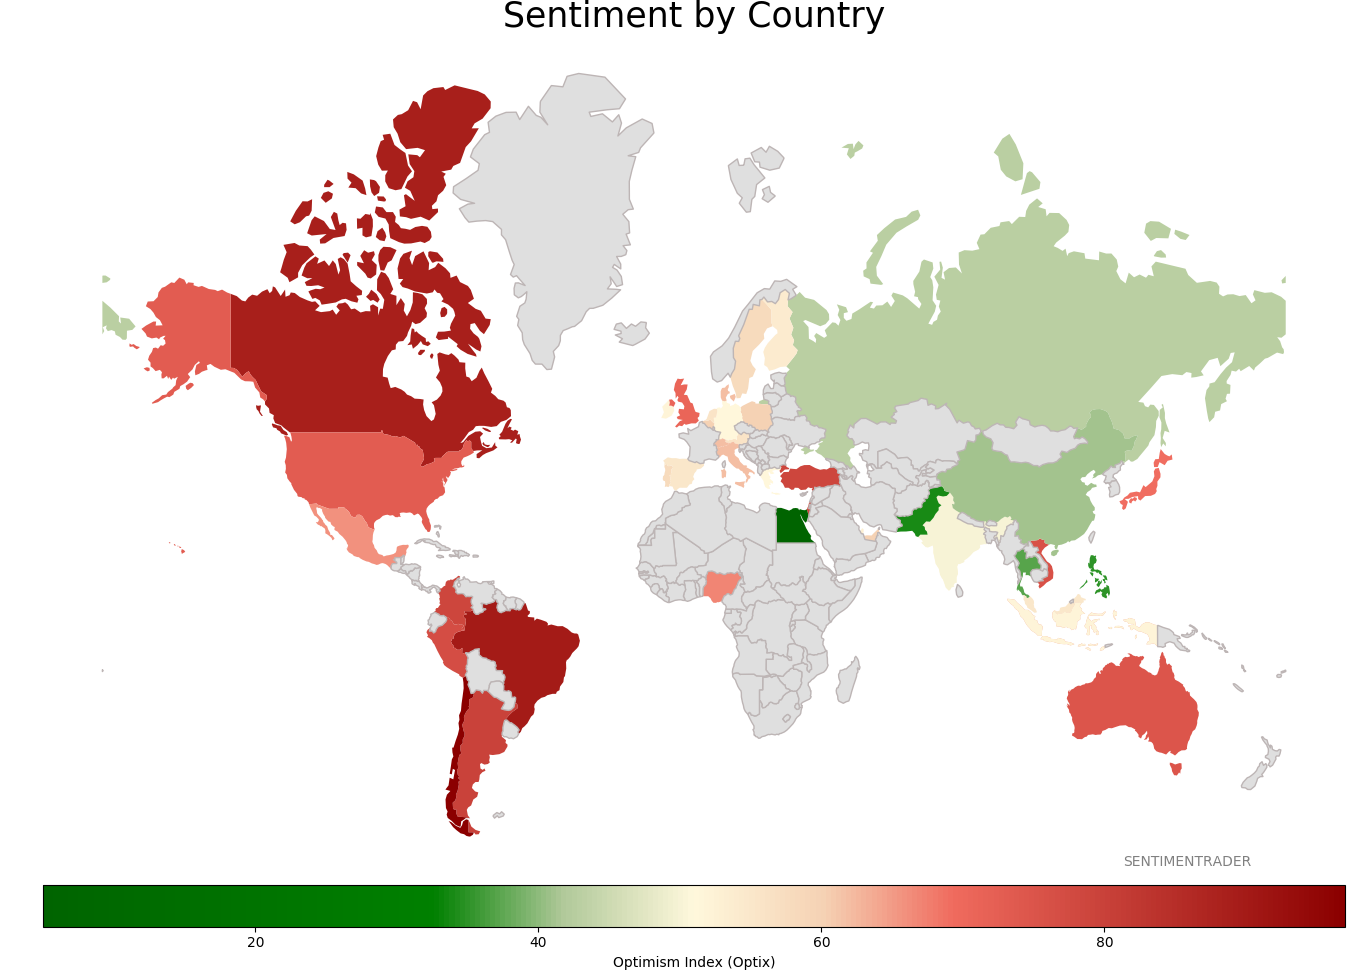
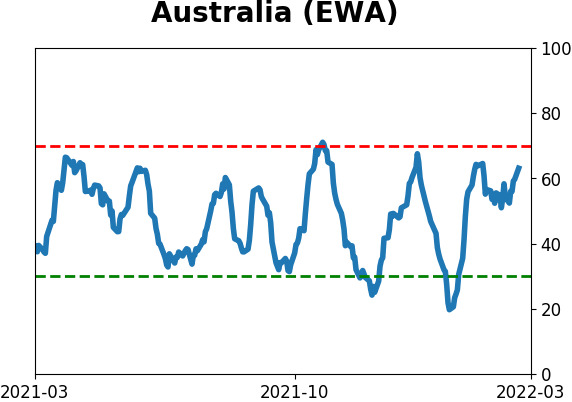
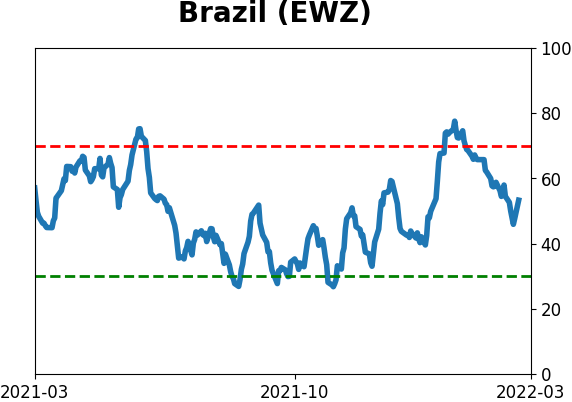
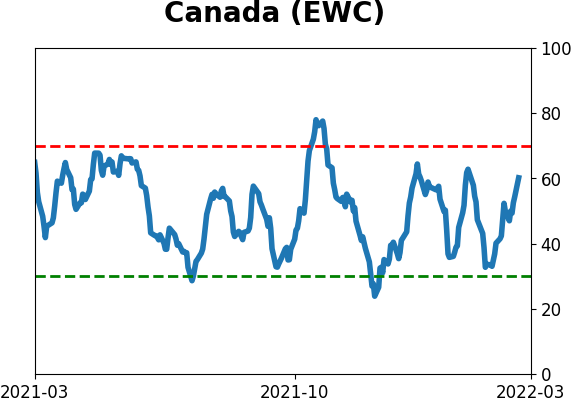
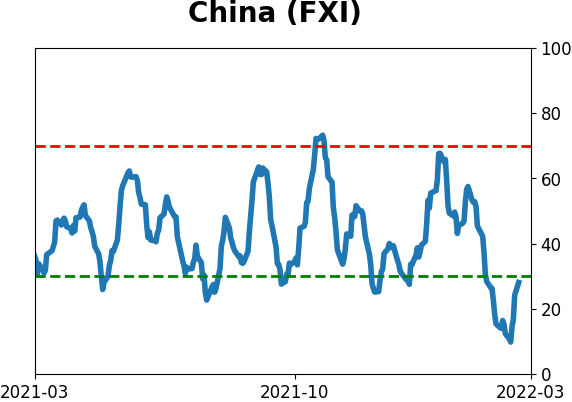
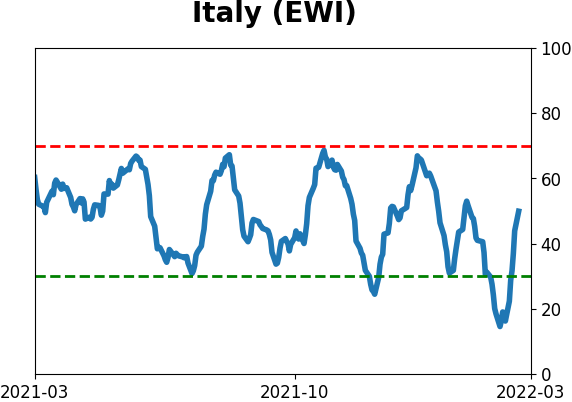
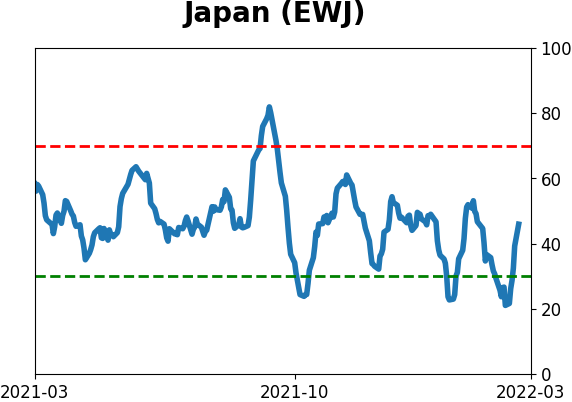
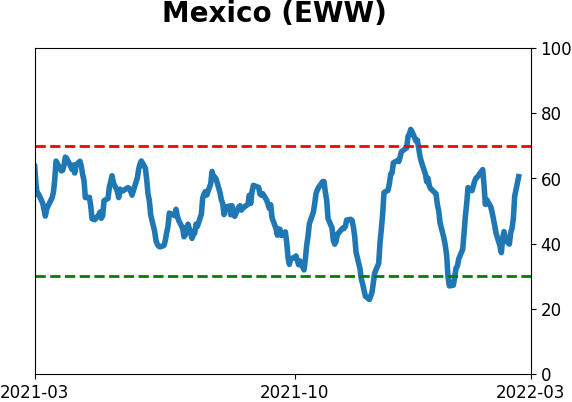
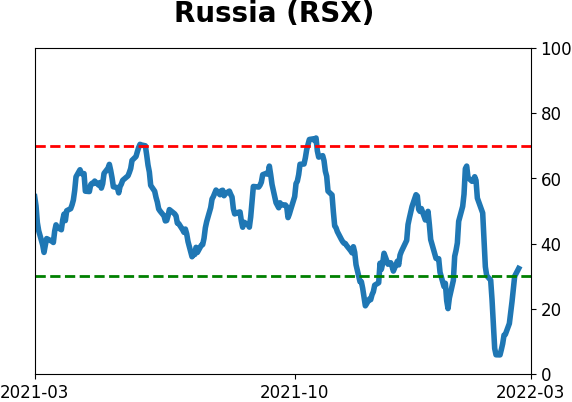
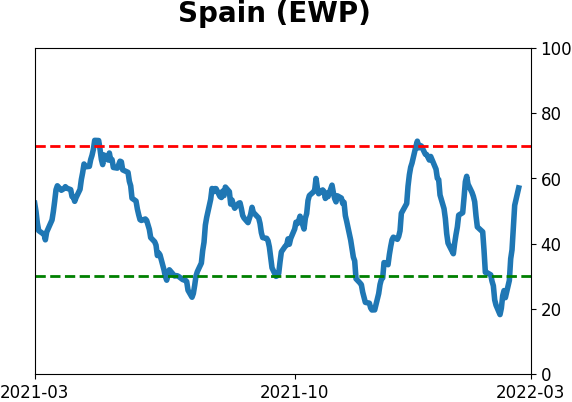
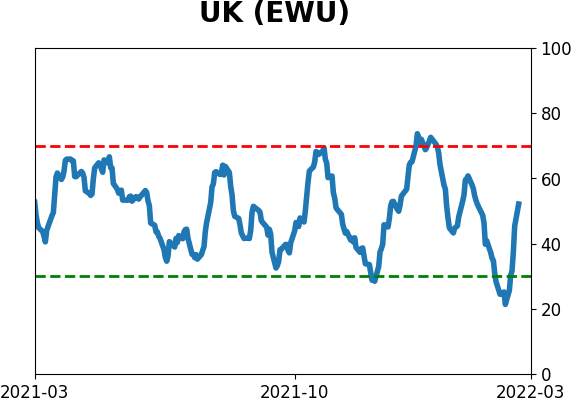
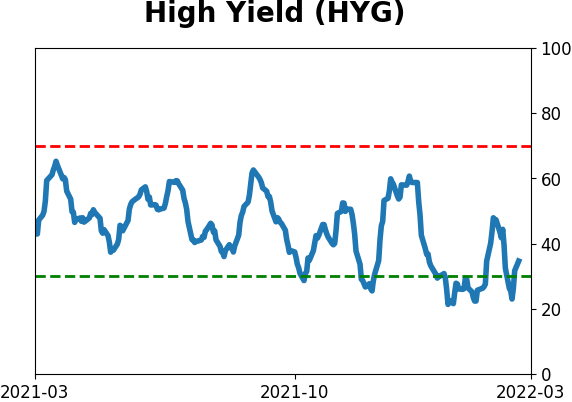
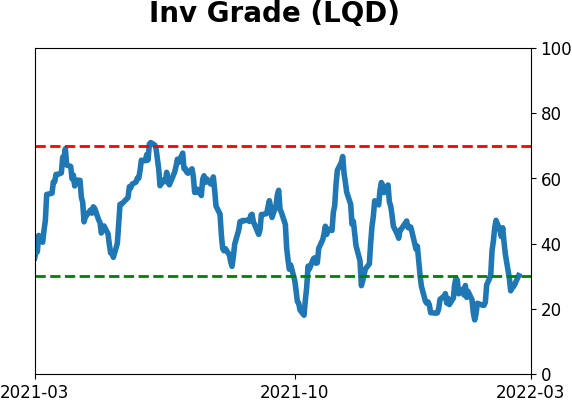
Sentiment Around The World
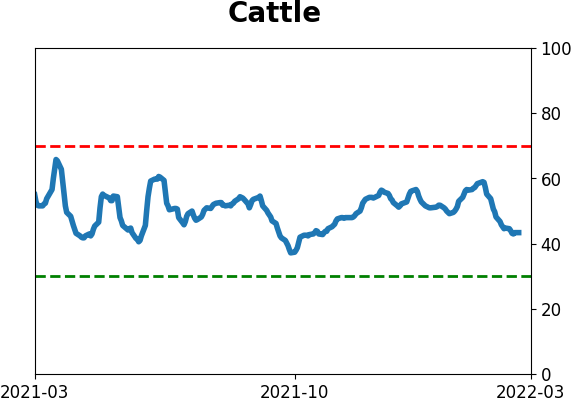
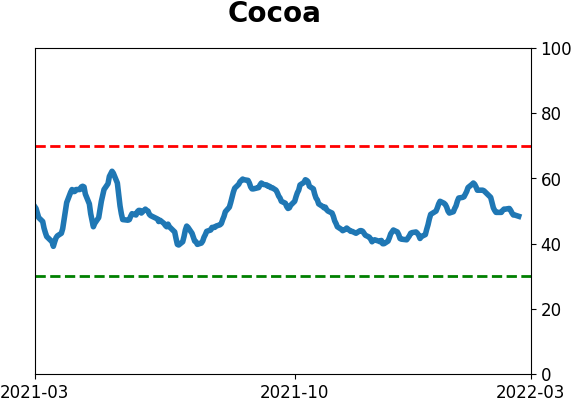
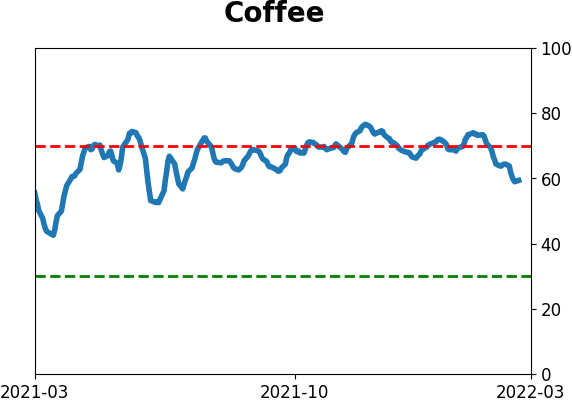
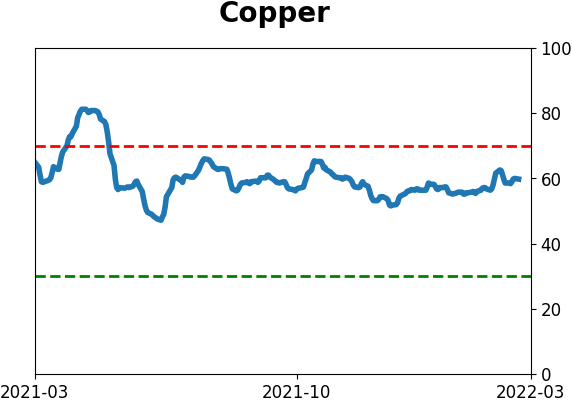
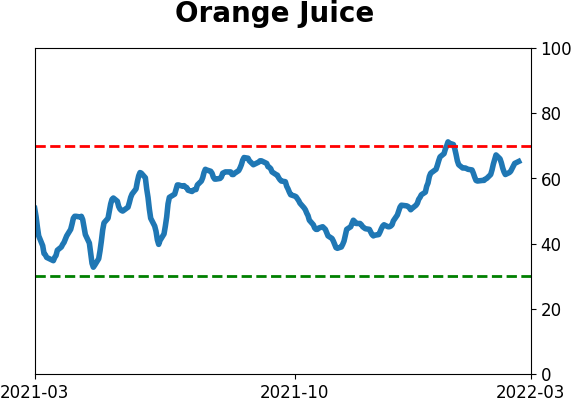
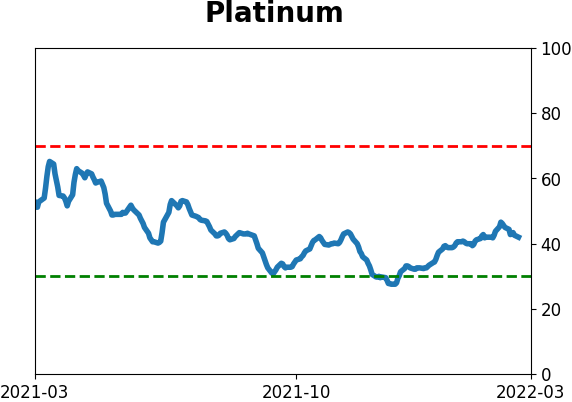
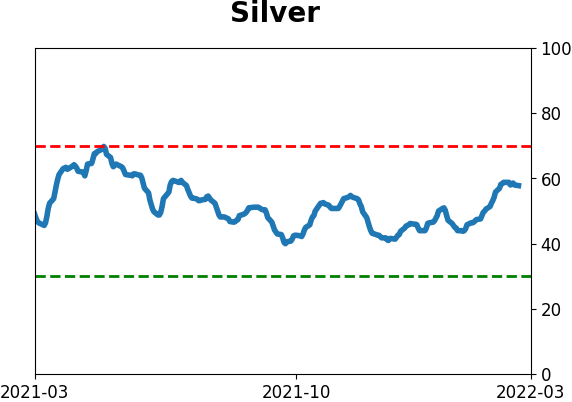
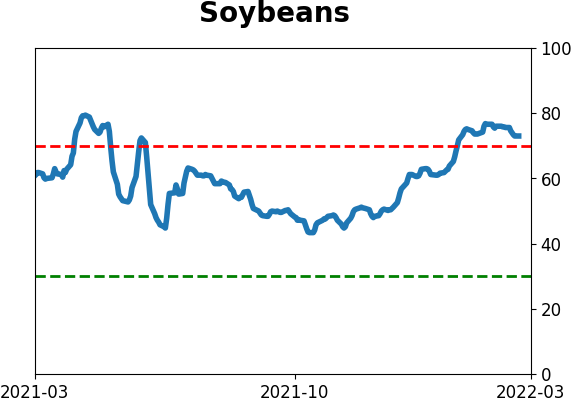
Optimism Index Thumbnails
|
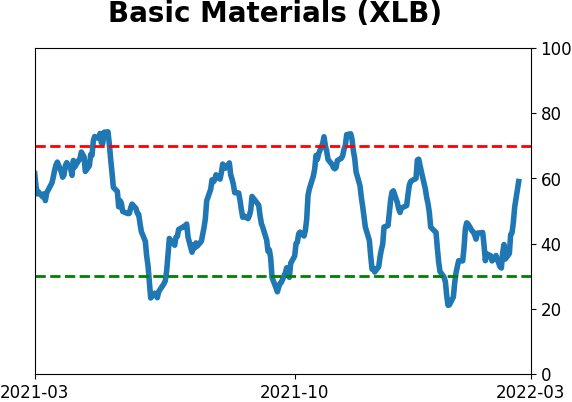
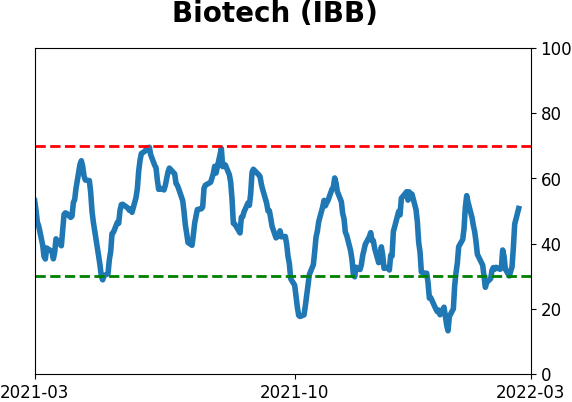
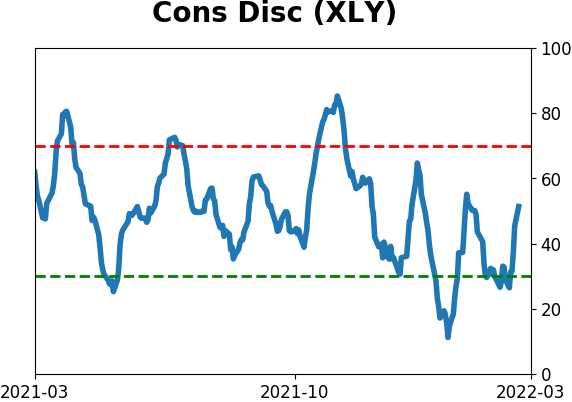
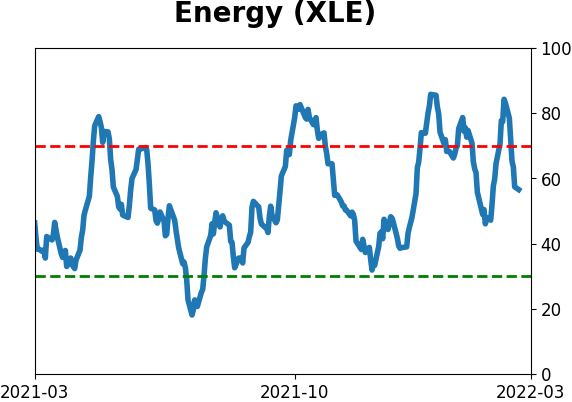
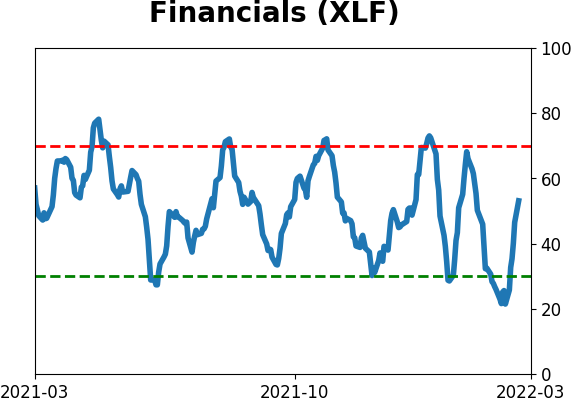
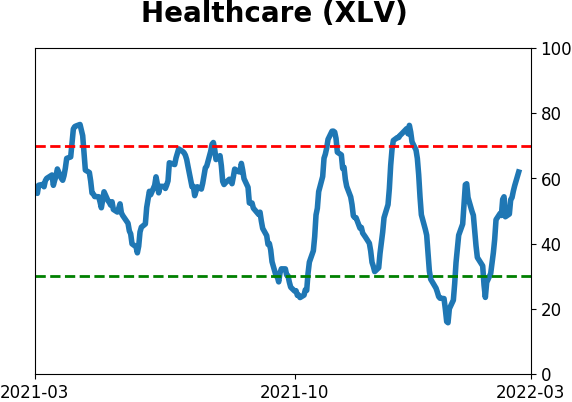
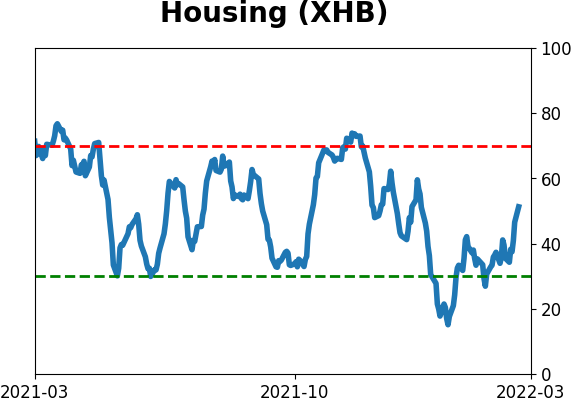
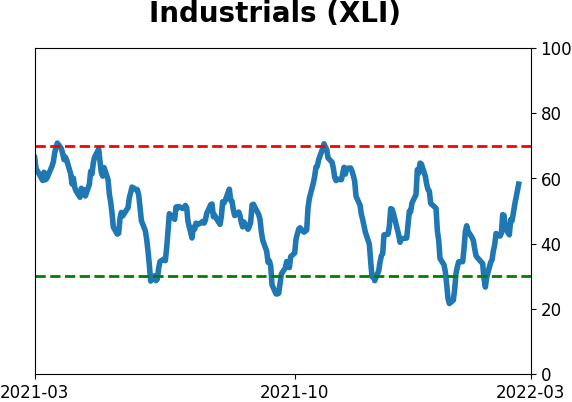
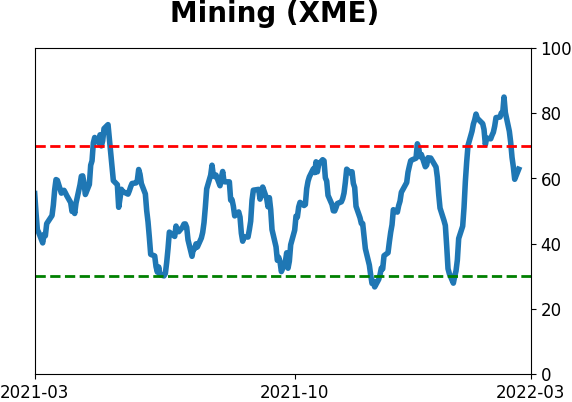
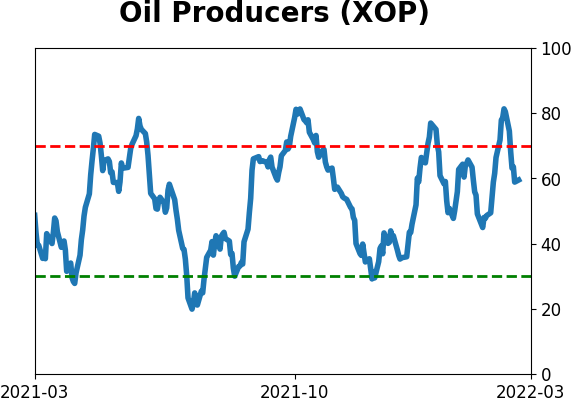
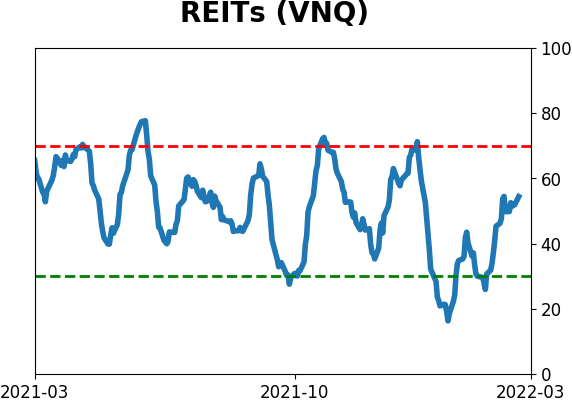
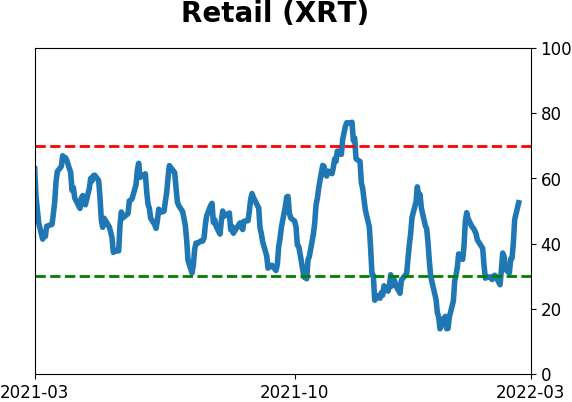
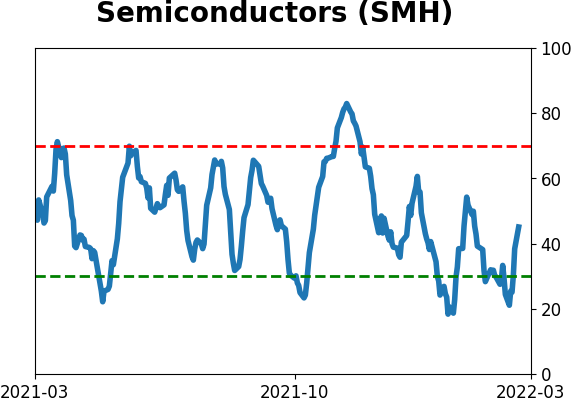
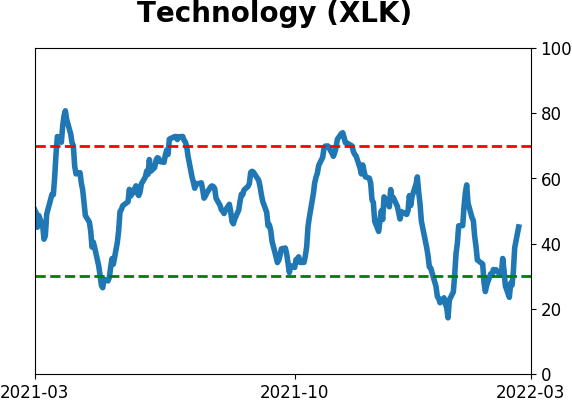
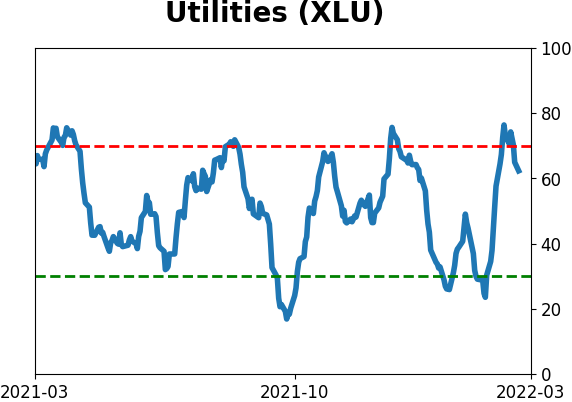
Sector ETF's - 10-Day Moving Average
|
|
|
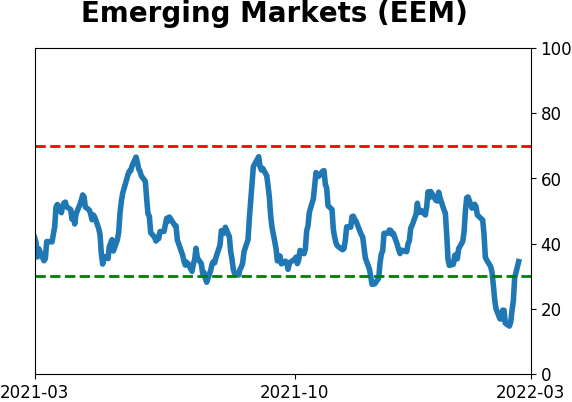
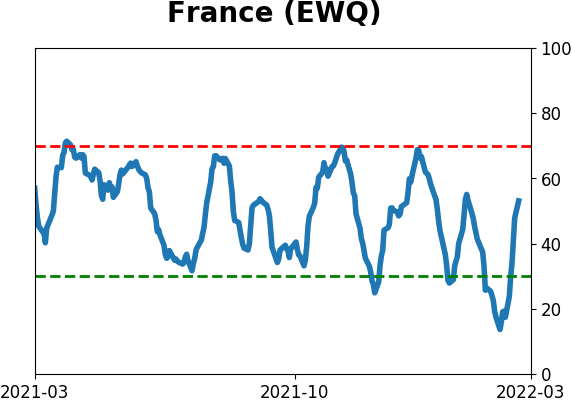
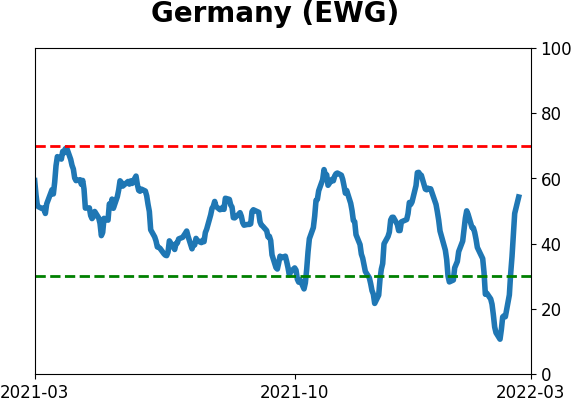
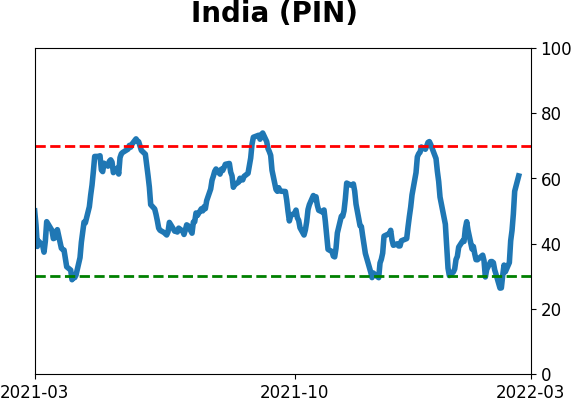
Country ETF's - 10-Day Moving Average
|
|
|
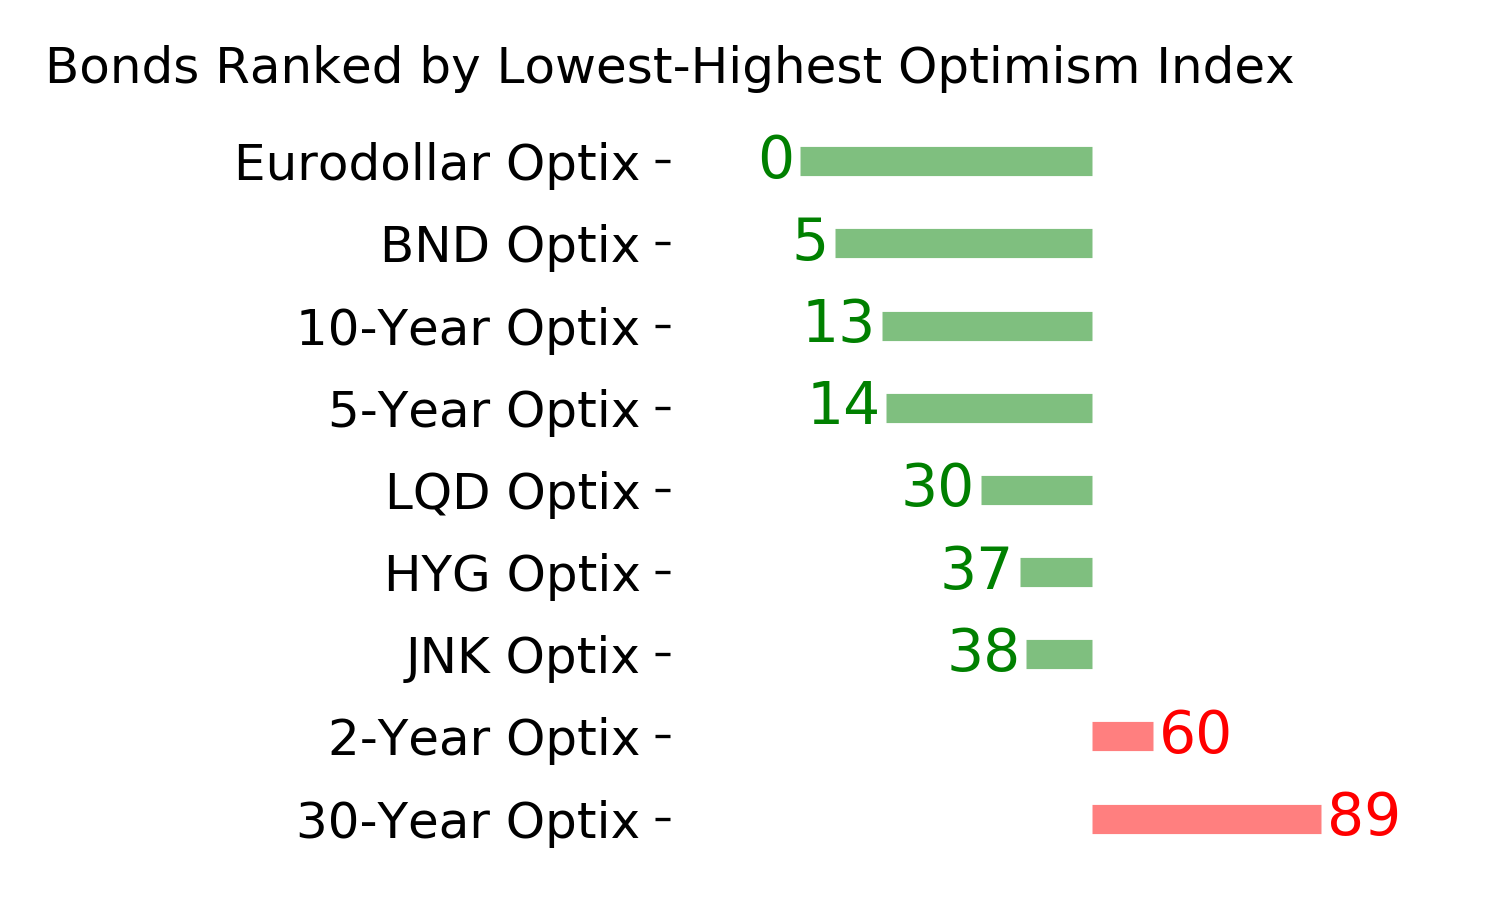
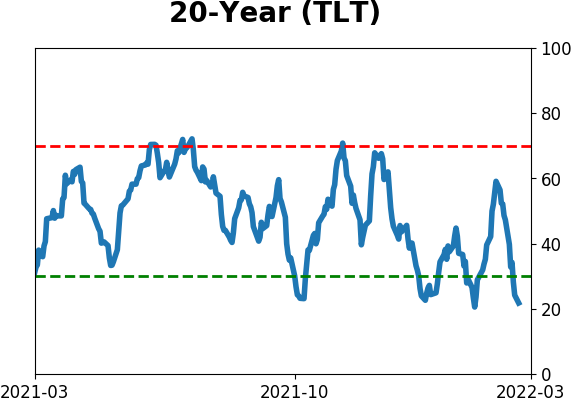
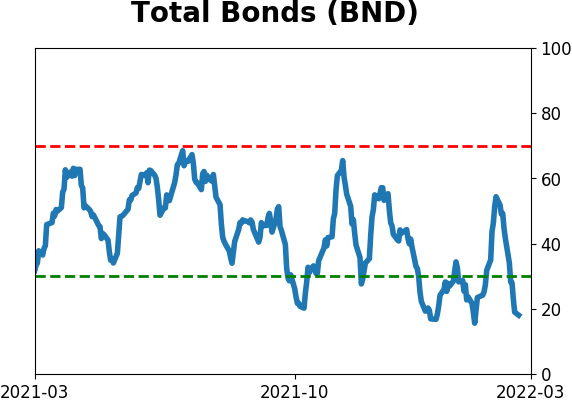
Bond ETF's - 10-Day Moving Average
|
|
|
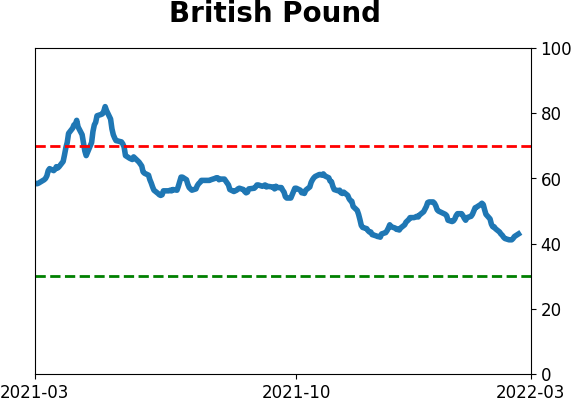
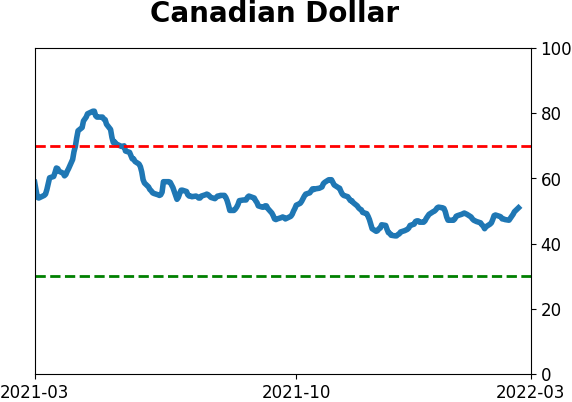
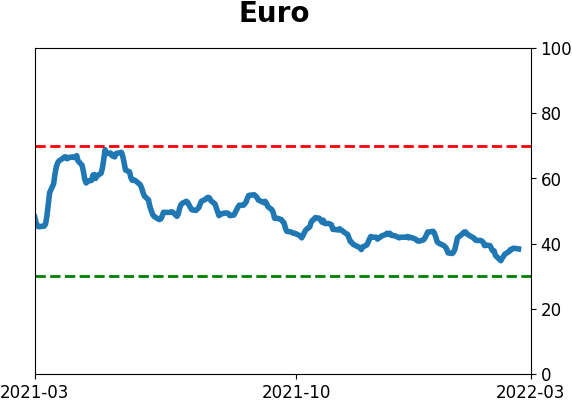
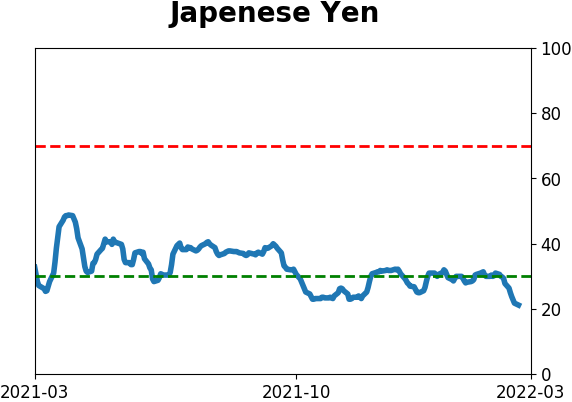
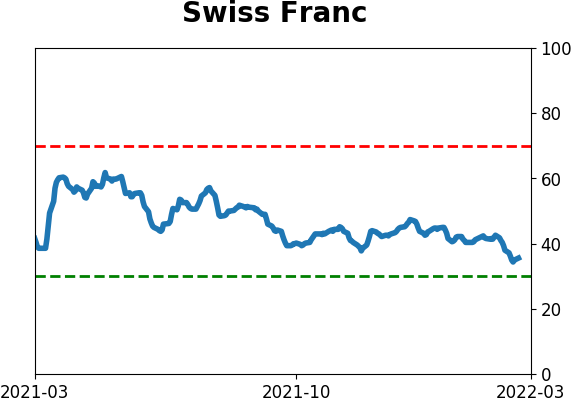
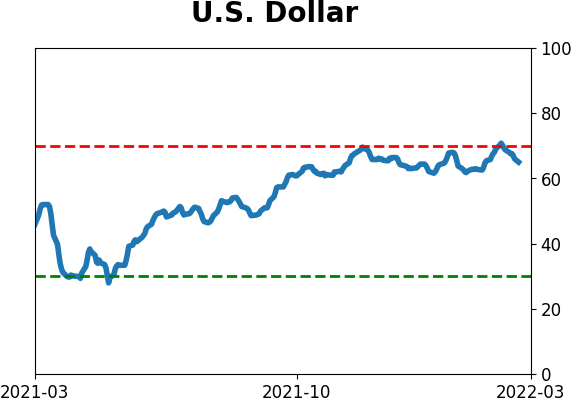
Currency ETF's - 5-Day Moving Average
|
|
|
Commodity ETF's - 5-Day Moving Average
|
|