Headlines
|
|
Traders are pricing in calm conditions across assets:
Options traders have been pricing in relatively small movements in the stock market over the next 30 days. They're doing the same in bonds, foreign exchange, oil, and gold. When cross-asset volatility has been this low, it's been a mostly good sign for stocks and other assets except for oil.
|
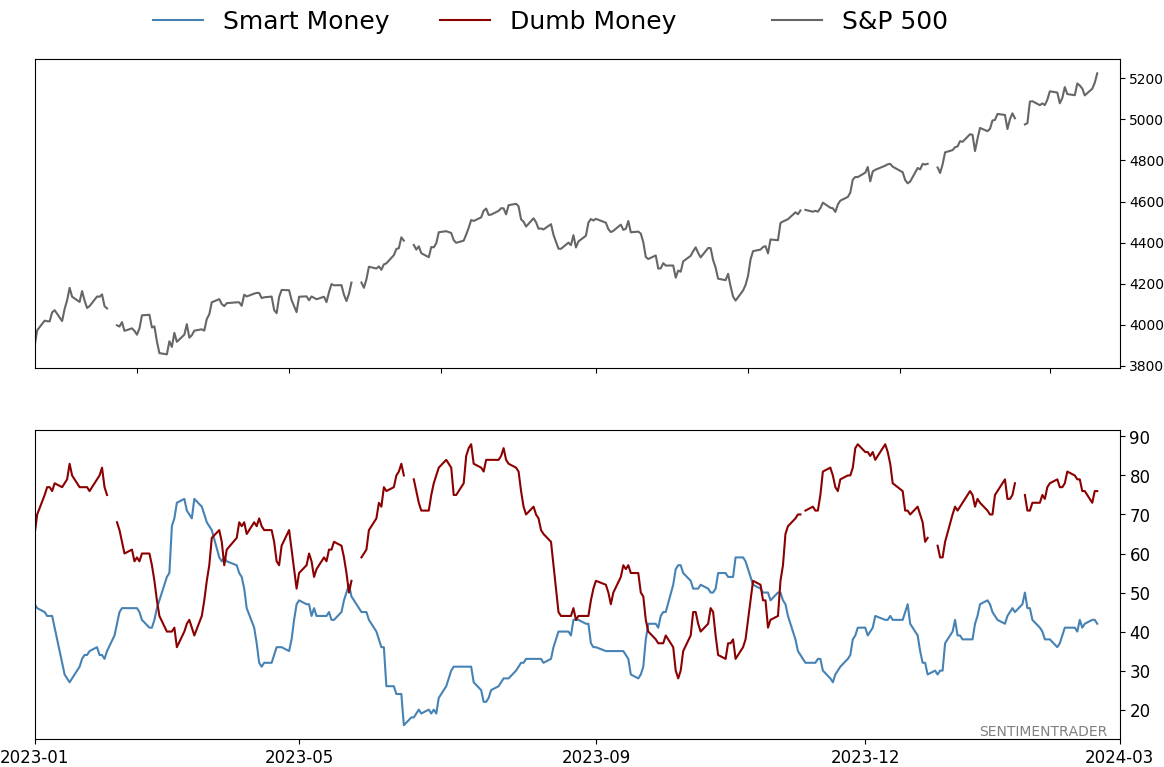
Smart / Dumb Money Confidence
|
Smart Money Confidence: 42%
Dumb Money Confidence: 76%
|
|
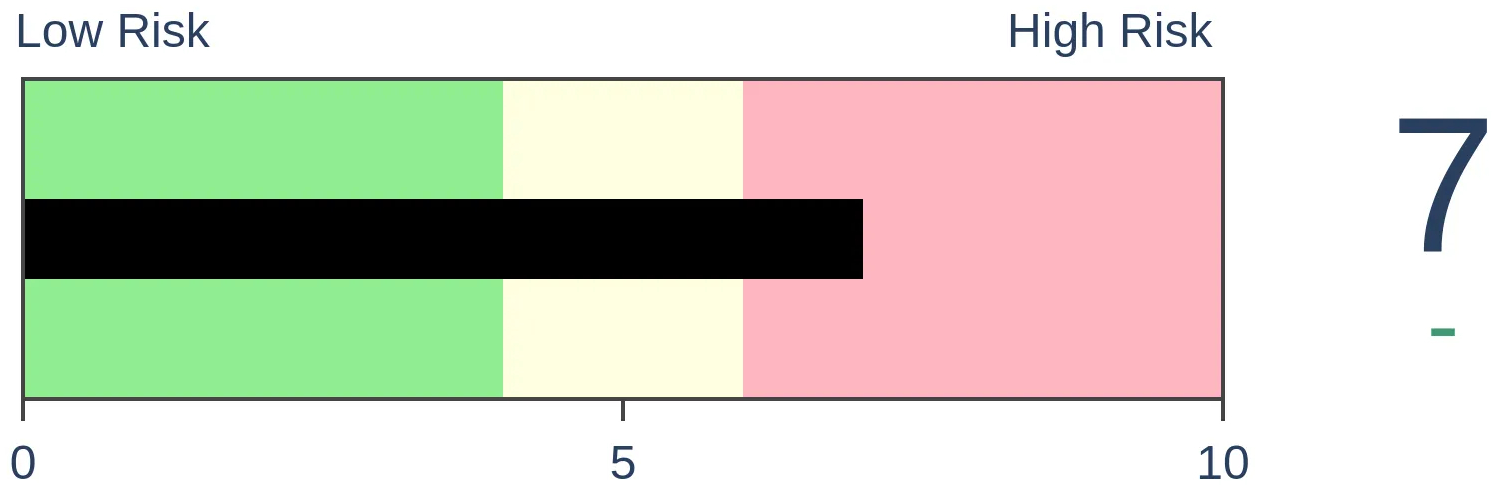
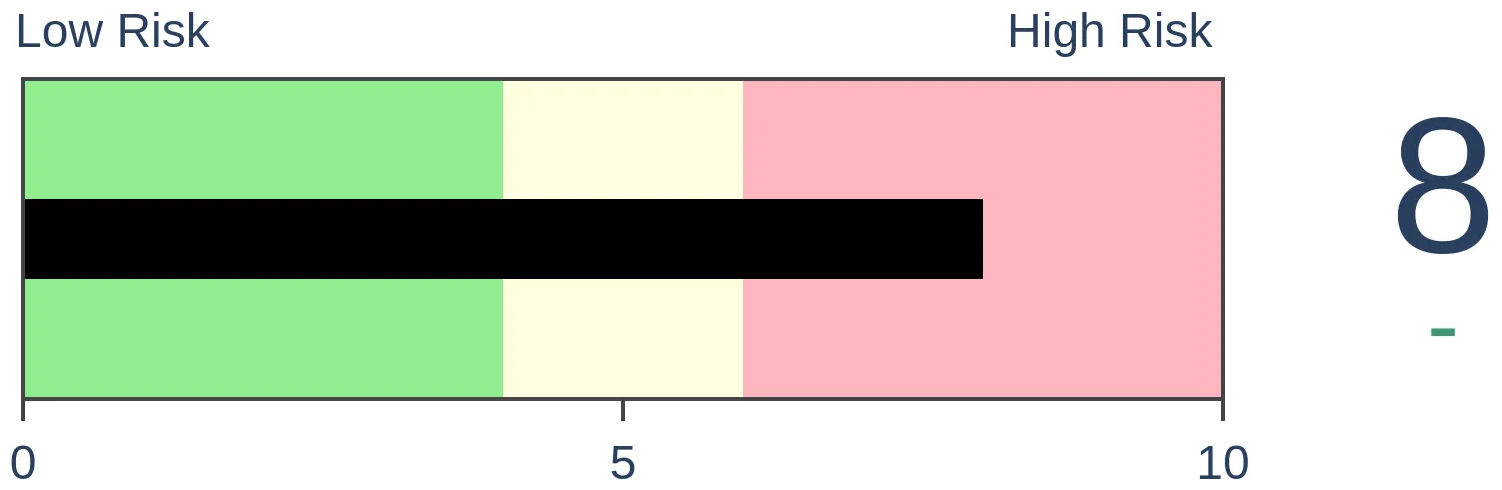
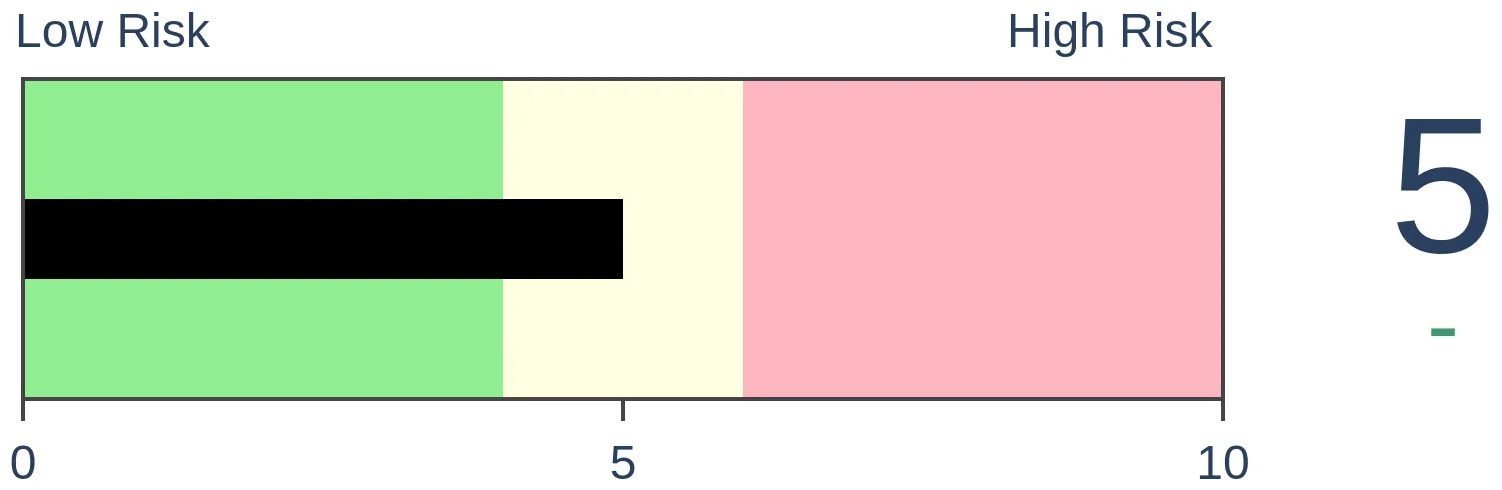
Risk Levels
Stocks Short-Term
|
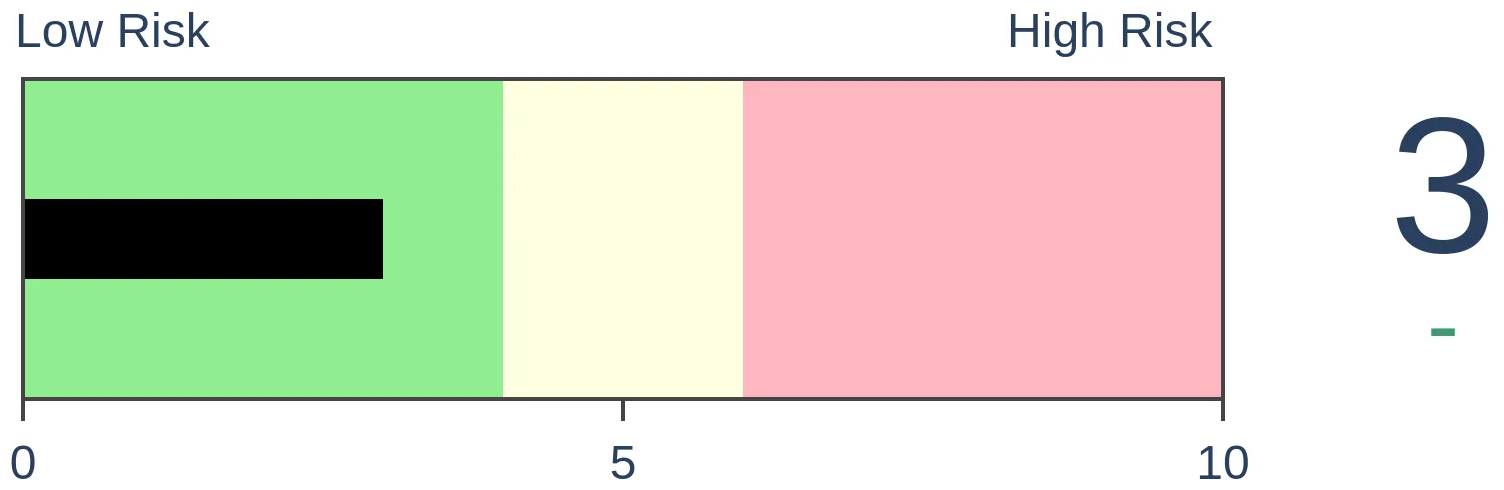
Stocks Medium-Term
|
|
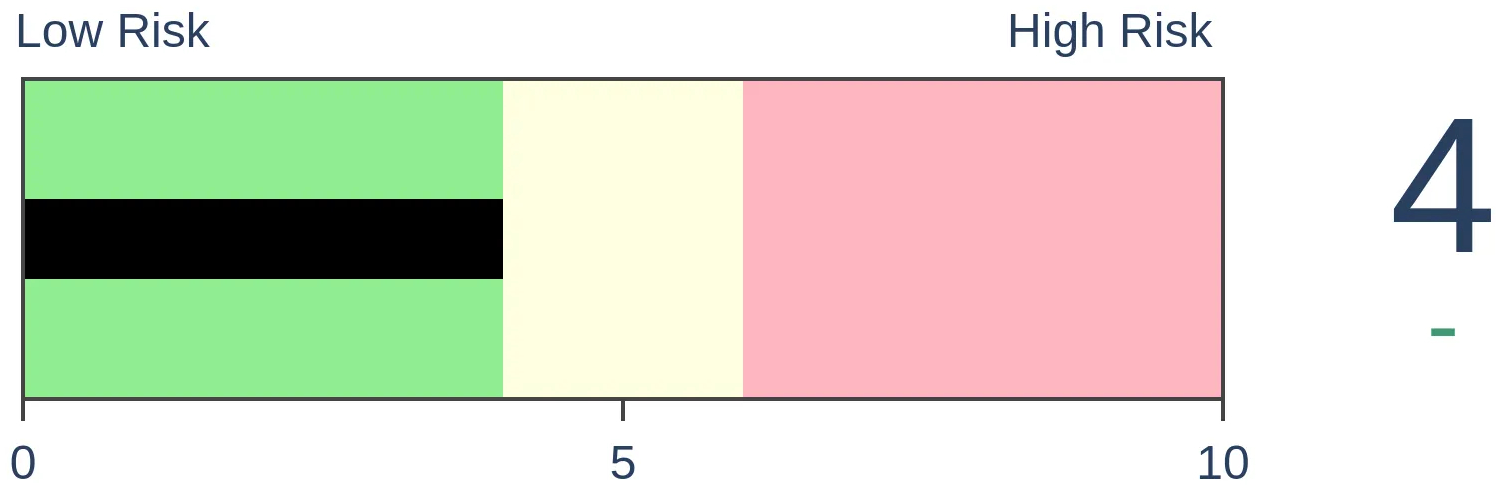
Bonds
|
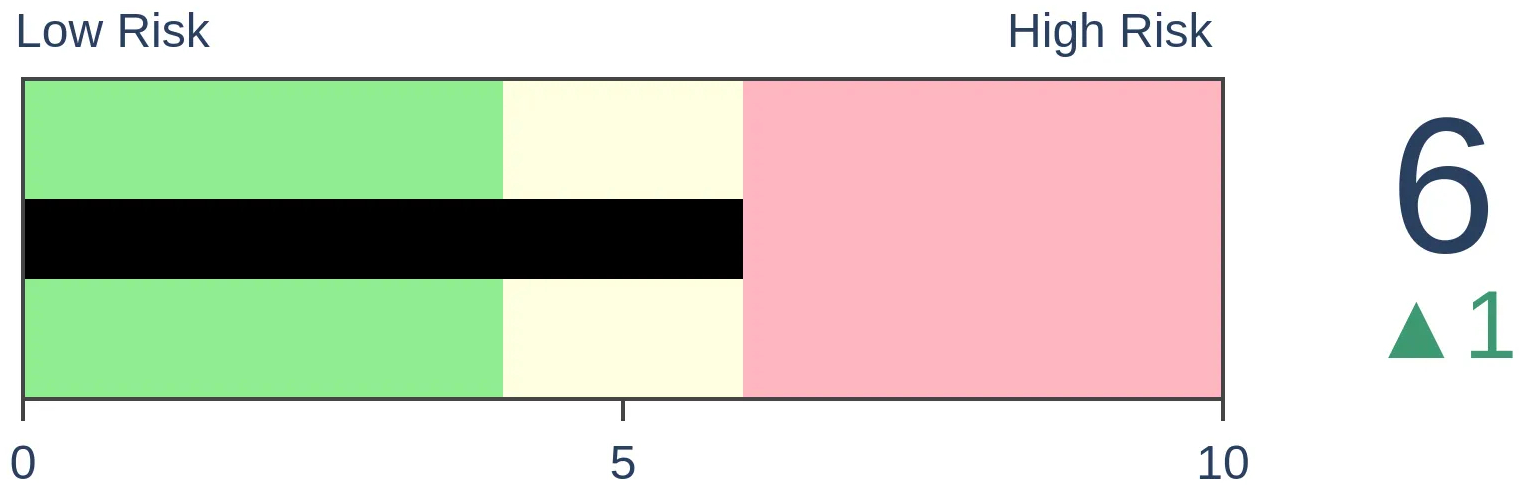
Crude Oil
|
|
Gold
|
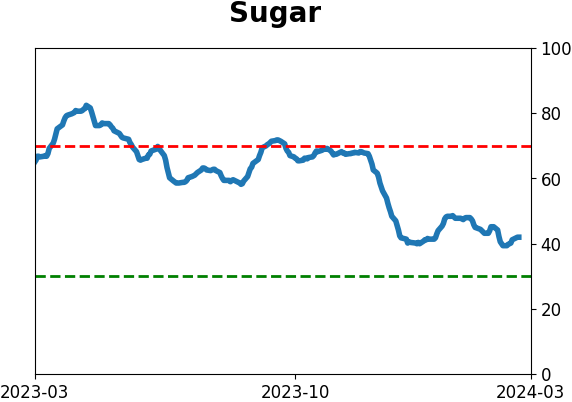
Agriculture
|
|
Research
By Jason Goepfert
BOTTOM LINE
Options traders have been pricing in relatively small movements in the stock market over the next 30 days. They're doing the same in bonds, foreign exchange, oil, and gold. When cross-asset volatility has been this low, it's been a mostly good sign for stocks and other assets except for oil.
FORECAST / TIMEFRAME
None
|
Key points:
- Implied volatility in stocks, bonds, foreign exchange, oil, and gold are all trending lower
- Over the past 50 days, median cross-asset volatility has dropped to one of the lowest levels in more than 20 years
- Similar environments were mostly good for stocks and bad for oil
Traders are pricing in smaller moves in stocks (and bonds, and gold, and...)
Stocks have been trending higher, and it's been a relatively quiet move. It's not just stocks.
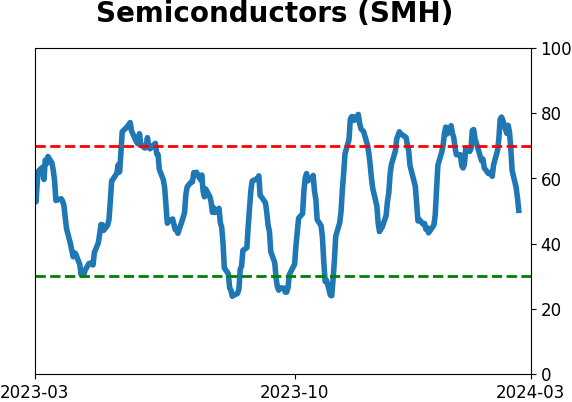
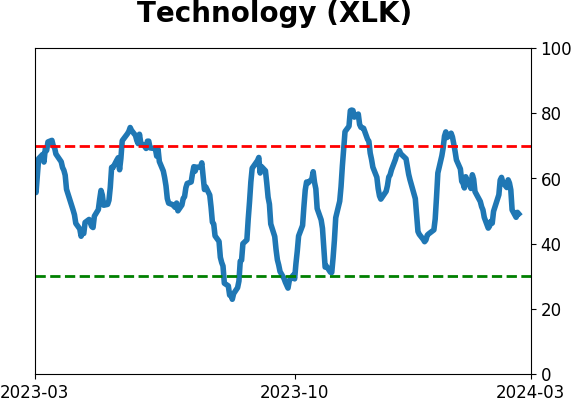
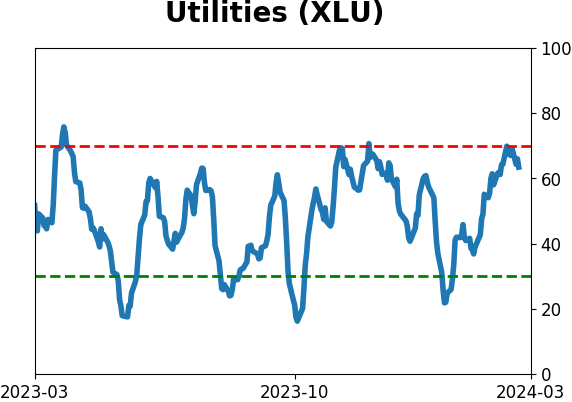
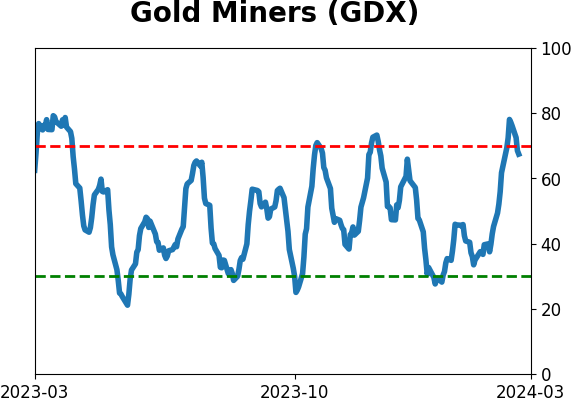
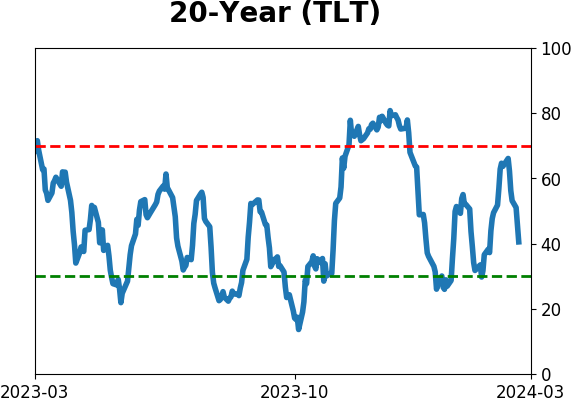
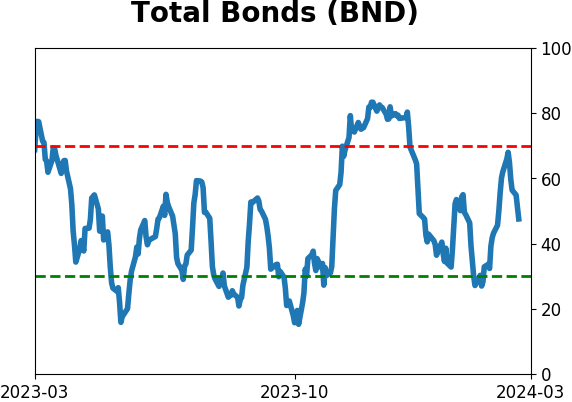
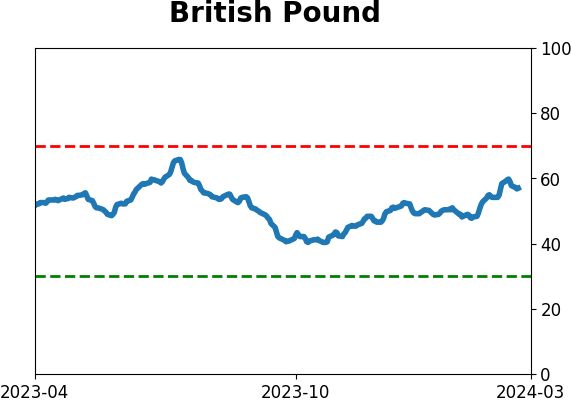
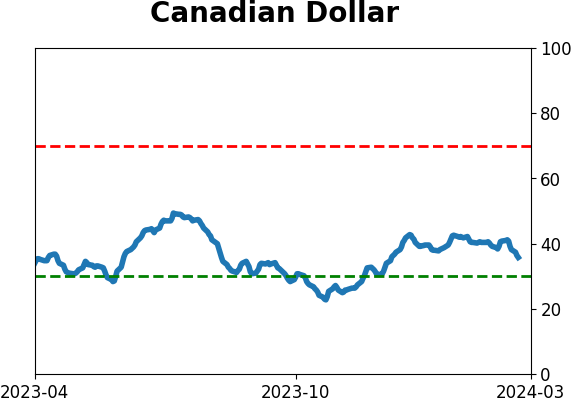
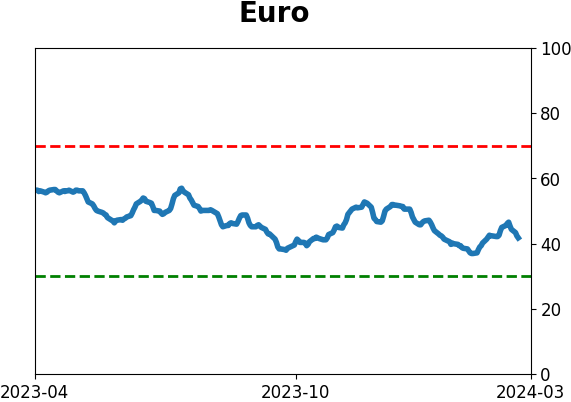
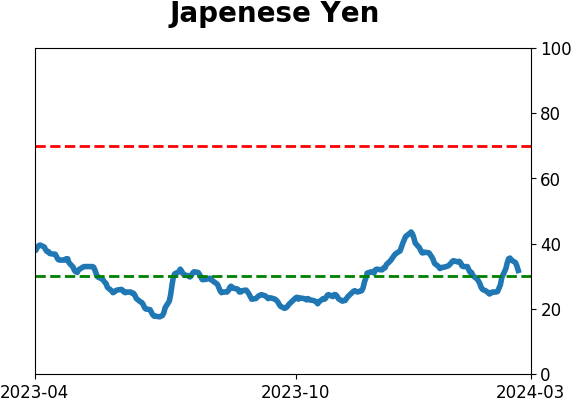
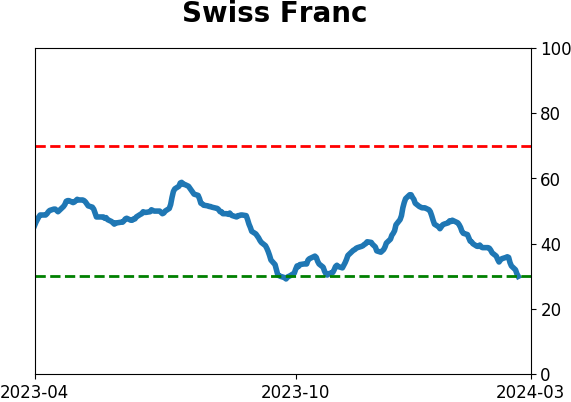
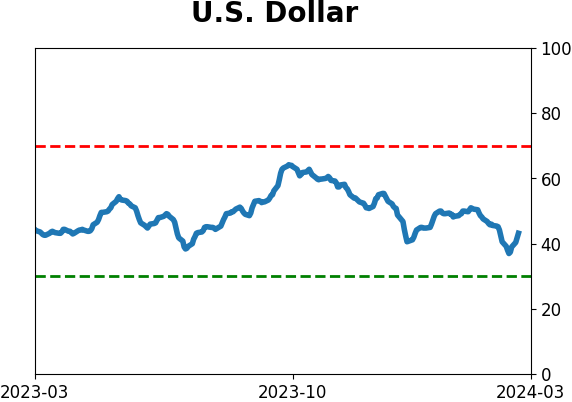
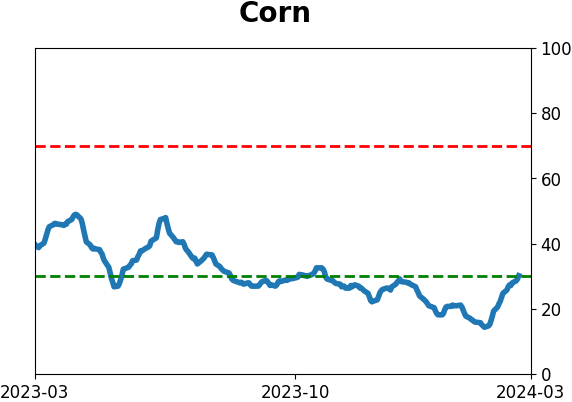
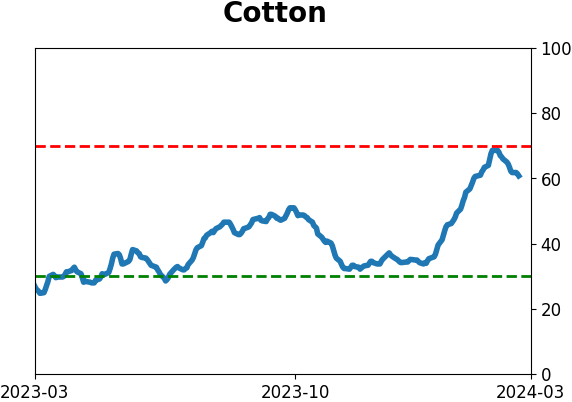
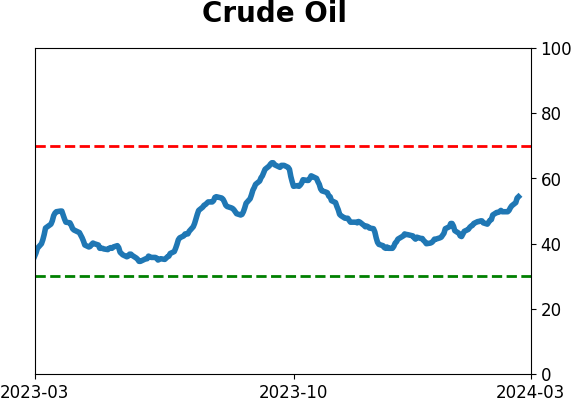
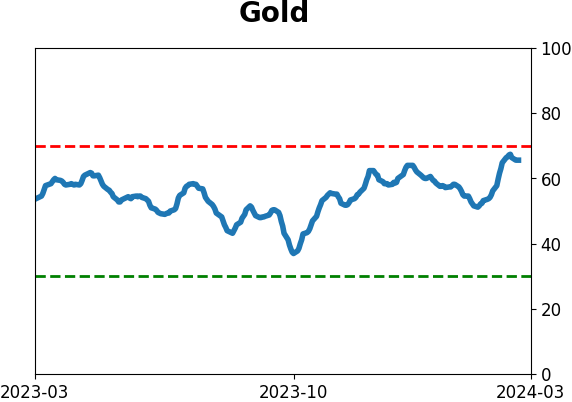
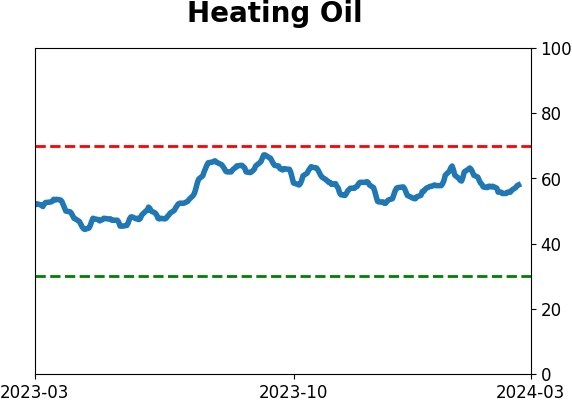
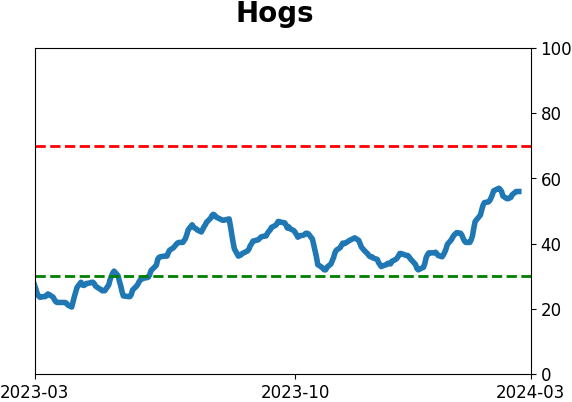
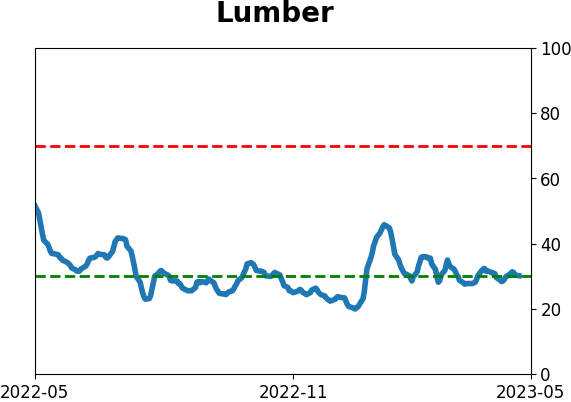
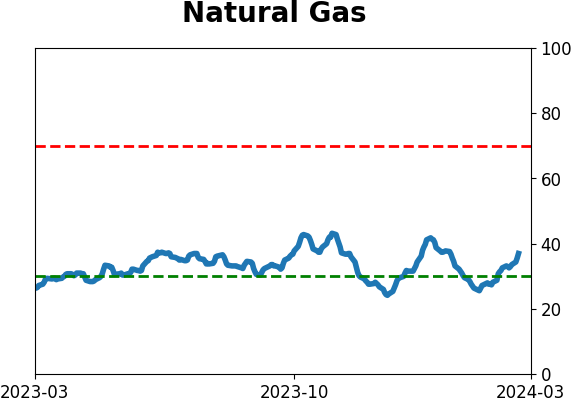
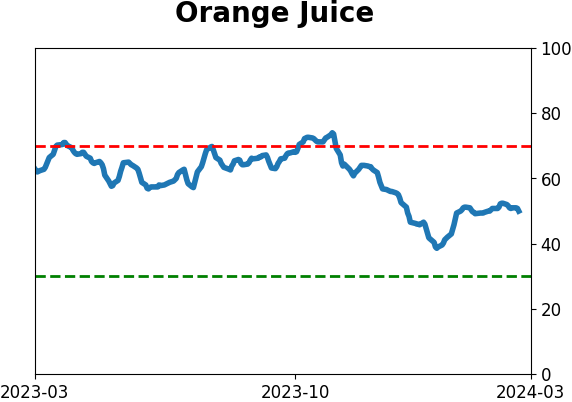
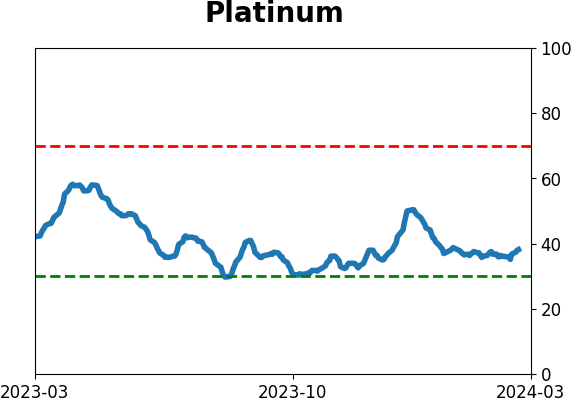
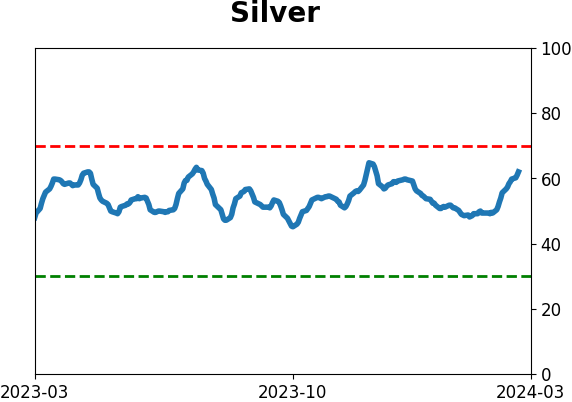
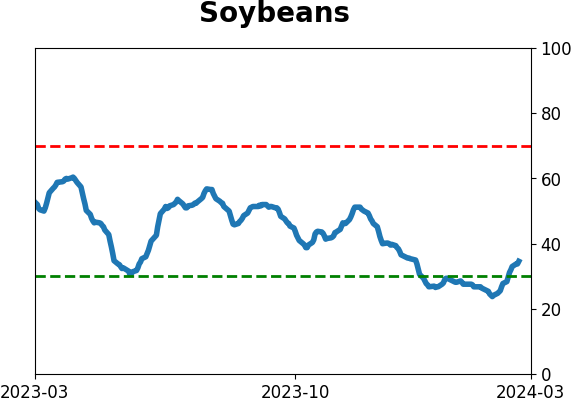
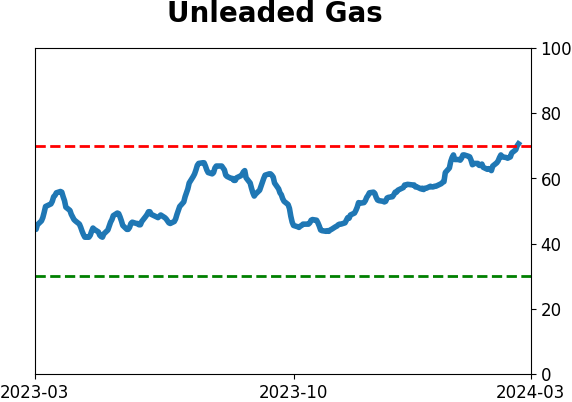
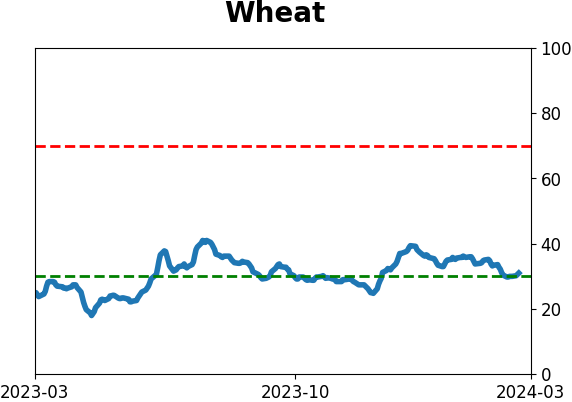
Even if other asset classes not rallying as much as equities (or rallying at all), traders are betting that those other assets will remain relatively calm. Across five different assets, implied volatility has dropped precipitously from levels a year ago. Four of them are shown below.
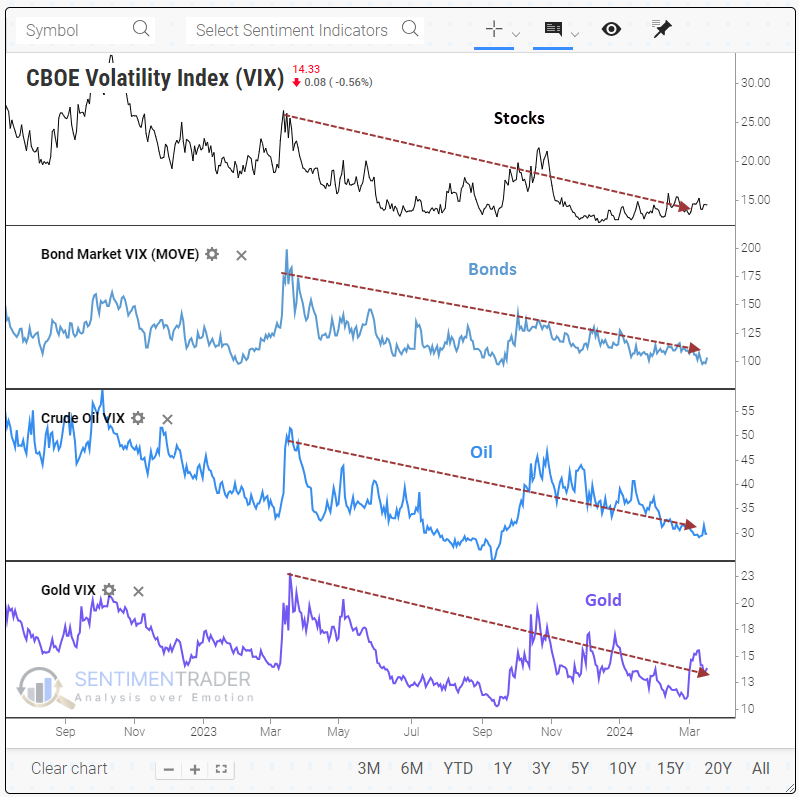
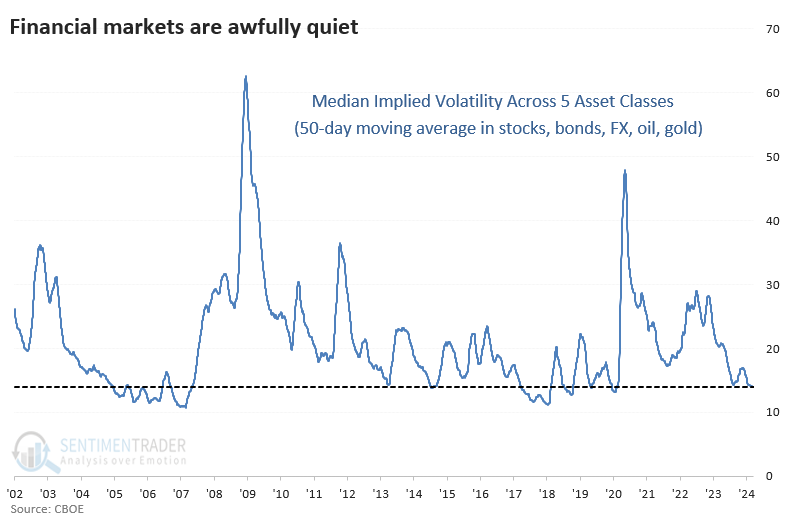
The median implied volatility across stocks, bonds, foreign exchange, crude oil, and gold has averaged less than 14% over the past 50 days. That's the lowest since early 2020 and one of the lowest levels in over two decades.
Low cross-asset volatility has been mostly good for stocks and bad for oil
Contrarians like to automatically assume that low volatility is a sign of complacency and negative forward returns, but that's usually not the case.
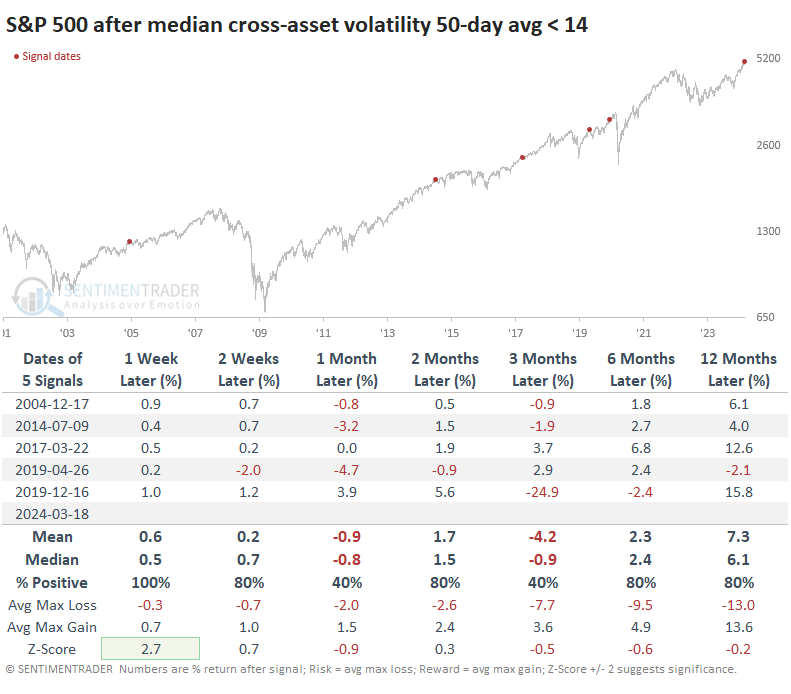
The table below shows returns in the S&P 500 when the median cross-asset volatility 50-day average crosses below 14. While its returns were mixed over the medium term, there were few significant losses. Once again, the pandemic was a notable interruption, but it's also a valid exception unless one believes we're likely to see another global shutdown.
Even though the only significant decline occurred during the pandemic, there also weren't many large gains up to six months later. This is consistent with low-volatility environments.
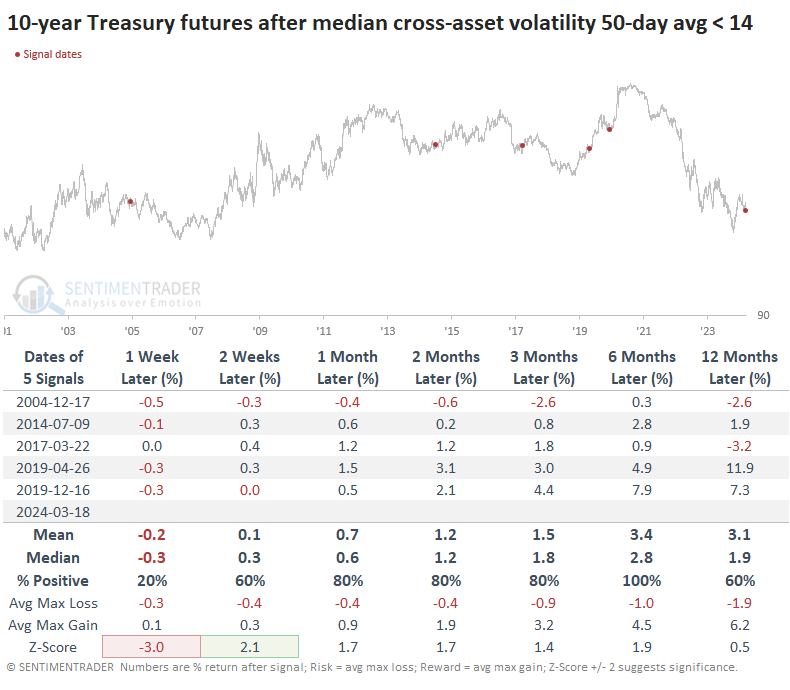
In fixed income, 10-year Treasury futures whipped around over the next couple of weeks but generally rallied afterward. Over the next six months, the futures showed a gain every time, with an impressively skewed ratio of reward to risk.
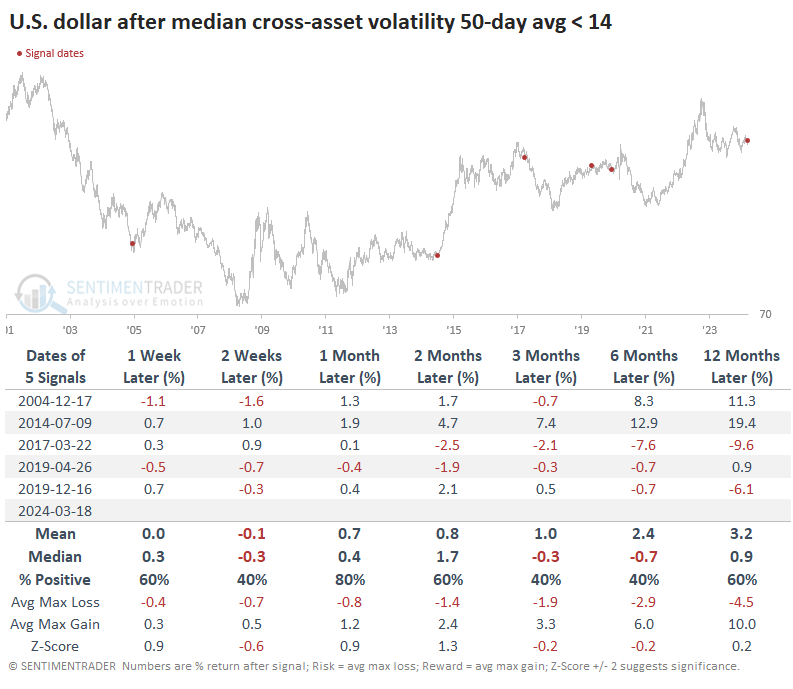
The U.S. dollar didn't respond all that well after these signals. It triggered close to major bottoms in 2004 and 2014, but all but one of the signals saw the dollar decline either three or six months later.
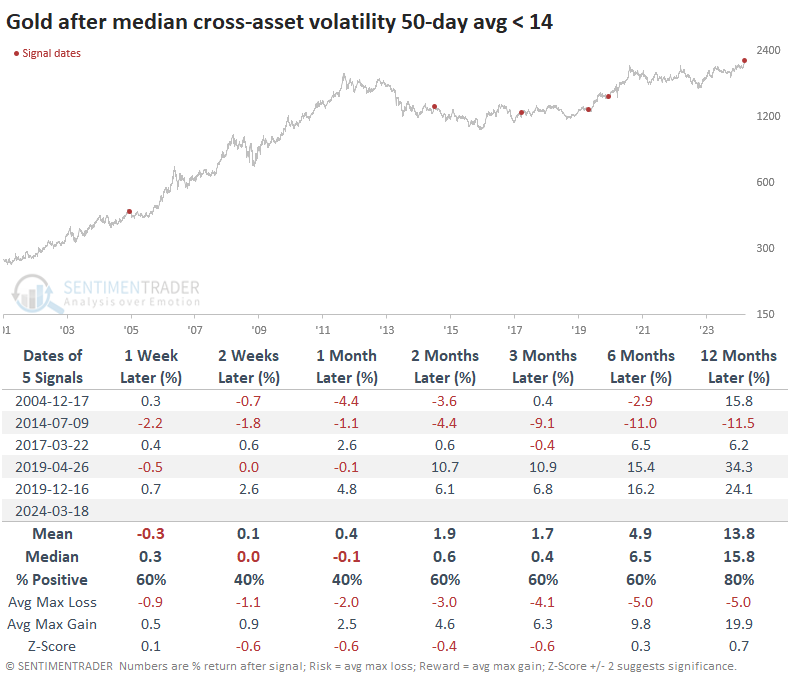
Gold mostly rallied after these signals, with four out of five signals showing a positive one-year return. It was also a generally good environment for gold during the study period, so that's a helpful tailwind. The only one that triggered when gold was at a high was in 2004, which preceded a multi-month trading range before the next run to new highs.
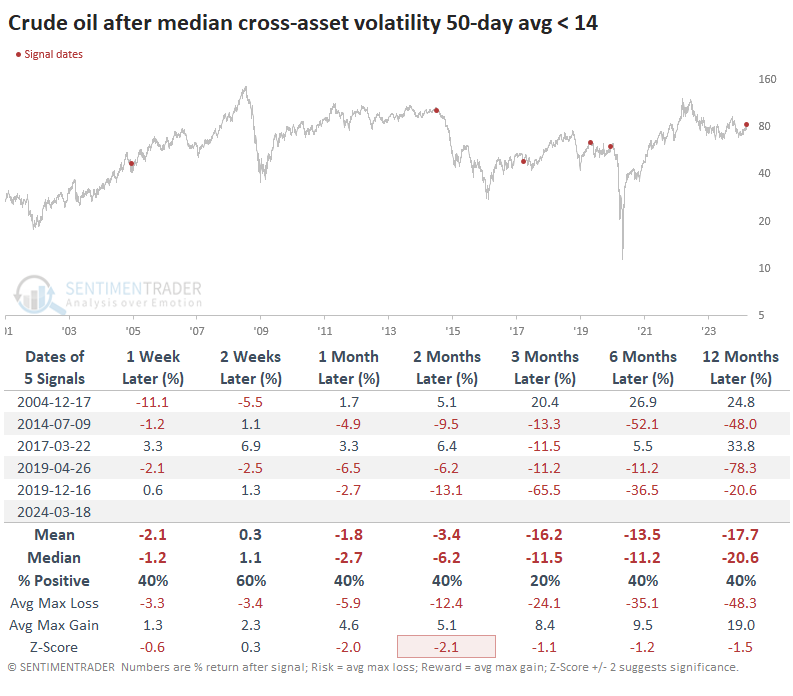
Out of all the markets, crude oil responded the worst. Only one of the signals, in 2004, led to a multi-month gain (but not without a double-digit correction in the interim). Oil suffered a double-digit decline over the next three months after four of the five signals.
What the research tells us...
Contrarians tend to dislike "creeper" uptrends. Our current situation has some hallmarks of that exact type of environment, not unlike 2013 and 2017, when buying interest overwhelms any potential negative, and stocks manage small but consistent gains.
It's not just stocks that are in a relatively calm environment. Traders are pricing in similar environments across asset classes. That has tended to be a decent sign for stocks and most others (except oil).
Indicators at Extremes
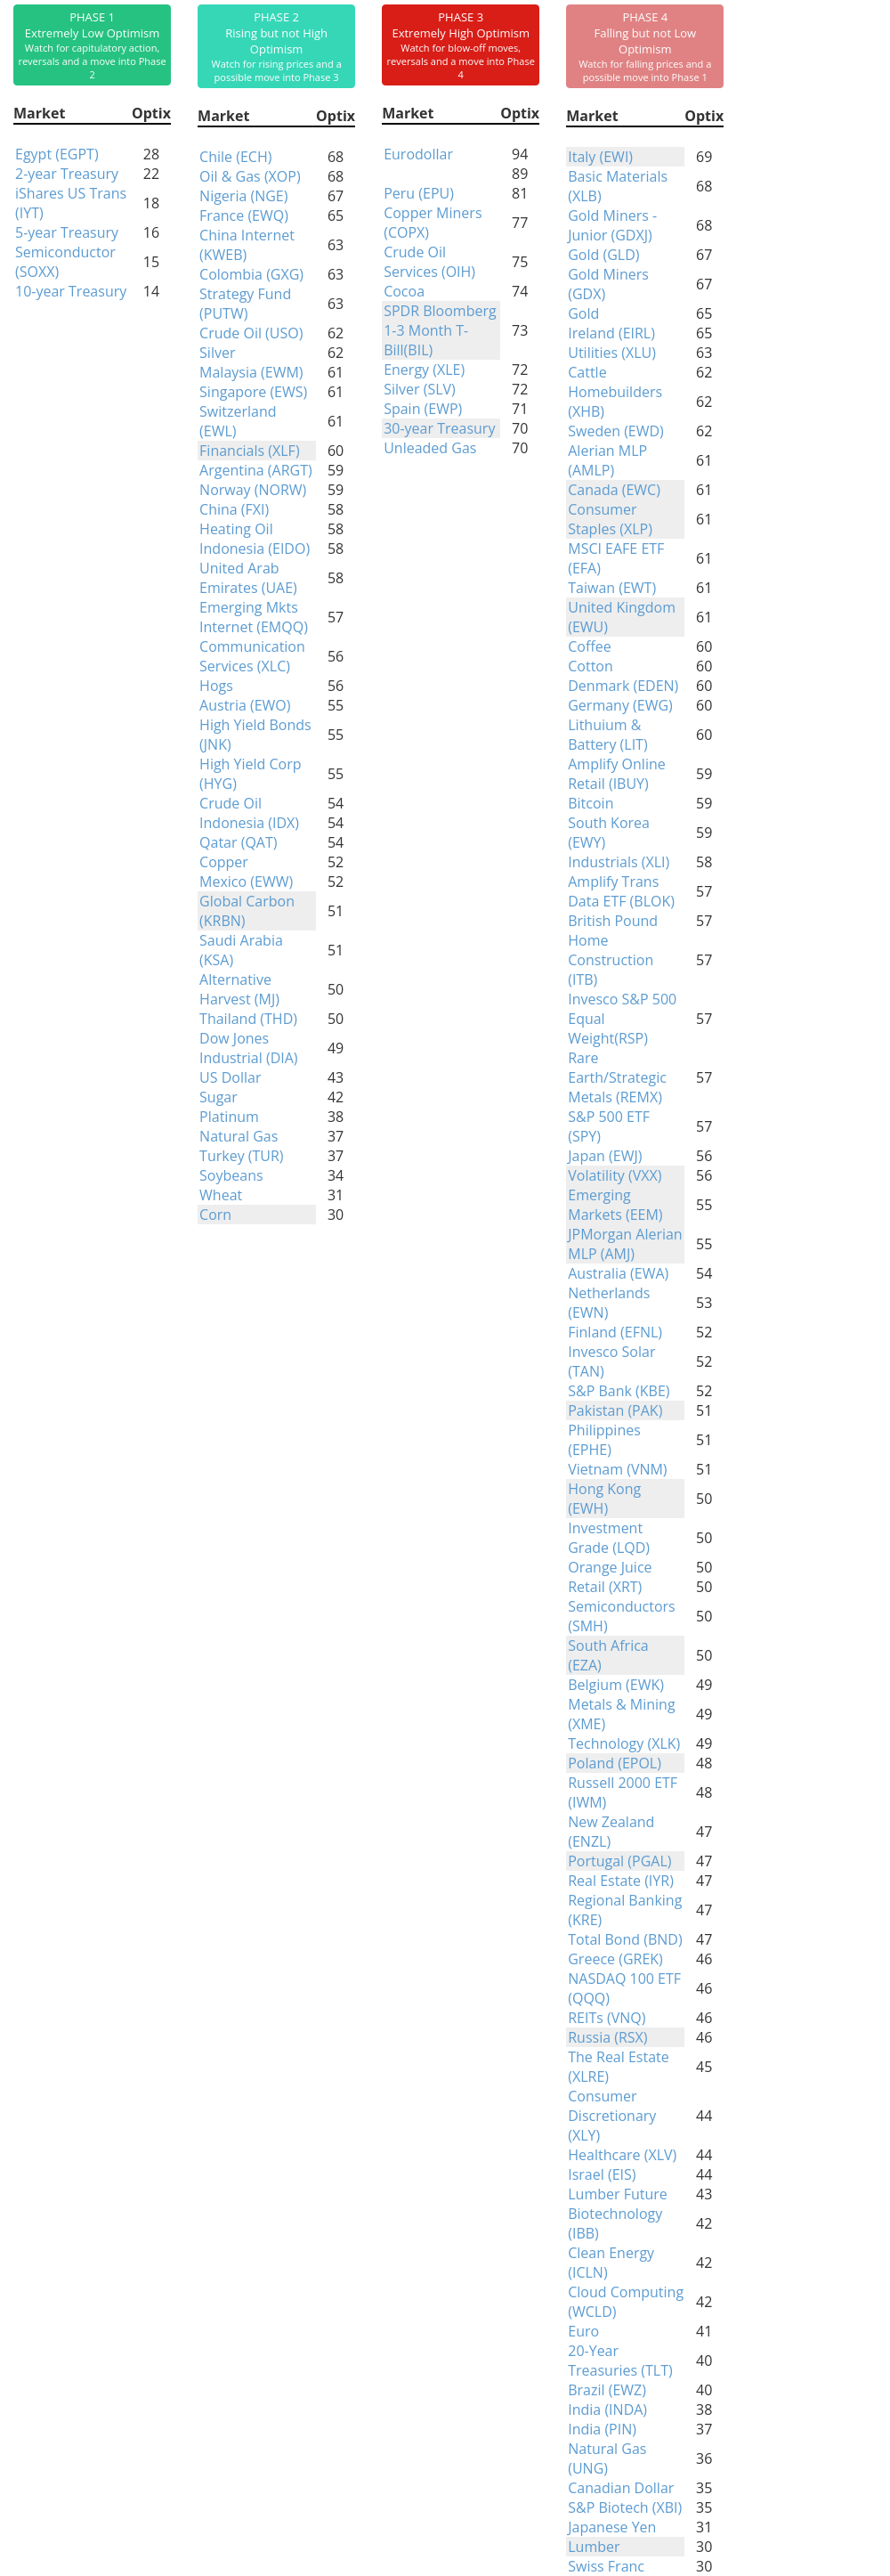
Phase Table
Ranks
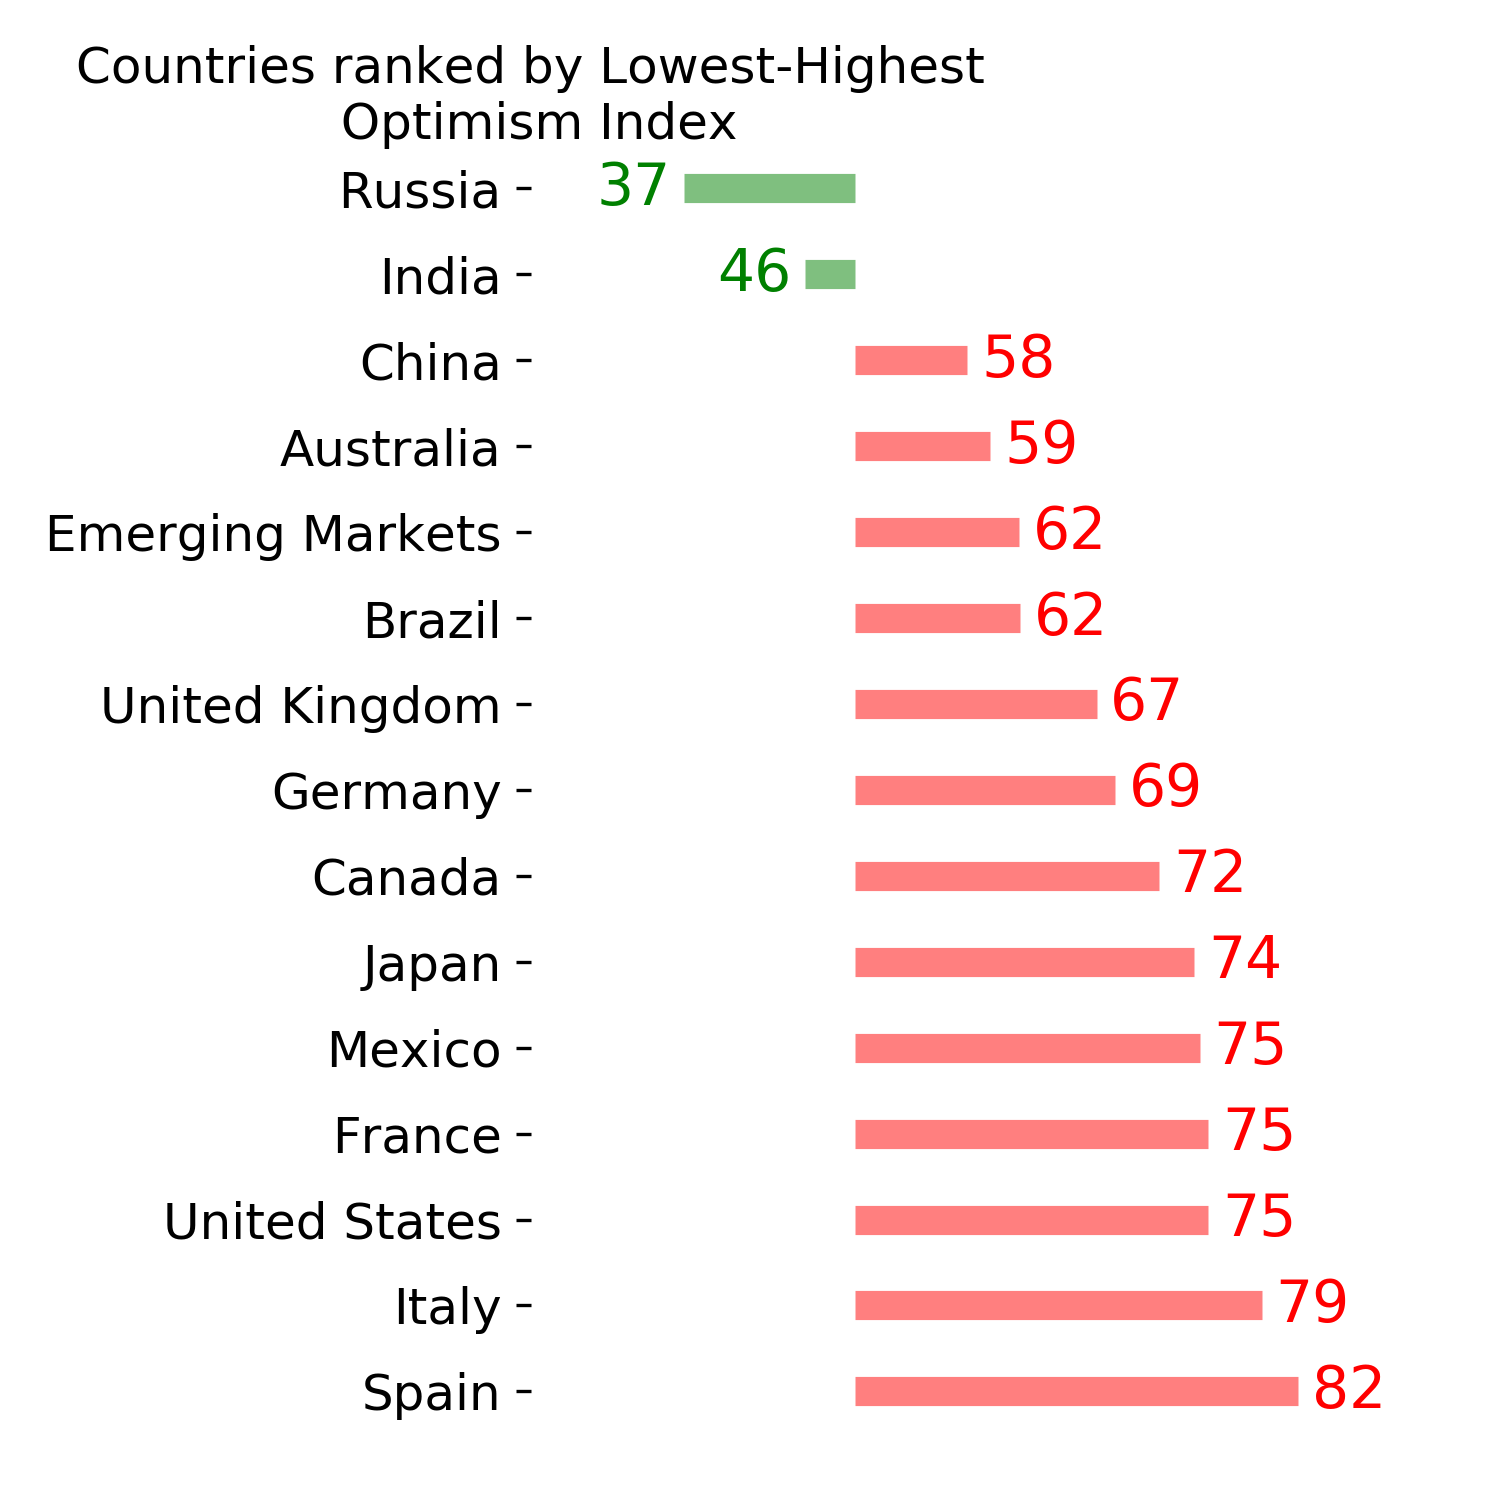
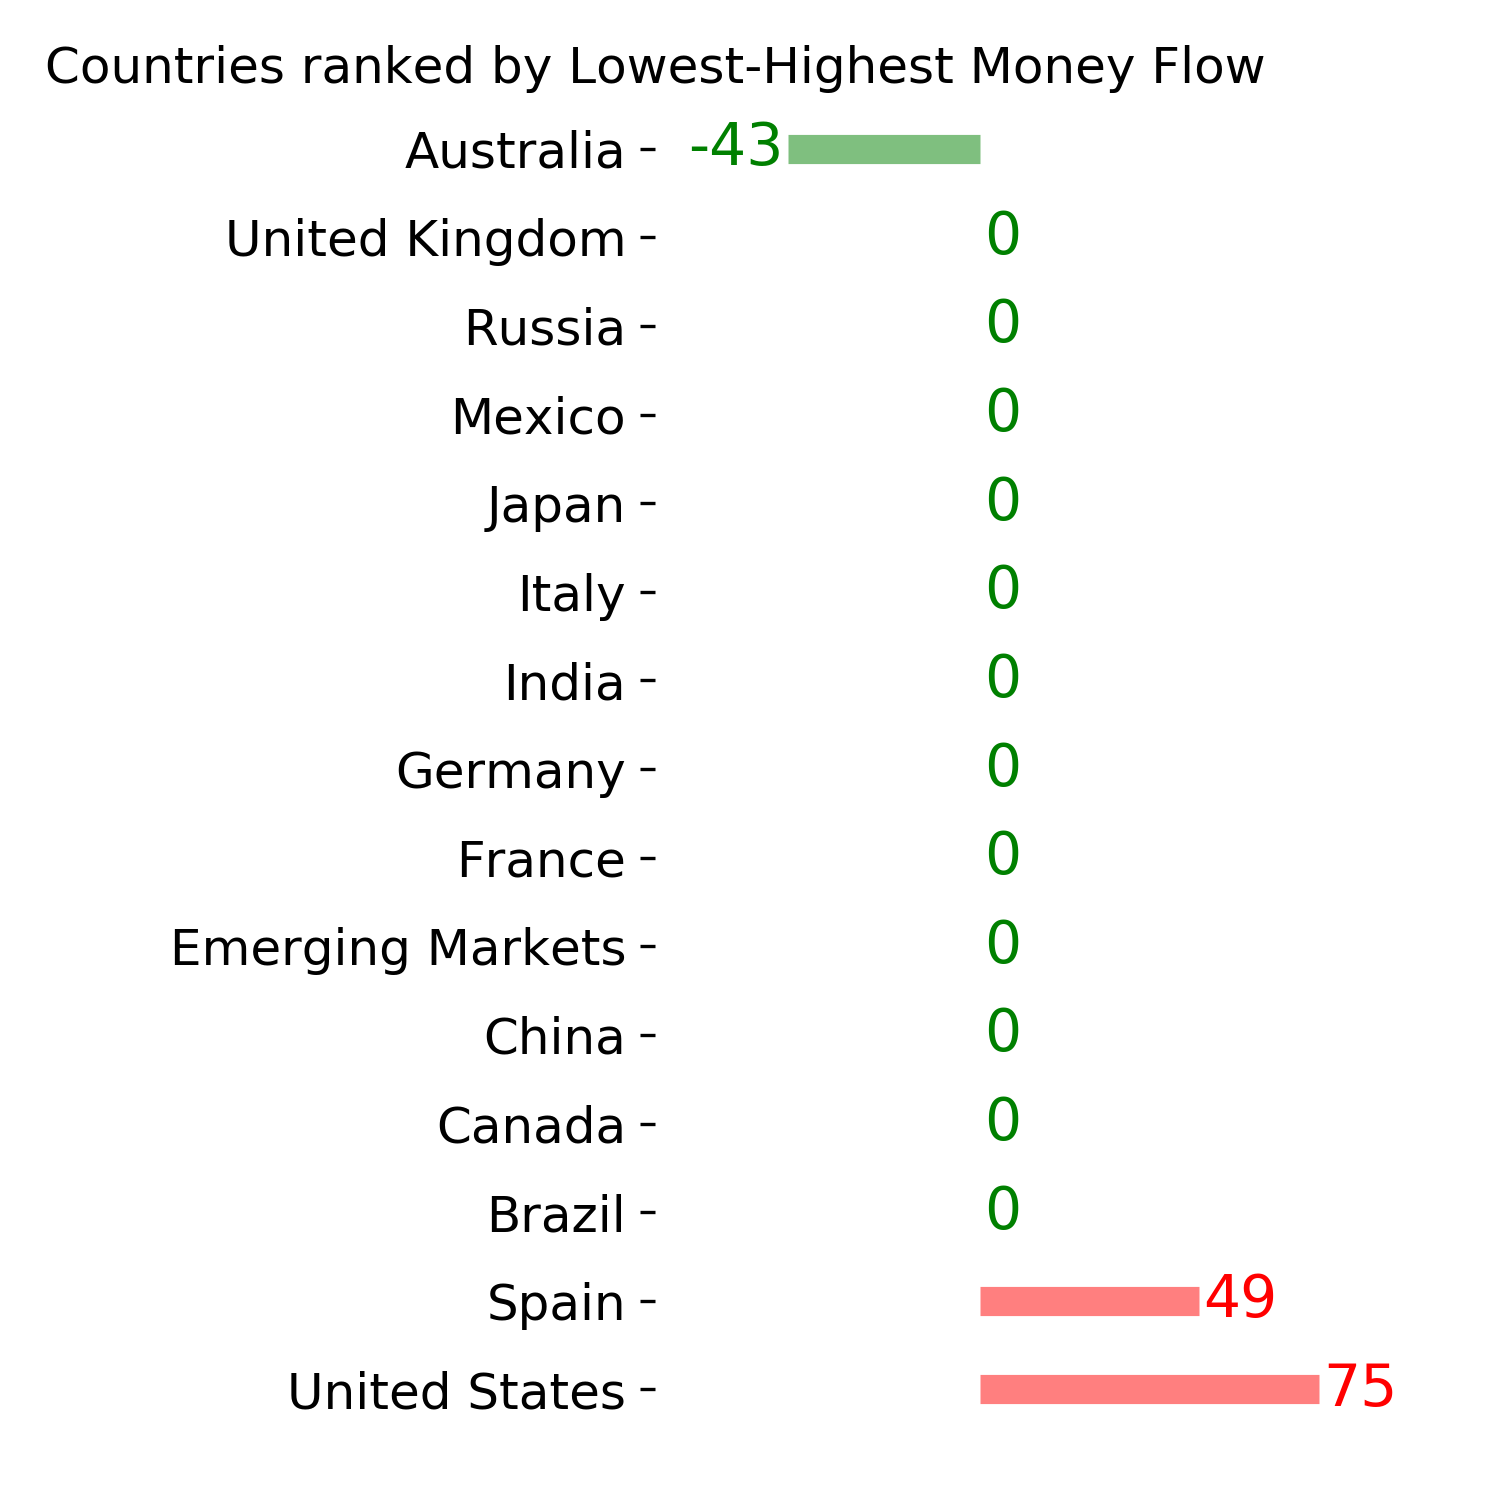
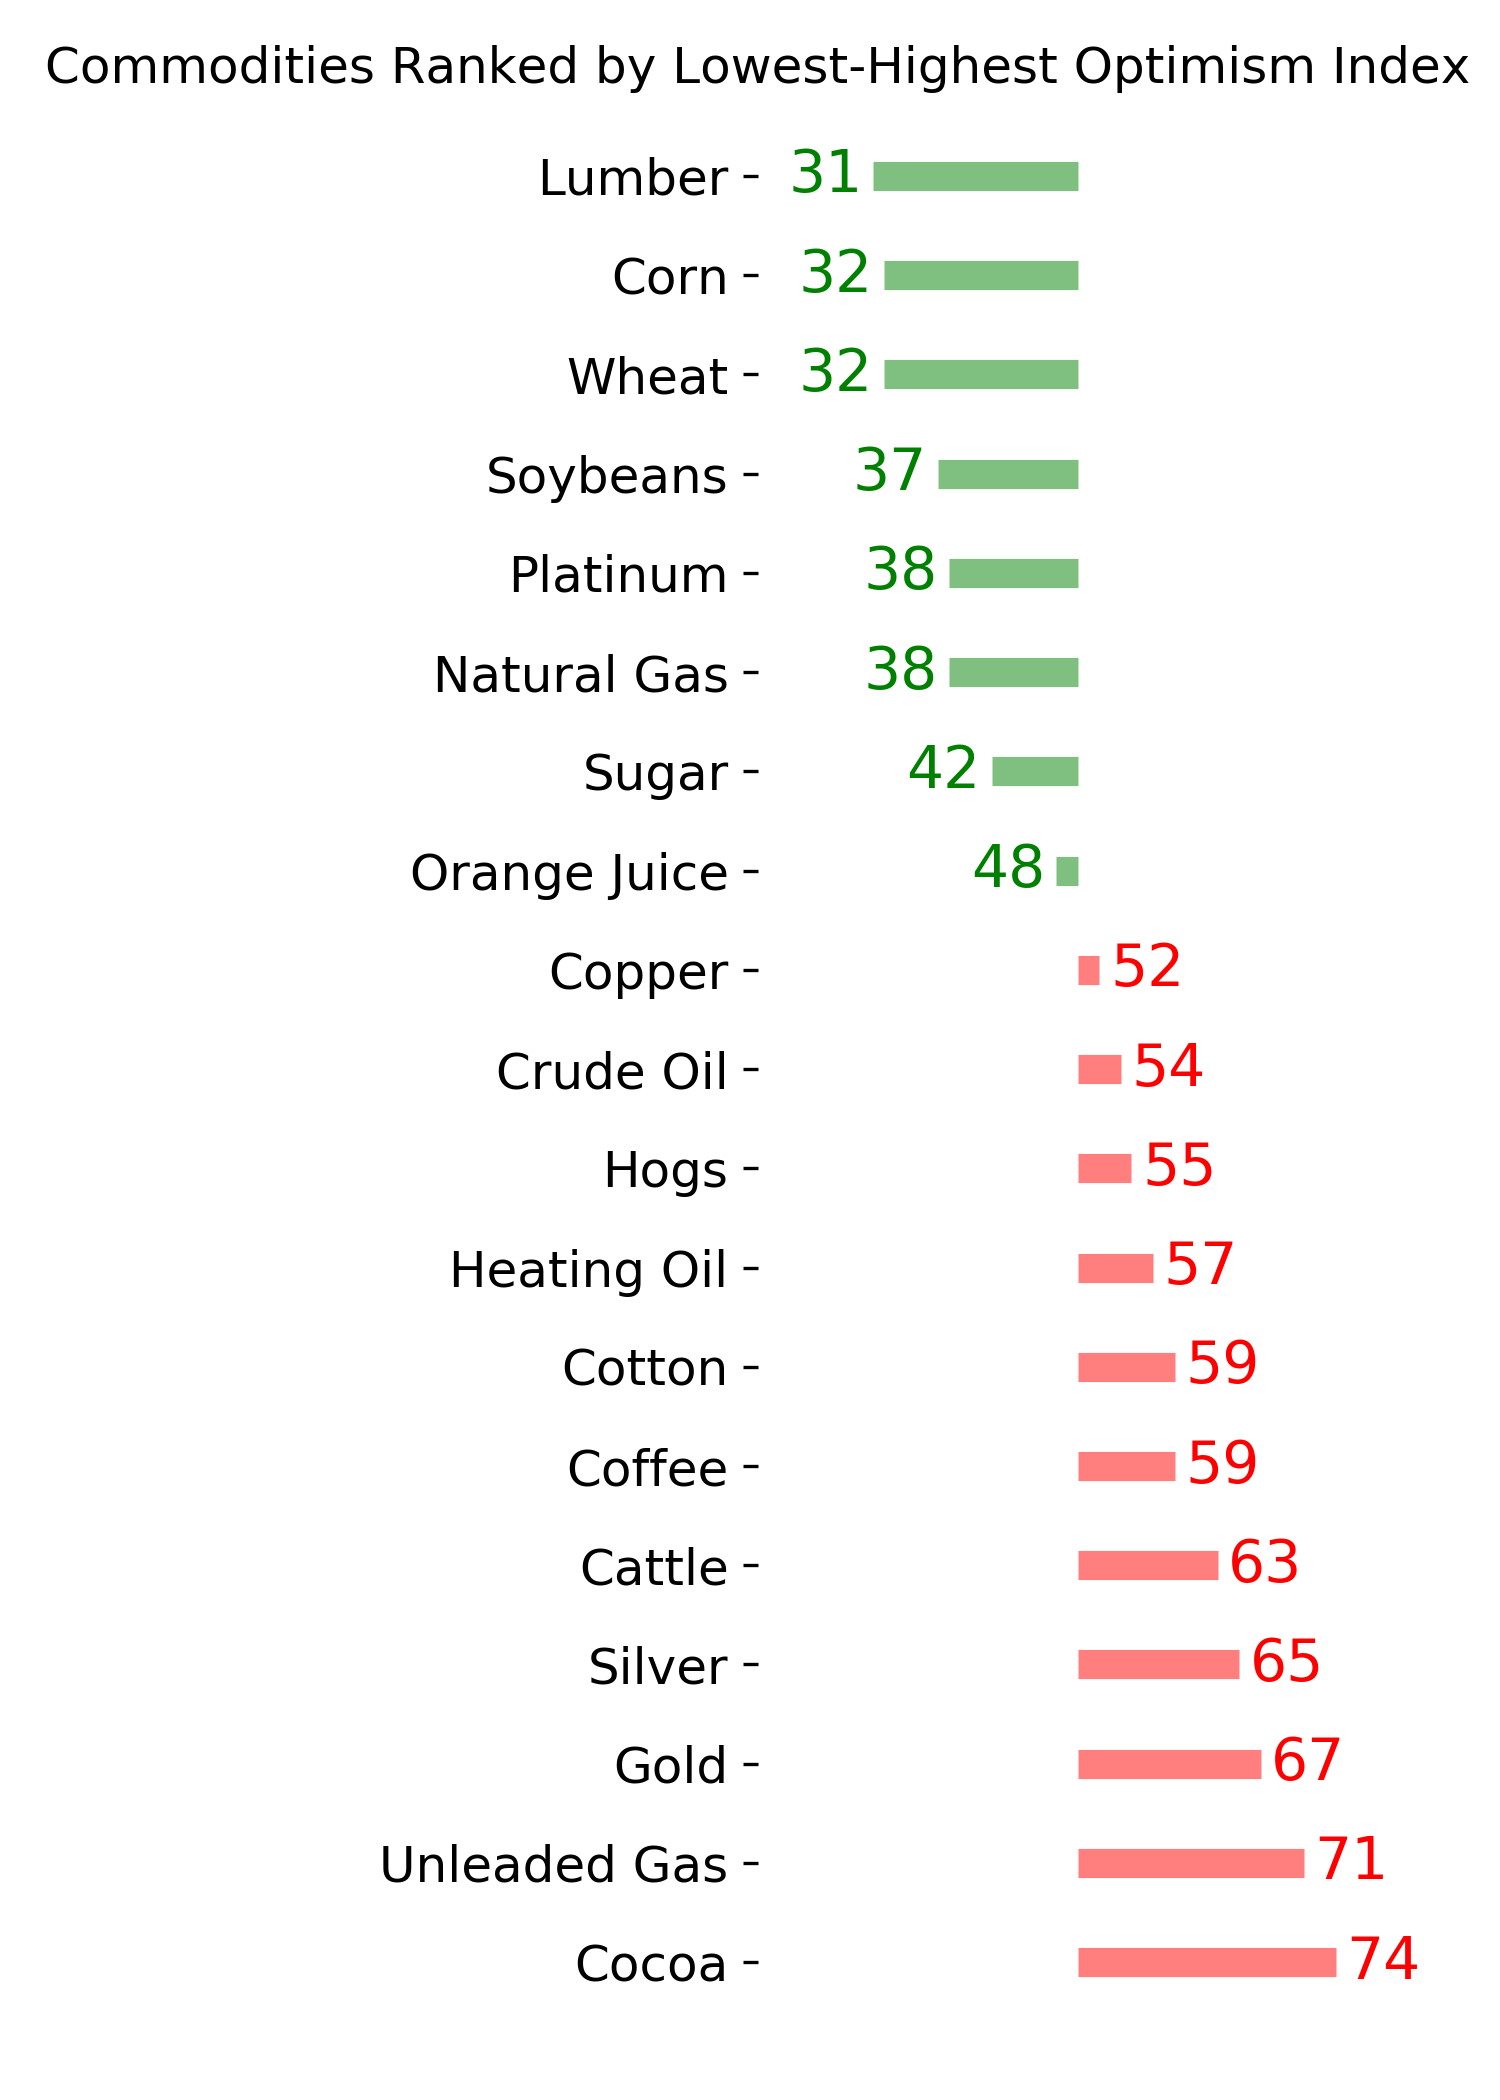
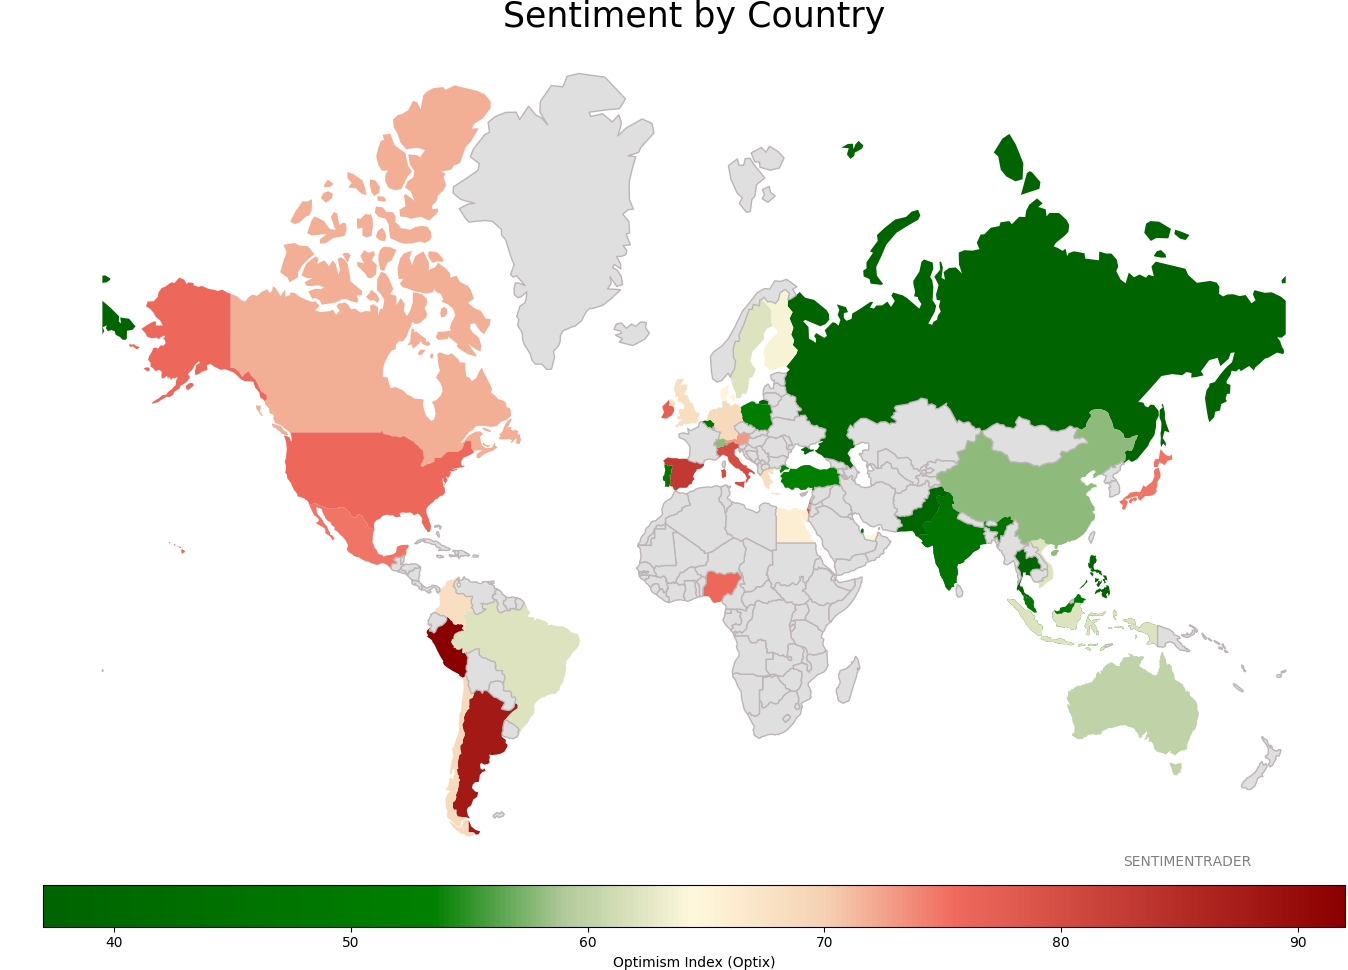
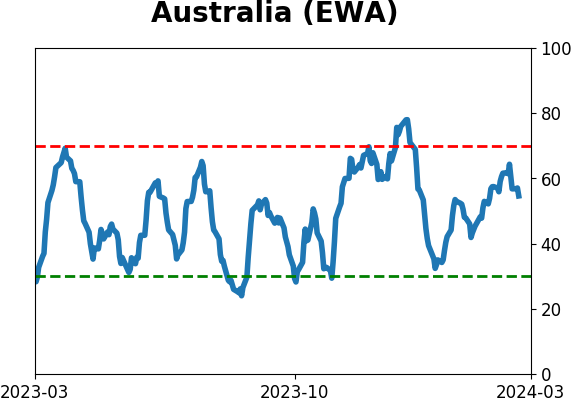
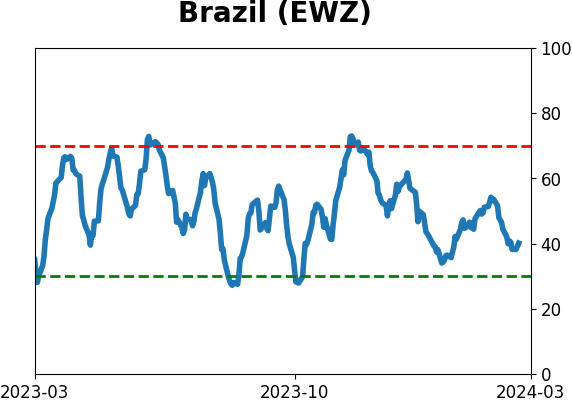
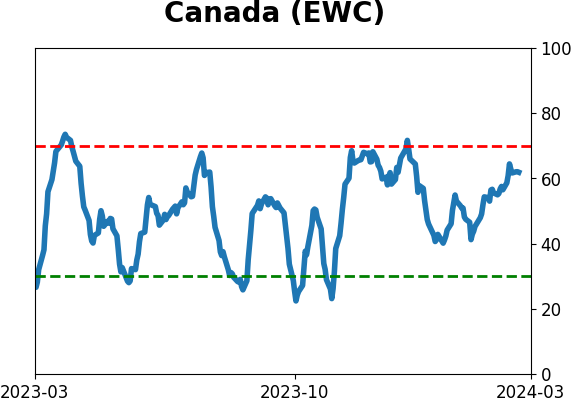
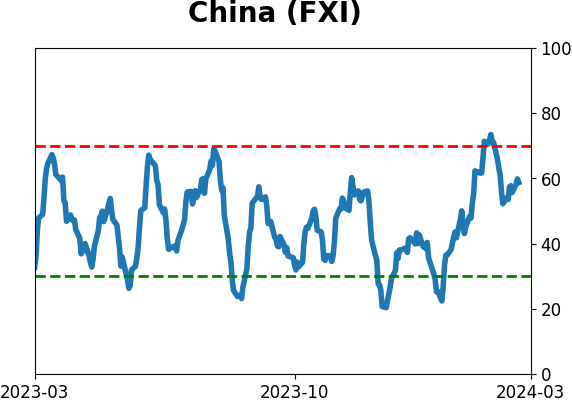
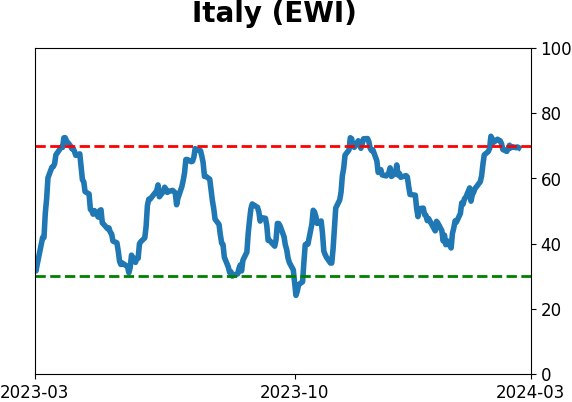
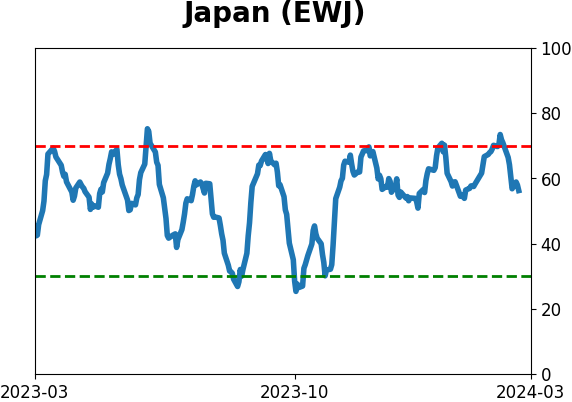
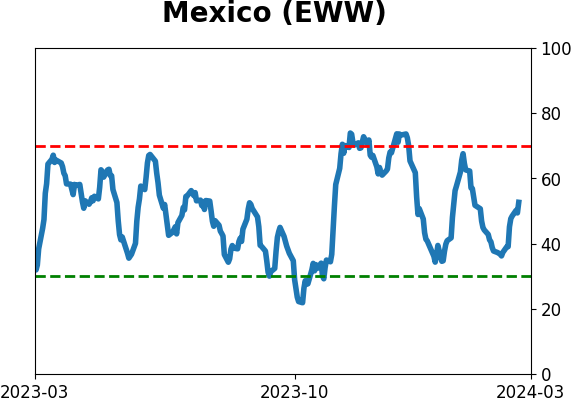
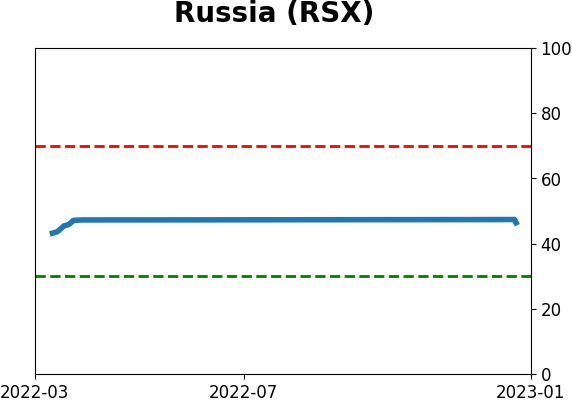
Sentiment Around The World
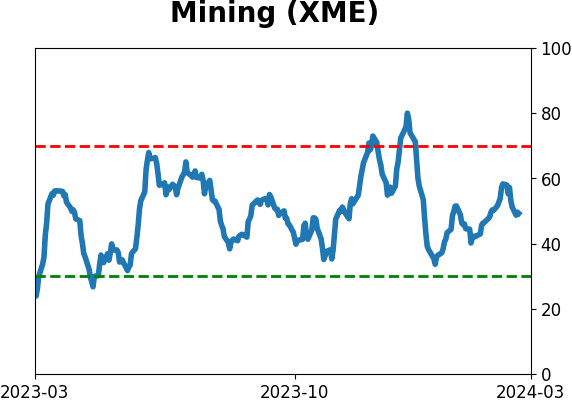
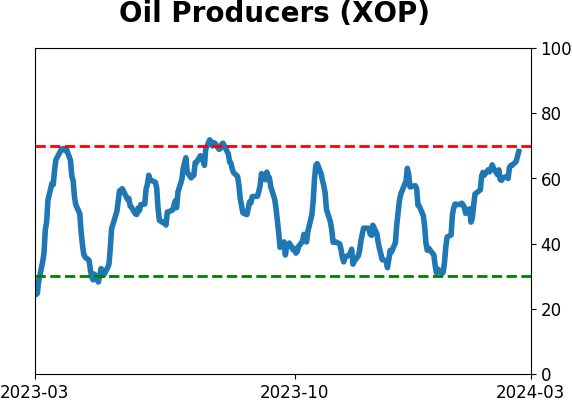
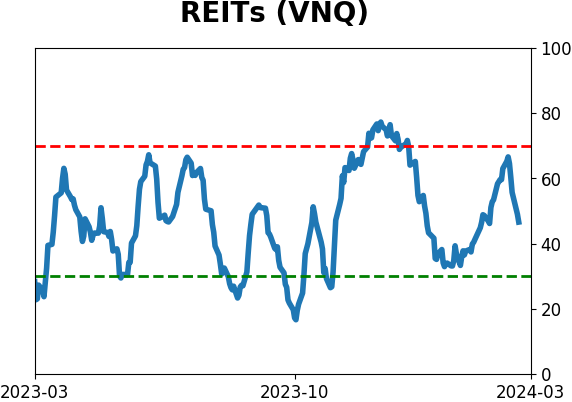
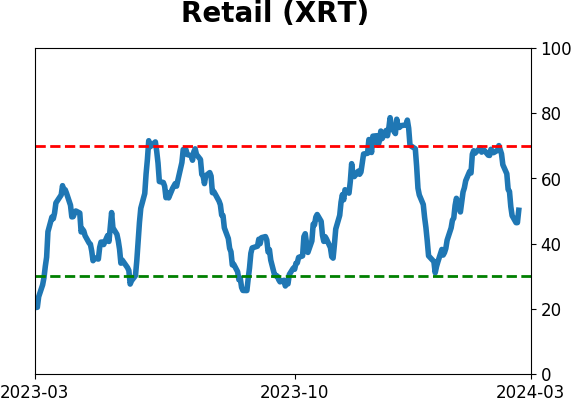
Optimism Index Thumbnails
|
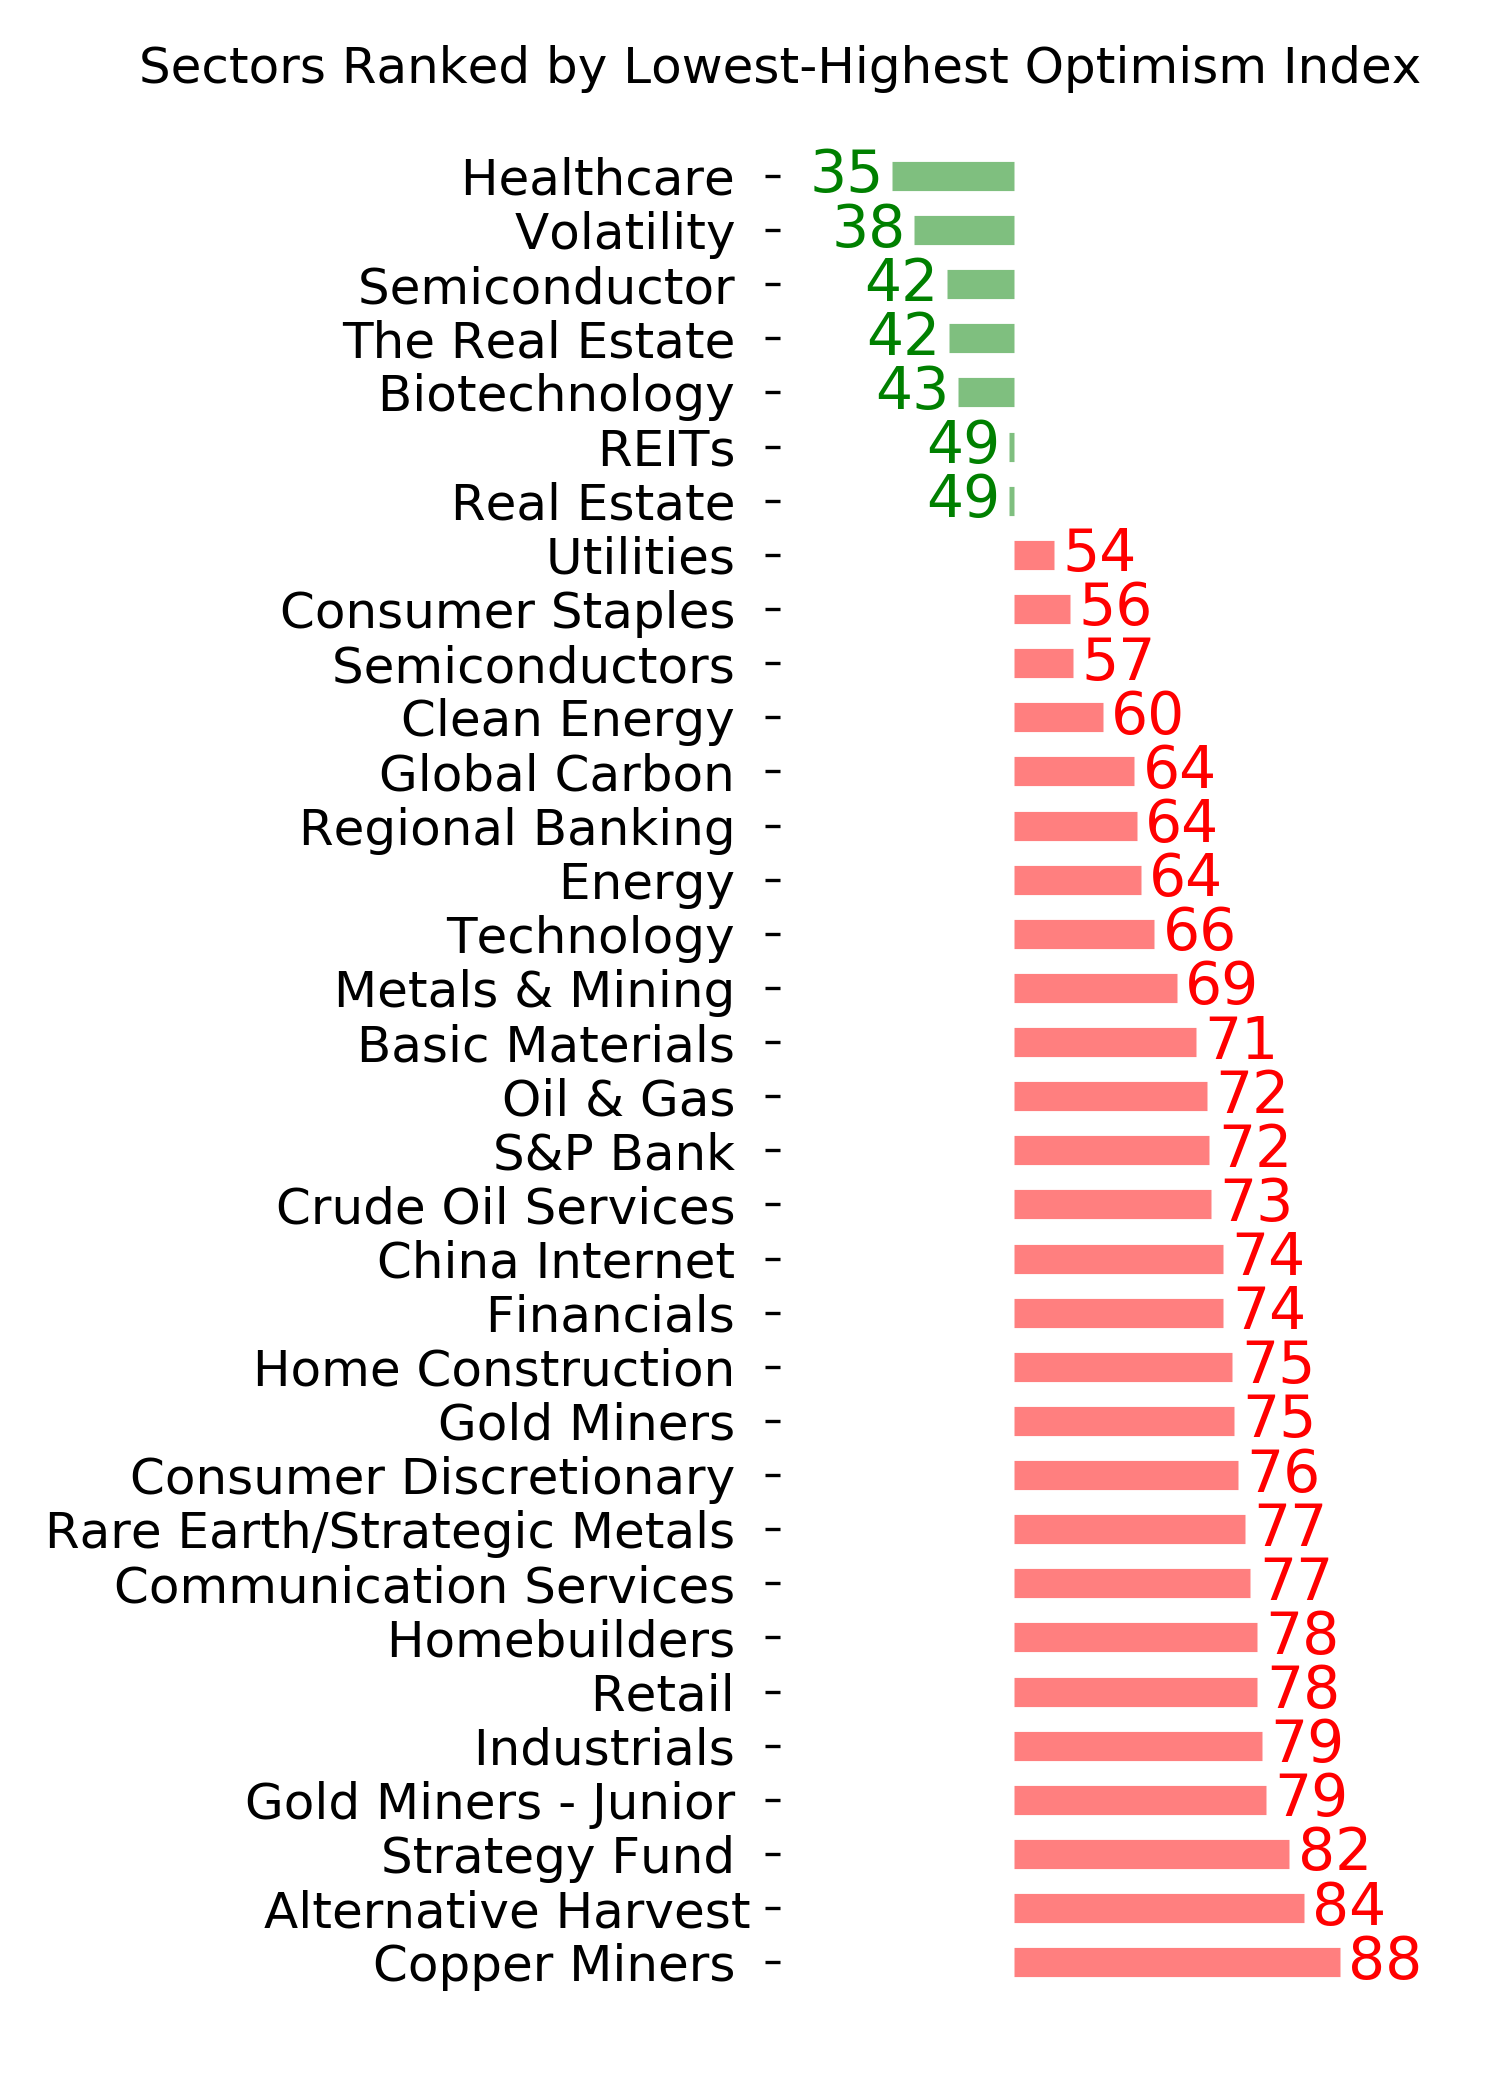
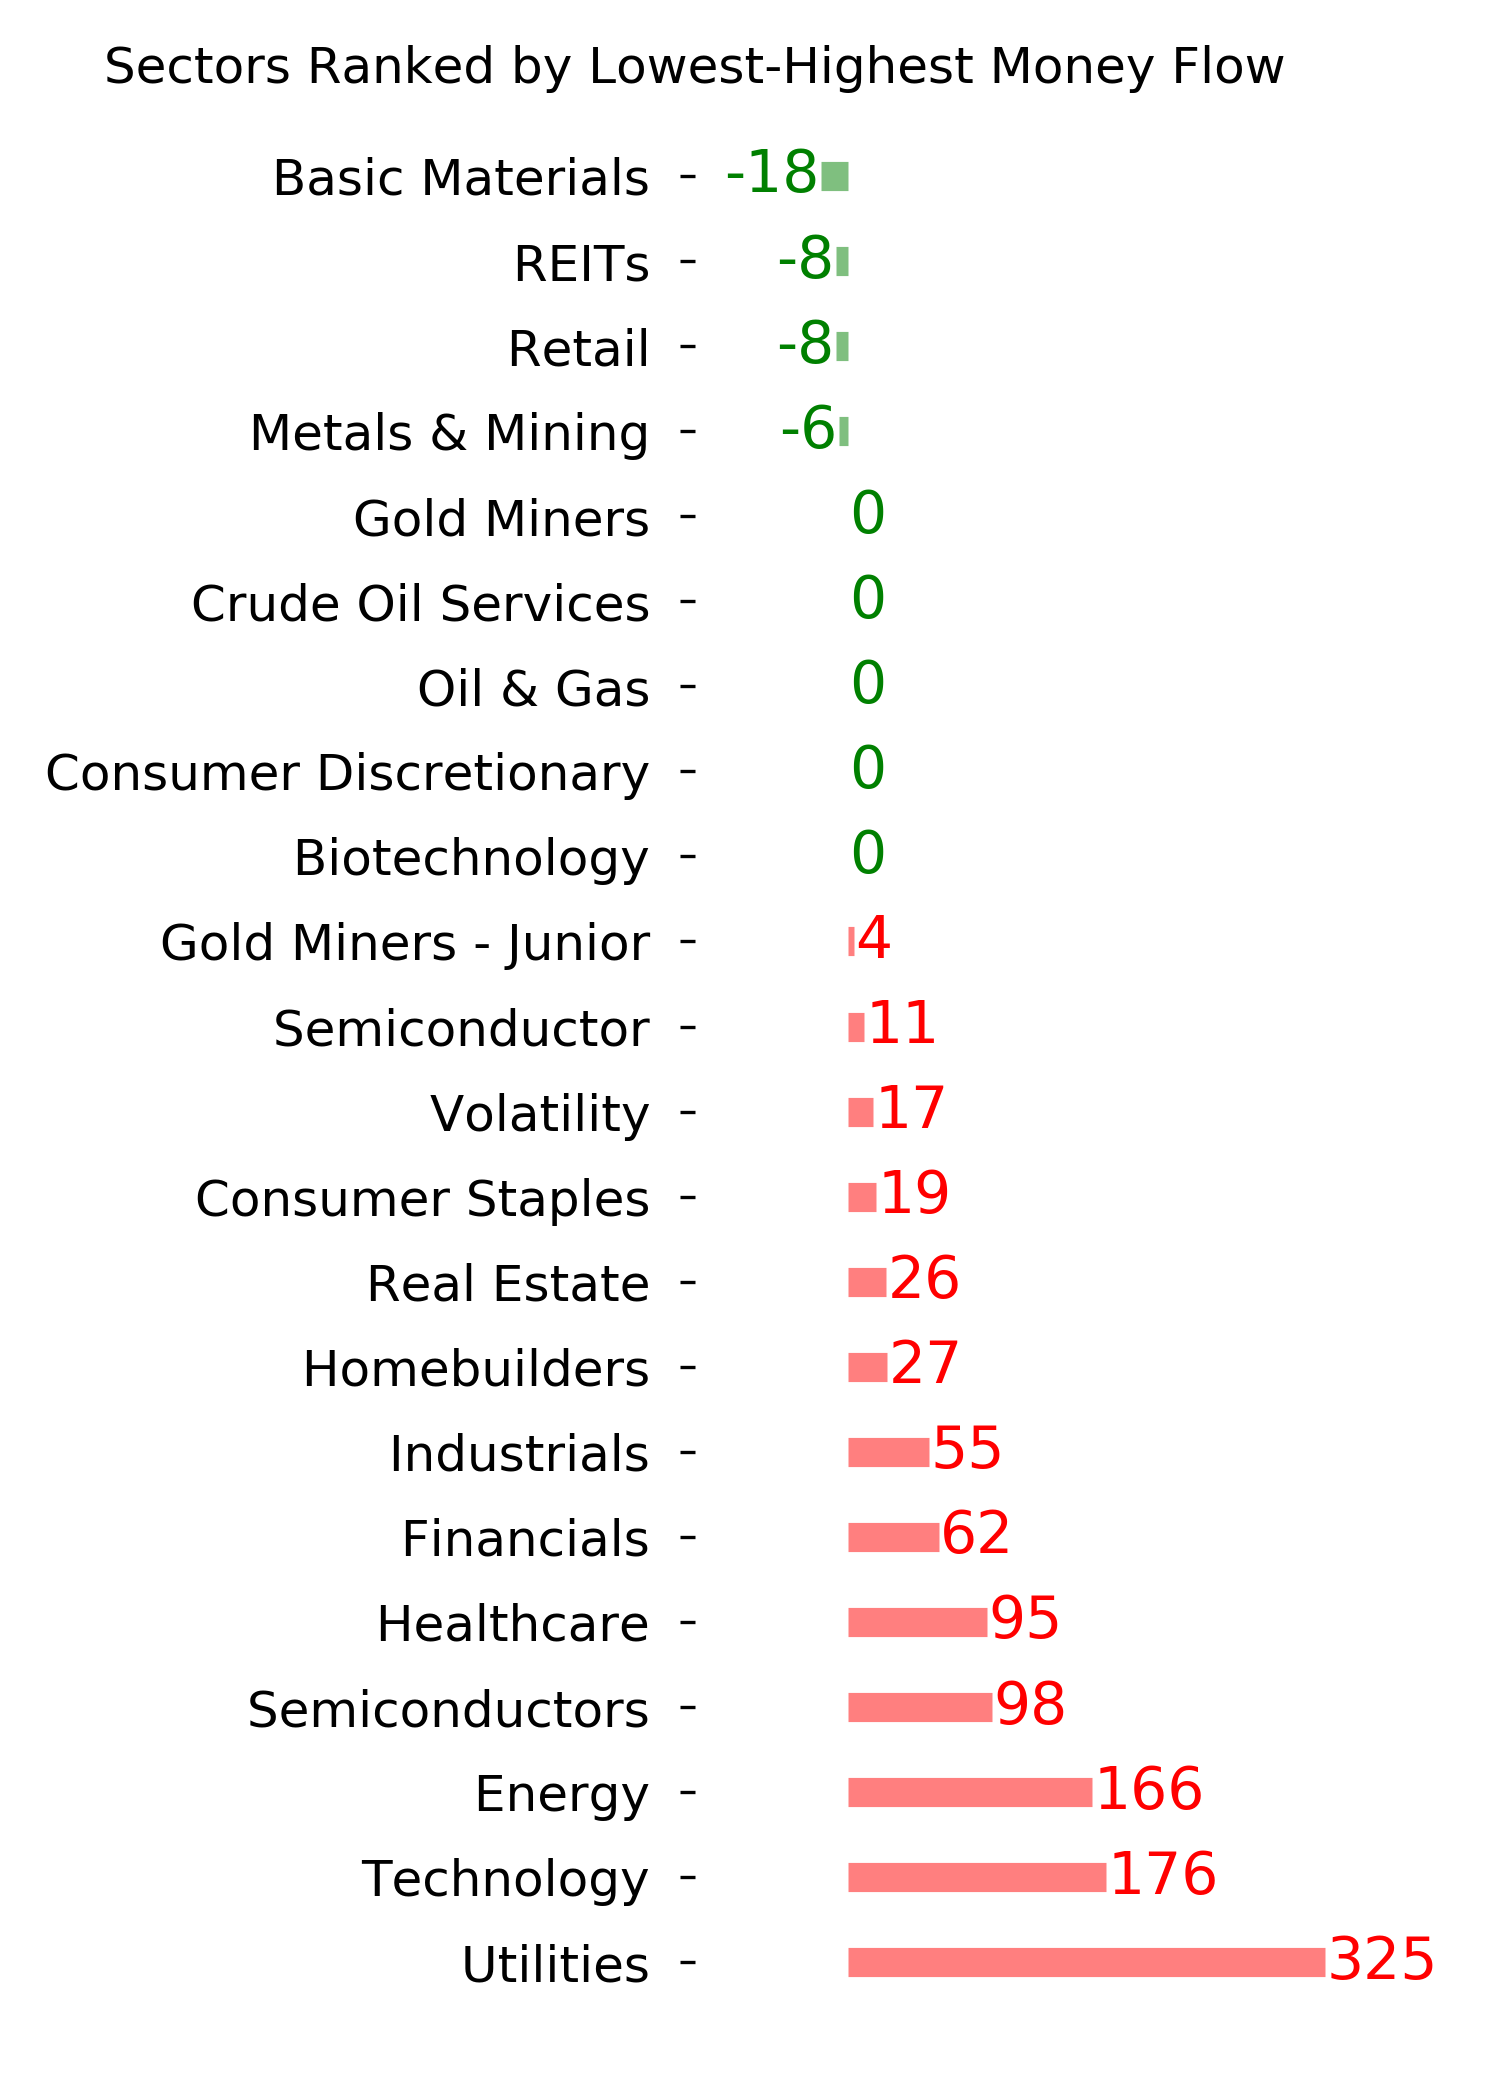
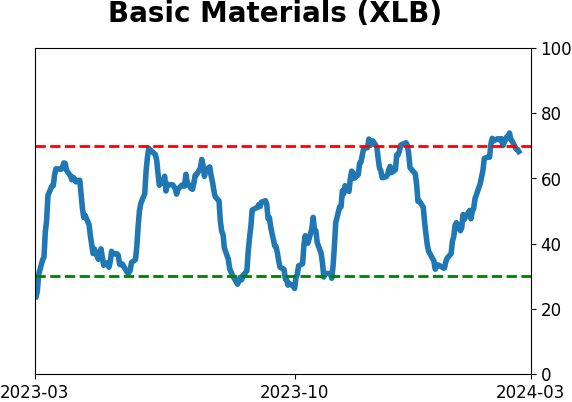
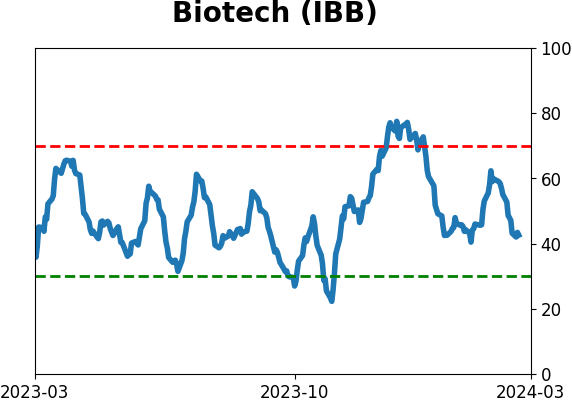
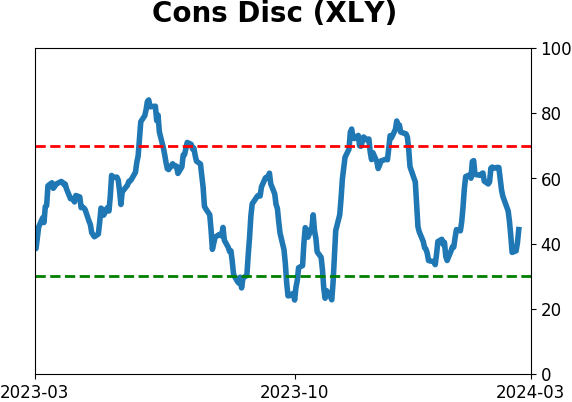
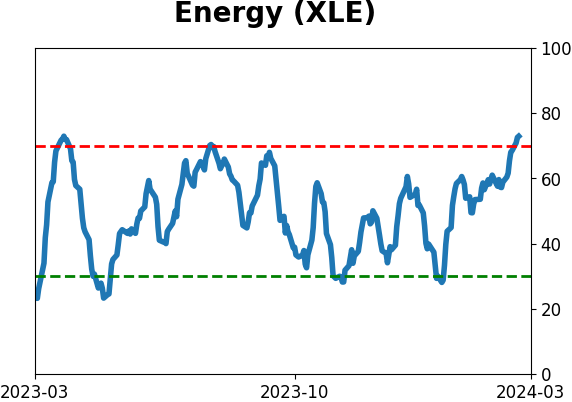
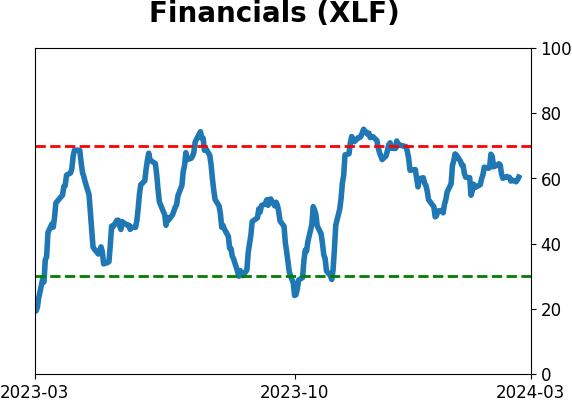
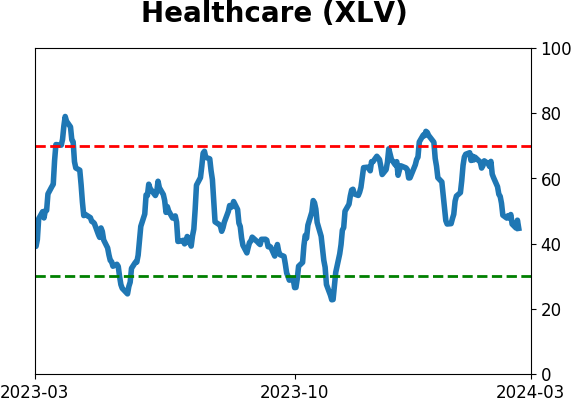
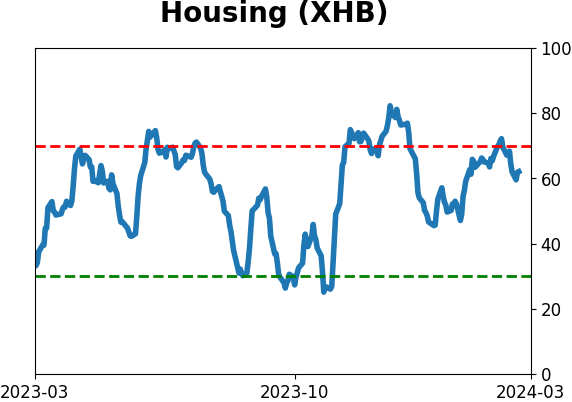
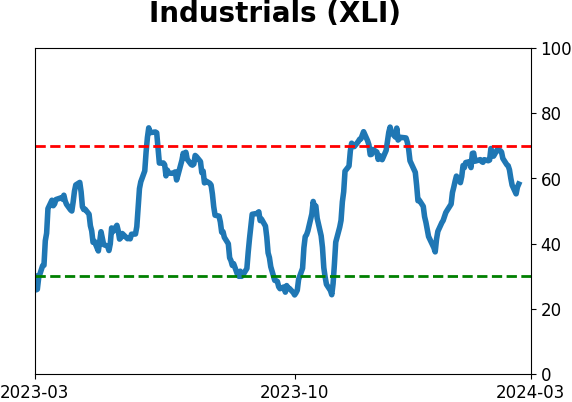
Sector ETF's - 10-Day Moving Average
|
|
|
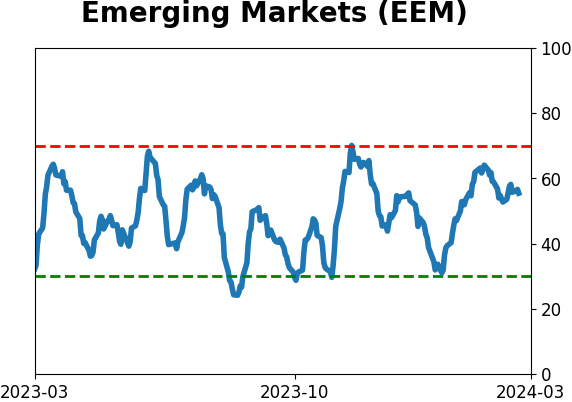
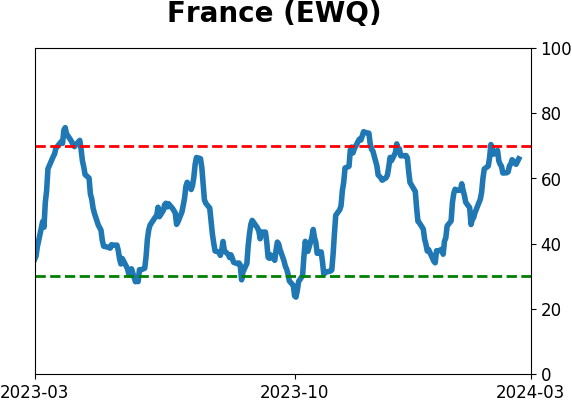
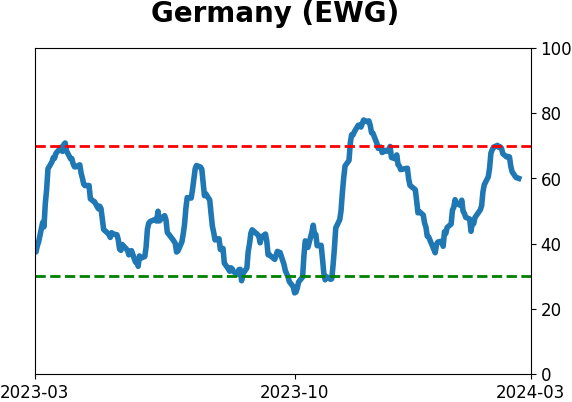
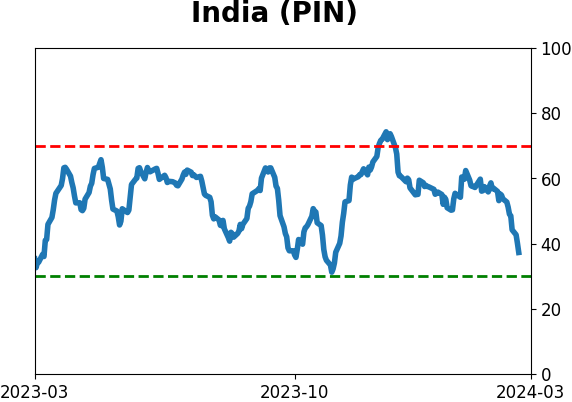
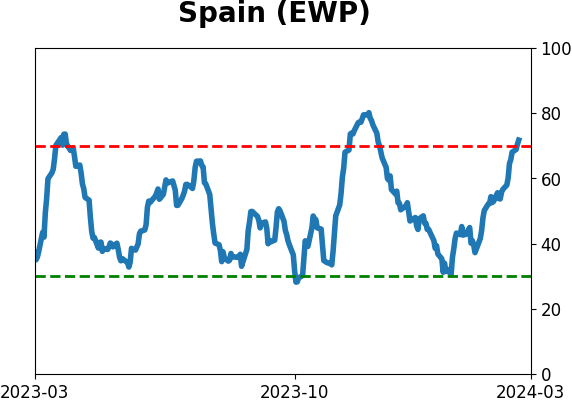
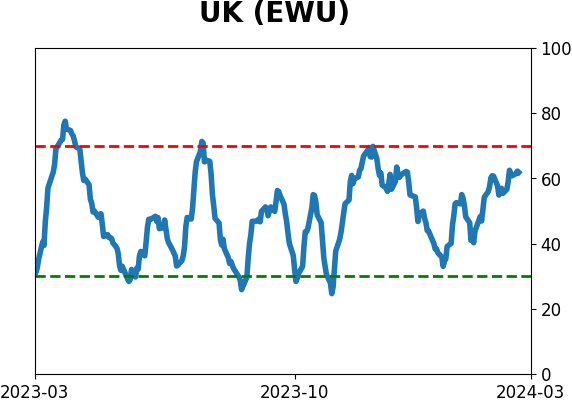
Country ETF's - 10-Day Moving Average
|
|
|
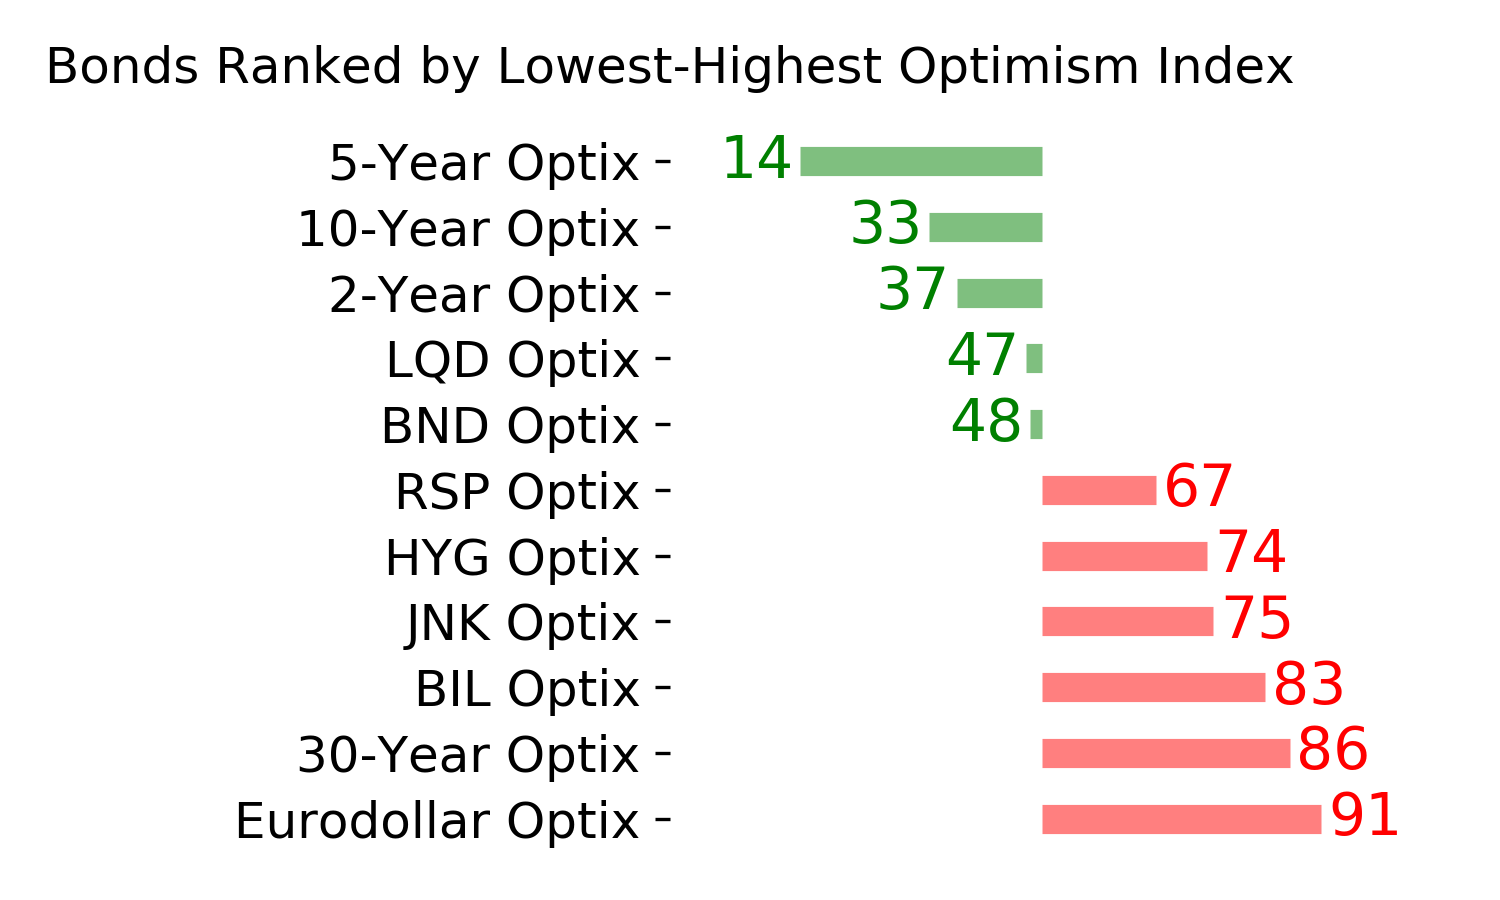
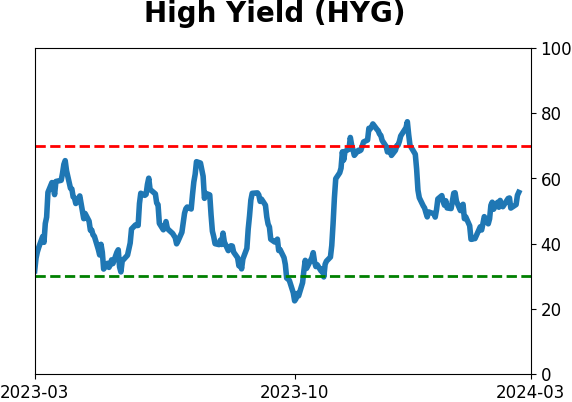
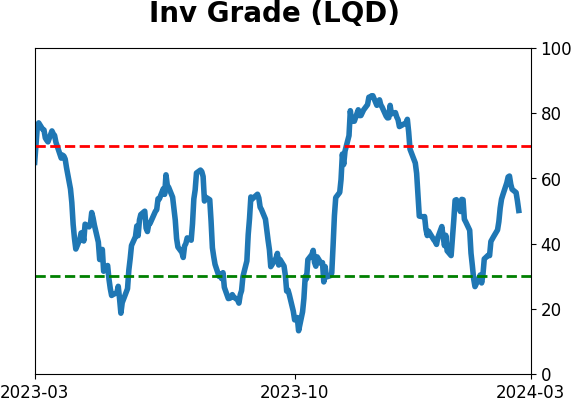
Bond ETF's - 10-Day Moving Average
|
|
|
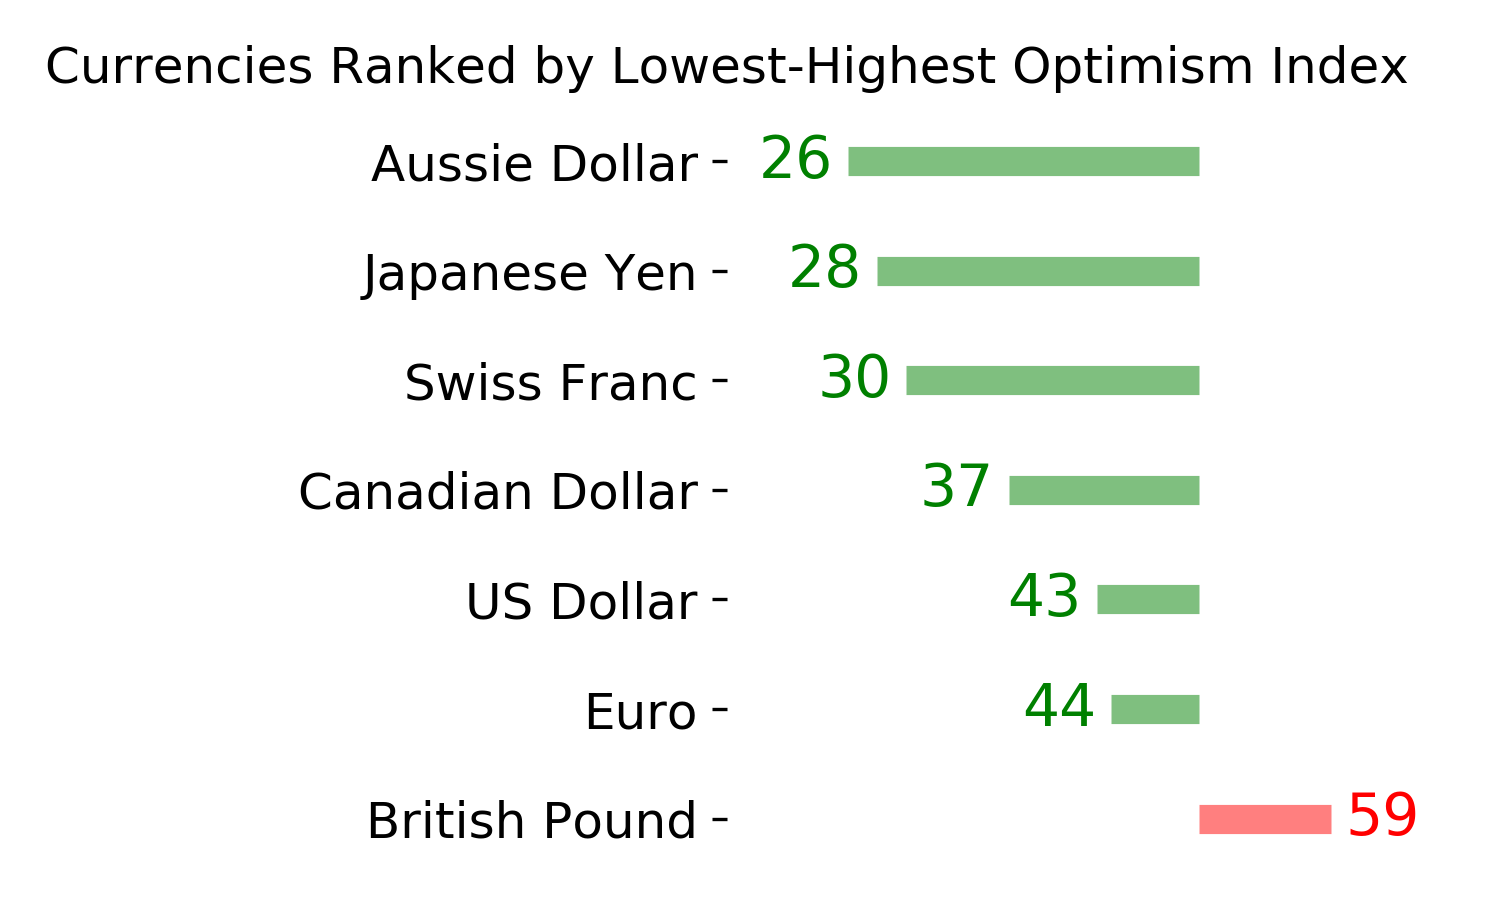
Currency ETF's - 5-Day Moving Average
|
|
|
Commodity ETF's - 5-Day Moving Average
|
|