Headlines
|
|
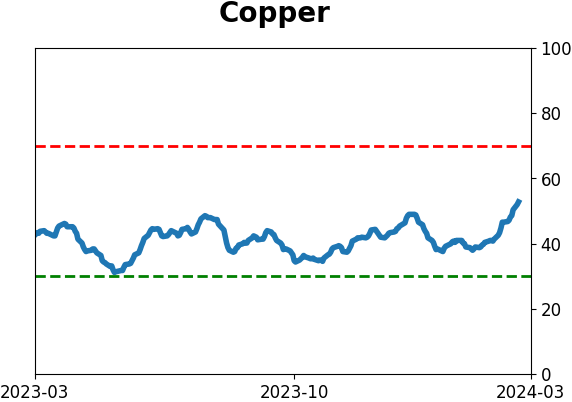
Copper has its best two weeks in a year:
Copper prices have surged over the past two weeks. Its 10-day rate of change jumped to the highest in more than a year, which comes on the heels of what had been a 200-day low in October. Similar cycles preceded mixed returns in copper and good returns in the S&P 500 and emerging markets.
|
Smart / Dumb Money Confidence
|
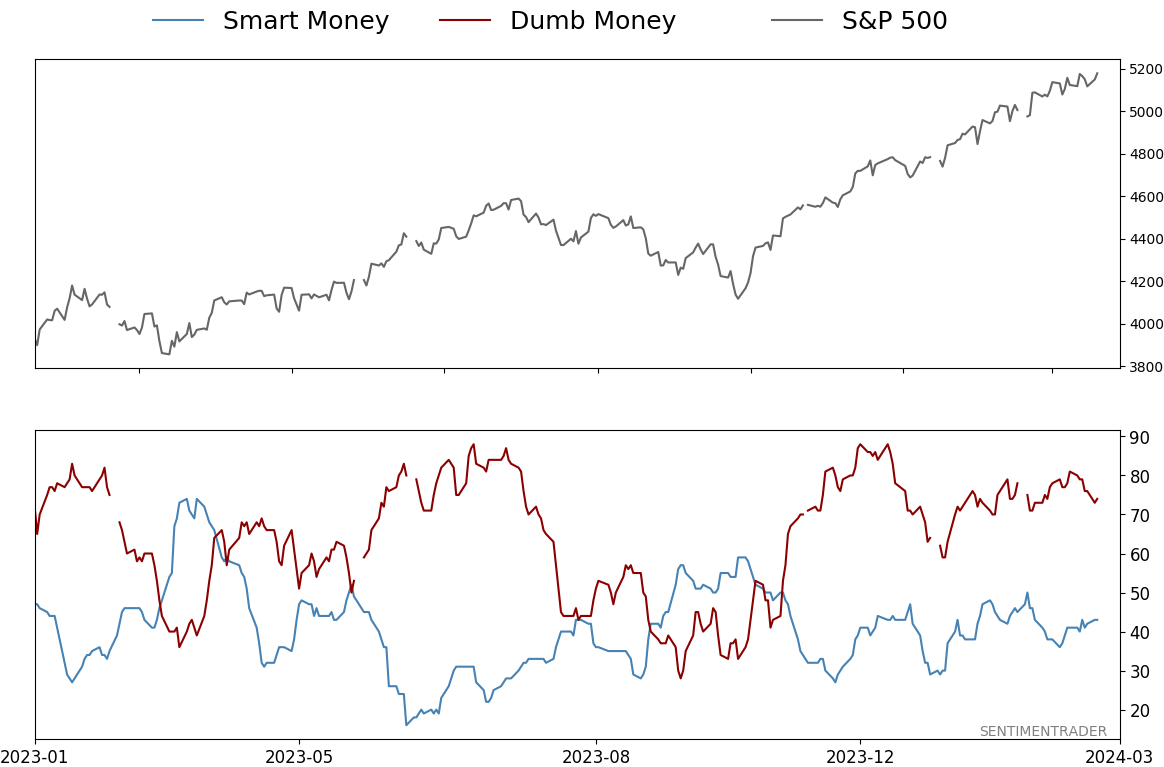
Smart Money Confidence: 43%
Dumb Money Confidence: 74%
|
|
Risk Levels
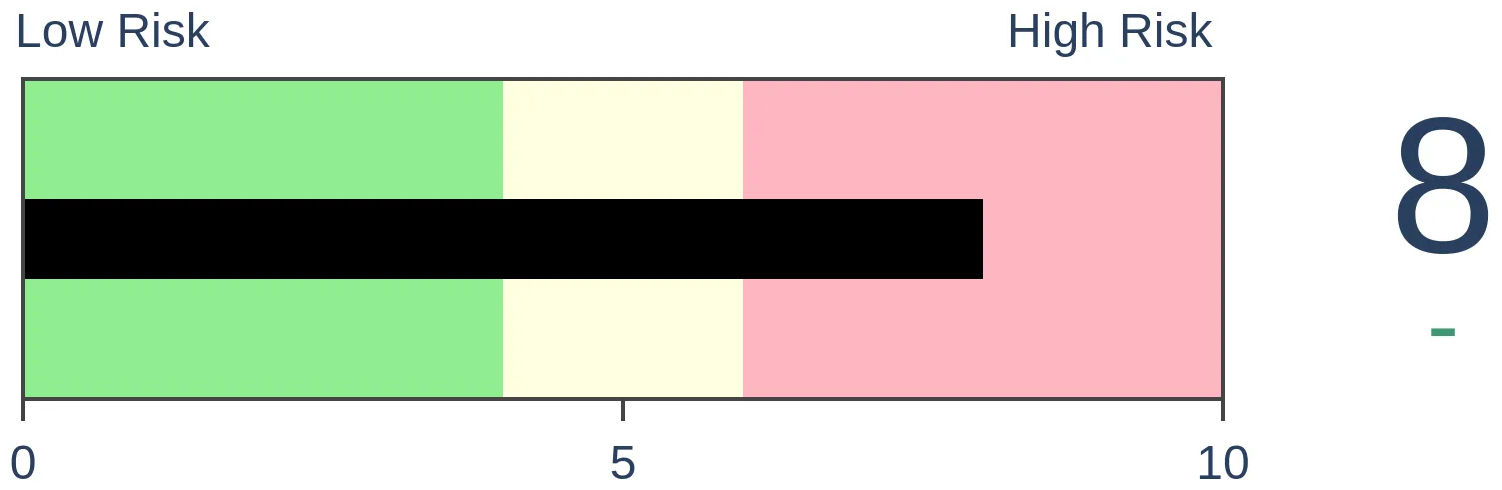
Stocks Short-Term
|
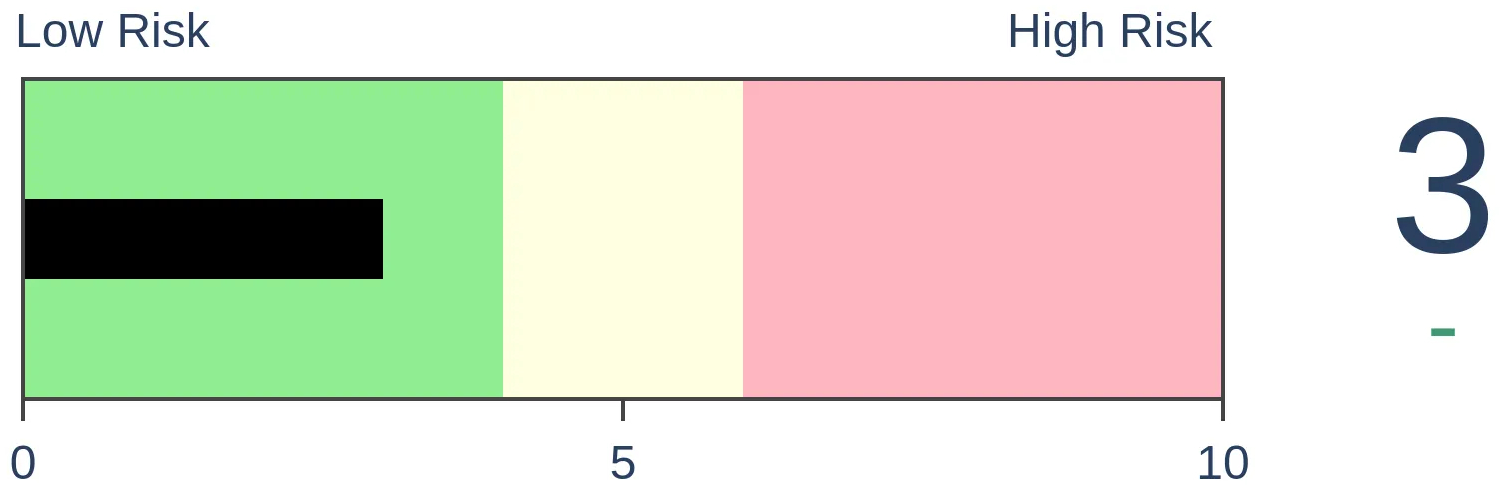
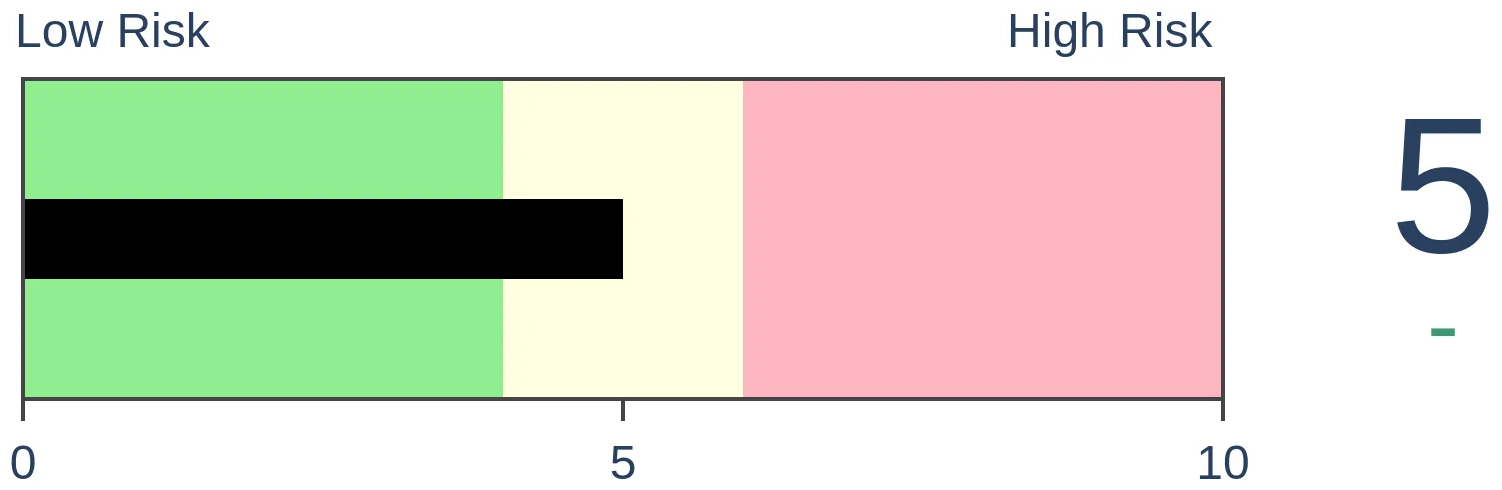
Stocks Medium-Term
|
|
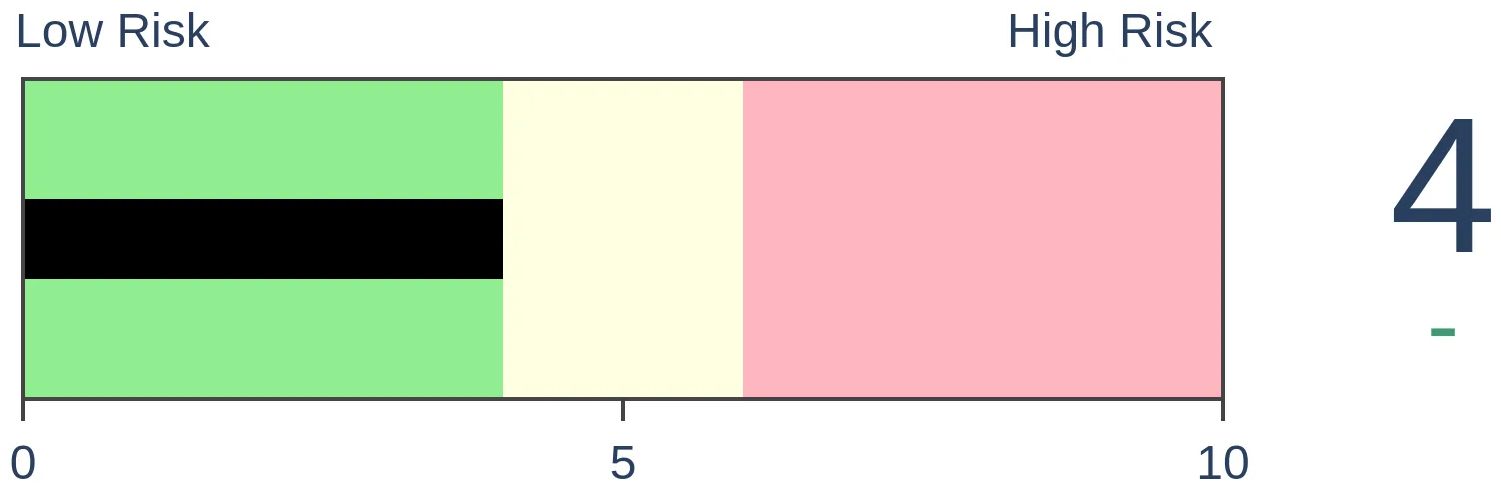
Bonds
|
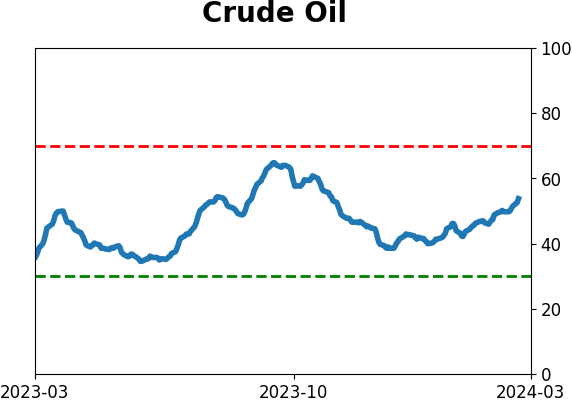
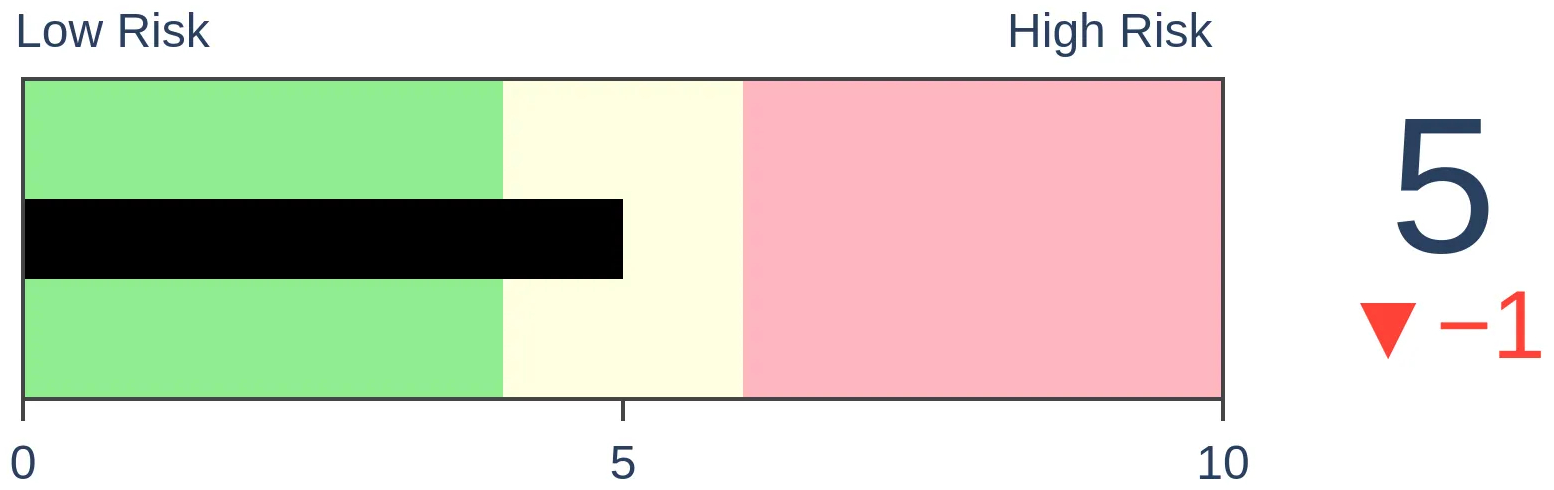
Crude Oil
|
|
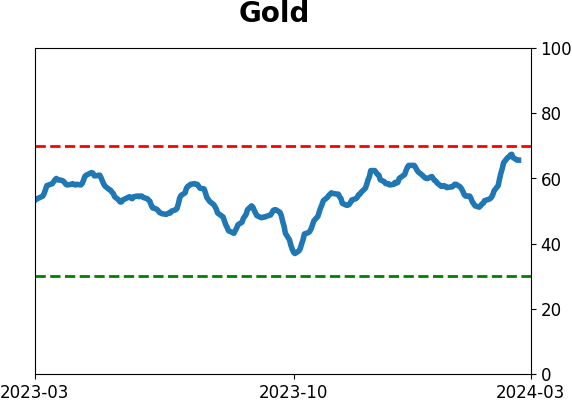
Gold
|
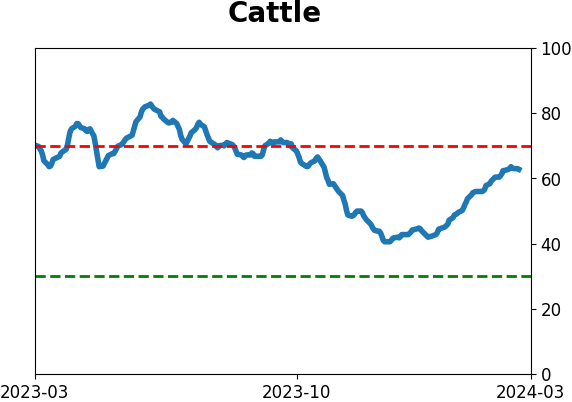
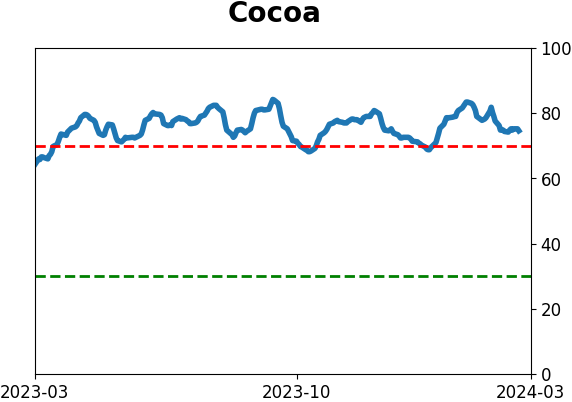
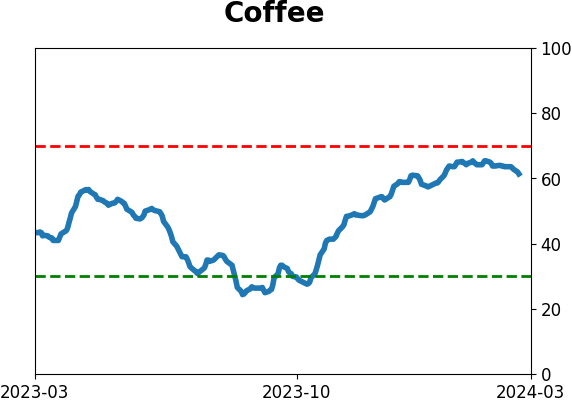
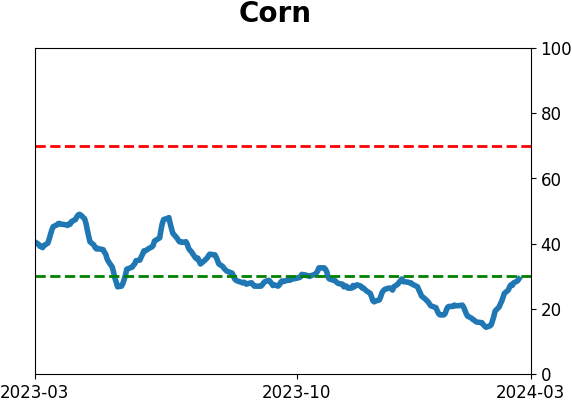
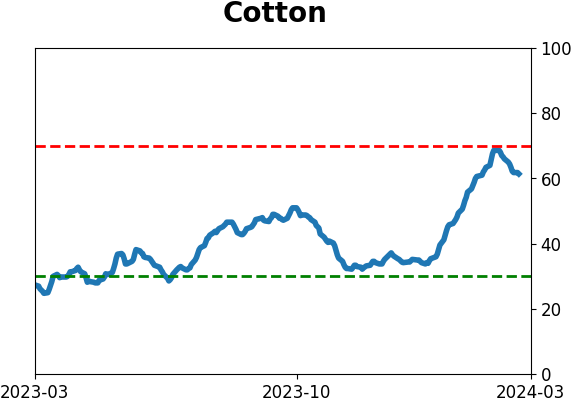
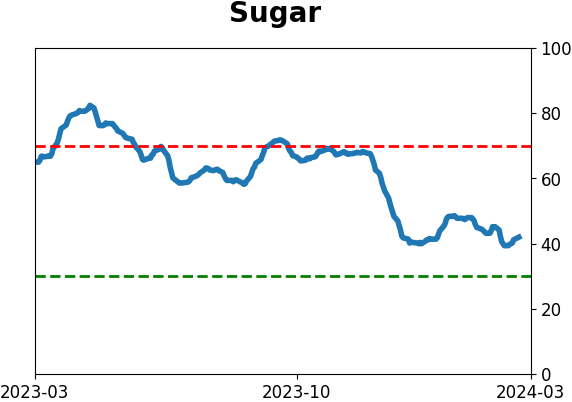
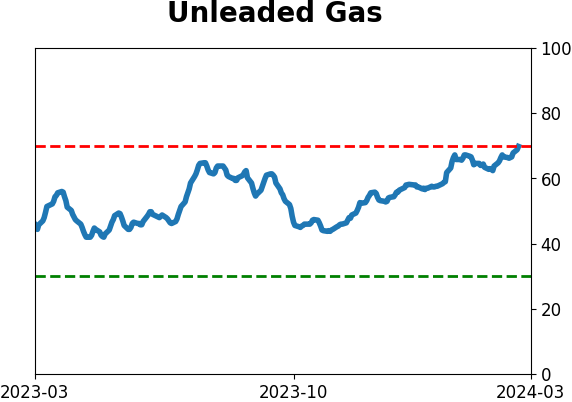
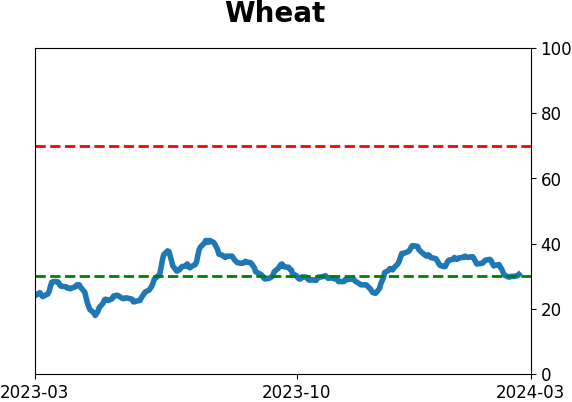
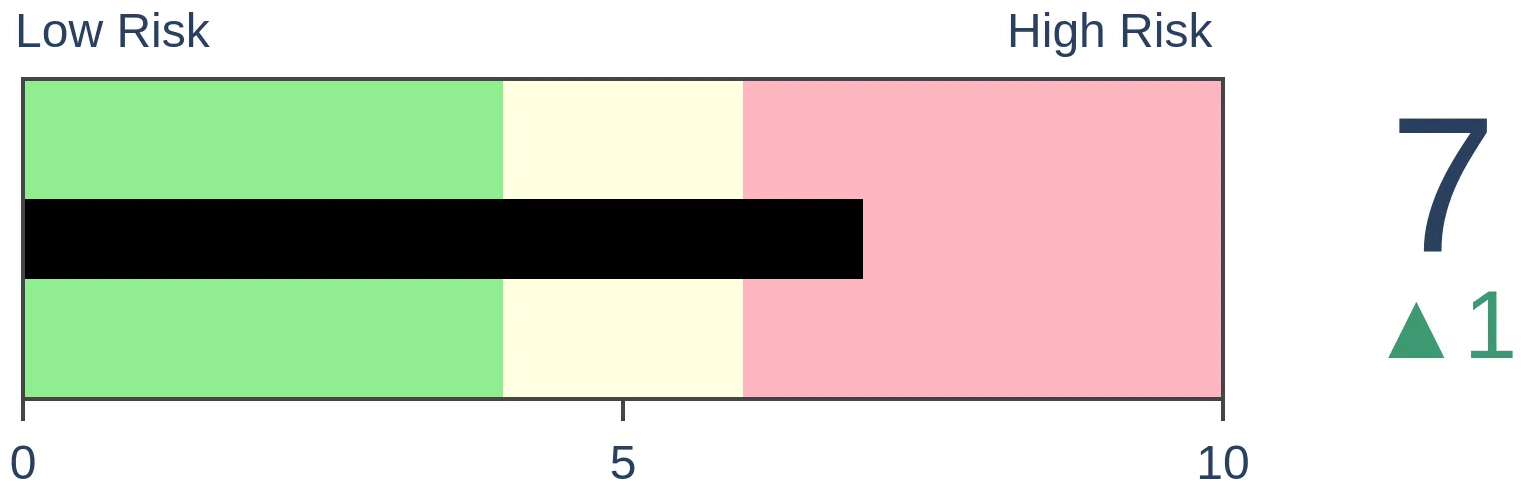
Agriculture
|
|
Research
By Jason Goepfert
BOTTOM LINE
Copper prices have surged over the past two weeks. Its 10-day rate of change jumped to the highest in more than a year, which comes on the heels of what had been a 200-day low in October. Similar cycles preceded mixed returns in copper and good returns in the S&P 500 and emerging markets.
FORECAST / TIMEFRAME
None
|
Key points:
- Copper hit a 200-day low in October and has just surged to its best 10-day gain in more than 200 days
- Similar cycles preceded mixed returns in the metal, most of them leading to declines over the following year
- Among other markets, the S&P 500 and emerging markets did well over the next couple of months
Copper is showing signs of a (mostly unreliable) bottom
It's not just the headline-grabbing high-beta stocks that have been surging lately. Money has been moving into often-overlooked sectors and entire markets.
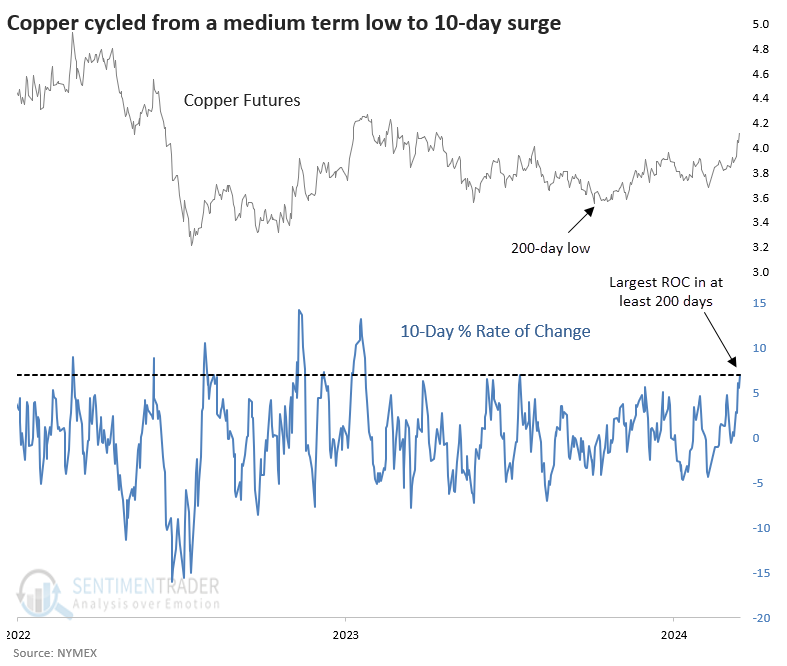
One of those is copper, which has jumped 7% over the past two weeks. That may not seem like a whole lot, but it's the largest 10-day rate of change in over a year for the metal. This is coming off what had been at least a 200-day low in copper last October, a potential sign of a shift in investors' mentality.
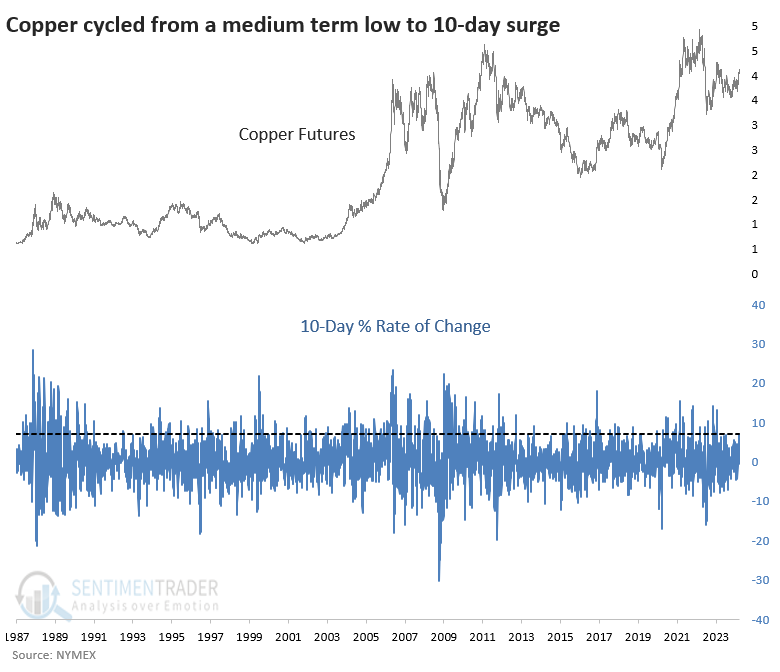
Even though the 10-day jump of 7% was the largest in over a year, it's not all that extreme relative to some of the other two-week rallies in copper futures during the past 35 years. It has frequently seen jumps more than twice as large as this - sometimes marking significant lows and sometimes blow-off peaks.
Big jumps after a low had a poor record of indicating bottoms
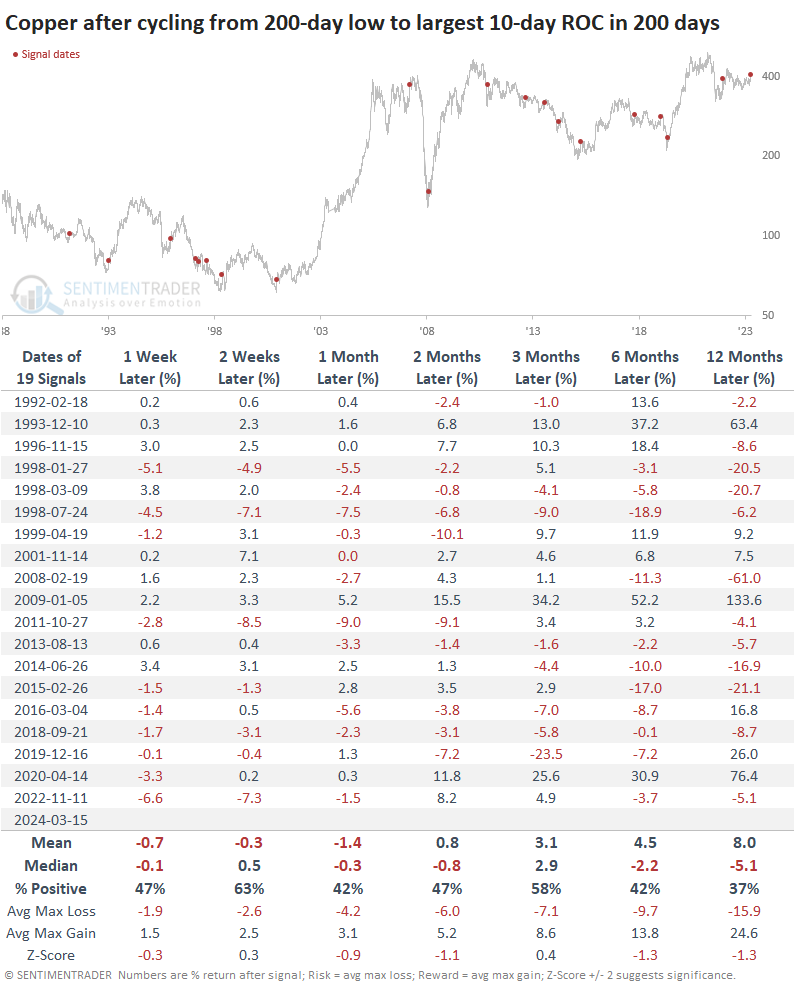
Unfortunately for copper bulls, these cycles from a 200-day low to the largest 10-day rally in copper futures had a poor record of indicating that more gains were in store.
The table below shows every time the metal cycled like this over the past 35 years. Several of them did, in fact, indicate that sentiment had shifted in a sustained way. These patterns coincided with long-term bottoms in 1993, 2009, and 2020. Most of the others either showed negative one-year returns or interim drawdowns so significant they would have scared out a typical investor.
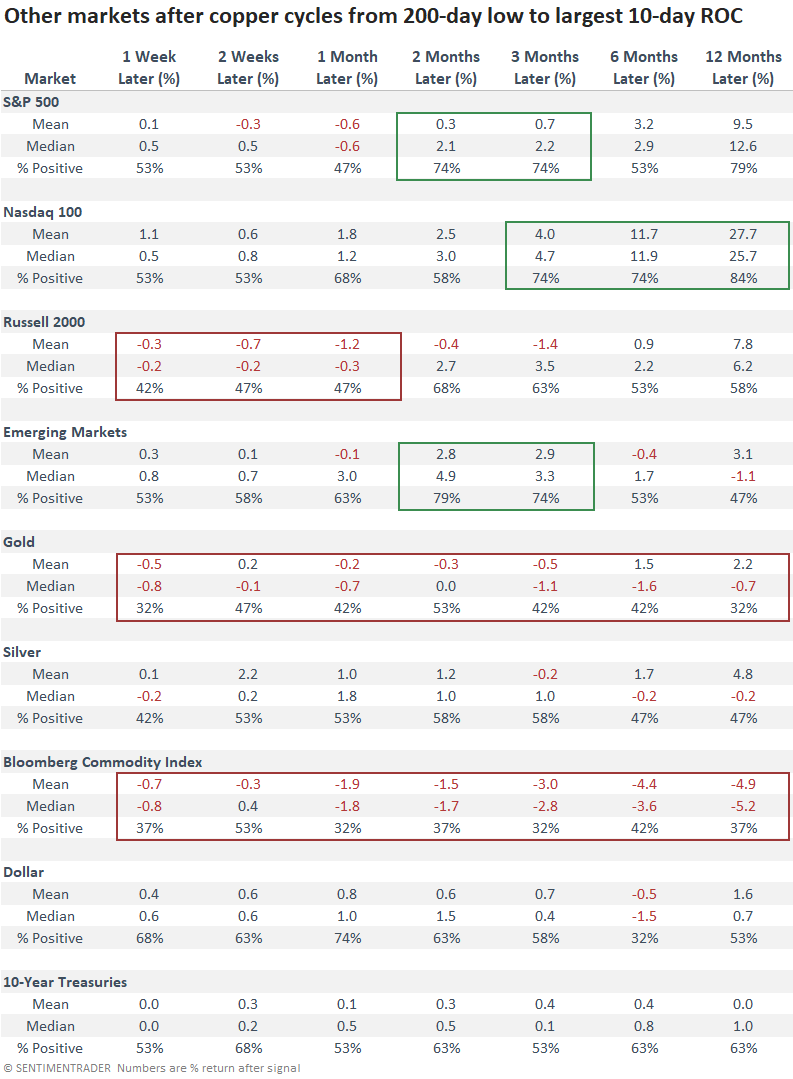
Copper is often referred to as an indicator of health for other markets. There is very little reason for this other than it was in a textbook somewhere, and everyone else just started parroting those talking points.
The table below shows returns in other indexes and markets after these cycles in copper. The best returns over the medium-term were in the S&P 500 and emerging markets indexes. The latter sported a gain 79% of the time two months later, enjoying a median rally of nearly +5%. Longer-term, the Nasdaq 100 was the best performer. Less inspiring, the small-cap Russell 2000 struggled up to a month later, gold didn't perform well across any time frame, and the broader commodity complex did even worse.
What the research tells us...
Copper is often referred to as "Dr. Copper," which has been one of my pet peeves for two decades. It's not a doctor of anything other than diagnosing who is most capable of regurgitating unsupported clichés.
The metal is showing some signs of a long-term bottom, but it hasn't been nearly as consistent a signal as we would like to rely upon it as a reliable signal. That goes for the metal itself and most other markets. U.S. large-cap stocks and emerging markets did okay over the medium term, but other than that, returns weren't that much better than random. For others, like precious metals and commodities in general, it was more of a negative than a positive.
Indicators at Extremes
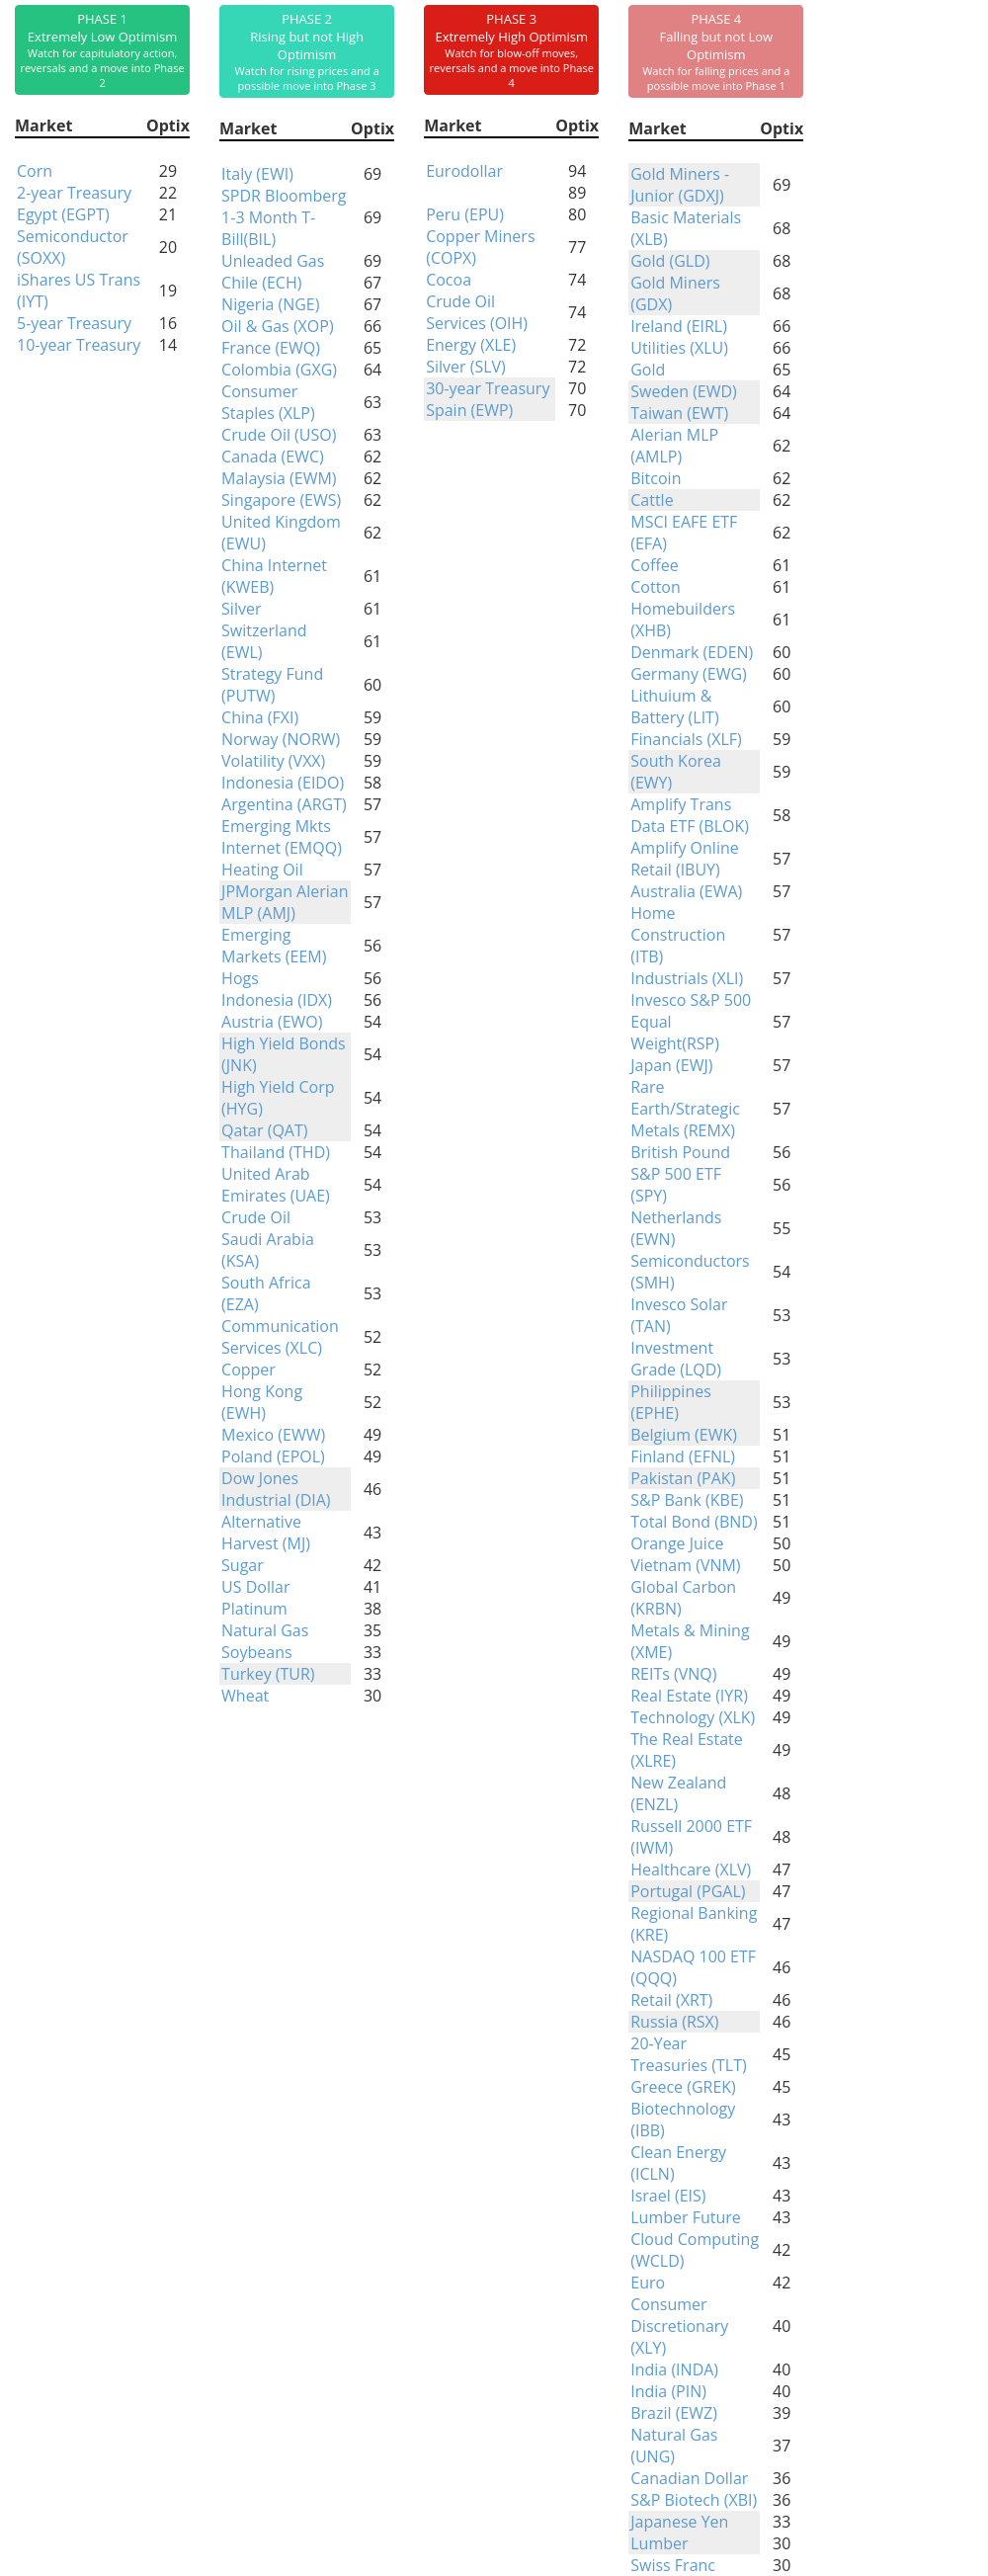
Phase Table
Ranks
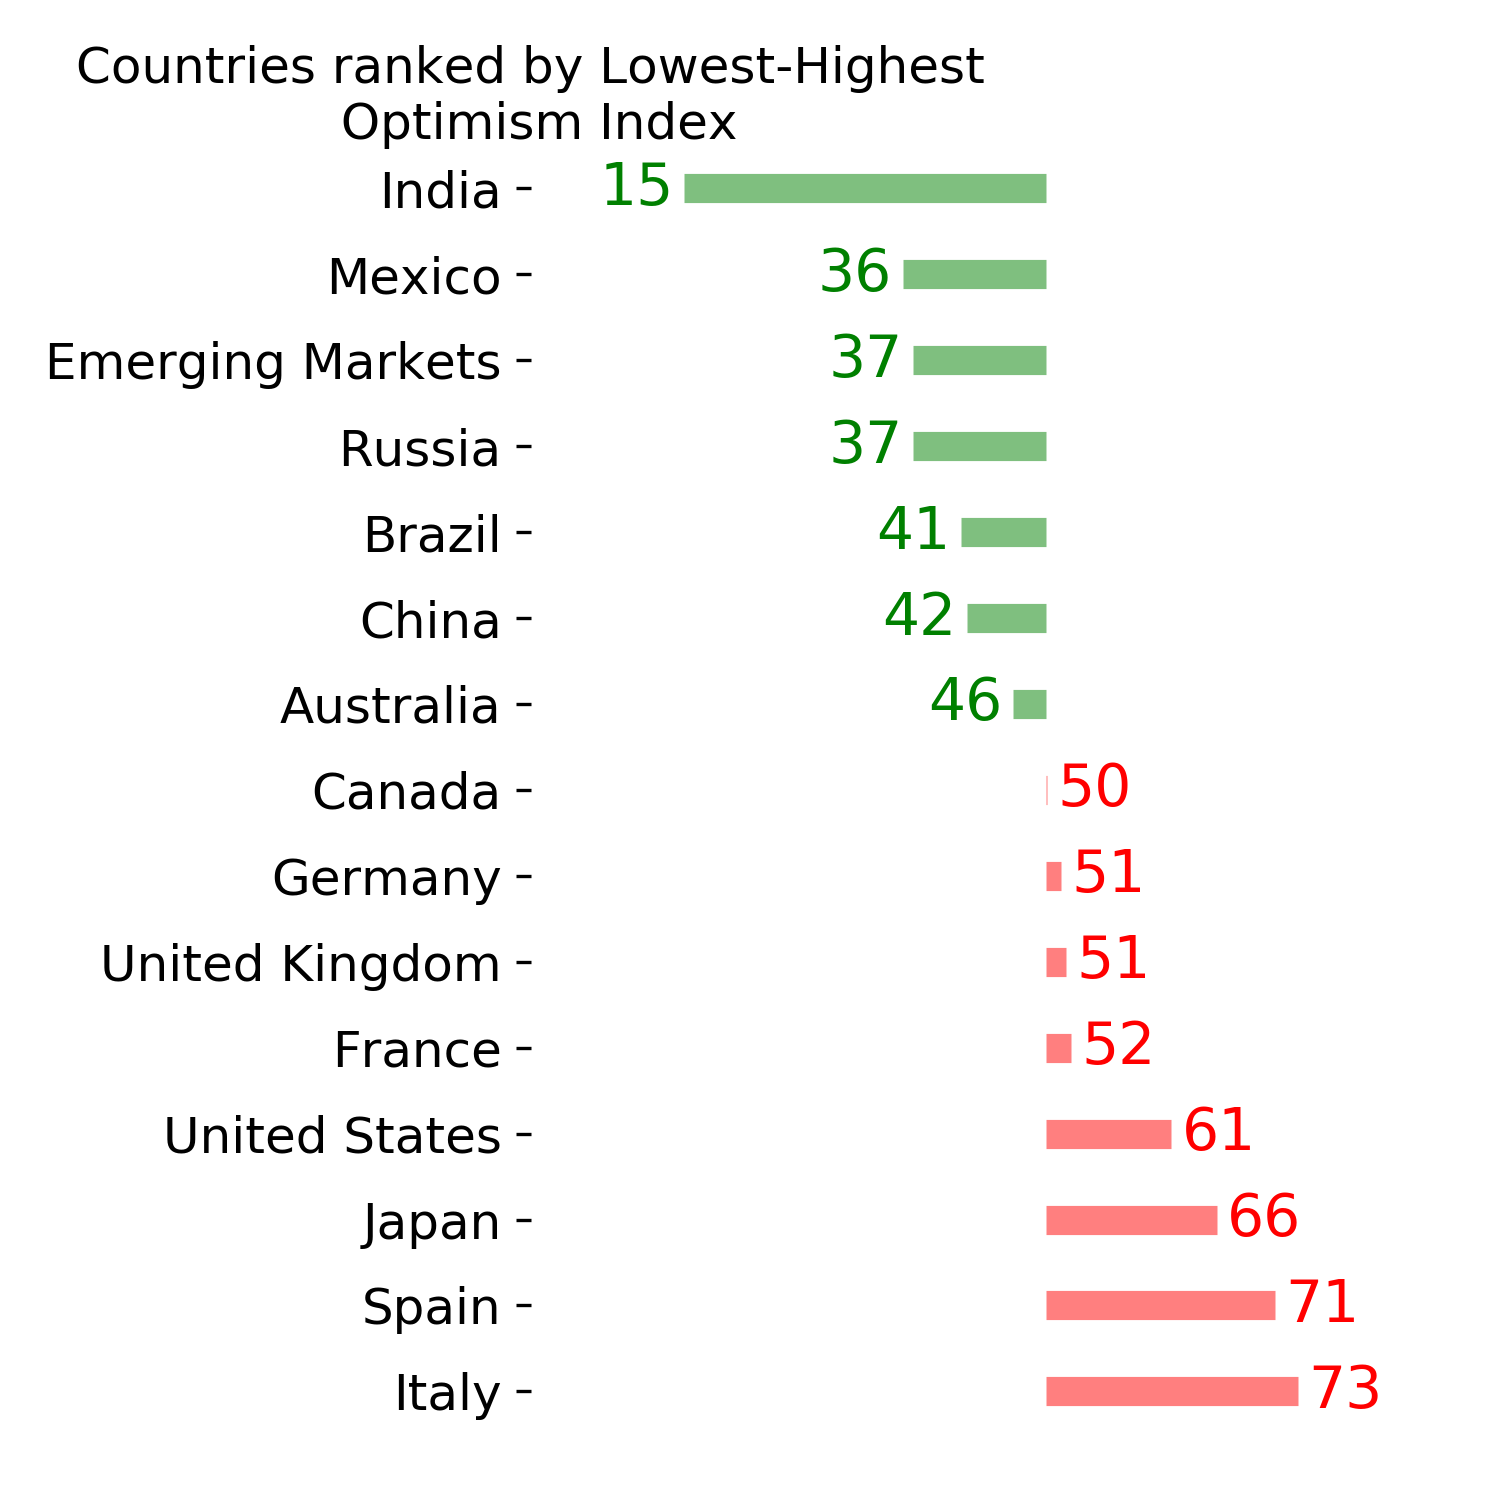
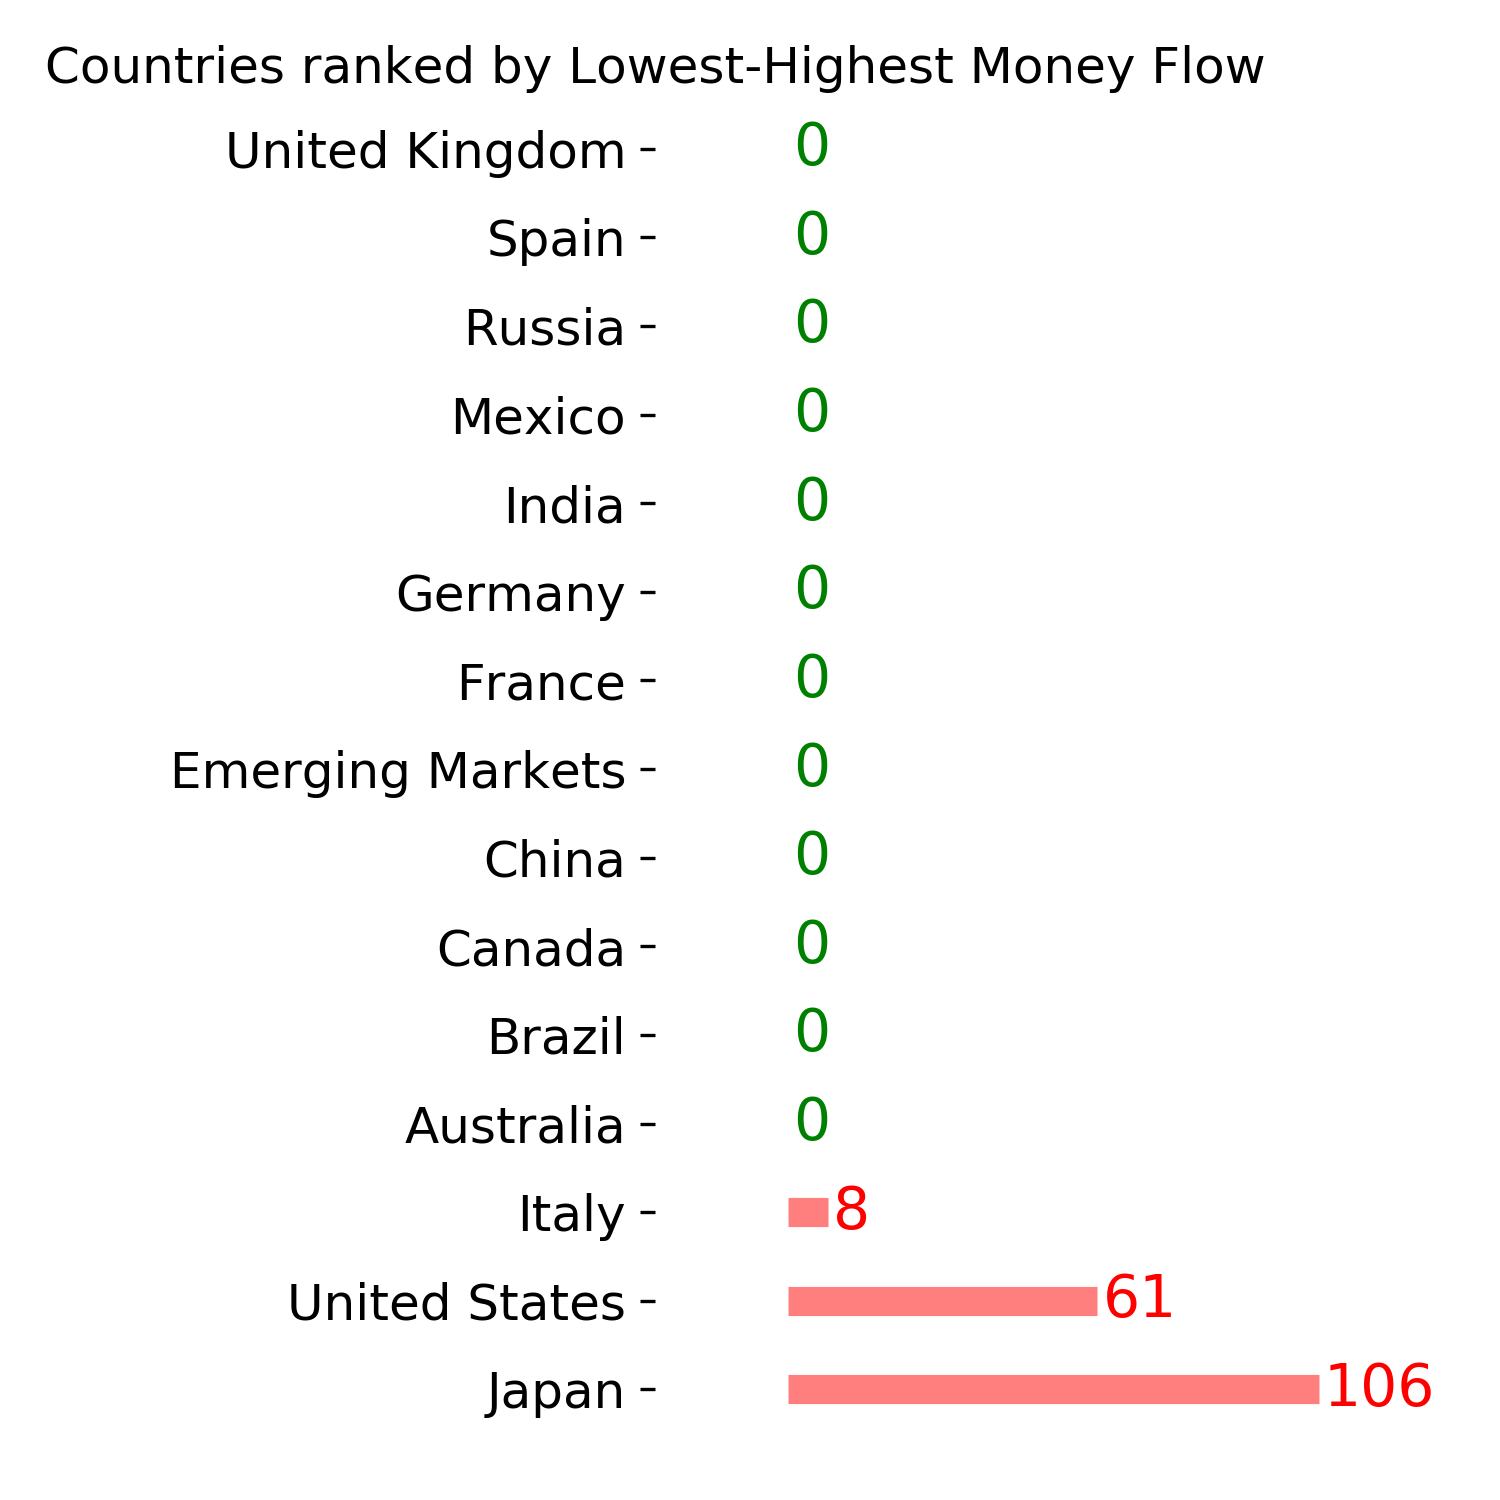
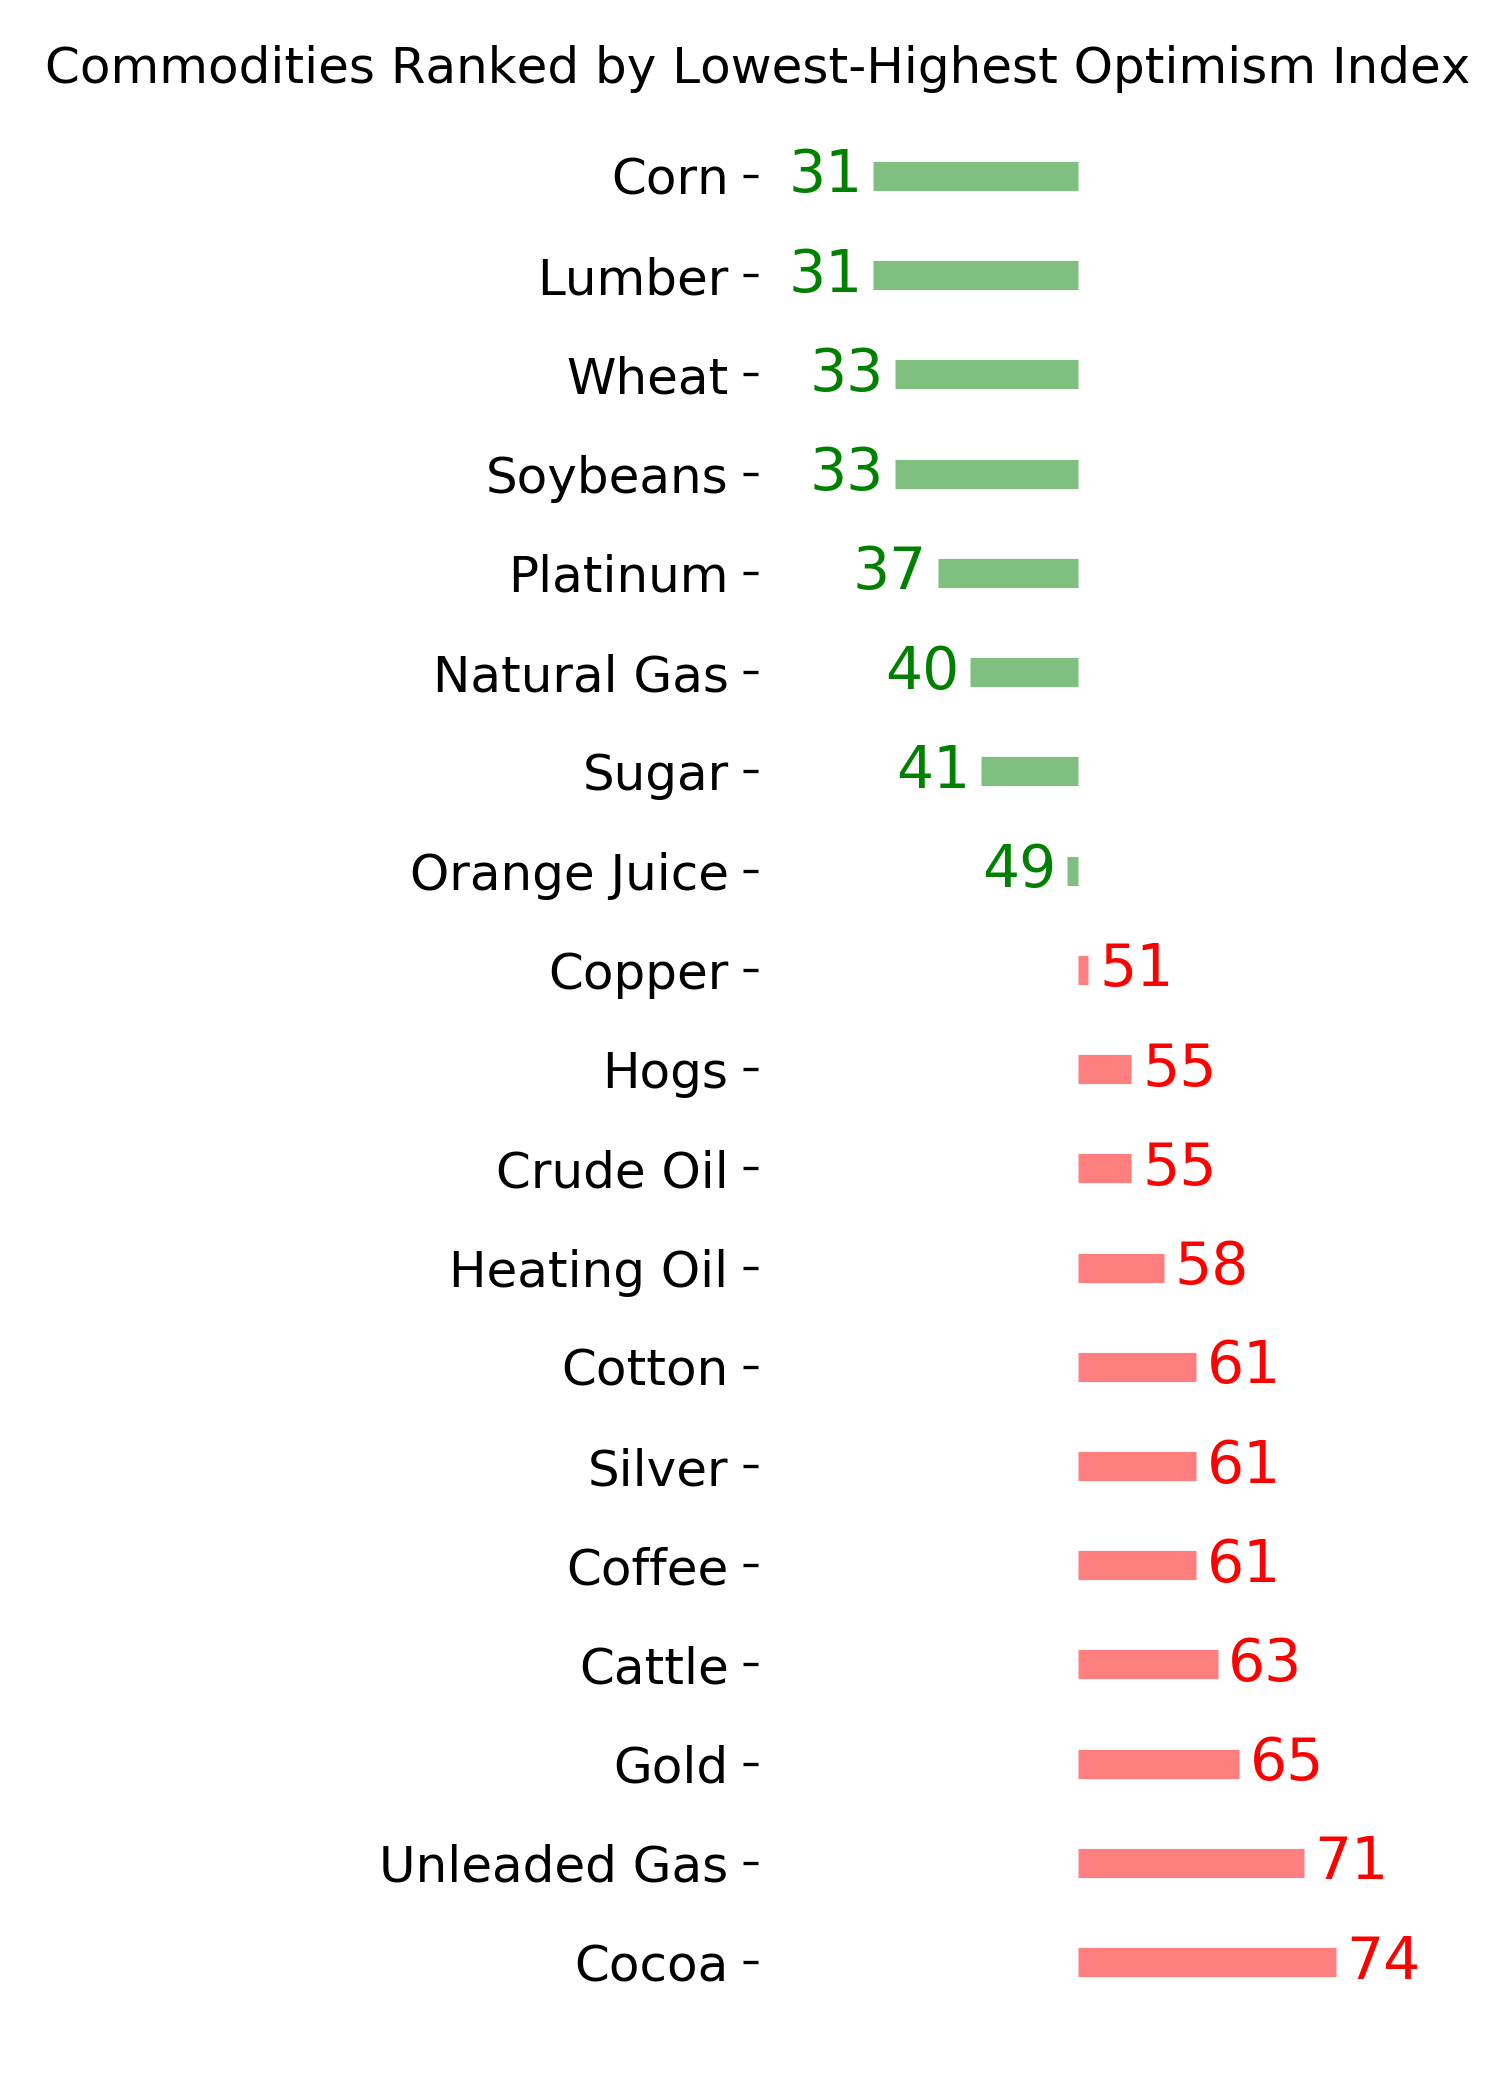
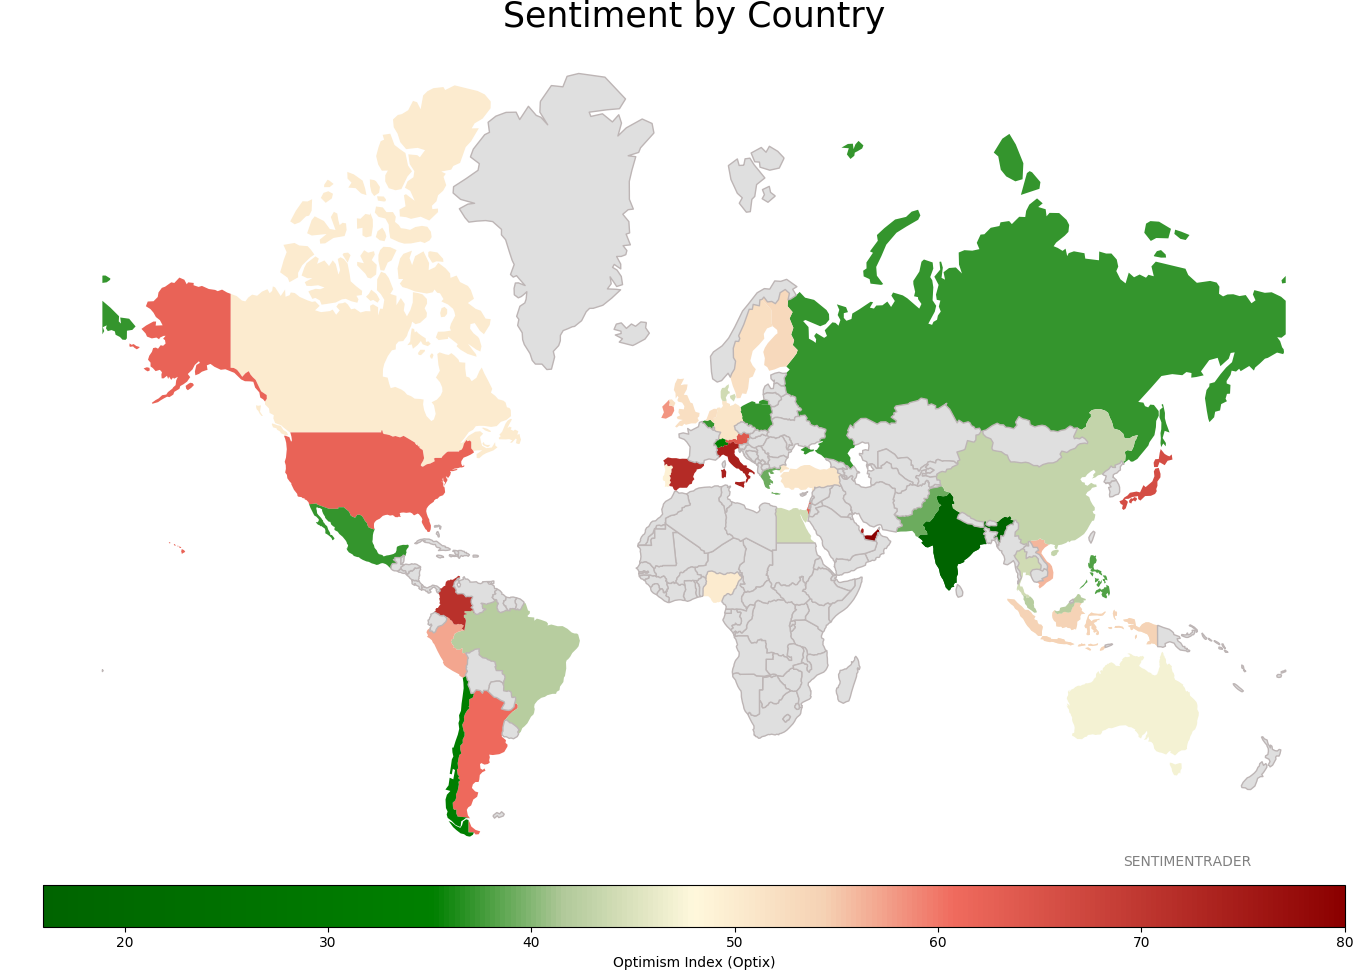
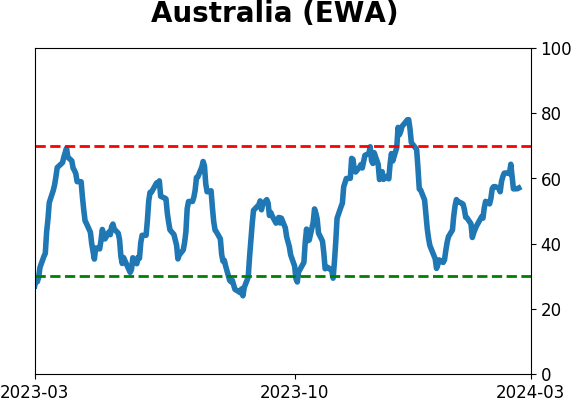
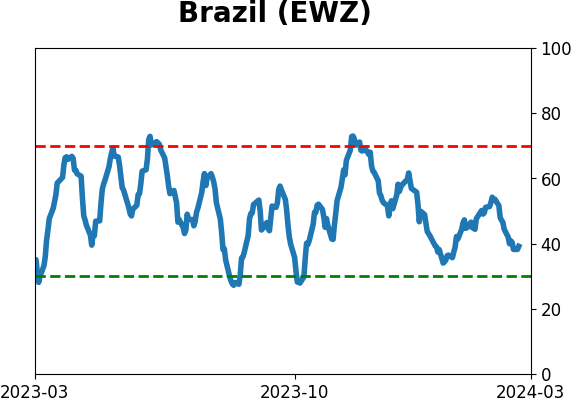
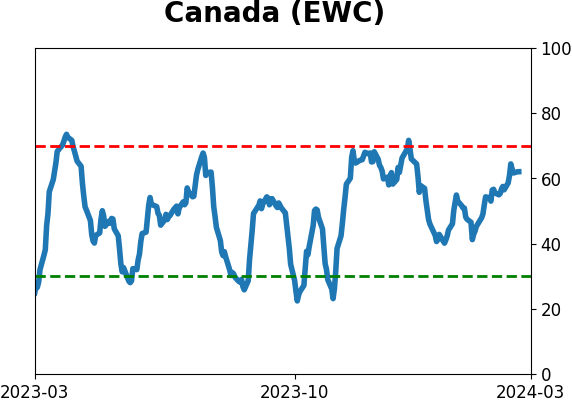
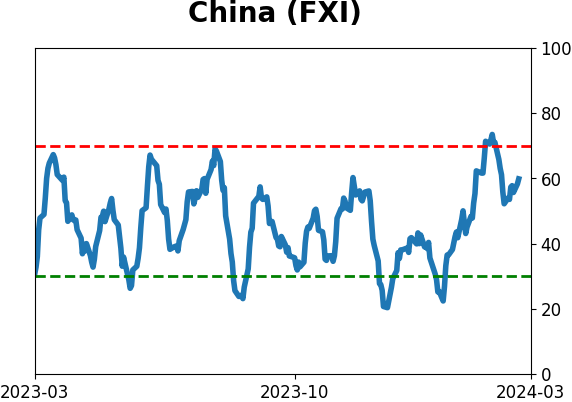
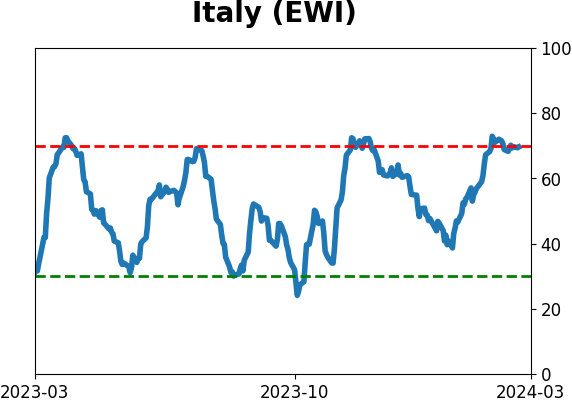
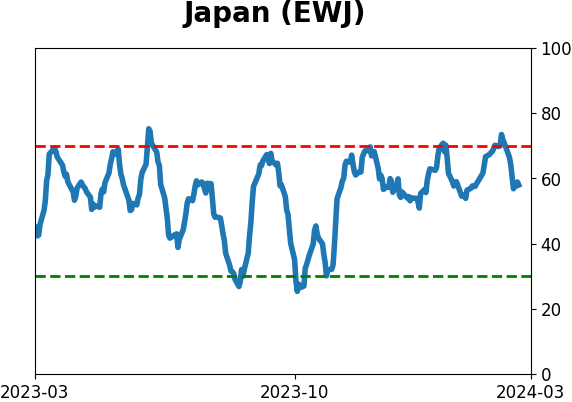
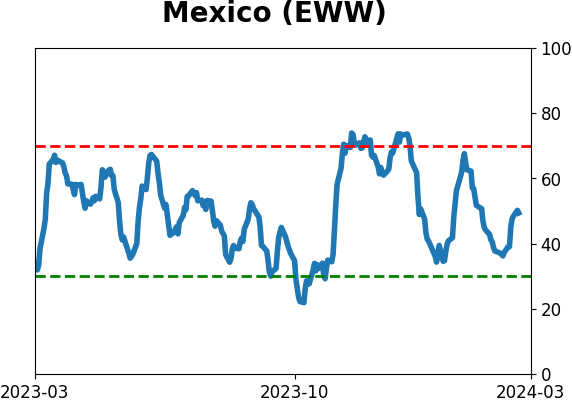
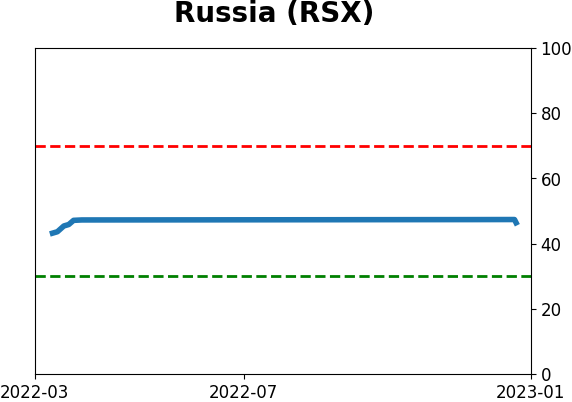
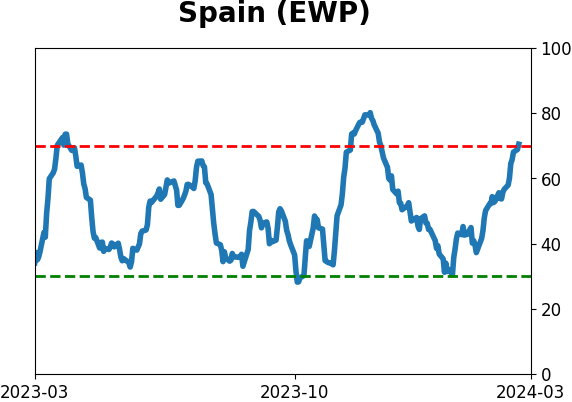
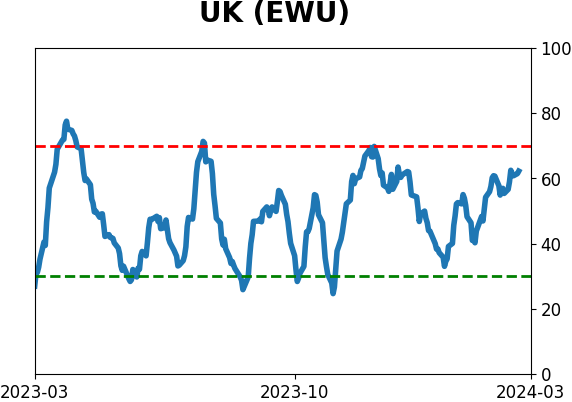
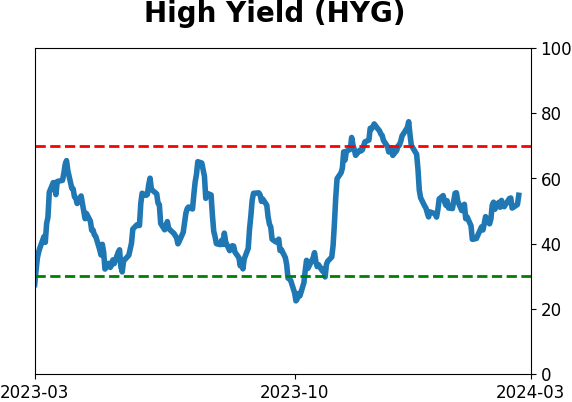
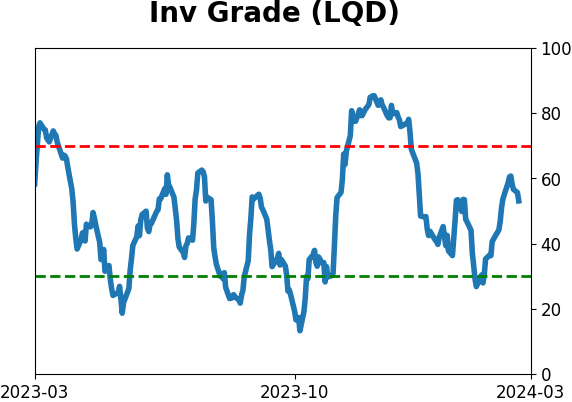
Sentiment Around The World
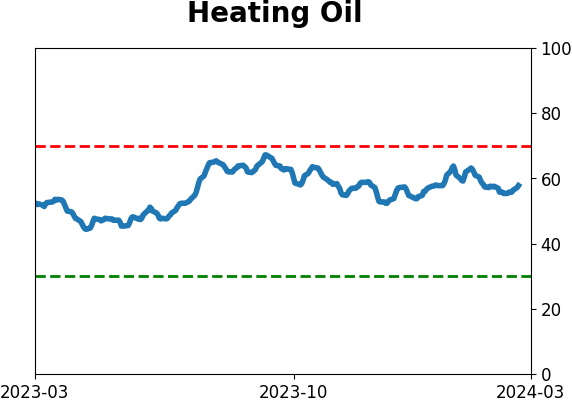
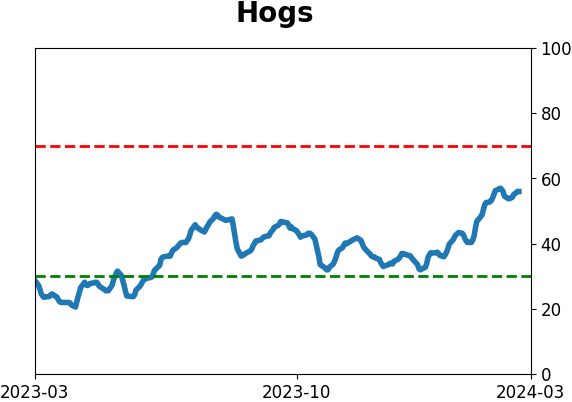
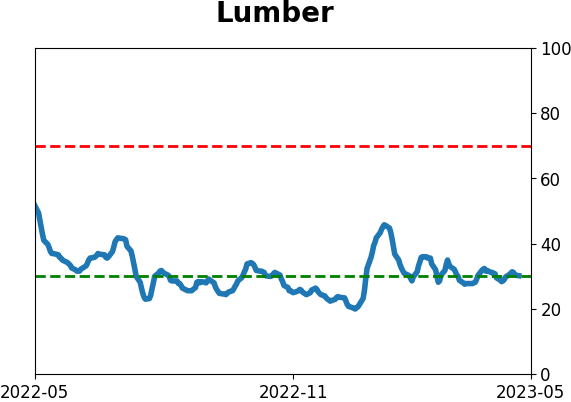
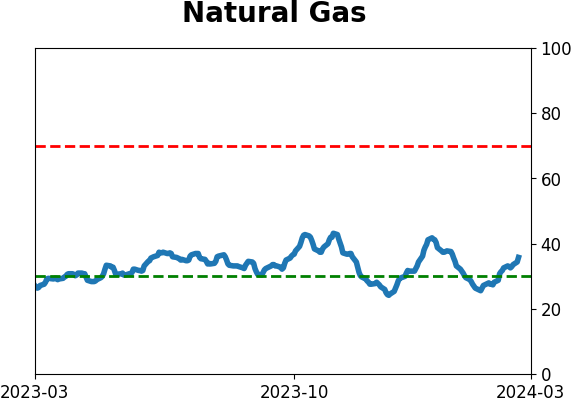
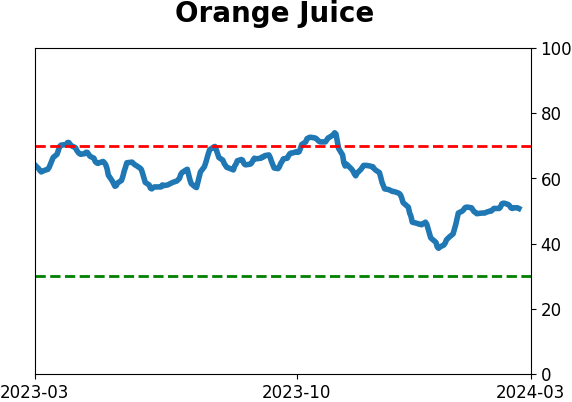
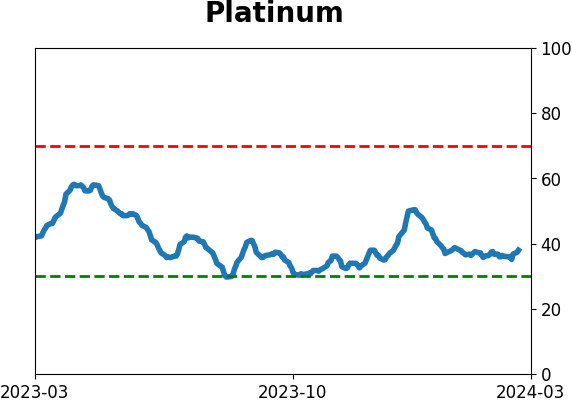
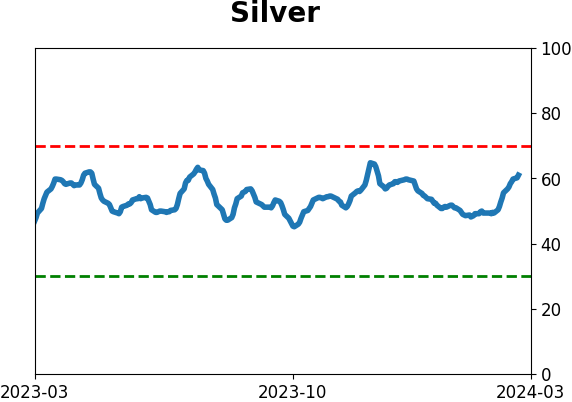
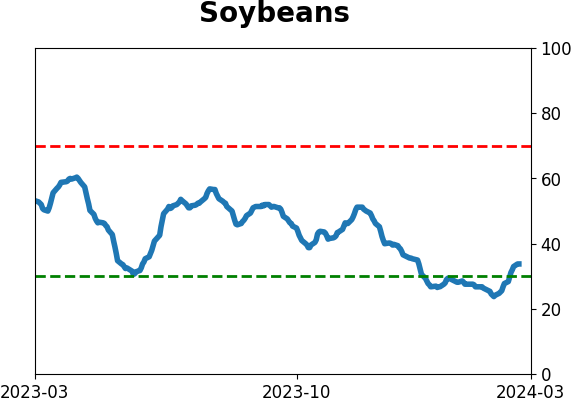
Optimism Index Thumbnails
|
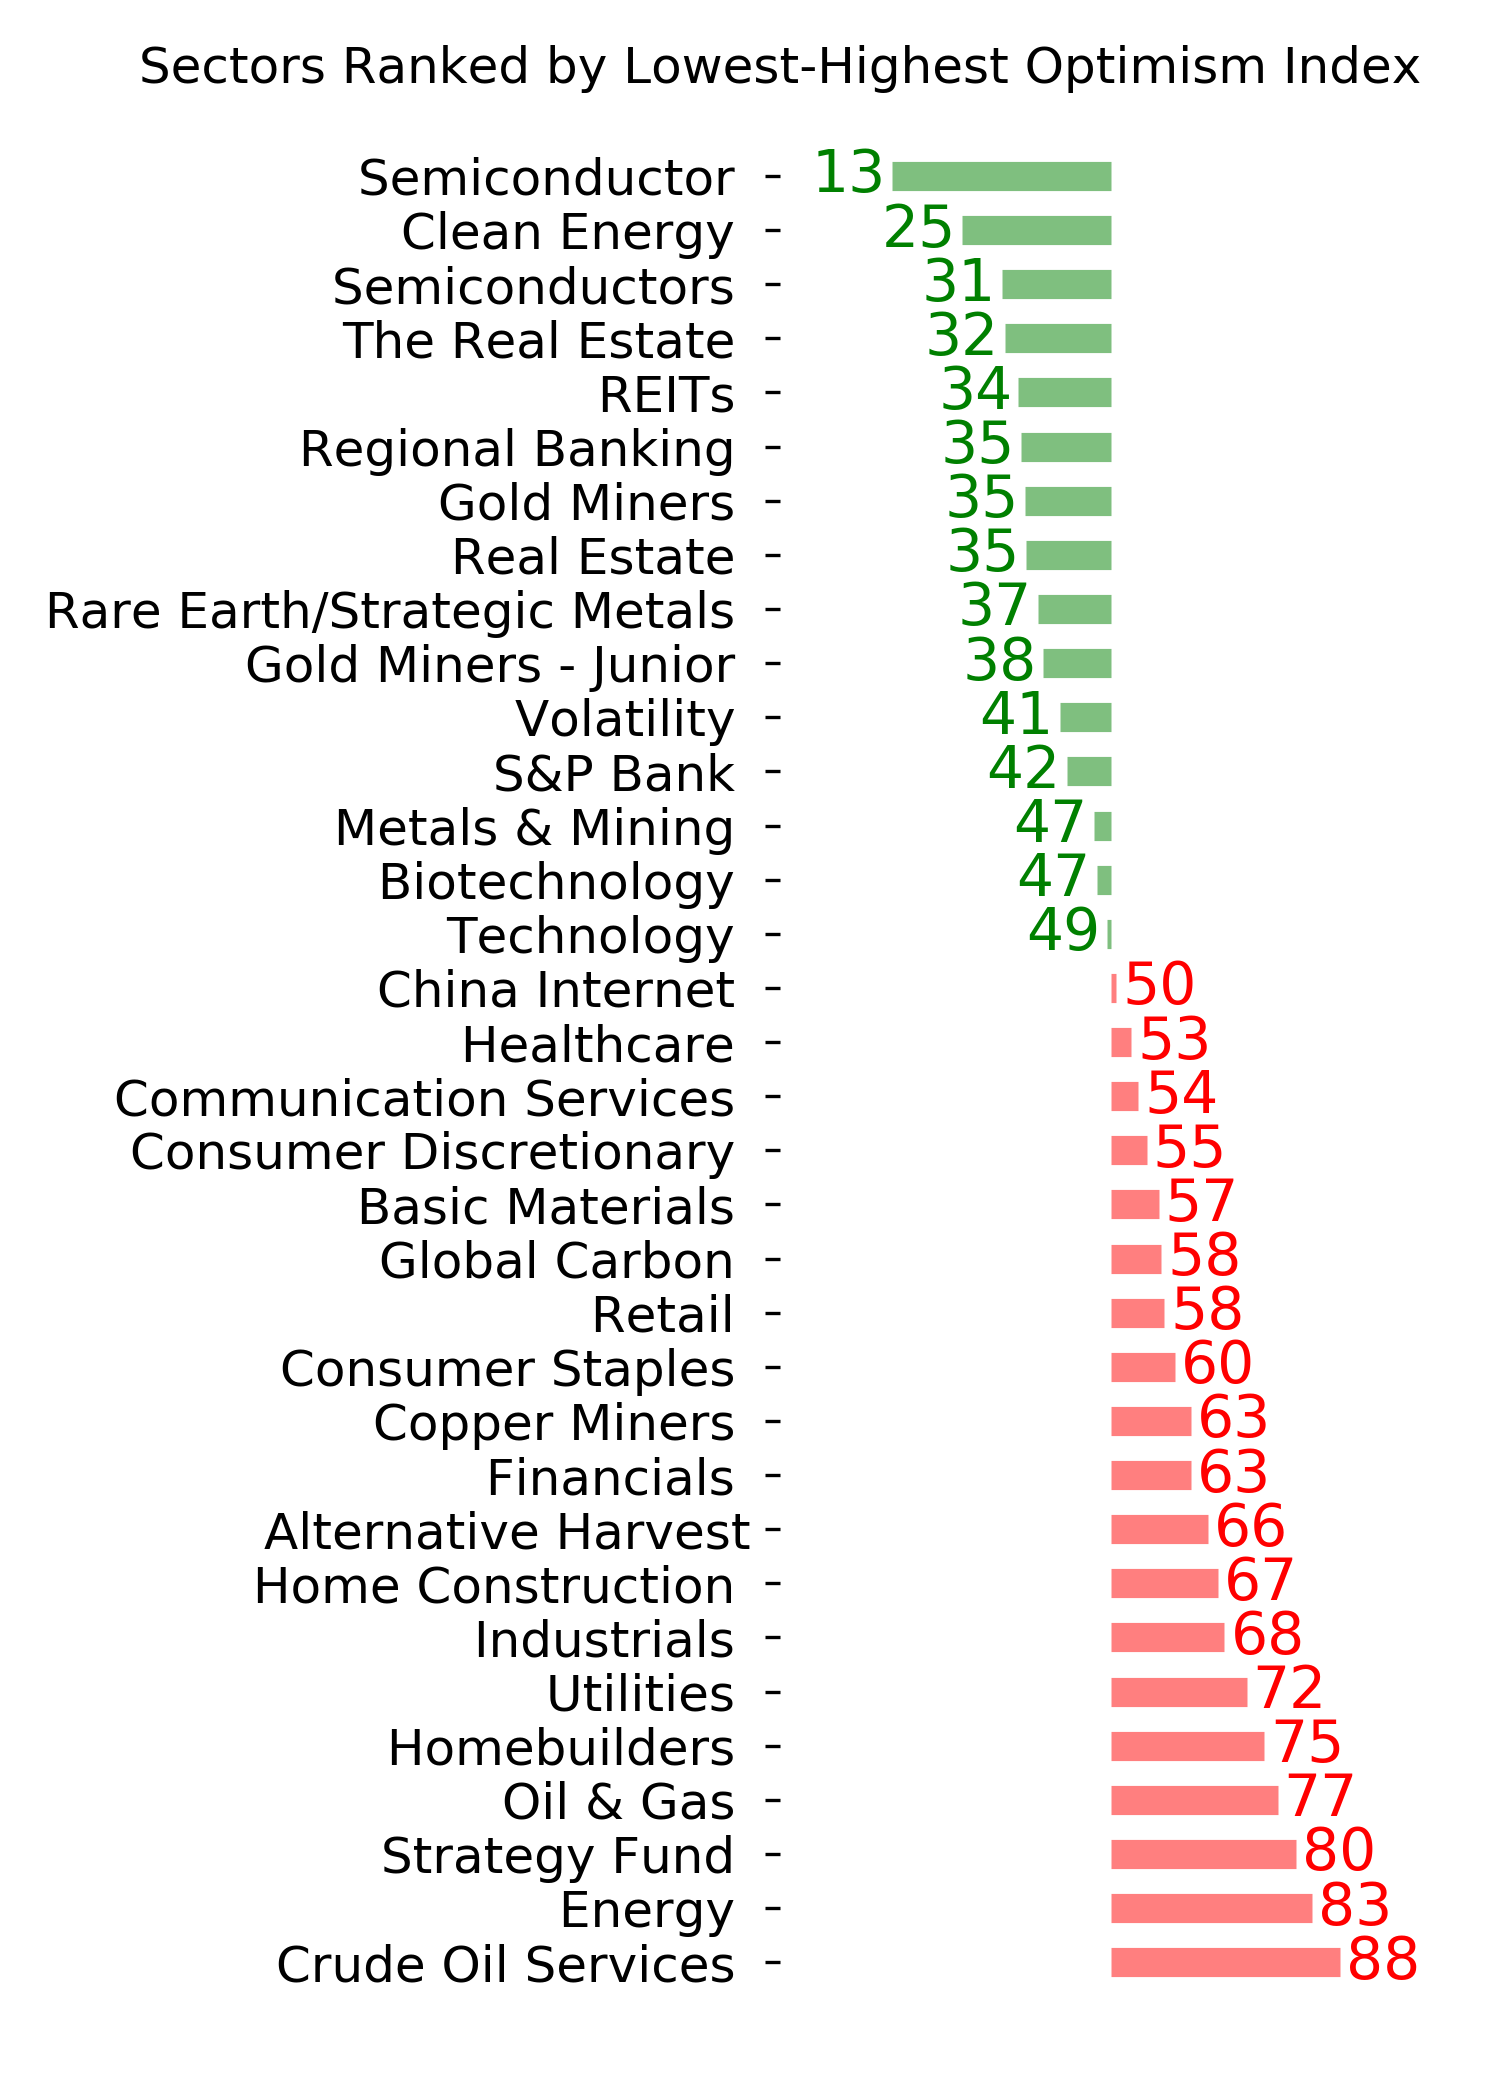
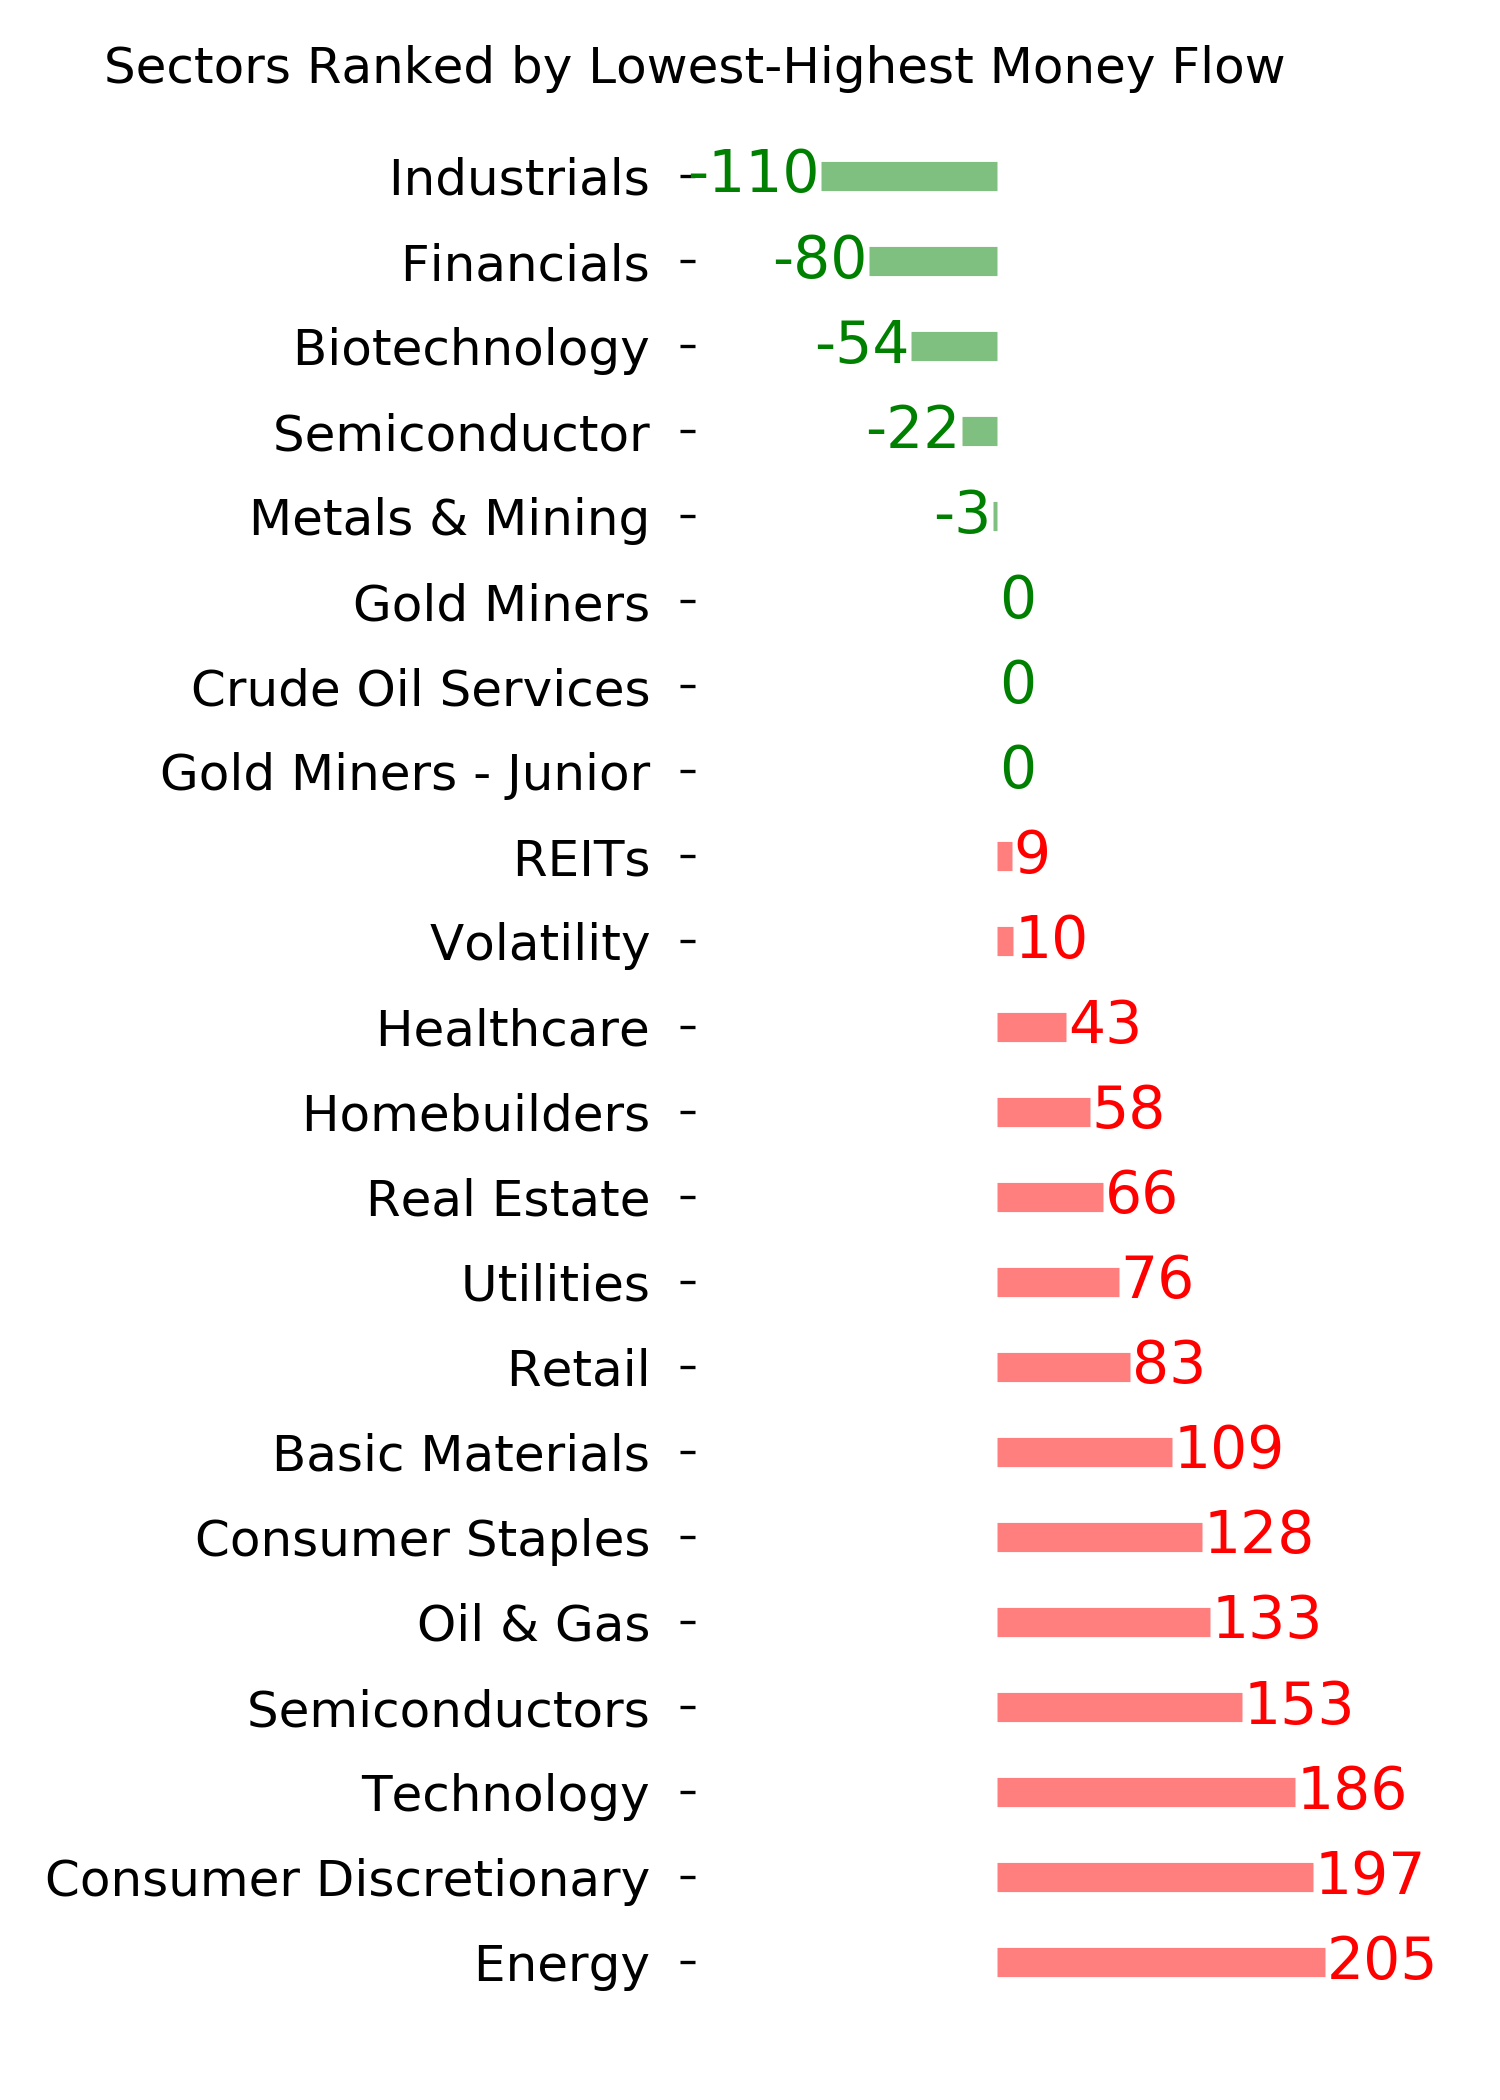
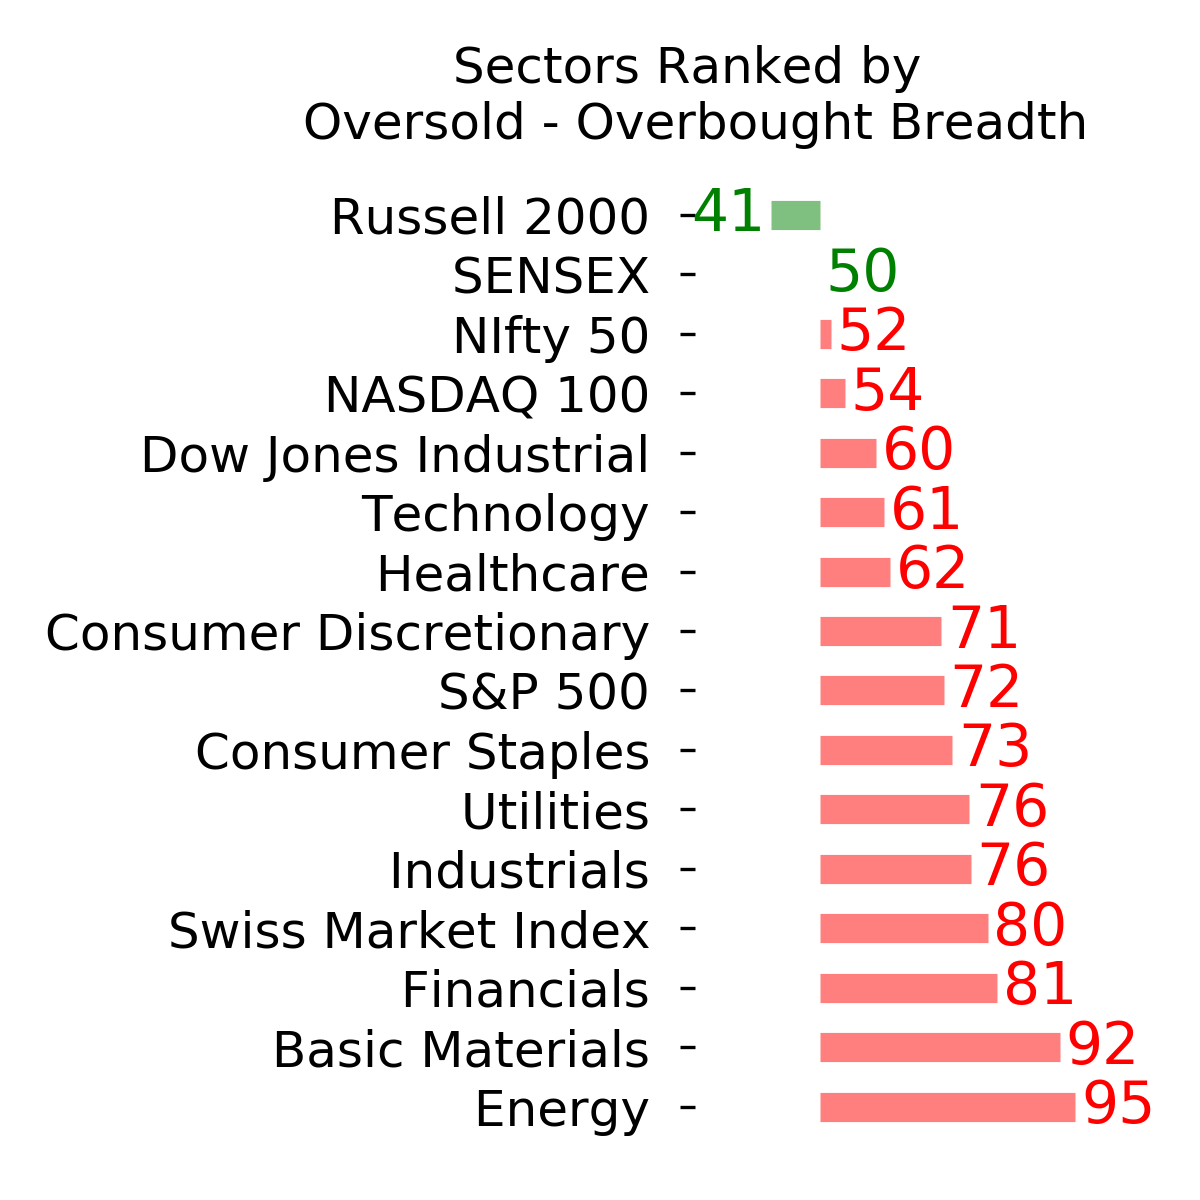
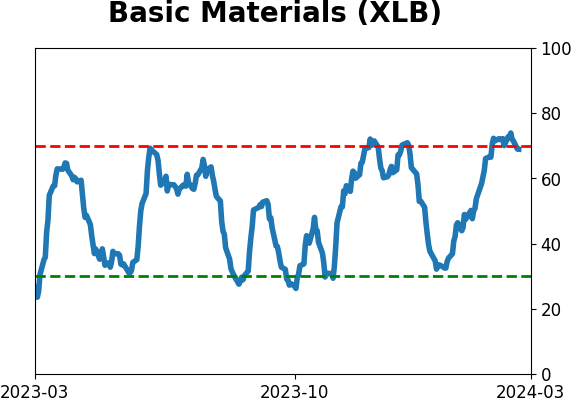
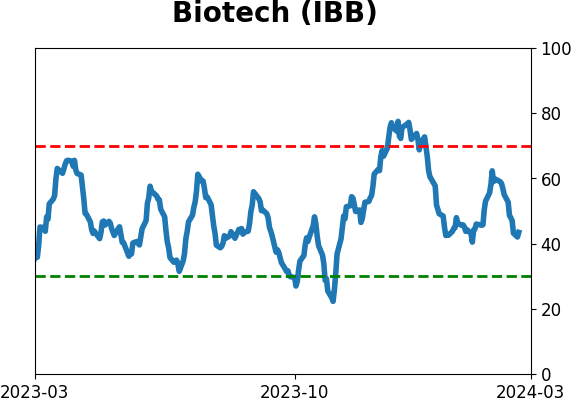
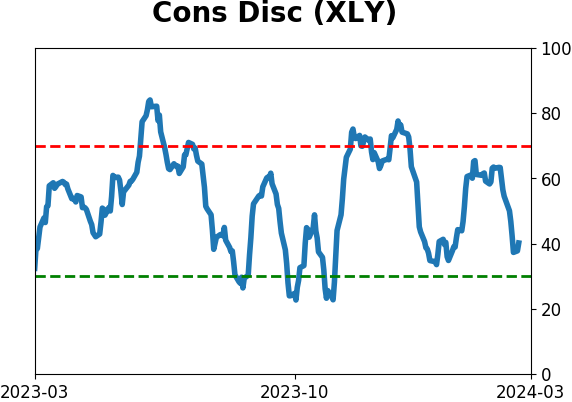
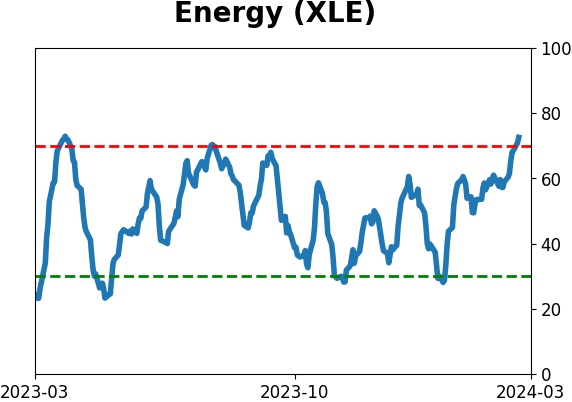
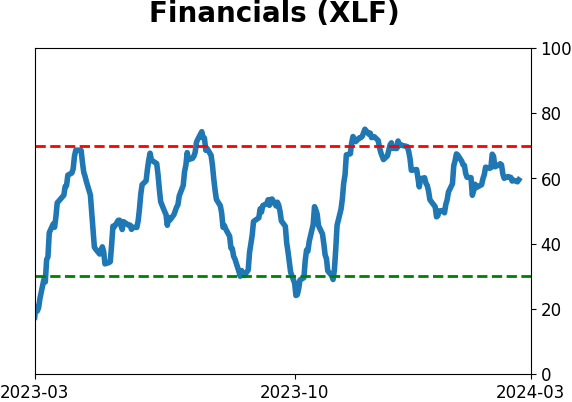
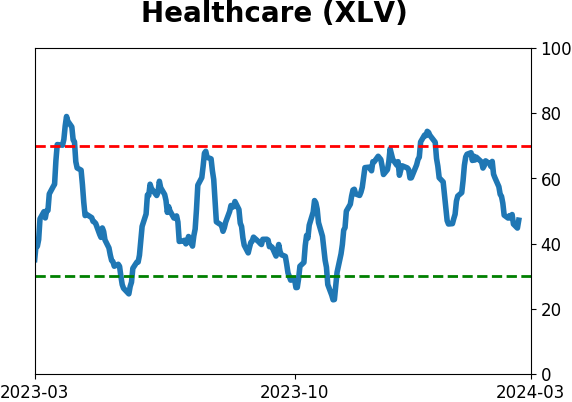
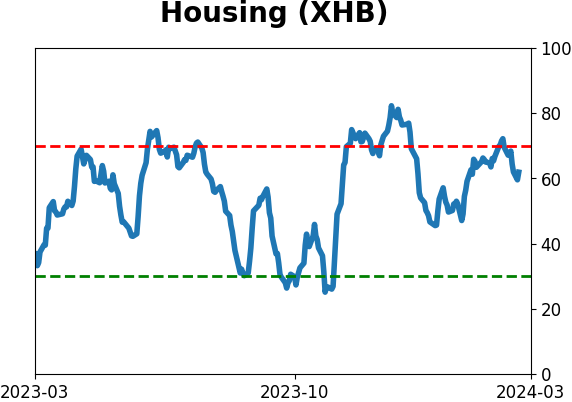
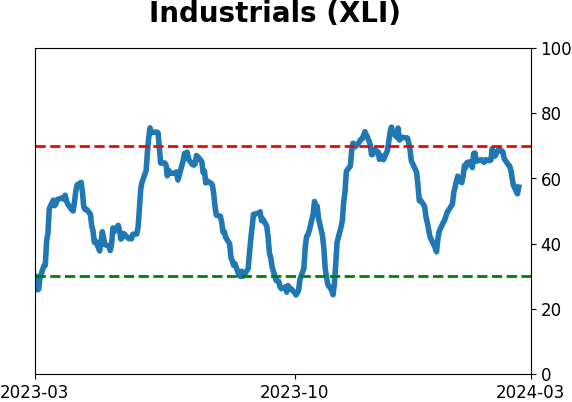
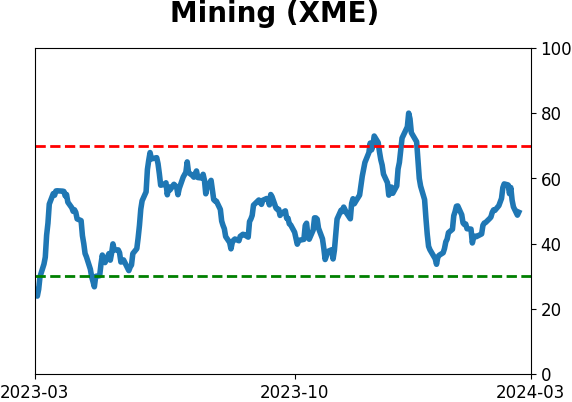
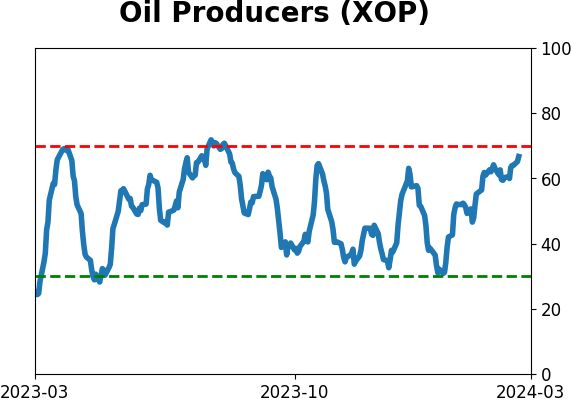
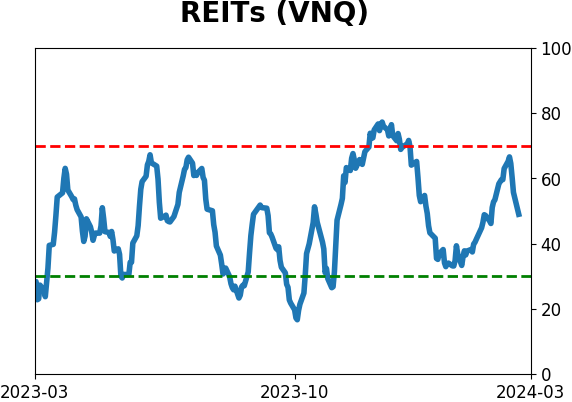
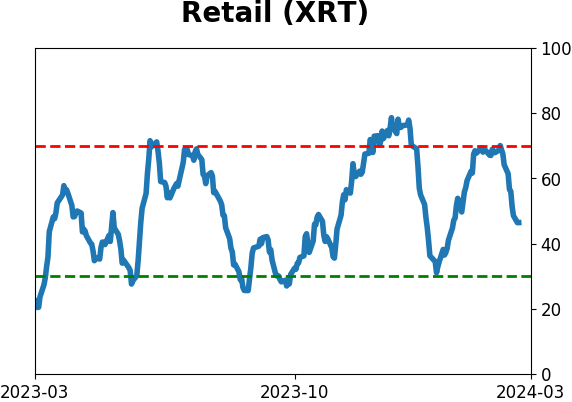
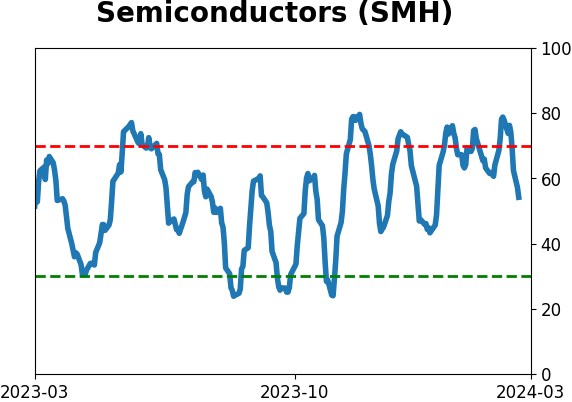
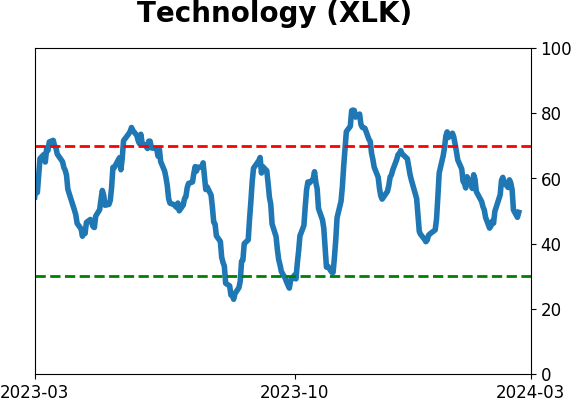
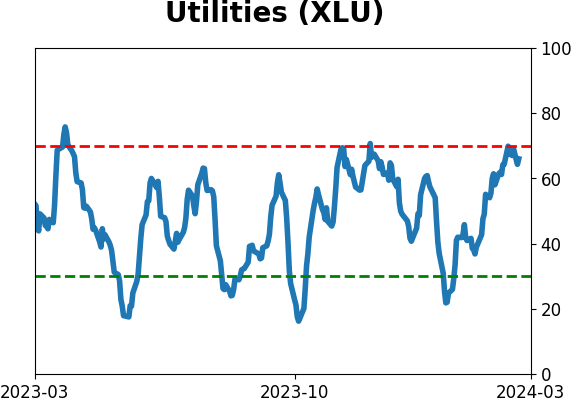
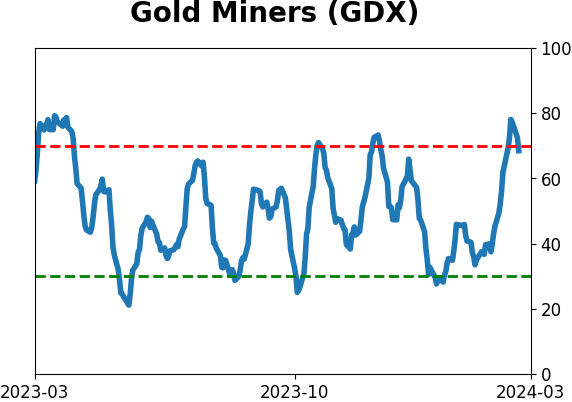
Sector ETF's - 10-Day Moving Average
|
|
|
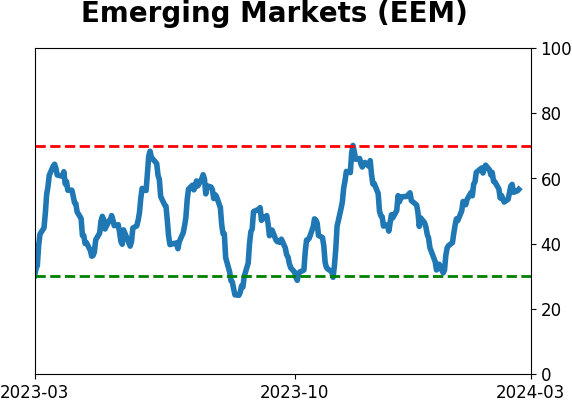
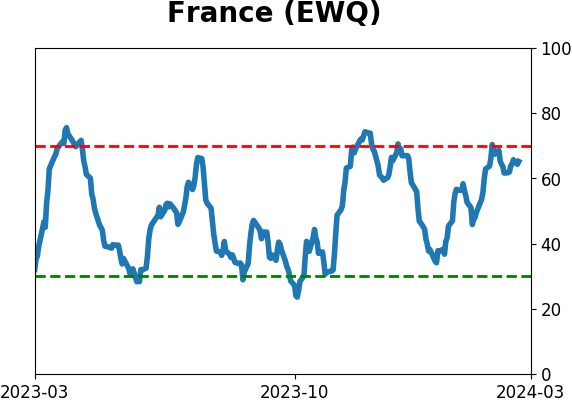
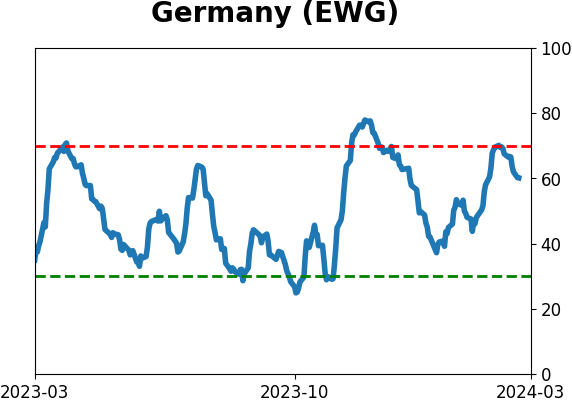
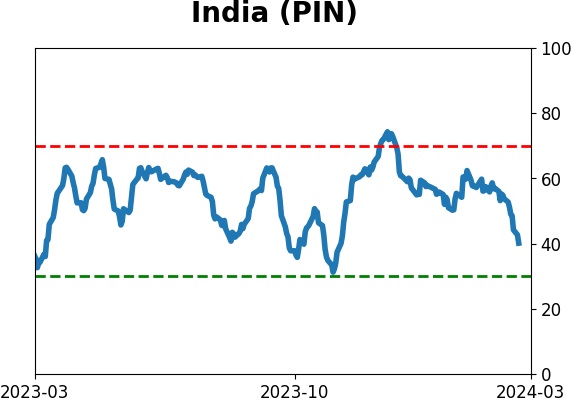
Country ETF's - 10-Day Moving Average
|
|
|
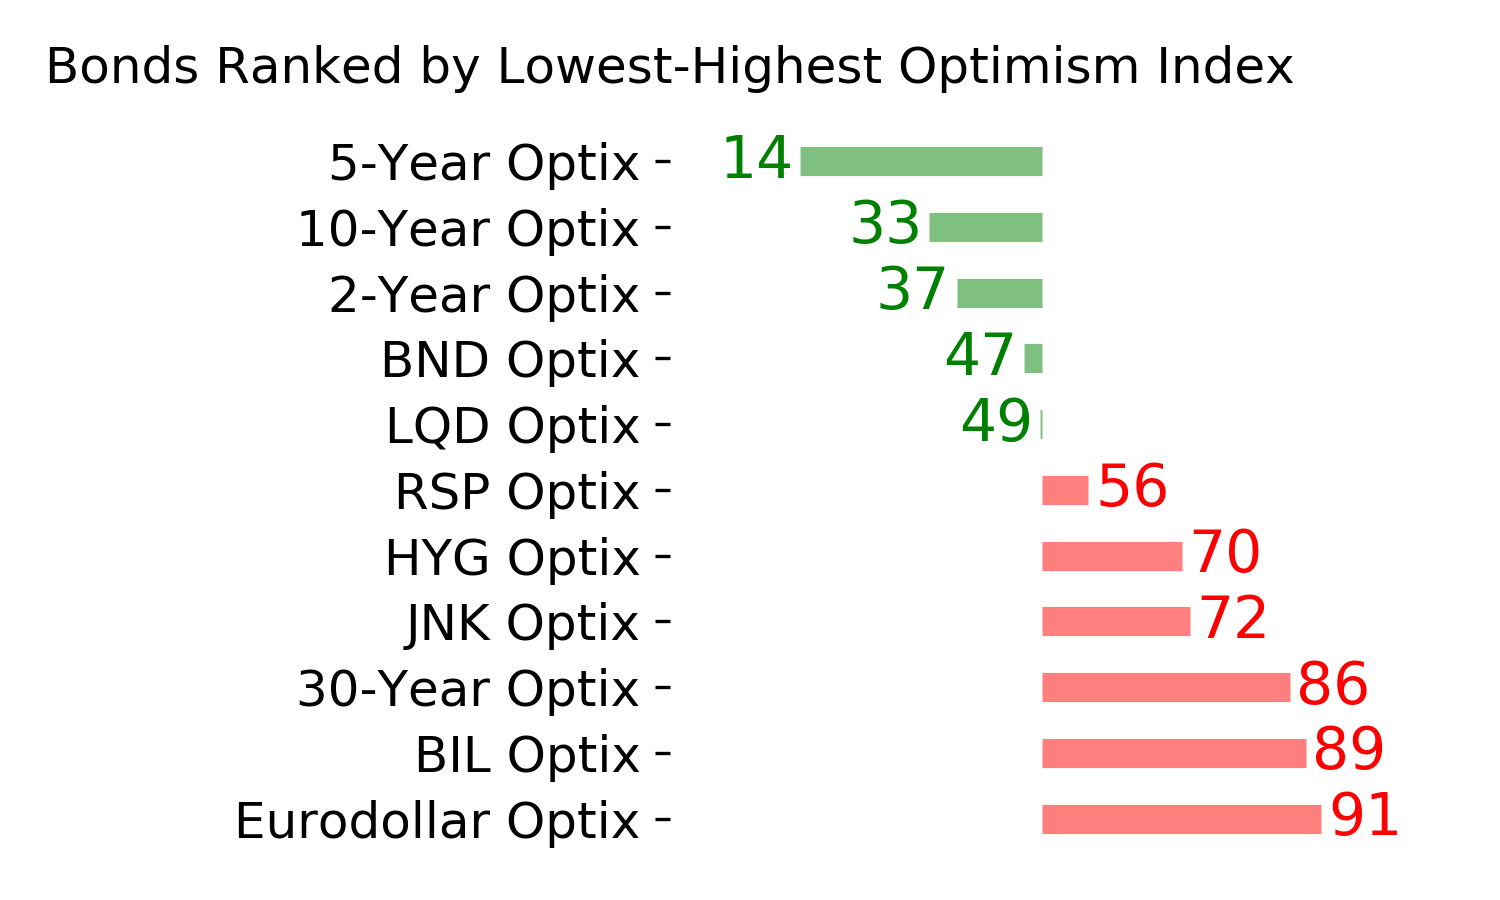
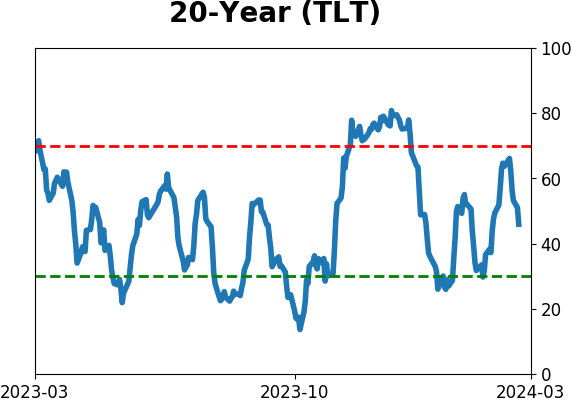
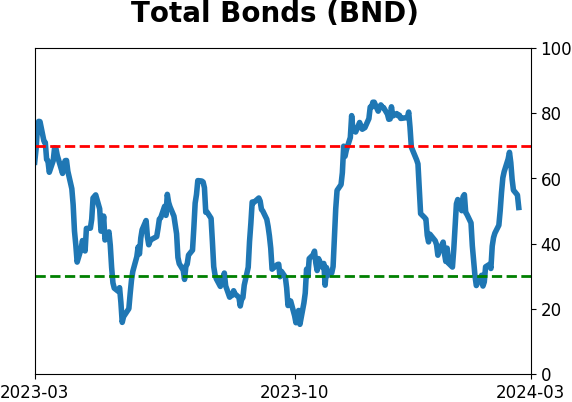
Bond ETF's - 10-Day Moving Average
|
|
|
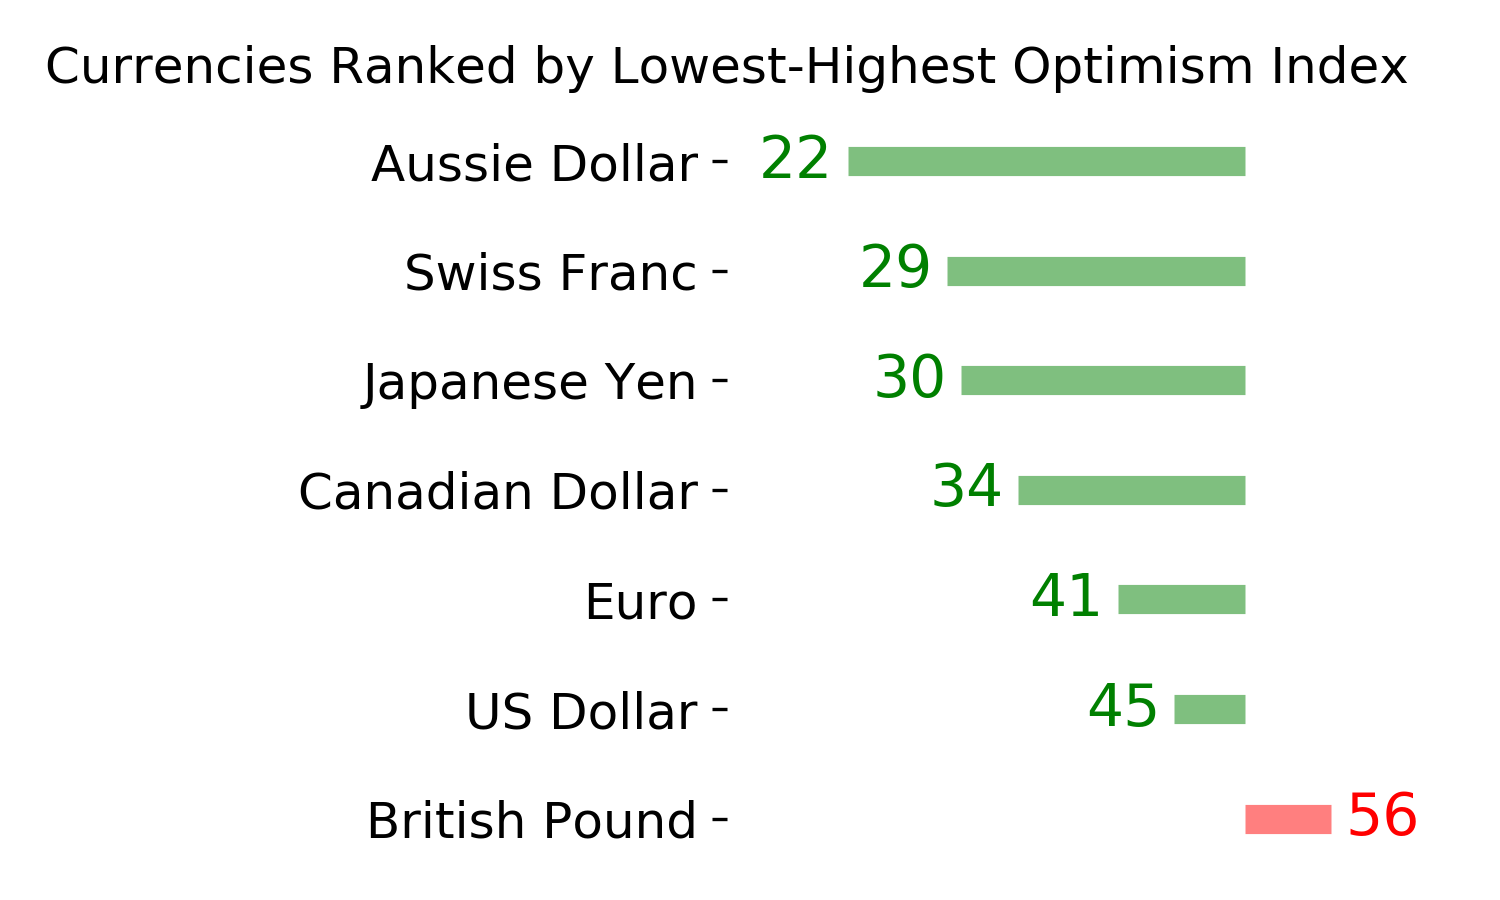
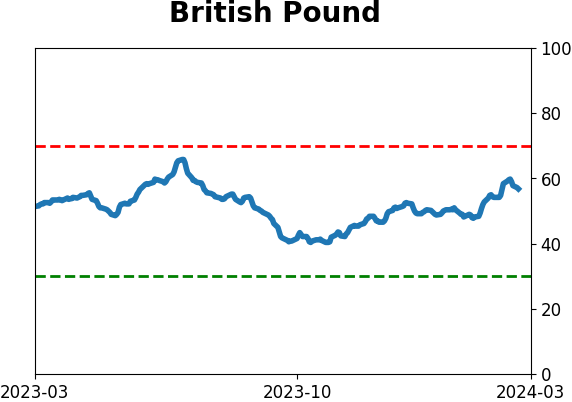
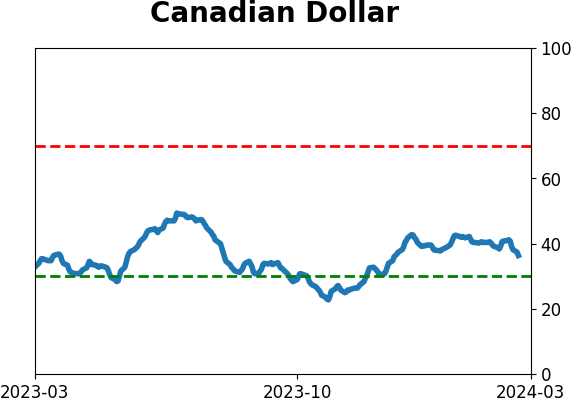
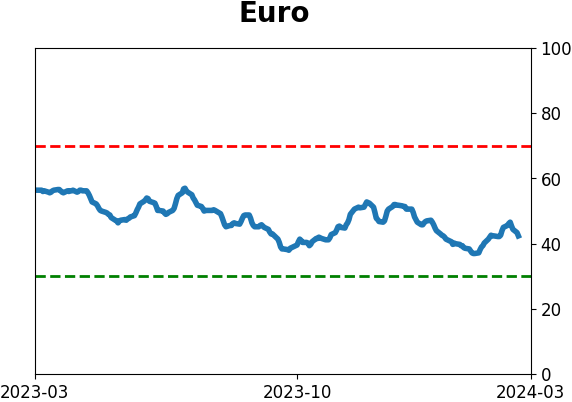
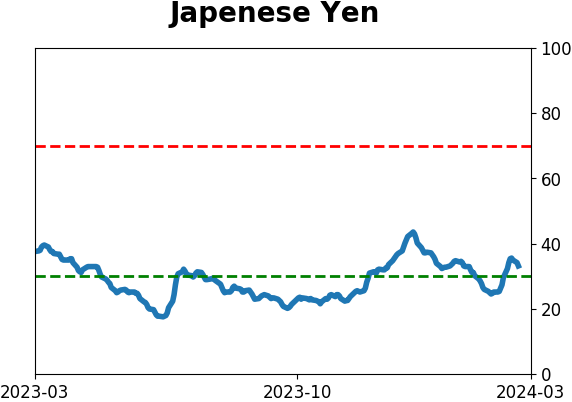
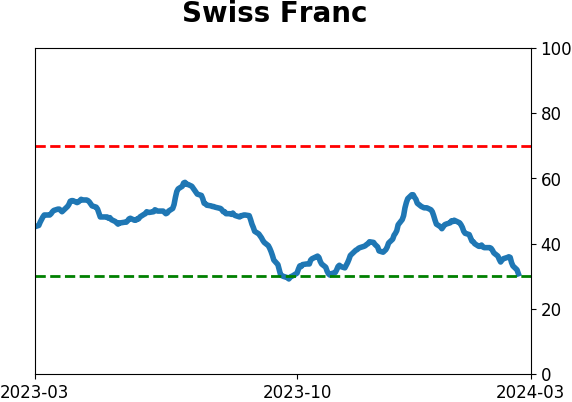
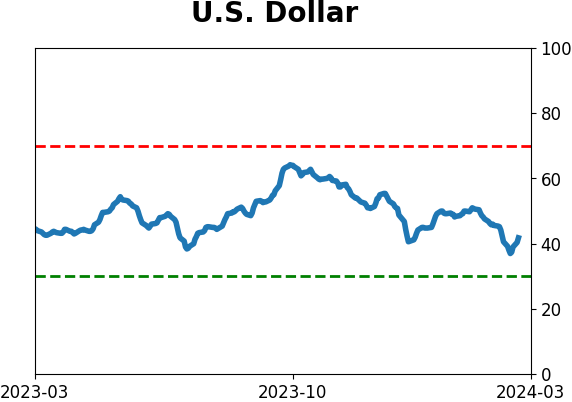
Currency ETF's - 5-Day Moving Average
|
|
|
Commodity ETF's - 5-Day Moving Average
|
|