Headlines
|
|
Big tech's strong and quiet rally:
The rally in big tech stocks over the past 90 days has propelled the Nasdaq 100 to strong average daily gains without much volatility. The ratio of its daily changes to standard deviation is now at one of the highest levels in its history. Similar extremes led to six-month gains every time.
|
Smart / Dumb Money Confidence
|
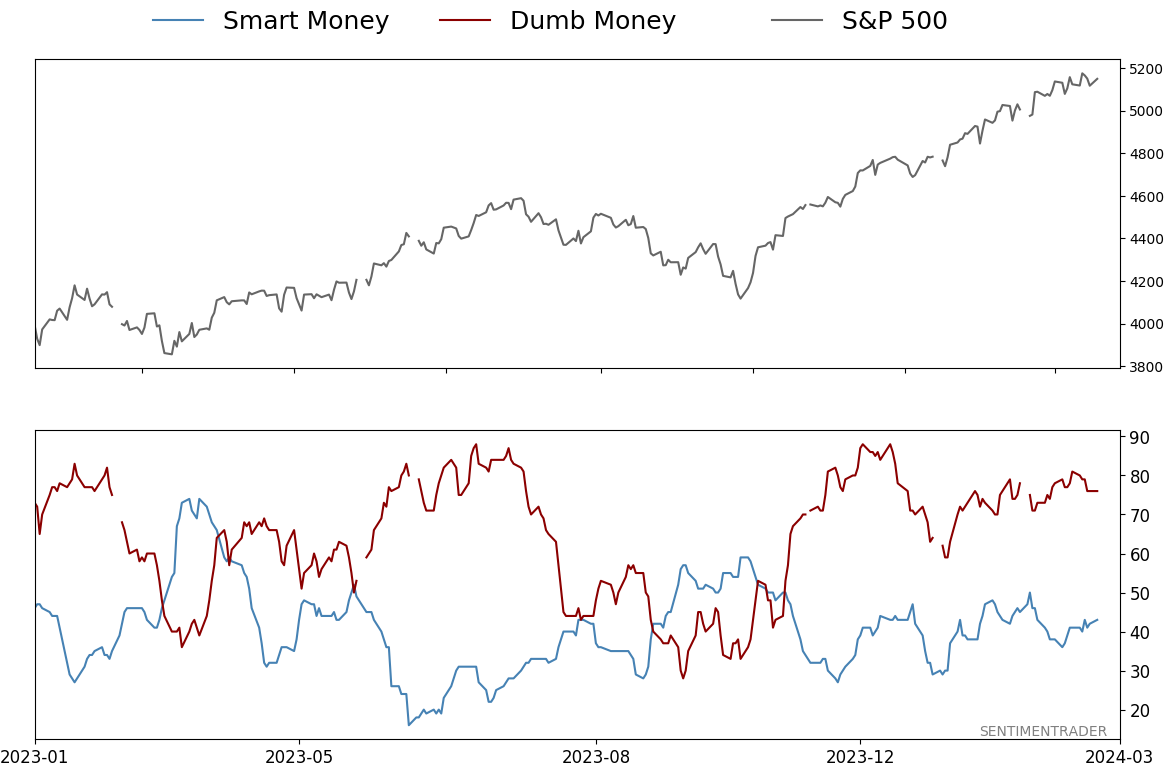
Smart Money Confidence: 43%
Dumb Money Confidence: 76%
|
|
Risk Levels
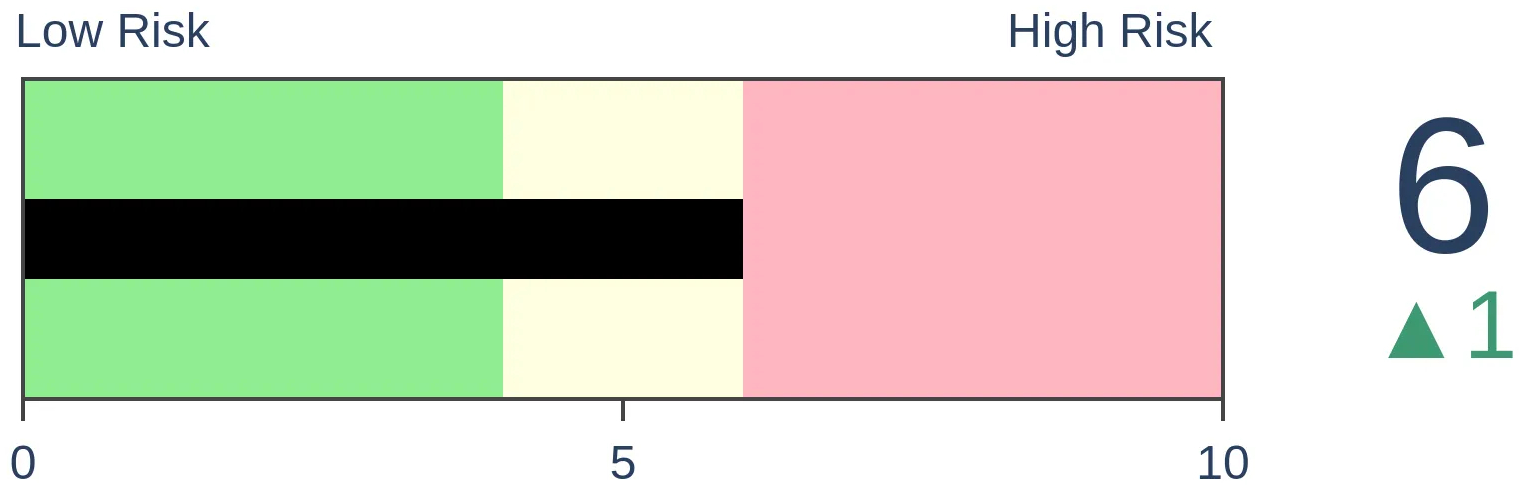
Stocks Short-Term

|
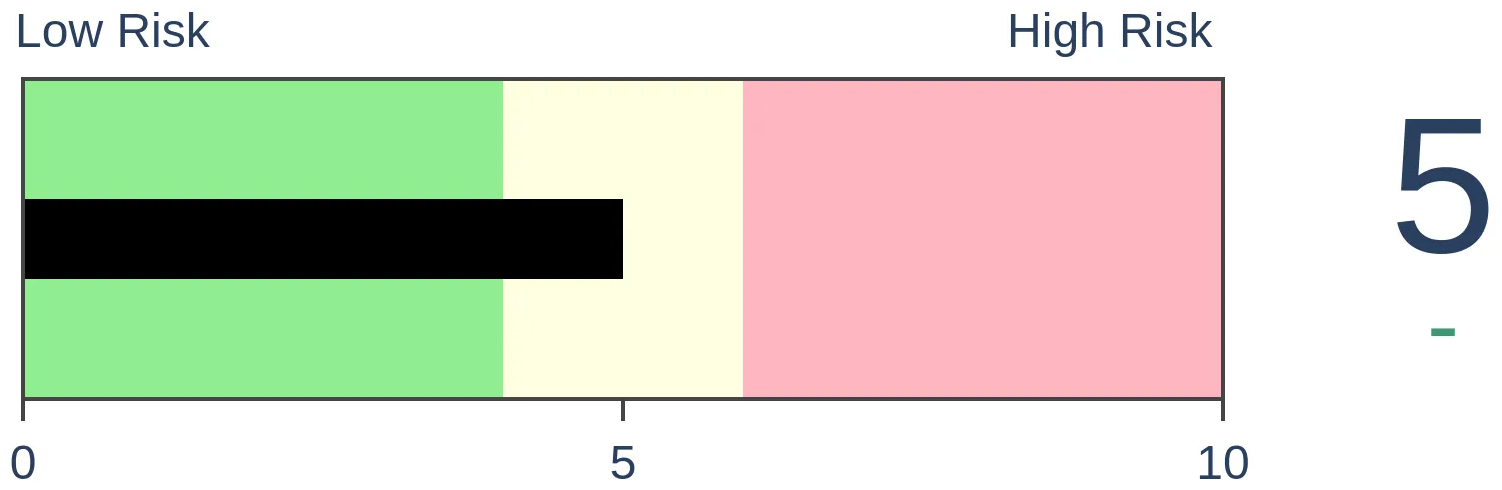
Stocks Medium-Term
|
|
Bonds
|
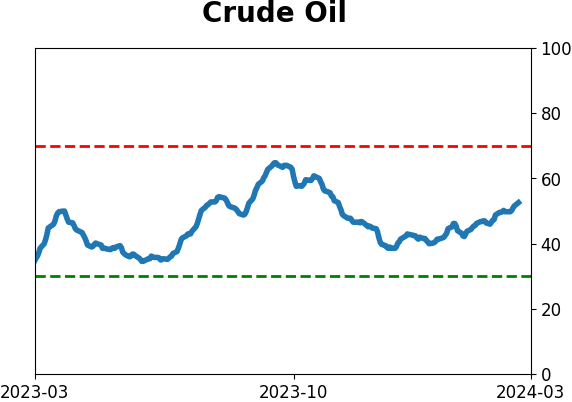
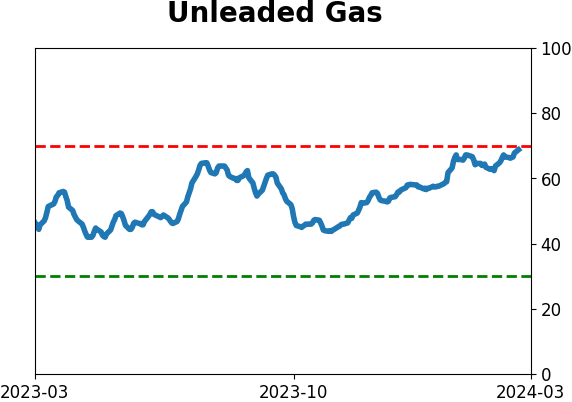
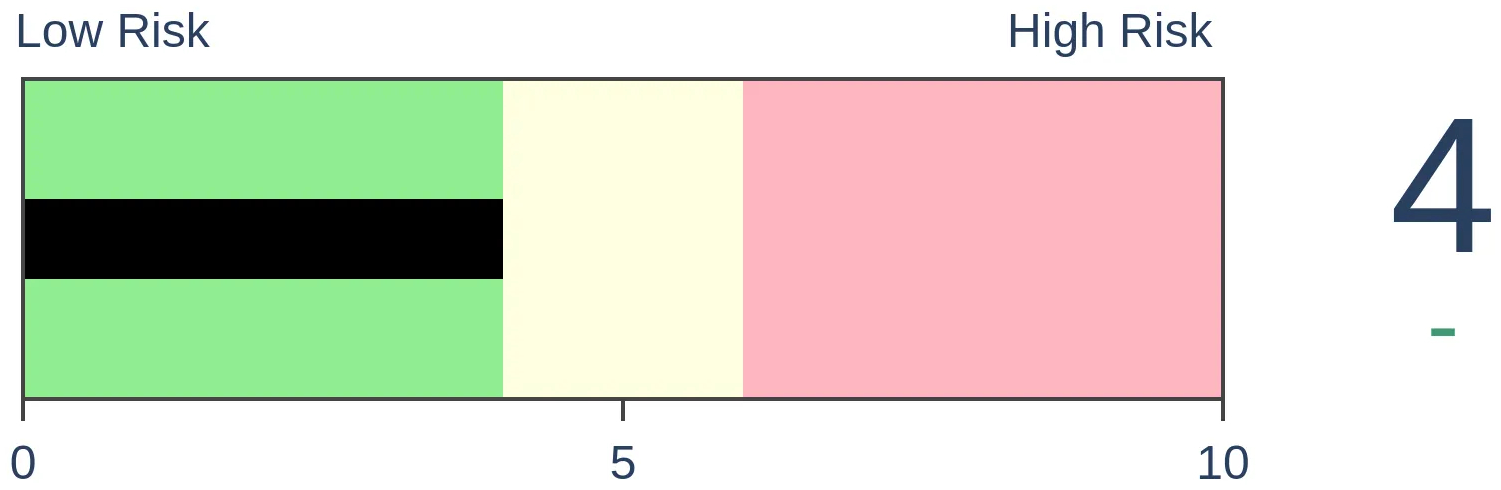
Crude Oil
|
|
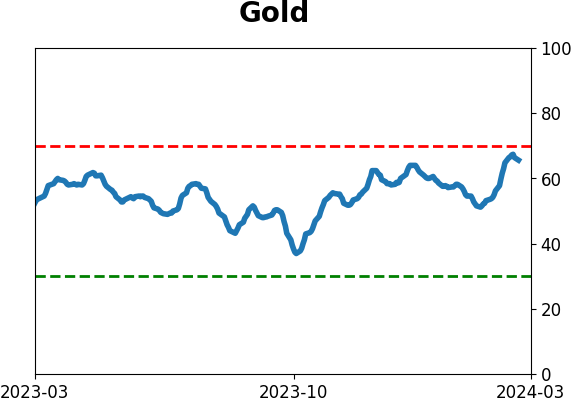
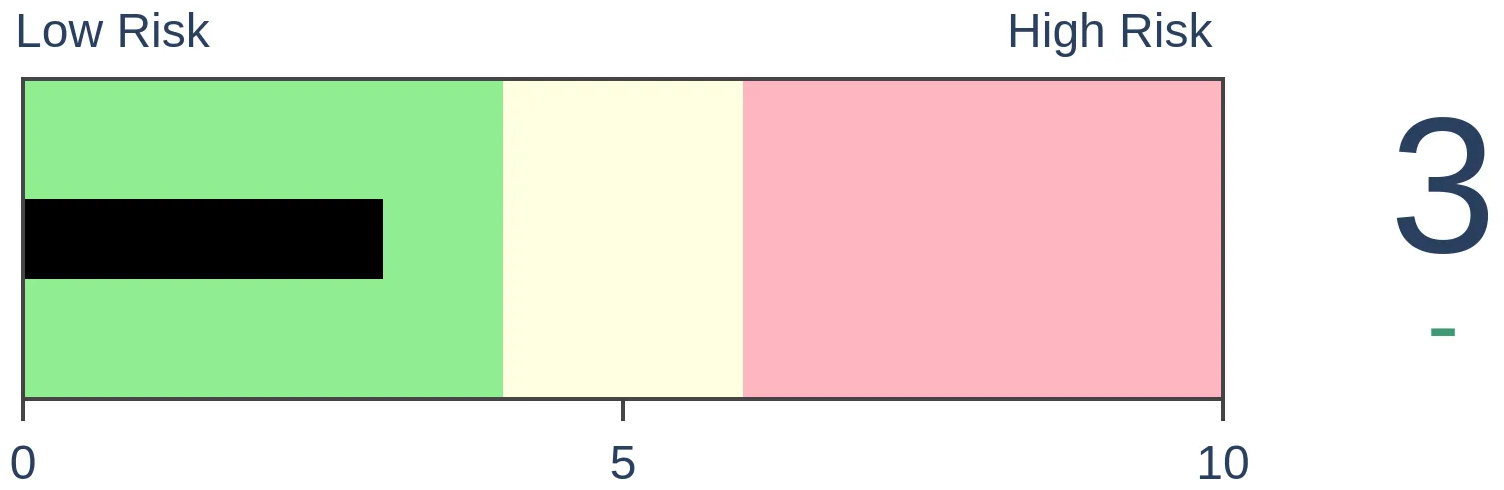
Gold
|
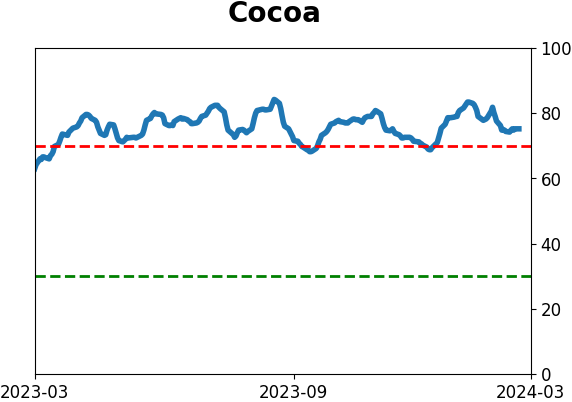
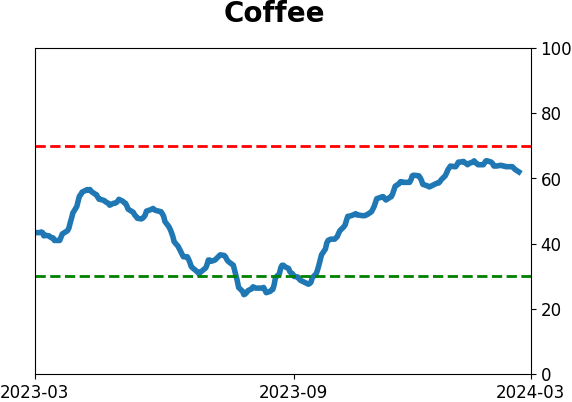
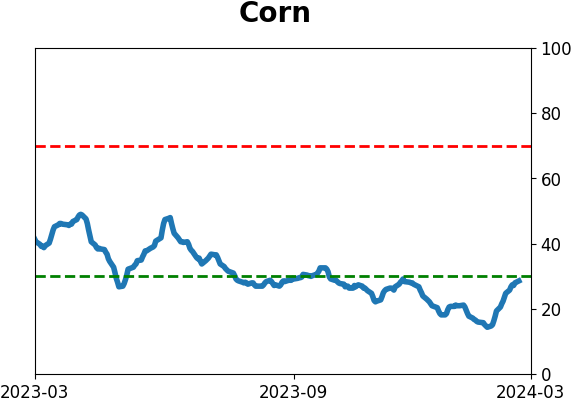
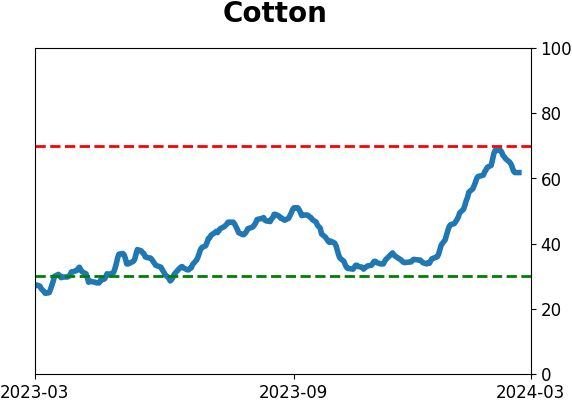
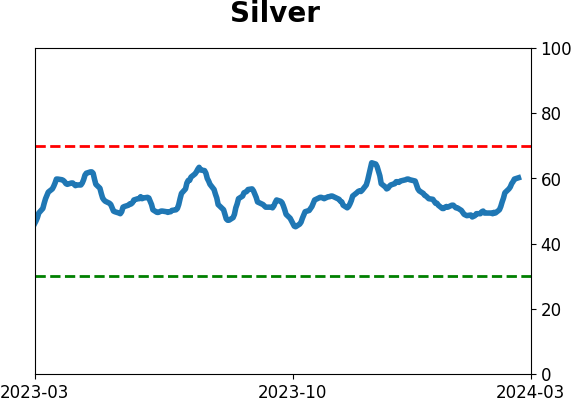
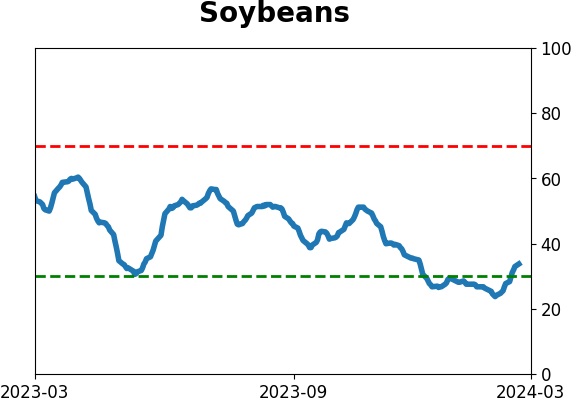
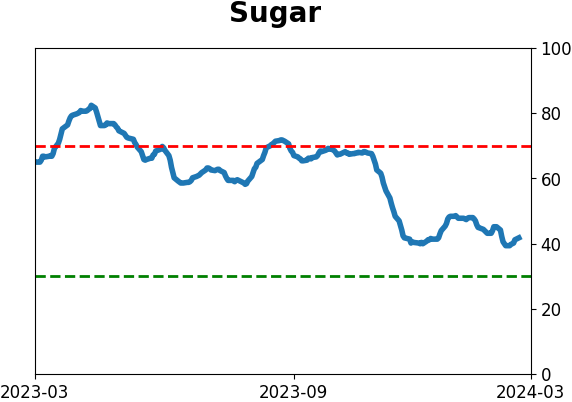
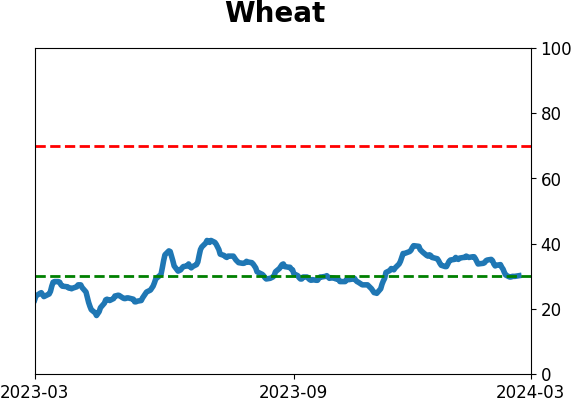
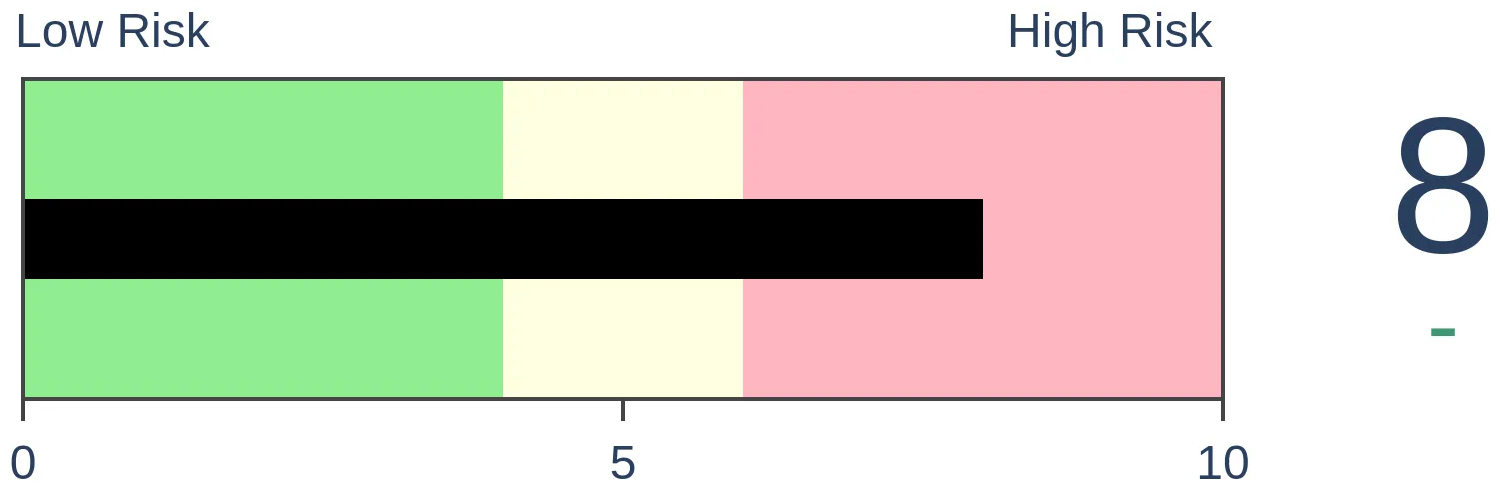
Agriculture
|
|
Research
By Jason Goepfert
BOTTOM LINE
The rally in big tech stocks over the past 90 days has propelled the Nasdaq 100 to strong average daily gains without much volatility. The ratio of its daily changes to standard deviation is now at one of the highest levels in its history. Similar extremes led to six-month gains every time.
FORECAST / TIMEFRAME
None
|
Key points:
- Over the past 90 days, the Nasdaq 100 has enjoyed large average daily gains without much volatility
- The ratio of average daily to change to standard deviation is now one of the highest in history
- Similar quiet uptrends may have chopped around a bit but showed a strong tendency to gain over the next six months
Big tech has enjoyed large gains without much volatility
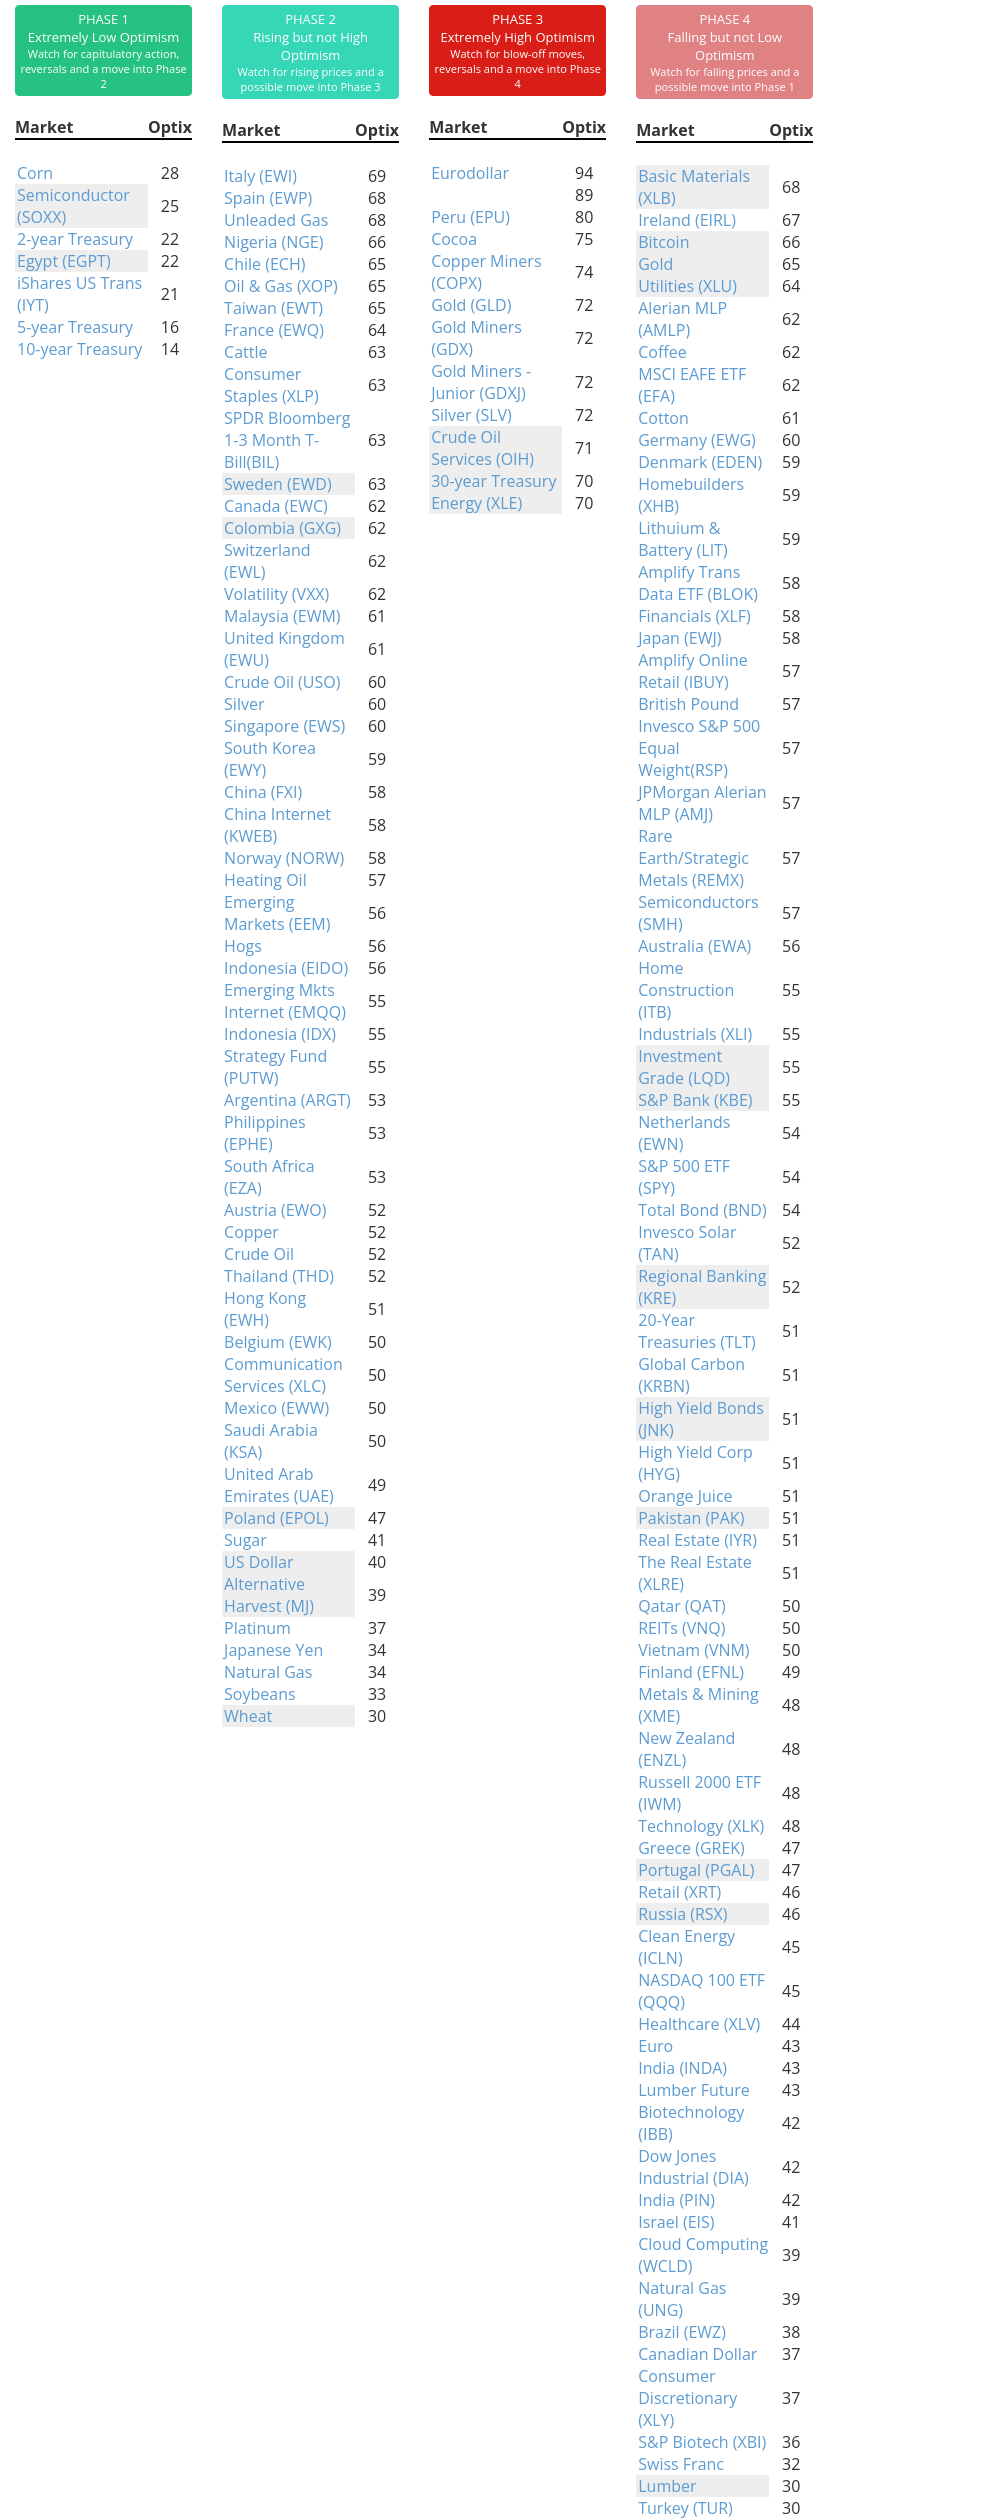
Auction markets - those most influenced by human behavior - typically have five distinct phases, each of which favors specific methodologies over others.
- Neutral trading range
- Quiet uptrend
- Volatile uptrend
- Quiet downtrend
- Volatile downtrend
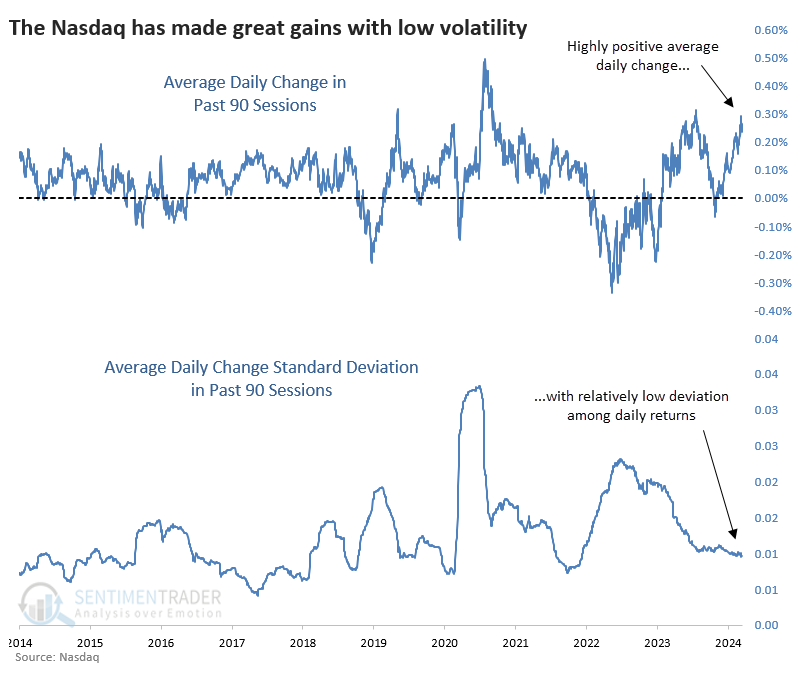
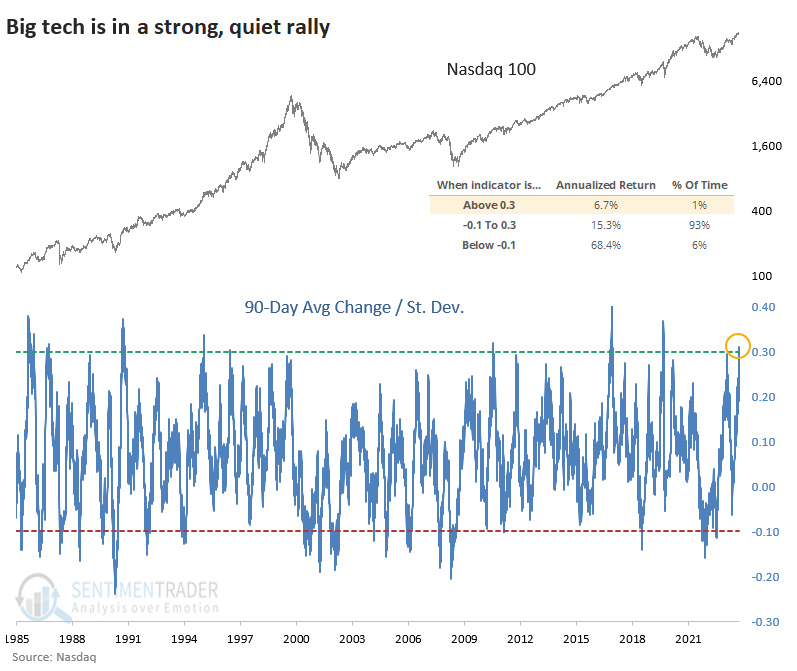
It's no secret that the big tech stocks powering the Nasdaq 100 (NDX) have been in a powerful uptrend. What may be a bit surprising is how quiet the rally has been.
Over the past 90 sessions, the NDX has averaged a large daily average change of more than +0.25% per day with a low and declining standard deviation among those daily returns - pretty much a textbook definition of a strong, quiet uptrend.
We get the chart below by combining those two measures, simply dividing the top figure by the bottom one. The last stretch to (almost) match the current one occurred in mid-July 2023, which almost exactly matched the peak for that summer. Same for the instance before that one, in February 2020. In 2017, it triggered during about the halfway mark of a sustained uptrend.
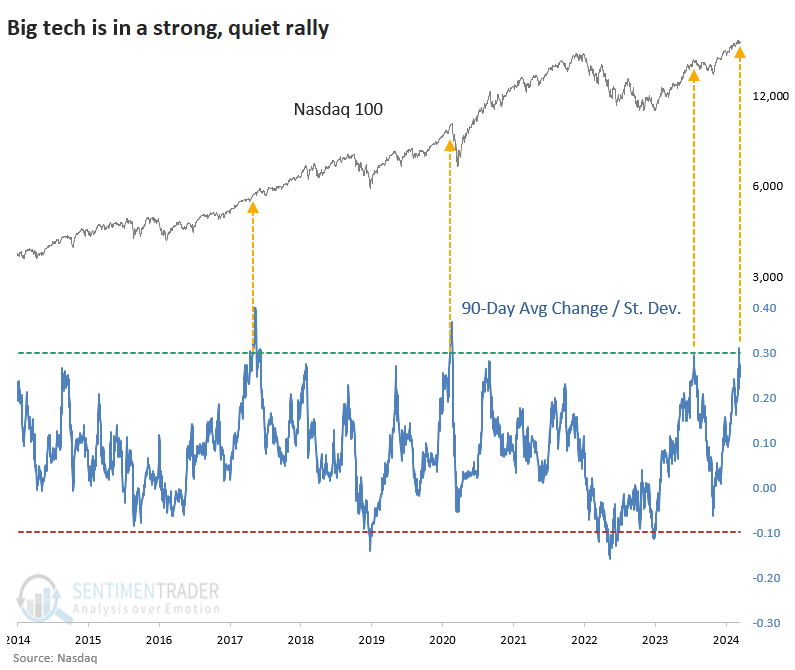
If we zoom out over the entire history of the Nasdaq 100 and use a more stringent extreme, the last instance from July 2023 barely missed the cut. Still, when the quiet uptrend reached the current threshold, annualized returns in the NDX tended to suffer. It averaged about half the returns during more normal periods. Too much of a good thing is not necessarily a good thing; all apologies to Mae West.
Just because annualized returns during these periods were low, it didn't mean it was a good sell signal. Rather, forward gains tended to be muted in the short-term but still mostly positive.
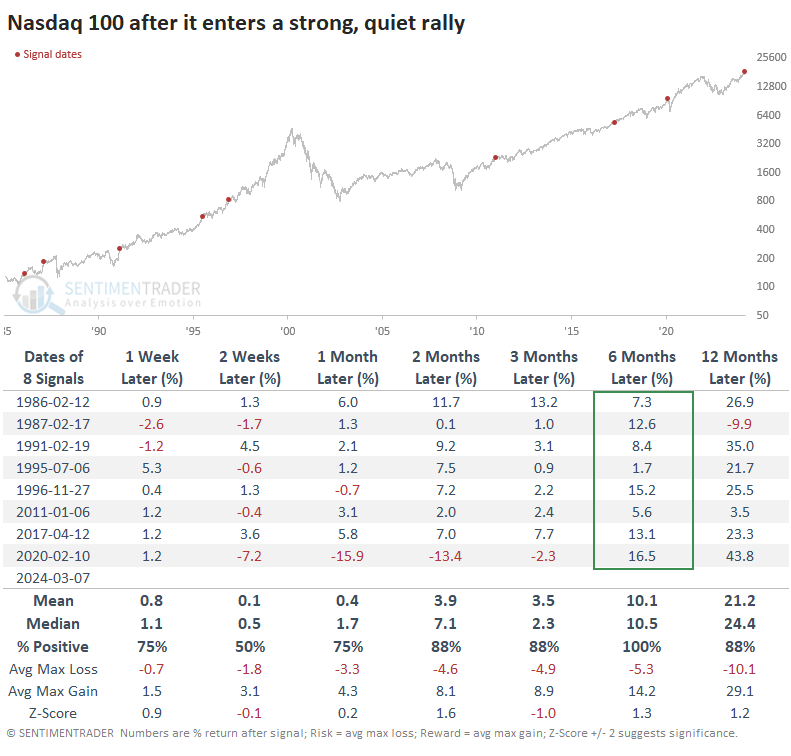
Quiet uptrends tend to keep going
The table below shows returns in the NDX after the ratio of its 90-day average return to its standard deviation rises above +0.3. In the short term, returns weren't all that great, with half of the small sample showing gains. But over the next six months, each sported a positive return, even the one that was triggered right before the pandemic panic.
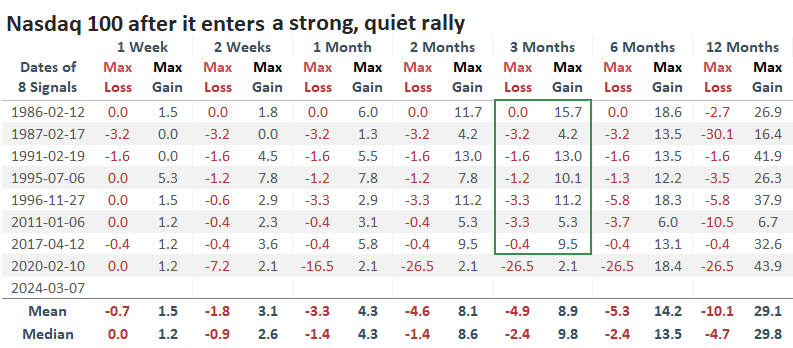
The table of maximum gains and losses across each time frame shows that up to three months later, only one of the signals suffered more than a -3.3% drawdown, that exception being the 2020 pandemic.
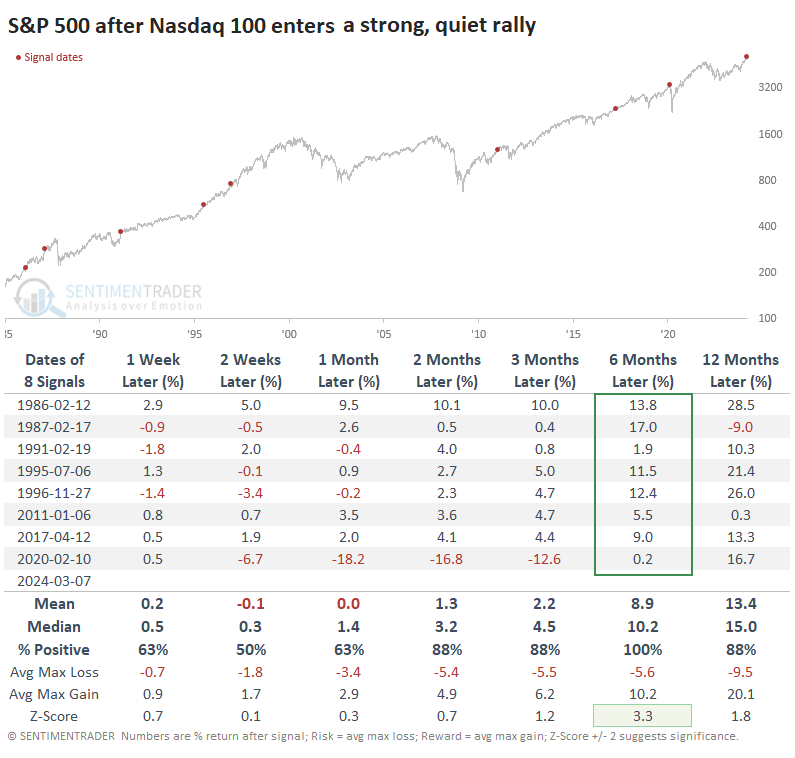
For the broader S&P 500, these strong, quiet rallies in the Nasdaq 100 were also positive indications. Over the next six months, the S&P rallied each time, with a median gain tallying in the double digits.
What the research tells us...
Contrarian investors always like to believe that a quiet market equals complacency, and complacency equals danger. There is some truth to that, and market beliefs with some truth are often the most damaging. That's because they work often enough to perpetuate the belief but fail often enough to be a drag on returns.
Most market tops are accompanied by low volatility. But low volatility itself isn't a sufficient condition to trigger a top. Most often, a market that cycles from a volatile downtrend to a quiet uptrend will persist for a long time. We can see that tendency above, as well. When the Nasdaq 100 has enjoyed as strong of returns as it has over the past few months, with relatively mild volatility, it has a strong tendency to add to those gains in the months ahead. The only exception was the pandemic, and an argument can be made that's a valid exception.
Indicators at Extremes
Phase Table
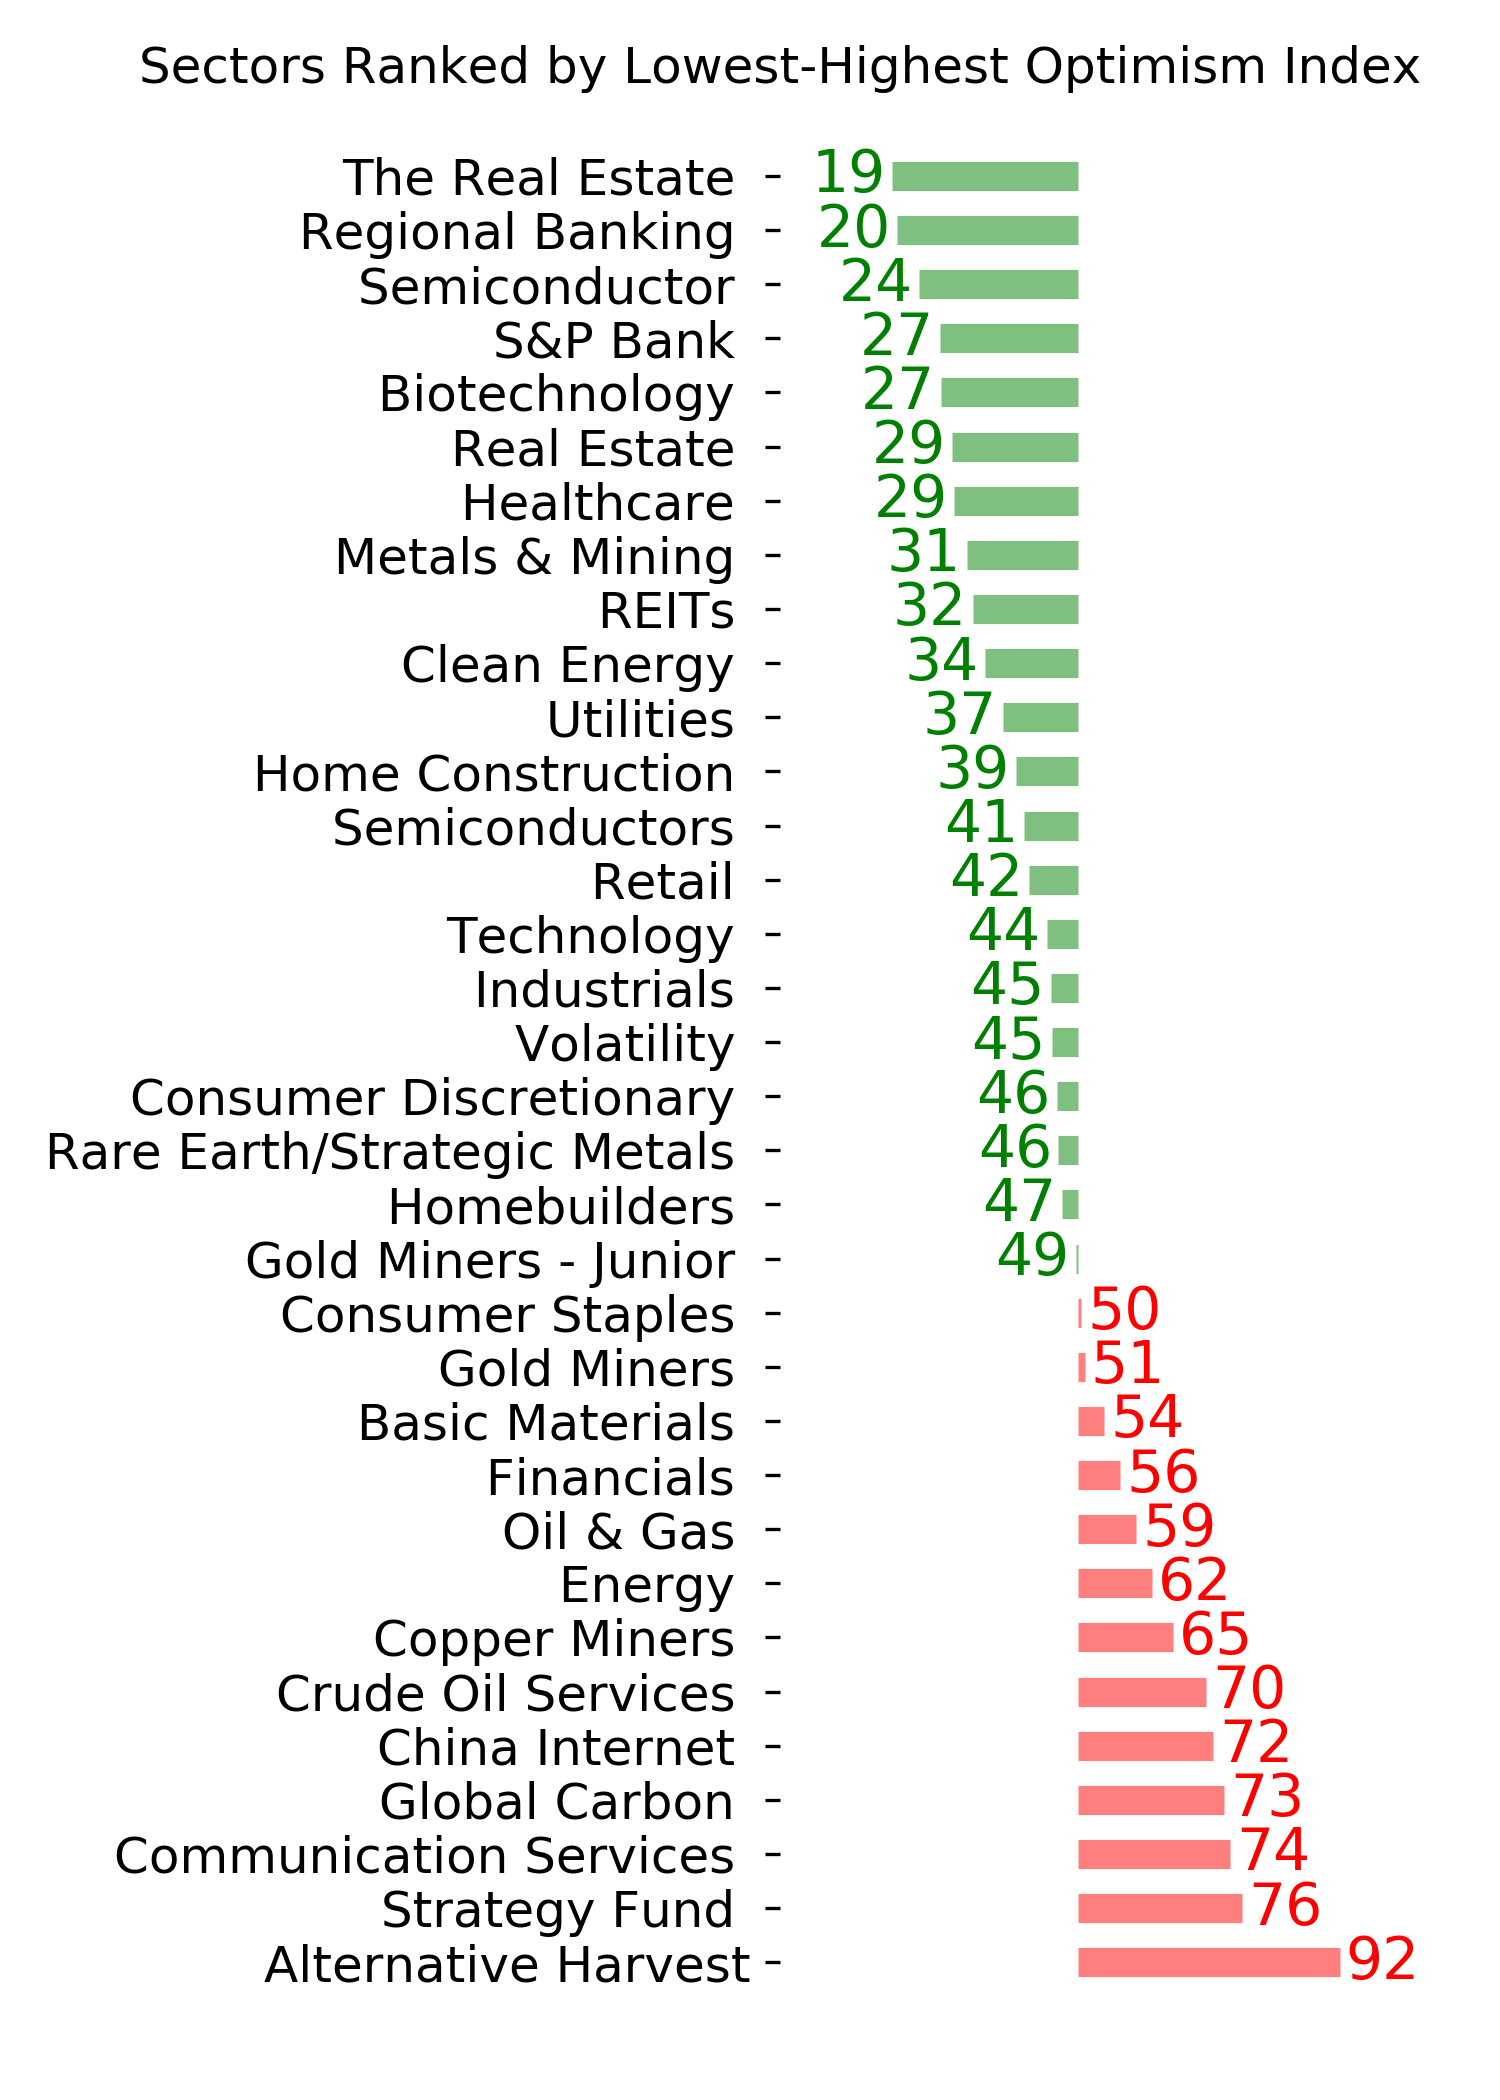
Ranks
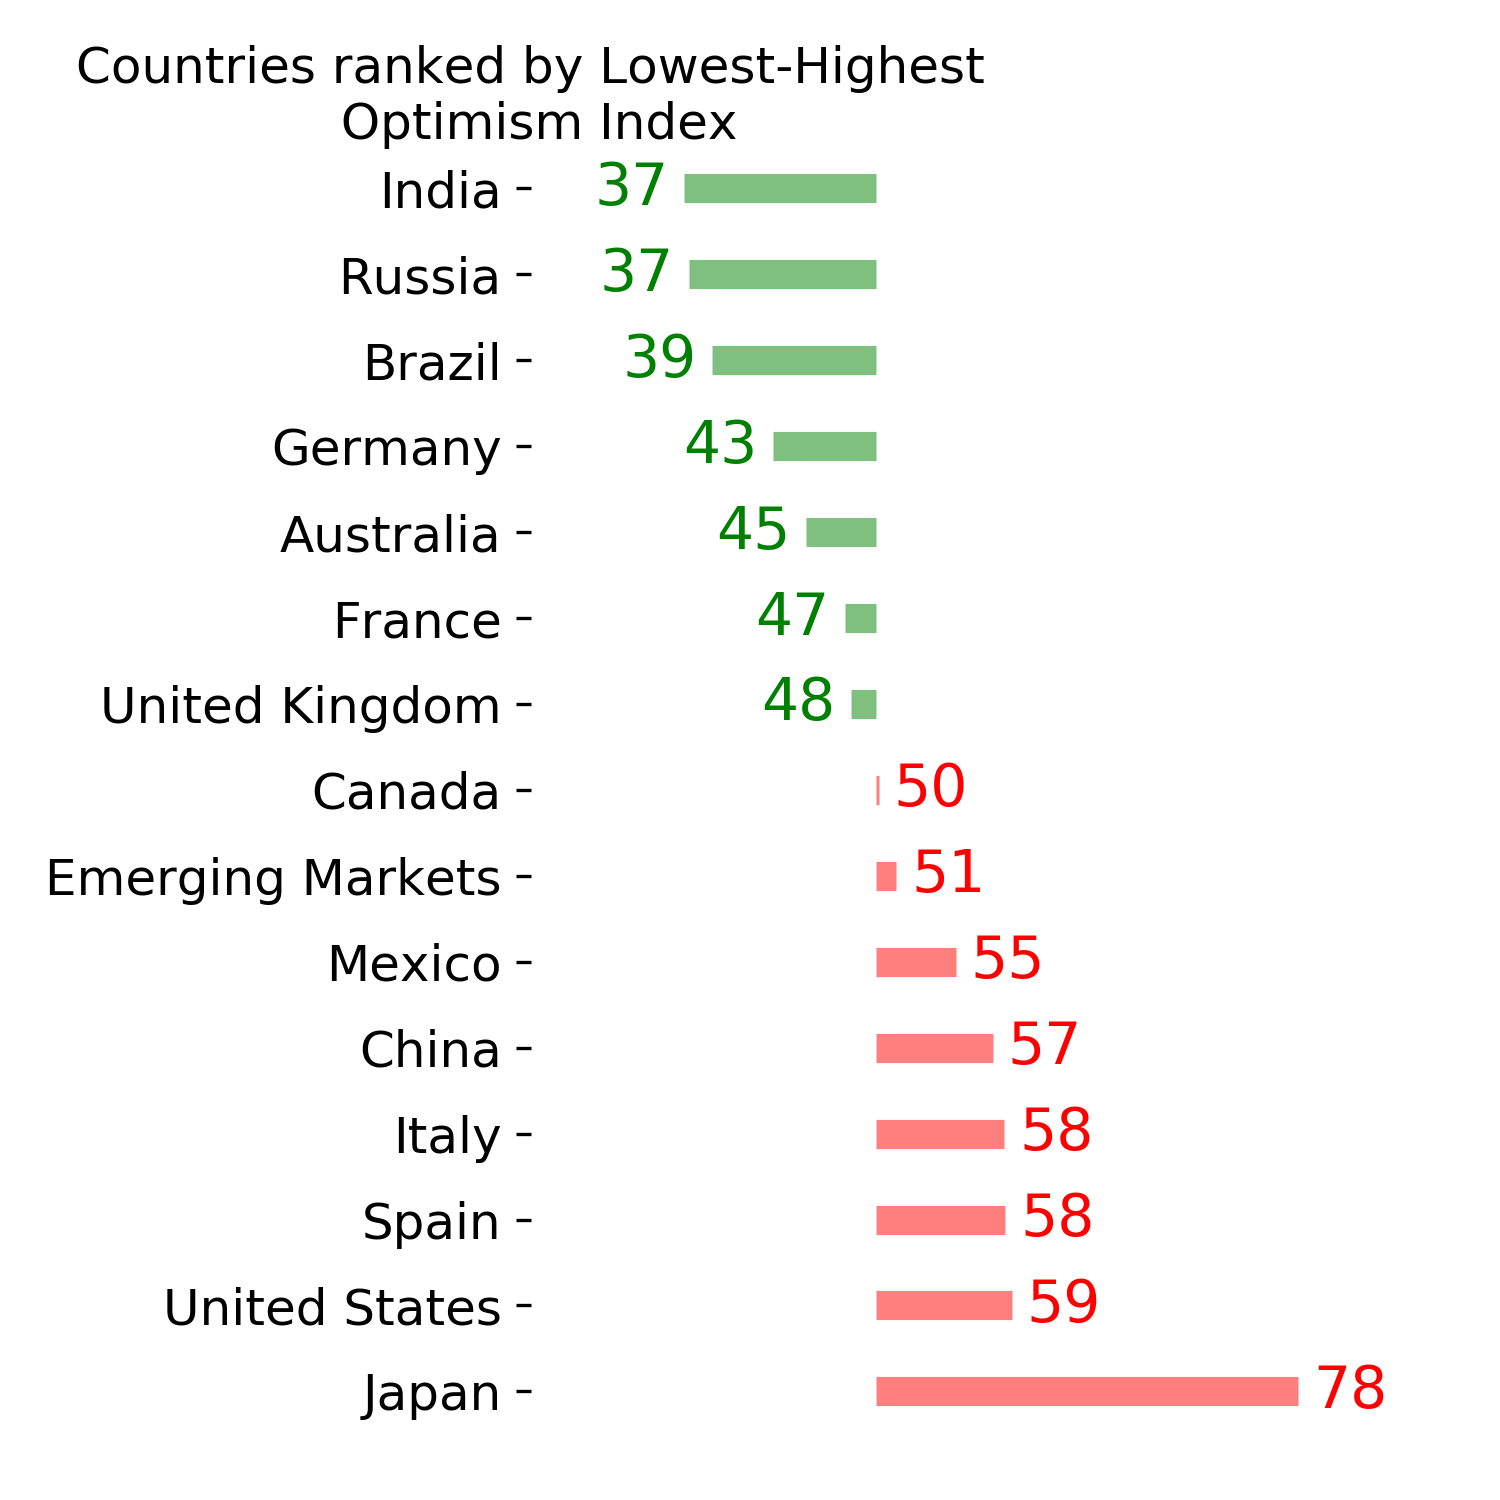
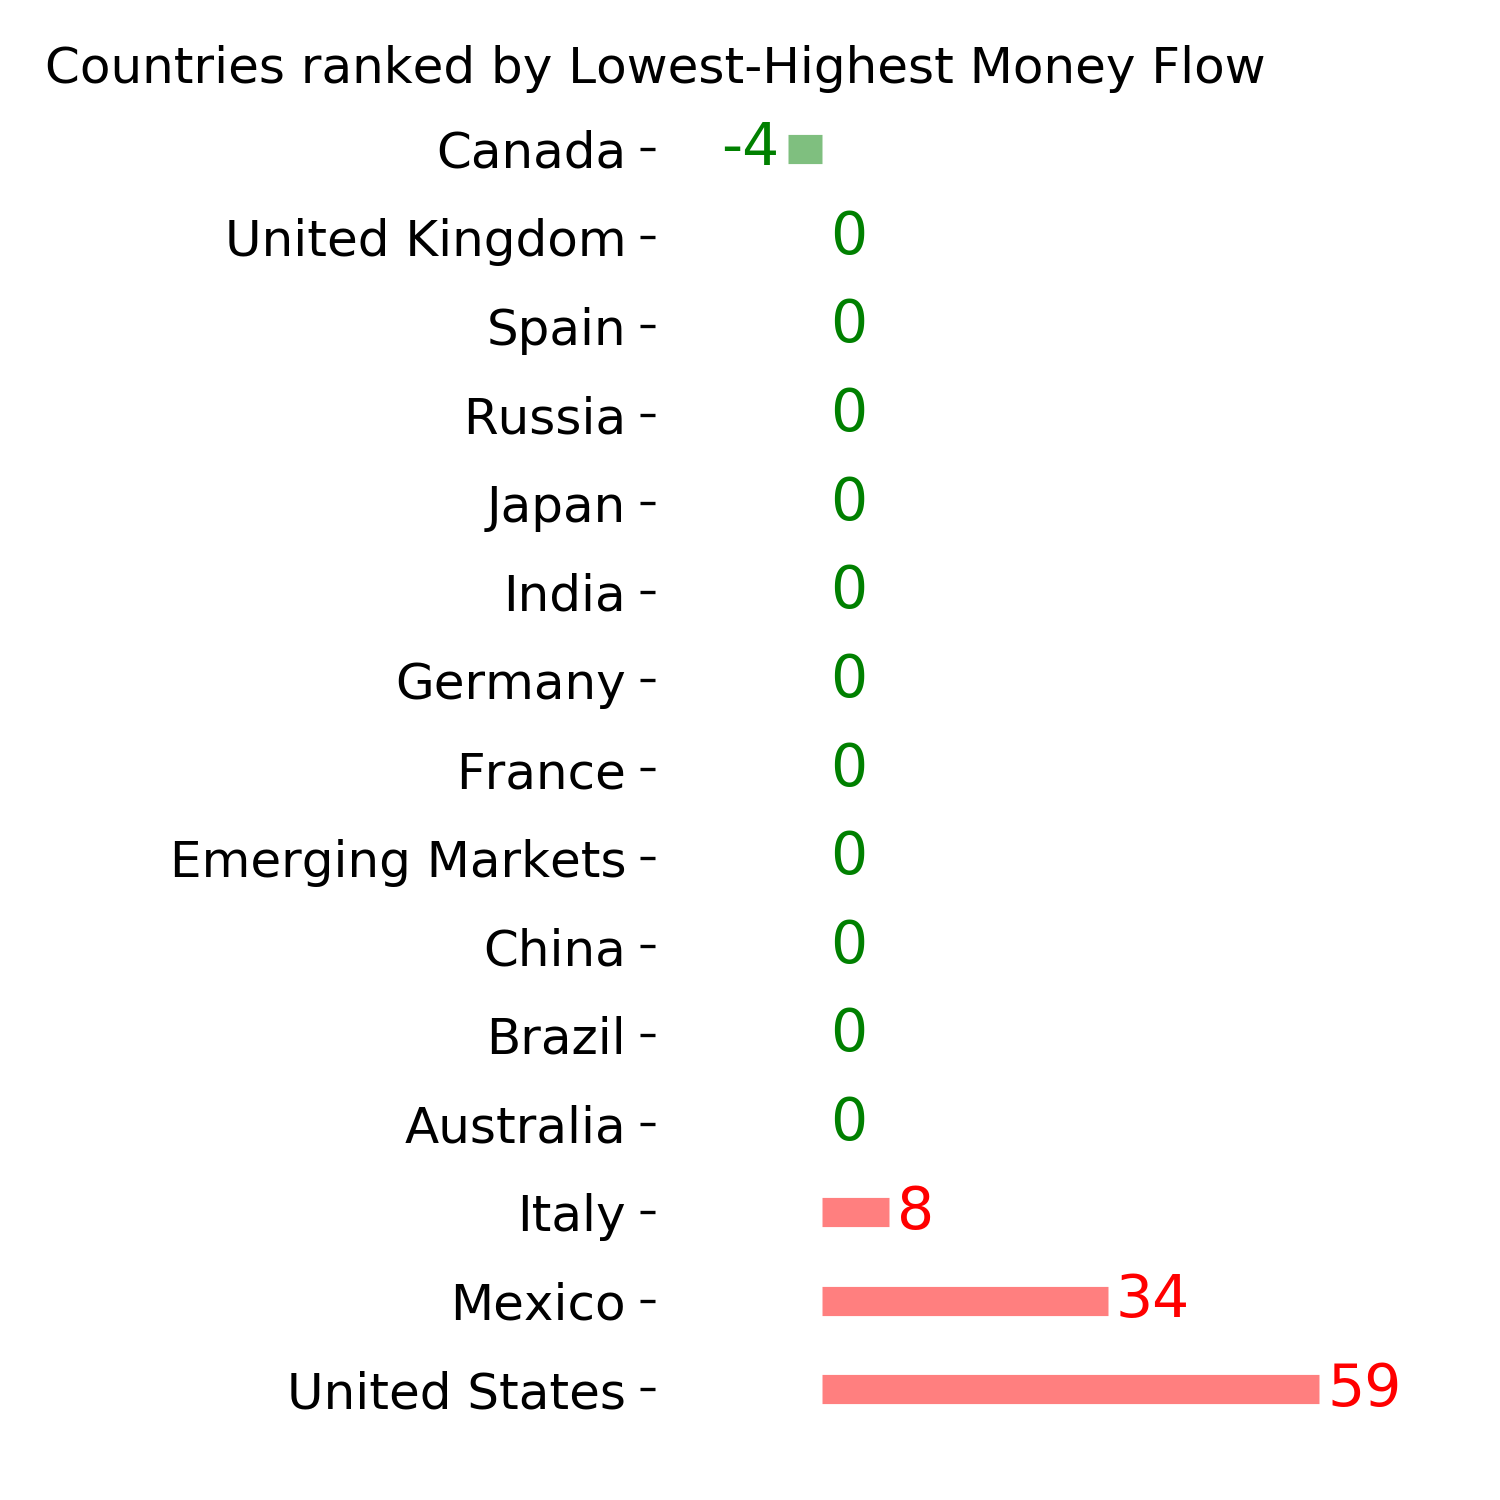
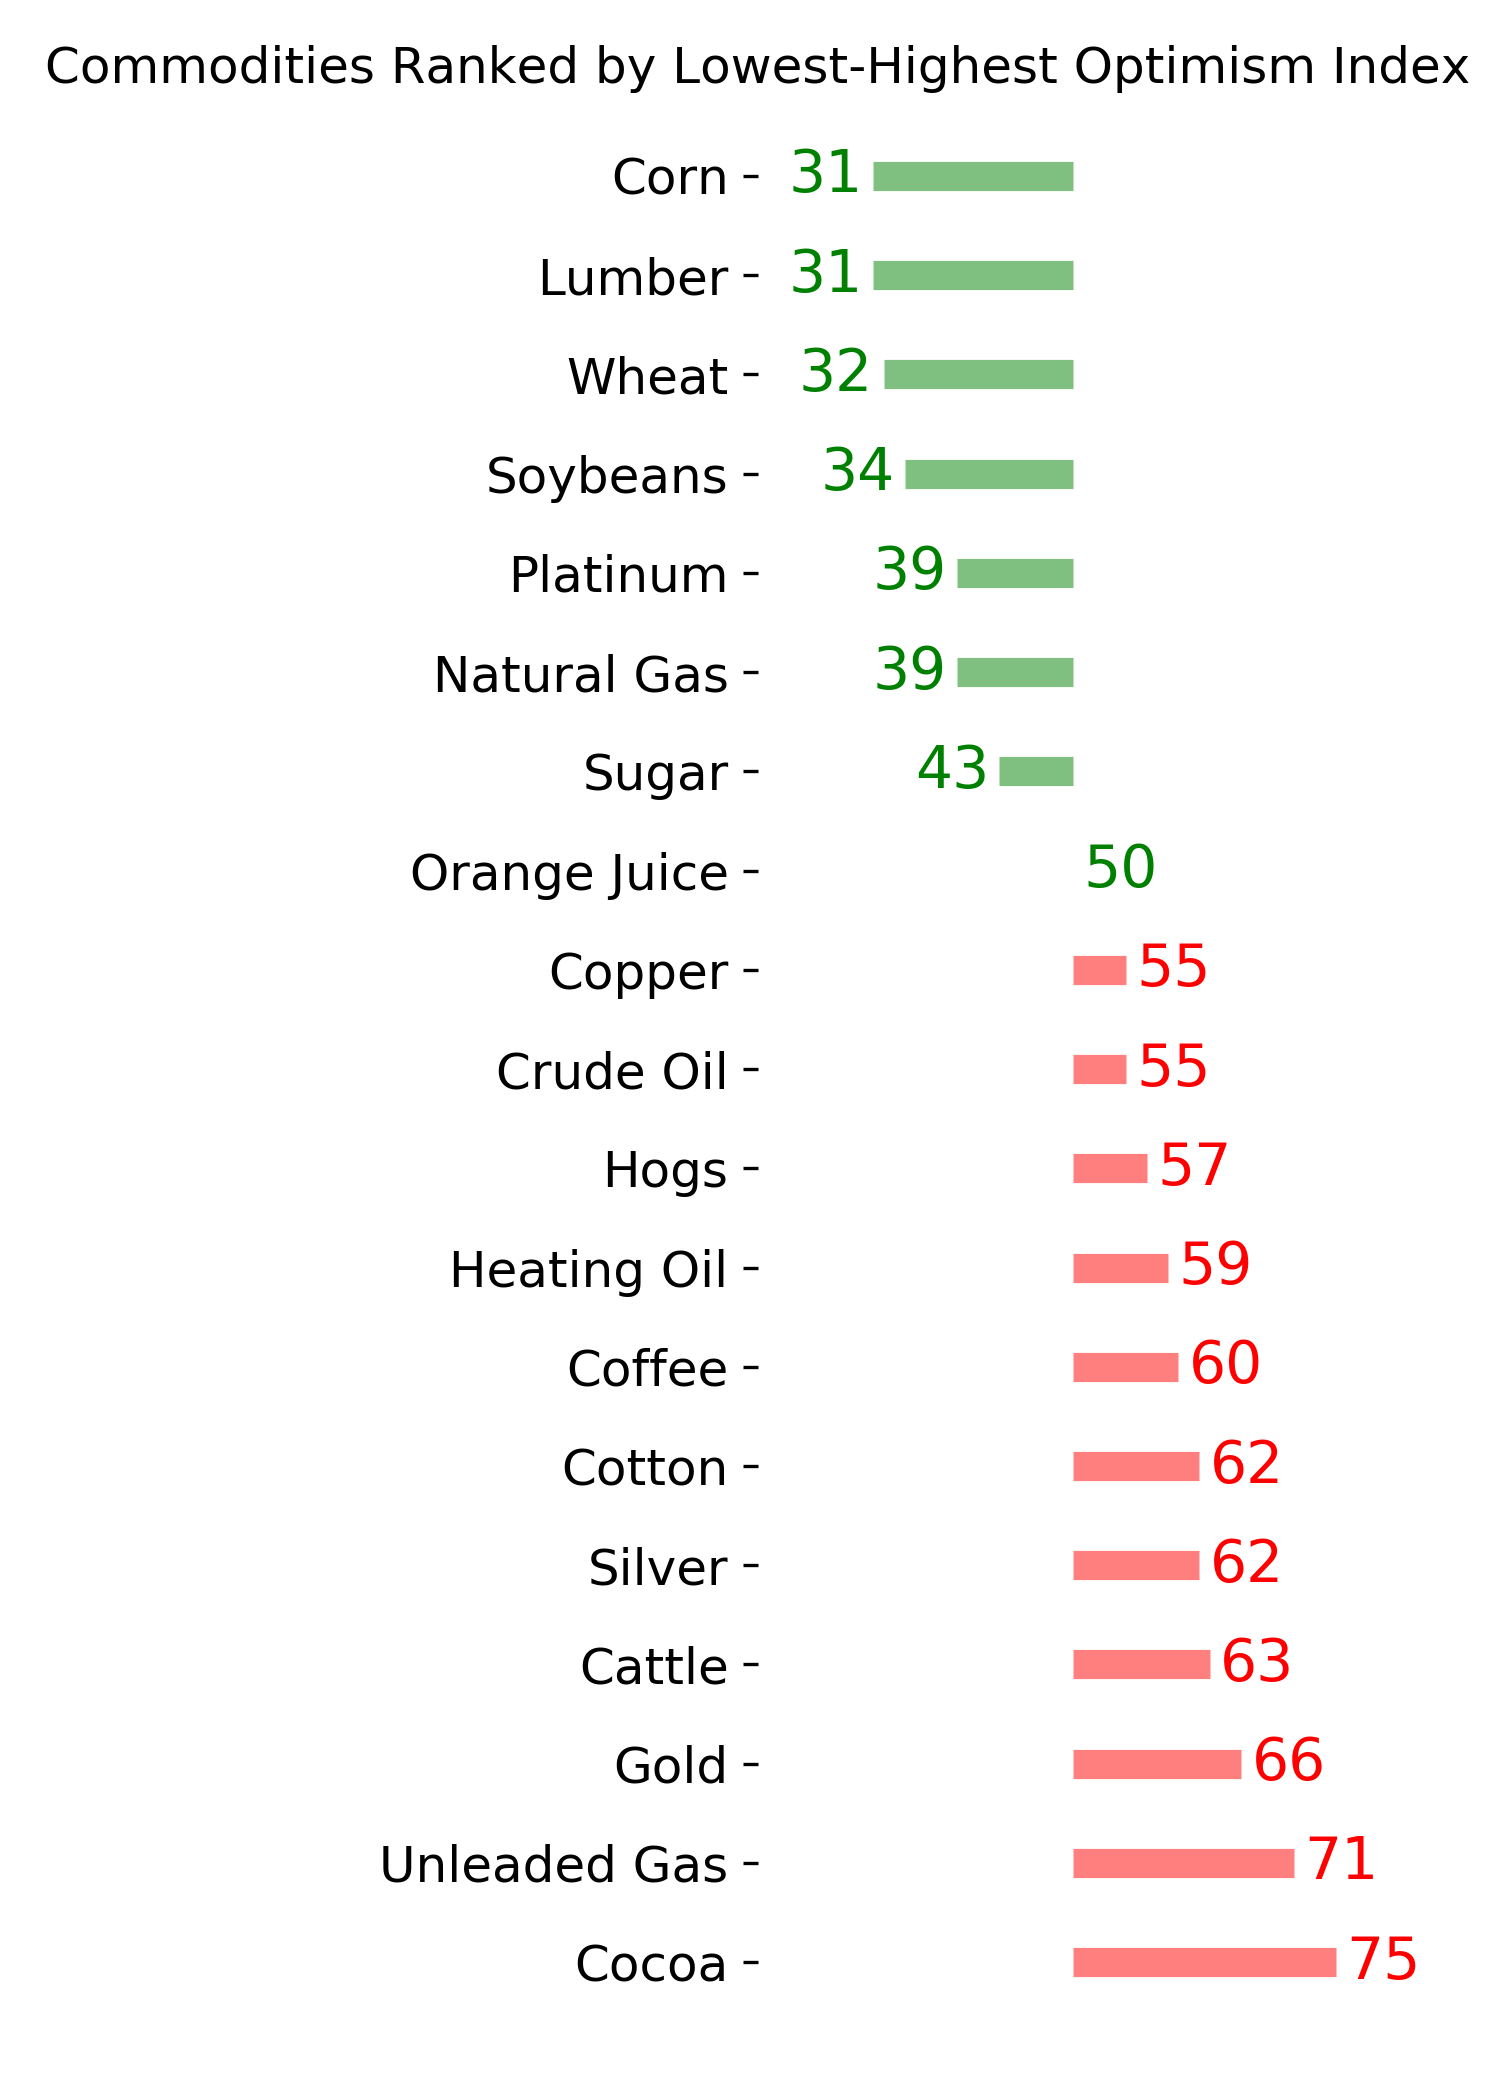
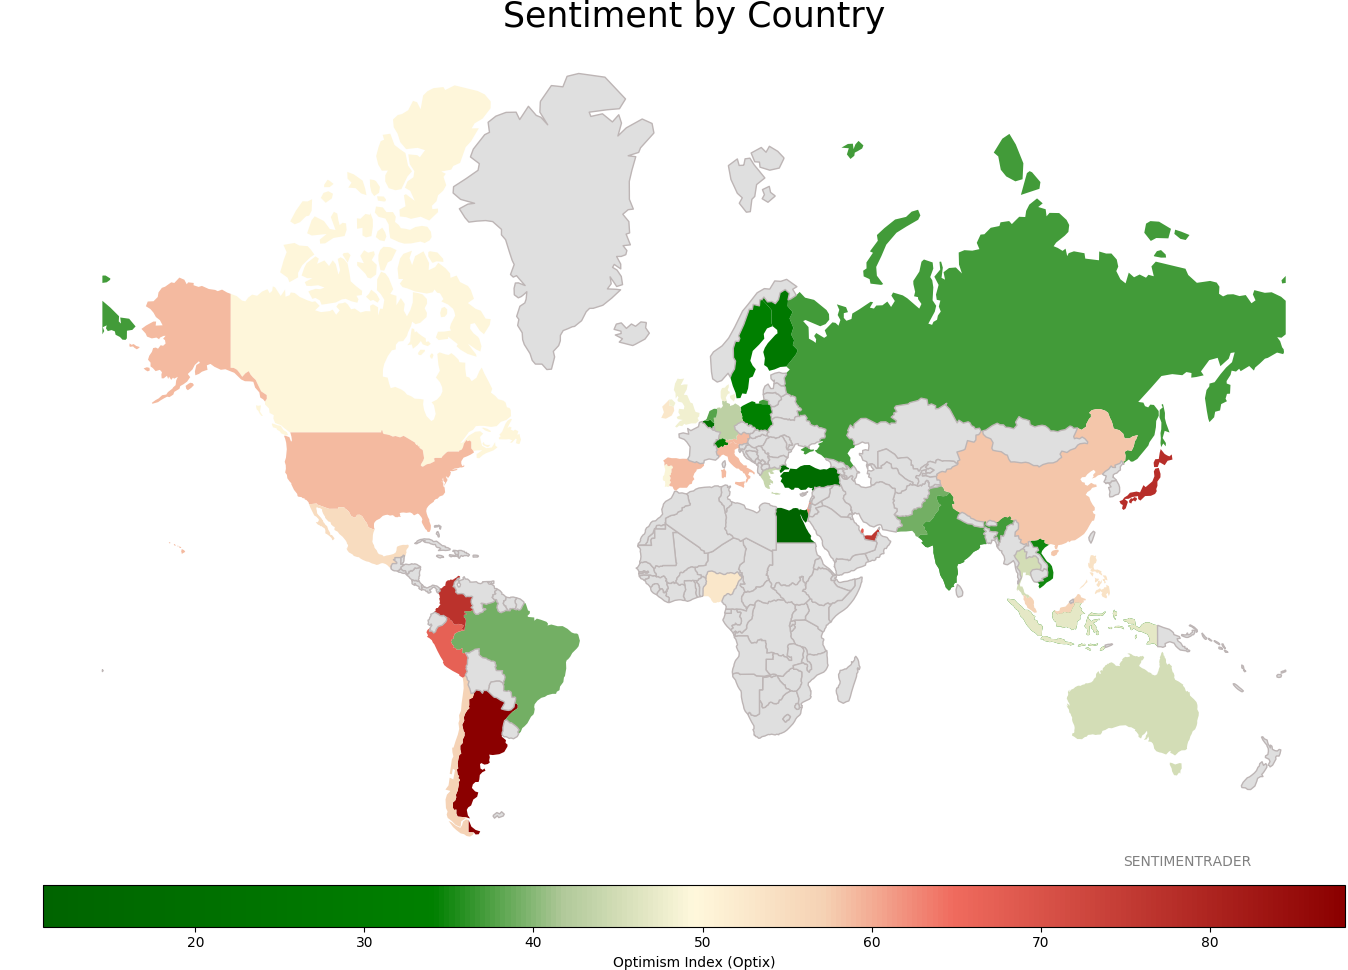
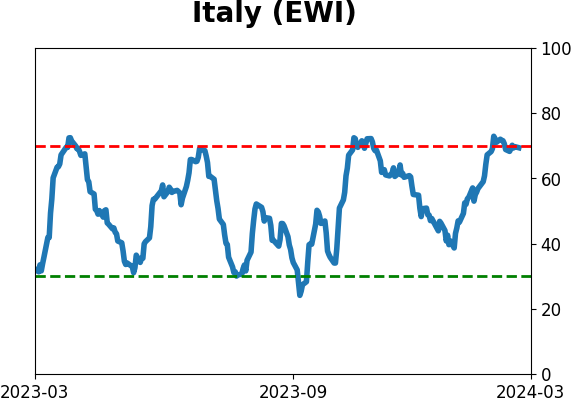
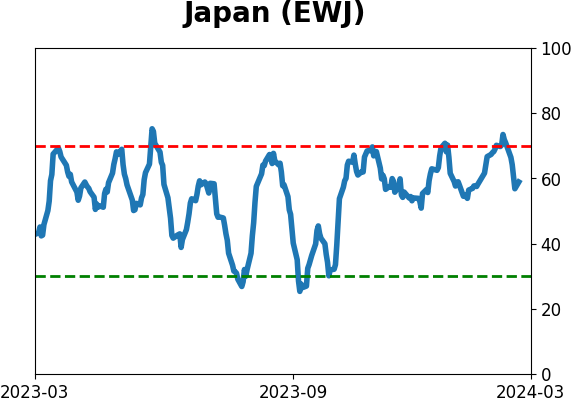
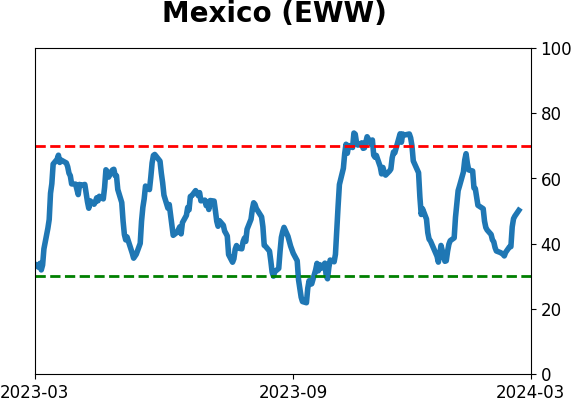
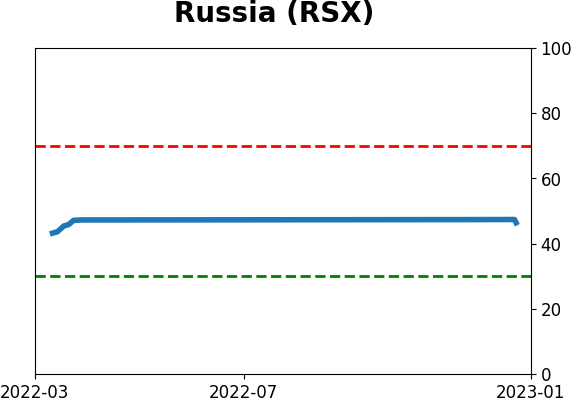
Sentiment Around The World
Optimism Index Thumbnails
|
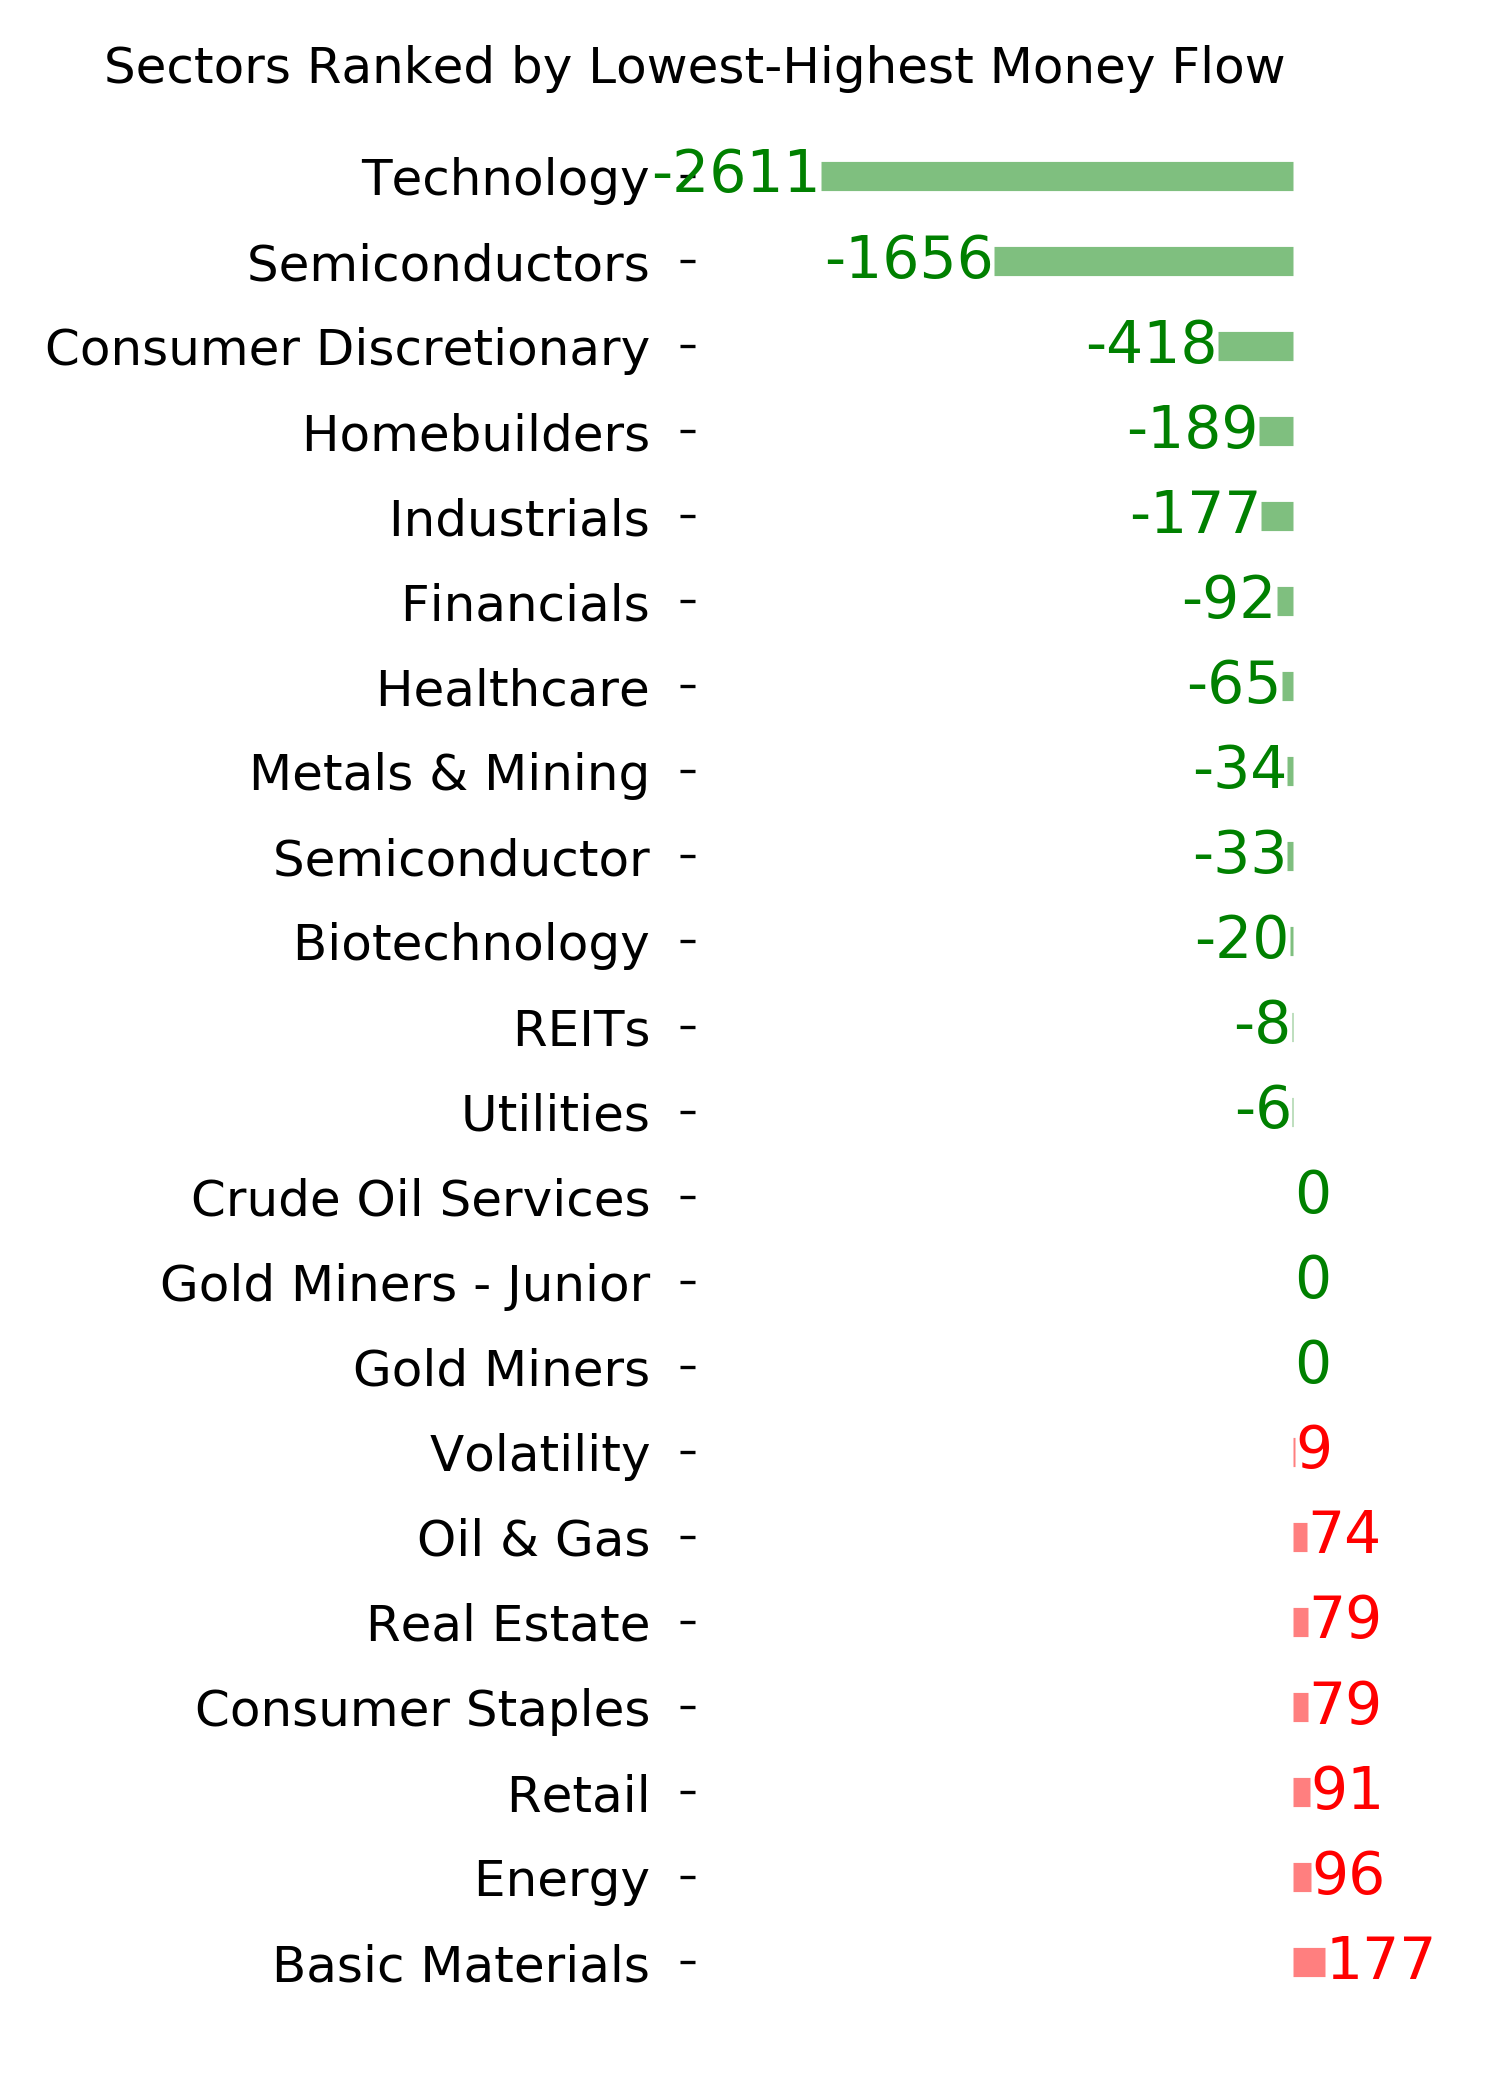
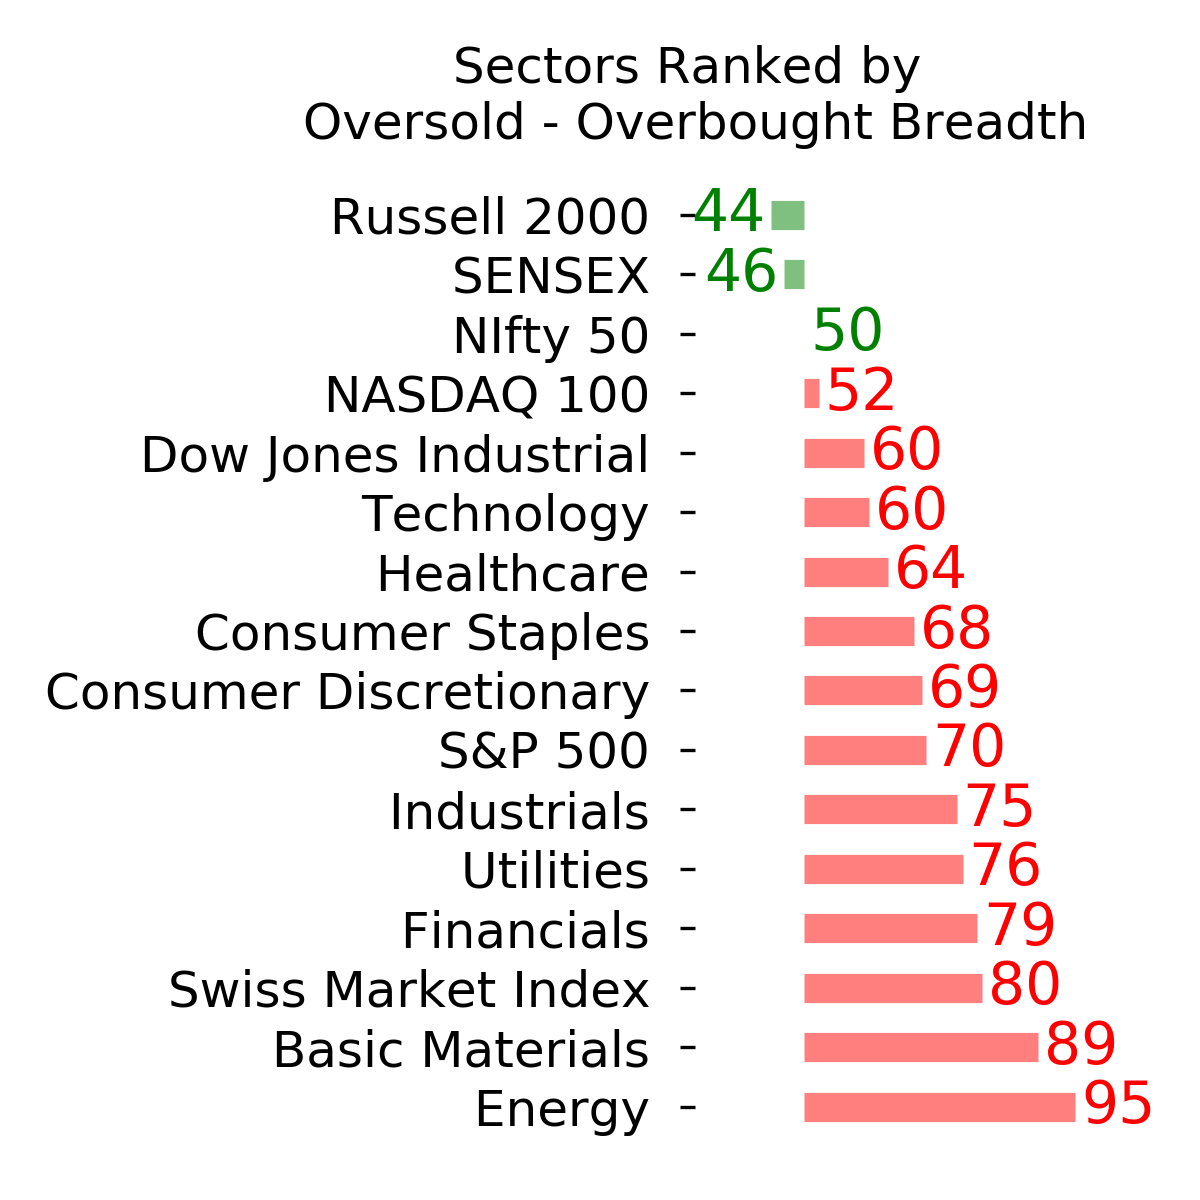
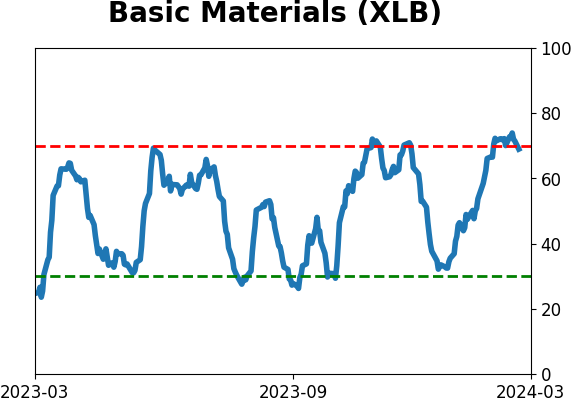
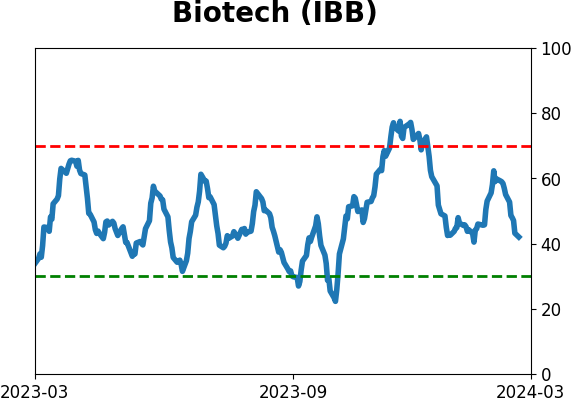
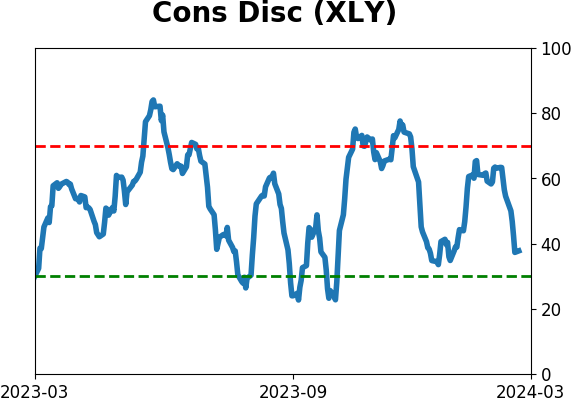
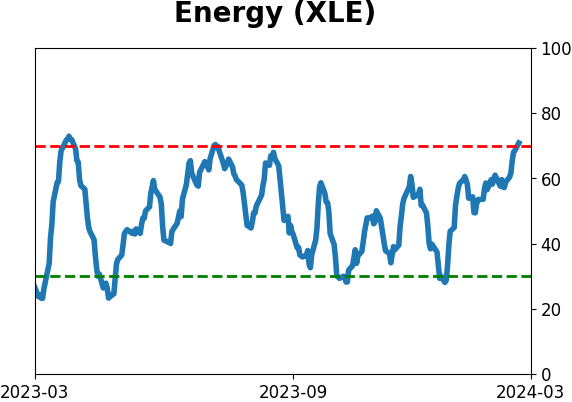
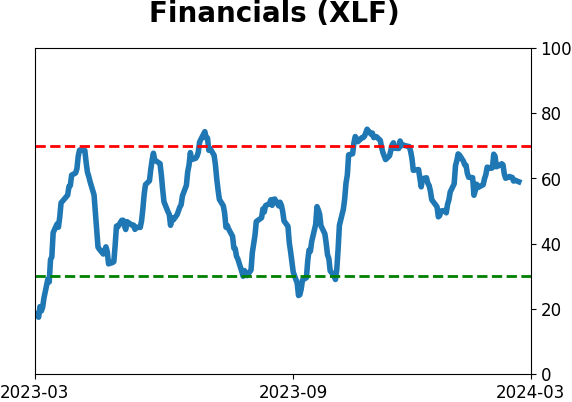
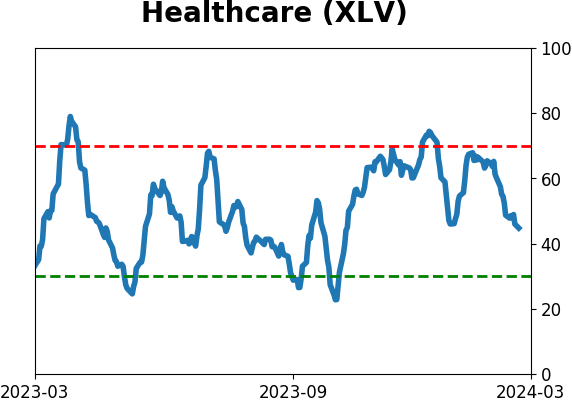
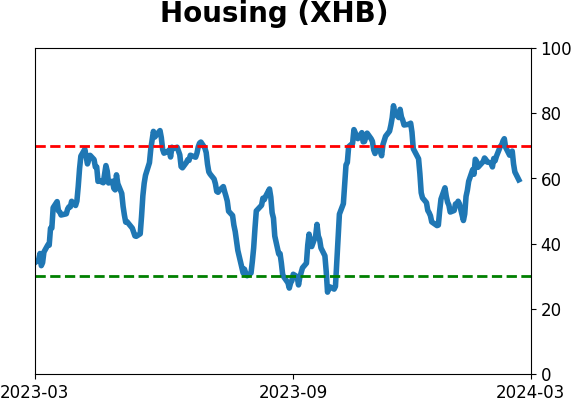
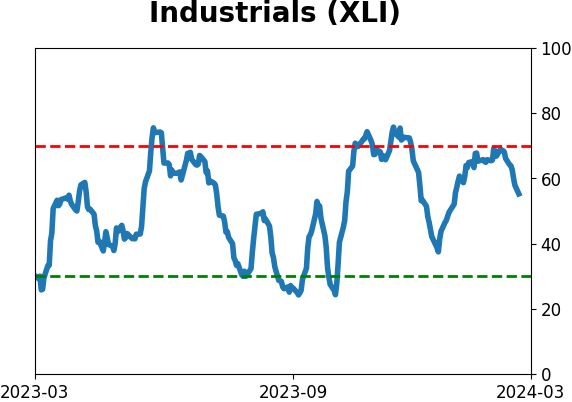
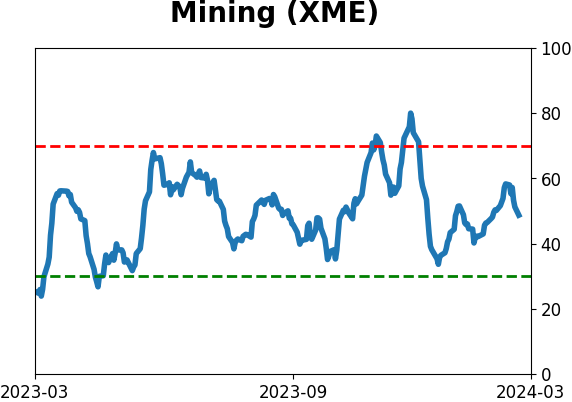
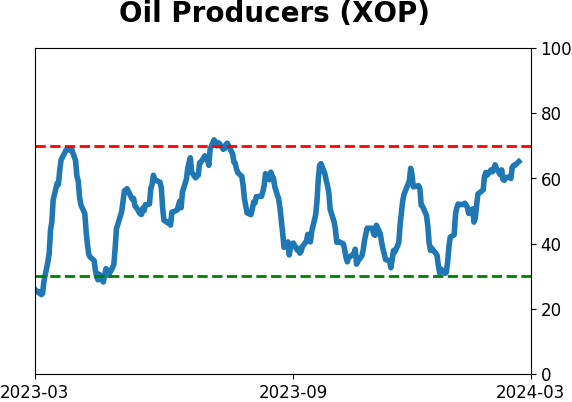
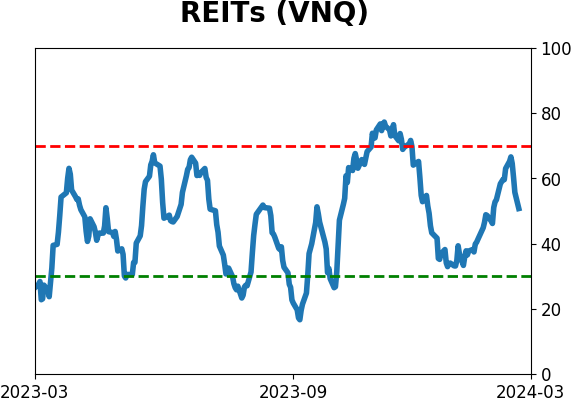
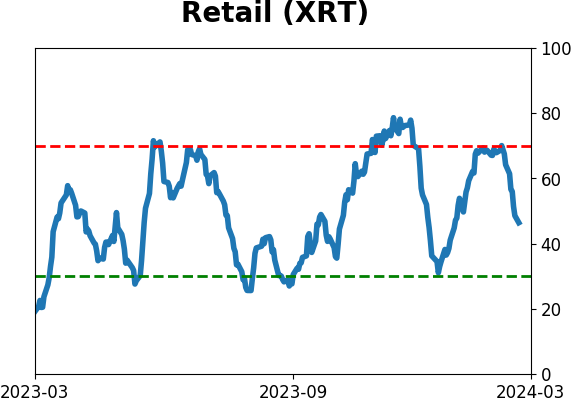
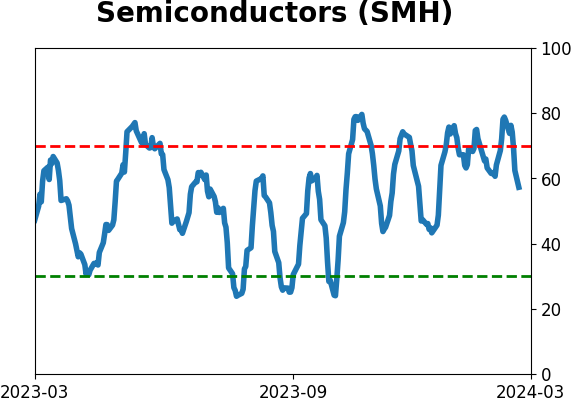
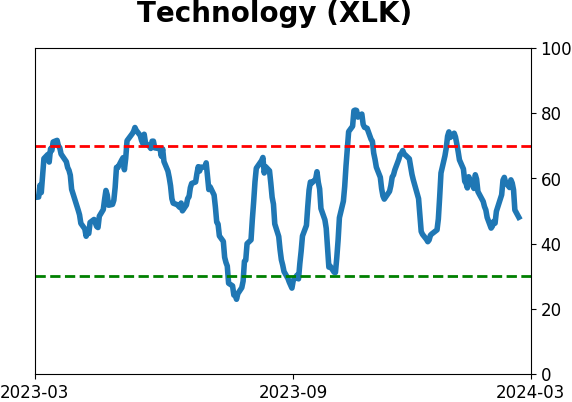
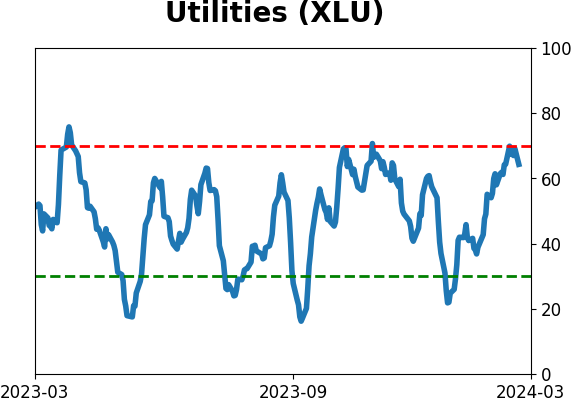
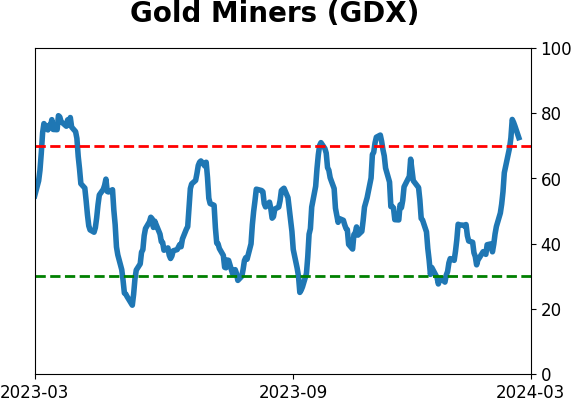
Sector ETF's - 10-Day Moving Average
|
|
|
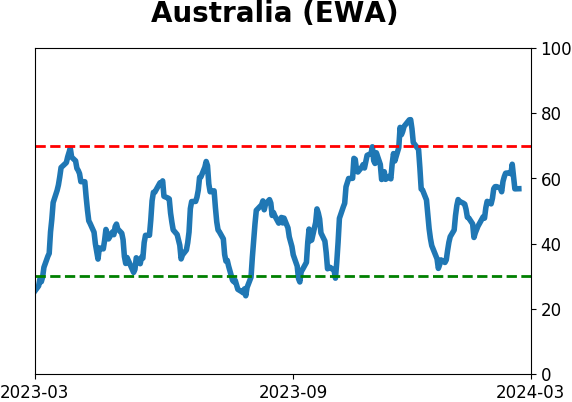
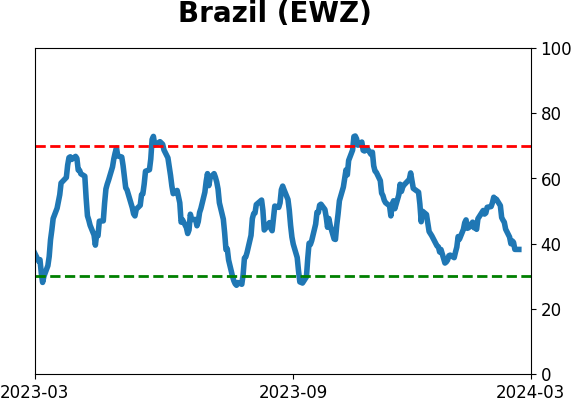
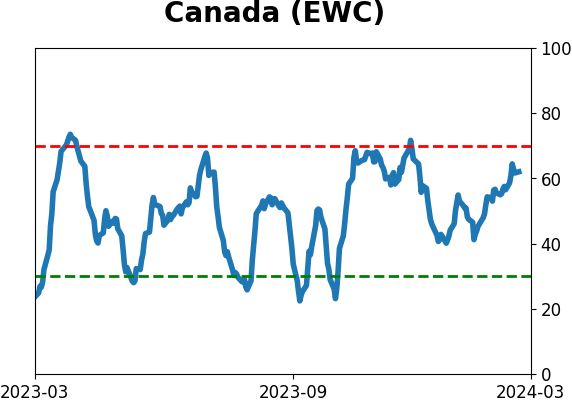
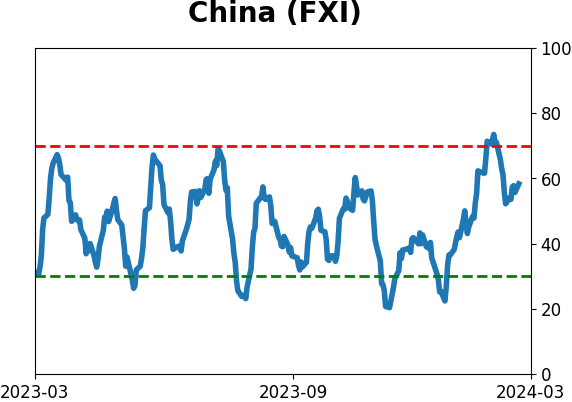
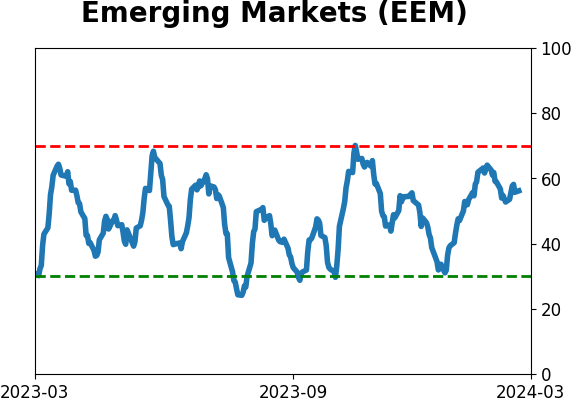
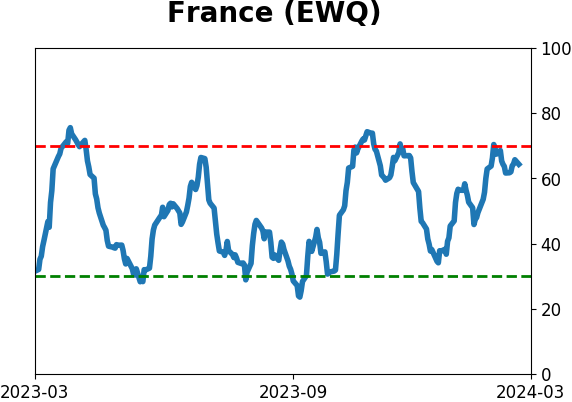
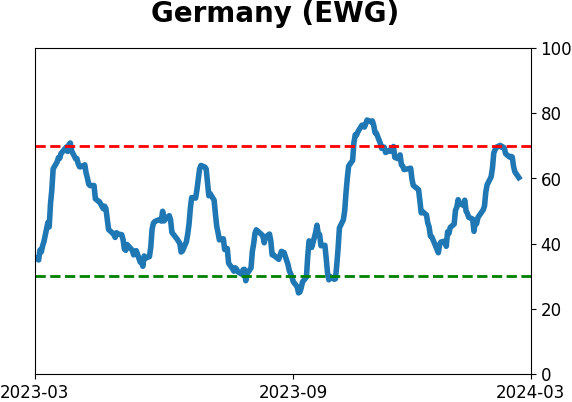
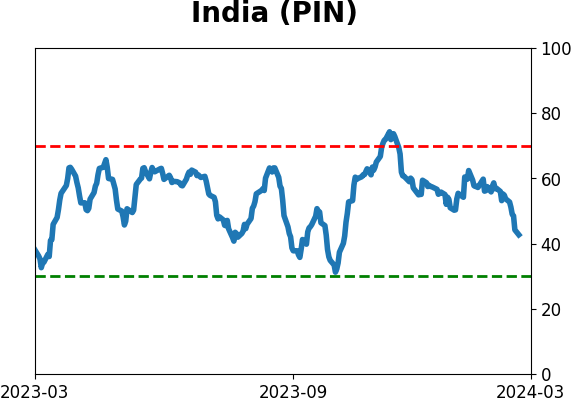
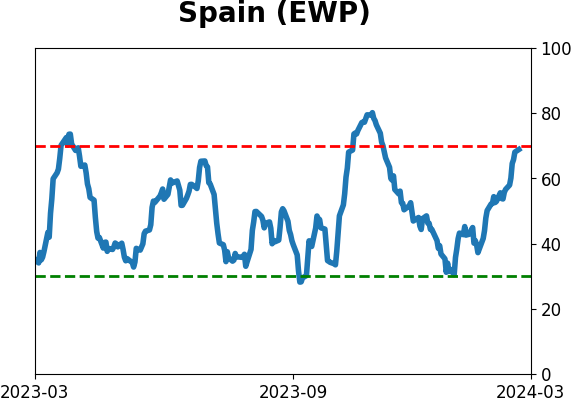
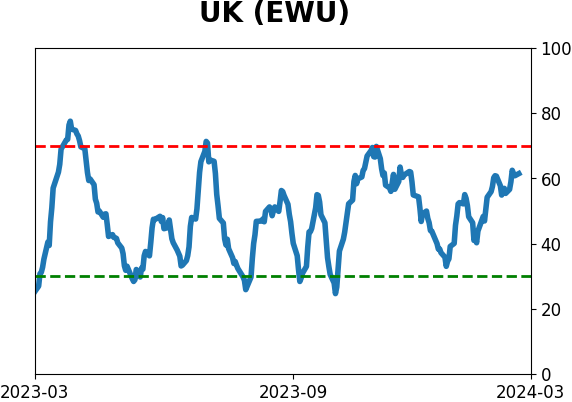
Country ETF's - 10-Day Moving Average
|
|
|
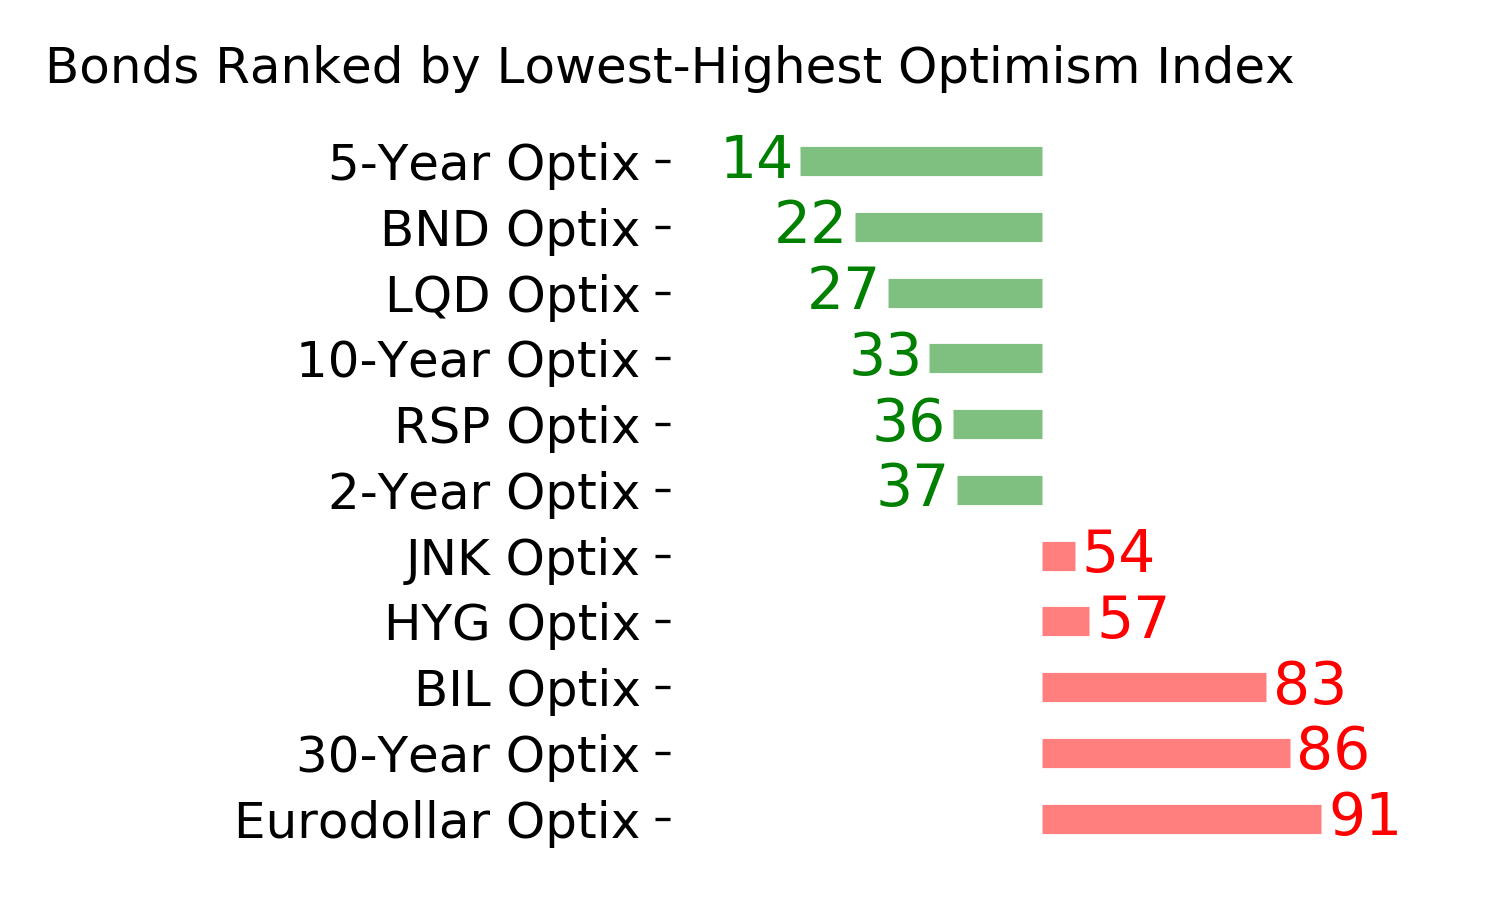
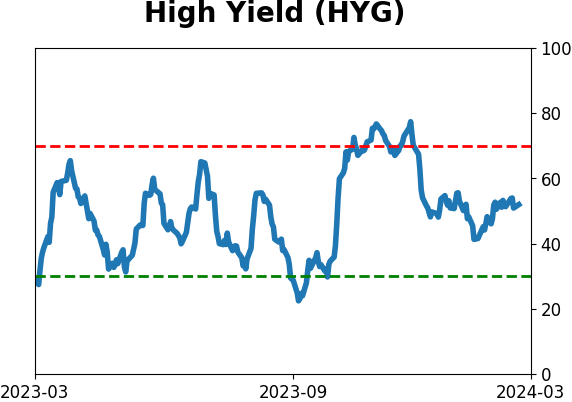
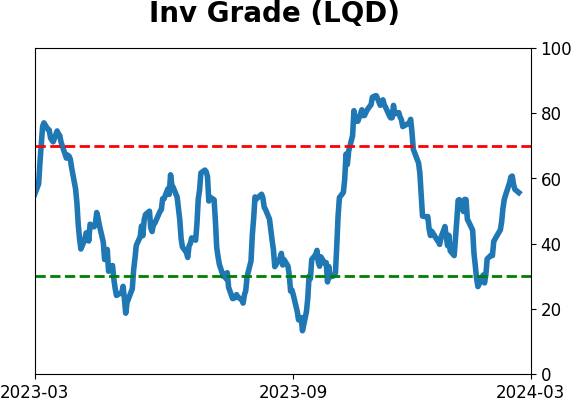
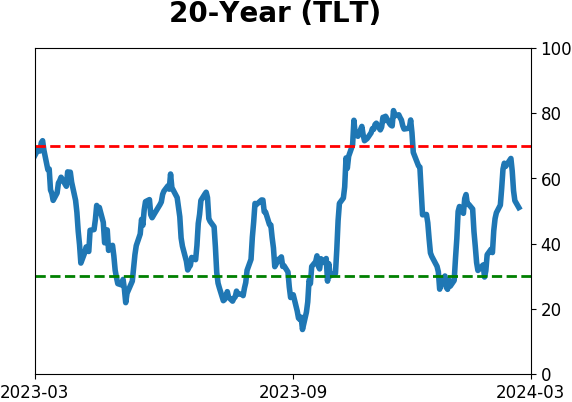
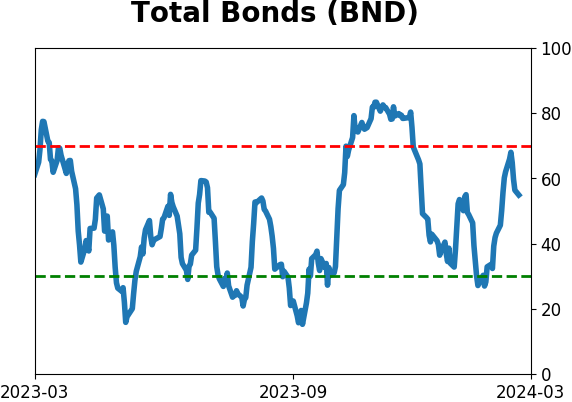
Bond ETF's - 10-Day Moving Average
|
|
|
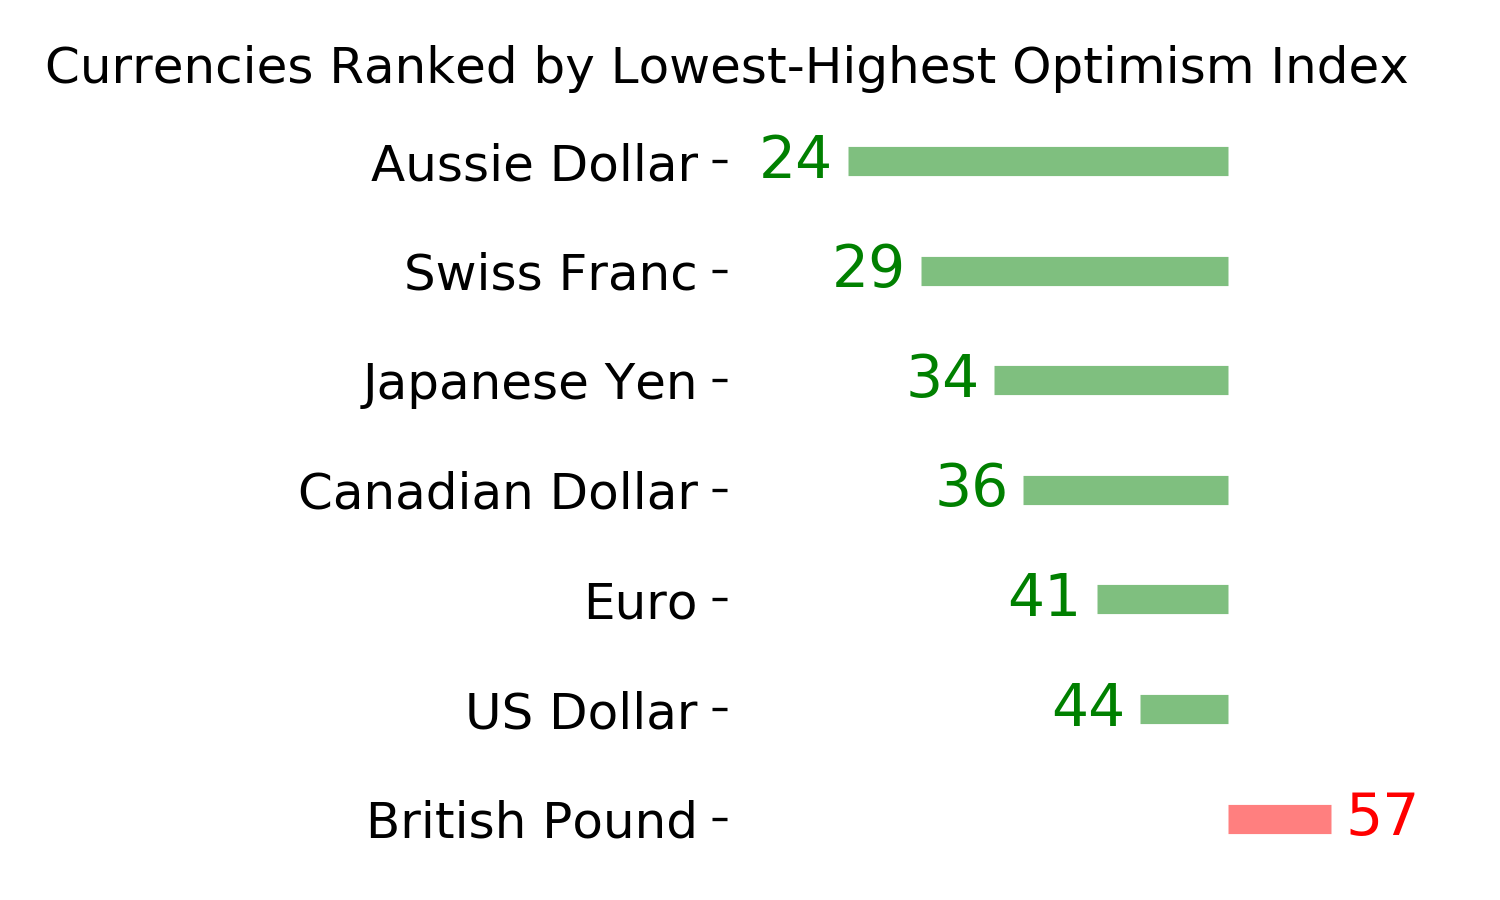
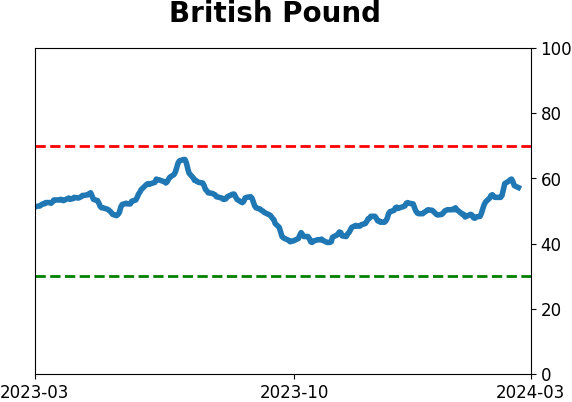
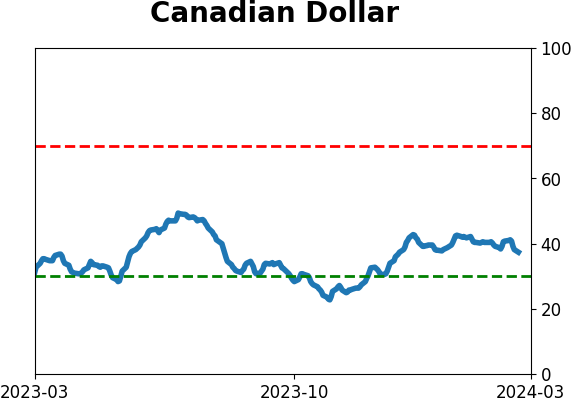
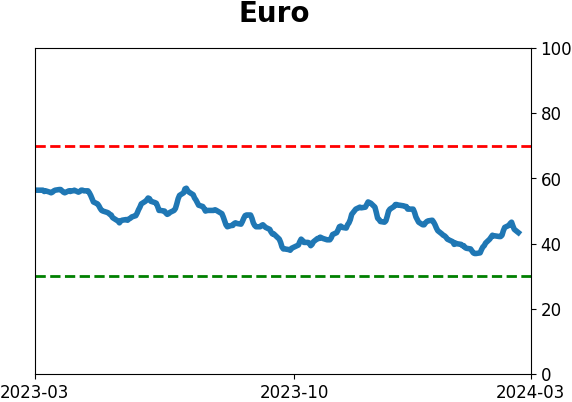
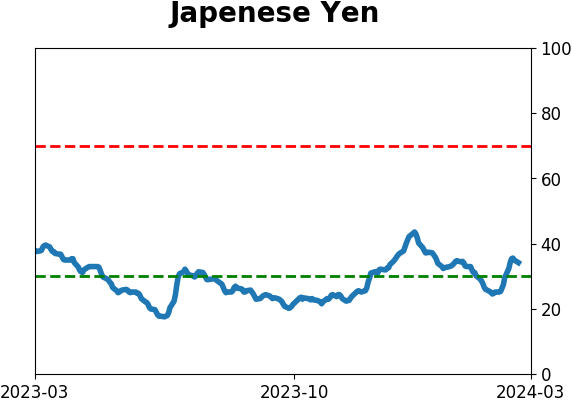
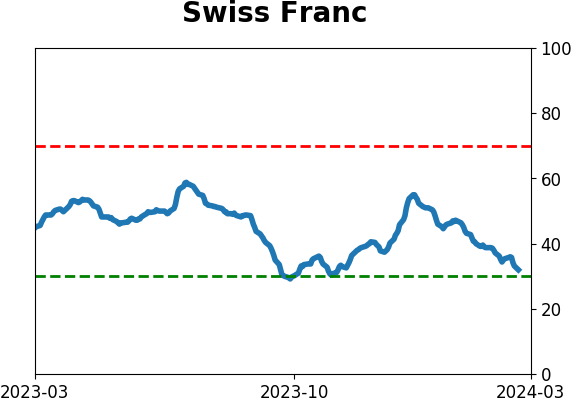
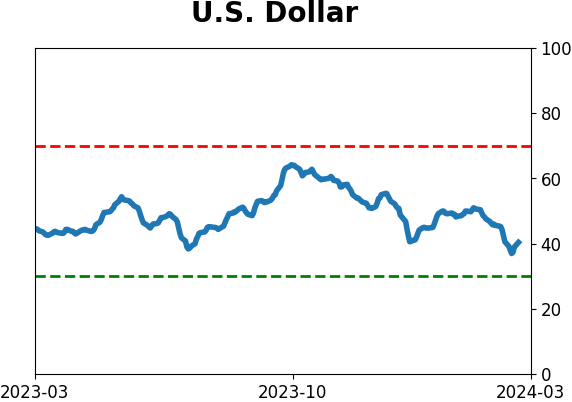
Currency ETF's - 5-Day Moving Average
|
|
|
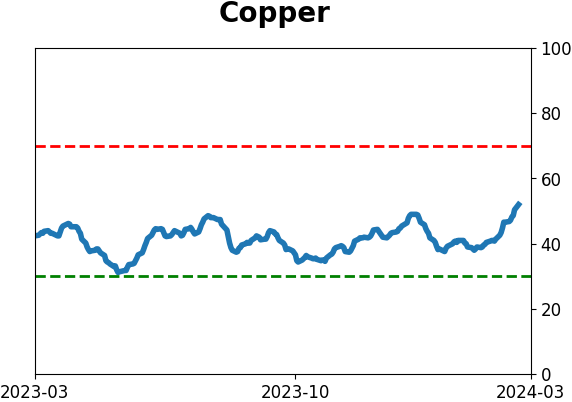
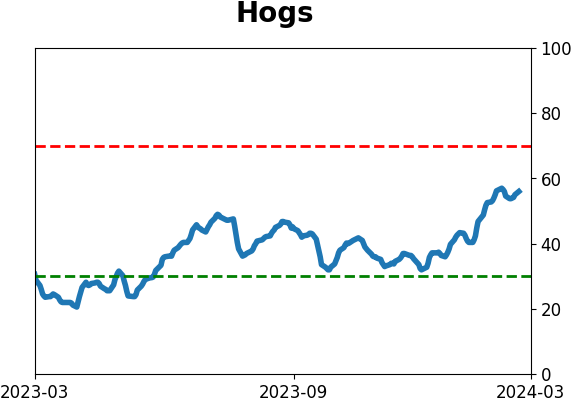
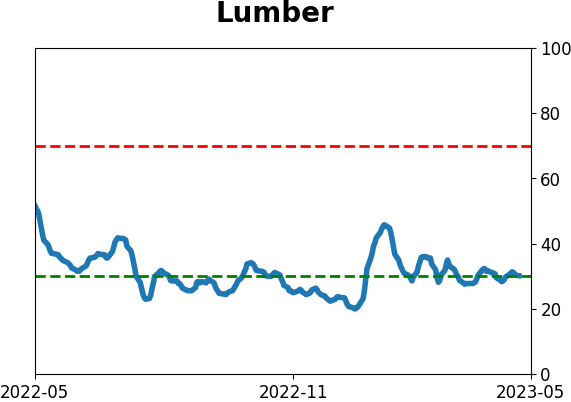
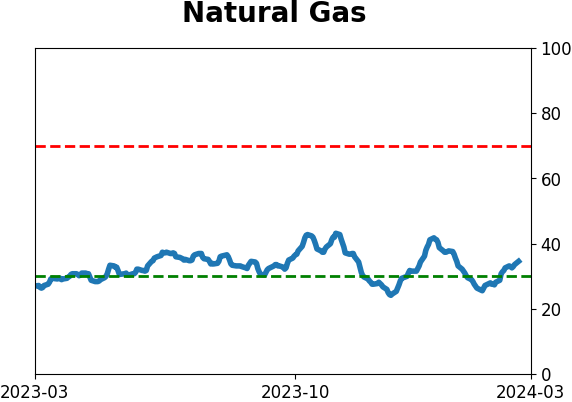
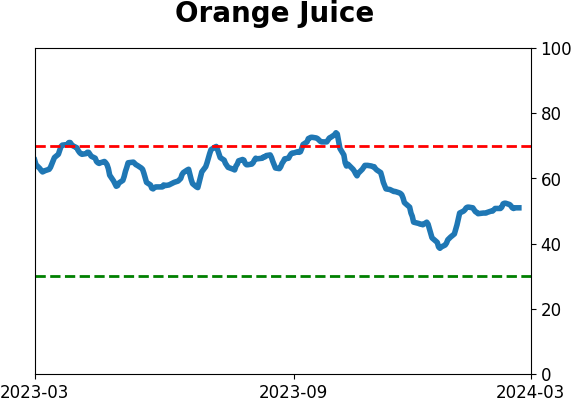
Commodity ETF's - 5-Day Moving Average
|
|