Headlines
|
|
Tech's massive swings signal a long-term change:
Technology stocks have been swinging wildly relative to Industrial stocks. Over the past year, Tech has outperformed Industrials by 2% or more on 28 days, among the most in nearly 100 years. The 2 other instances ultimately led to Tech under-performing.
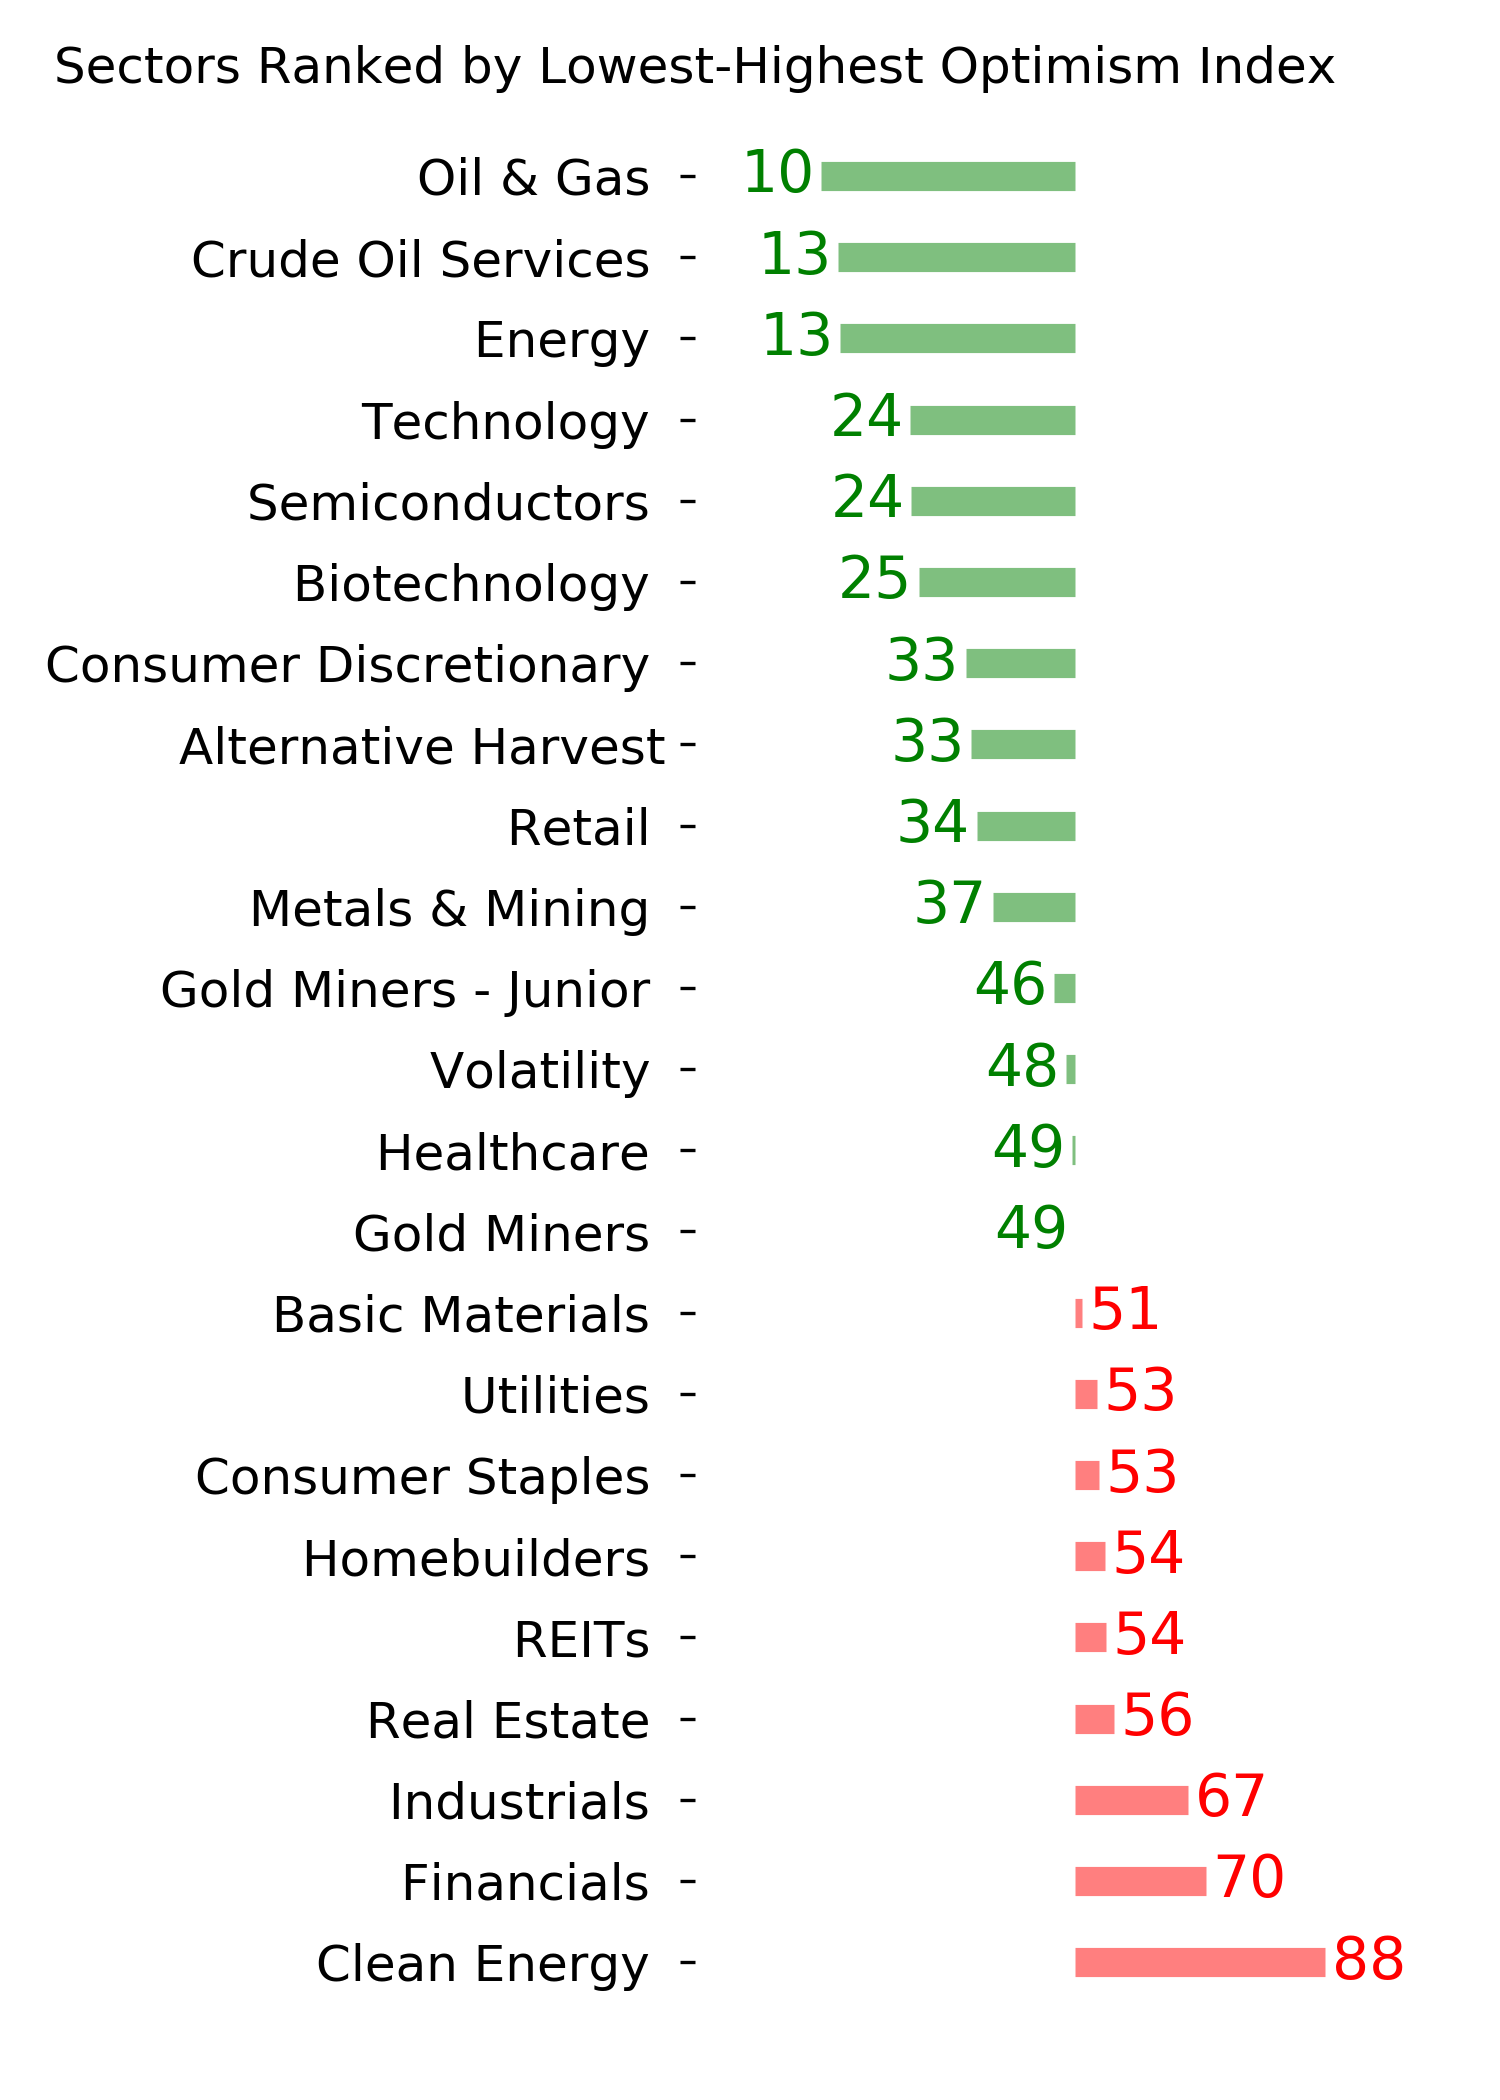
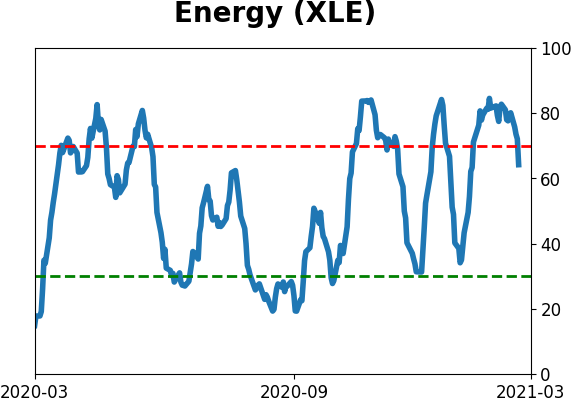
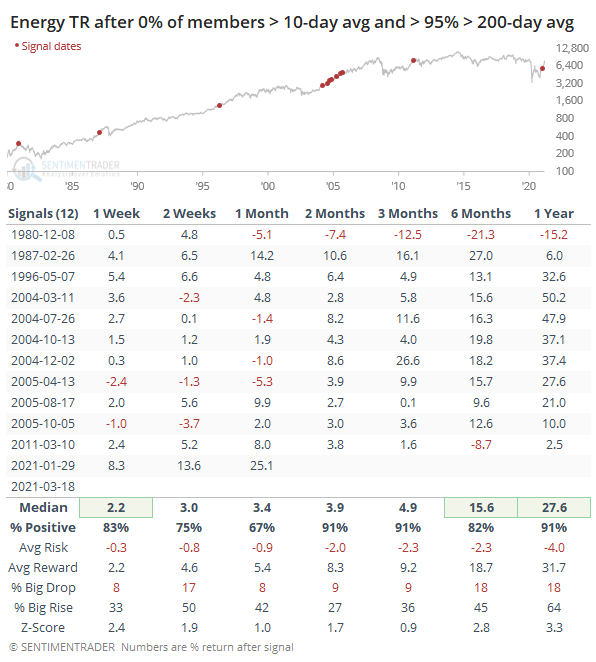
Energy smackdown: Dean noticed an unusual situation in energy stocks with Thursday's selling pressure. No stocks in the sector managed to hold above their short-term 10-day moving averages, while more than 95% of them were still trading above their long-term 200-day moving averages. This never happened from 1952 - 1979, but has triggered a dozen times since then. There was a strong tendency to see a rebound in the months ahead. Only the 1980 instance preceded a peak, with the overall average 1-year return being an impressive +27.6%.
Bottom Line:
See the Outlook & Allocations page for more details on these summaries STOCKS: Weak sell
The extreme speculation registered in January and February is starting to get wrung out. Internal dynamics have mostly held up, so a return to neutral sentiment conditions would improve the forward risk/reward profile substantially. We're still a ways off from that. BONDS: Weak buy
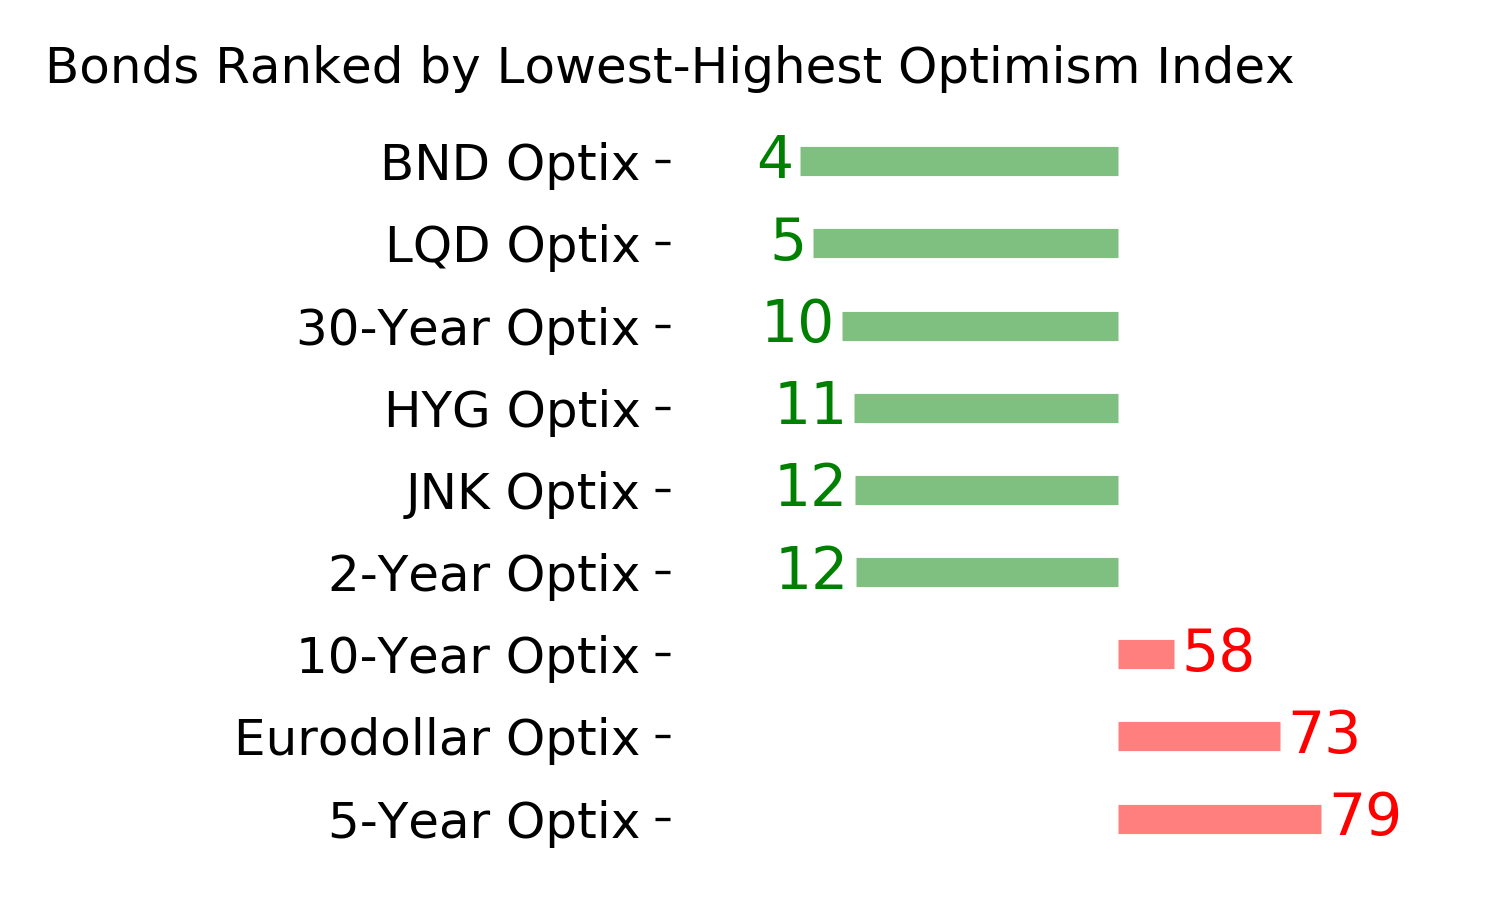
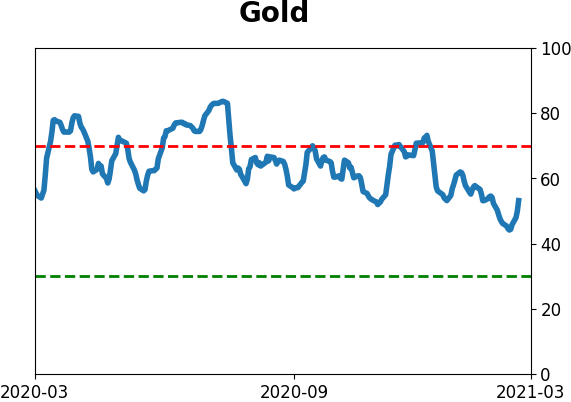
Various parts of the market have been hit in recent weeks, with mild oversold conditions. The Bond Optimism Index is now about as low as it gets during healthy bond market environments. Fixed income isn't responding well, so that needs to be monitored in case it's transitioning to a longer-term negative market environment. GOLD: Weak buy
A dollar trying to rebound from a severe short position has weighed on gold and miners. The types of signals they've given in recent weeks, within the context of their recent surge, have usually resulted in higher prices over a medium- to long-term time frame. Like bonds, gold and miners aren't responding very well, and this needs to be monitored.
|
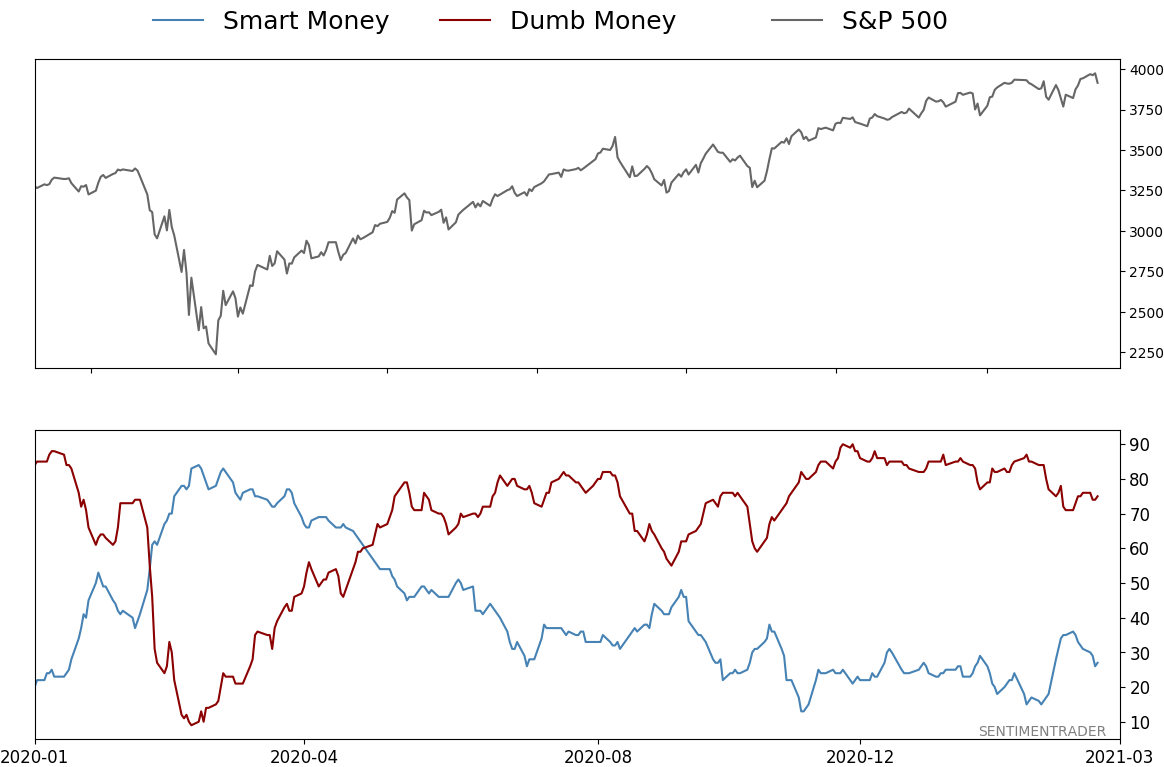
Smart / Dumb Money Confidence
|
Smart Money Confidence: 27%
Dumb Money Confidence: 75%
|
|
Risk Levels
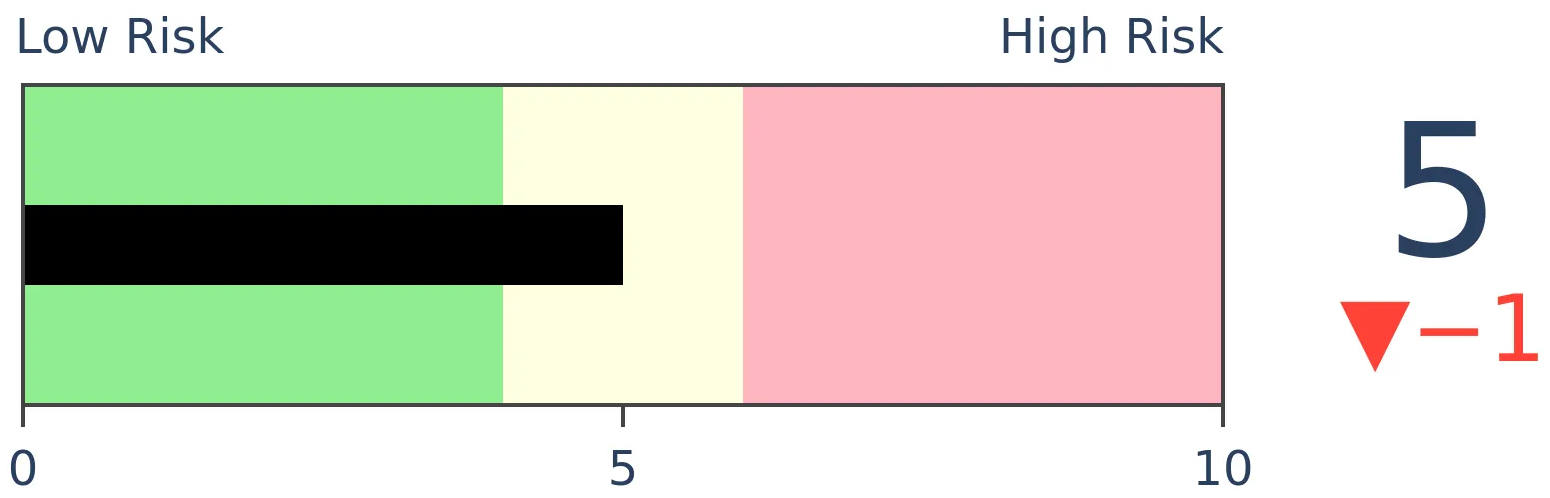
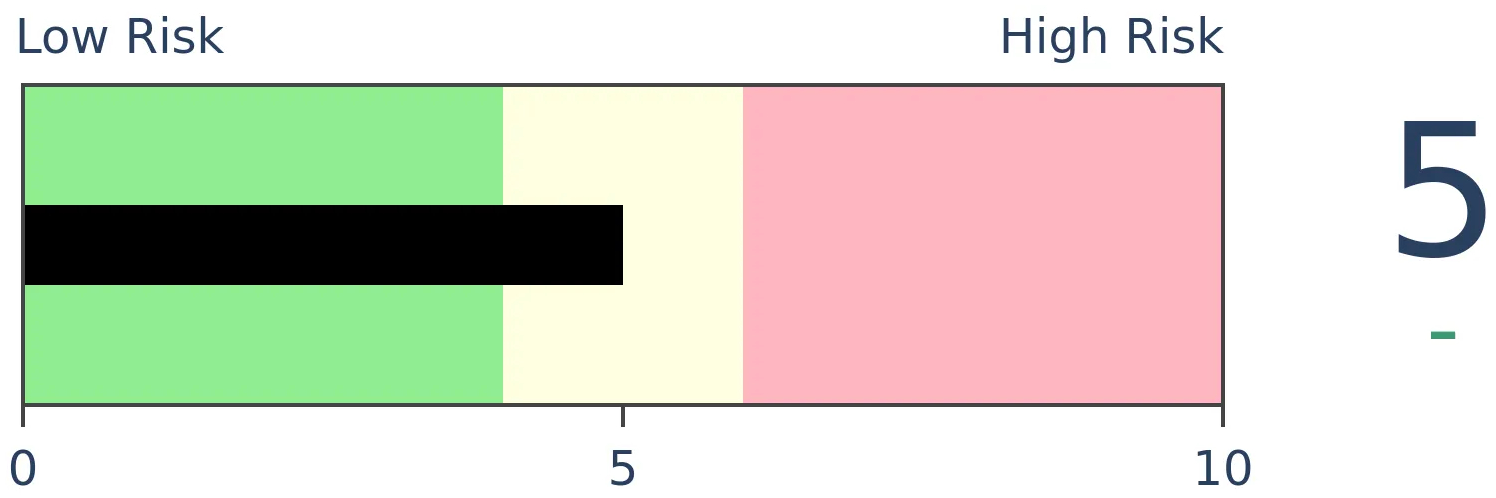
Stocks Short-Term
|
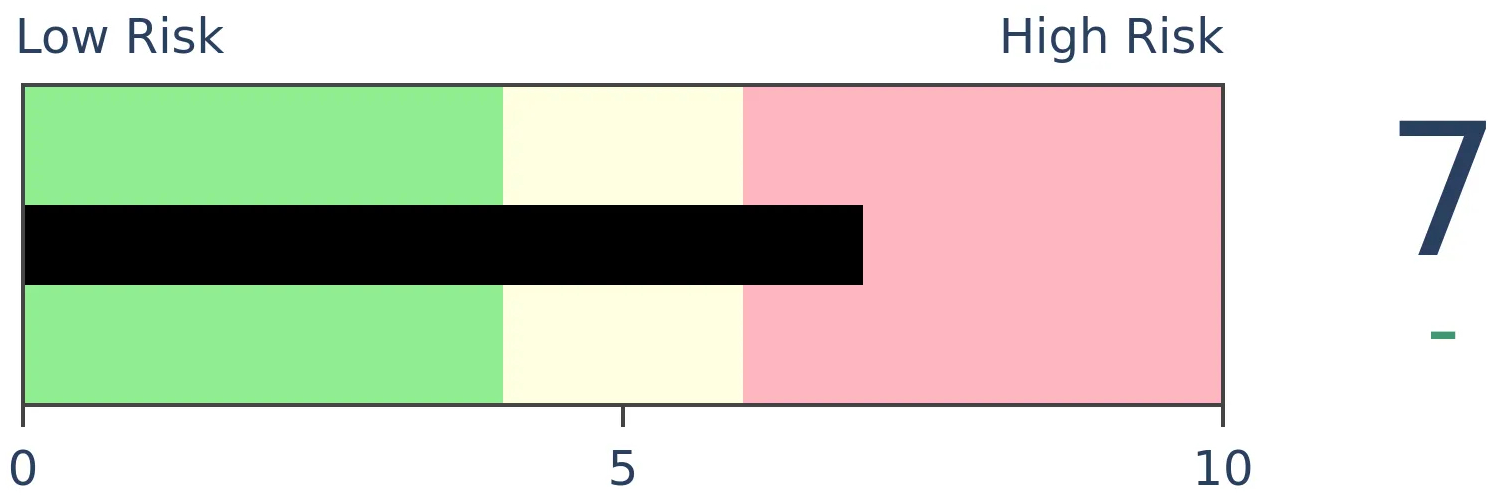
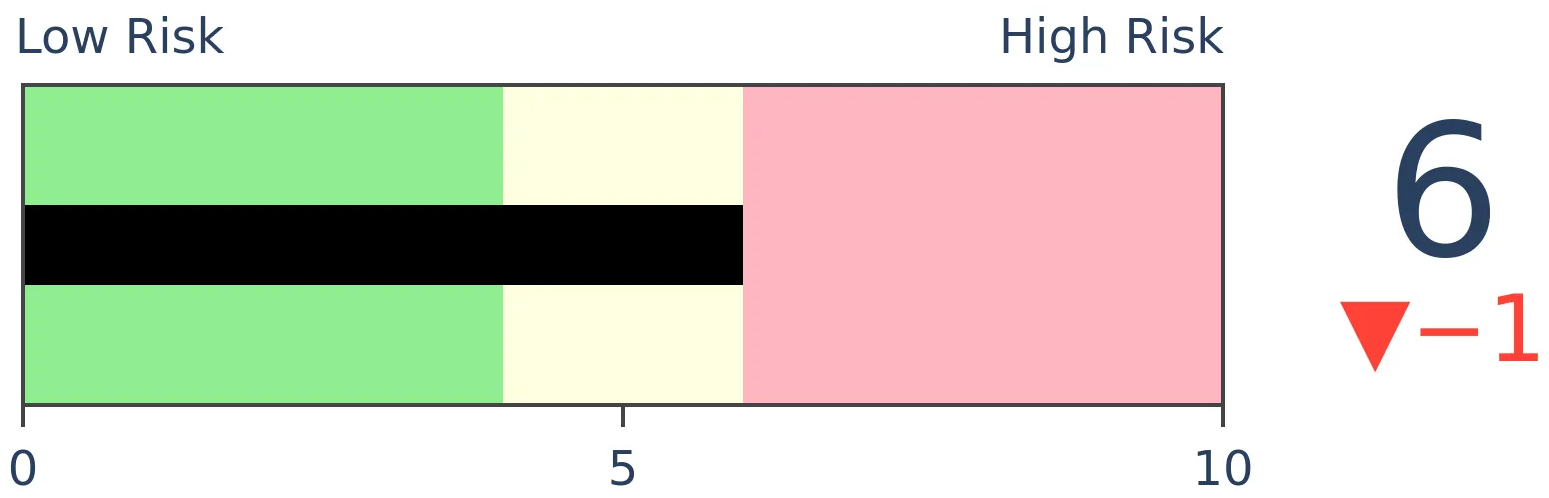
Stocks Medium-Term
|
|
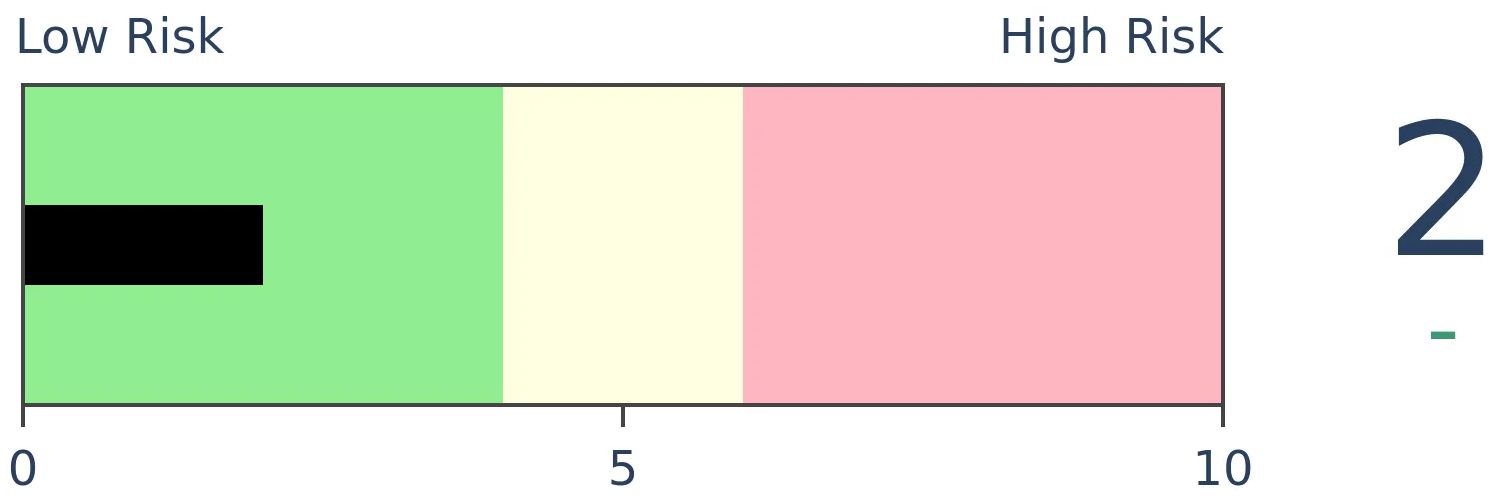
Bonds
|
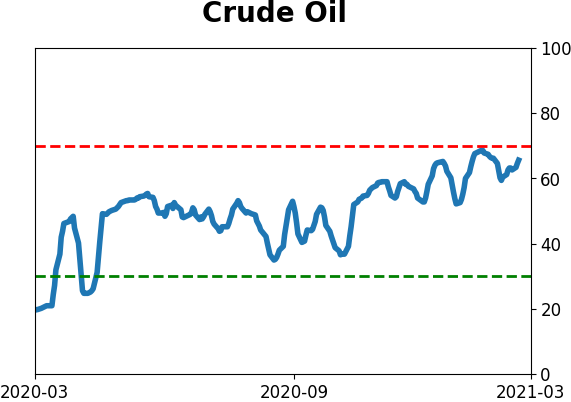
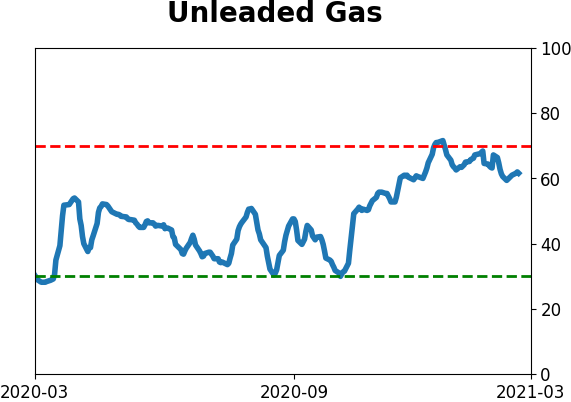
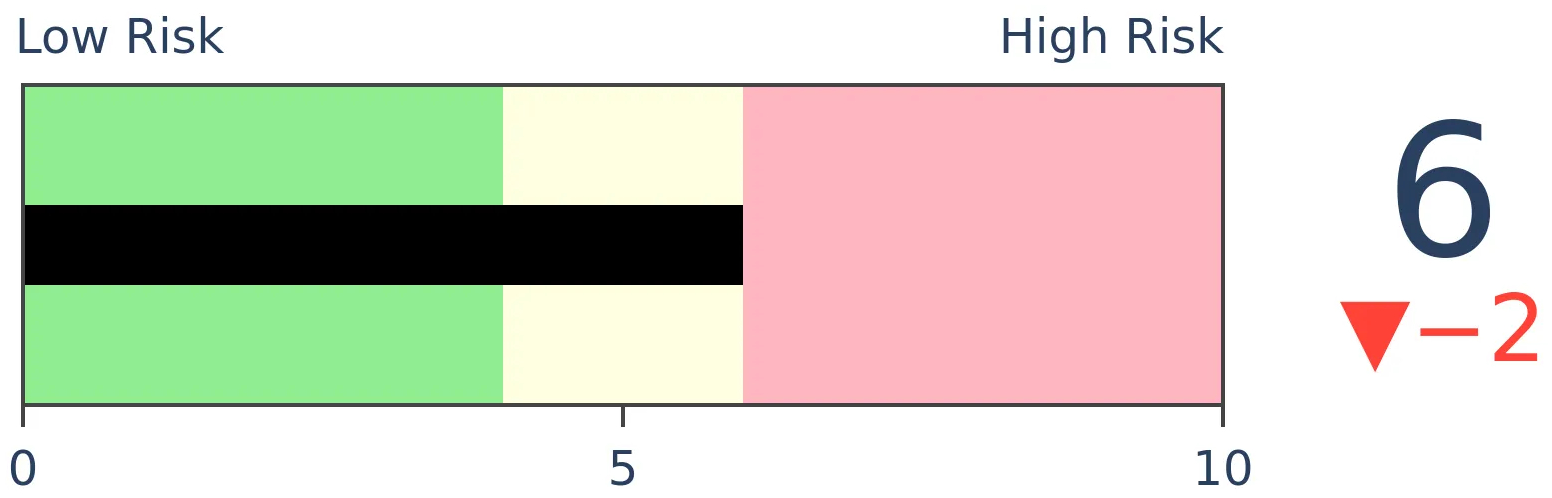
Crude Oil
|
|
Gold
|
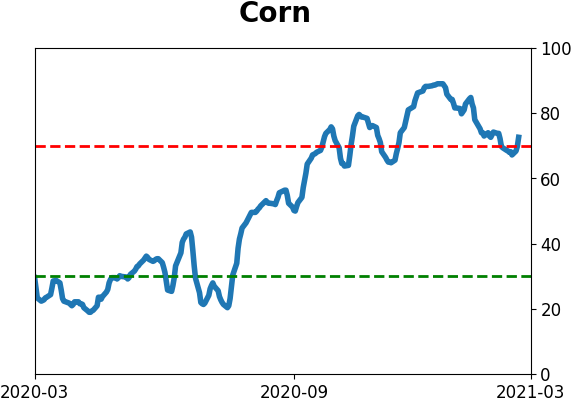
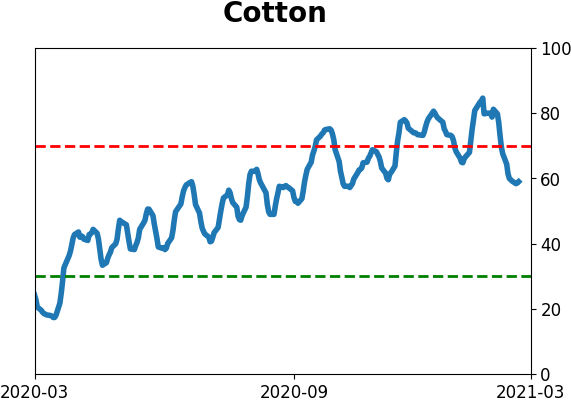
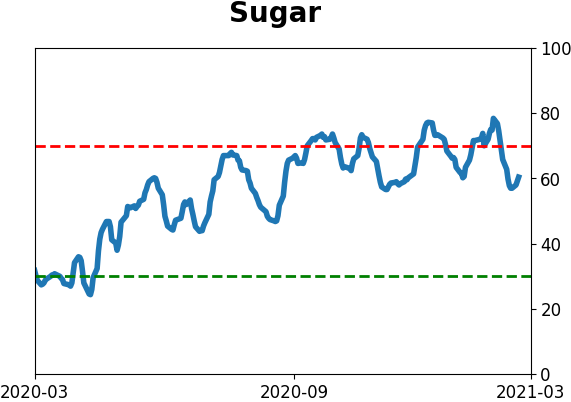
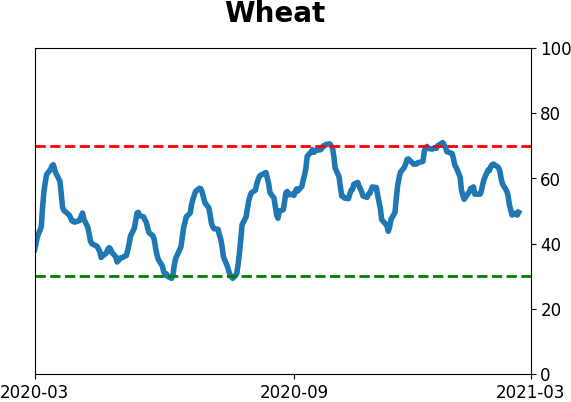
Agriculture
|
|
Research
BOTTOM LINE
Technology stocks have been swinging wildly relative to Industrial stocks. Over the past year, Tech has outperformed Industrials by 2% or more on 28 days, among the most in nearly 100 years. The 2 other instances ultimately led to Tech under-performing.
FORECAST / TIMEFRAME
None
|
There has been a lot of rotation going on under the surface. We've touched on that in a few different ways, either looking at relative returns in indexes or factors like Growth versus Value (here and here).
Mark Hulbert, writing in Barron's, noted the Nasdaq's sudden snapback versus the Dow Industrials the other day. Once again, the Nasdaq surged relative to the Dow, adding to the count of outsized moves in recent months.
We certainly saw that at the top of the dot-com bubble. Over the three months prior to that top, there were no fewer than 14 trading sessions in which the Nasdaq's alpha over the Dow was at least two percentage points. No other three-month period over the past 50 years has seen as many large positive alphas between the two indexes.
Going back further, we can look at the daily changes in the total return in Technology versus Industrial stocks. The chart below shows a running count of how many days there were in the past year when Tech outperformed Industrials by 2% or more. We're only focusing on days when Tech outperformed by a large degree - it's a similar picture when including 2% gains or losses.
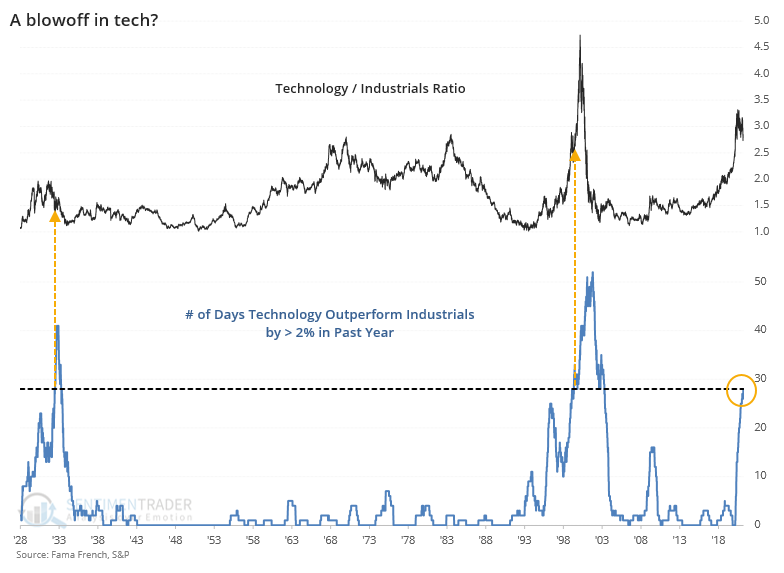
This was not a precise signal. It triggered after the peak between Technology and Industrials in the 1930s, and well before the peak in 1999. The table below shows forward returns for the S&P 500 and the relevant factors once this reached the current level of 28 days.
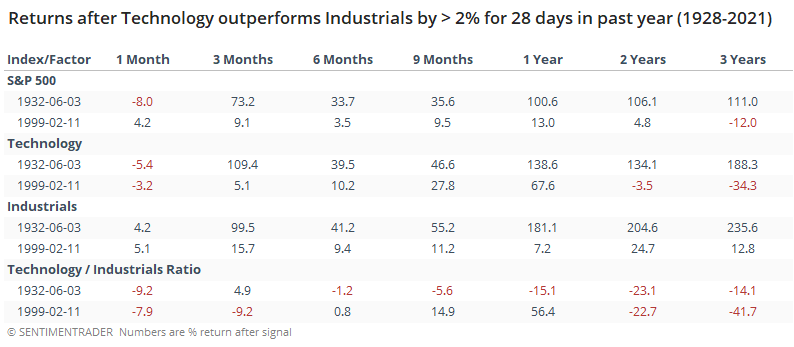
While it wasn't a good timing signal, the overriding message was clear, or at least as clear as it can be with a sample size of 2. Over the next 2-3 years, Technology greatly under-performed Industrials. This is much more of an environmental clue as opposed to any kind of actionable timing signal. It's another hint that the severe rotations among indexes, sectors, and factors in recent weeks and months are signaling a turn in long-term trends.
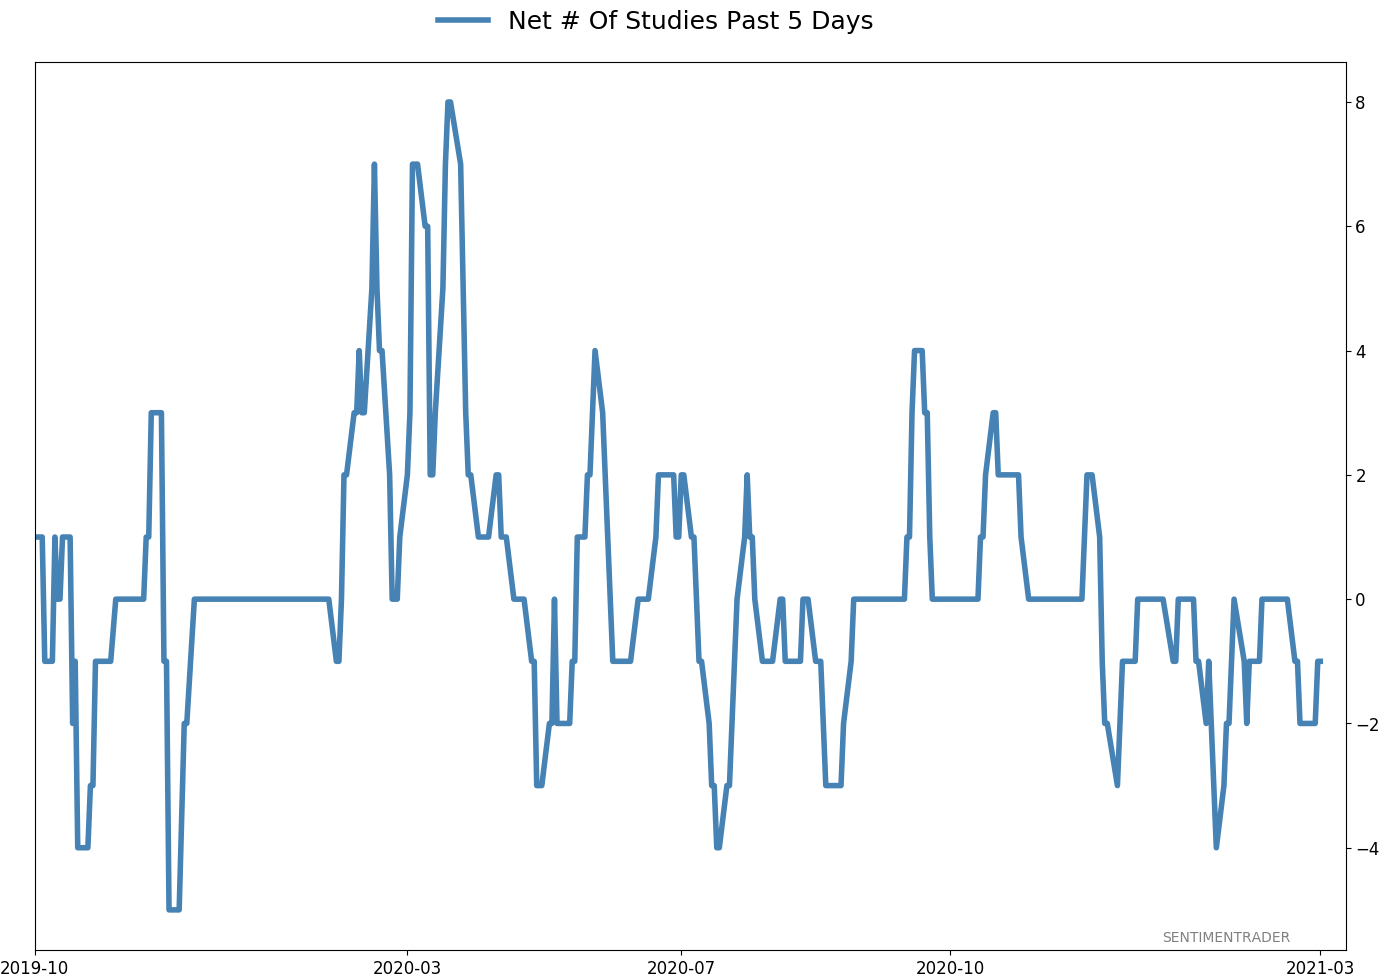
Active Studies
| Time Frame | Bullish | Bearish | | Short-Term | 0 | 0 | | Medium-Term | 2 | 10 | | Long-Term | 16 | 4 |
|
Indicators at Extremes
Portfolio
| Position | Description | Weight % | Added / Reduced | Date | | Stocks | RSP | 4.9 | Reduced 4% | 2021-02-09 | | Bonds | 30.0% BND, 8.8% SCHP | 38.8 | Added 15.1% | 2021-02-18 | | Commodities | GCC | 2.3 | Reduced 2.1%
| 2020-09-04 | | Precious Metals | GDX | 9.0 | Added 0.1% | 2021-02-18 | | Special Situations | 7.3% XLE, 4.8% PSCE | 12.1 | Reduced 5.6% | 2021-02-18 | | Cash | | 32.8 | | |
|
Updates (Changes made today are underlined)
With a market that has seen the kinds of broad participation and big breath thrusts like we did in the fall, it's hard to become too negative. Those kinds of conditions have consistently preceded higher returns over the next 6-12 months. It's the interim that's more of an issue. Even conditions like that haven't prevented some shorter-term pullbacks. And when we combine an environment where speculation is rampant and recent days have seen an increase in cracks under the surface of the indexes, it's enough to become more defensive over a short- to medium-term time frame. We still don't have much confirmation from the price action in the indexes, so those who are more conservative would likely wait before increasing cash levels. I've decreased risk exposure a bit more, mainly in terms of energy stocks and the ANGL fund, while adding more to the broader bond market. RETURN YTD: 5.8% 2020: 8.1%, 2019: 12.6%, 2018: 0.6%, 2017: 3.8%, 2016: 17.1%, 2015: 9.2%, 2014: 14.5%, 2013: 2.2%, 2012: 10.8%, 2011: 16.5%, 2010: 15.3%, 2009: 23.9%, 2008: 16.2%, 2007: 7.8%
|
|
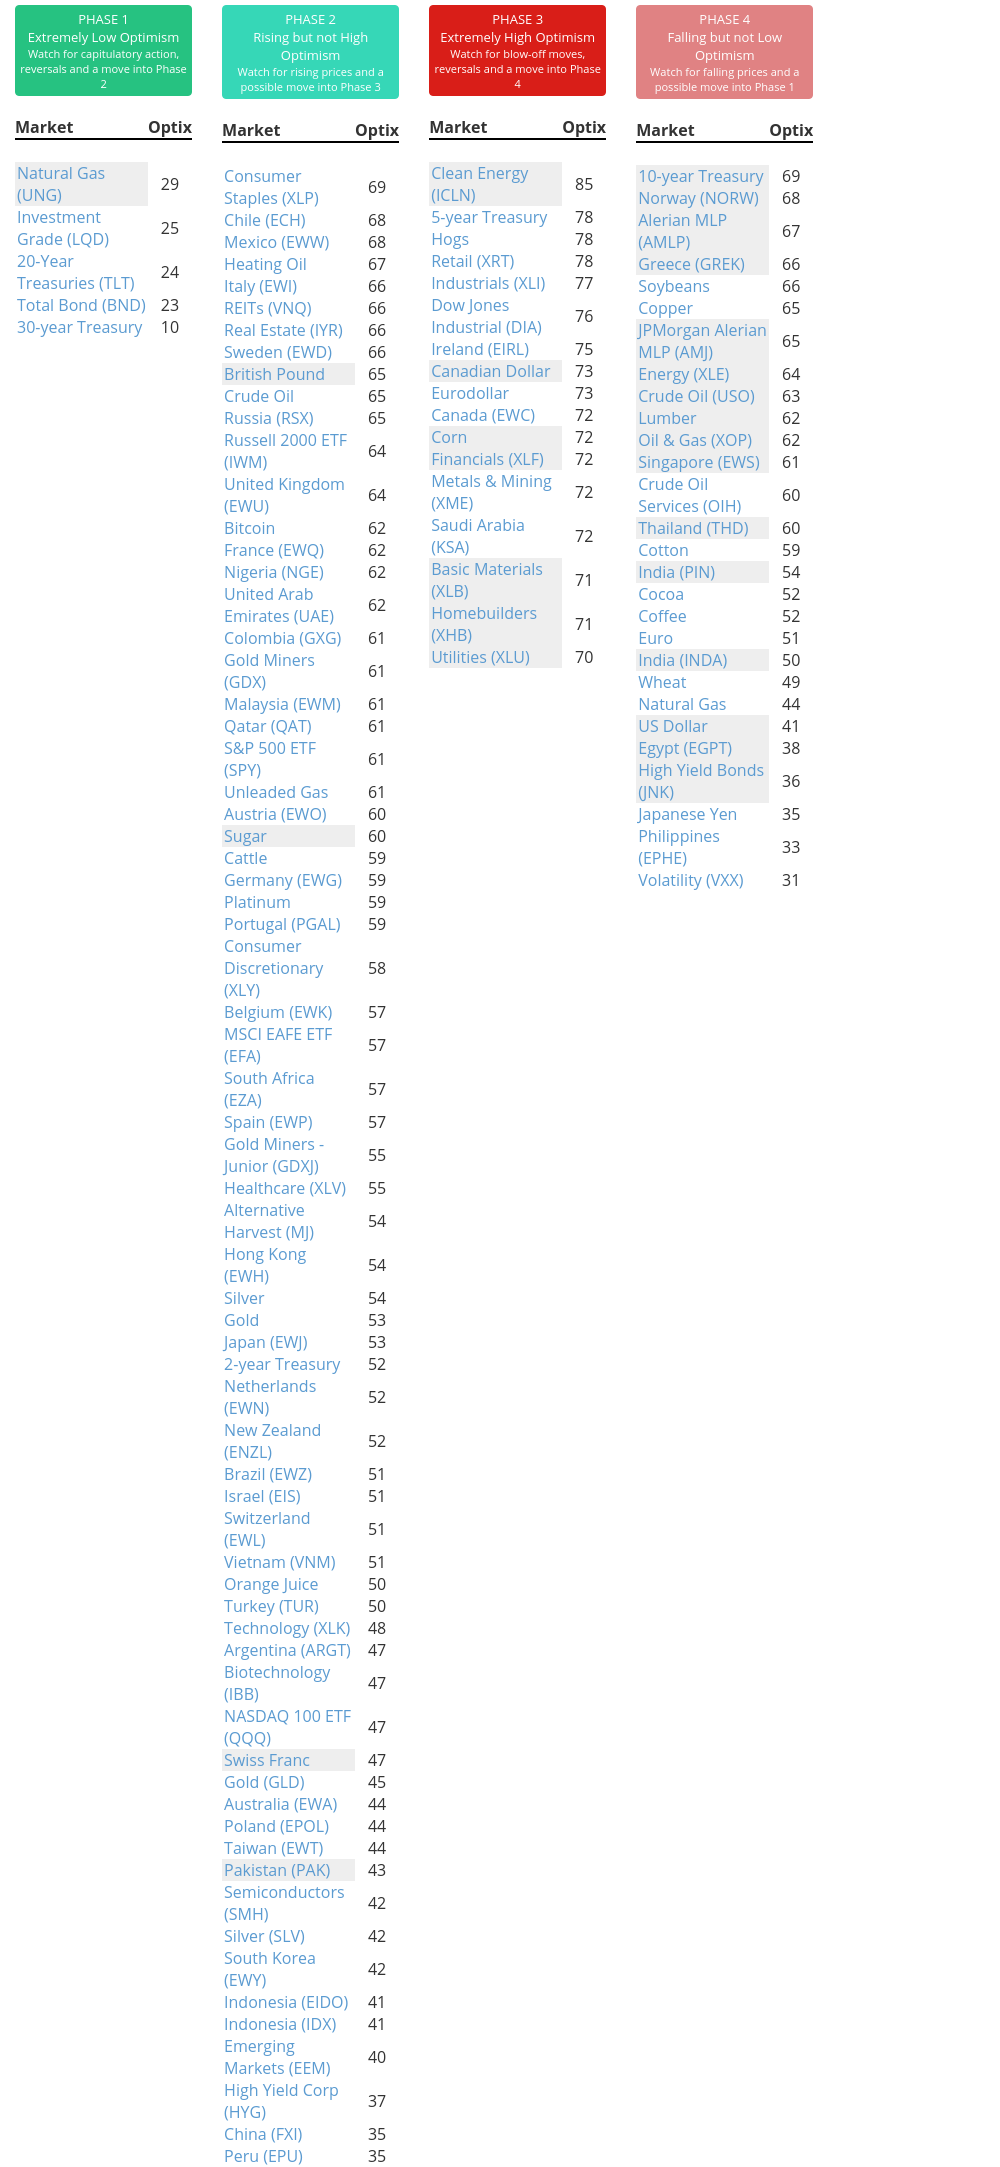
Phase Table
Ranks
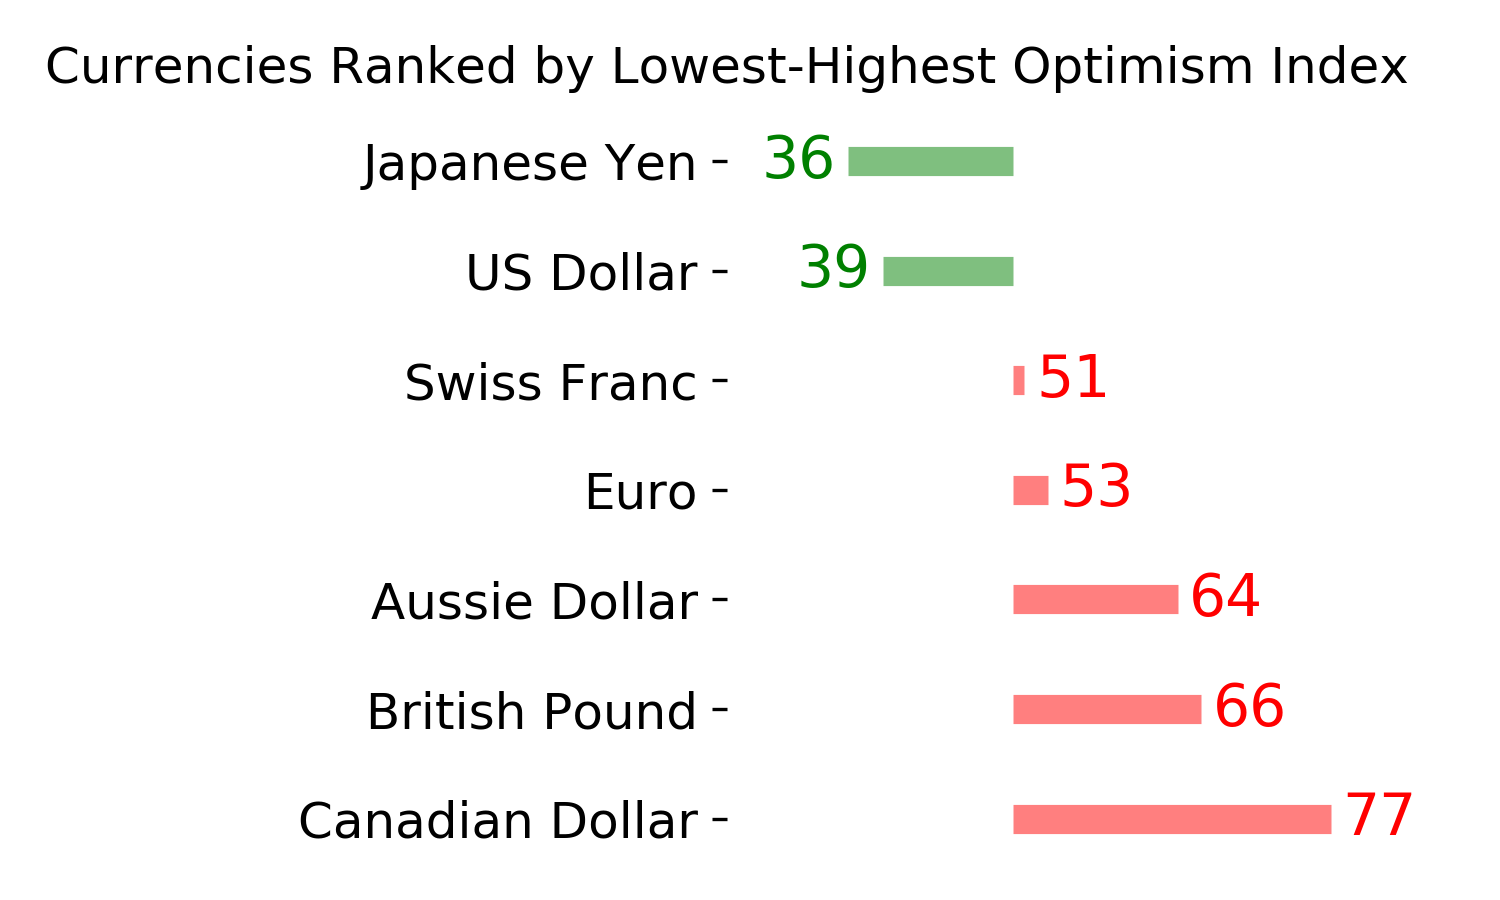
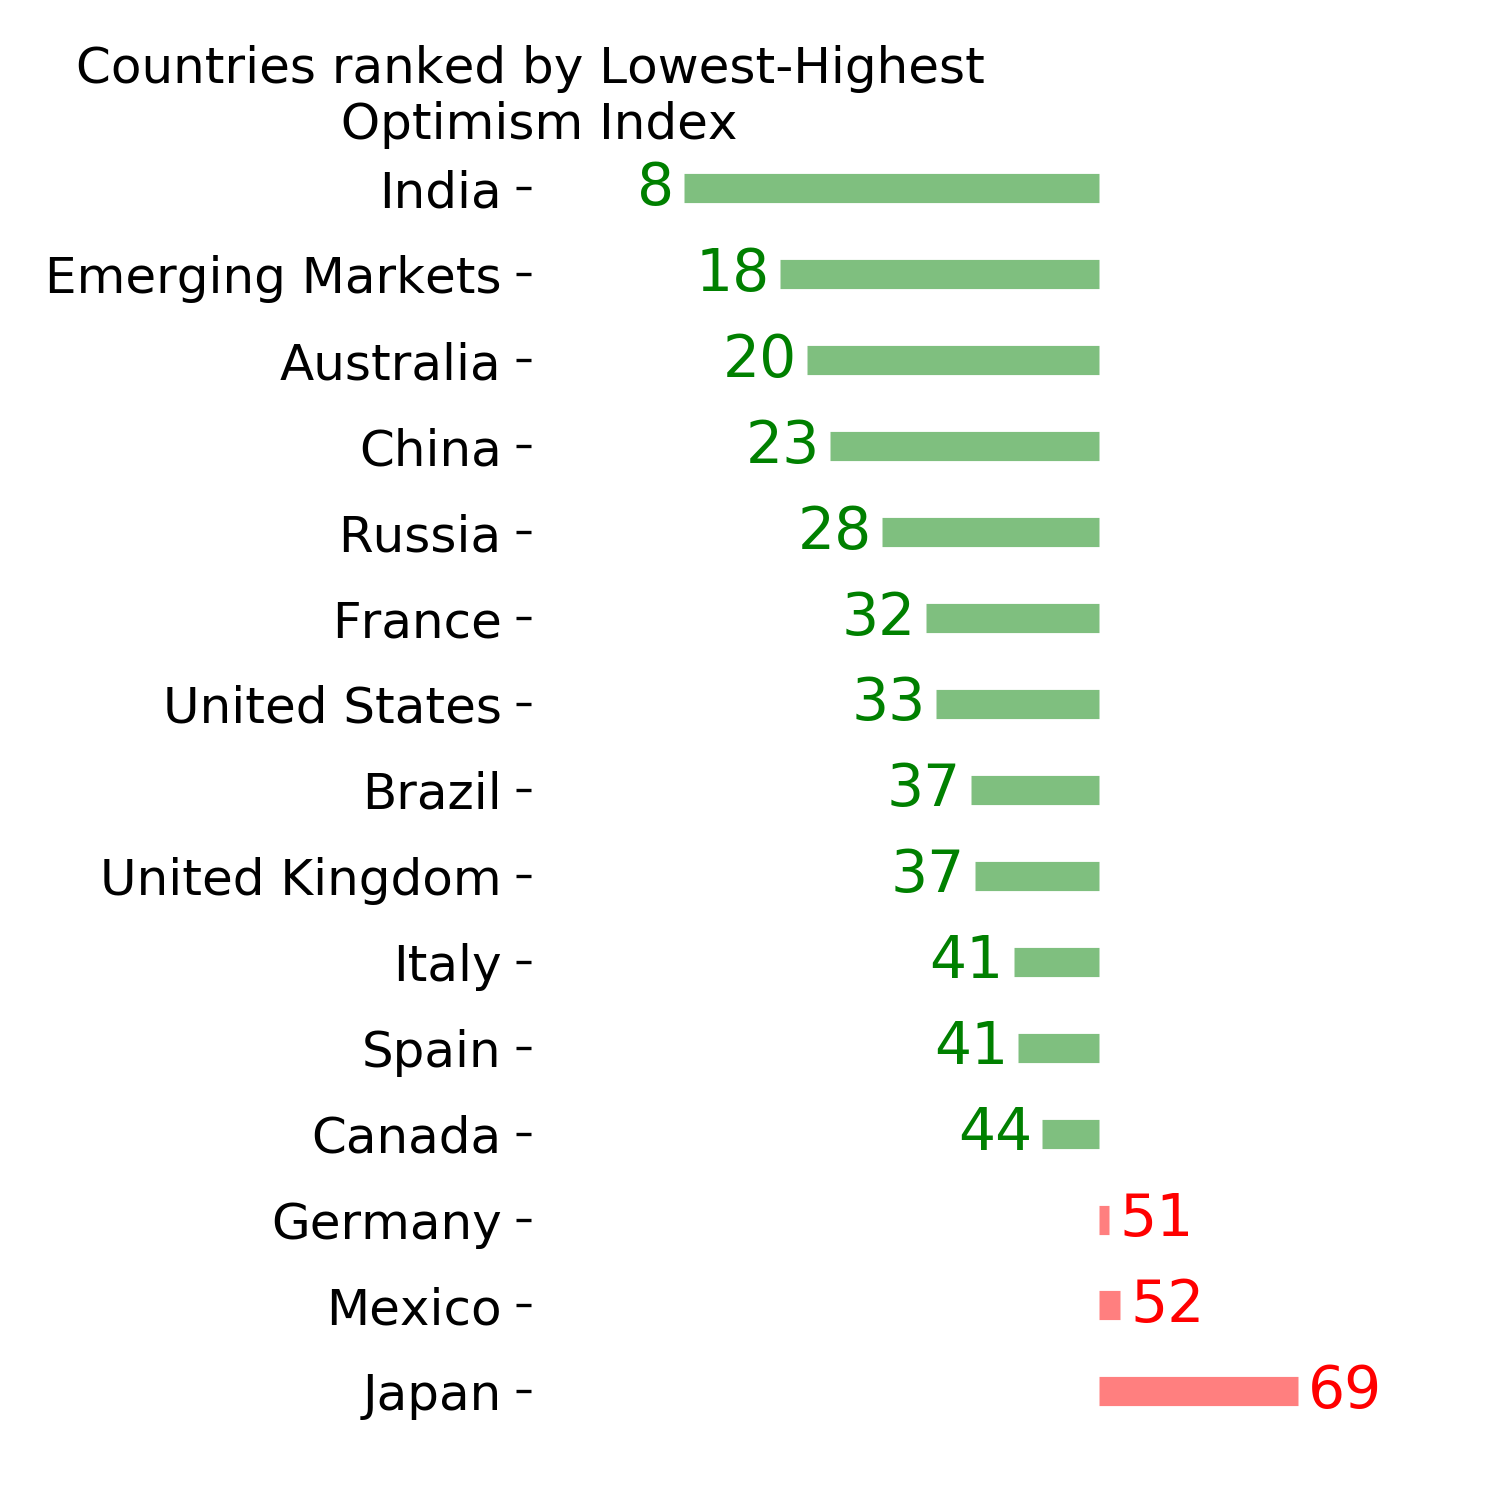
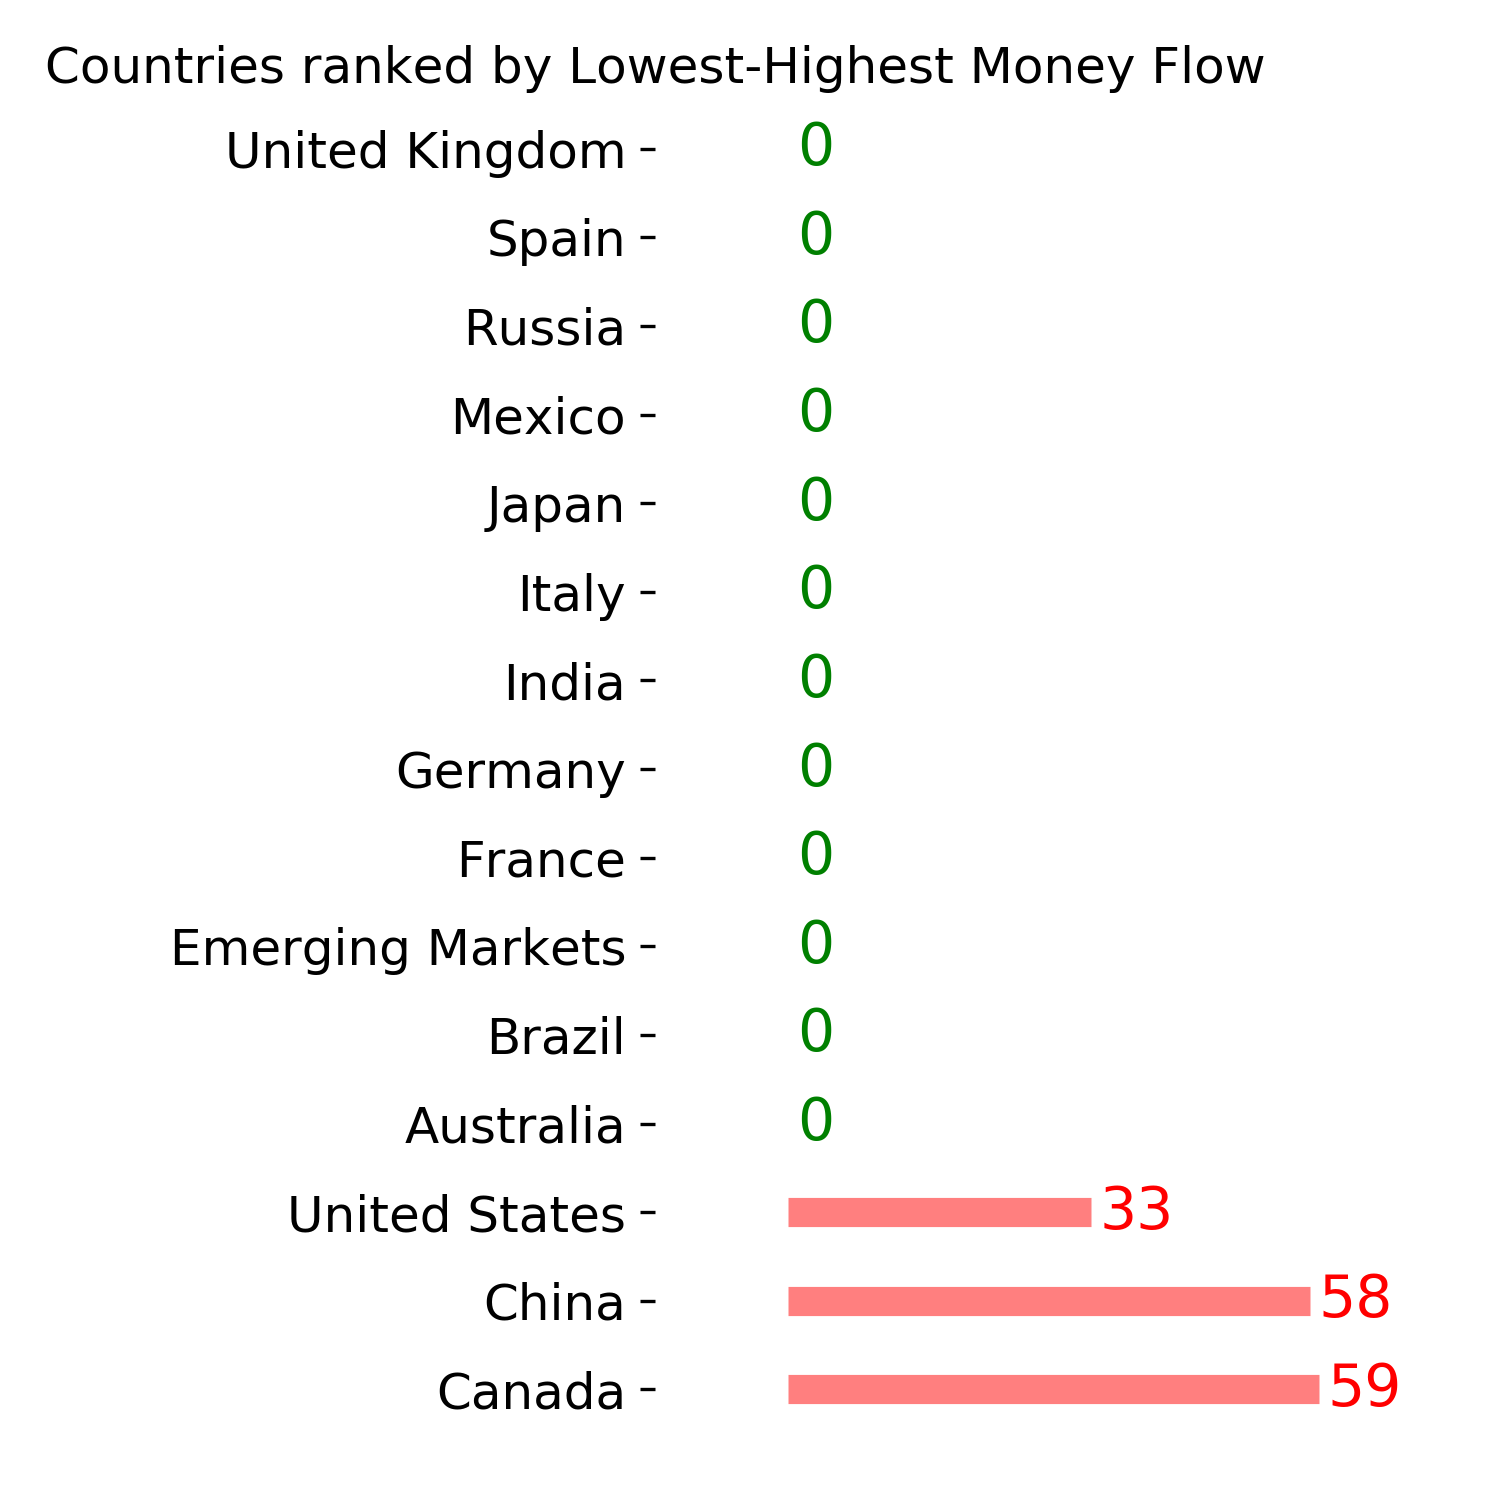
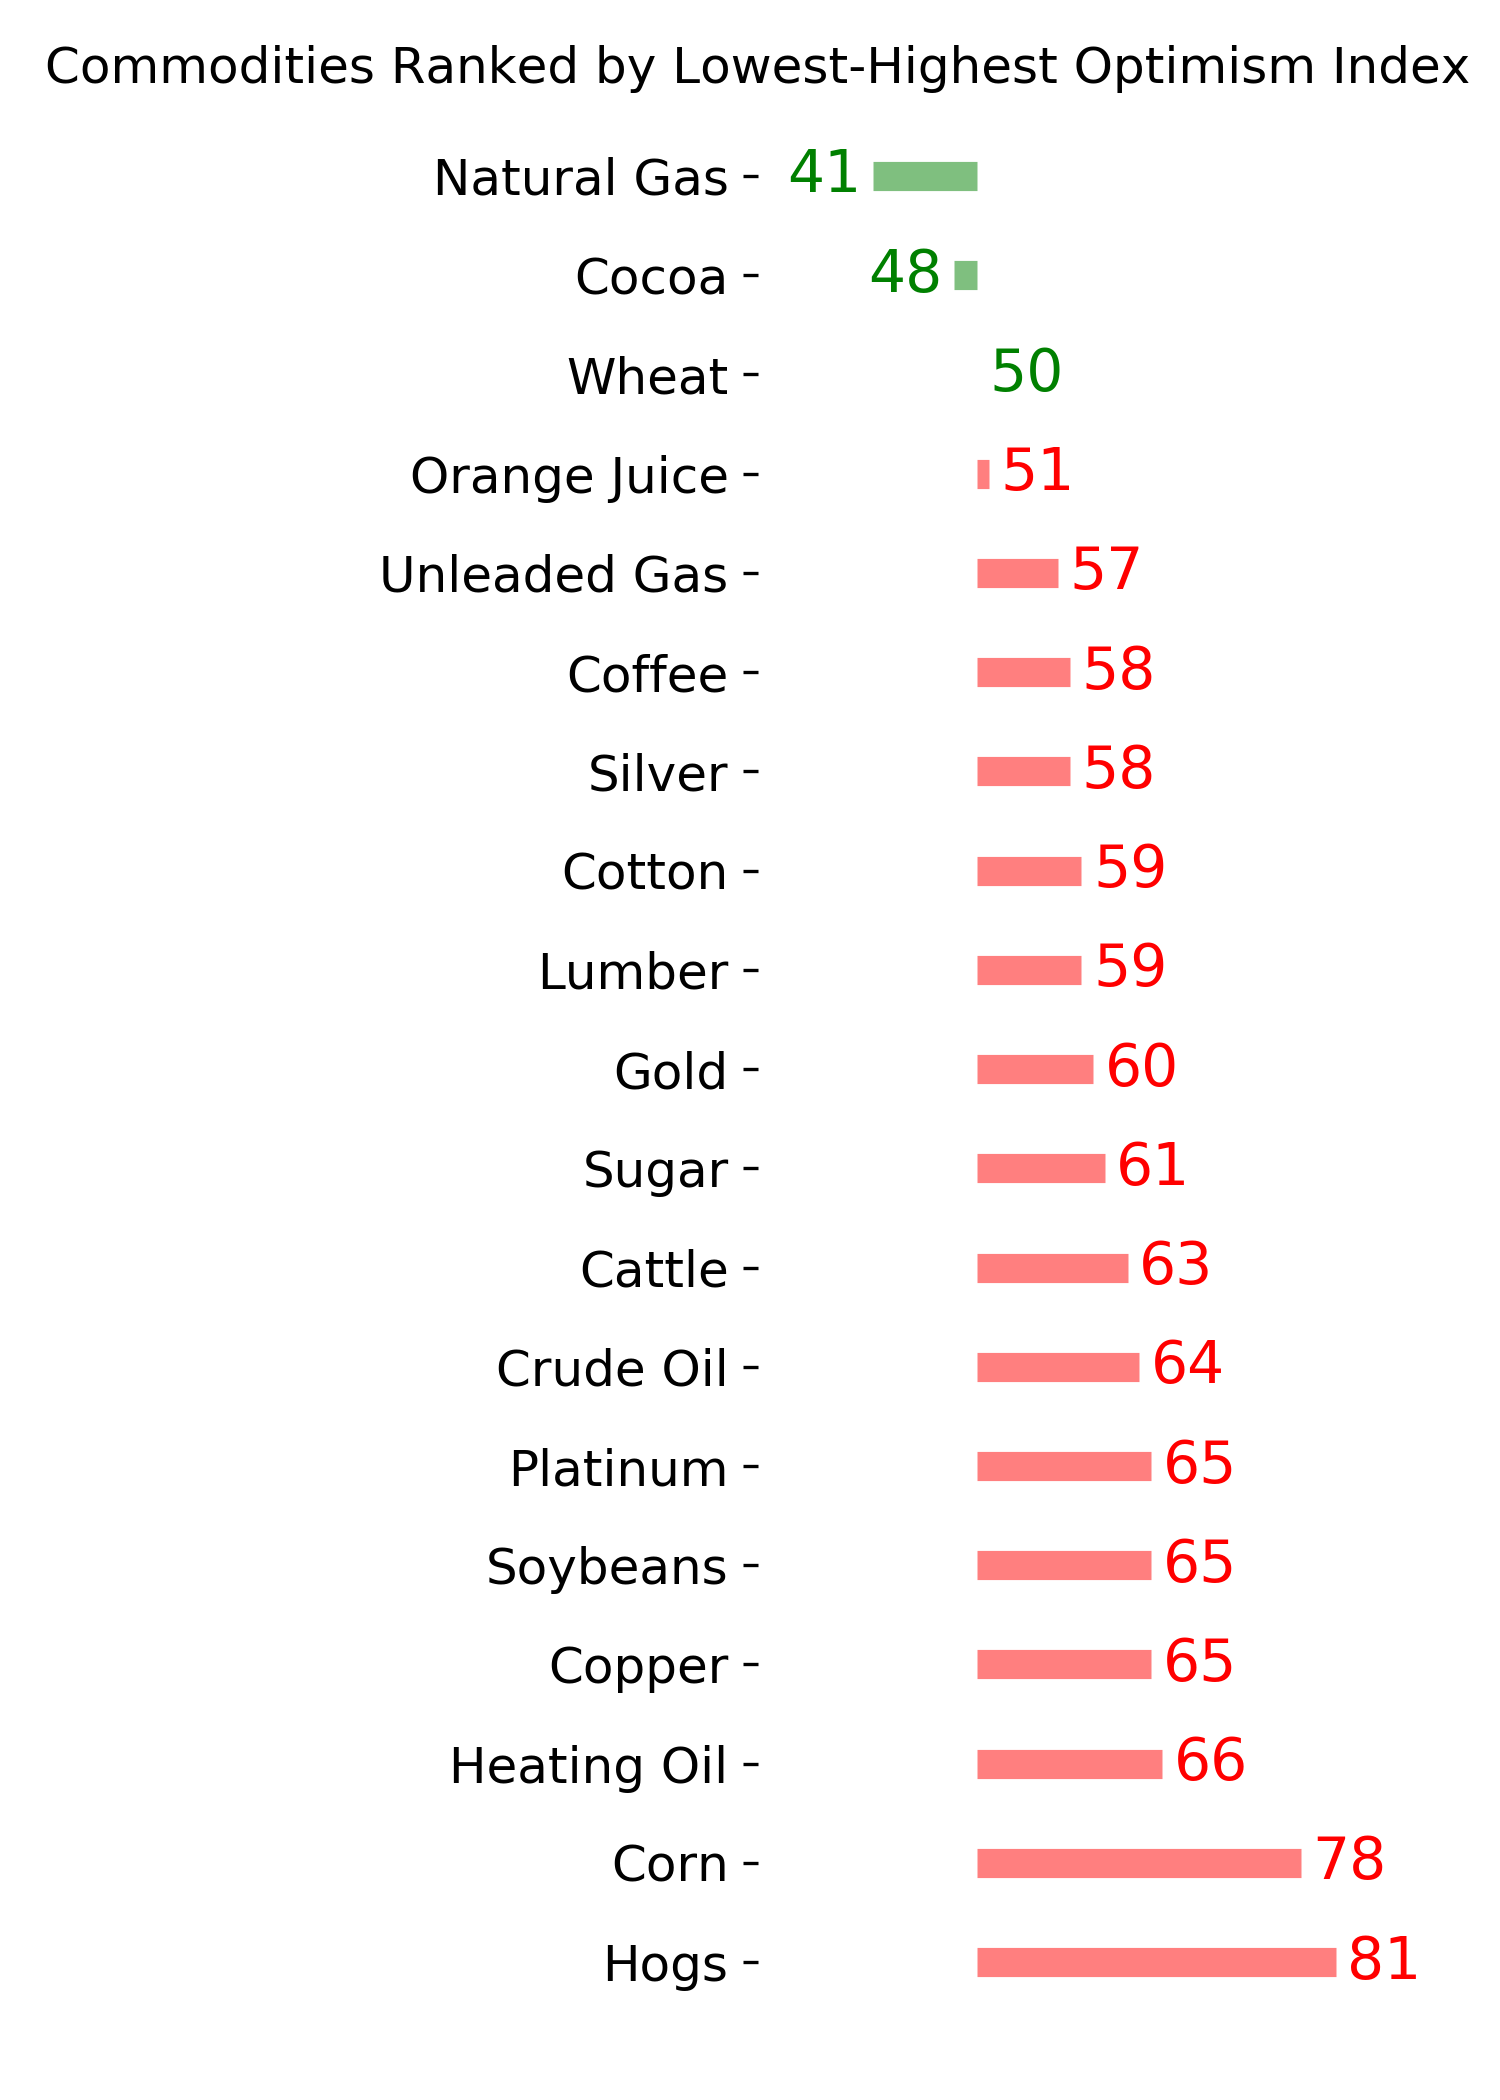
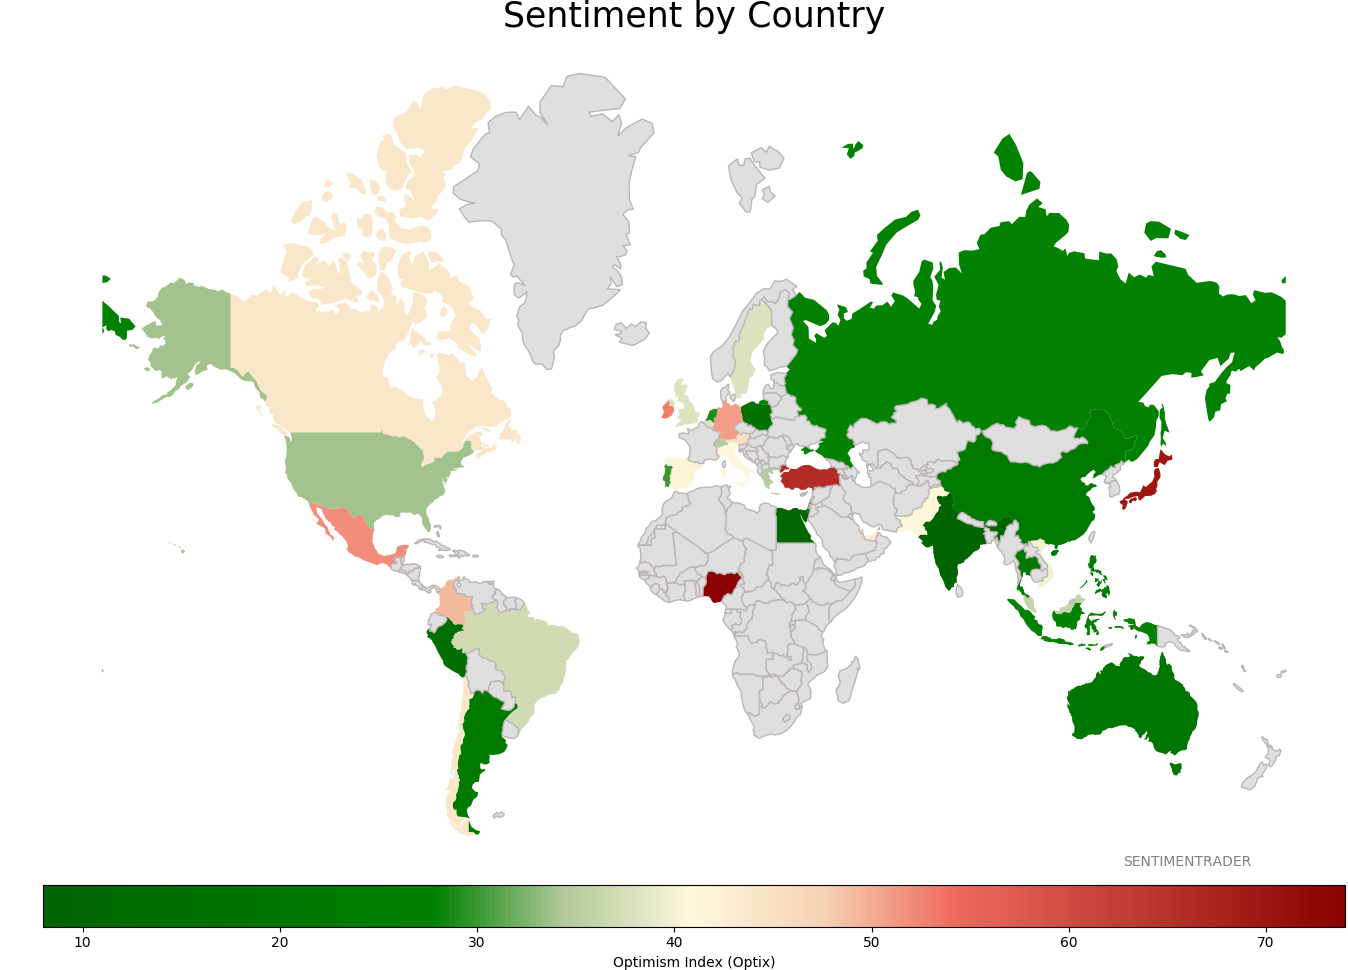
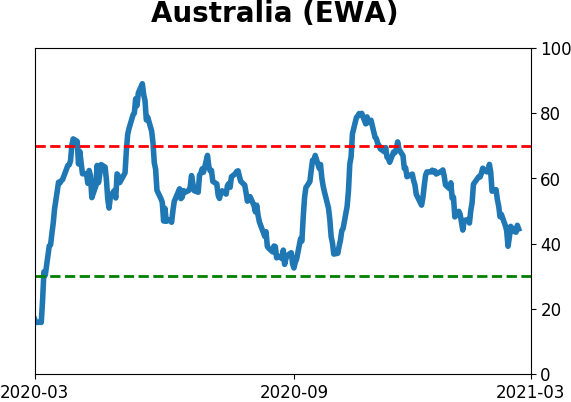
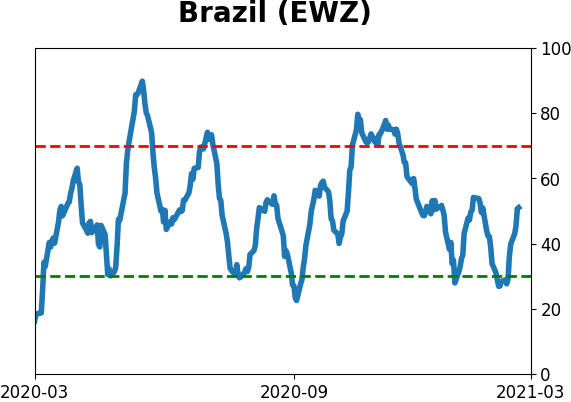
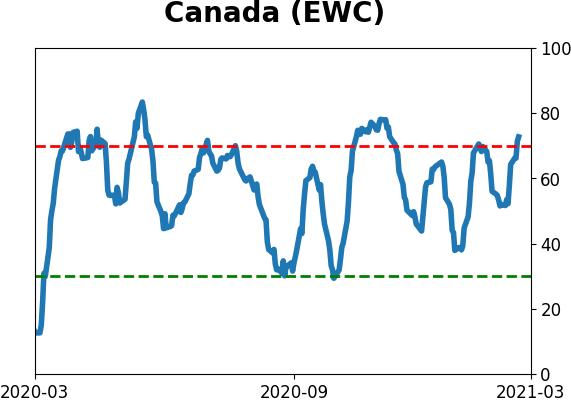
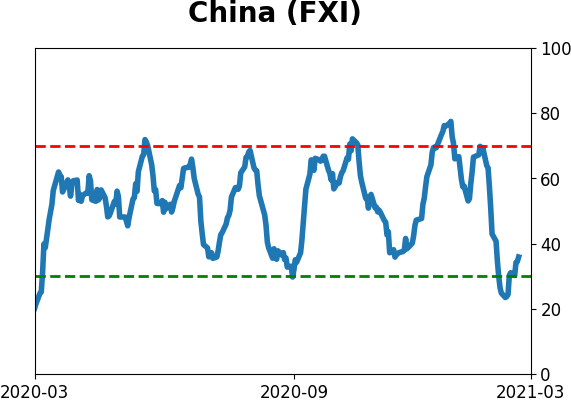
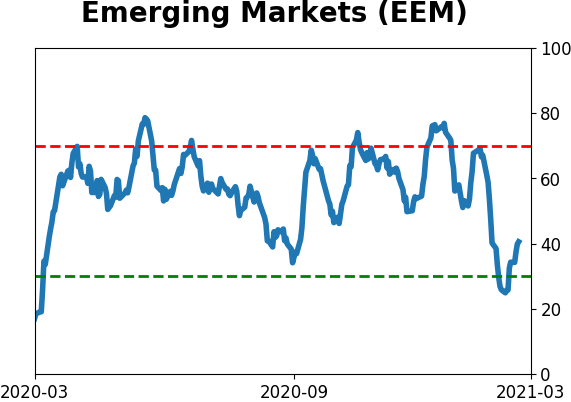
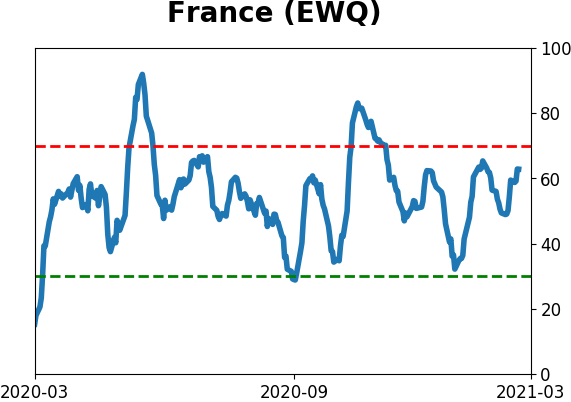
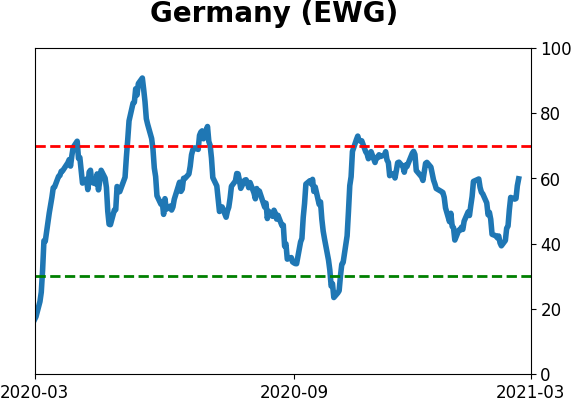
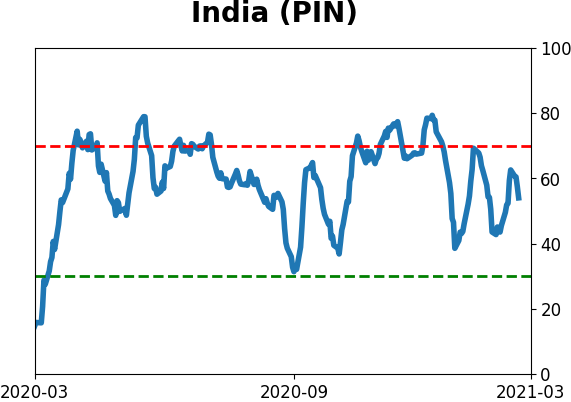
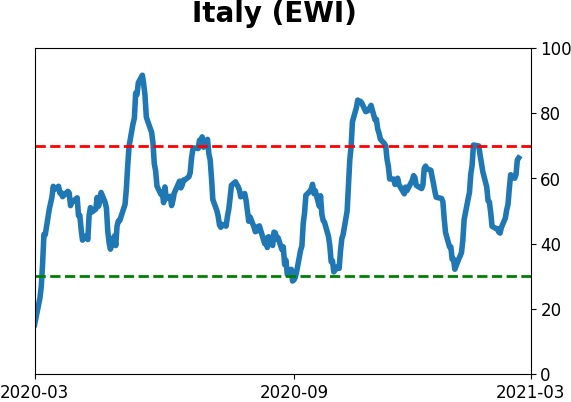
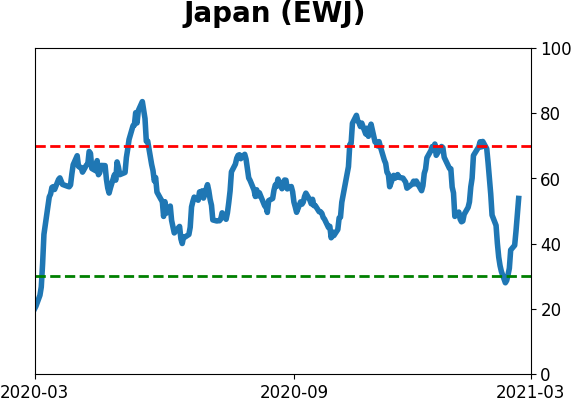
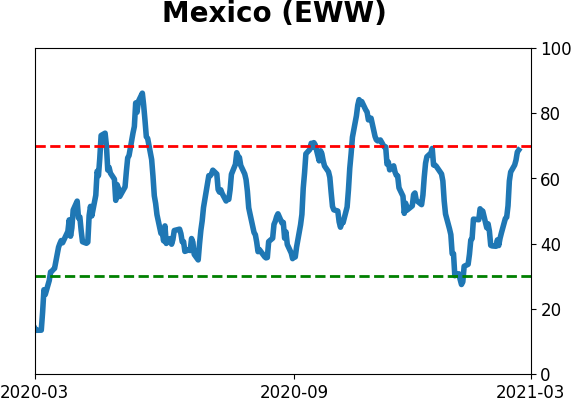
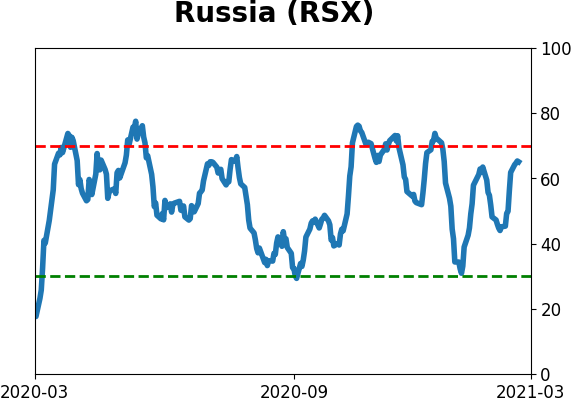
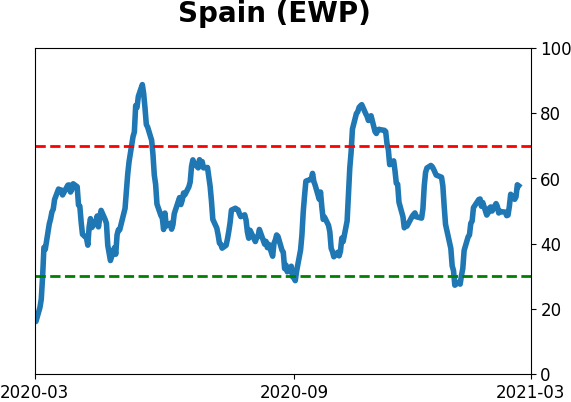
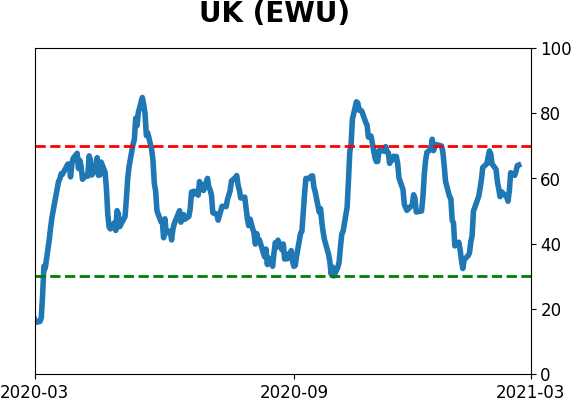
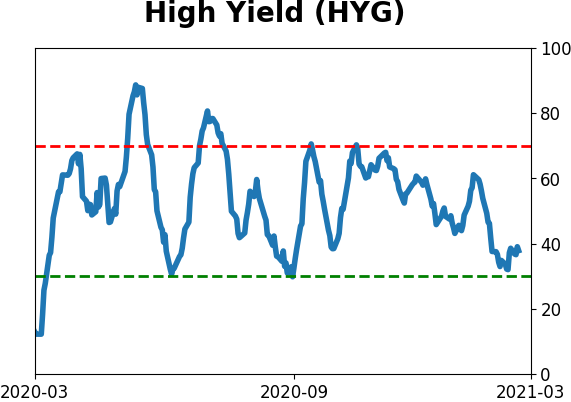
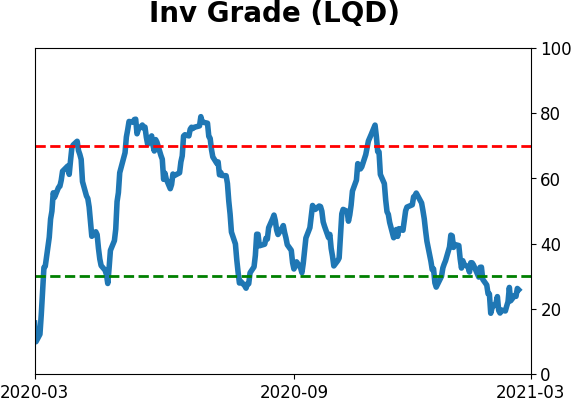
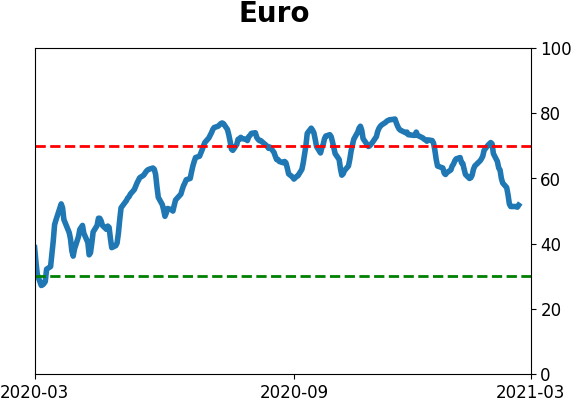
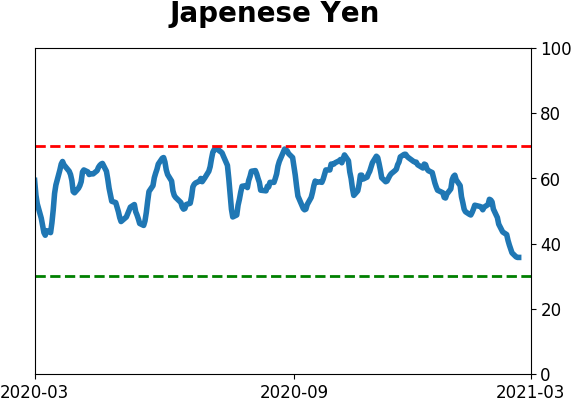
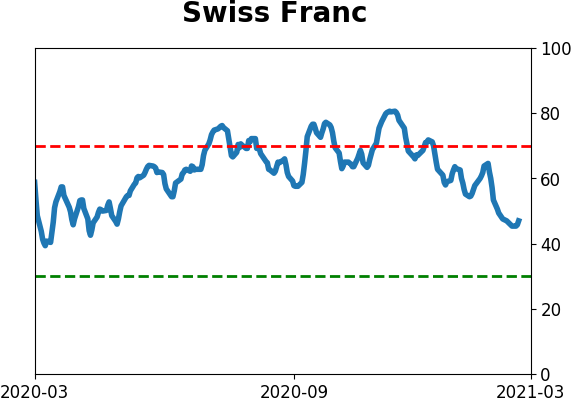
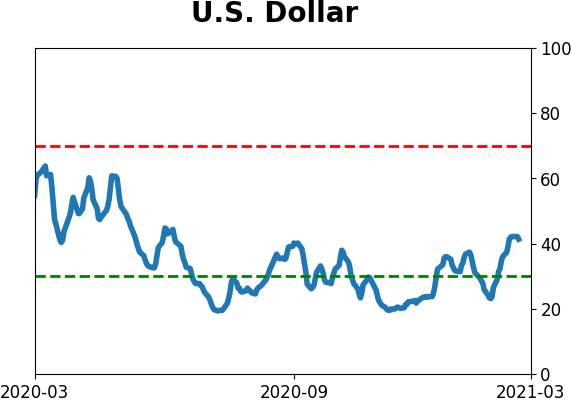
Sentiment Around The World
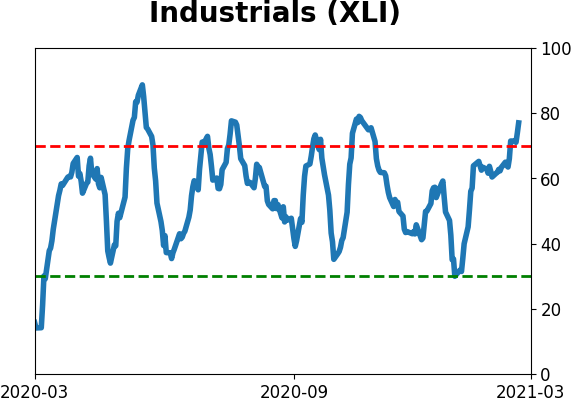
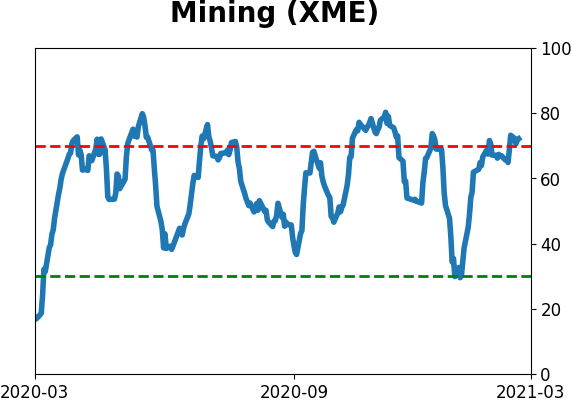
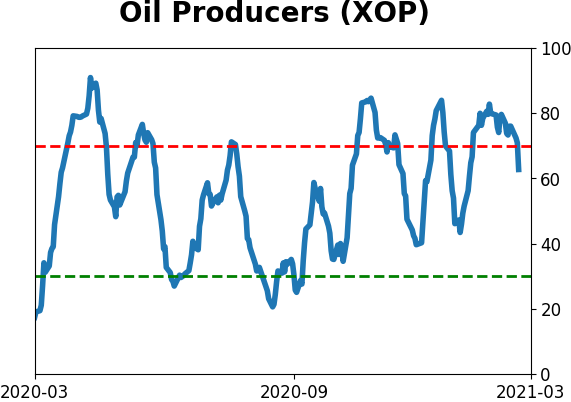
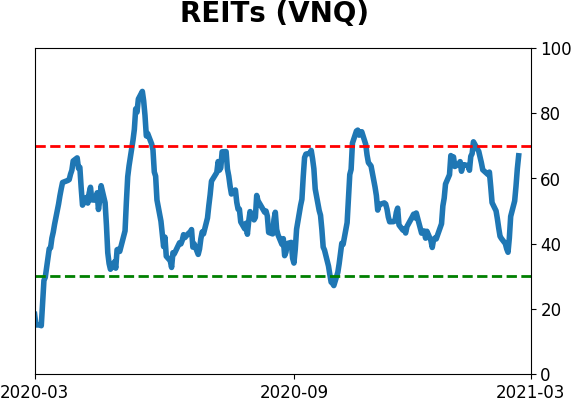
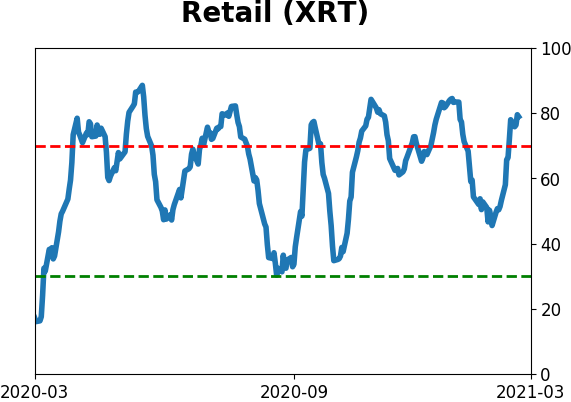
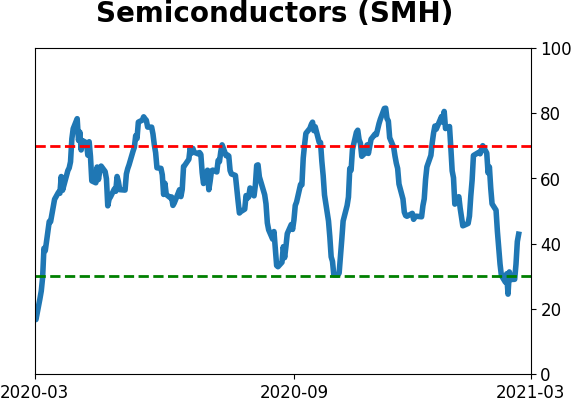
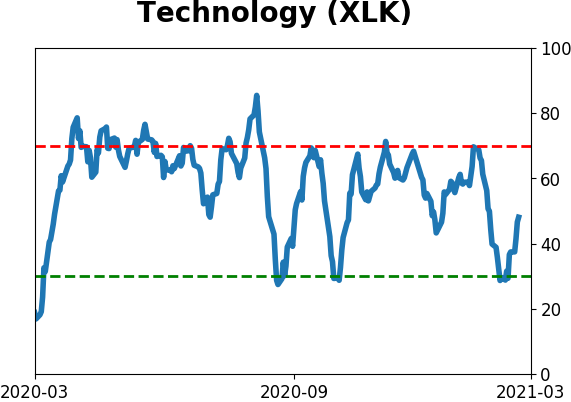
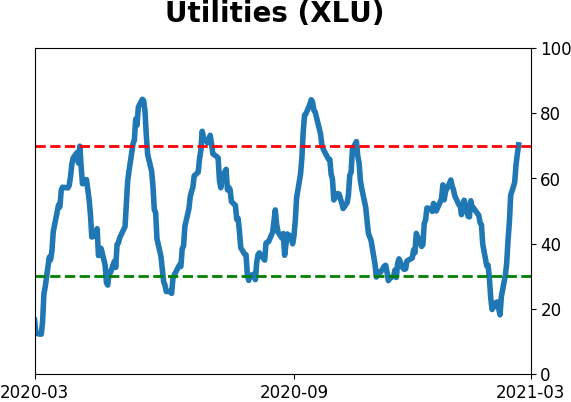
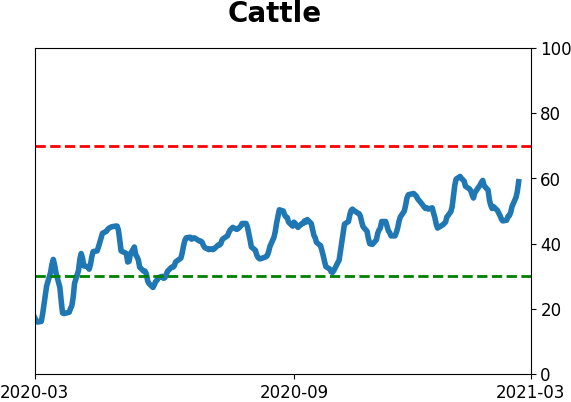
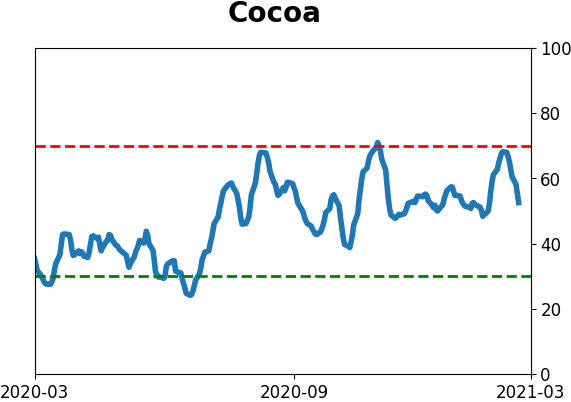
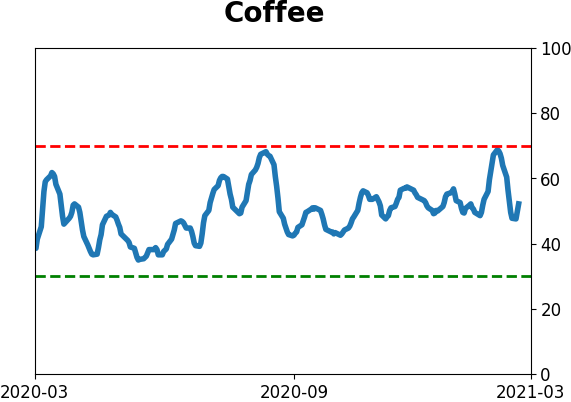
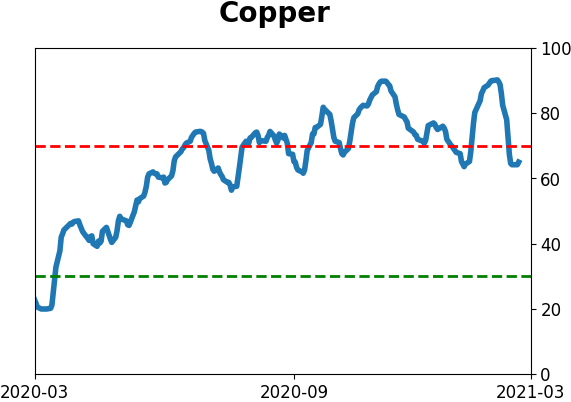
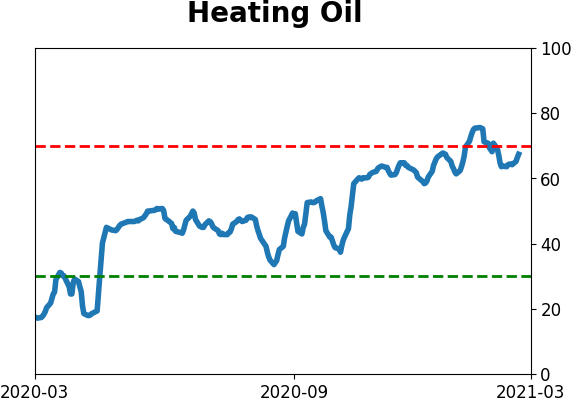
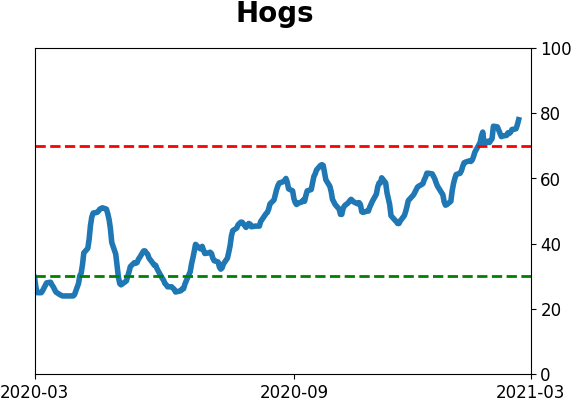
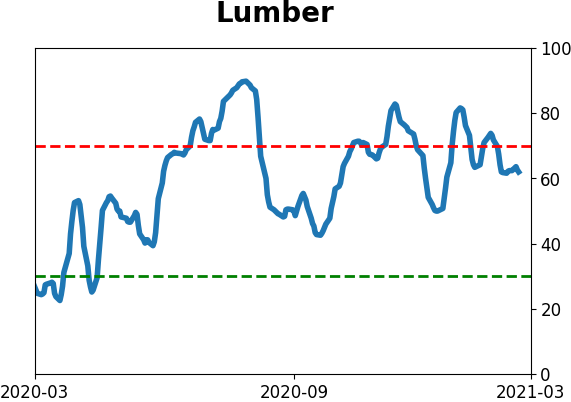
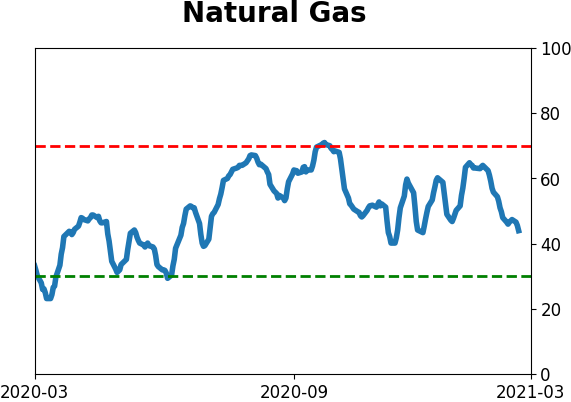
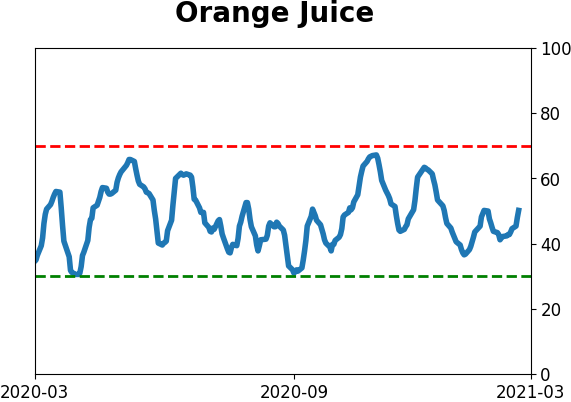
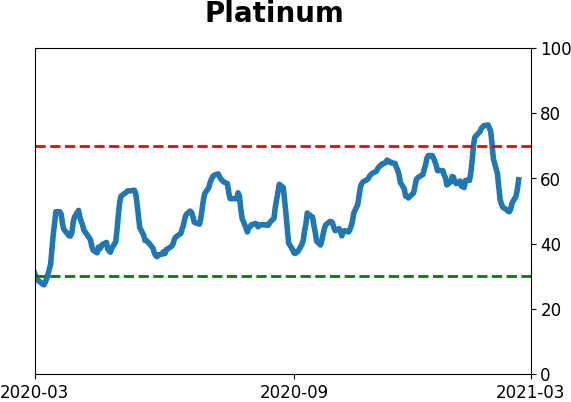
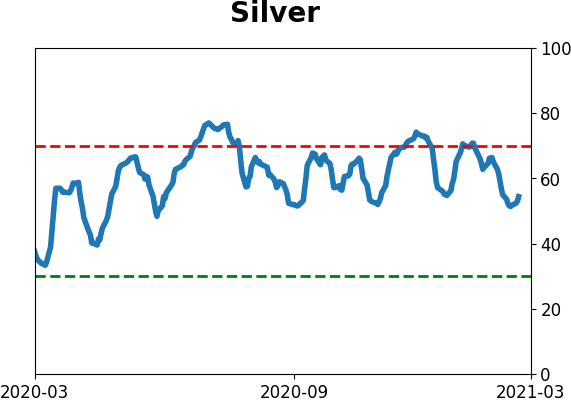
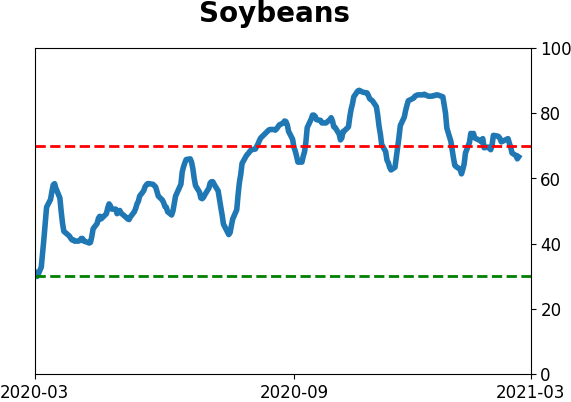
Optimism Index Thumbnails
|
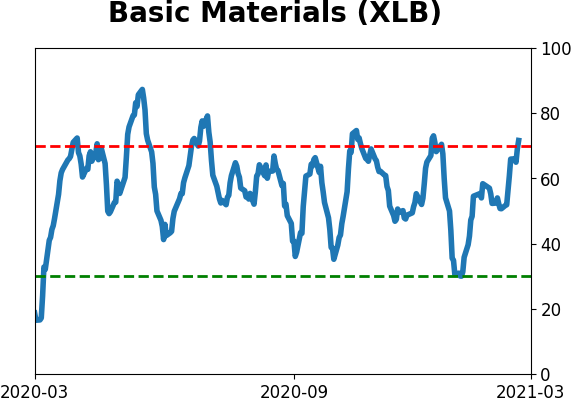
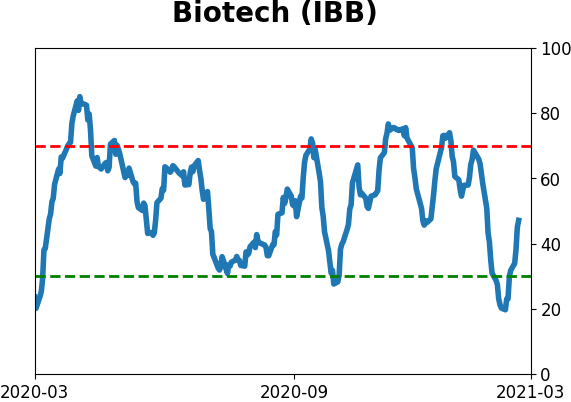
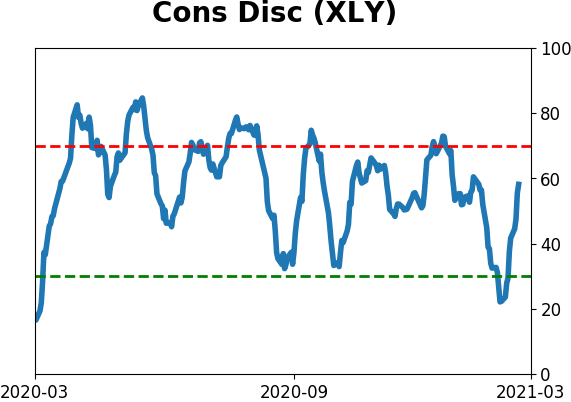
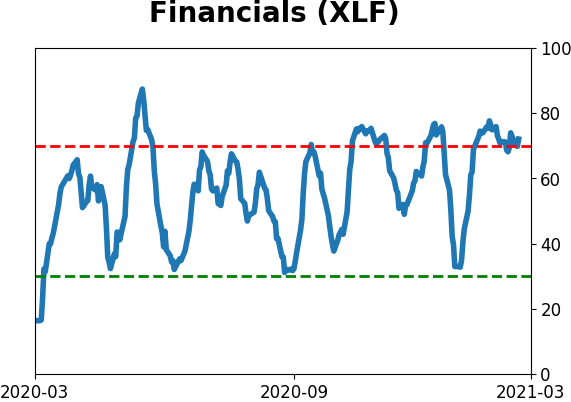
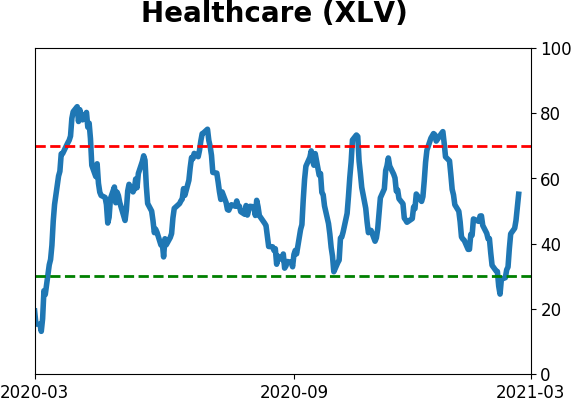
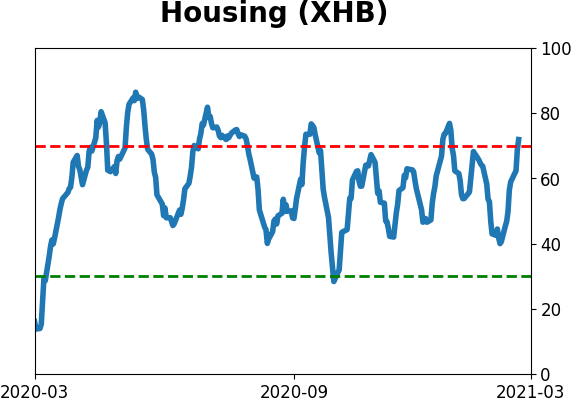
Sector ETF's - 10-Day Moving Average
|
|
|
Country ETF's - 10-Day Moving Average
|
|
|
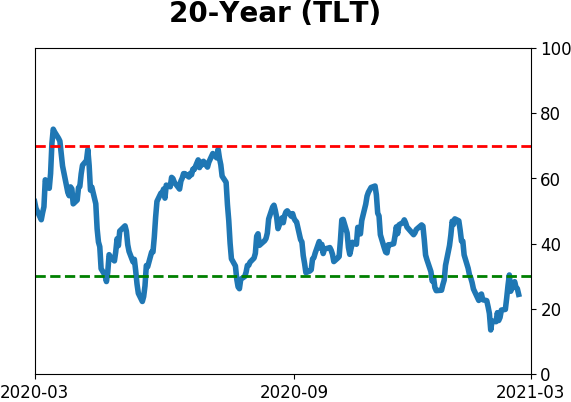
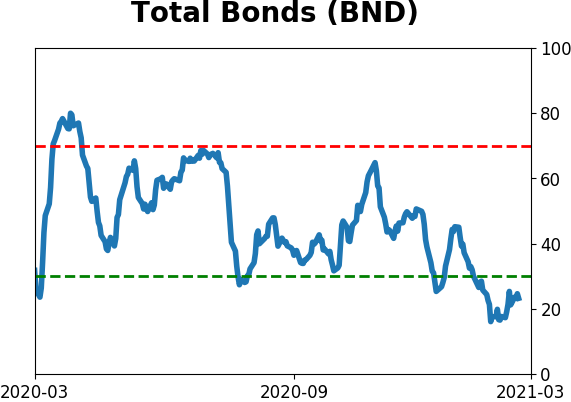
Bond ETF's - 10-Day Moving Average
|
|
|
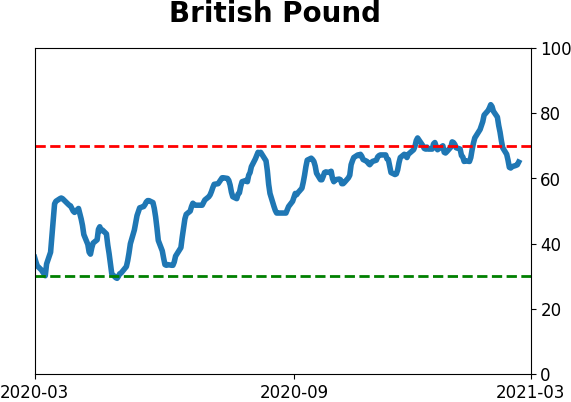
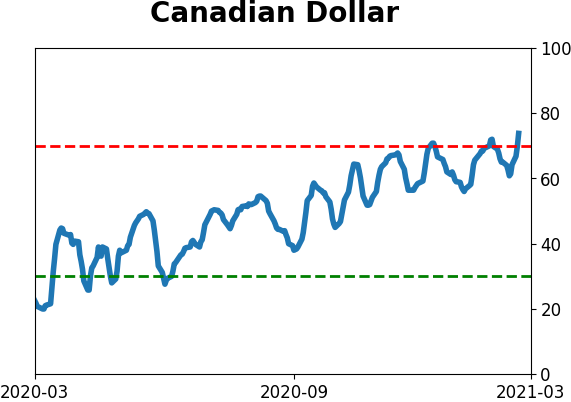
Currency ETF's - 5-Day Moving Average
|
|
|
Commodity ETF's - 5-Day Moving Average
|
|