Headlines
|
|
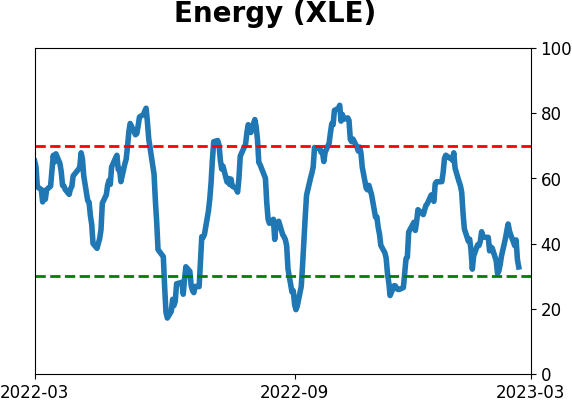
Market breadth indicators for the energy sector flash a warning sign:
New lows in the energy sector are expanding, and other market breadth indicators have deteriorated meaningfully. After similar conditions, energy sector returns were unfavorable over the next two to three months. With most energy stocks transitioning to long-term downtrends, the sector could be in the penalty box until further notice.
|
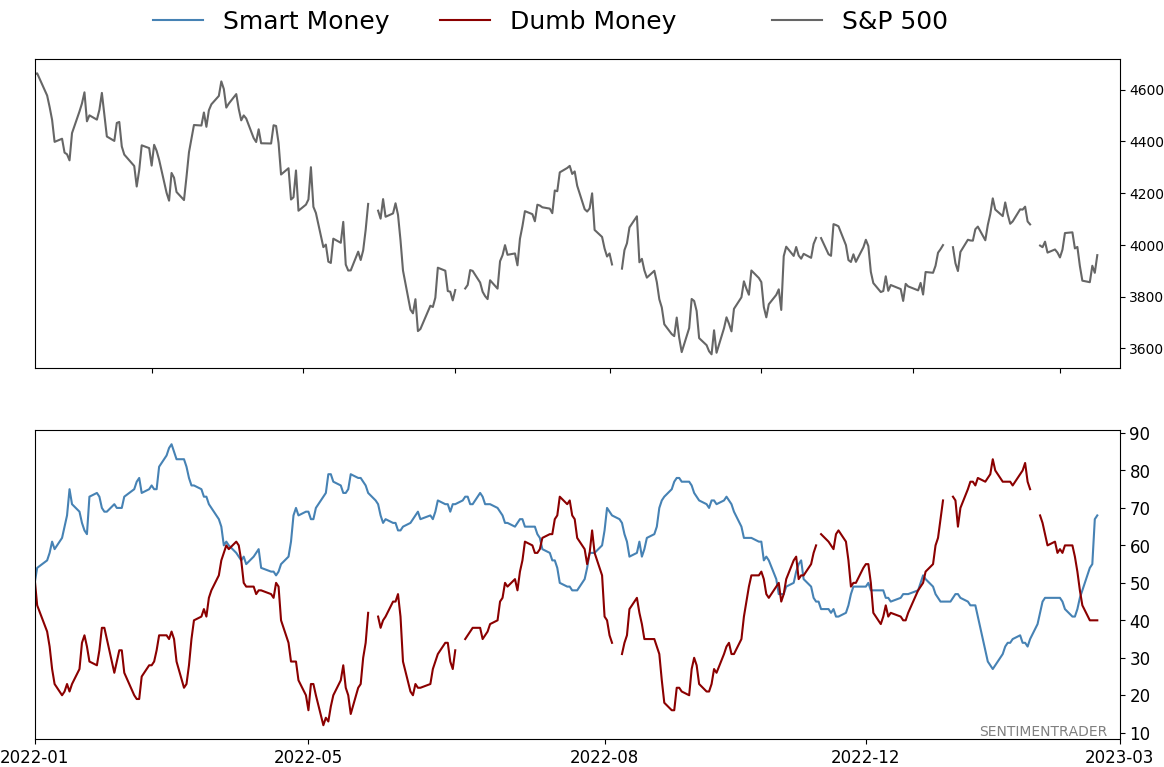
Smart / Dumb Money Confidence
|
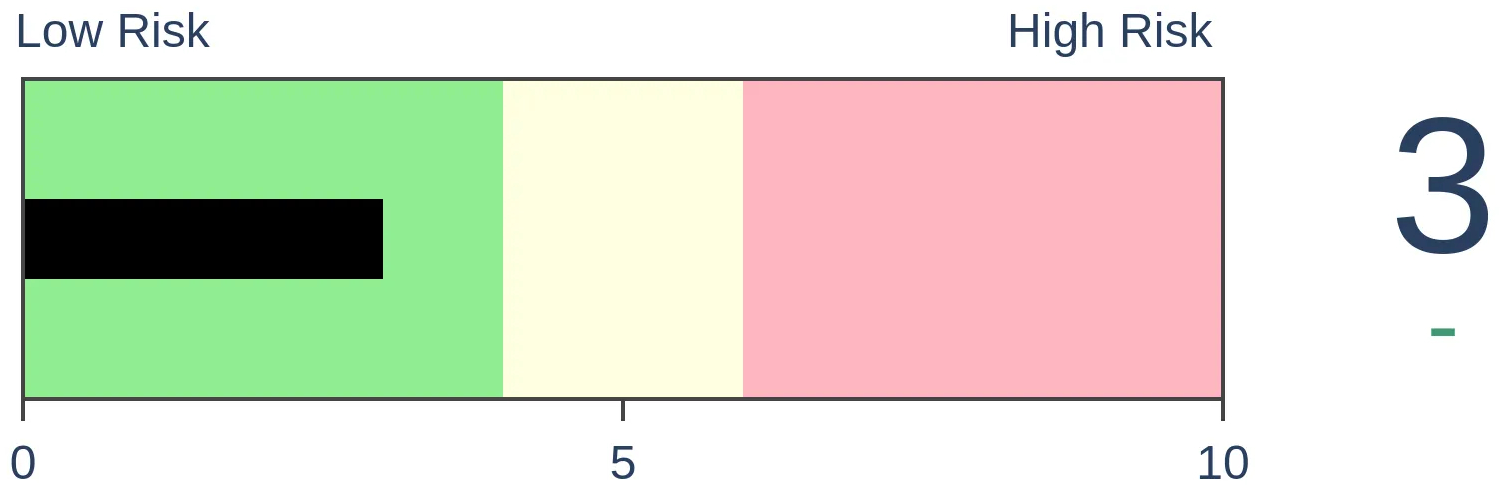
Smart Money Confidence: 68%
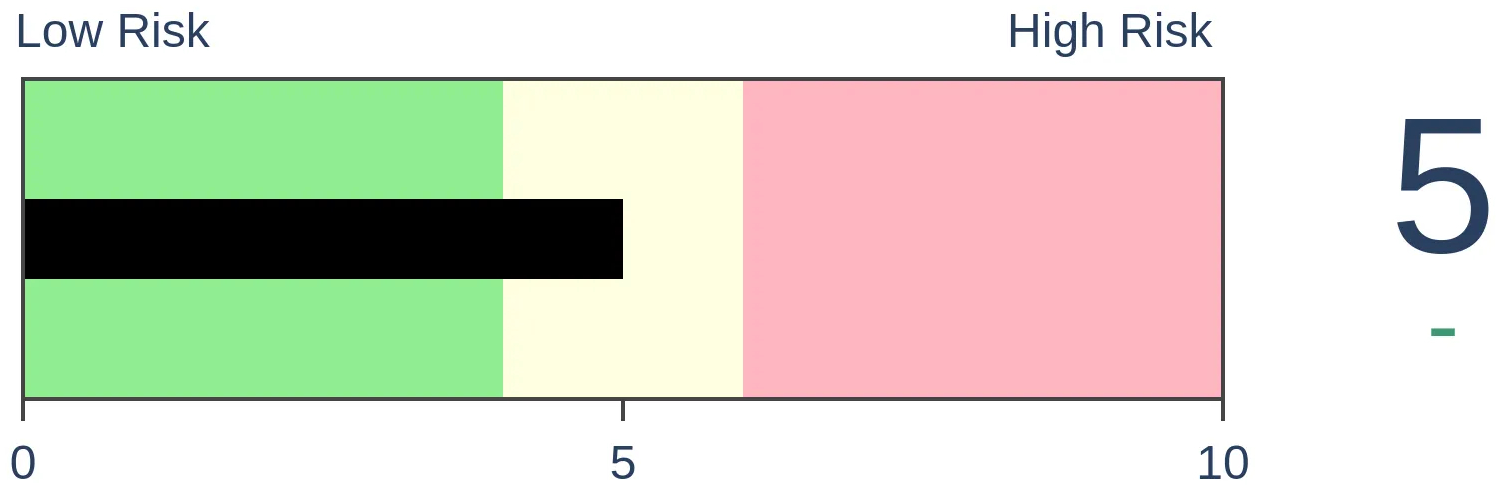
Dumb Money Confidence: 40%
|
|
Risk Levels
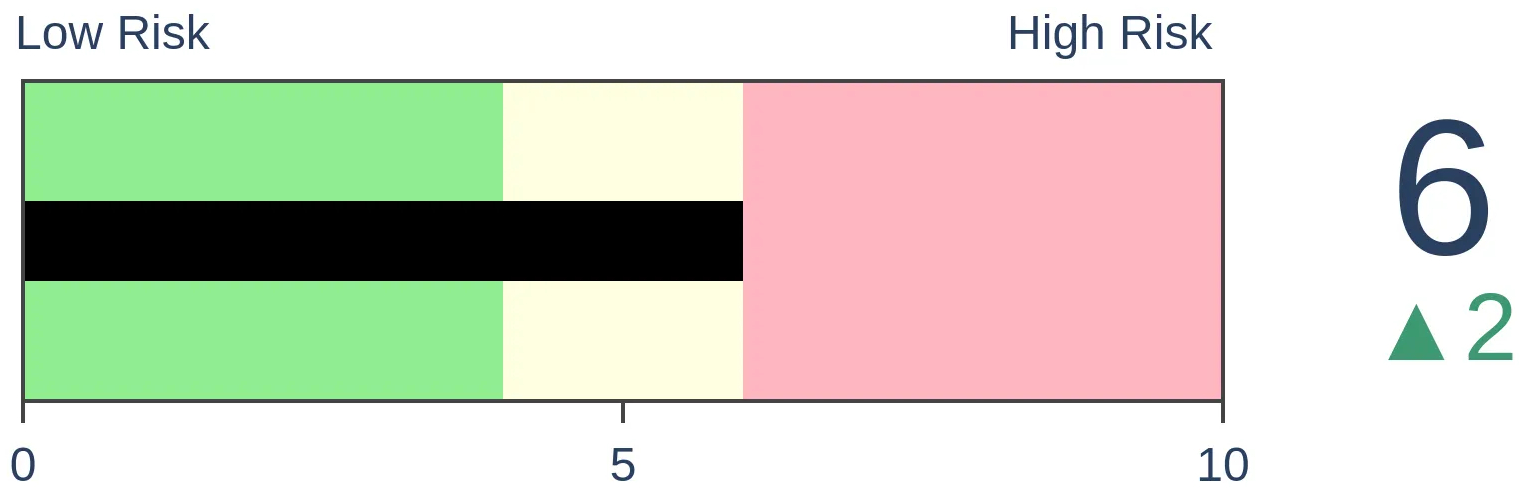
Stocks Short-Term
|
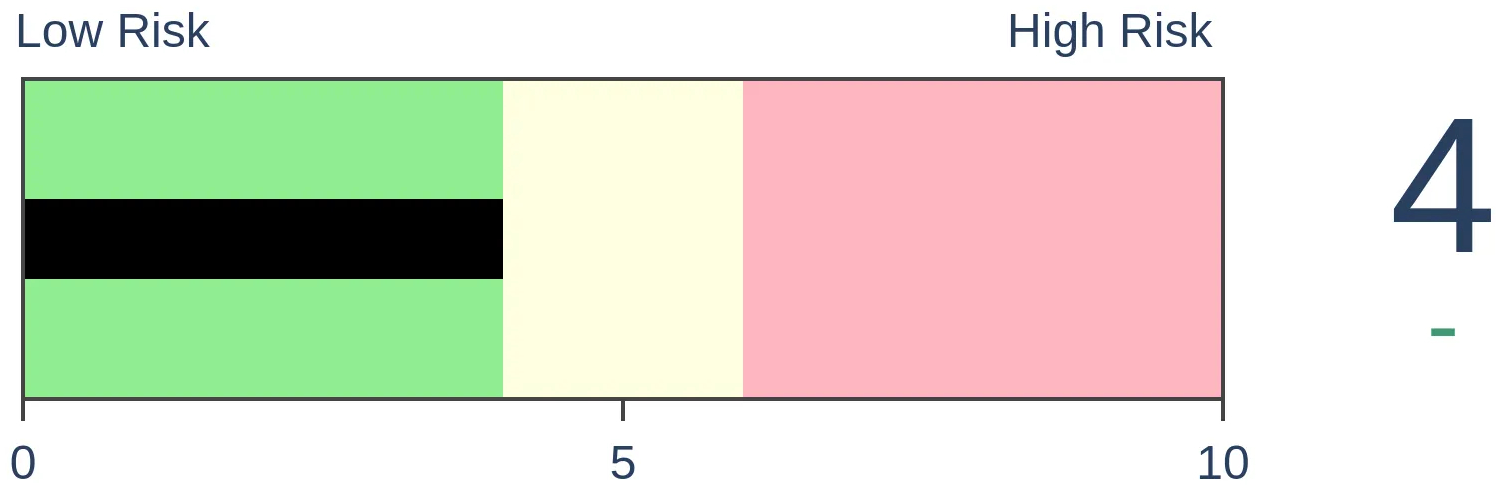
Stocks Medium-Term
|
|
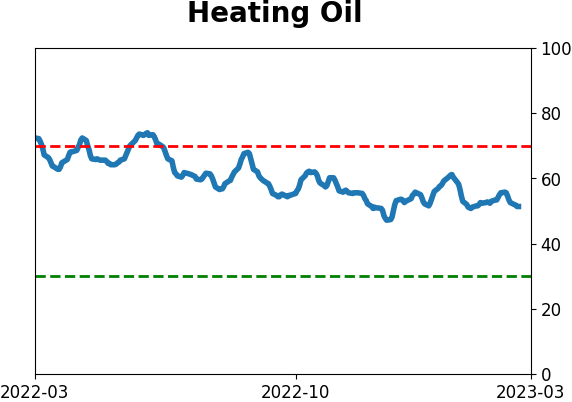
Bonds

|
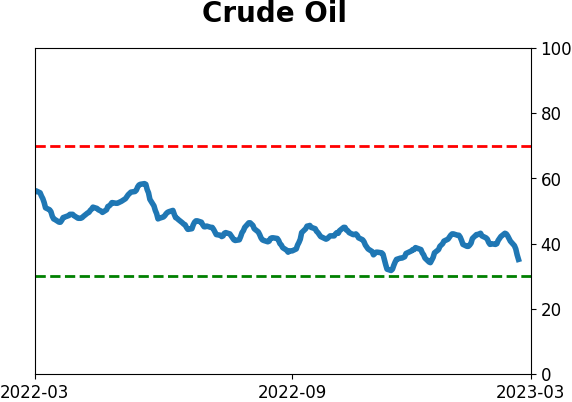
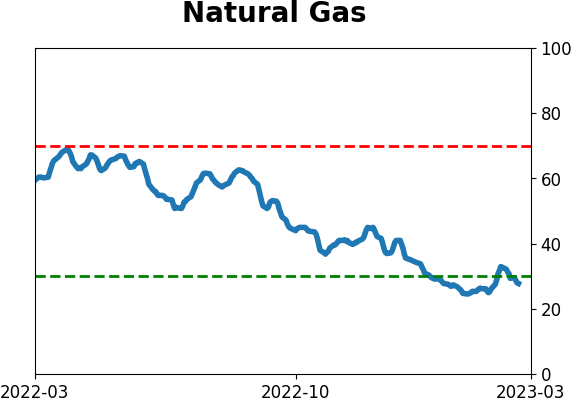
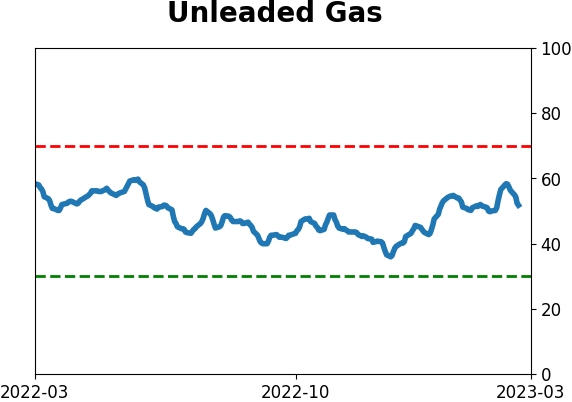
Crude Oil
|
|
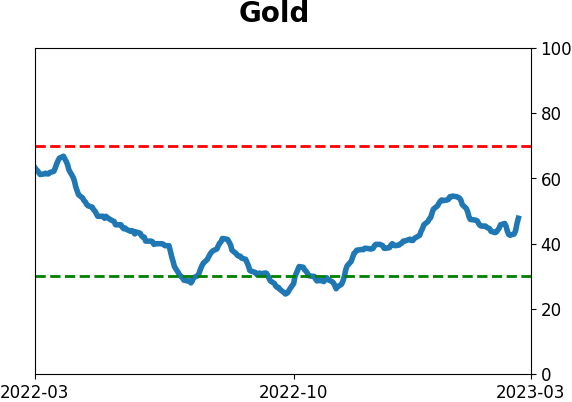
Gold

|
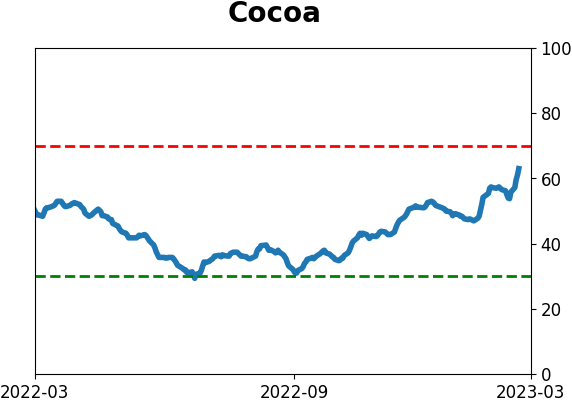
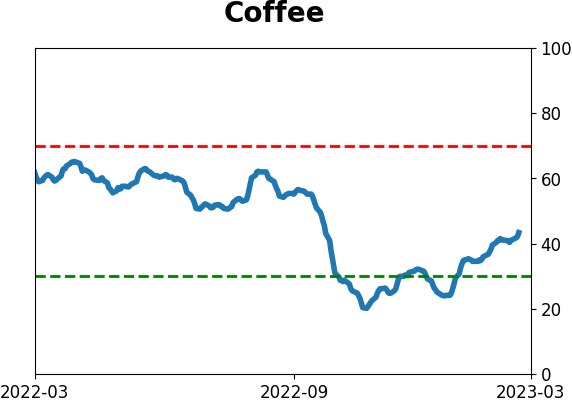
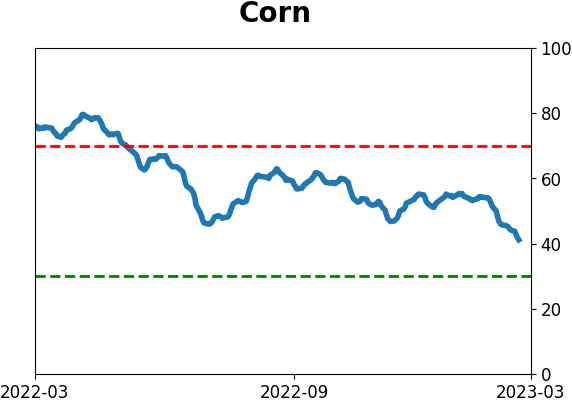
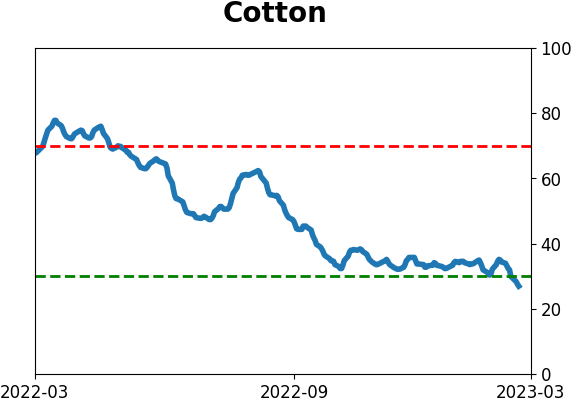
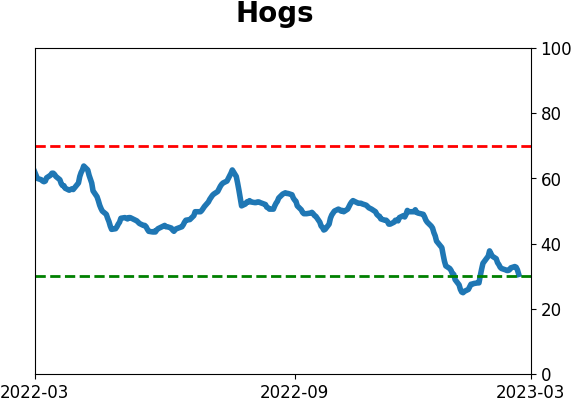
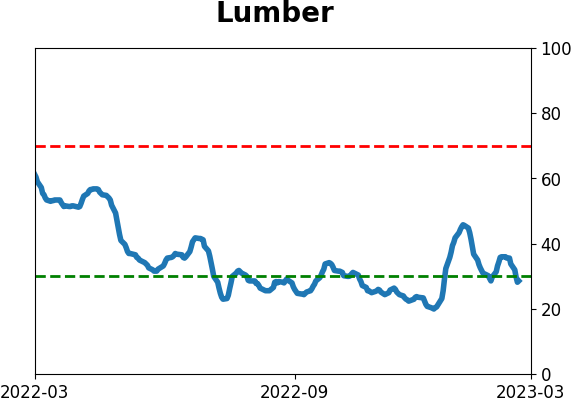
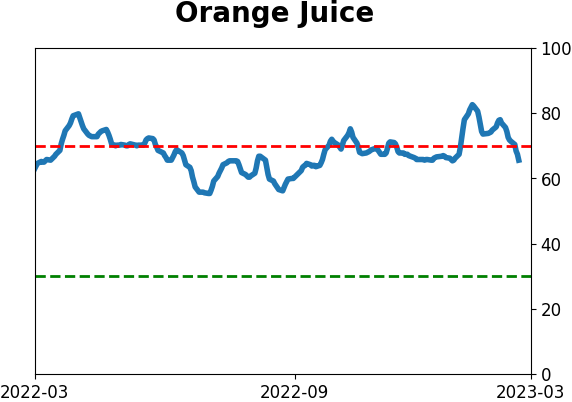
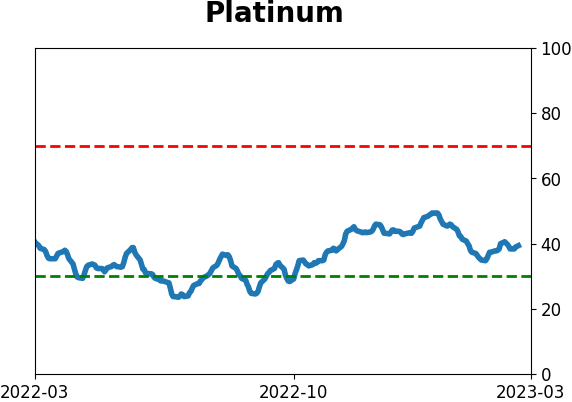
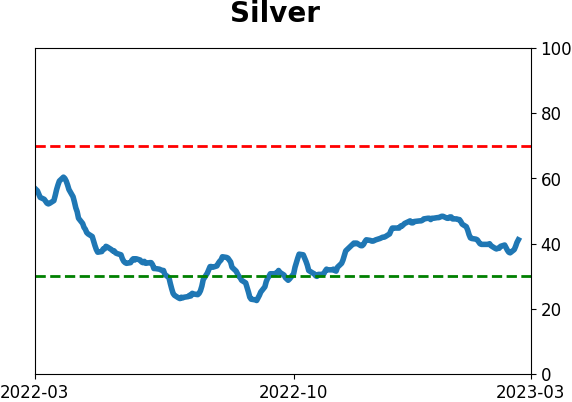
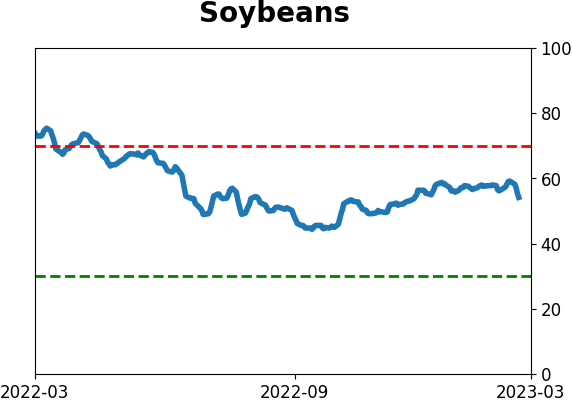
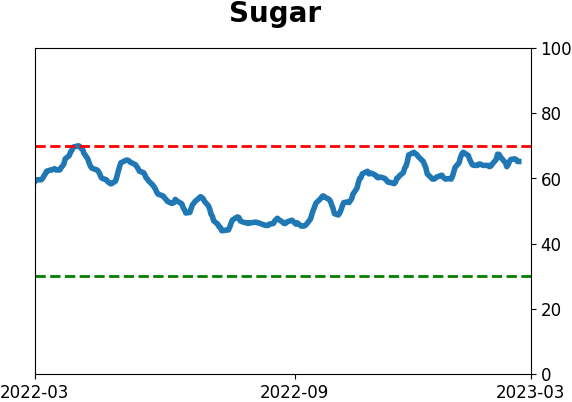
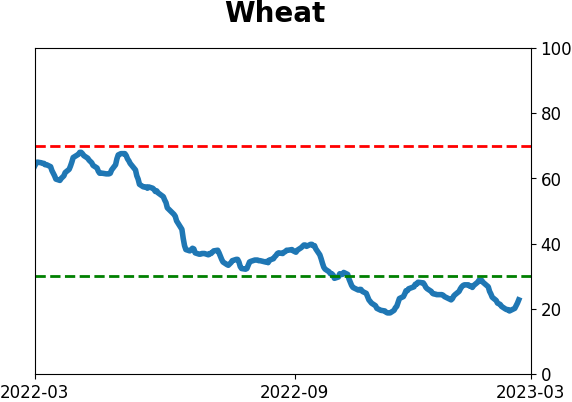
Agriculture
|
|
Research
By Dean Christians
BOTTOM LINE
New lows in the energy sector are expanding, and other market breadth indicators have deteriorated meaningfully. After similar conditions, energy sector returns were unfavorable over the next two to three months. With most energy stocks transitioning to long-term downtrends, the sector could be in the penalty box until further notice.
FORECAST / TIMEFRAME
None
|
Key points:
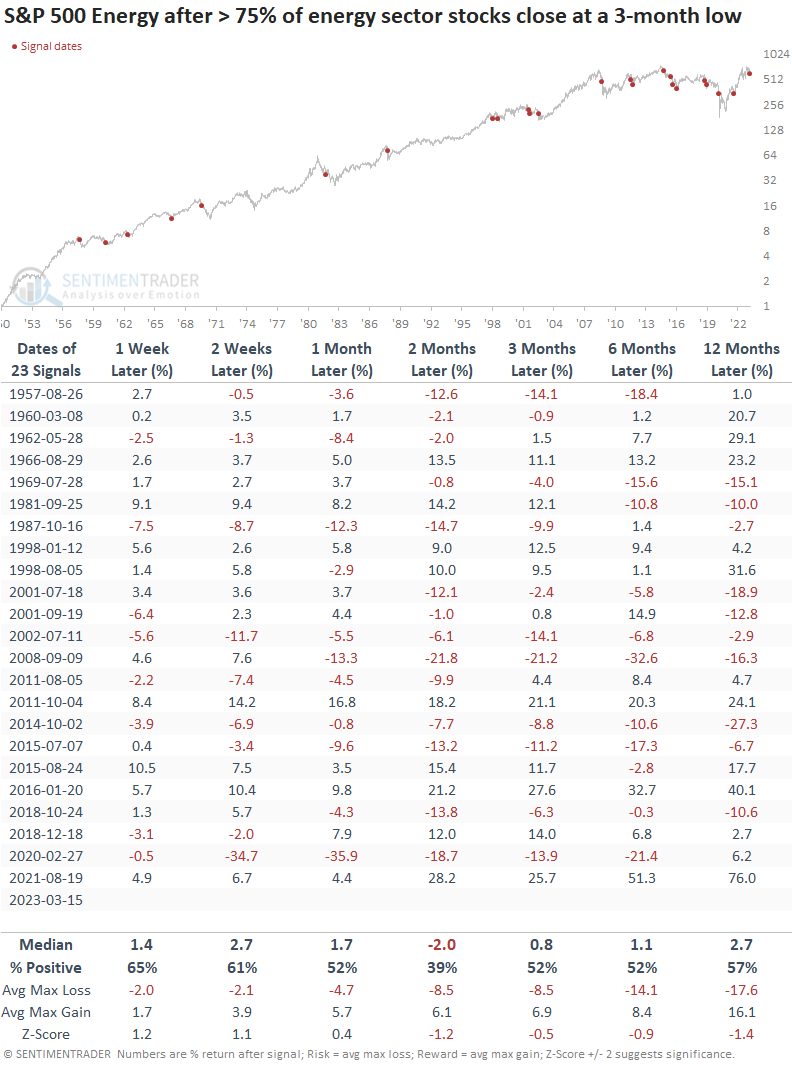
- More than 78% of S&P 500 energy sector stocks closed at a 3-month low
- After similar increases, the sector showed negative returns two months later
- A composite that measures energy stock participation deteriorated to an adverse level
- Composite readings, like now, suggest a cautious outlook for the sector
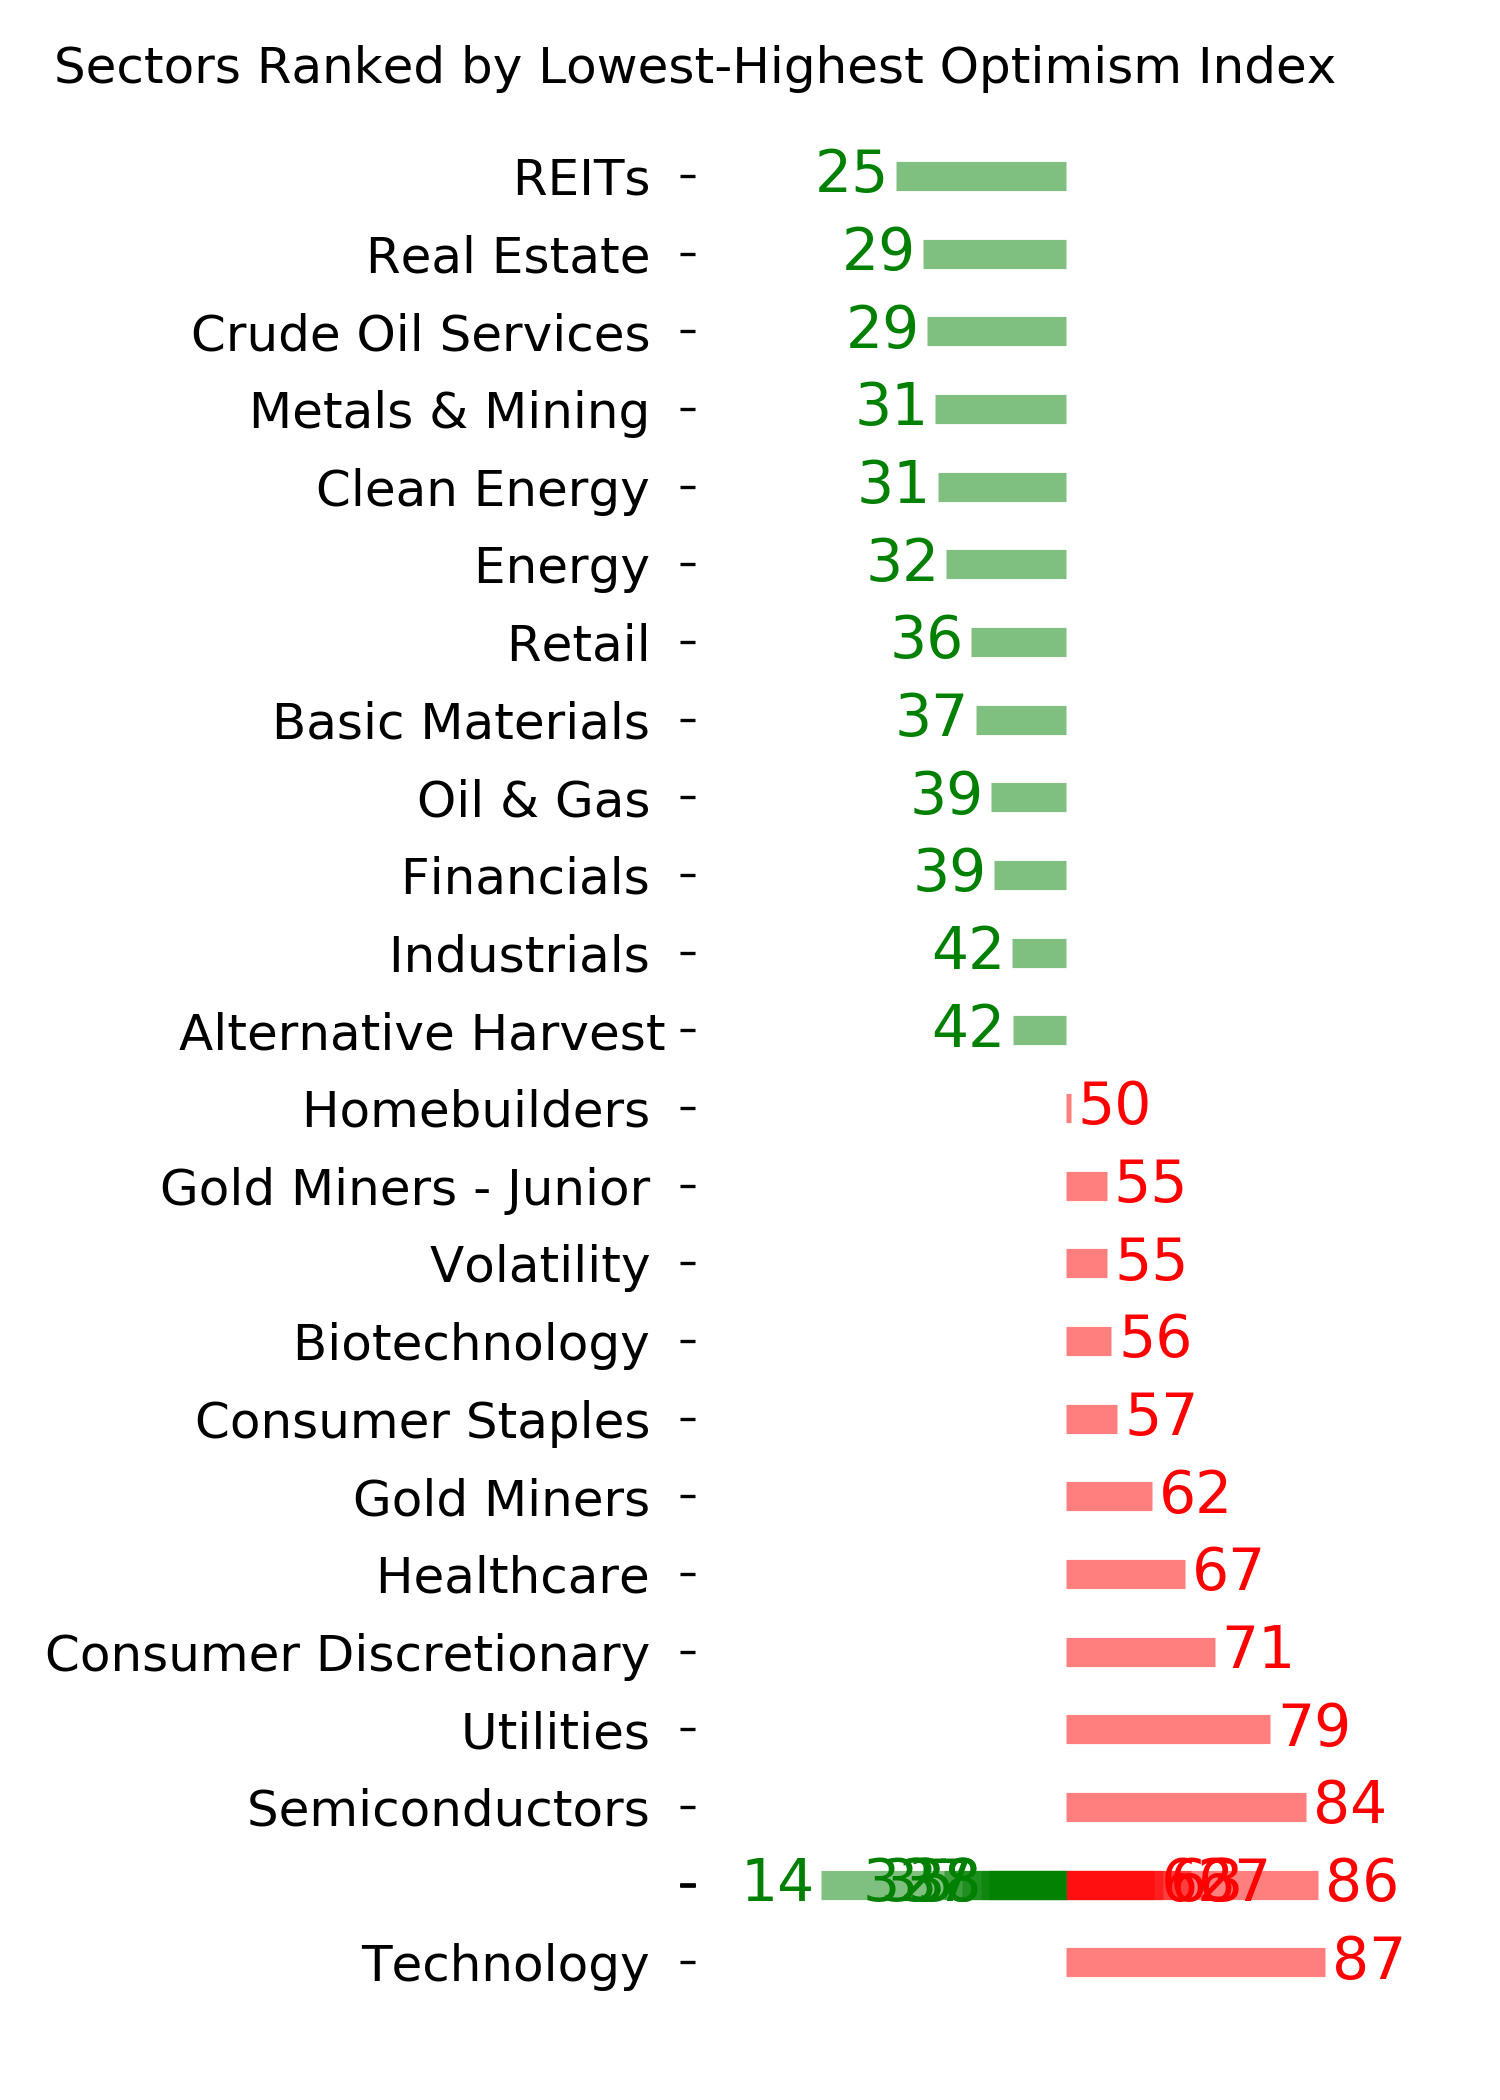
Breadth-based indicators for the energy sector show meaningful deterioration
Energy stocks broke down from a multi-month consolidation late last week as crude oil continued to hold above support. The divergence between crude and energy stocks didn't last long. Oil finally succumbed to a wave of selling pressure in risk assets by tumbling over 5% to a new 1-year low on Wednesday.
Energy stocks took their cue from oil and plunged by a similar amount. The significant decline on top of last week's consolidation breakdown pushed several market breadth indicators to extreme levels.
One such indicator, the percentage of S&P 500 Energy sector stocks closing at a 3-month low, surged above 75%.
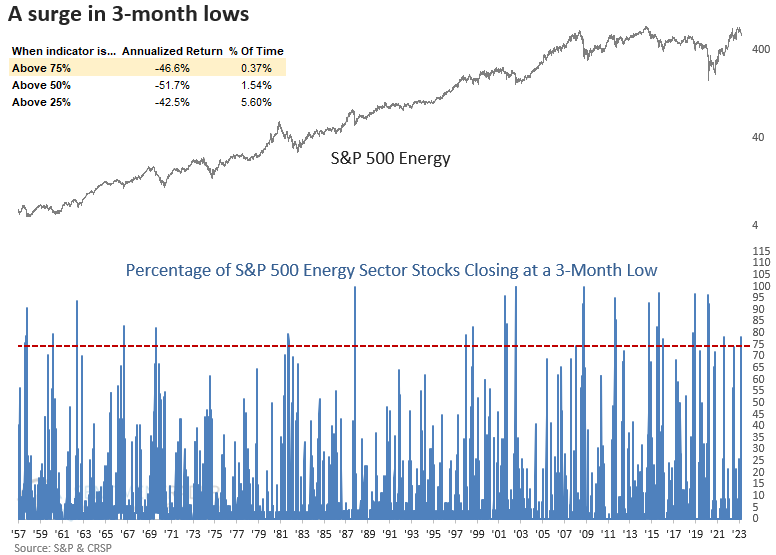
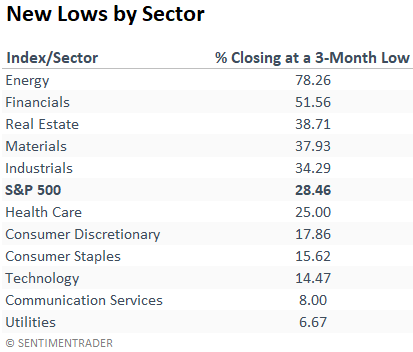
An overwhelming percentage of energy stocks closed at a 3-month low, especially compared to other sectors.
Similar surges in 3-month lows preceded negative returns two months later
When more than 75% of S&P 500 Energy sector stocks close at a 3-month low, the sector tends to bounce from the extreme level in the next few weeks. However, the rally is brief. Two months later, the unfavorable breadth environment reasserts itself with negative returns.
A broader measure of market breadth indicators deteriorates to an unfriendly level
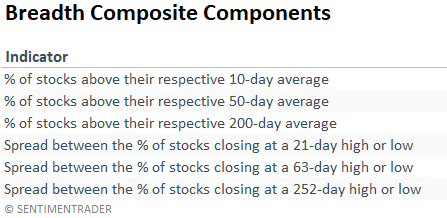
The S&P 500 Energy breadth composite declined to the lowest value since the Covid crash in March 2020. Composite readings below 0% suggest negative annualized returns.
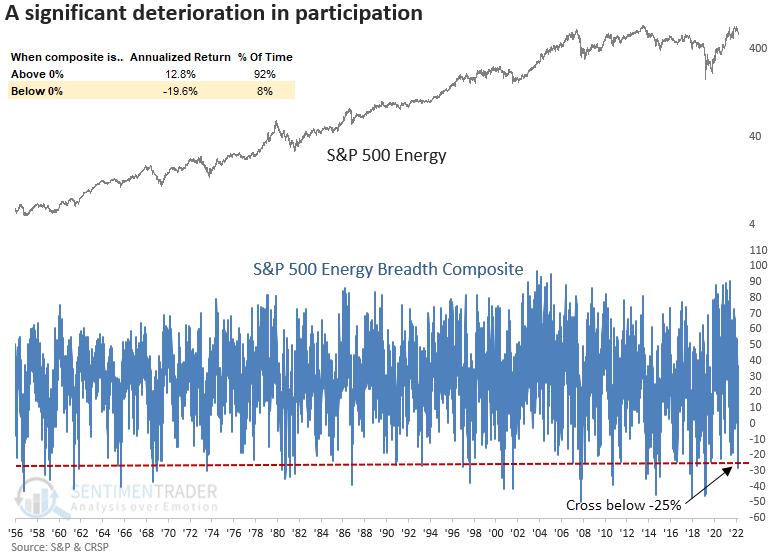
Similar breadth composite signals suggest negative returns
The energy sector struggles when the indicator falls below -25%, especially over the next two to three months. And long-term time frames are not exactly bullish.

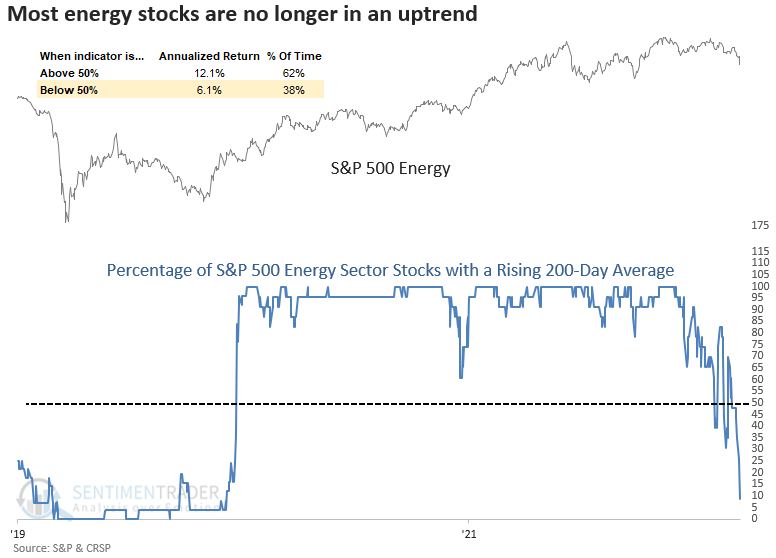
Buying oversold conditions is less compelling
For most of 2021 and 2022, the backdrop for buying oversold conditions in energy stocks was ideal as a high level of issues maintained a rising 200-day average. That's not the case now.
What the research tells us...
Market breadth measures for energy stocks deteriorated across several indicators with varying duration lengths. After similar conditions, energy sector returns were unfavorable over the next two to three months. A buy-the-dip approach is less compelling, with long-term trends no longer providing a tailwind for the group. Like the financials, the sector is most likely in the penalty box for now, notwithstanding a mean-reversion bounce in the near term.
Indicators at Extremes
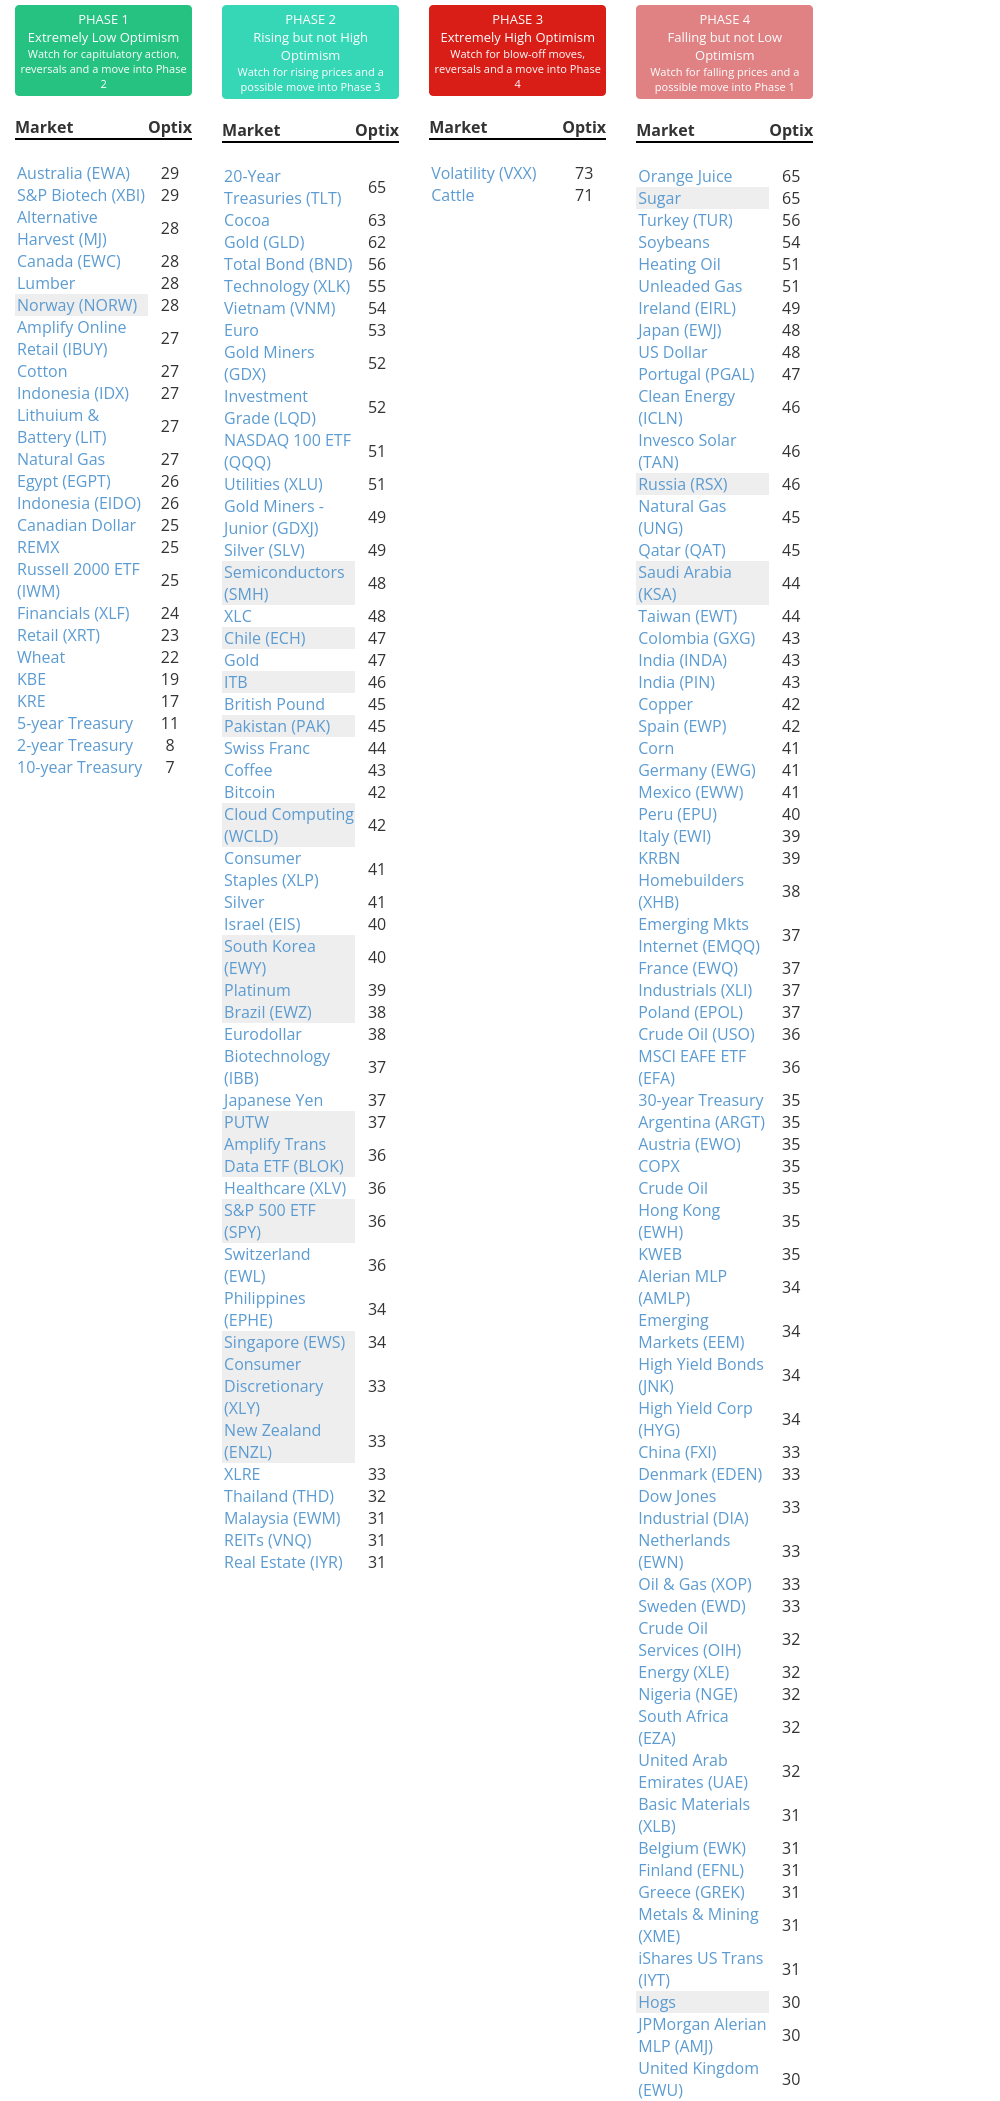
Phase Table
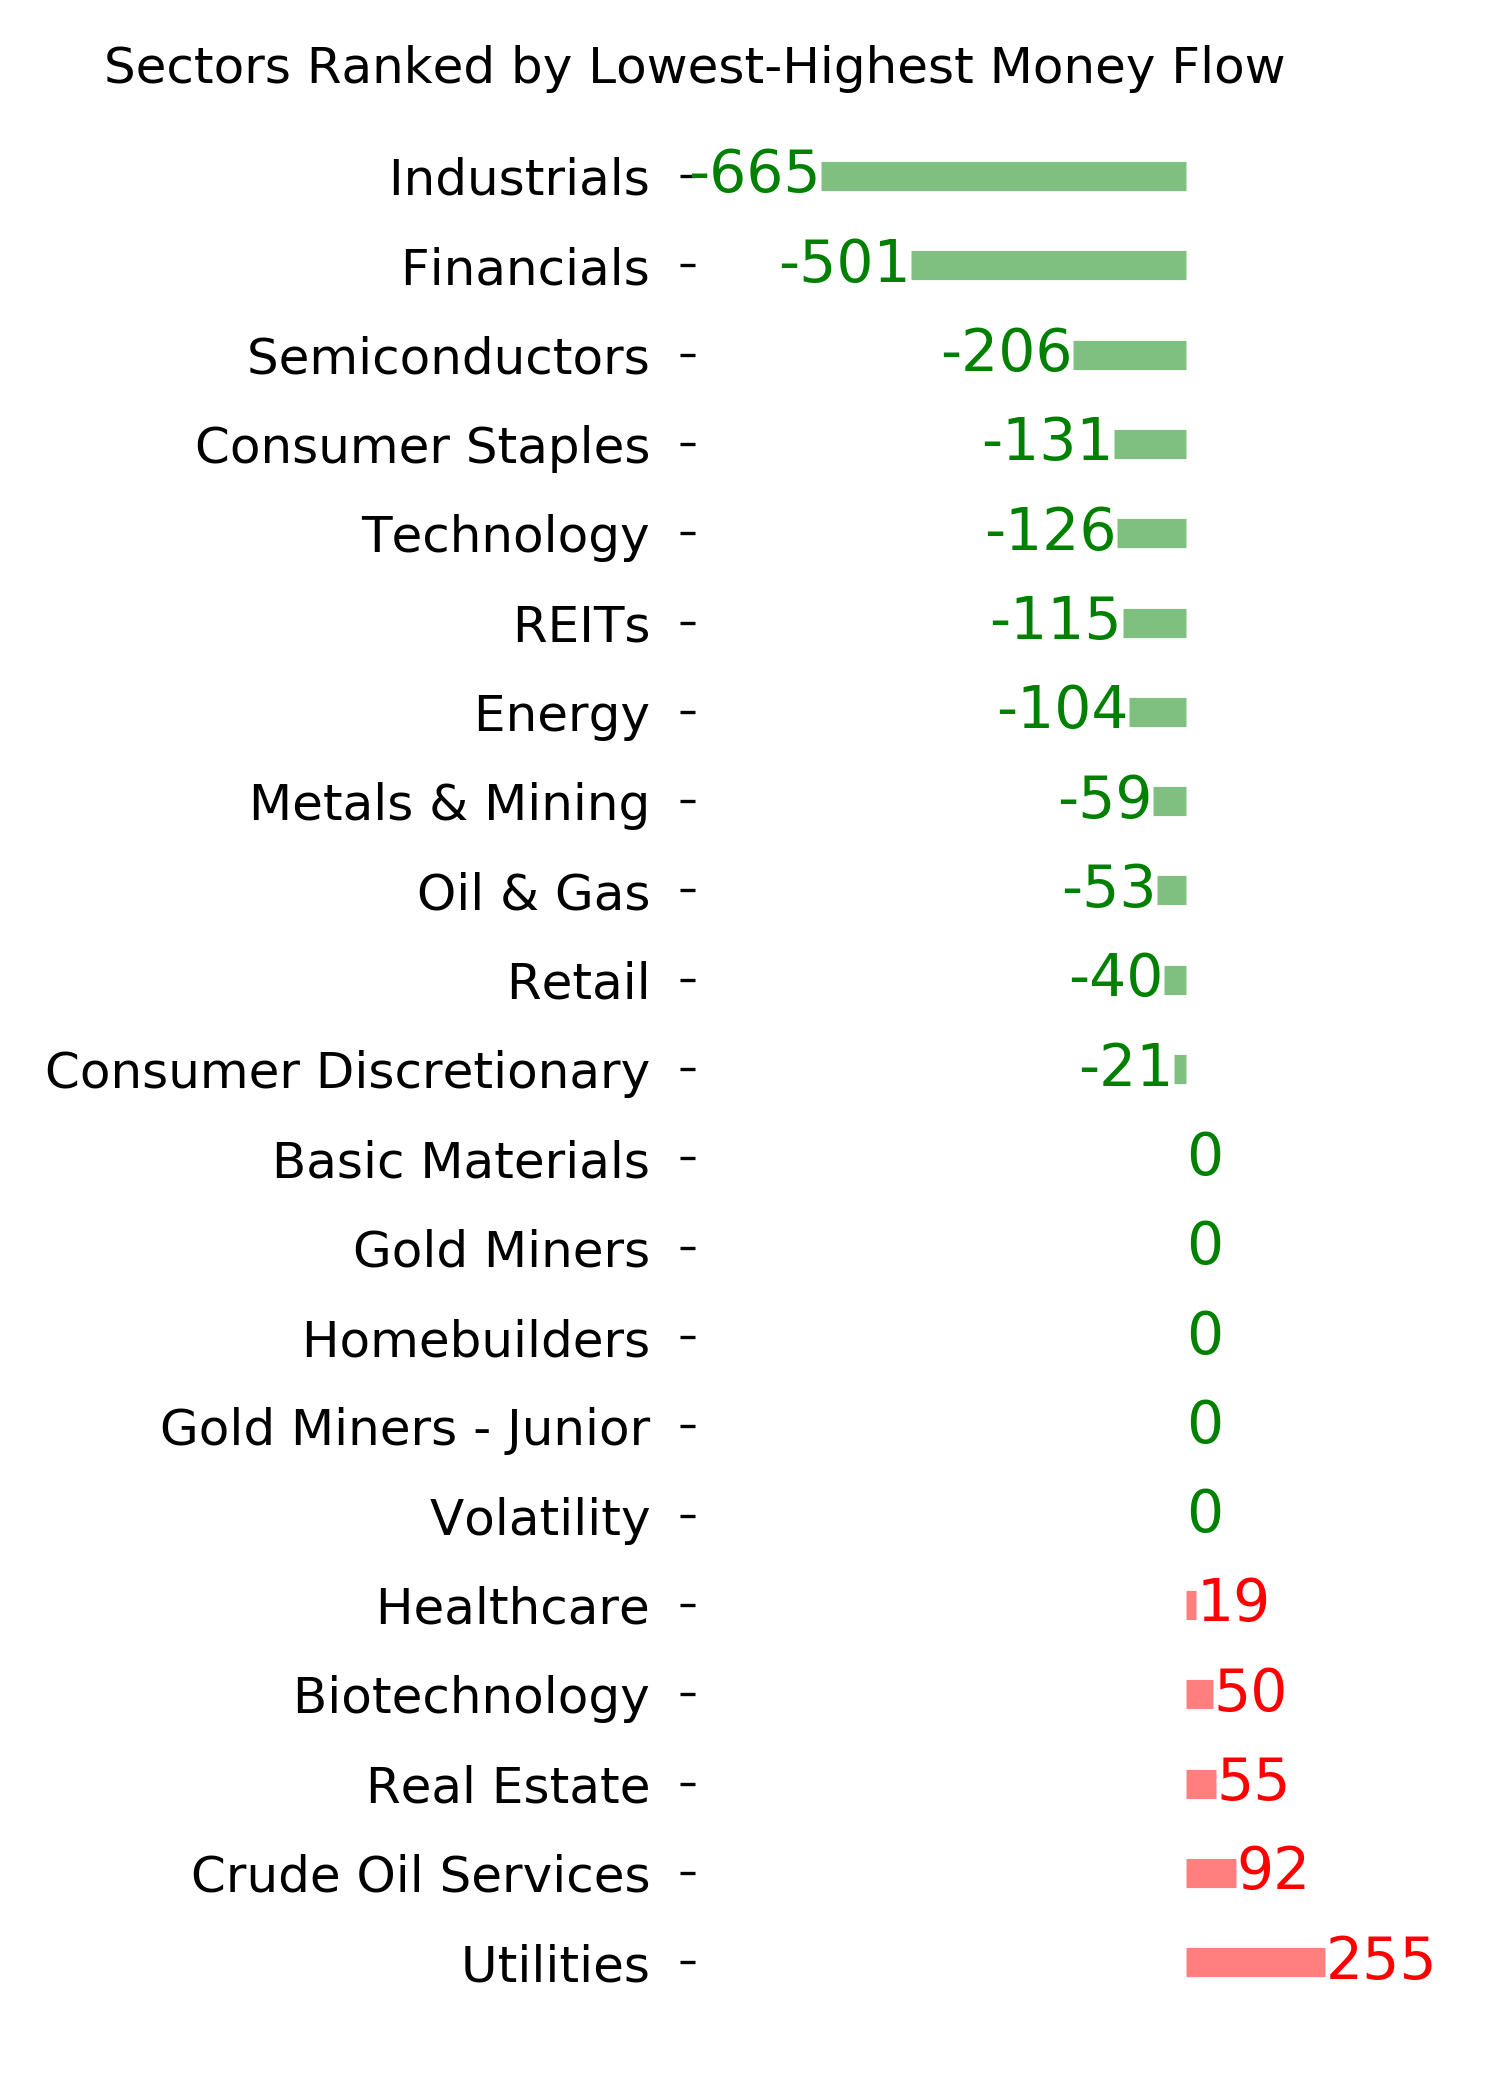
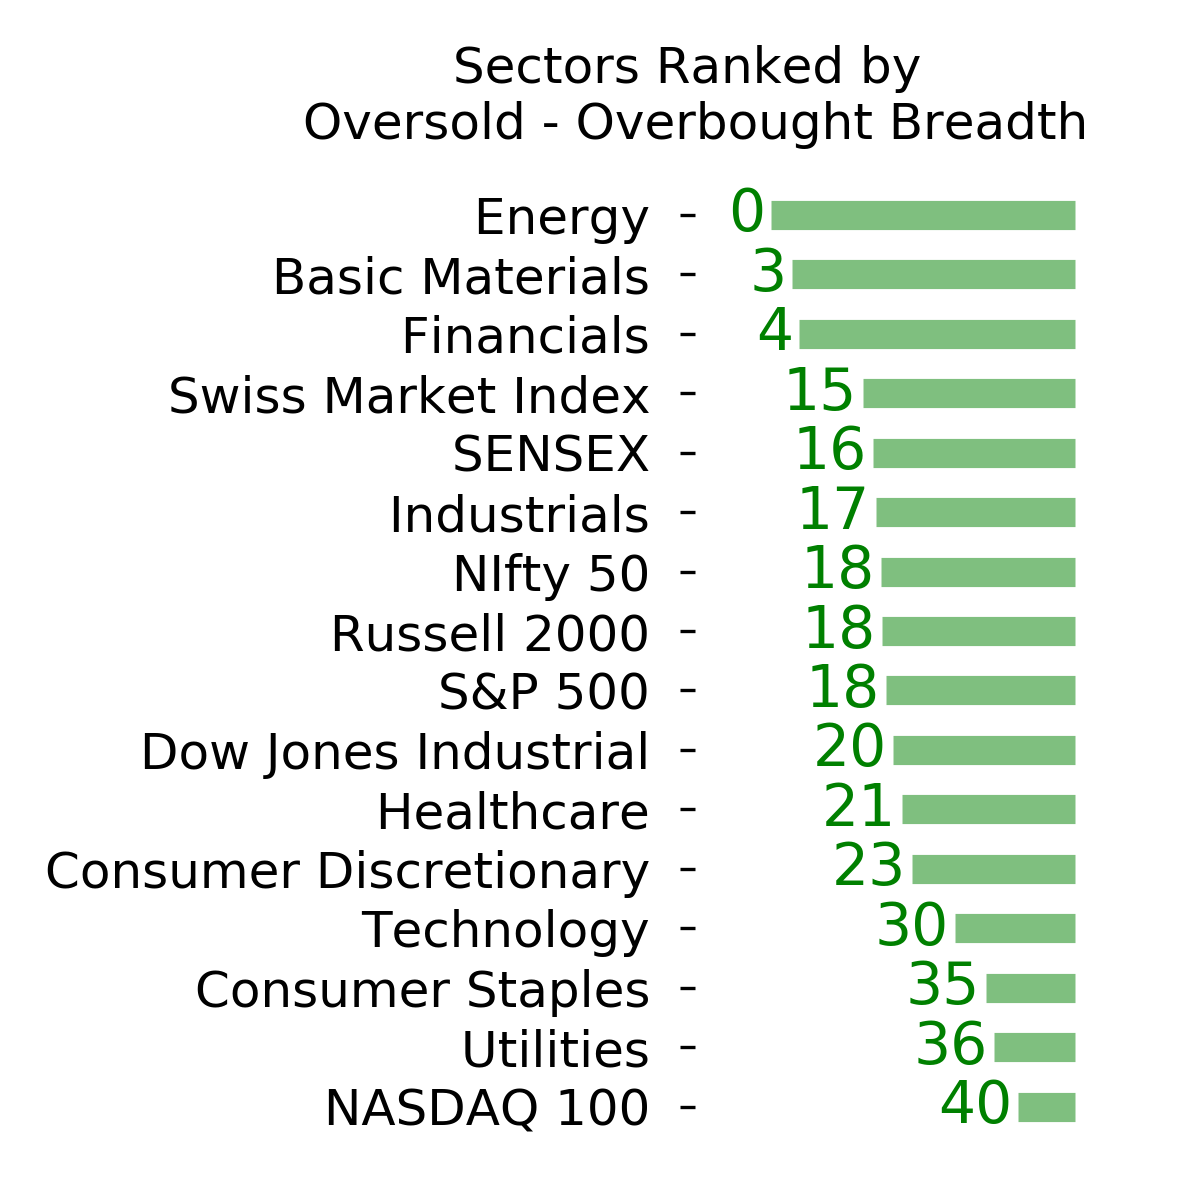
Ranks
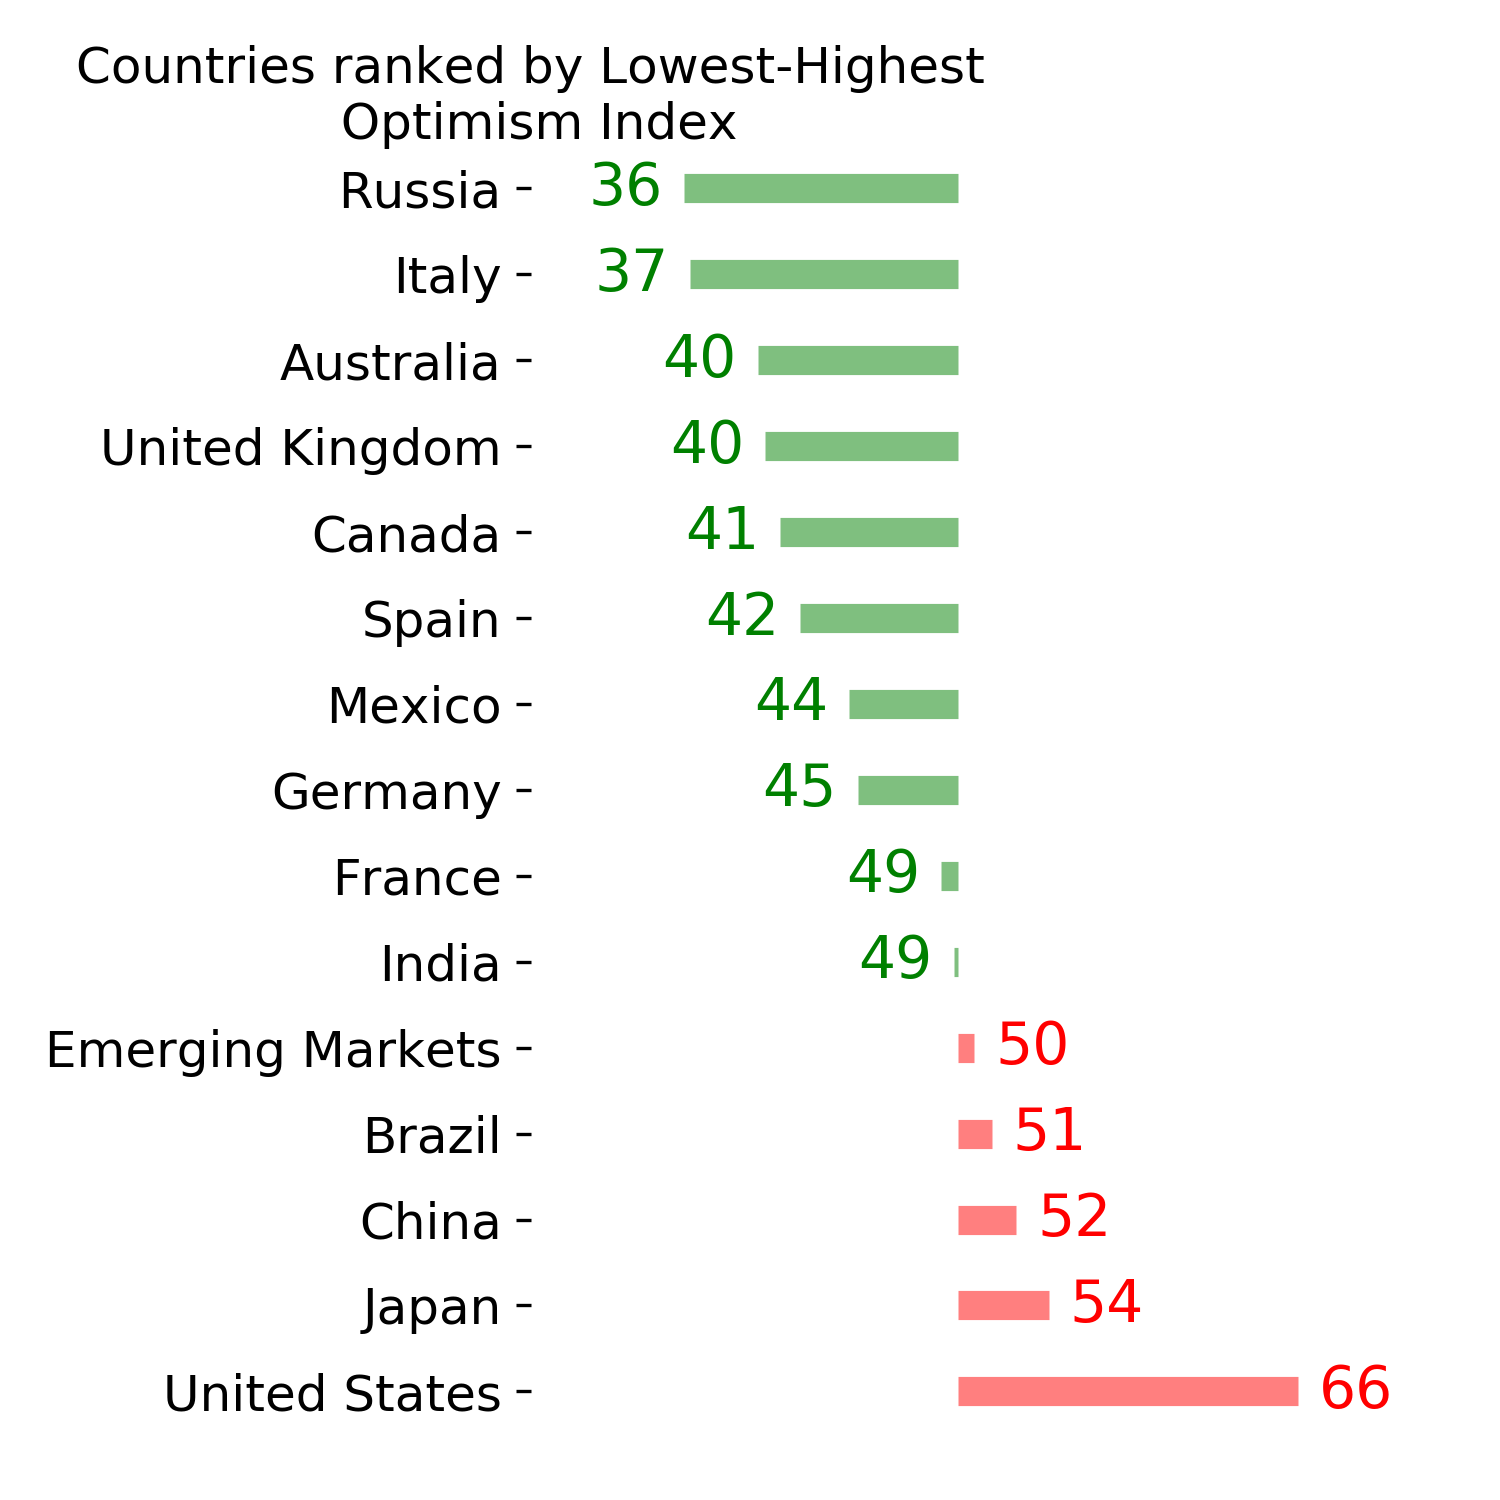
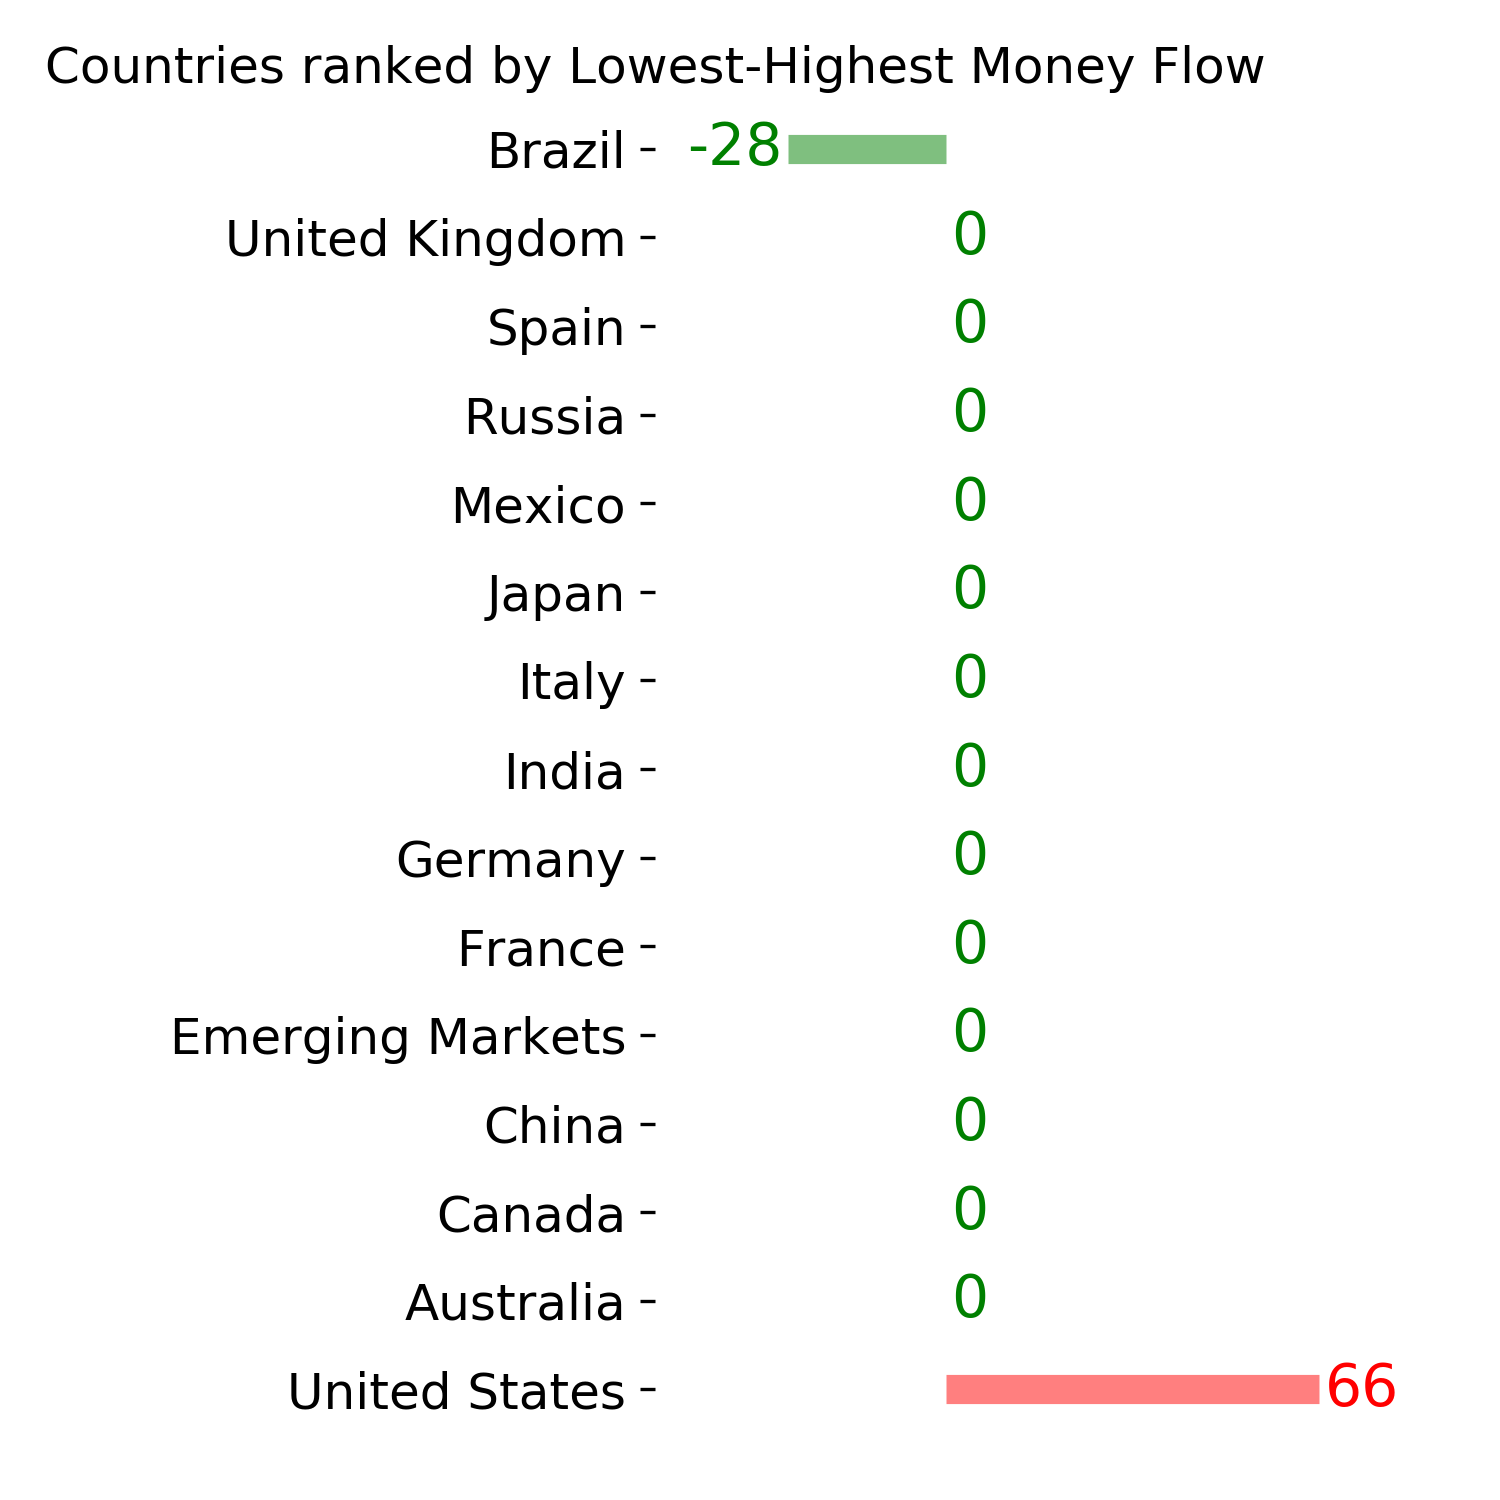
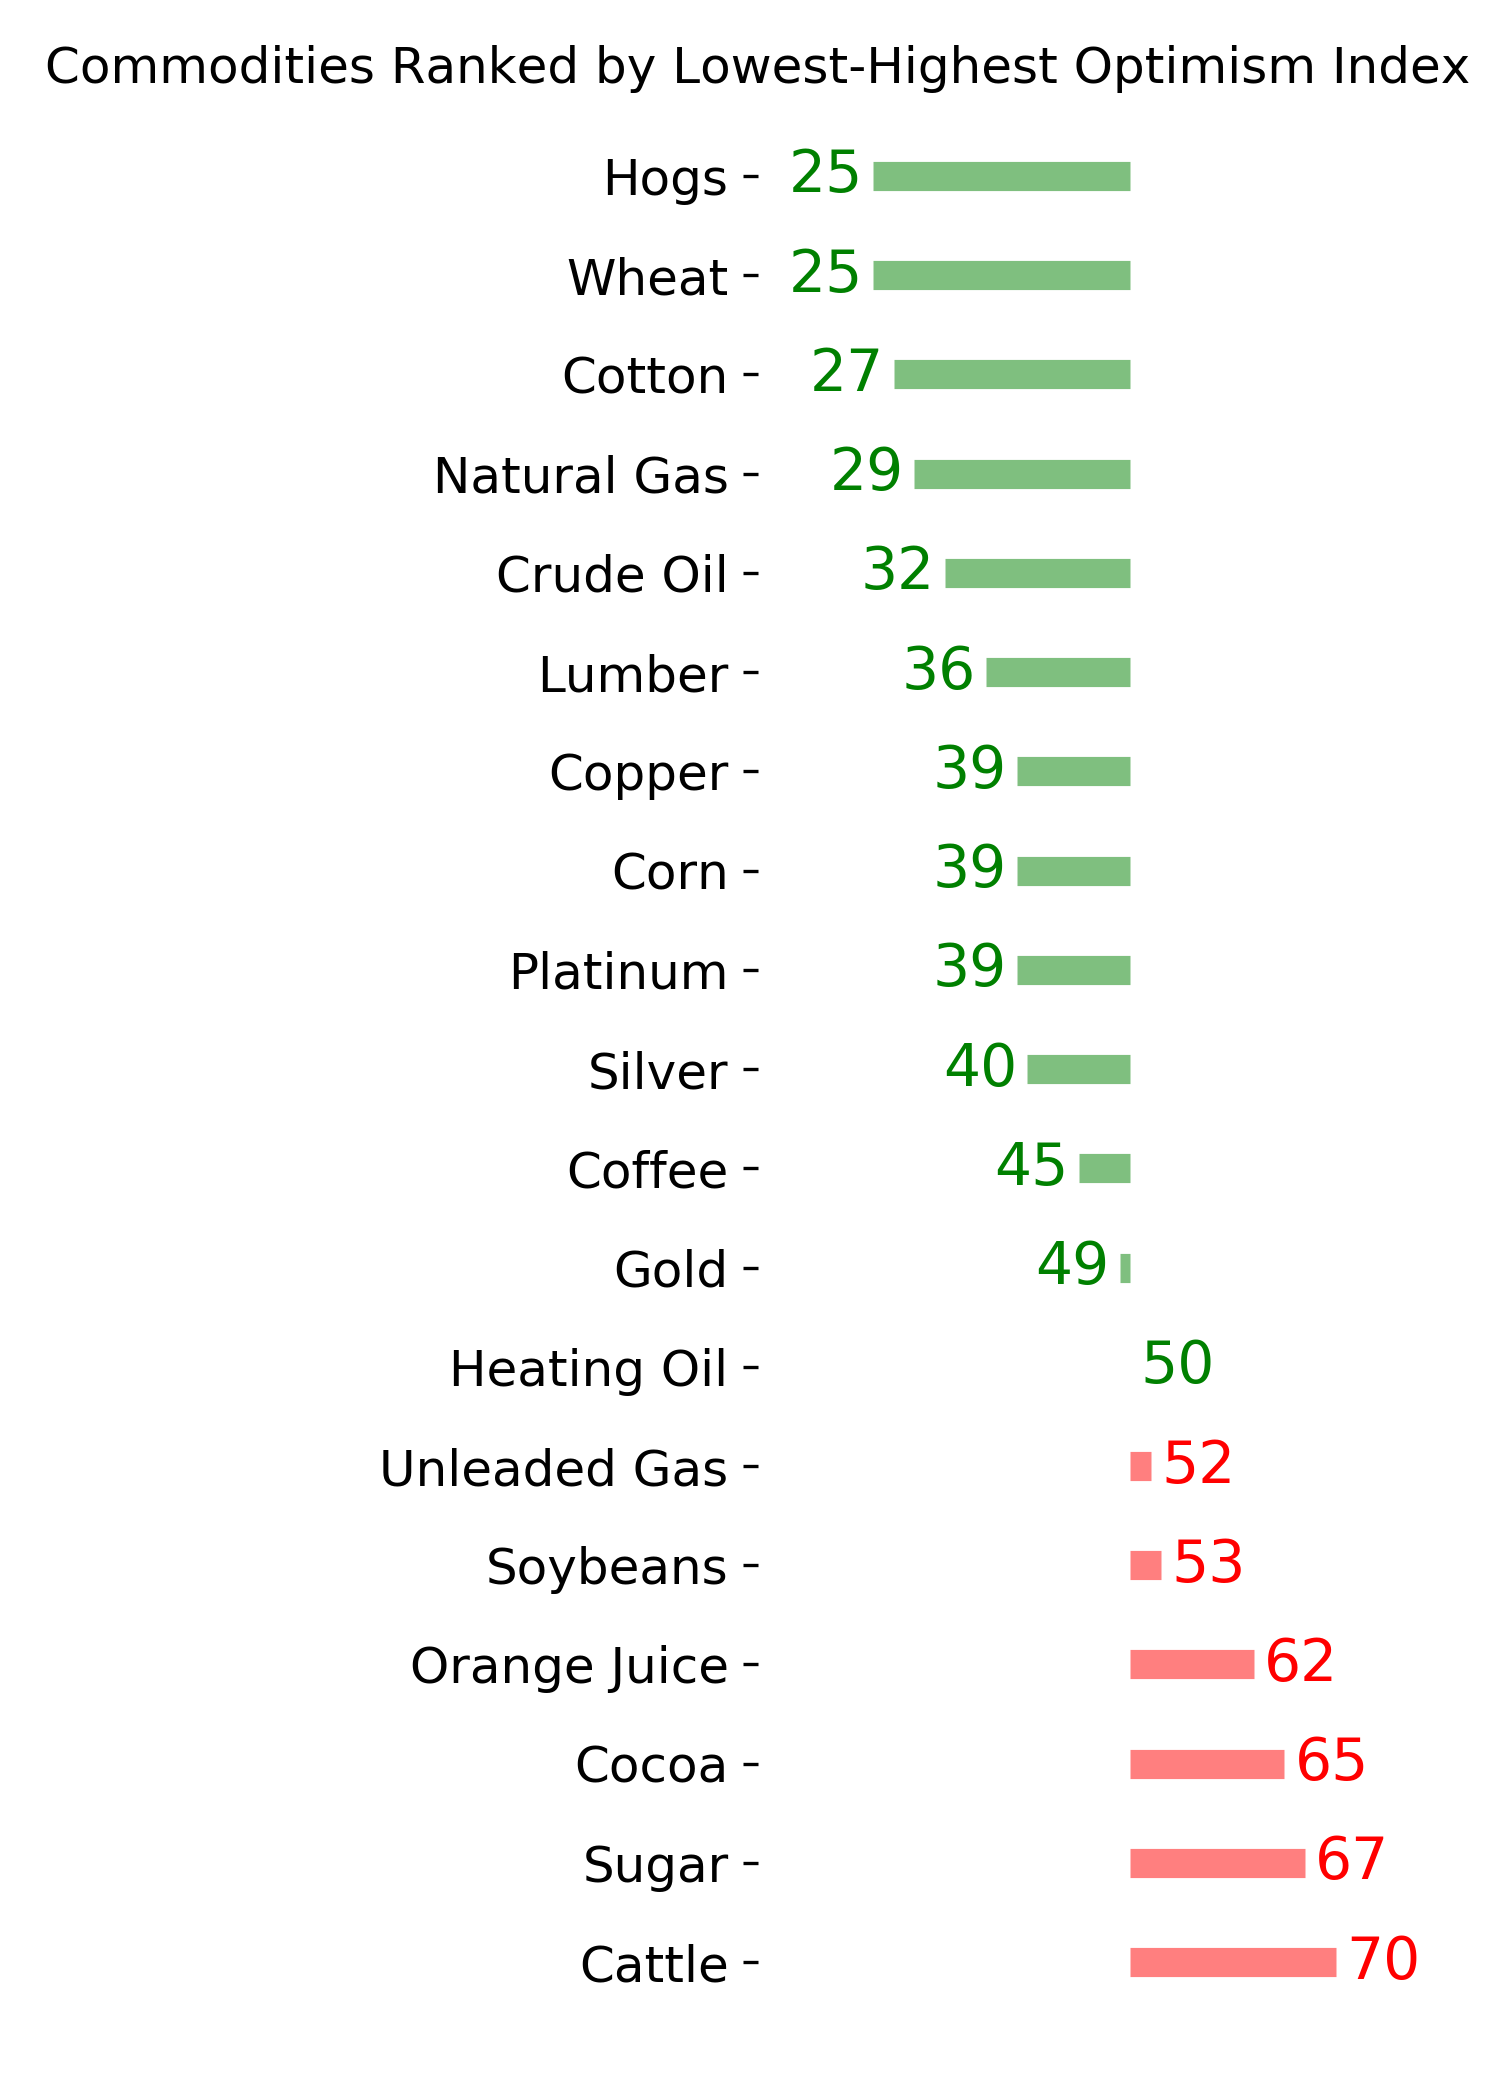
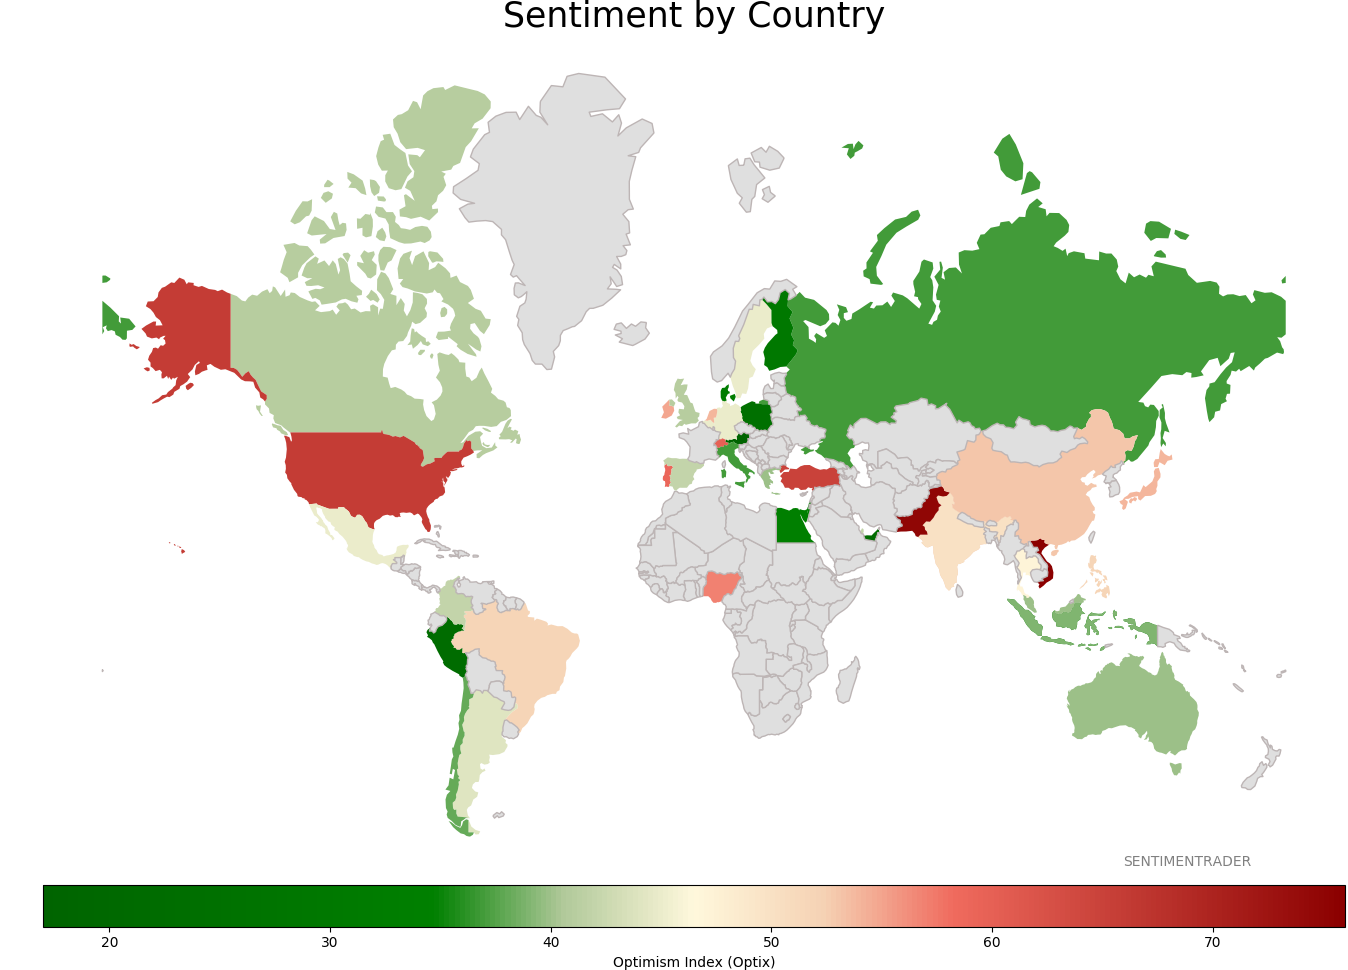
Sentiment Around The World
Optimism Index Thumbnails
|
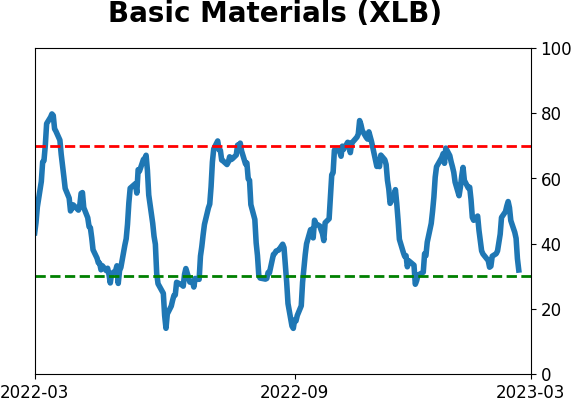
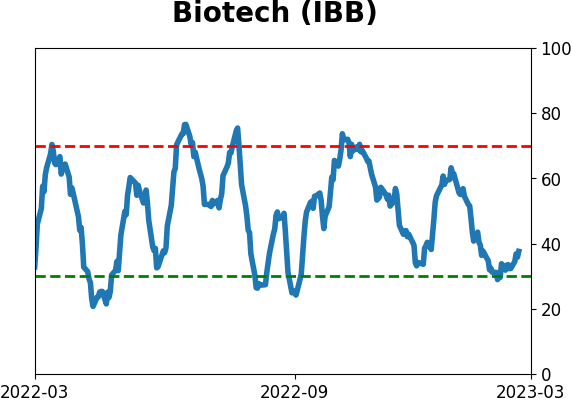
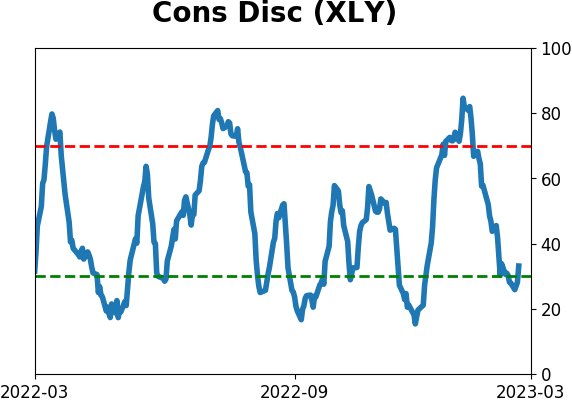
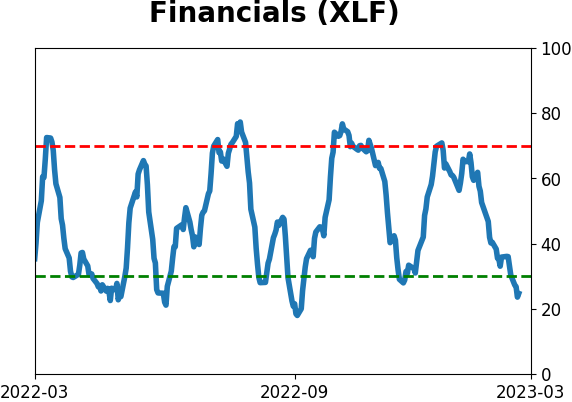
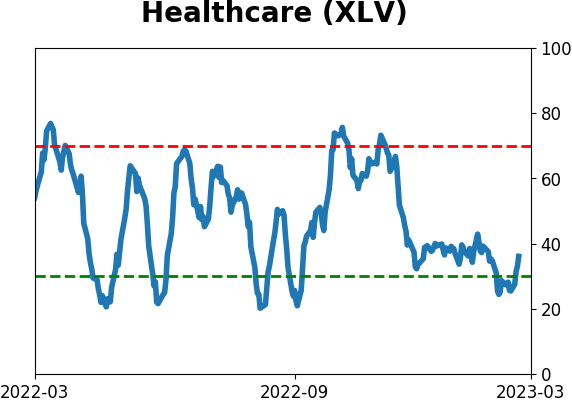
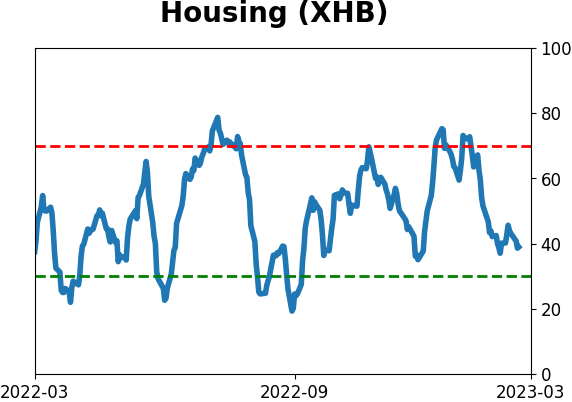
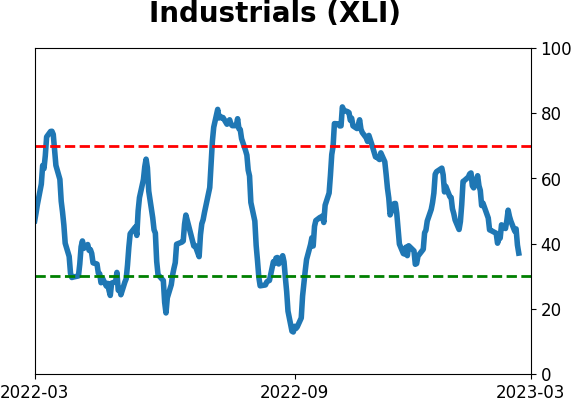
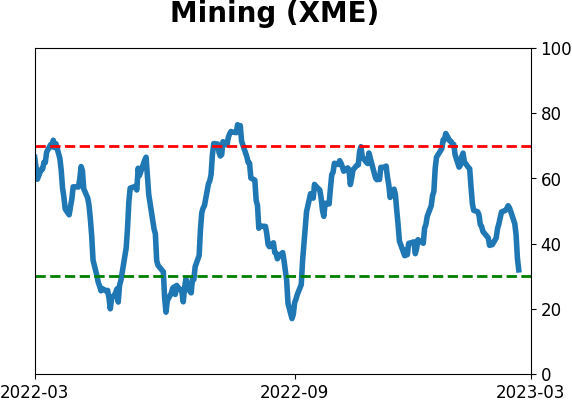
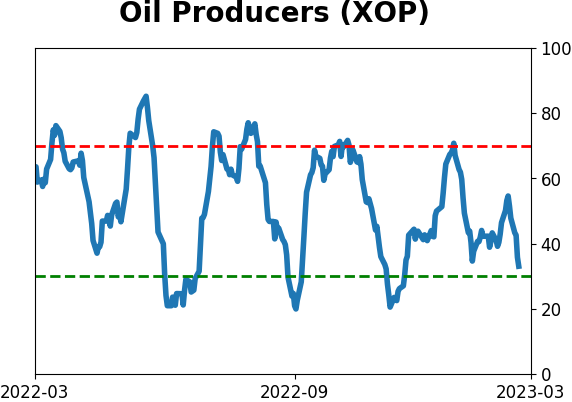
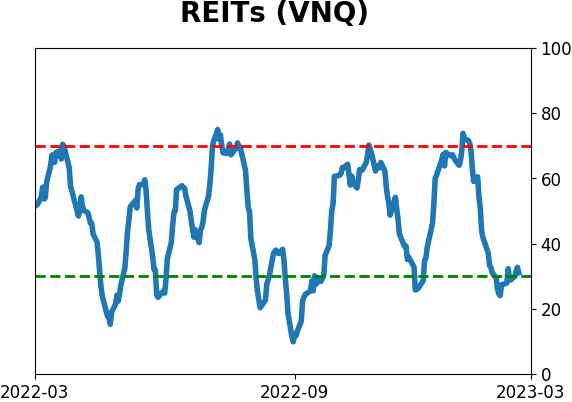
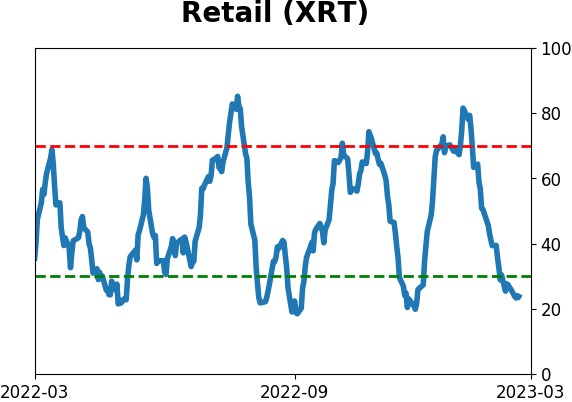
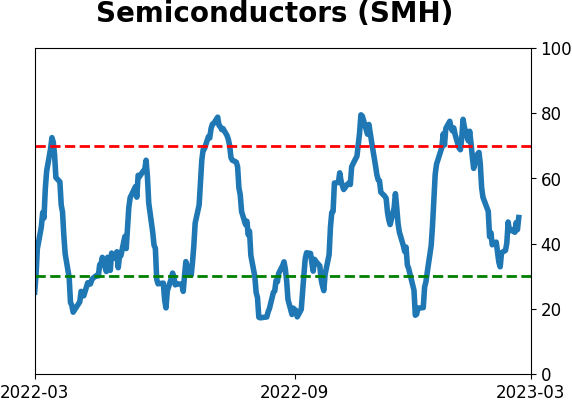
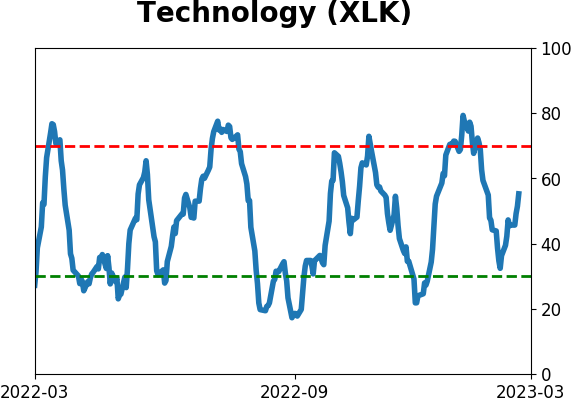
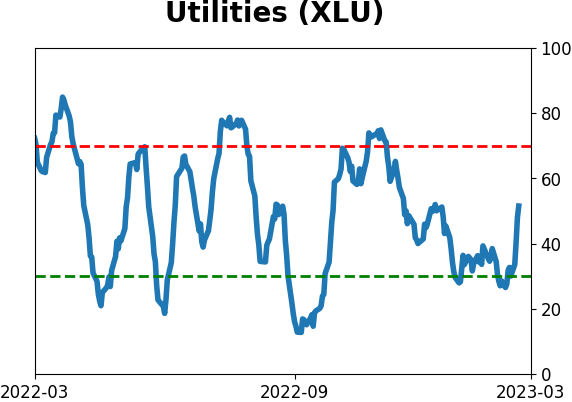
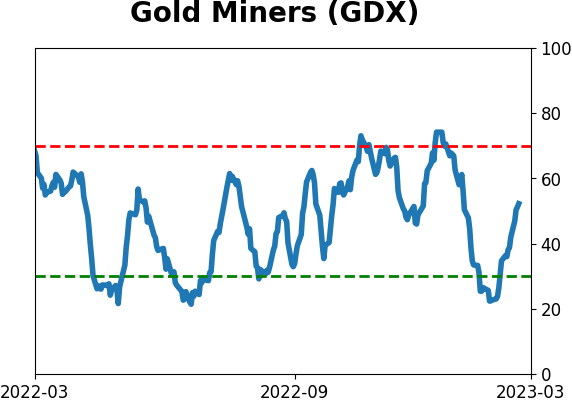
Sector ETF's - 10-Day Moving Average
|
|
|
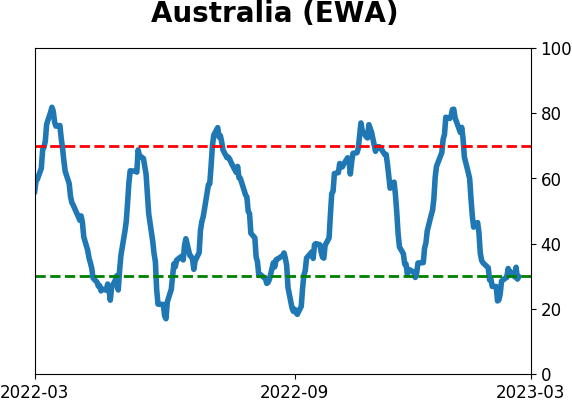
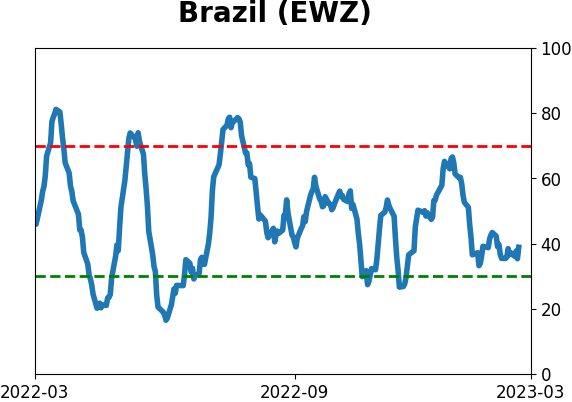
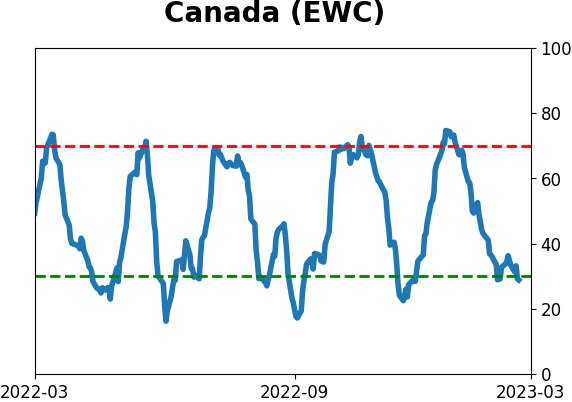
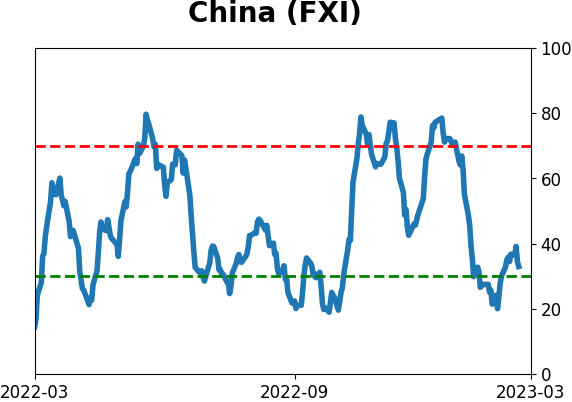
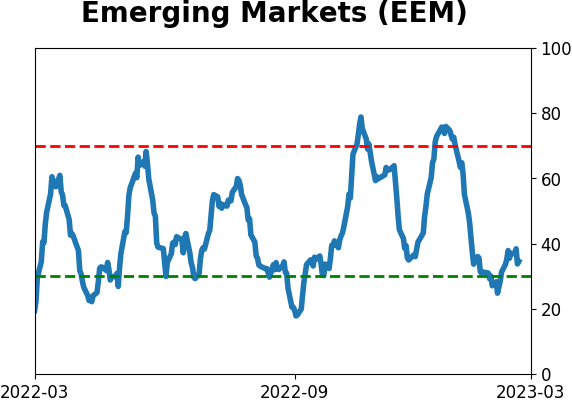
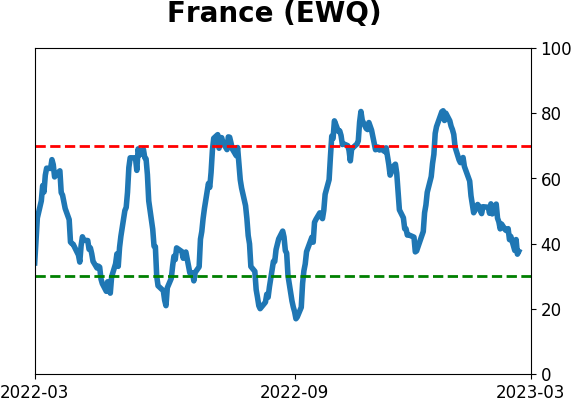
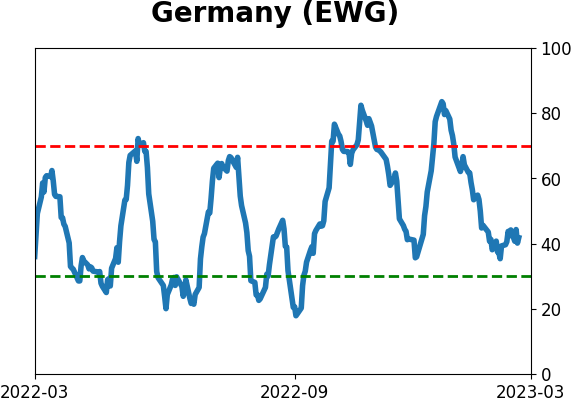
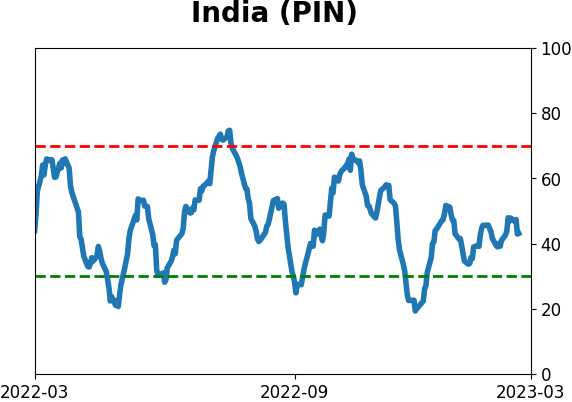
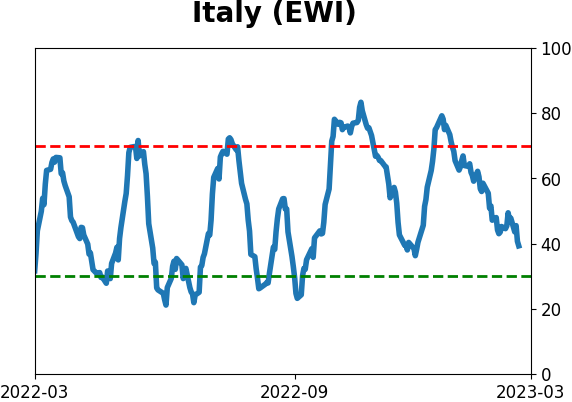
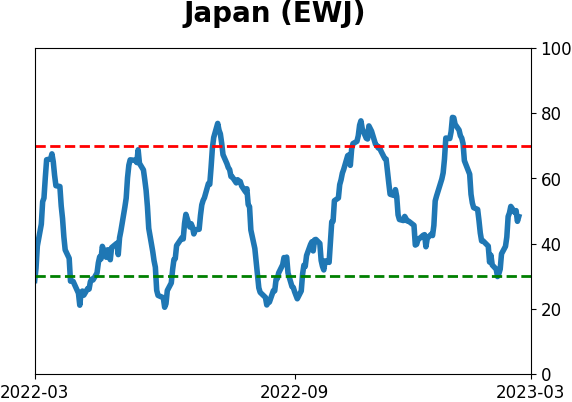
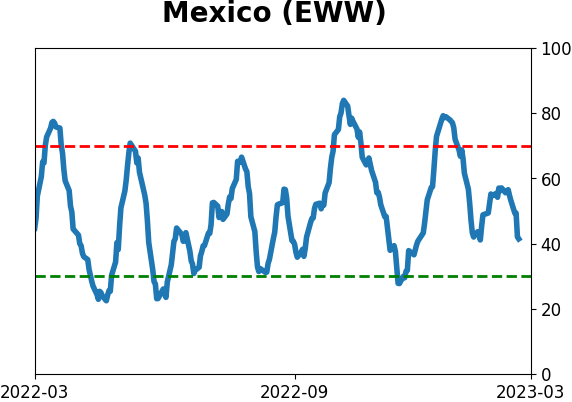
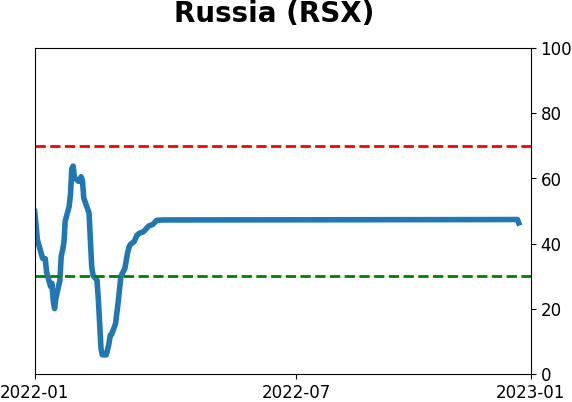
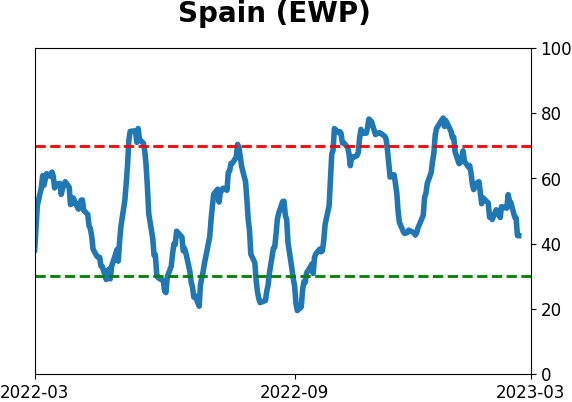
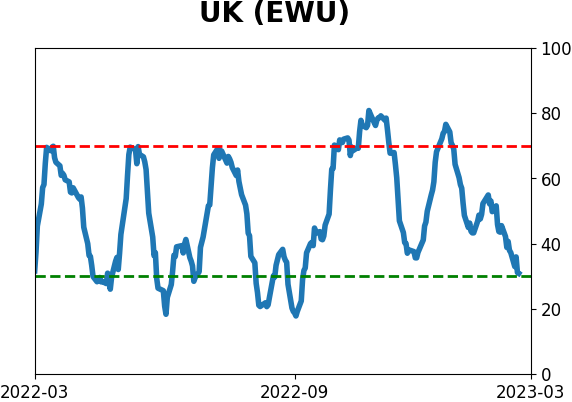
Country ETF's - 10-Day Moving Average
|
|
|
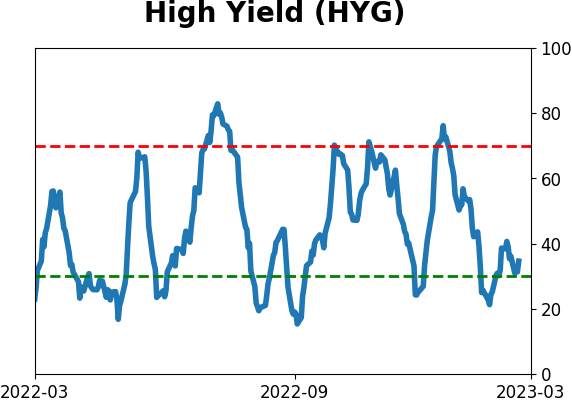
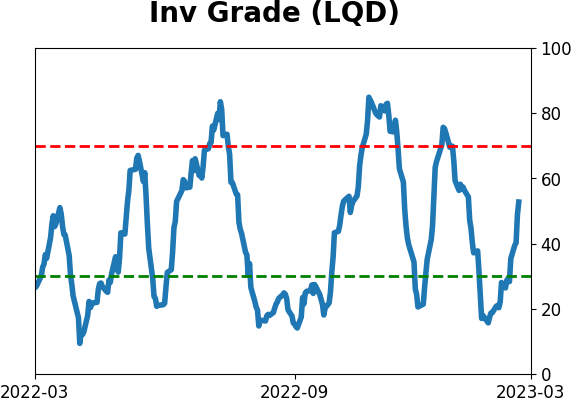
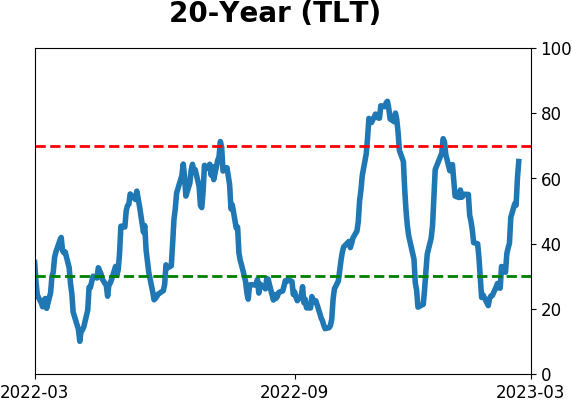
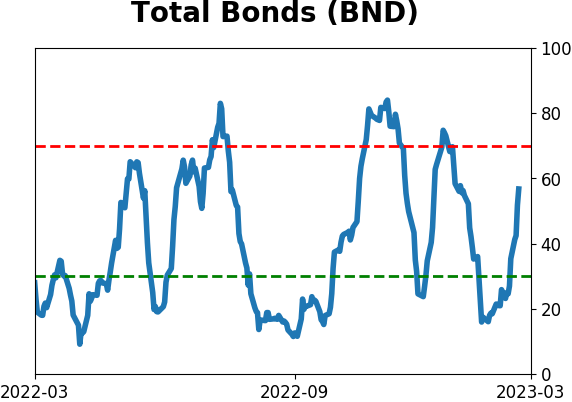
Bond ETF's - 10-Day Moving Average
|
|
|
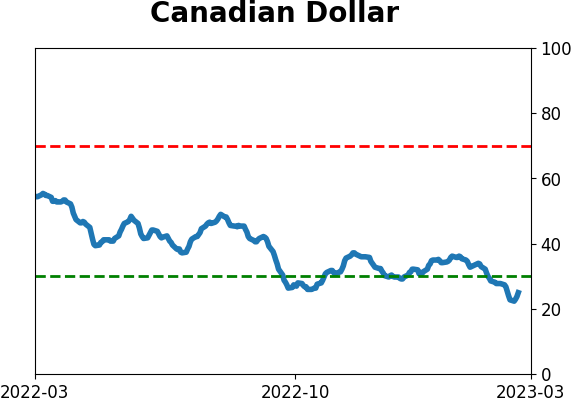
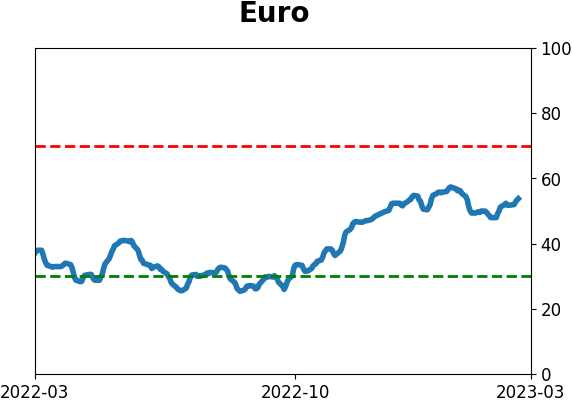
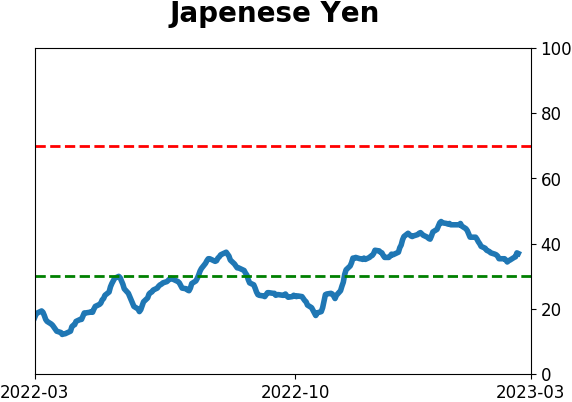
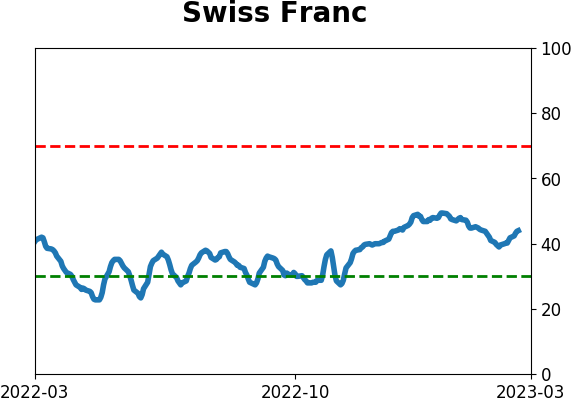
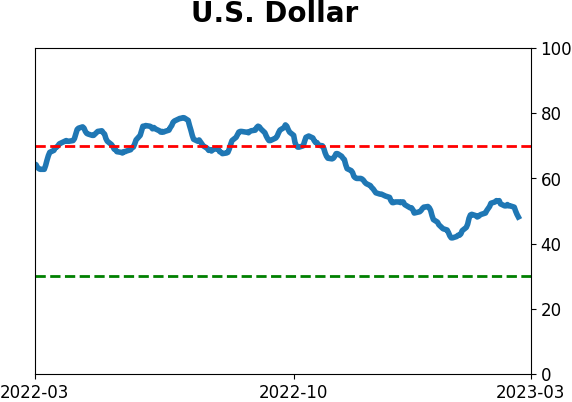
Currency ETF's - 5-Day Moving Average
|
|
|
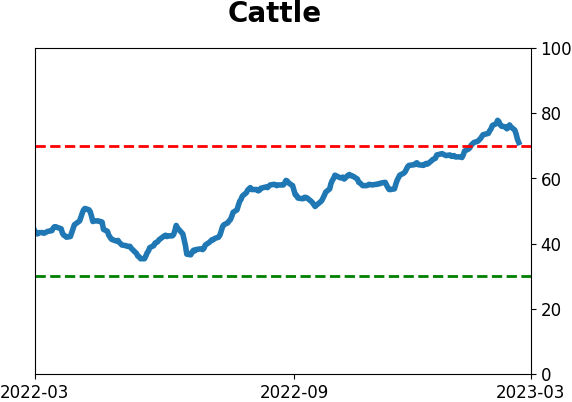
Commodity ETF's - 5-Day Moving Average
|
|