Headlines
|
|
We need to talk about (Chinese) tech:
There has been no worse place to be than Chinese technology stocks. Over the past month, they've suffered massive selling pressure and it has triggered record extremes in many breadth metrics. The average stock has lost nearly 75% of its value, and almost all are trading at 52-week lows.
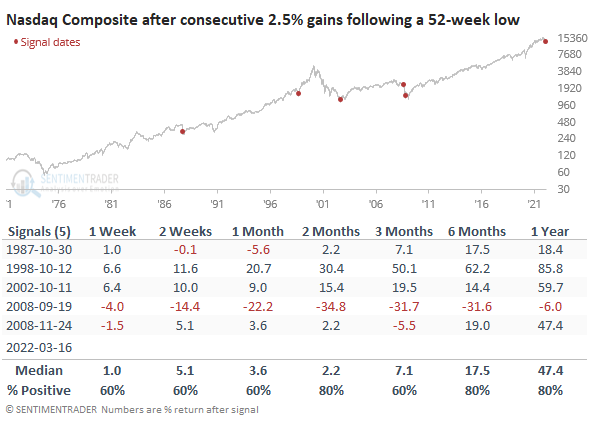
Nasdaq surge is one for the record books: After falling to a 52-week low on Monday, the Nasdaq Composite has surged at least 2.5% on consecutive sessions. In the index's 50+ year history, this kind of behavior has triggered 5 other times, 4 of which marked mutli-year lows. That failure in 2008 was a major outlier, however. It was also the only signal to exceed a 5% drawdown within the first 2 weeks of the back-to-back surge.
|
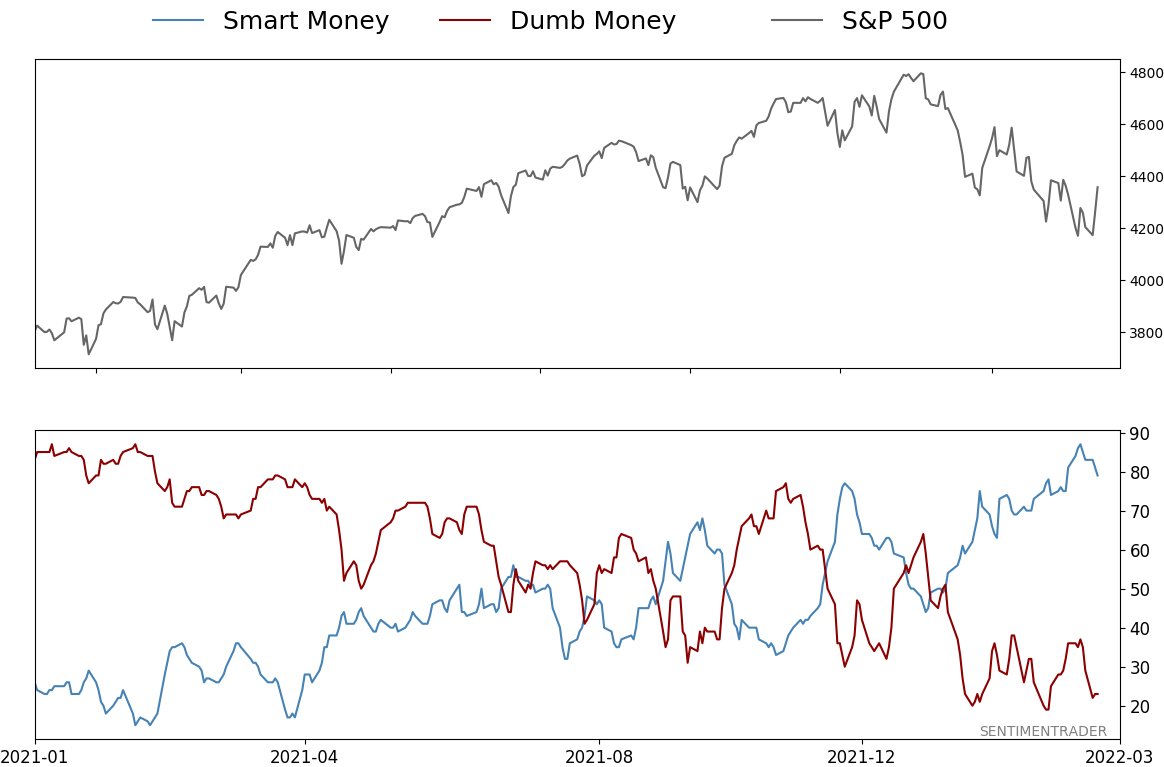
Smart / Dumb Money Confidence
|
Smart Money Confidence: 79%
Dumb Money Confidence: 23%
|
|
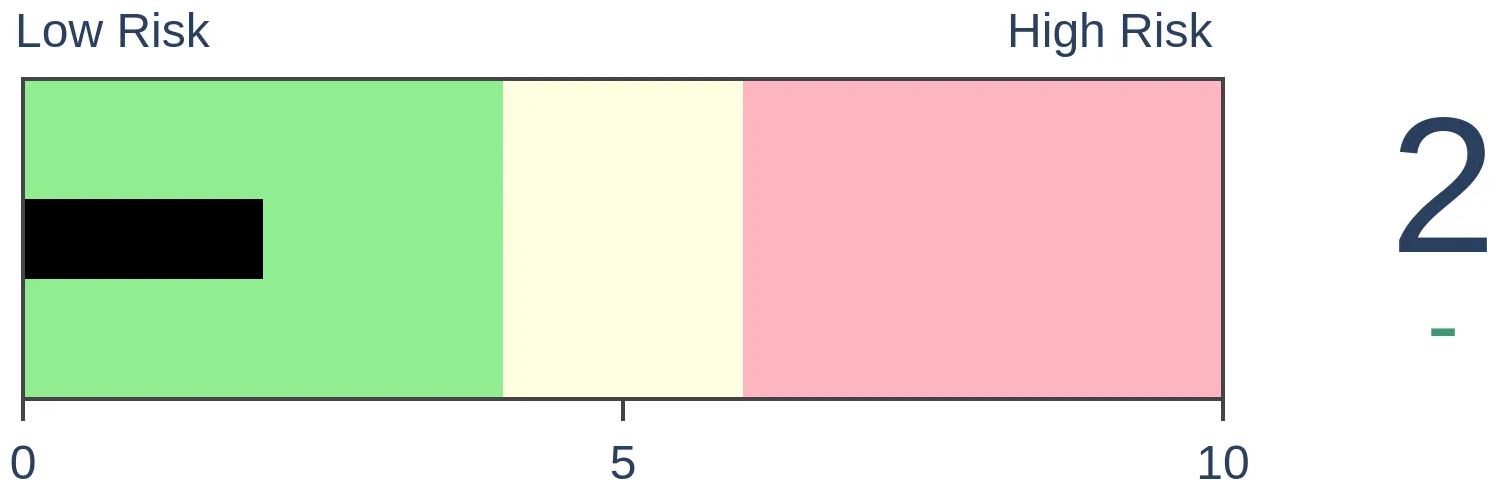
Risk Levels
Stocks Short-Term
|
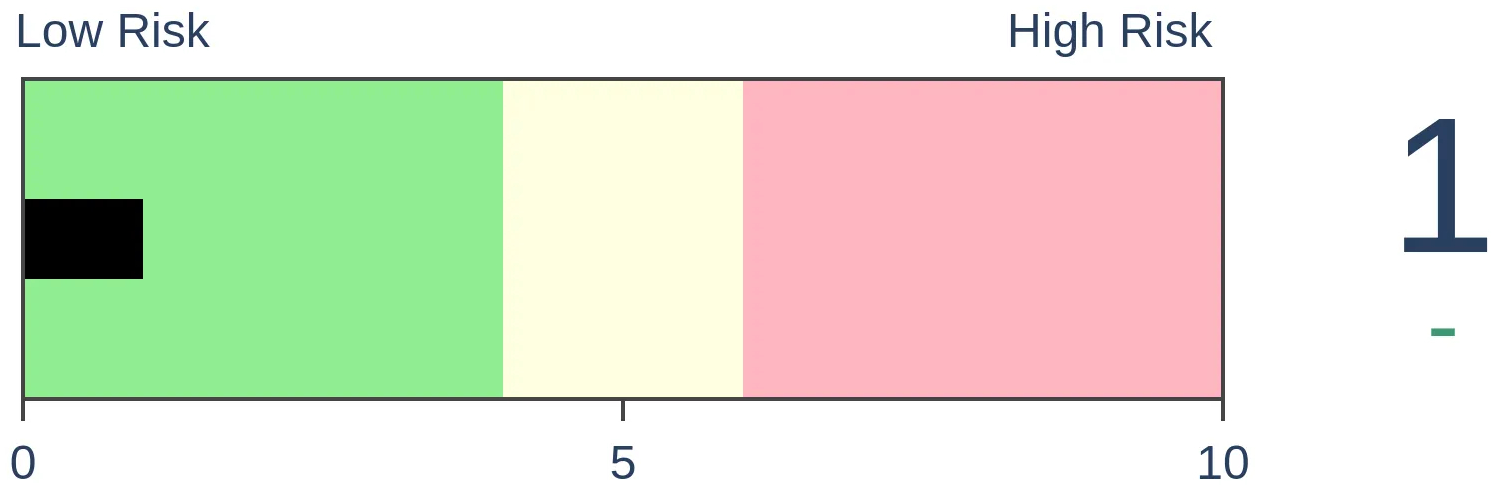
Stocks Medium-Term
|
|
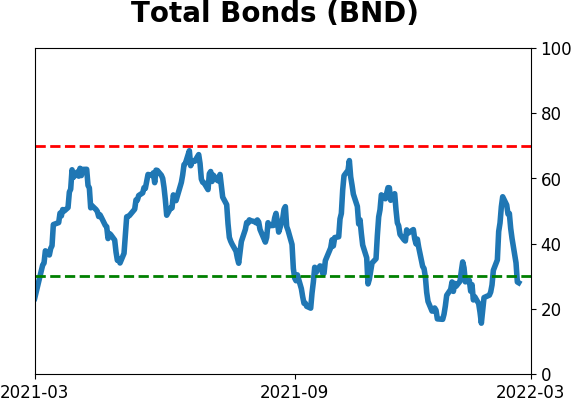
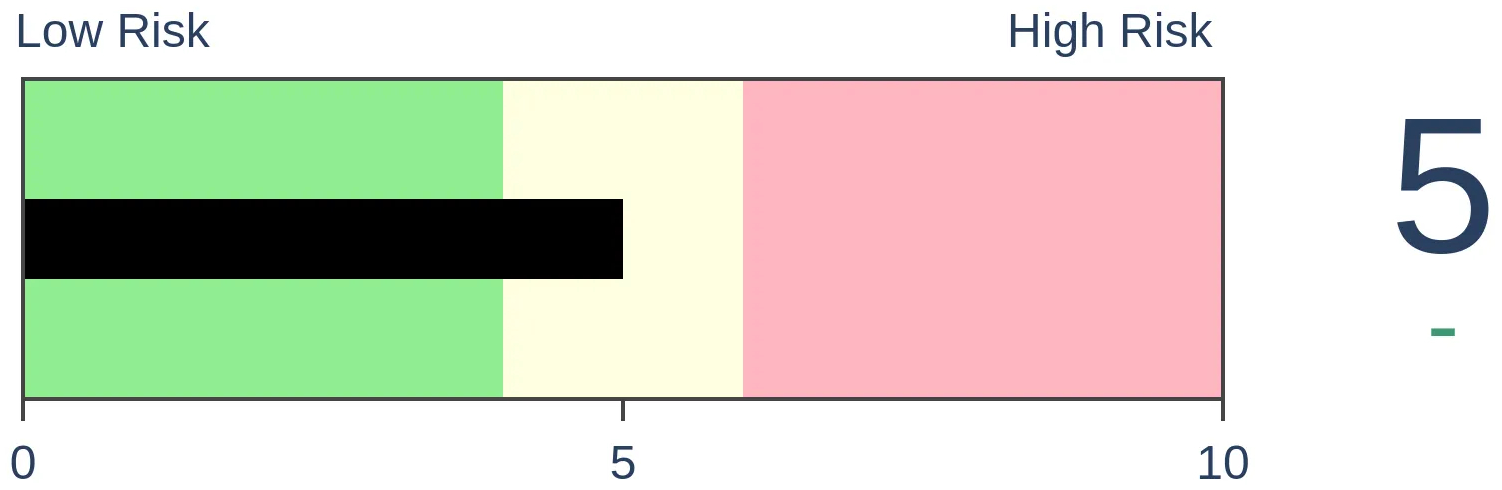
Bonds
|
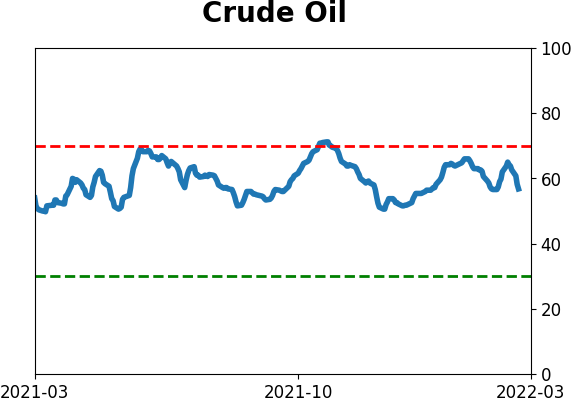
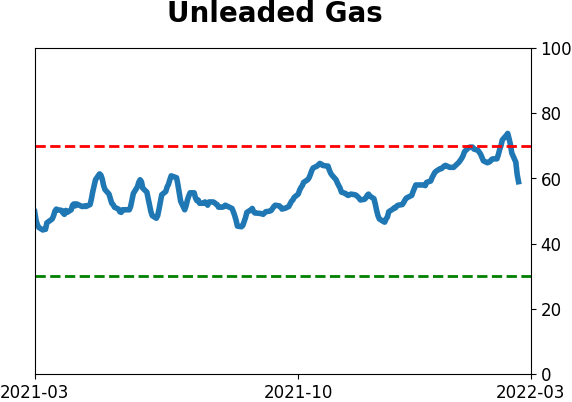
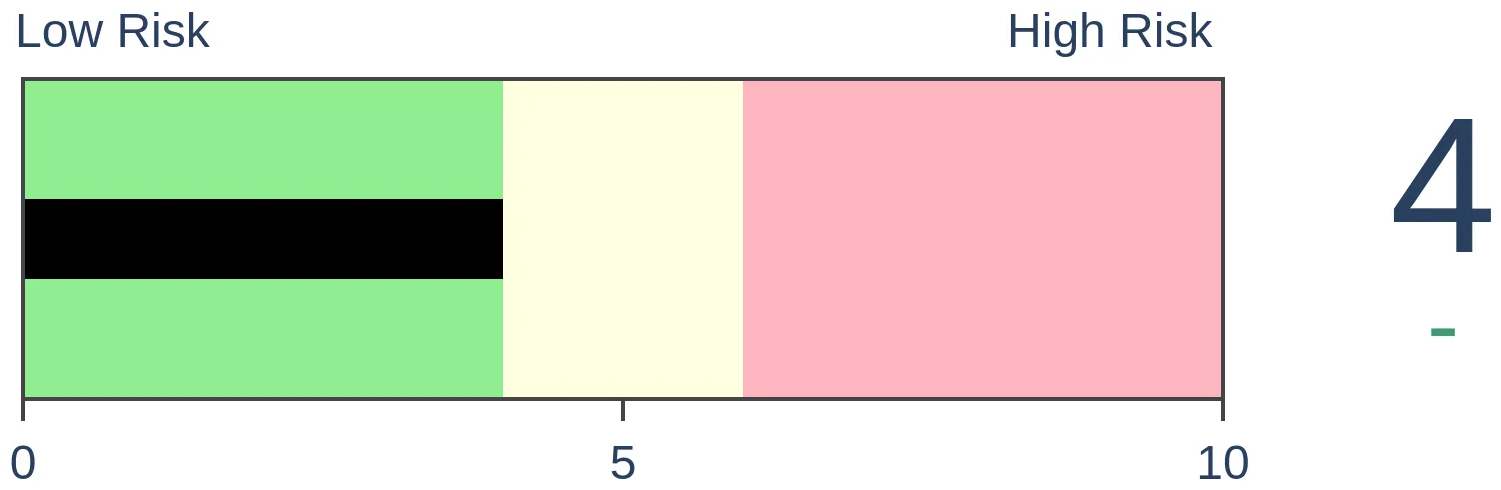
Crude Oil

|
|
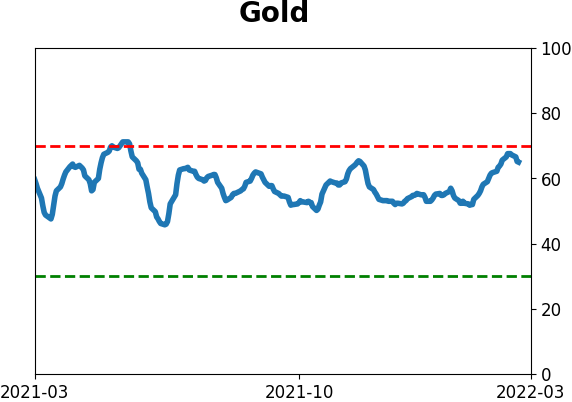
Gold
|
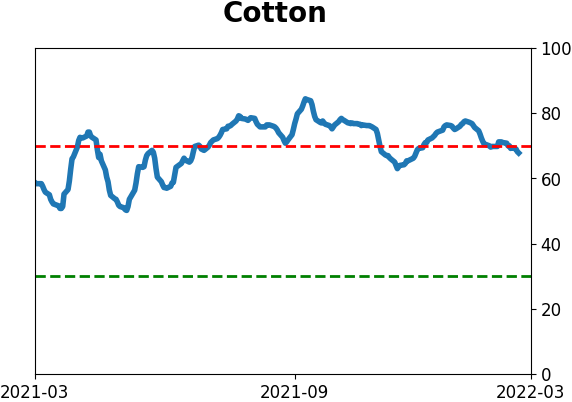
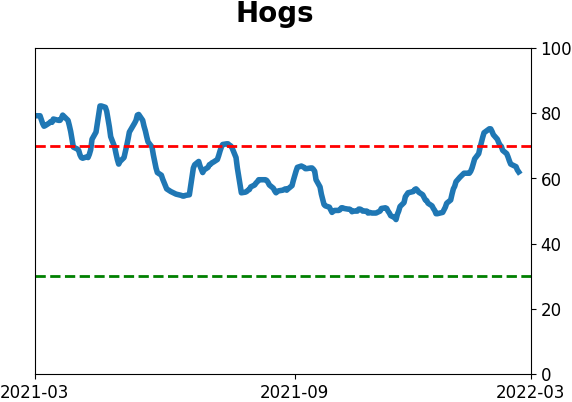
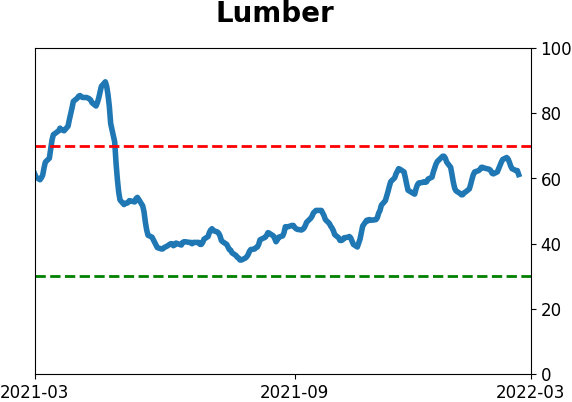
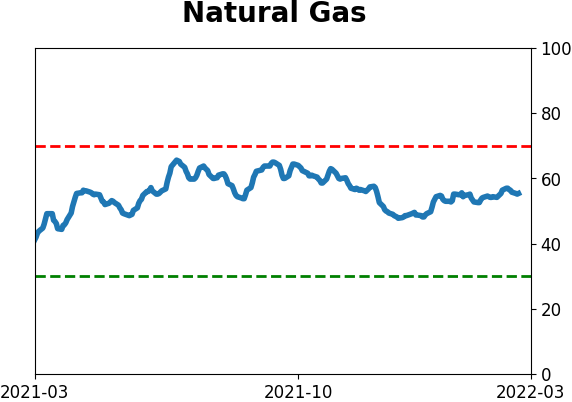
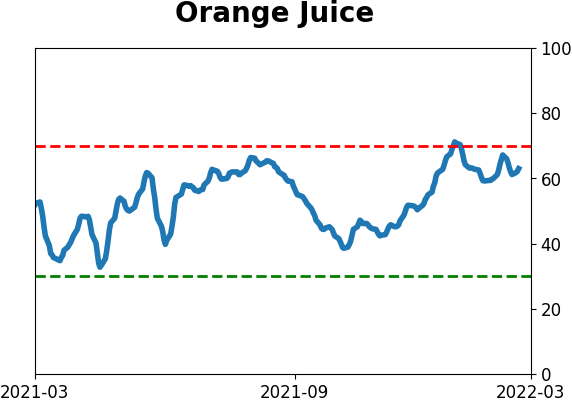
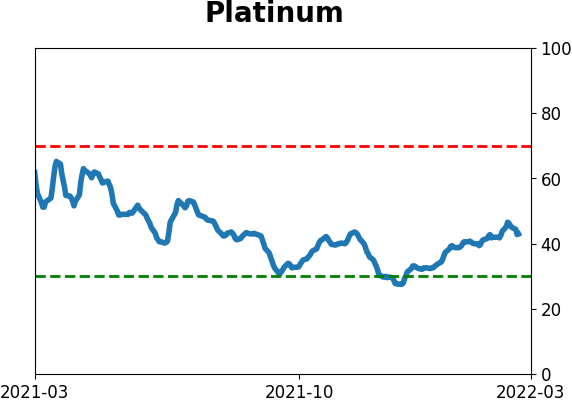
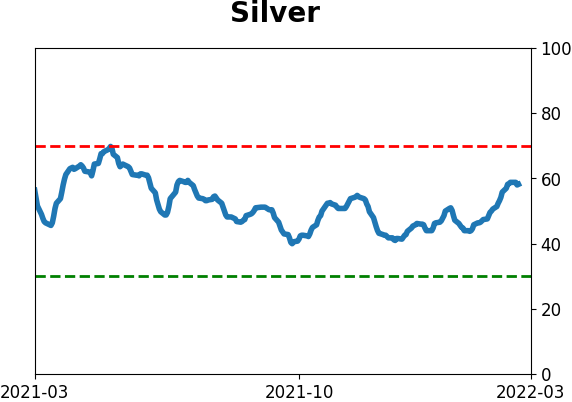
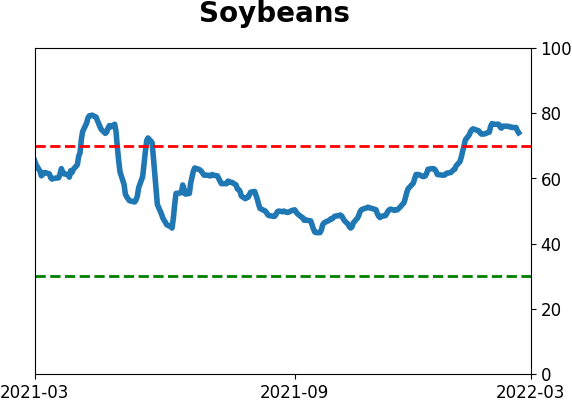
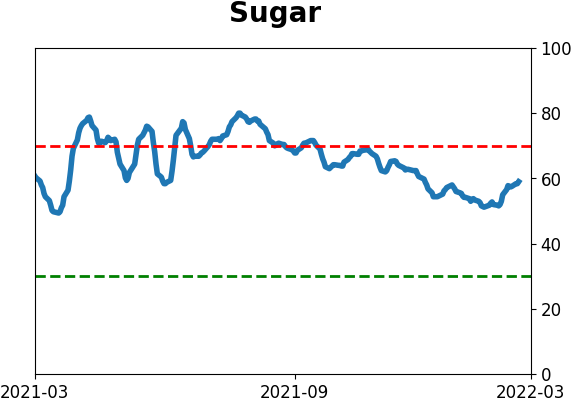
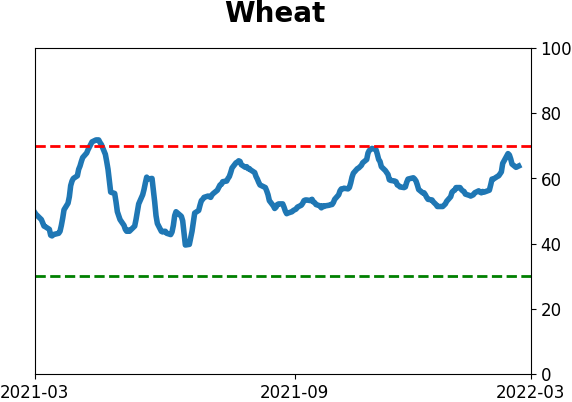
Agriculture
|
|
Research
By Jason Goepfert
BOTTOM LINE
There has been no worse place to be than Chinese technology stocks. Over the past month, they've suffered massive selling pressure and it has triggered record extremes in many breadth metrics. The average stock has lost nearly 75% of its value, and almost all are trading at 52-week lows.
FORECAST / TIMEFRAME
KWEB -- Up, Long-Term
|
Key points:
- Chinese technology stocks have suffered their worst selling pressure in 15 years, exceeding the financial crisis
- Many metrics show that the average stock has lost nearly 3/4 of its value
- Similar wholesale selling pressure in other sectors have resulted in long-term gains
A washout unlike any other
Whenever a conversation starts, "We need to talk about...", you know it's not gonna be good. And there is no worse not-gonna-be-good than Chinese tech stocks.
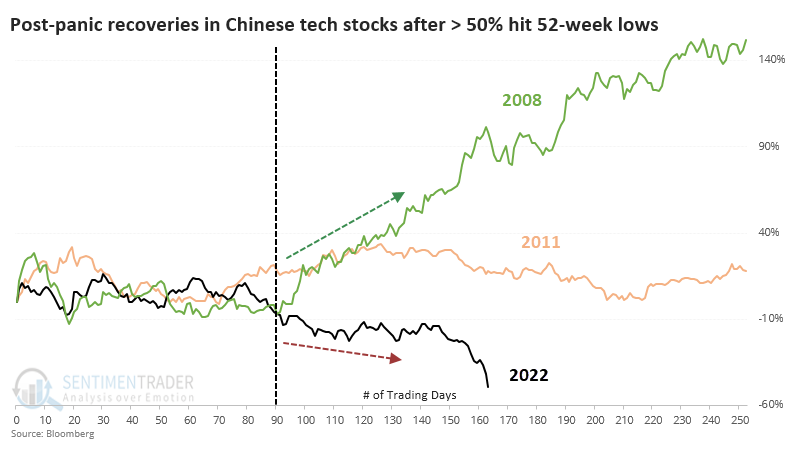
We've touched on this sector a couple of times. In September, the sector was about as washed out as it had ever been, with more than half of the stocks falling to a new low and the average stock suffering a massive 60% drawdown.
Over the next couple of months, the stocks did exactly what they should, which was precisely nothing. Bellwethers like Tencent were holding up well, showing relative strength and following through on their virtually perfect record of savvy stock buybacks.
And then the floor fell out.
About 90 days after the two other waves of panic, in 2008 and 2011, Chinese tech stocks stabilized and started their recoveries. This time, it's when the losses started to accelerate.
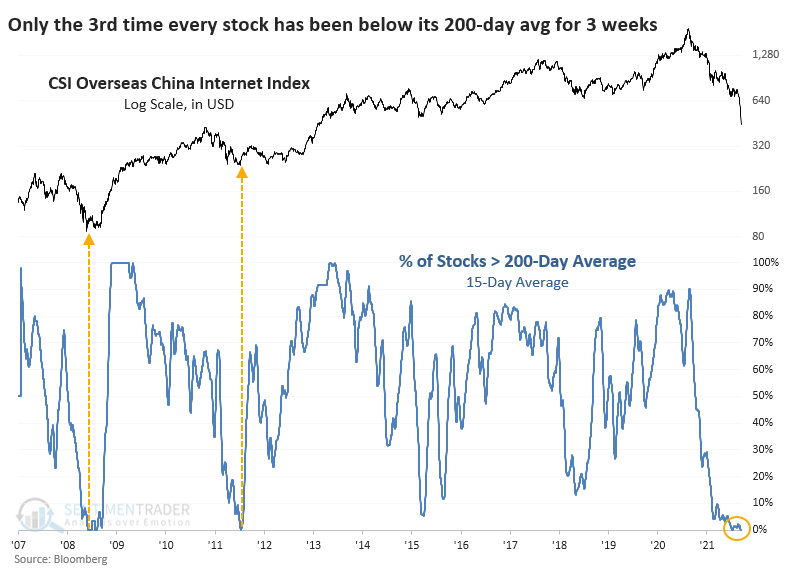
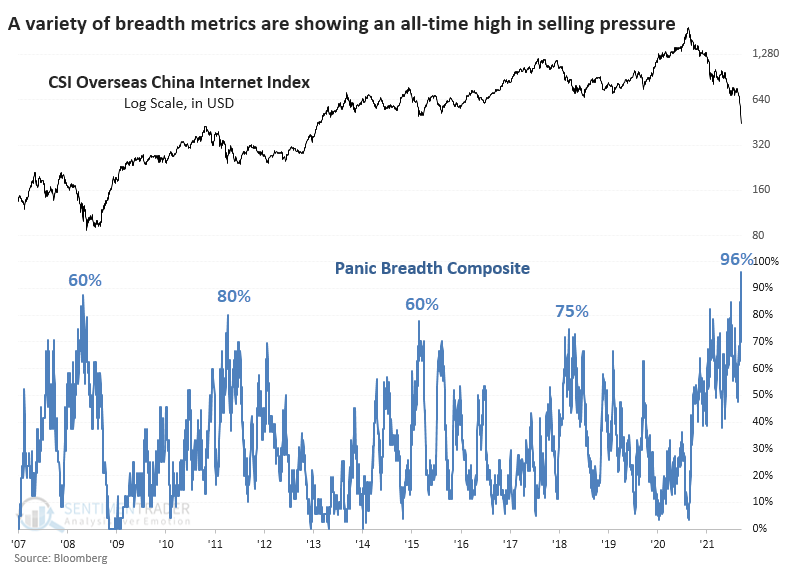
Over the past 17 sessions, there hasn't been a single member of the CSI China Overseas Internet Index trading above its 200-day moving average. This is the index upon which funds like KWEB are based. The only other times it went this long with every member below its long-term average were early December 2008 and early January 2012.
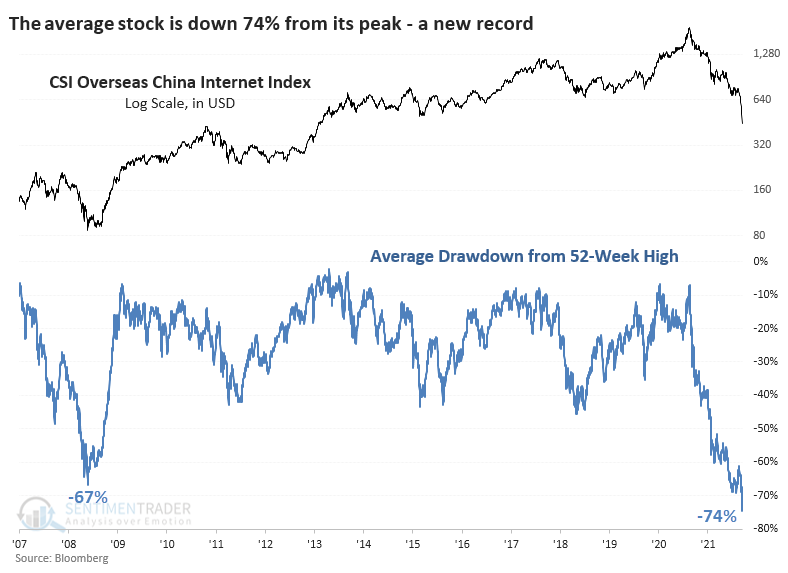
The latest down leg has surpassed the financial crisis, with the average stock down a massive 74% from its 52-week high. The prior record drawdown was 67% on November 20, 2008.
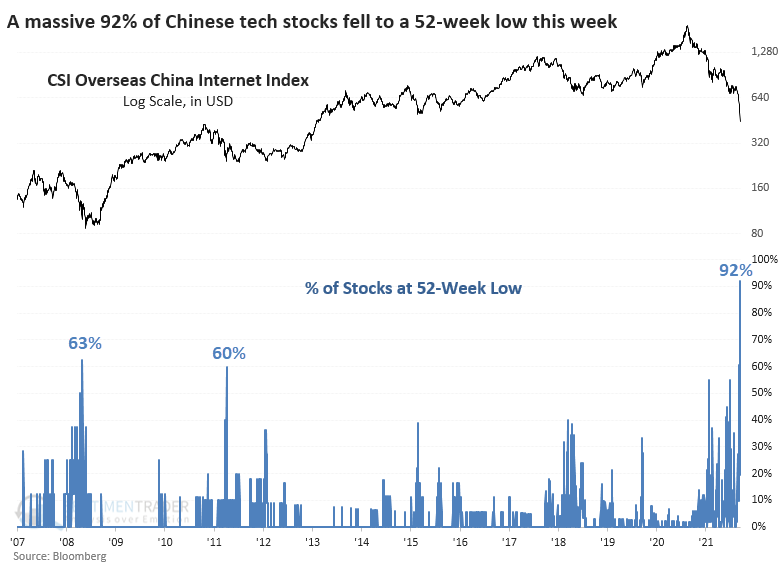
As a result of the persistent and broad-based selling, the sector recorded what is perhaps the most astounding metric that I've seen in the past 20 years. A jaw-dropping 92% of members in the index fell to a 52-week low on the same day. The prior records were 63% on October 24, 2008, and 60% on October 3, 2011.
The Panic Breadth Composite was on par with other major lows in September. Now, it has spiked to a record high, with no close comparison.
As for Tencent and its pristine record of buying back its own stock, it waded back into the market virtually every day from January 5 through January 20, doubling the size of its daily buyback operations from its last stretch of buying August and September 2021.
When running a scan for any company with a market capitalization over $100 billion that dropped 33% or more over 20 days while falling to a 52-week low (U.S. listed companies only), 590 days qualified, spread among 58 stocks. A year later, these shares were trading higher after 79% of the days, averaging a return of 66%.
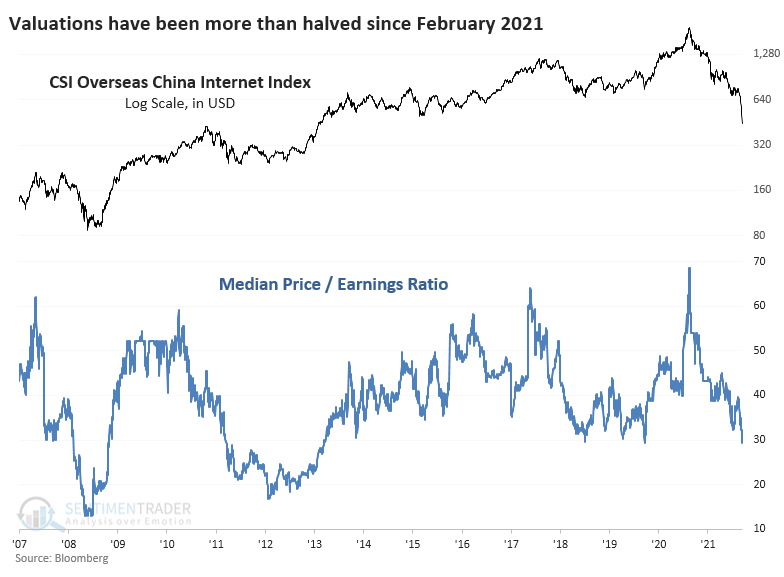
Valuations are near or at historic lows
I've never been a big fan of using forecasted valuation multiples because analysts continually miss their marks. Using trailing 12-month reported earnings, Chinese tech stocks are trading at their lowest median multiple in a decade. Mutiples contracted even further during 2008 and 2011-12, though.
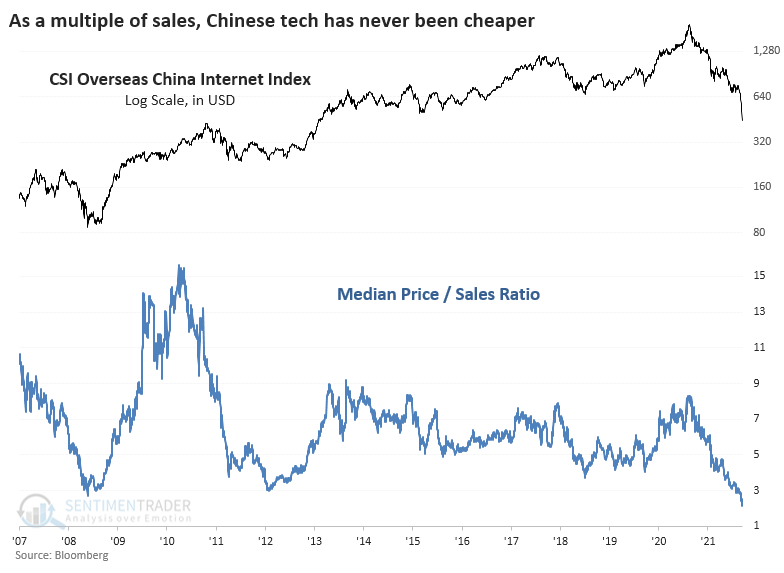
Even more objectively, and more notably, they've dropped to only 2.1 times sales, a record low. The 2008 and 2011-12 declines took the average multiple to around 3 times sales.
What the research tells us...
The concerns about Chinese stocks, and their technology sector, in particular, are well-known. Or investors think they know.
- Increased regulatory scrutiny
- Potential sanctions if China expands its ties with Russia
- Fears of U.S. exchange de-listings
- Focus shift from market-based to common-prosperity-based
- A Covid spike and economic lockdowns
- Rampant inflation
- Property bubble bust and potential debt implosion
Of course, I have an opinion on these risks; I'm human. I will keep them to myself - I'd be just another schmuck spouting poorly-informed hot takes like pretty much everyone else. I have no edge there; what everyone else knows isn't really worth knowing, anyway.
There has been a drumbeat of headlines about China in the financial and mainstream press, and not a single one of them that I've read is positive. As an investor, it's exceedingly difficult to buy or hold during times like this because there is zero feedback that you may be on the right path. It doesn't feel good.
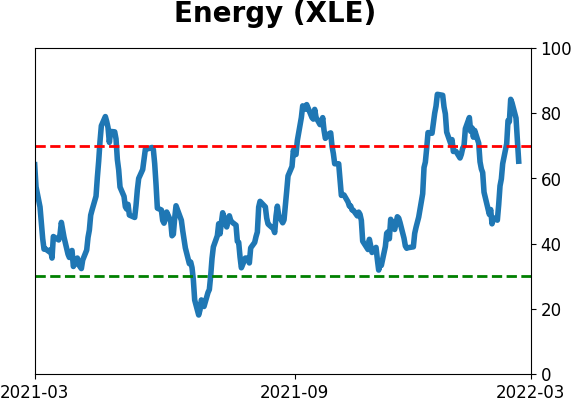
This is reminiscent of energy stocks in September 2020, when there was compelling evidence that it was the most-hated sector of all time. The headlines were dire - Exxon was booted from the Dow Industrials after more than 90 years, ESG investors were dumping energy shares, and the "green revolution" was threatening these firms as going concerns. The XLE fund has returned nearly 200% since then.
Or we could point to gold mining stocks near the end of 2015 when a Chinese slowdown and drop in gold prices triggered historic selling pressure and suspended dividend payouts.
I noted in some portfolio updates that since the stocks were now not doing what they should, it would make sense to take the loss and stand aside from a trading point of view. From a multi-year investment point of view, buying into give-up sectors almost always carries some short-term pain. But this has been something else. I don't think I've ever seen, in direct observation or through extensive study, a sector that has been battered like this one in such a short period, despite solid fundamentals (for now, anyway) in many members.
The risk is always that somebody knows something, and they're getting out. There is no guarantee that the stocks will recover like miners or energy companies did. The last setup failed miserably, but there is an excellent chance that today's rebound is the start of a bottoming process like it was in 2008 and 2011-12, and if so then we'll probably be in for a test of the low at some point.
Active Studies
| Time Frame | Bullish | Bearish | | Short-Term | 4 | 0 | | Medium-Term | 22 | 2 | | Long-Term | 15 | 5 |
|
Indicators at Extremes
Portfolio
| Position | Description | Weight % | Added / Reduced | Date | | Stocks | RSP | 21.4 | Added 10.2% | 2022-01-28 | | Bonds | 32.7% BND, 7.1% SCHP | 40.1 | Added 8.3% | 2021-10-26 | | Commodities | GCC | 2.4 | Reduced 2.1%
| 2020-09-04 | | Precious Metals | GDX | 4.6 | Reduced 4.2% | 2021-05-19 | | Special Situations | 7.6% KWEB, 4.9% XBI, 3.7% XLE, 1.8% PSCE | 18.0 | Added 4.6% | 2022-02-24 | | Cash | | 13.2 | | |
|
Updates (Changes made today are underlined)
With a typical time frame of several months in this account, I normally don't make changes so quickly. I've added back part of the stock exposure I took off earlier in January due to the washed-out conditions and extreme pessimism we're seeing across a wide array of metrics. The biggest issue is that the environment is unhealthy and we could be in the throes of a protracted bear market. Even so, the readings we've seen recently have a good record at preceding relief rallies, so we'll have to see how that pans out. Bond sentiment is trying to recover from a recent bout of pessimism, and gold stocks are doing their thing which is not much at all. They've been flat for six months. Chinese tech stocks were doing exactly what they're supposed to do, then did *not* by plunging to new lows. This is troubling on a shorter-term time frame, but this was never meant for a trade, rather a multi-year investment. Recent behavior is troubling and I will not be adding any exposure as long as that's the case. RETURN YTD: -0.9% 2021: +8.7%, 2020: +8.1%, 2019: +12.6%, 2018: +0.6%, 2017: +3.8%, 2016: +17.1%, 2015: +9.2%, 2014: +14.5%, 2013: +2.2%, 2012: +10.8%, 2011: +16.5%, 2010: +15.3%, 2009: +23.9%, 2008: +16.2%, 2007: +7.8%
|
|
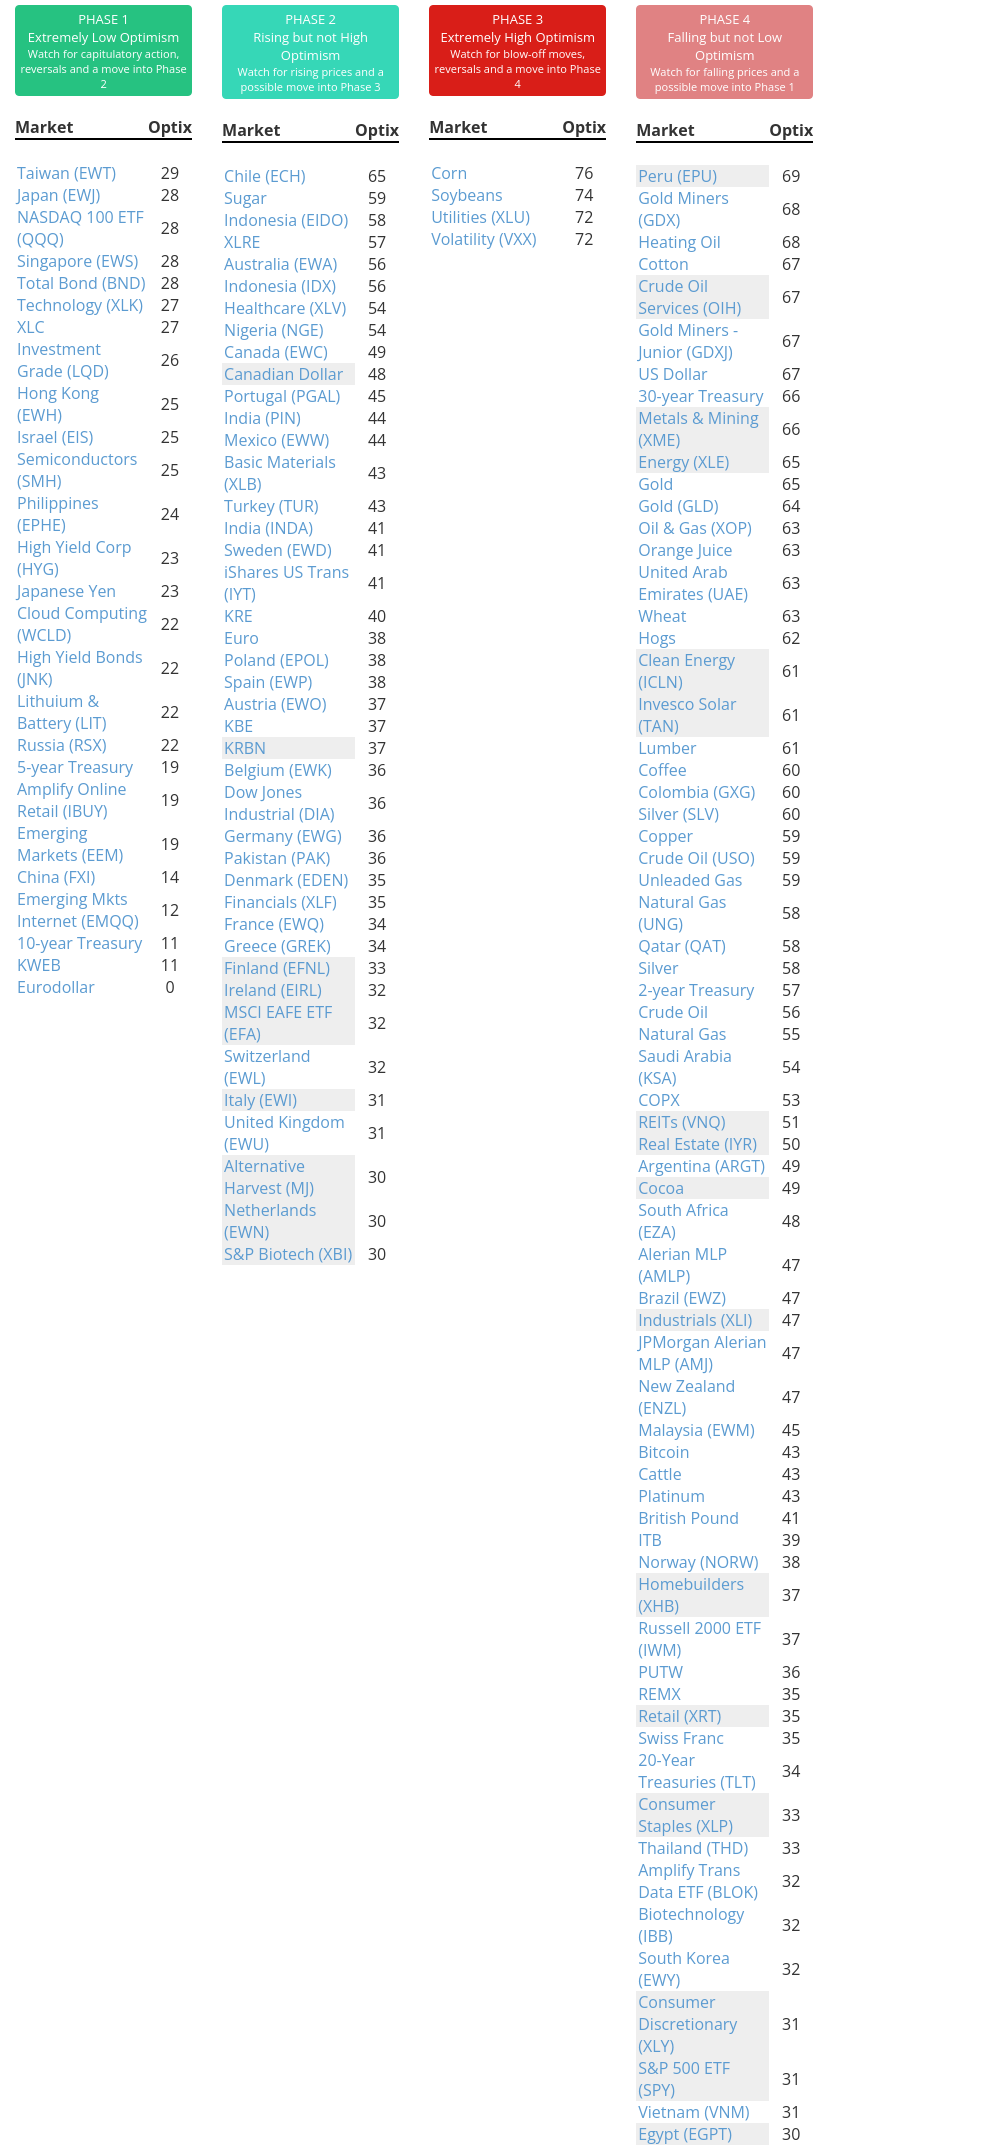
Phase Table
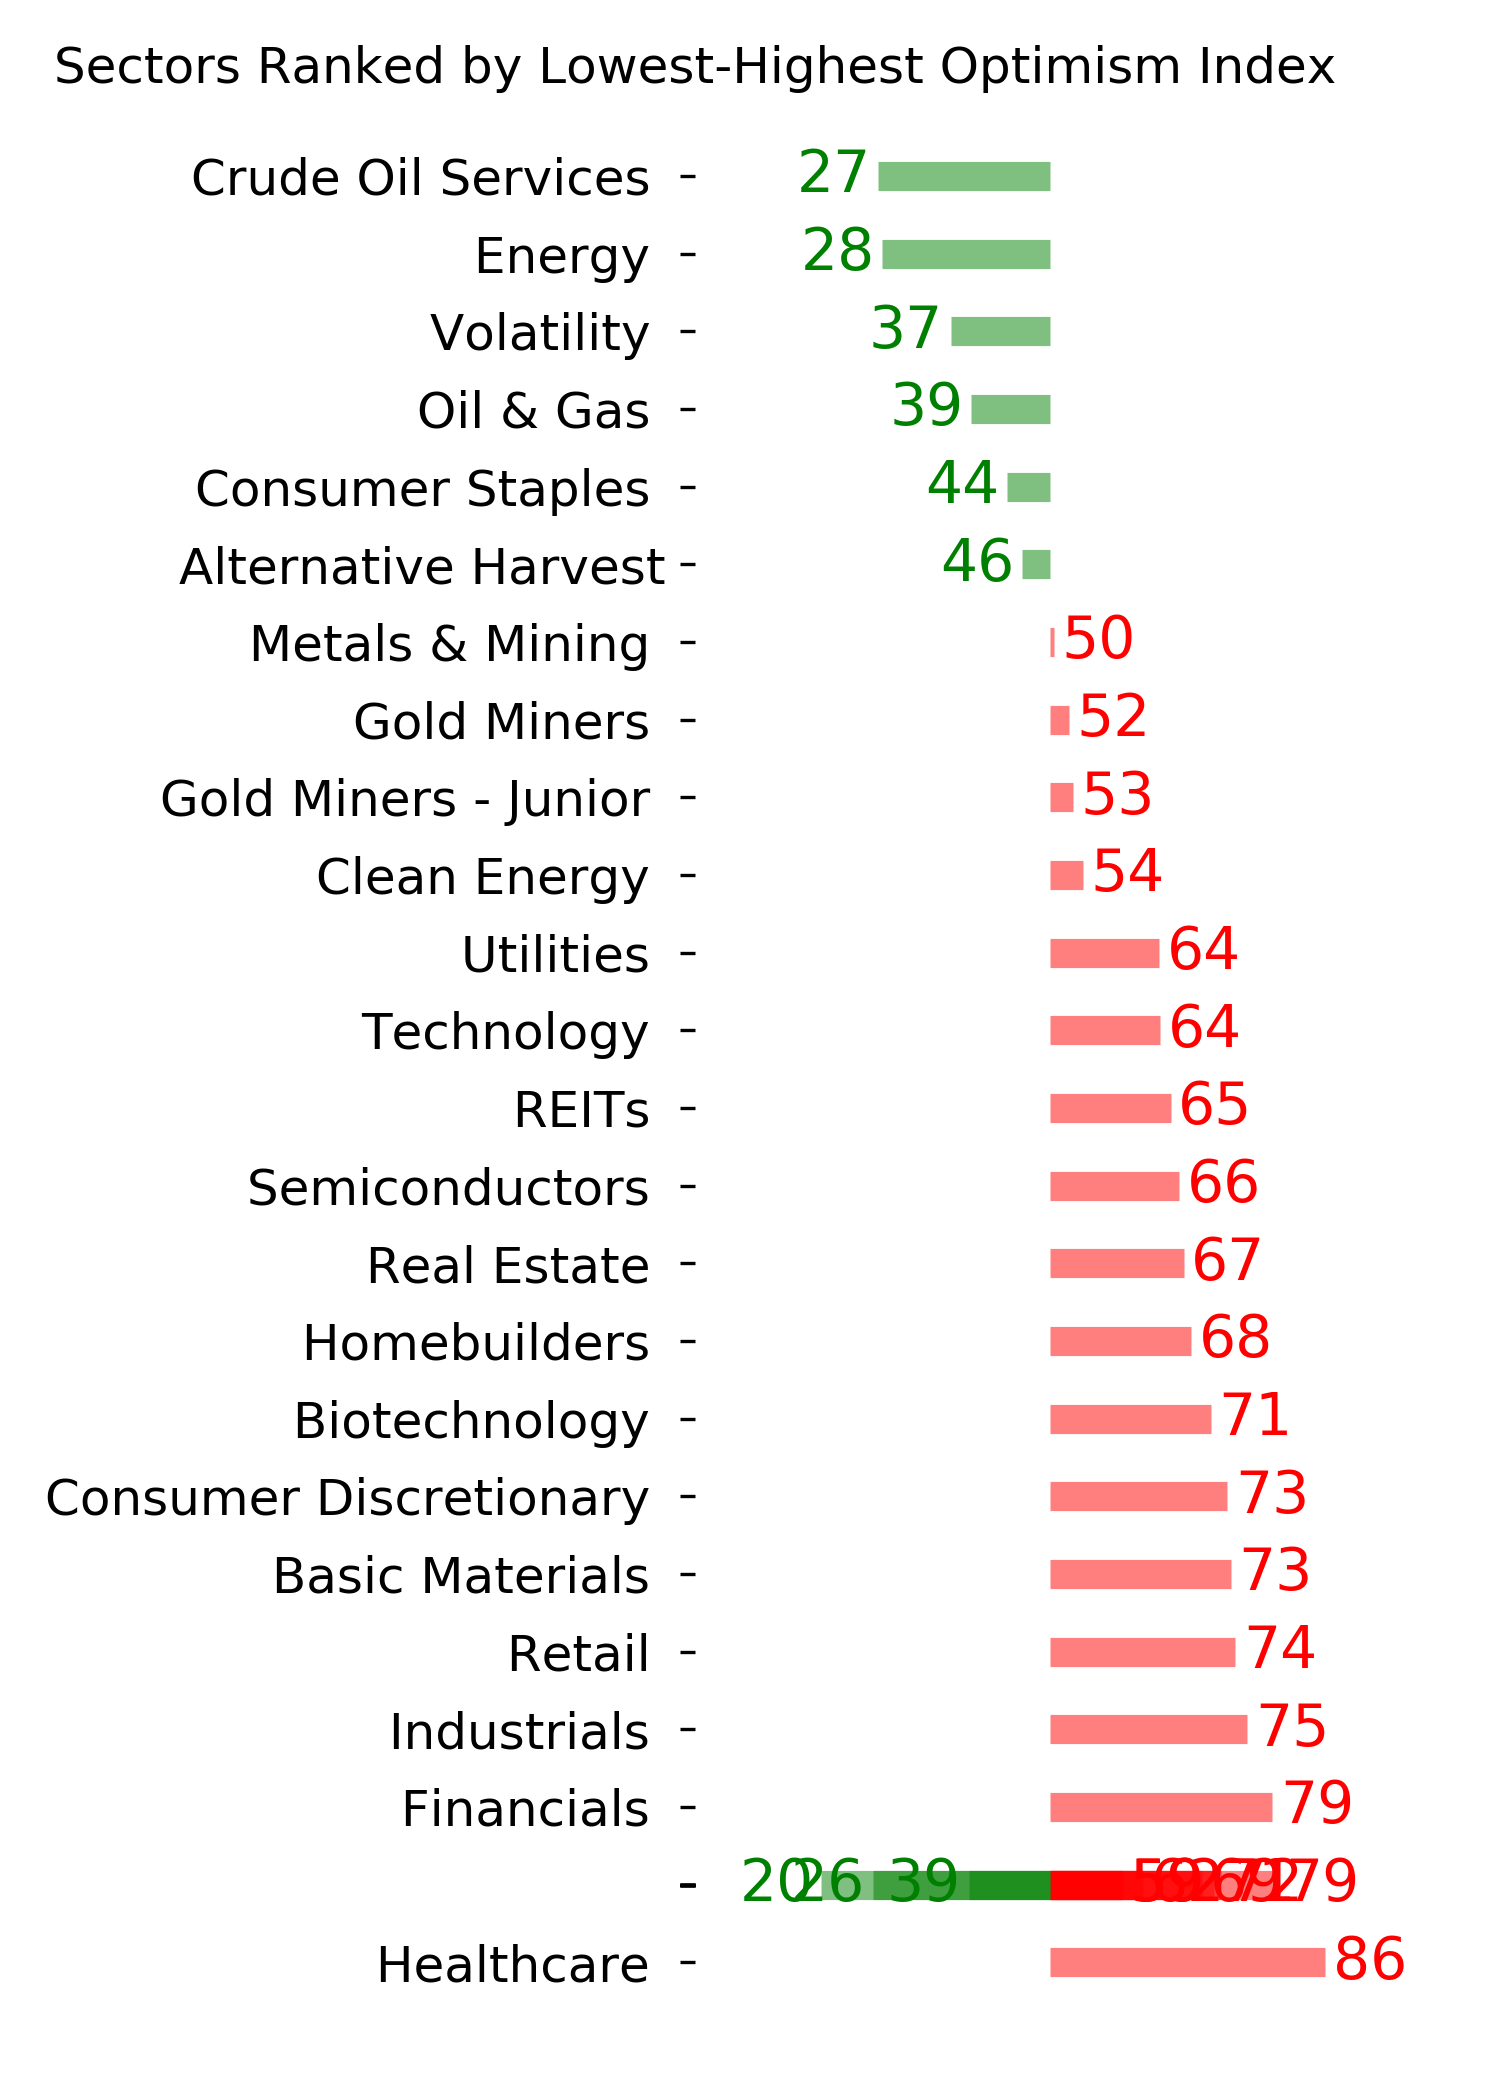
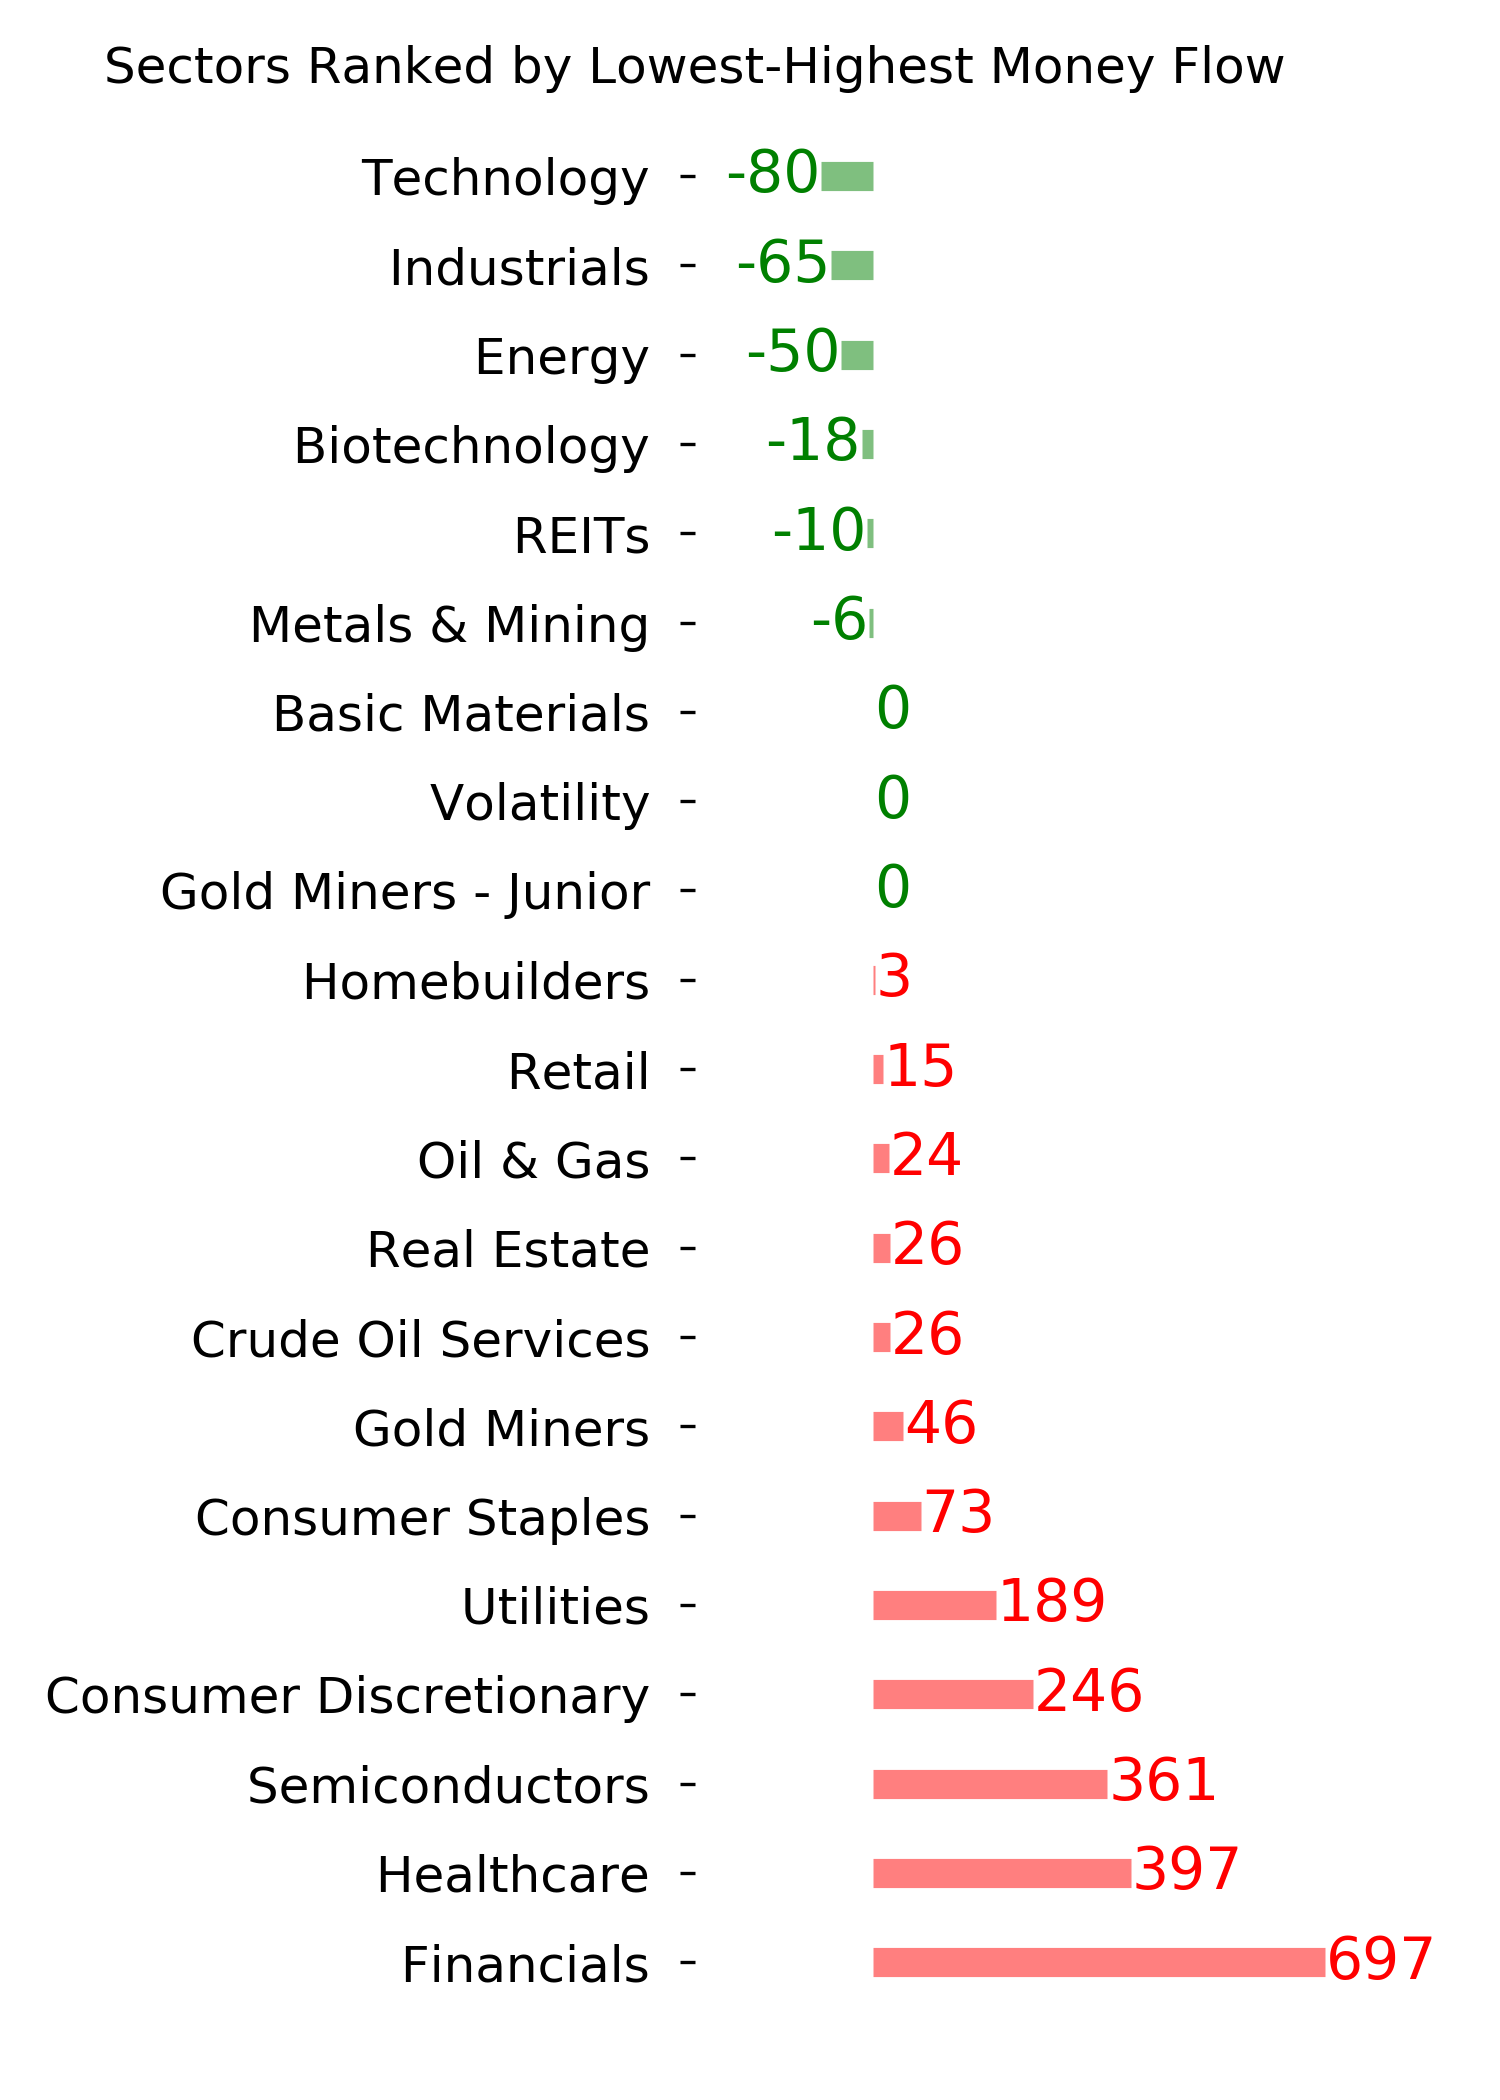
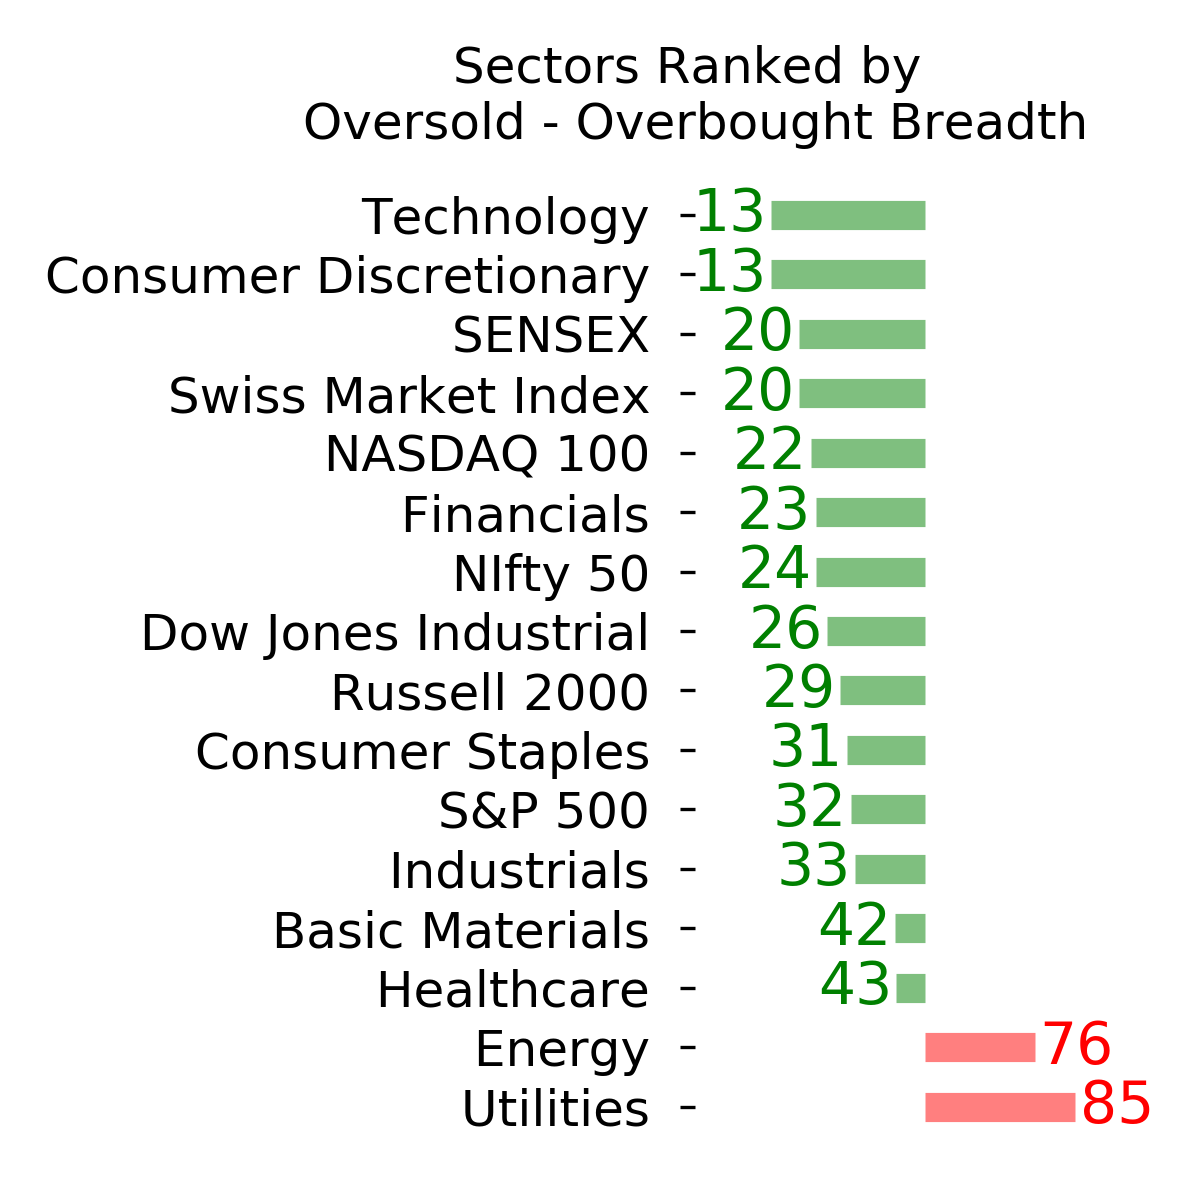
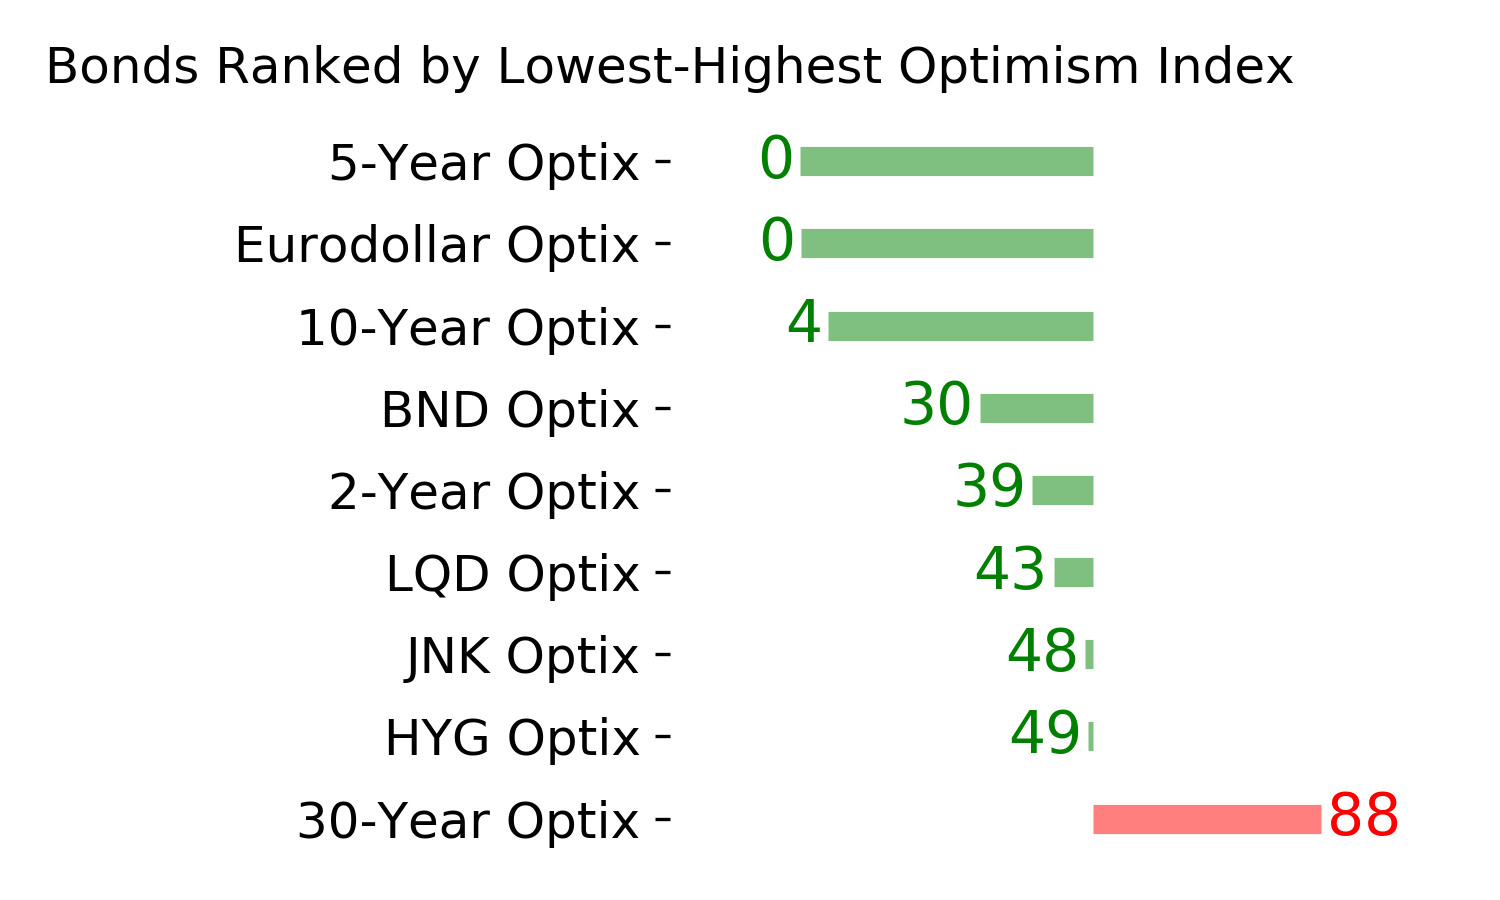
Ranks
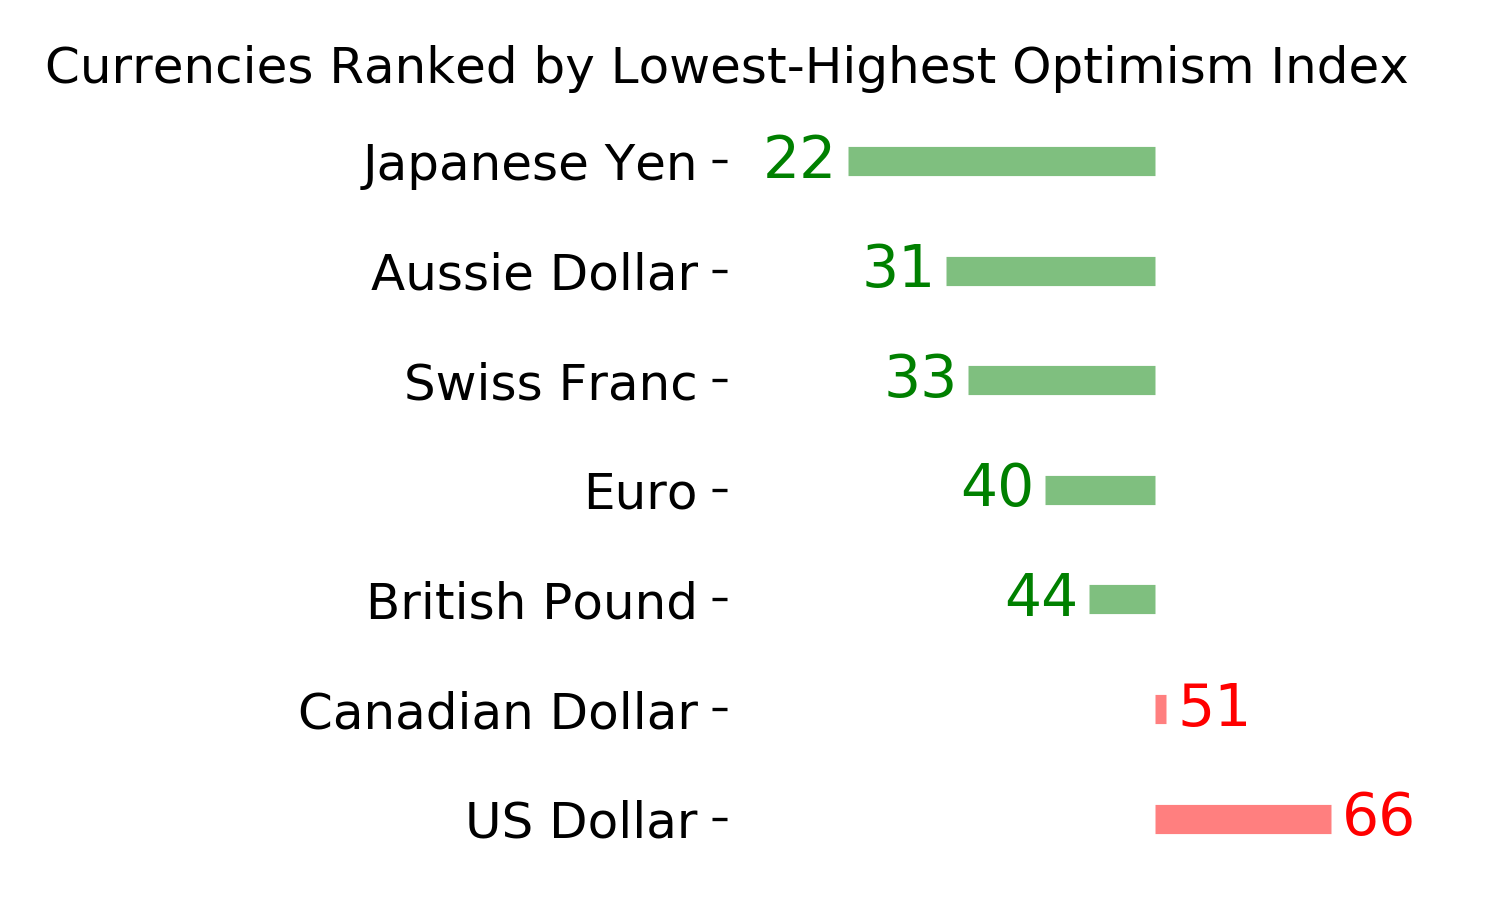
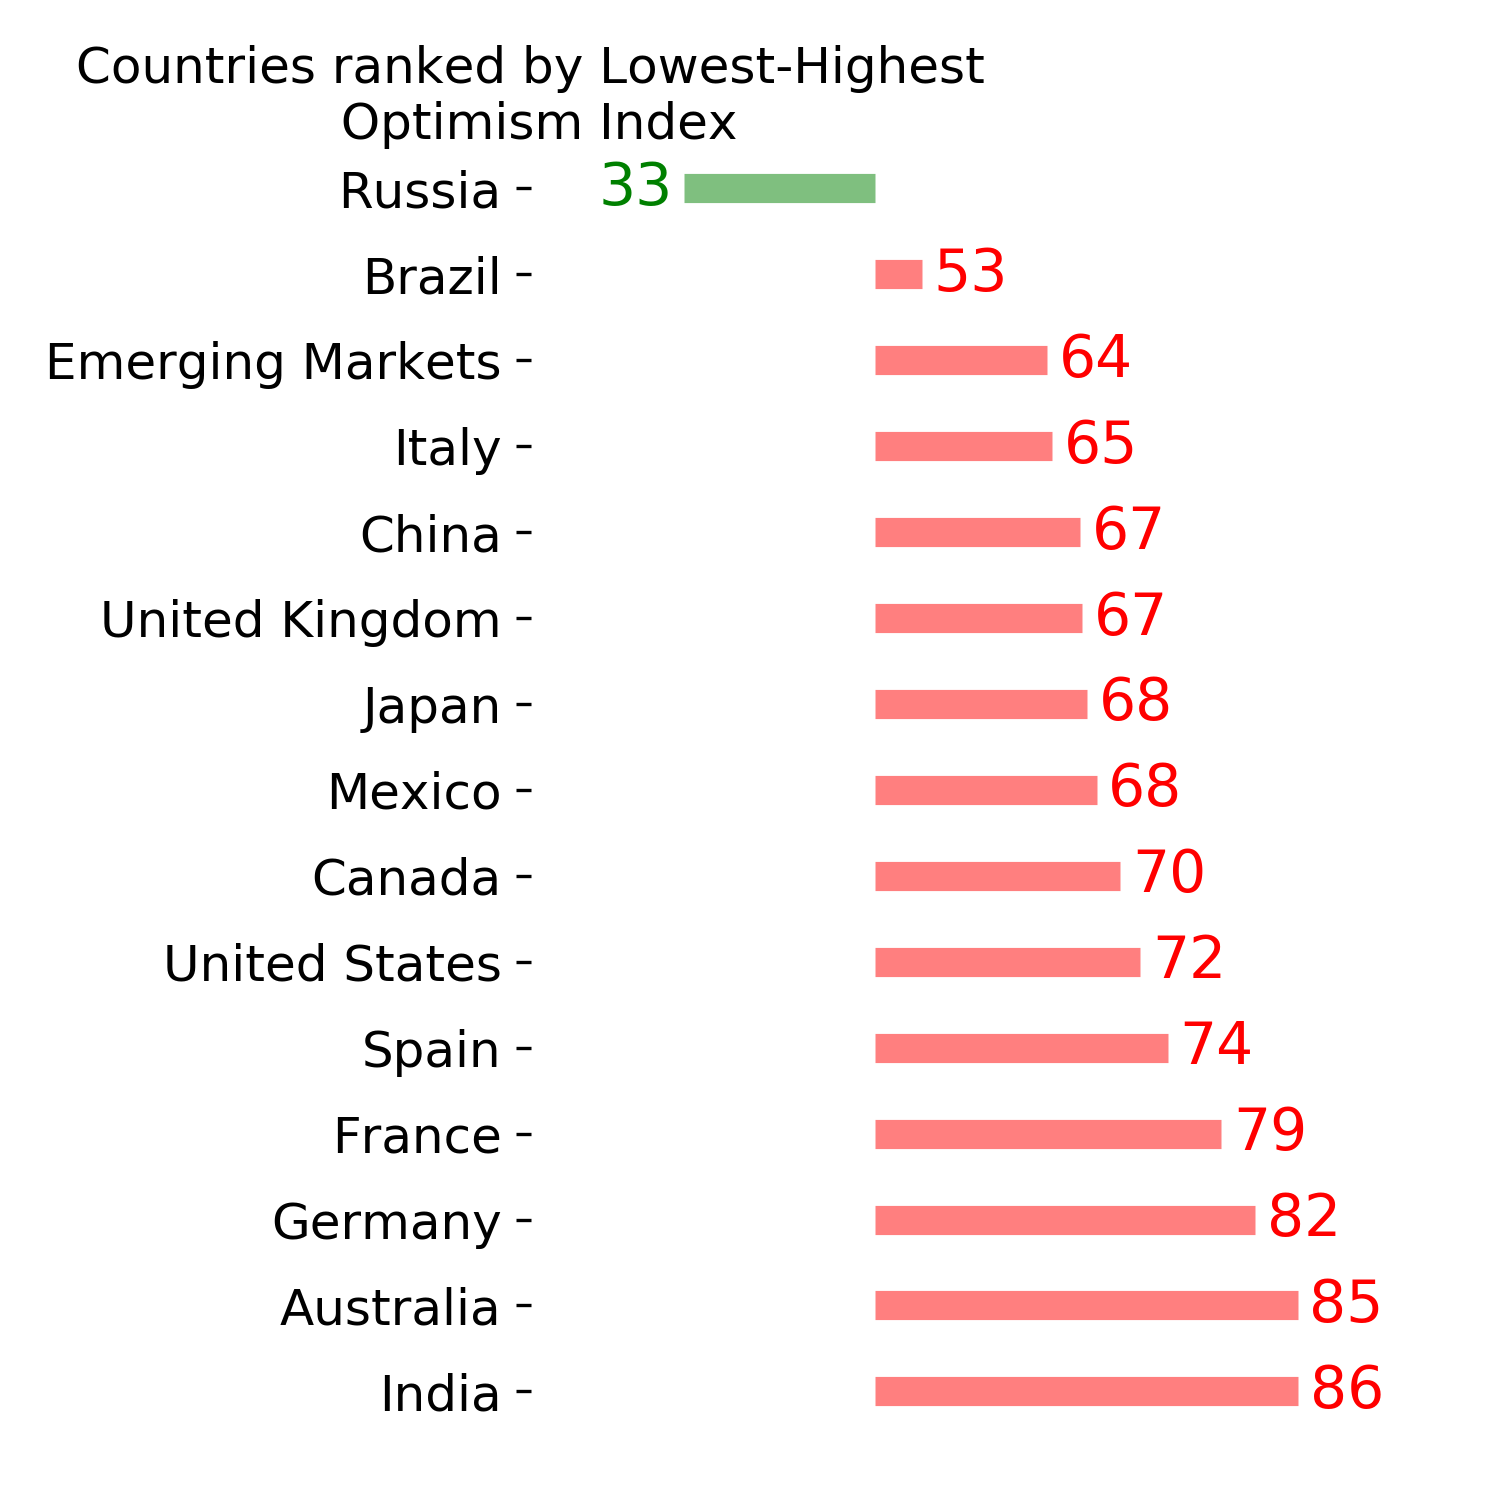
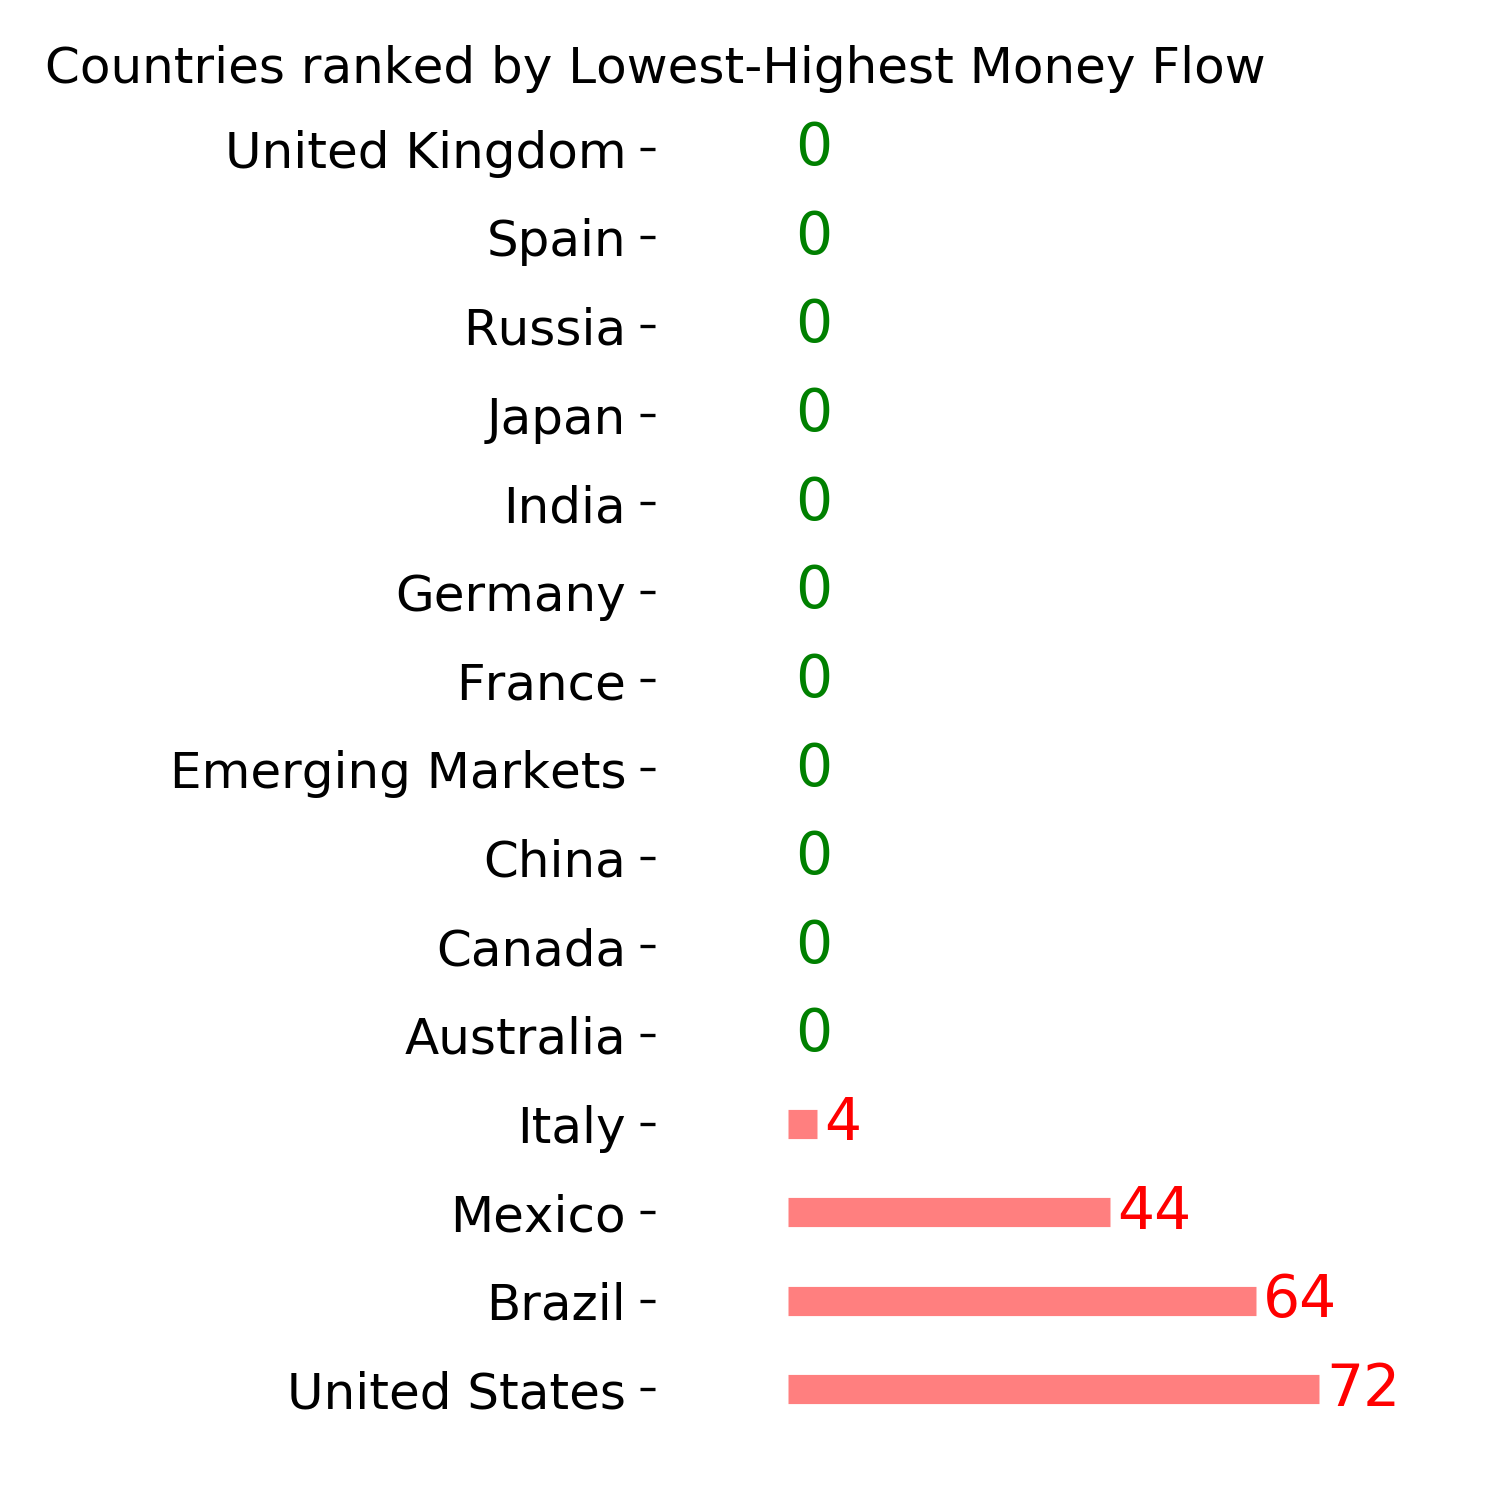
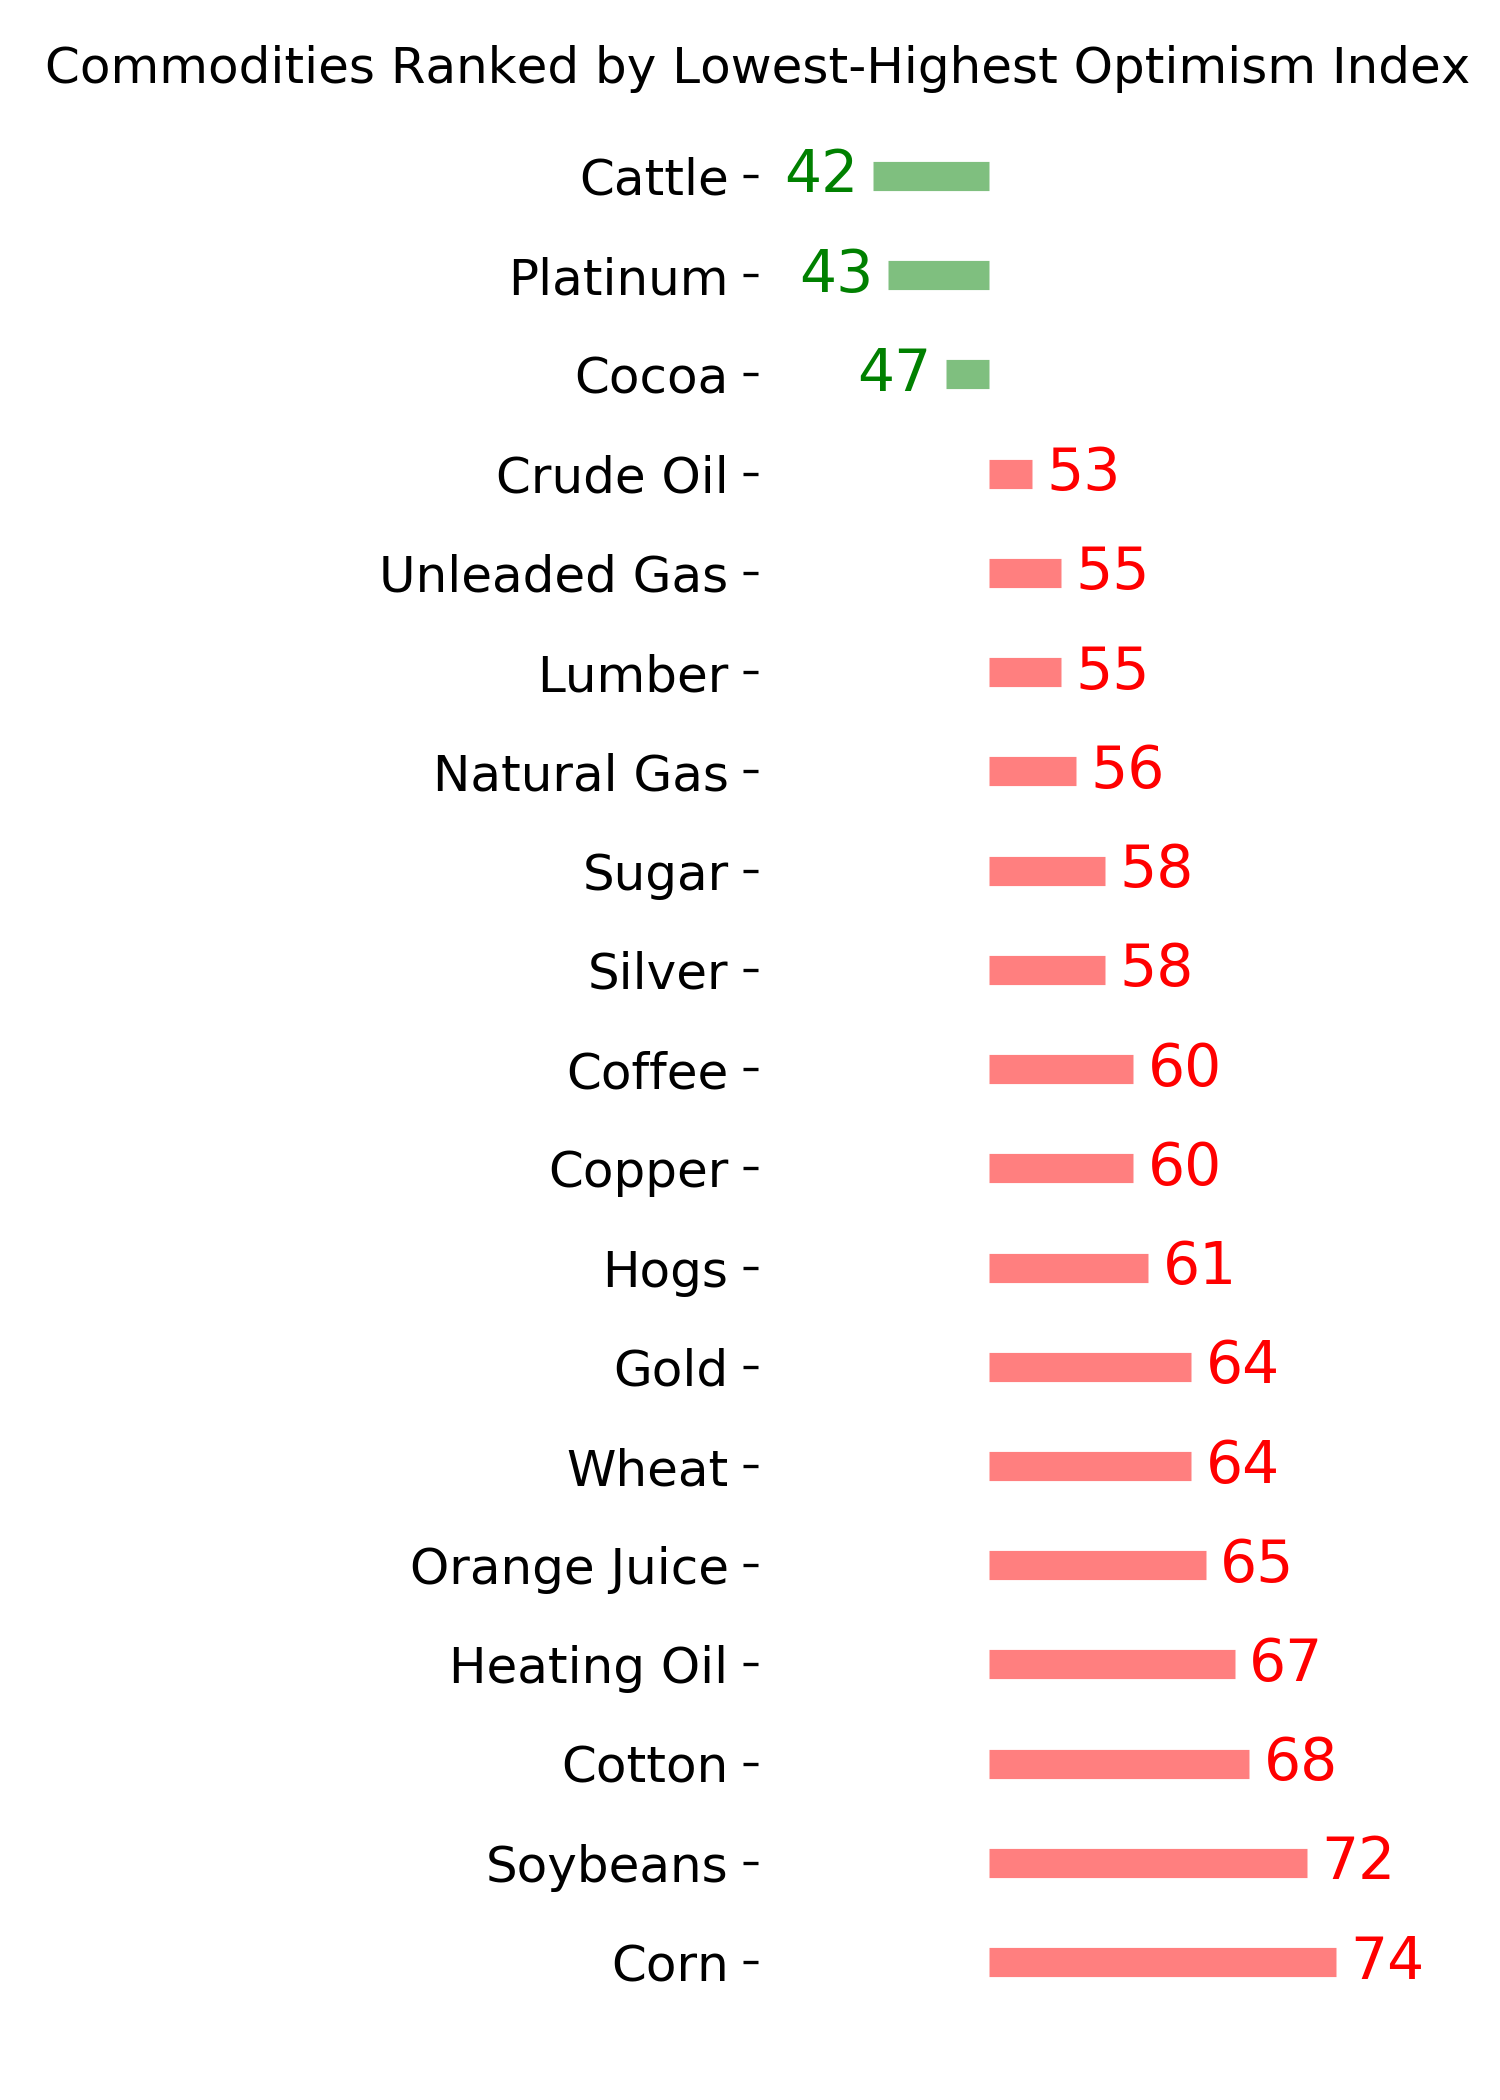
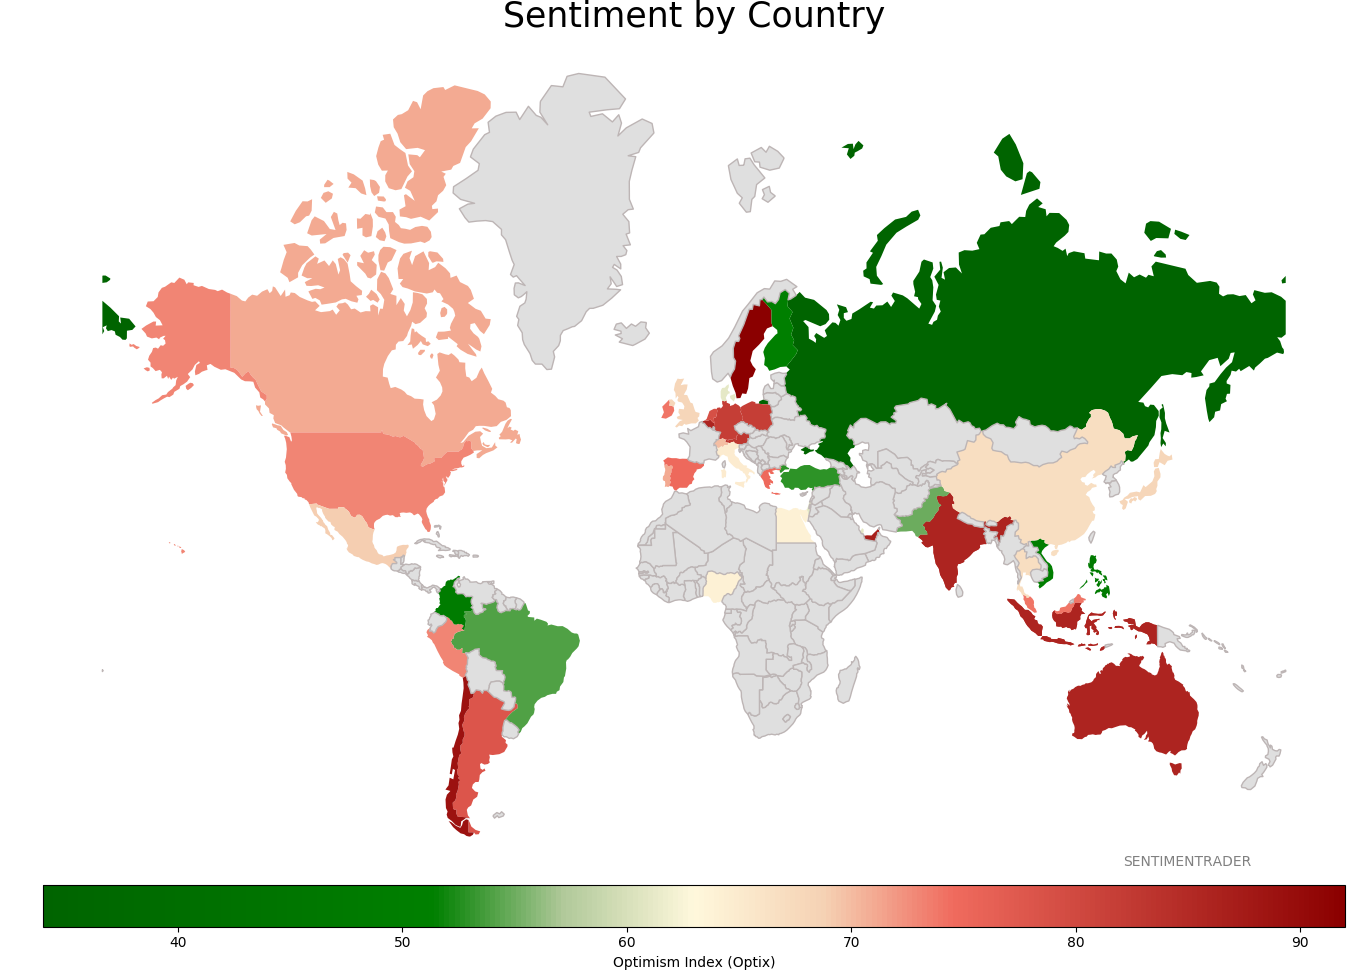
Sentiment Around The World
Optimism Index Thumbnails
|
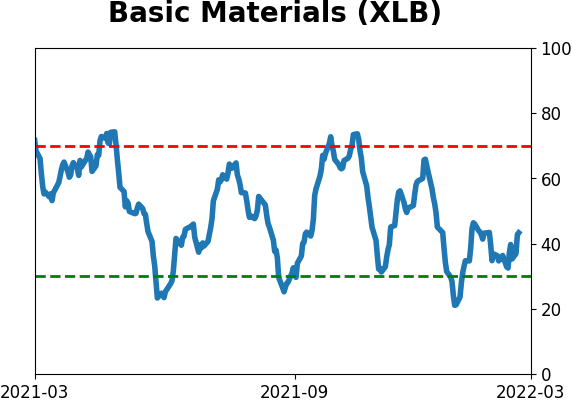
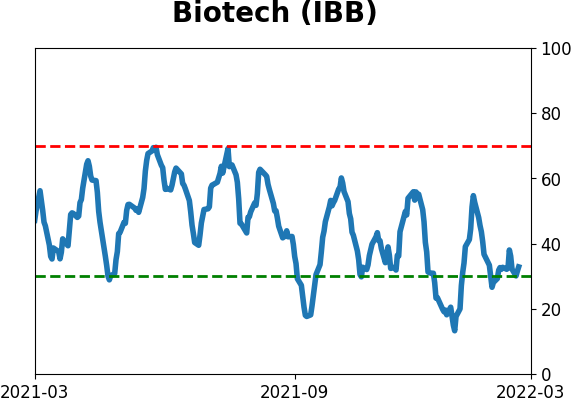
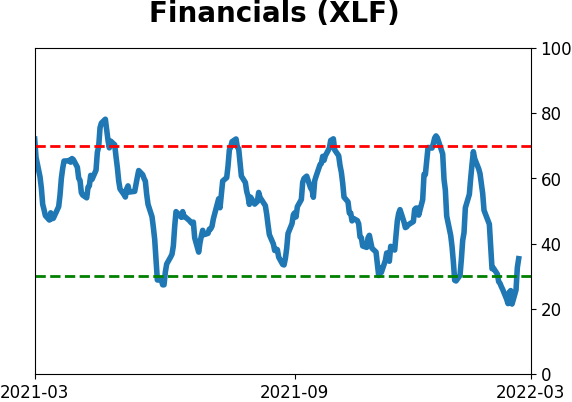
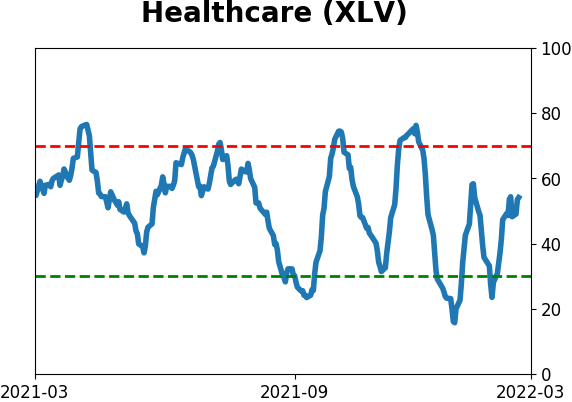
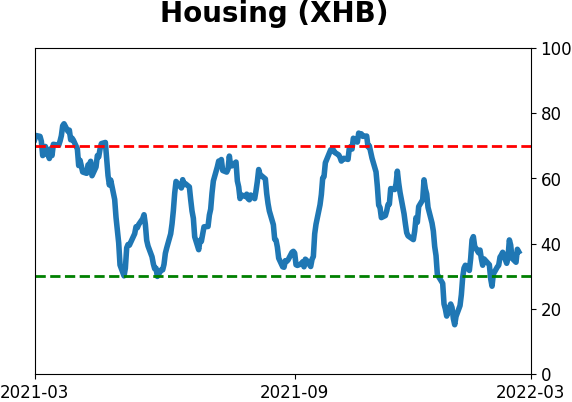
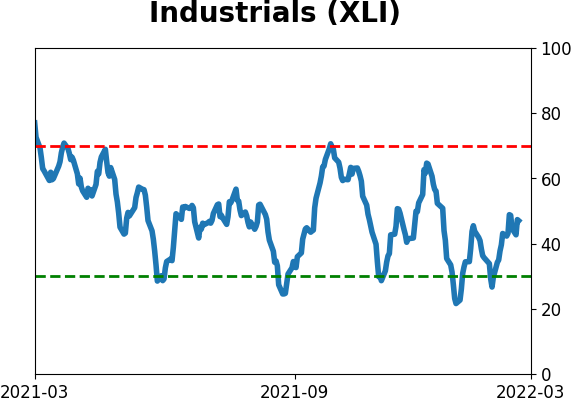
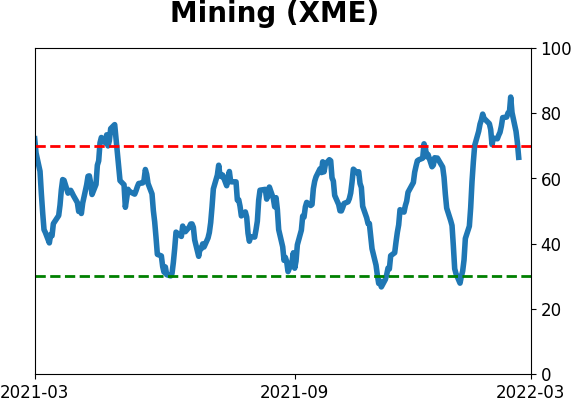
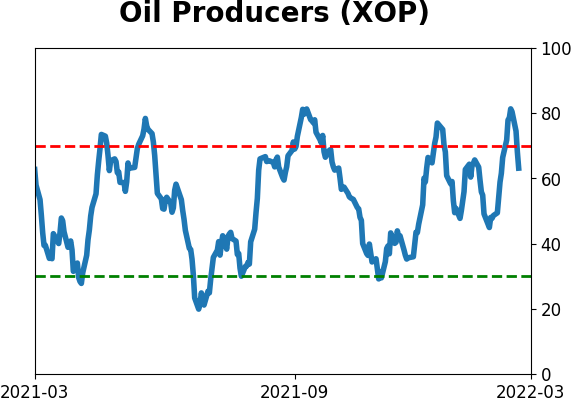
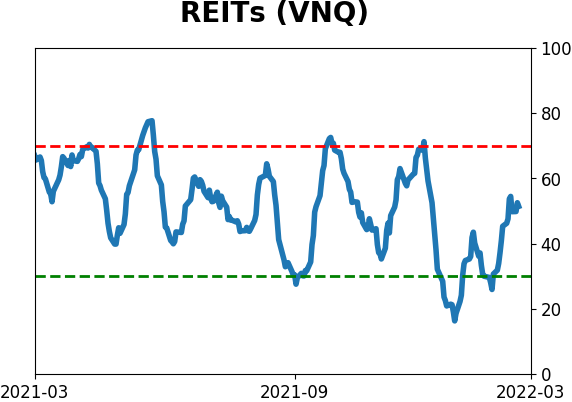
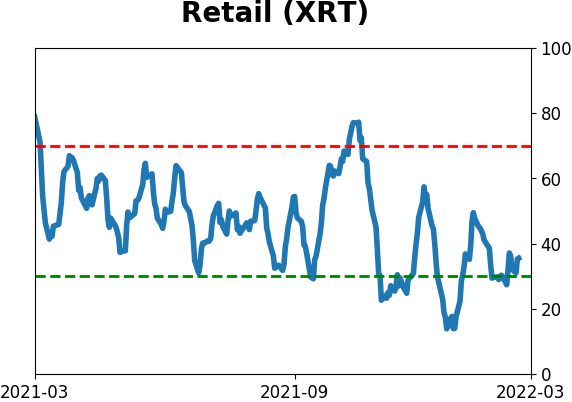
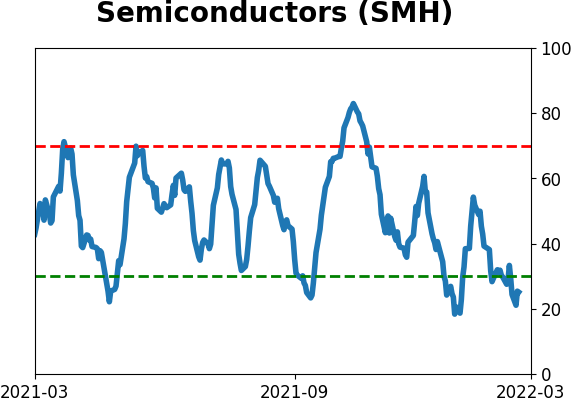
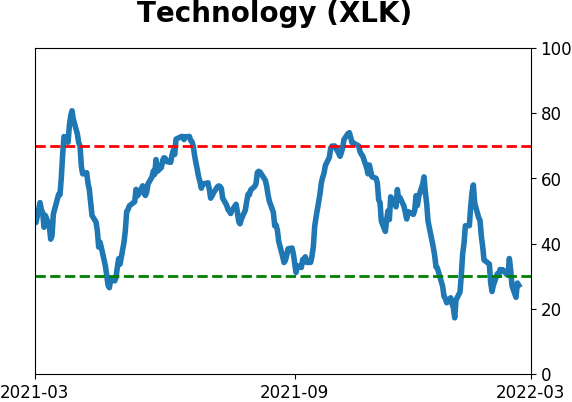
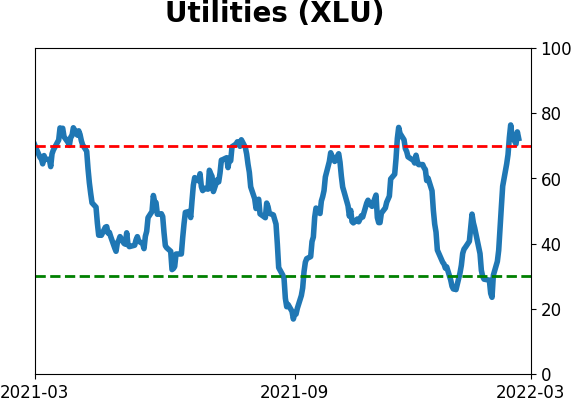
Sector ETF's - 10-Day Moving Average
|
|
|
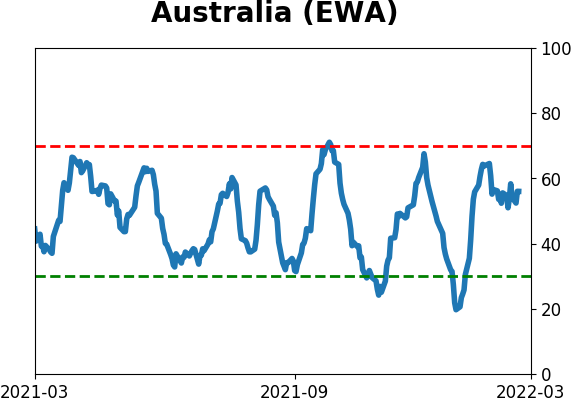
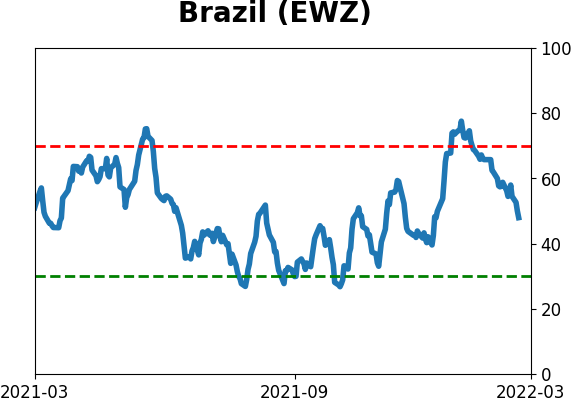
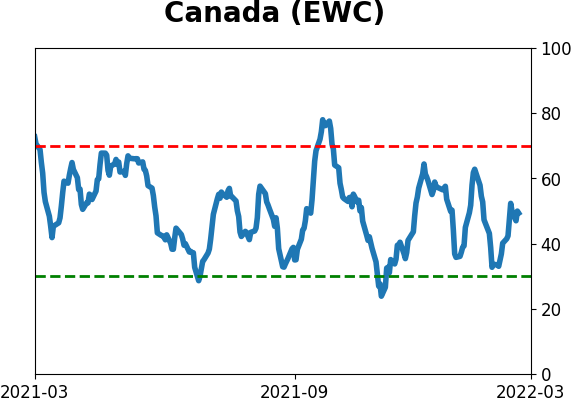
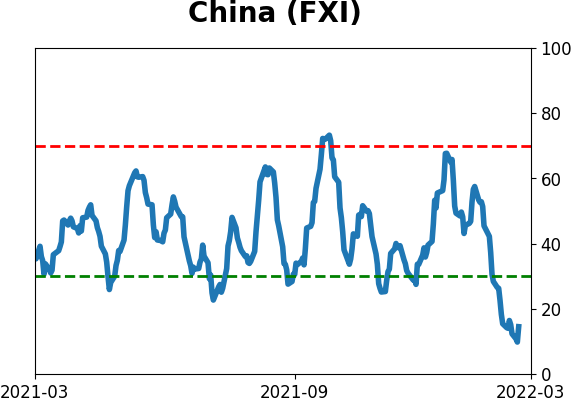
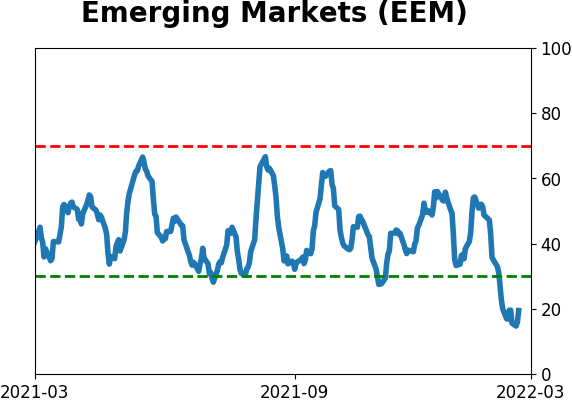
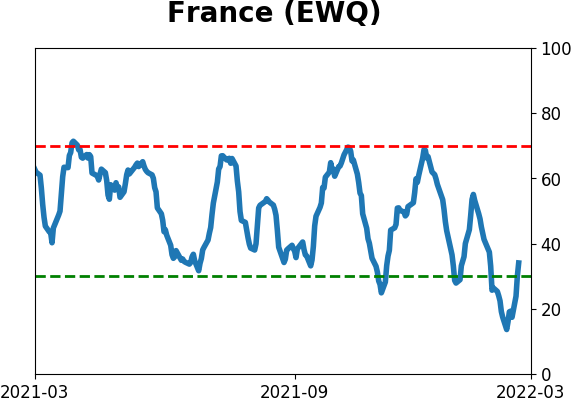
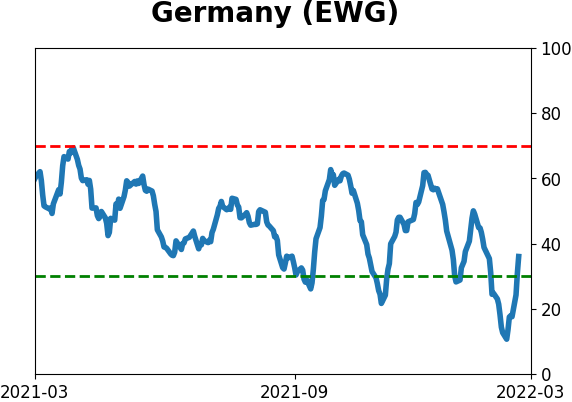
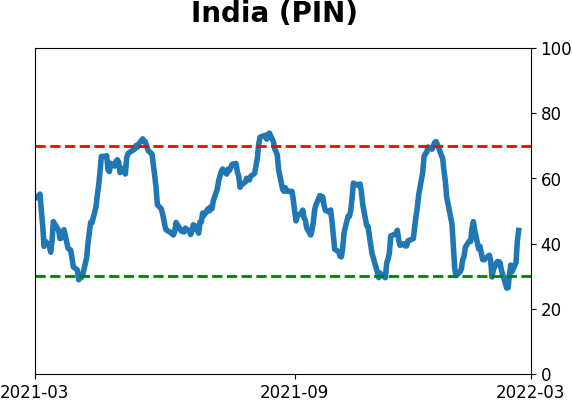
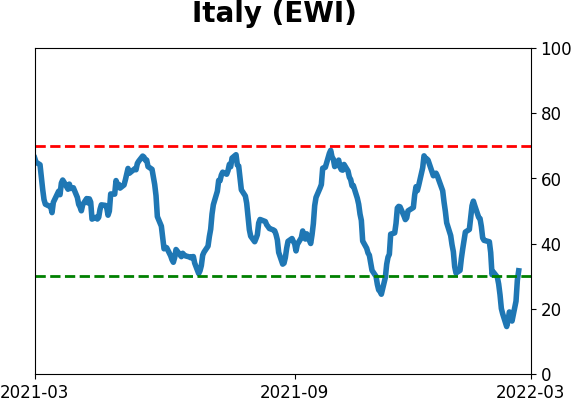
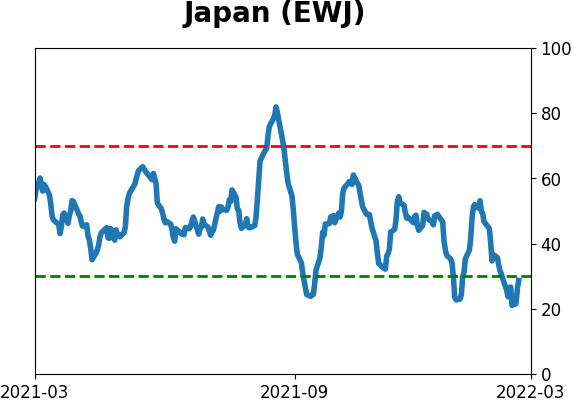
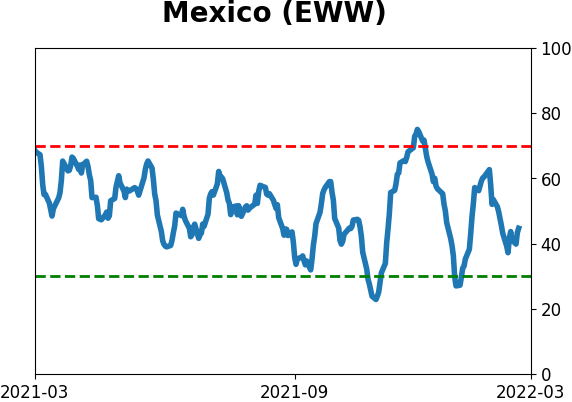
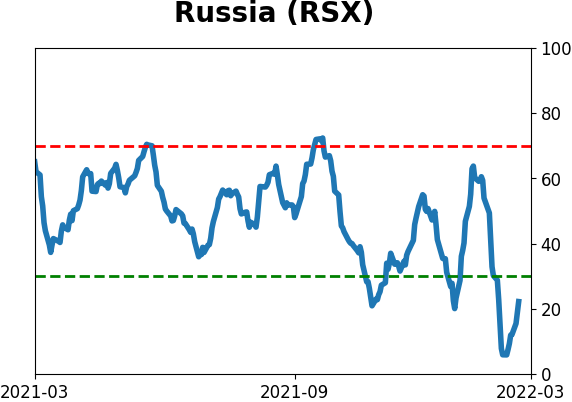
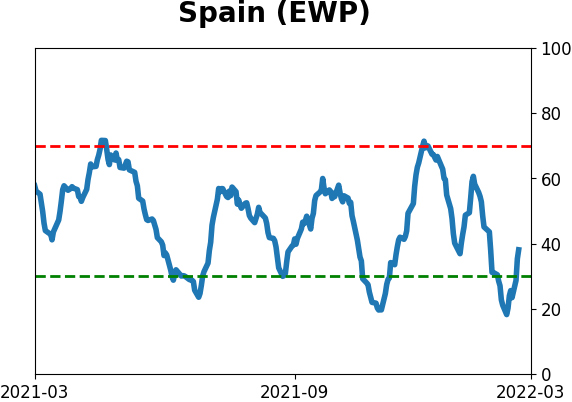
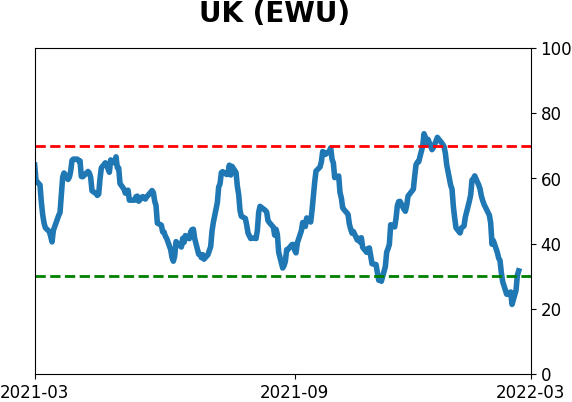
Country ETF's - 10-Day Moving Average
|
|
|
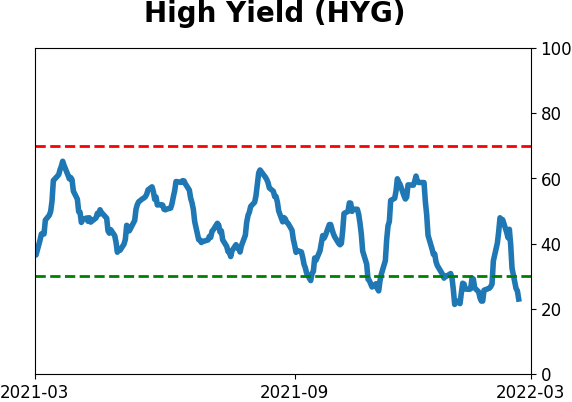
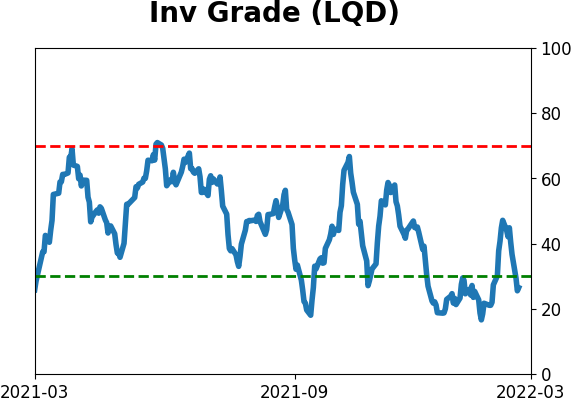
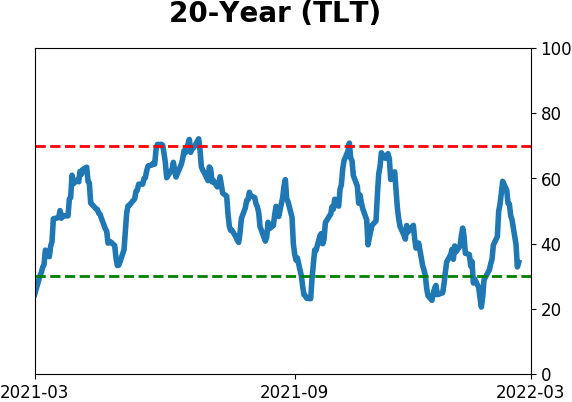
Bond ETF's - 10-Day Moving Average
|
|
|
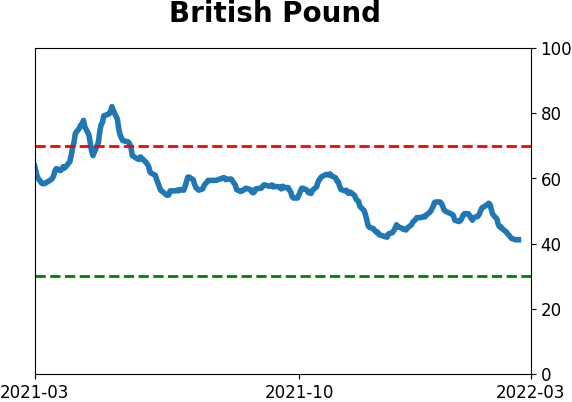
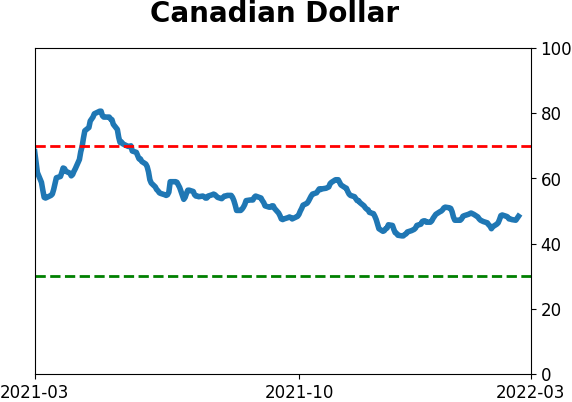
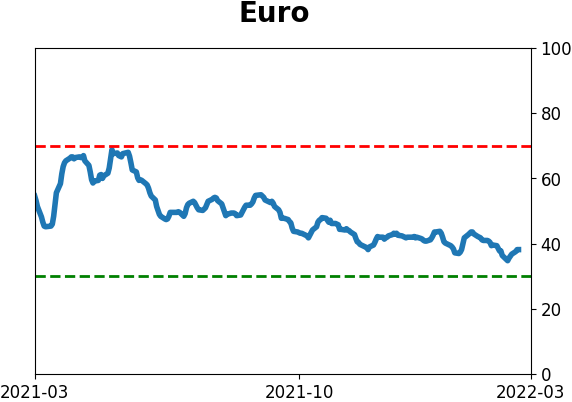
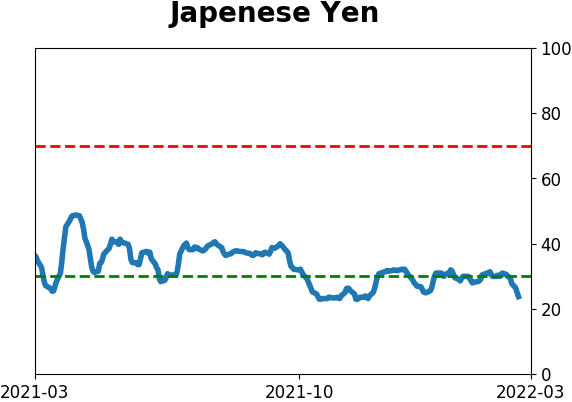
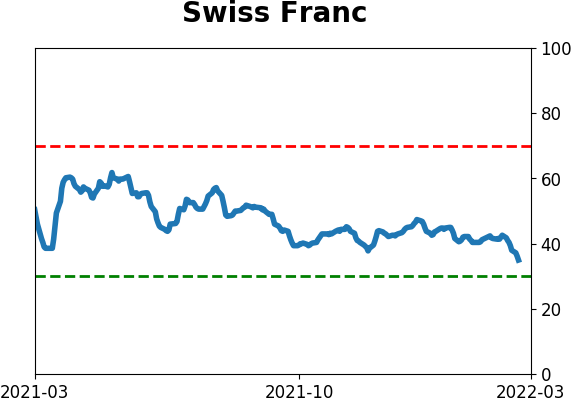
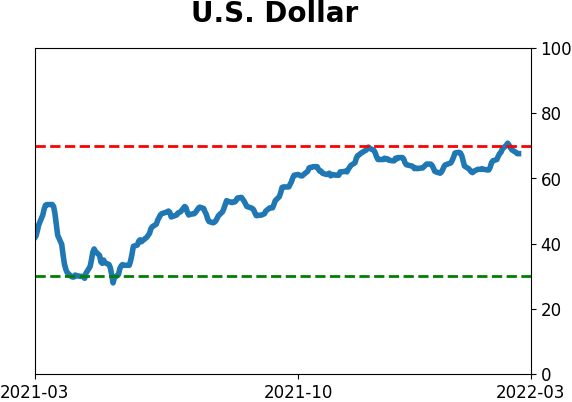
Currency ETF's - 5-Day Moving Average
|
|
|
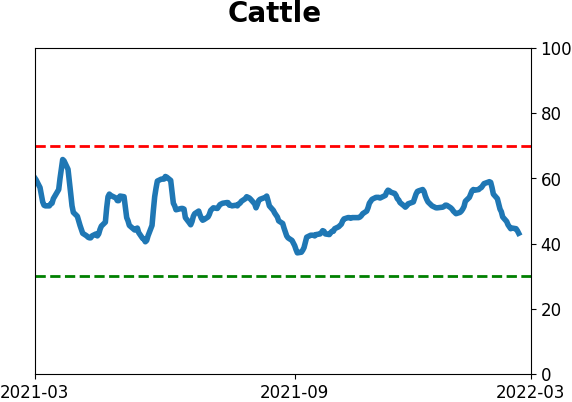
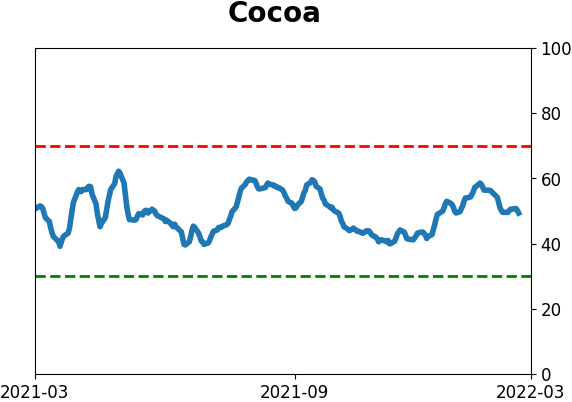
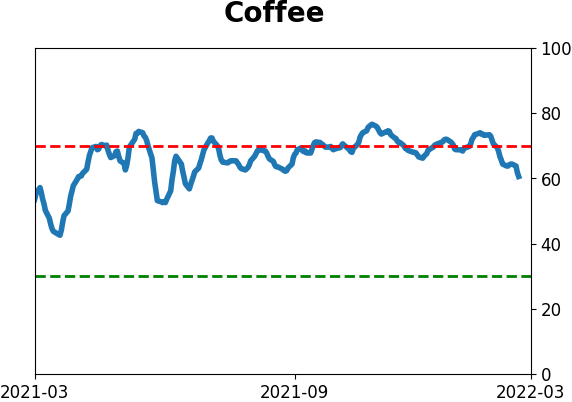
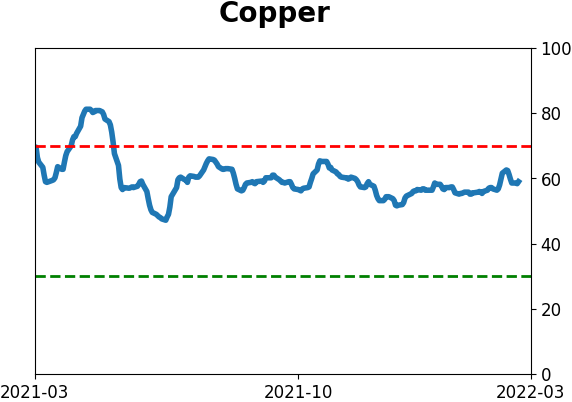
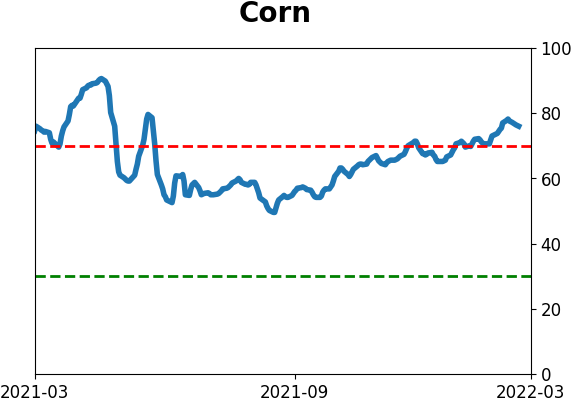
Commodity ETF's - 5-Day Moving Average
|
|