Daily Report : TradingEdge Weekly for Mar 15 - Sector thrusts, options bets, bond buying

| View/Print a PDF version of this Report |
Headlines
|
TradingEdge Weekly for Mar 15 - Sector thrusts, options bets, bond buying: This week, we saw that most S&P 500 stocks are now within 5% of their 52-week highs, giving a broader buy signal. Options traders are betting on it. Under the surface, there are some issues in semis and the Nikkei. Health care, energy, and basic materials stocks have been doing very well. Bonds have been doing well, too. |
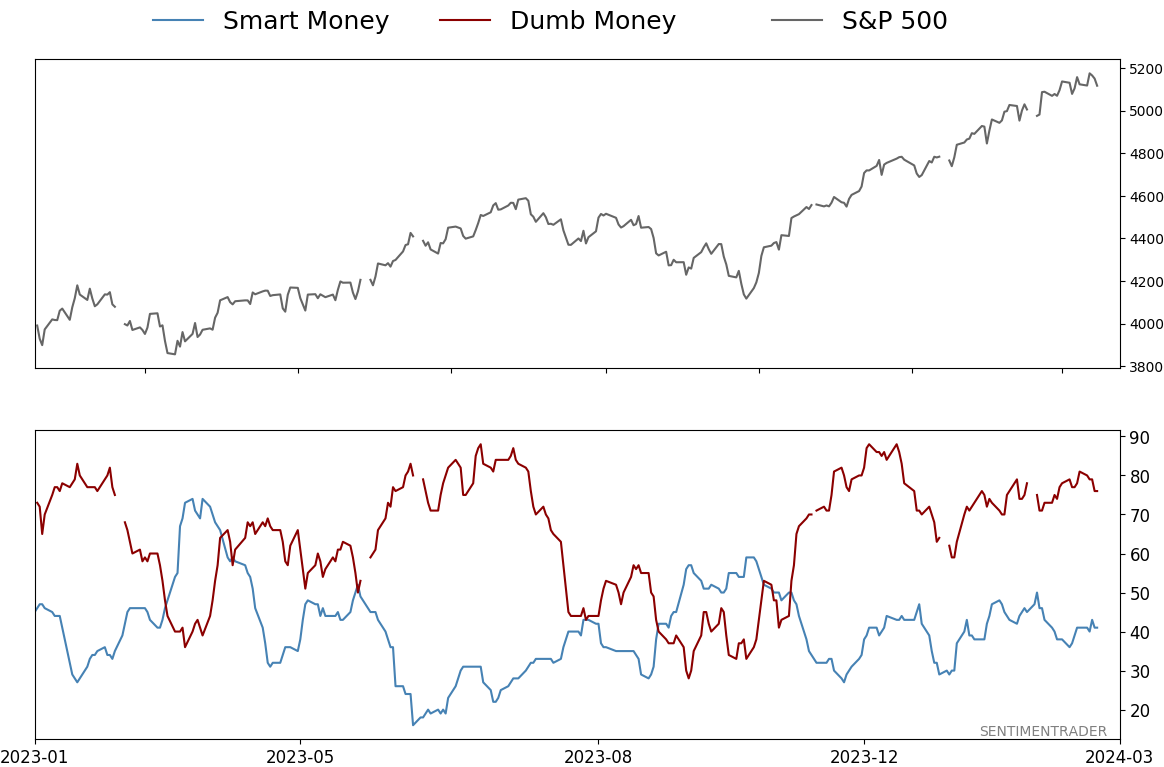
Smart / Dumb Money Confidence
|
|
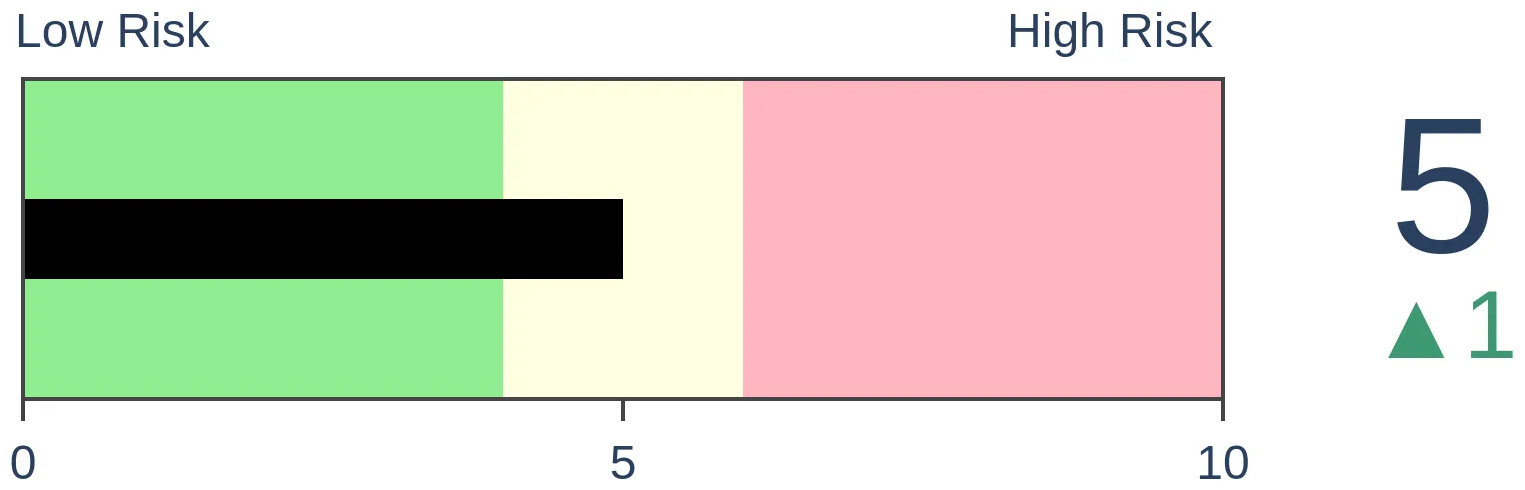
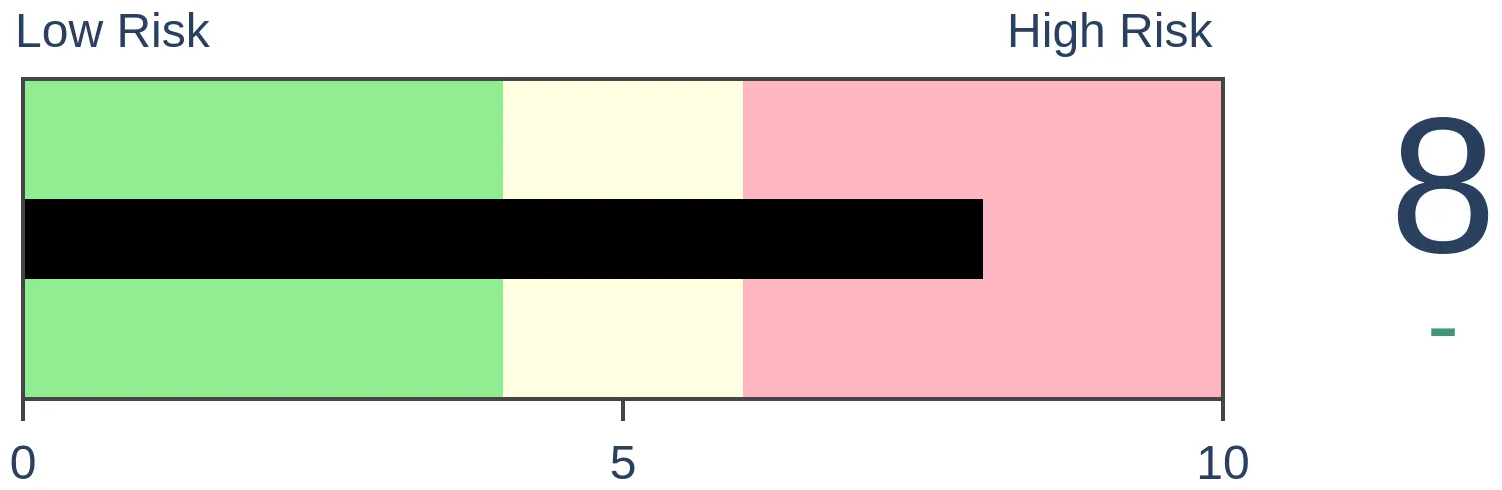
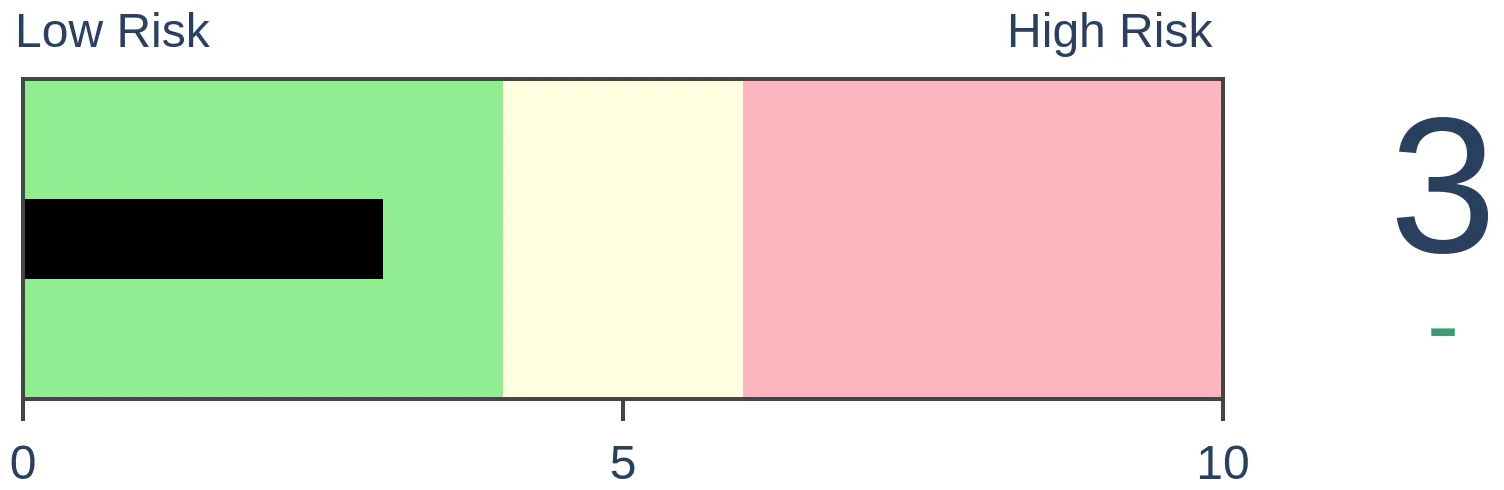
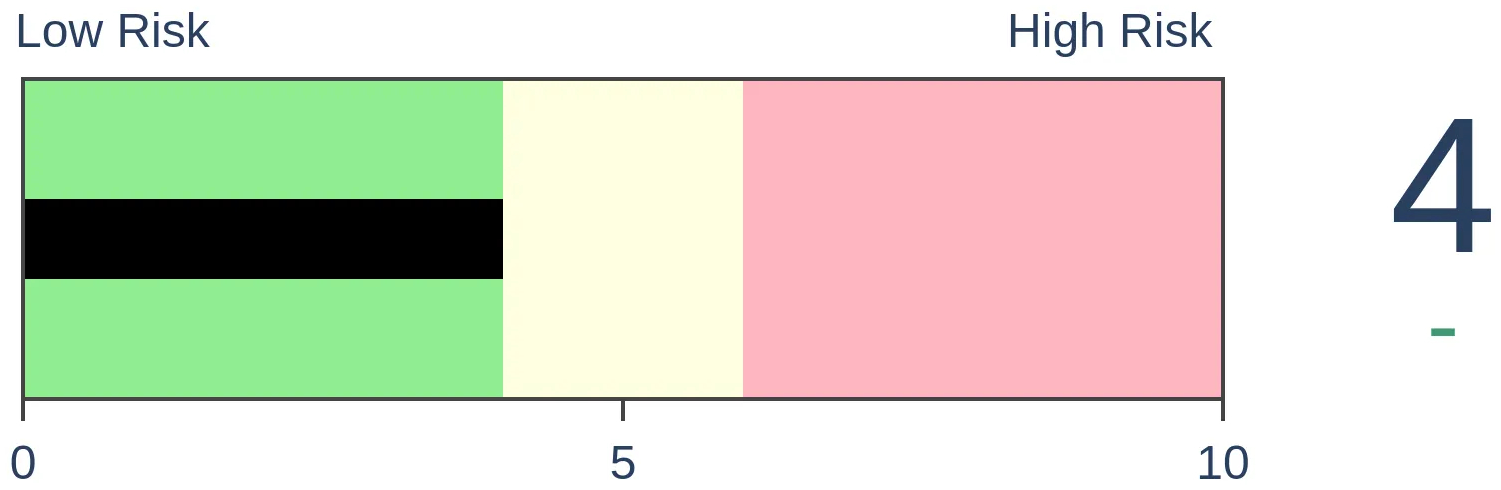
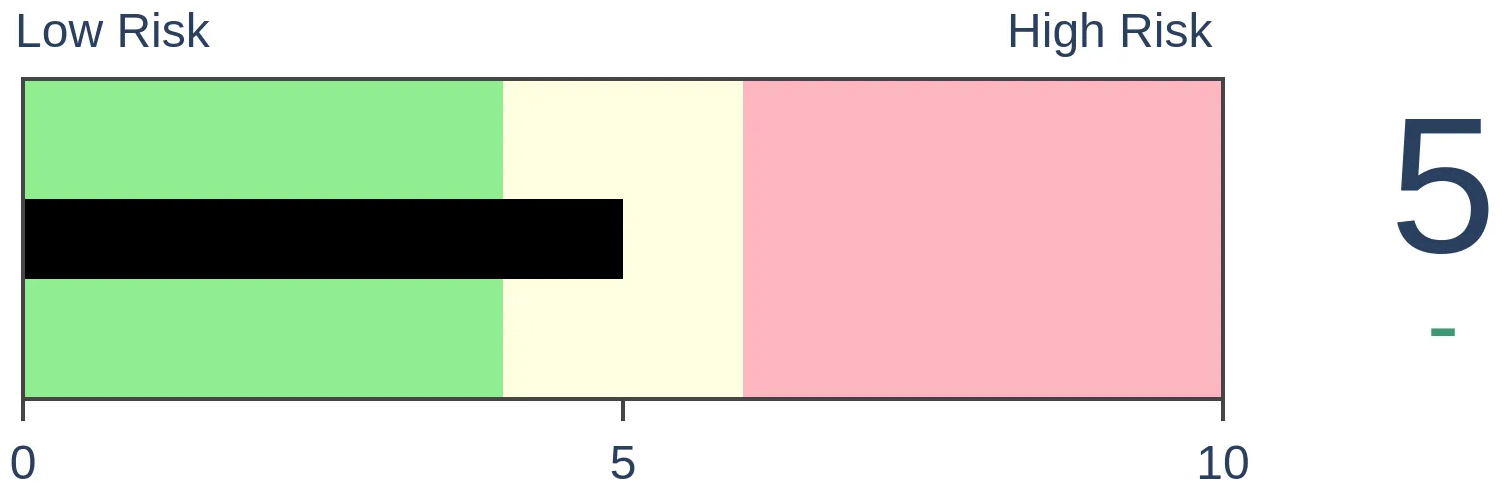
Risk Levels
|
|
|

Research
TradingEdge Weekly for Mar 15 - Sector thrusts, options bets, bond buyingBy Jason GoepfertBOTTOM LINEThis week, we saw that most S&P 500 stocks are now within 5% of their 52-week highs, giving a broader buy signal. Options traders are betting on it. Under the surface, there are some issues in semis and the Nikkei. Health care, energy, and basic materials stocks have been doing very well. Bonds have been doing well, too. FORECAST / TIMEFRAME |
Key points:
- Most S&P 500 stocks are no longer in pullbacks
- Options traders are betting heavily that the rally will continue
- The Nikkei has been doing well but some of the stocks are lagging
- A time to look at emerging markets
- There were major reversals in a couple of new bellwether stocks
- Health care stocks are looking healthier
- There has been a thrust in energy stocks
- Basic materials stocks have seen a surge but typically don't react well to high momentum
- Treasury bonds are trying to form a new long-term uptrend
- A breadth thrust signal in investment-grade bonds
Most stocks are now close to new highs
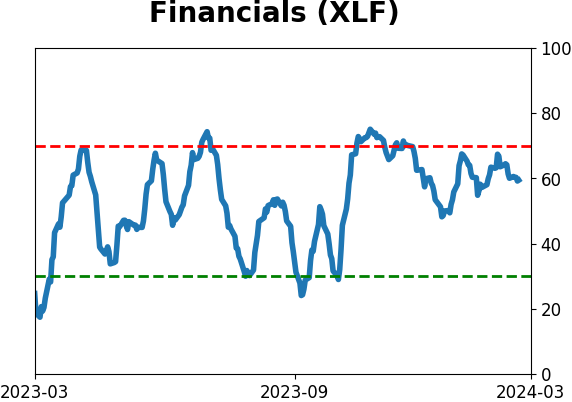
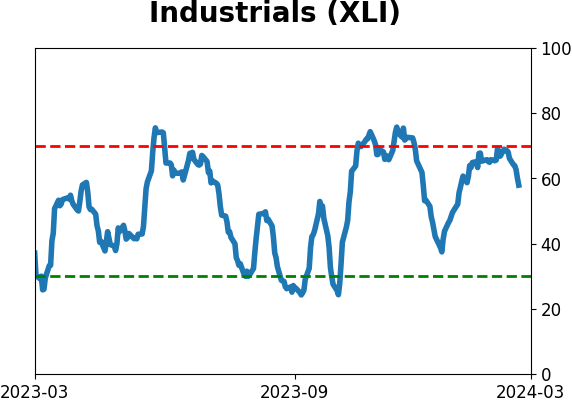
A majority of S&P 500 stocks closed within 5% of their 252-day highs. Dean showed that similar long-term trend conditions preceded a 100% win rate over the subsequent month. Financials, Industrials, Materials, and Consumer Discretionary stocks maintain the highest readings.
The indicator gauges the proportion of S&P 500 stocks trading within 5% of their 252-day high. A signal triggers when the indicator cycles from less than 10% to greater than 50%.
The previous alert occurred in March 2021, resulting in a 14% gain over six months.
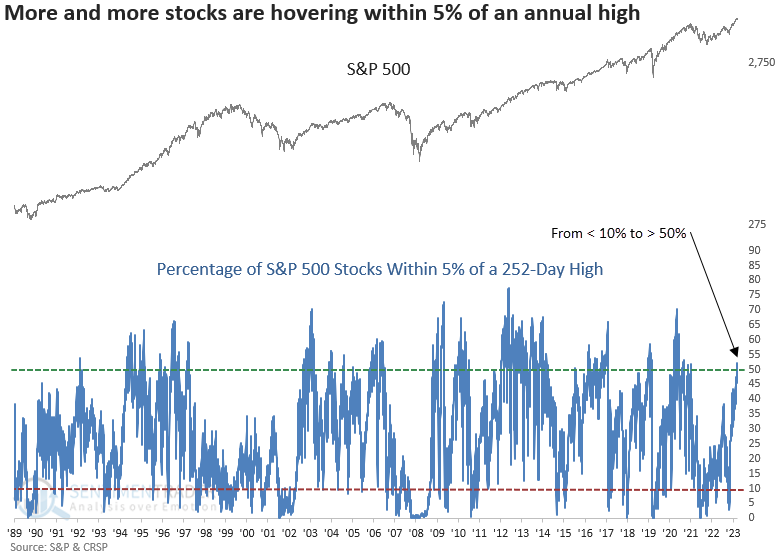
Whenever the percentage of S&P 500 stocks trading within 5% of their respective 252-day high shifted from under 10% to over 50%, in tandem with the index reaching an all-time high, the world's most benchmarked index exhibited outstanding returns and win rates across all time horizons. Despite the worrisome signals in 1987 and 2019, it's crucial to remember that crash events are exceptionally rare.
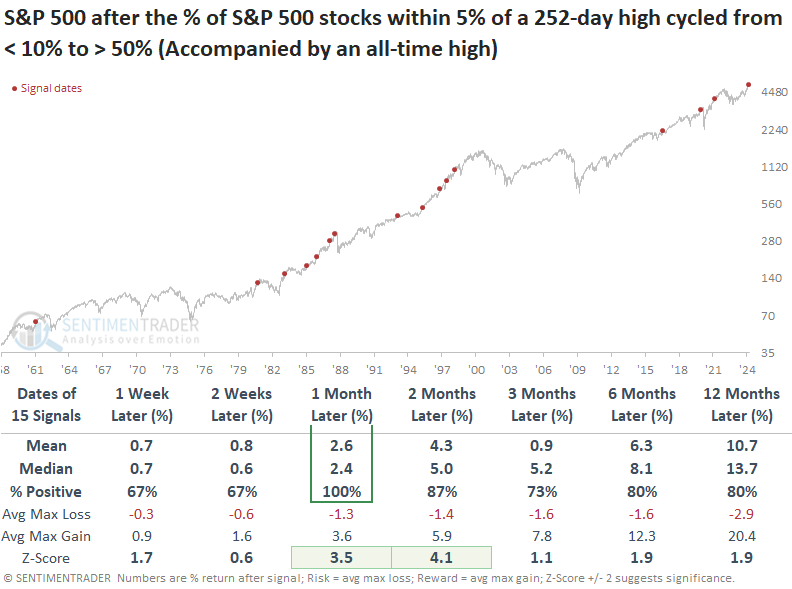
Meaningful drawdowns were conspicuously minimal in the ensuing two months, with no precedent surpassing a maximum loss of -5%.
Small (and large) options traders are betting on that trend to continue
A little over a year ago, small options traders were feeling pessimistic. Well, they're back.
Last week, small options traders spent 46% of their total volume on buying call options to open. Over nearly 25 years of history, the only time this level of speculative activity did not precede at least a pullback is during the options mania from the summer of 2020 through the fall of 2021.
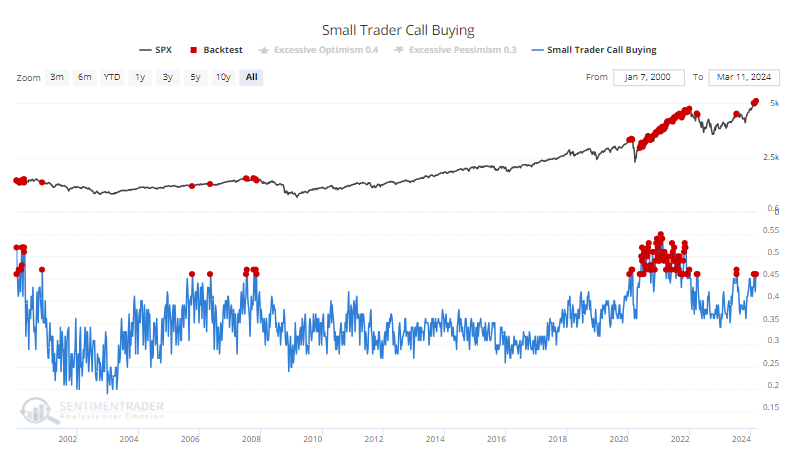
The demand for call options is pushing the premium differential out of whack. The amount that small traders spent buying put options relative to call options has melted to the lowest in more than two years. As of last week, small traders paid only $35 in premiums on puts for every $100 spent on calls.
What's even more notable about last week's activity is that it wasn't just the smallest of traders snapping up speculative call options. The largest traders did so, too. They spent more than 40% of their volume on buying call options to open, one of the highest levels since 2000.
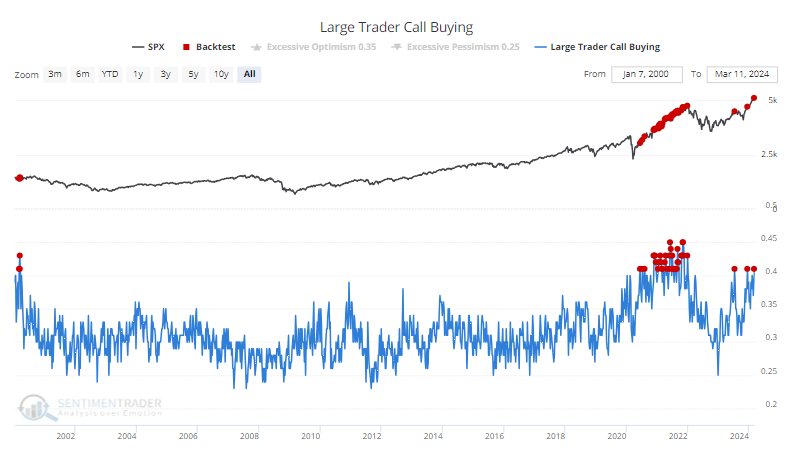
If we combine all of the options indicators to find every week when all of them were this extreme simultaneously, only a handful of dates popped up, all in 2020-21 or 2000. Bulls have to hope we're back in a mania-infused rally that can self-perpetuate.
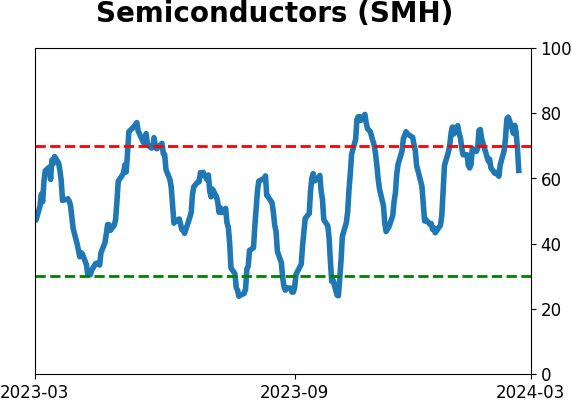
The Nikkei has been doing well, but participation is questionable
One of the most celebrated breakouts, among many this year, is the Nikkei 225. It's a bit curious that not as many stocks are participating in the advance as bulls might hope.
When the Nikkei pushed to a 52-week high late in 2021, fewer stocks within the index were trading above their long-term 200-day moving averages than earlier in the year. That divergence was a successful warning that something odd was afoot. This time, the breakout has been much more persistent, but we're still not seeing as many stocks in uptrends as earlier in 2023.
Even more oddly, during this run over the past thirty days, the McClellan Oscillator hasn't poked above +50 even once. Not even close. This is highly atypical for a move like the Nikkei has enjoyed over the past month+.
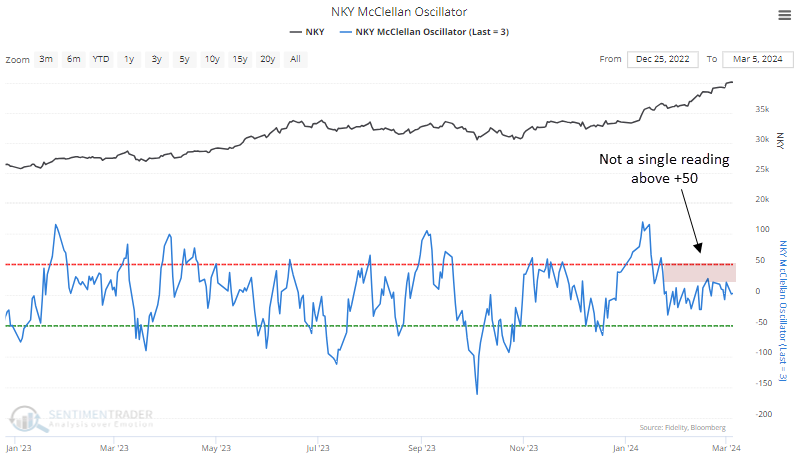
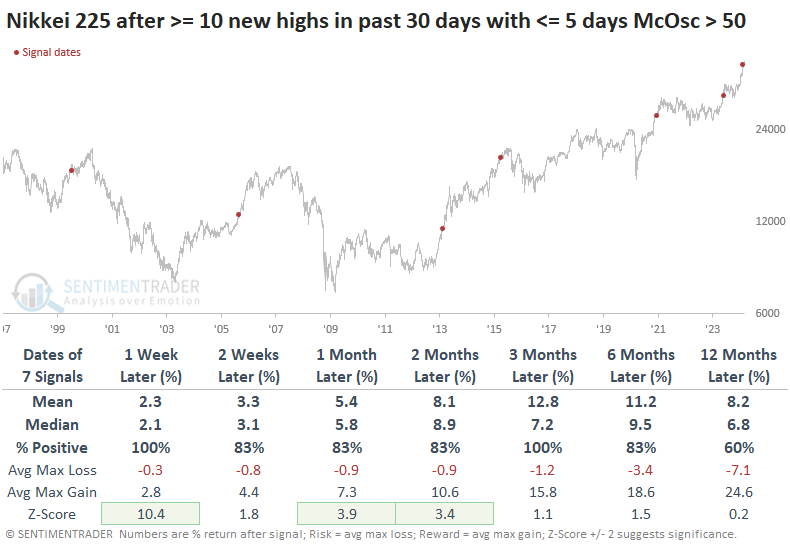
There were only three other times something similar happened, and all three scored more gains over the next several months. The last signal, from 2015, did end up rolling over within the next six months but not before chopping higher for several months.
When we try to get a larger sample size by relaxing the parameters, we can see that this situation is still highly unusual. Even if there were five or fewer days with a McOsc above +50, we still get only seven instances. And all of those still preceded more gains over the next three months.
Divergences between an index and its constituent stocks can be resolved either by dragging the index lower or the index pulling the stocks higher. In theory, that can't happen; in practice, it's a handy heuristic. Basically, we just look to see whether divergences tend to be successful warnings or not.
In the Nikkei, the answer is usually "not."
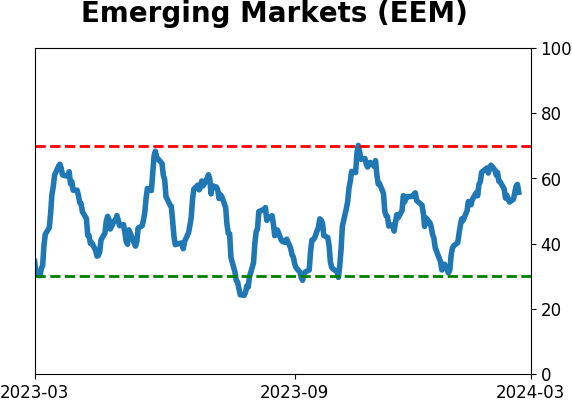
Keeping an eye on emerging markets
Emerging markets as an asset class have been trending sideways for literally 17 years. But Jay noted that they could be breaking out above a narrowing channel just as a short seasonally favorable window opens.
The iShares MSCI Emerging Markets ETF (ticker EEM) is unchanged in price from its level 17 years ago. Most investors have long written off this niche asset class as a viable investment alternative. And understandably so.
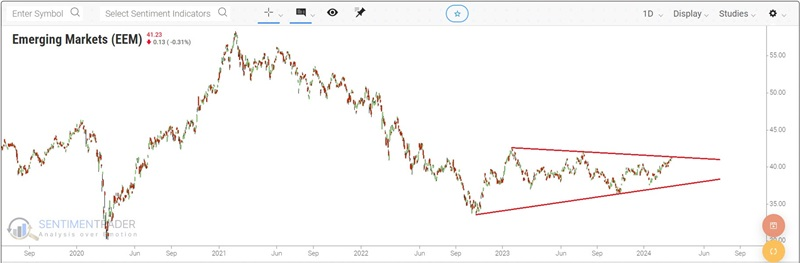
Traders might require something more to consider EEM to be offering - or at least close to offering - a decent opportunity. As always, seasonality is "climate, not weather" and also a factor and not an automatic buy or sell signal. The chart below displays the annual seasonal trend for ticker EEM.
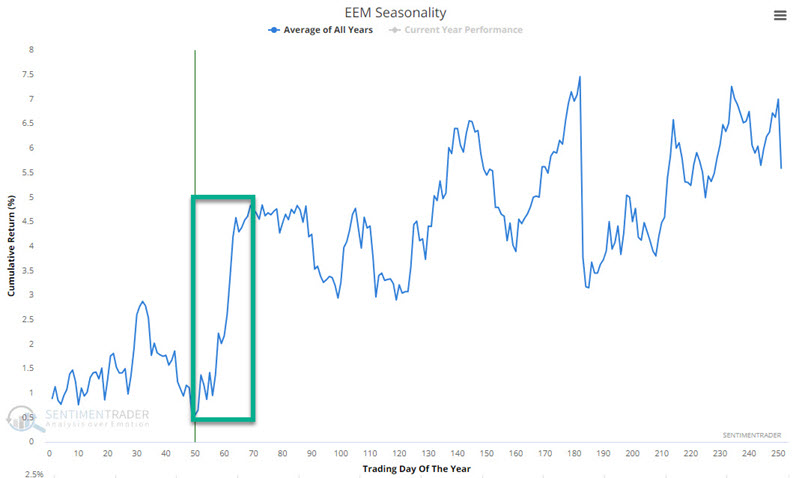
EEM just entered a favorable seasonal period that extends from the close on Trading Day of Year (TDY) #49 through the close on TDY #69. For 2024, this period for EEM extends from the close on 2024-03-12 to the close on 2024-04-10.
The chart below displays the growth of $1 invested in ticker EEM only from TDY #49 through TDY #69 every year since EEM started trading in 2003.
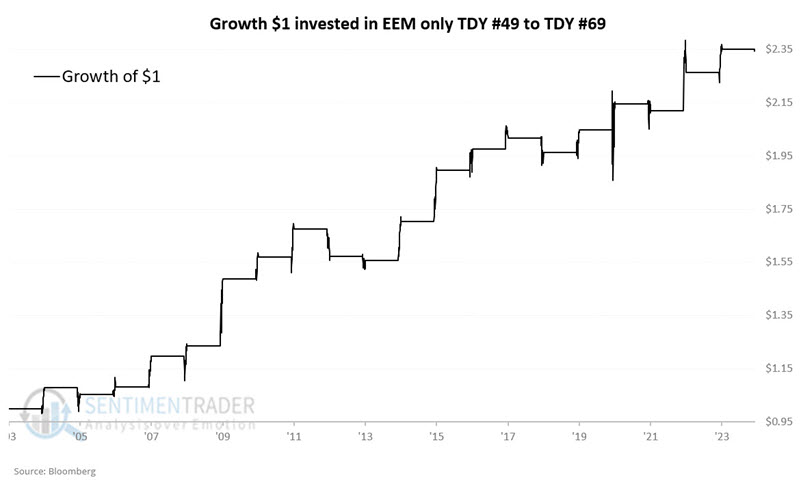
Overall, the long-term, seasonal results skew to the favorable side, with 3 out of 4 years showing a gain. Likewise, regarding moves greater than 5% or more during this period, EEM is 8 and 1 to the plus side.
Reversals in a couple of new bellwether stocks
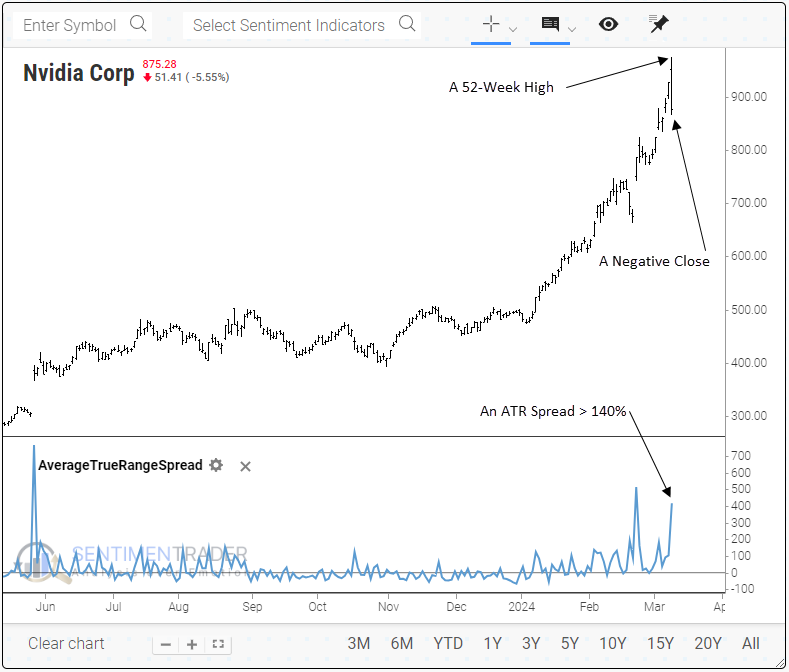
Dean noted that Nvidia and Advanced Micro Devices experienced substantial downside reversals from all-time highs.
Friday marked an interesting turn of events for Nvidia and Advanced Micro Devices. Following an initial surge of 5% and 7.5% to all-time highs, the stocks reversed course, creating a massive daily trading range.
Nvidia and Advanced Micro Devices' 1-day Average True Range as a percentage of their respective 84-day Average True Range spiked to 416% and 243%, signifying extreme intraday price volatility. Let's identify historical precedents that closely resemble last Friday's market movements.
We will use the following criteria:
- A 52-week high
- An ATR spread greater than 140% (I had to lower the threshold to increase the sample size)
- A negative close
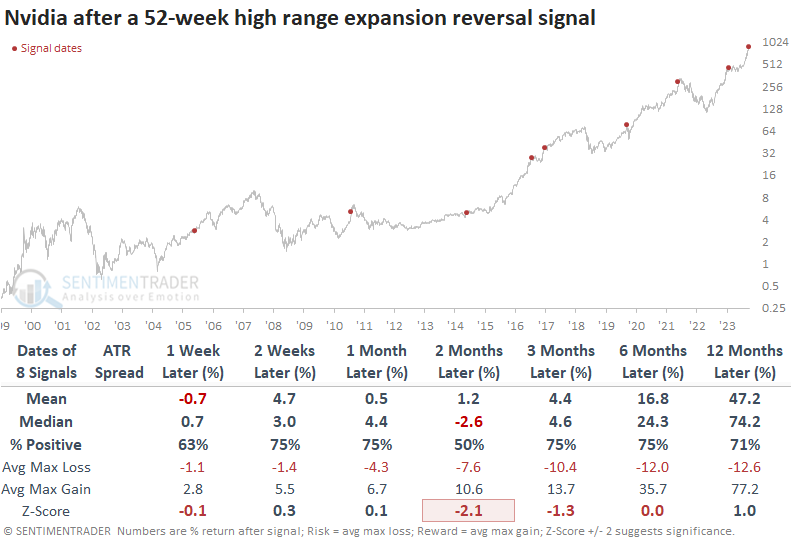
If we look at the most recent signal, July 2023, which occurred in the new AI era, Nvidia consolidated for four months and registered a -10% max loss before the uptrend resumed.
While not as pronounced as Nvidia, AMD's Average True Range spread increased to one of the highest levels in more than two years.
Following reversals from a 52-week high similar to the one experienced on Friday, the outlook for AMD was pretty bleak, with several instances representing significant tops. Over the following three months, the stock was lower at some point in 12 out of 16 cases.
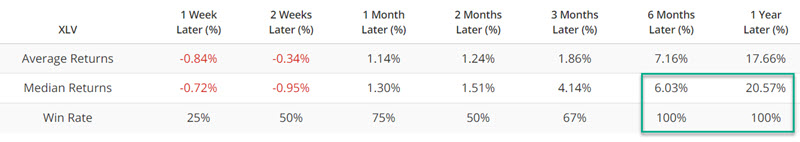
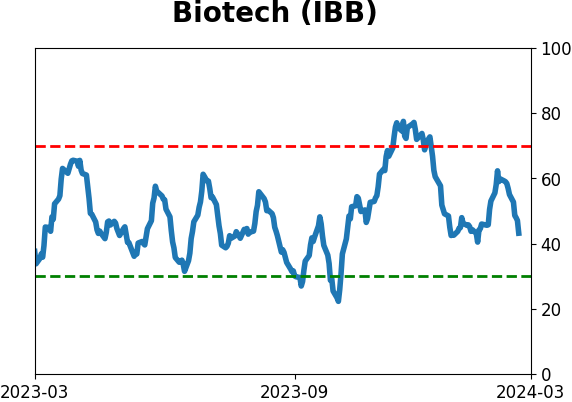
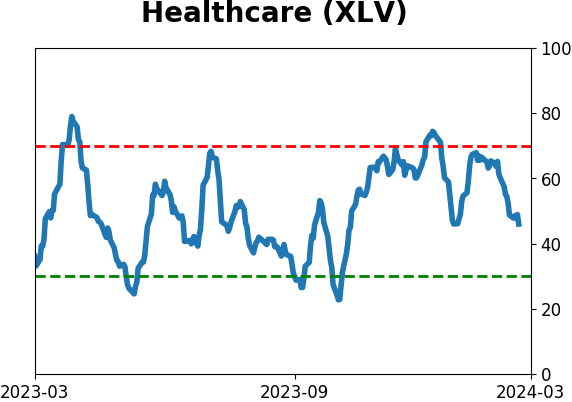
Health care is looking healthy
The healthcare sector continues to be of particular interest and recently broke out to a new all-time high. Jay showed that momentum based on new highs within the sector was triggered recently.
There is no guarantee that health care's recent price breakout will hold. However, the odds tend to improve when internal confirmations of strength accompany a breakout. One such potential sign (albeit one with a small sample size) occurred in December 2023, as the rally that led to the breakout was getting started.
The chart below highlights those rare occasions when the XLV 4 Week High % indicator crossed above 71%.
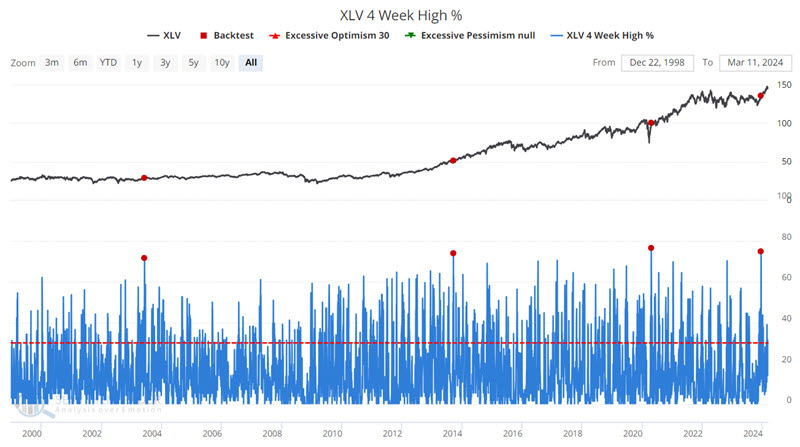
Jay also looked at a recent change in corporate insider behavior in health care stocks that tended to lead to higher longer-term prices in XLV.
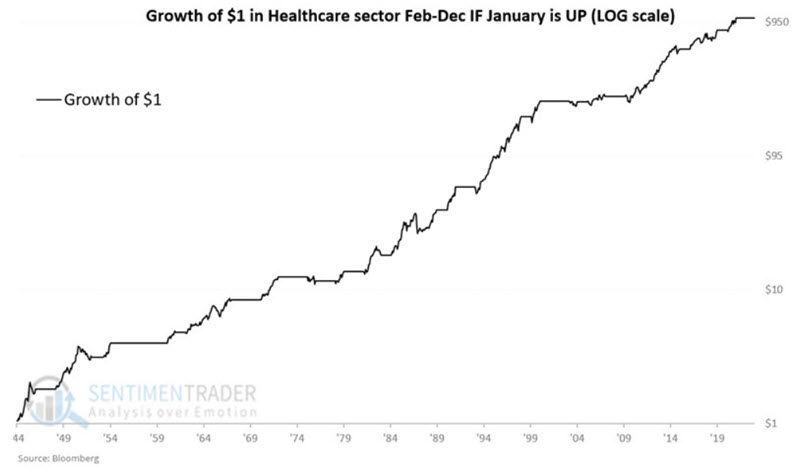
He also reminded readers that the sector has done very well for the year when it rallies in January. The chart below displays the hypothetical growth of $1 invested in the S&P 500 Healthcare sector from February through December only during those years since 1944 when the sector showed a gain for January.
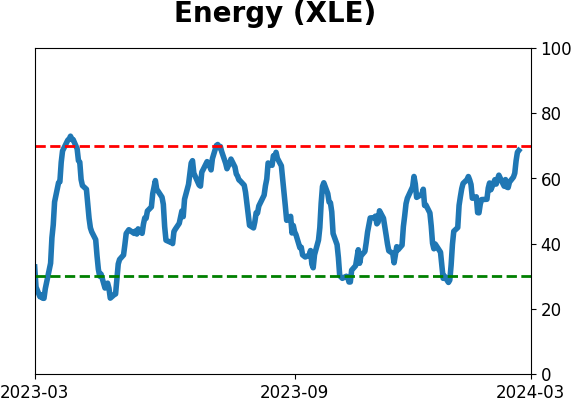
A thrust in energy stocks
The S&P 500 Energy sector triggered a breadth thrust buy signal, which Dean showed preceded a 72% win rate over the subsequent month. From an individual stock perspective, opportunities within the energy sector are limited.
Over the prior ten sessions, the sum of advancing issues outnumbered the sum of declining issues in the S&P 500 energy sector by a ratio of 3.32 to 1, triggering a breadth thrust buy signal. The previous signal was observed on July 31, 2023, during which the sector experienced a 5.9% gain over two months.
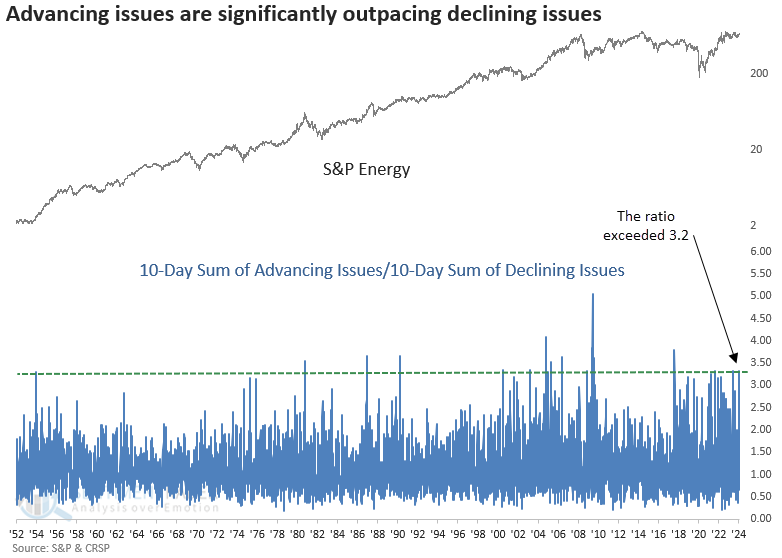
Whenever the S&P 500 energy sector registers a breadth thrust, the positive price momentum for the group tended to persist over the subsequent month, with 15 of 18 precedents showing a gain at some point over that horizon.
Should the consolidation over the last year-plus in the energy sector be a pause that refreshes an uptrend, then the new thrust signal could act as a positive catalyst for an upside breakout.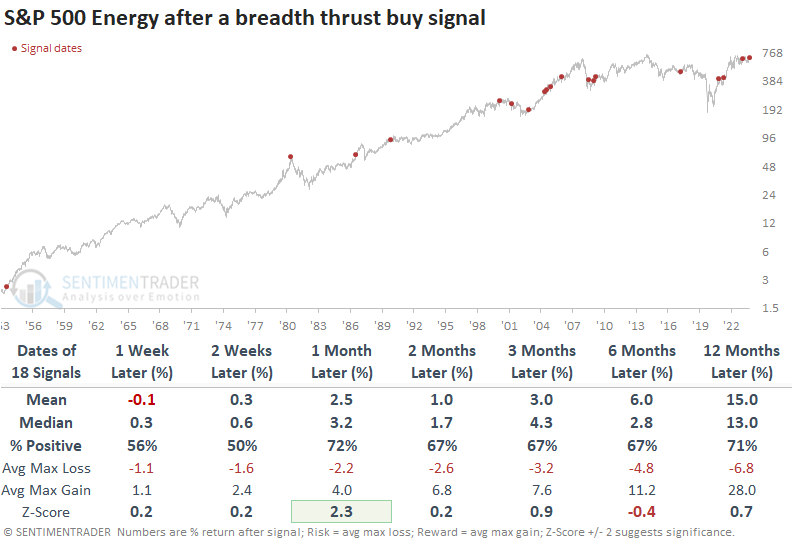
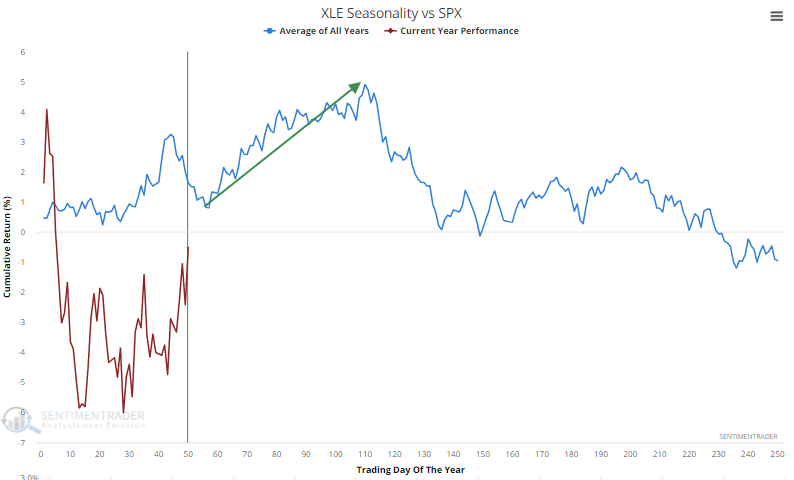
The energy sector is also about to enter the most favorable month of the year for absolute and relative returns.
Absolute and relative trend scores for energy ETFs look unattractive. This is not surprising, given that the indicators comprising the composites are predominantly long-term. Should the thrust signal momentum persist, we would expect the scores to improve.
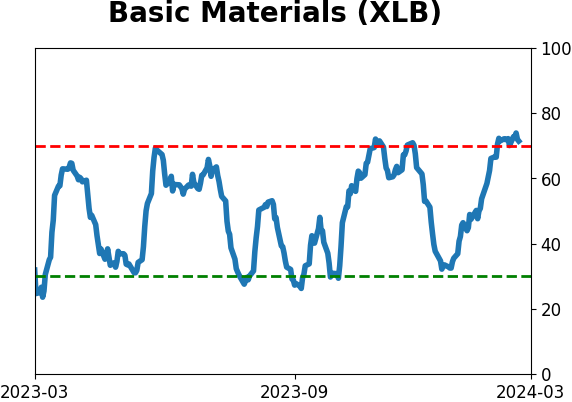
Basic materials stocks are showing good momentum, but...
Some indexes and sectors react well to upside thrusts. Others don't.
With the latter group, basic materials stocks have also found some trouble when momentum gets hot. They have been showing some signs of renewed investor interest lately, and nearly a third of them recently hit a 52-week high. The last time they spiked like this marked the peak in last 2021.
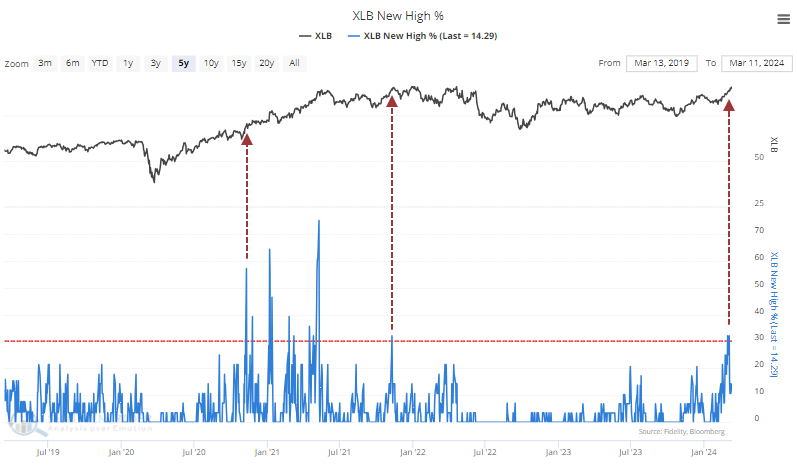
The table below shows every time in the past 70 years when more than 30% of materials stocks reached a 52-week high for the first time in at least two years. The materials sector isn't very broad, and as noted above, signs of momentum haven't been a great signal to jump in.
Over the next three months, the total return on the sector was negative, only 38% of the signals showed a positive return, and the average max loss exceeded the average max gain.
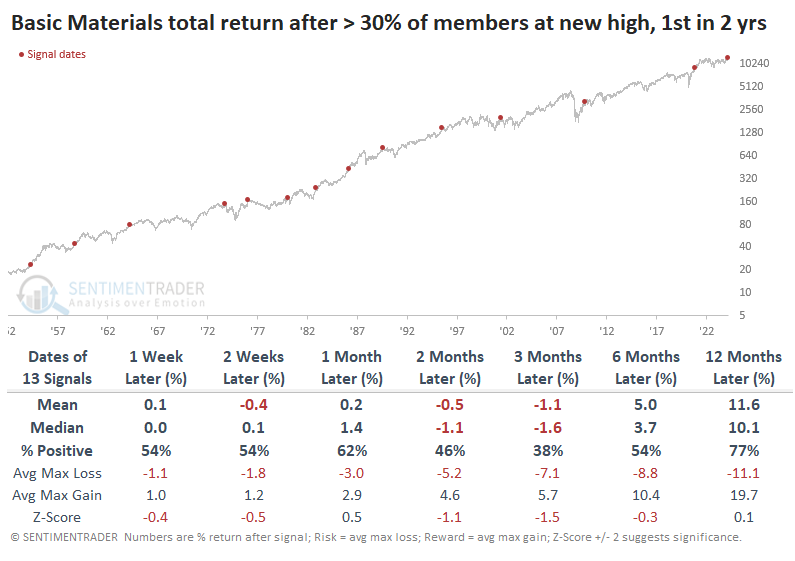
One wrinkle we often see with groups like this is that if the rally is real, investors will typically keep pushing them in the short term. That's the case here, as well. It's not perfect, but if investors continue to push materials stocks higher in the short-term (or at least not sell them aggressively), they tend to stick around longer term.
Other medium- to long-term indicators have also jumped higher for the sector in recent days. More than 95% of the stocks are trading above their 50-day moving averages, which has also preceded mostly negative short-term returns in the XLB fund.
The move in these stocks has been impressive and persistent enough that the McClellan Summation Index for the sector has pushed above +1150. Again, XLB has had some difficulty adding to the positive momentum.
The most compelling positive, from a longer-term point of view, is that corporate insiders have been loathe to sell and relatively eager to buy shares of their companies. The buy/sell ratio for firms in the materials sector is high compared to the past decade.
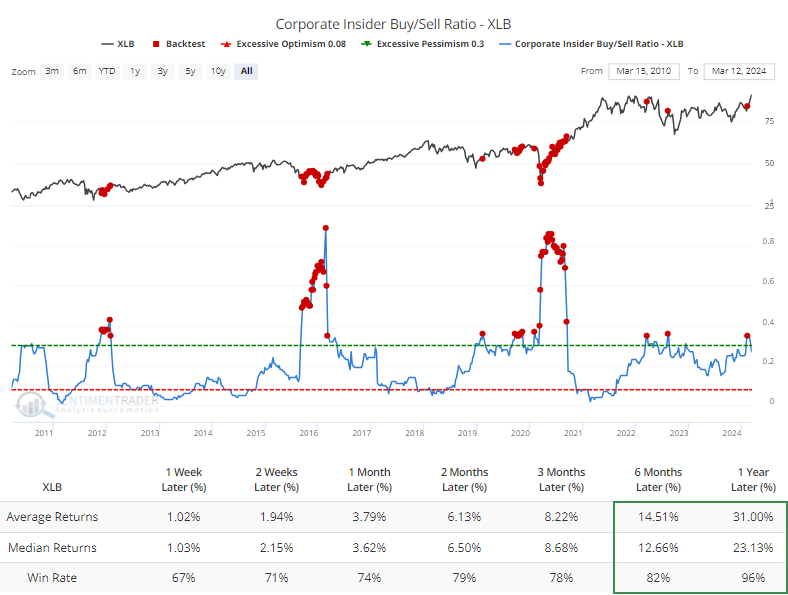
Because of the nature of their business, some of the stocks can be a bit more seasonally consistent over the years. The XLB fund started the year by adhering to its seasonal pattern very well, but in recent weeks, it has front-run what has typically been a positive trend into April. The summer months have been more of a struggle.
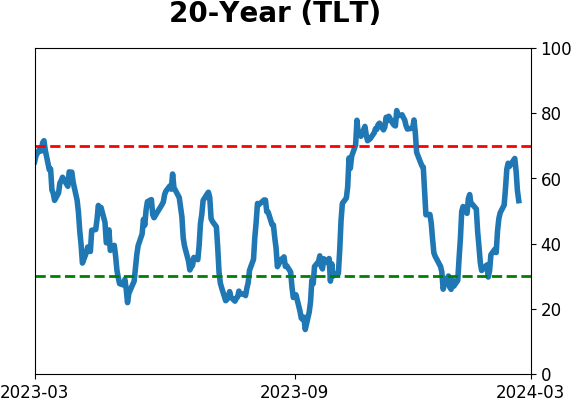
Treasury bonds are trying to bottom
Jay noted that after an epic multi-year decline, long-term treasury bonds are threatening to establish a new uptrend.
From the March 2020 high to the October 2023 low, long-term treasury bond futures prices suffered a staggering -42%+ decline from peak-to-valley. One can argue that t-bonds are now in an uptrend, as the price is back above the 200-day moving average.
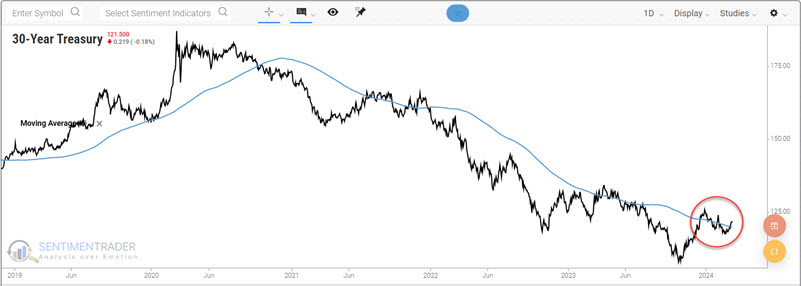
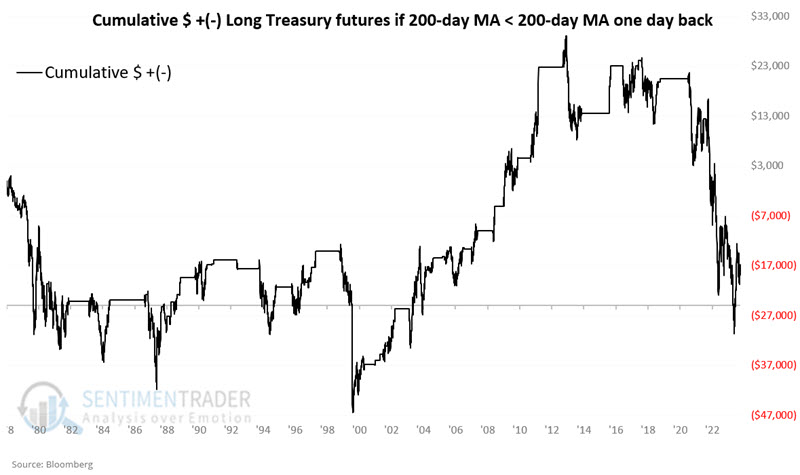
One important clue to watch for is whether t-bonds can move decisively above their 200-day average and if that 200-day average begins to turn higher. At present, the 200-day average itself remains in a downtrend. Historically, this has not been a favorable configuration for bonds.
The chart below displays the cumulative $ +(-) for t-bond futures when the 200-day moving average for t-bond futures was in a downtrend.
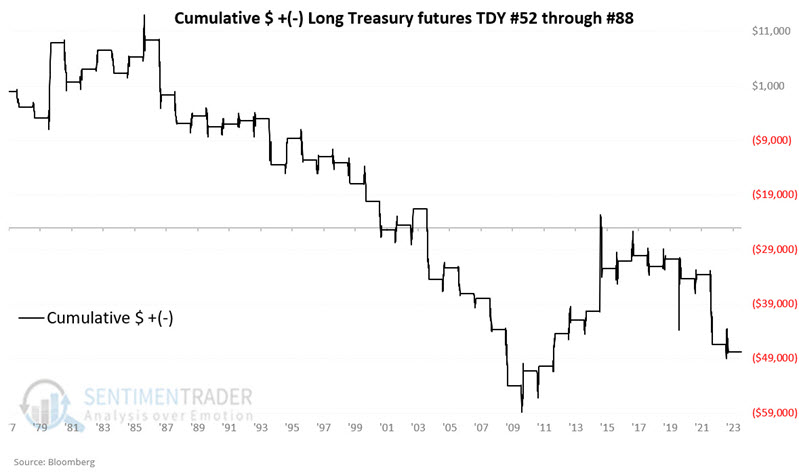
Also, we are nearing an unfavorable period that extends from the close on Trading Day of the Year (TDY) #52 through the close on TDY #88. For 2024, this period extends from the close on 2024-03-13 through 2024-05-03.
The chart below displays the cumulative hypothetical $ +(-) achieved by holding a long position in 30-year futures only during the TDY 52 through TDY #88 period each year starting in 1978.
The recent bounce in t-bond prices brought the bond bulls back to life in a big way. If we look at when the 3-week average of T-Bond Optimism Index crossed above 86% during the last 20 years, we see a propensity for bond weakness, particularly in the 3-month time frame.
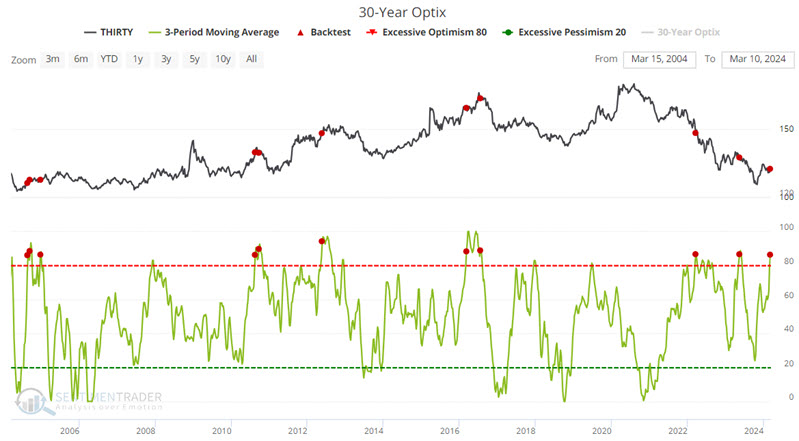
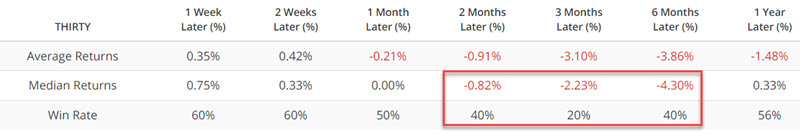
The willingness of traders to turn bullish so quickly following a relatively modest rally appears to be a potential red flag.
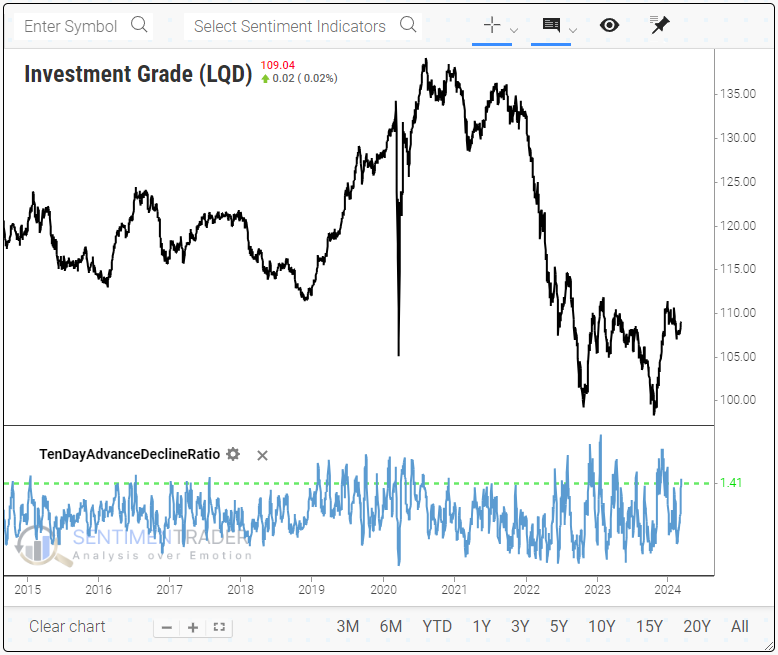
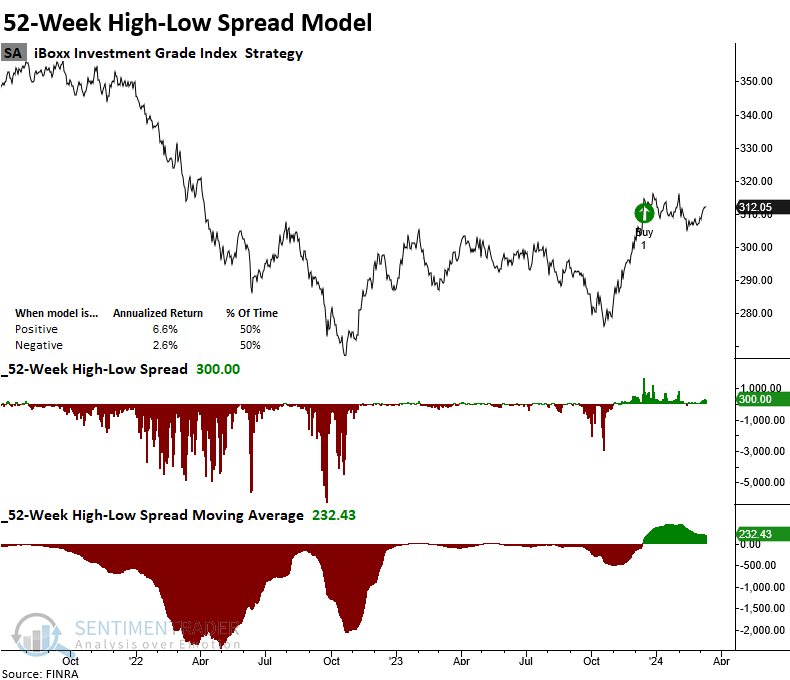
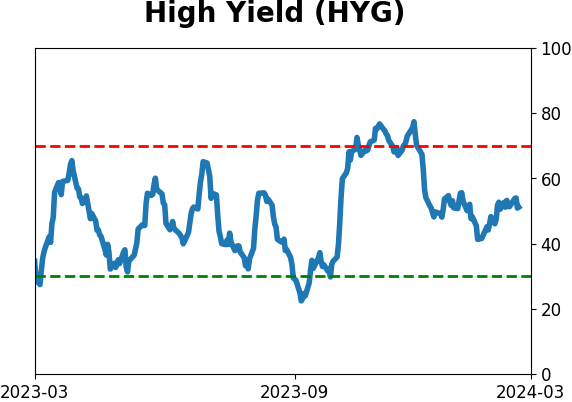
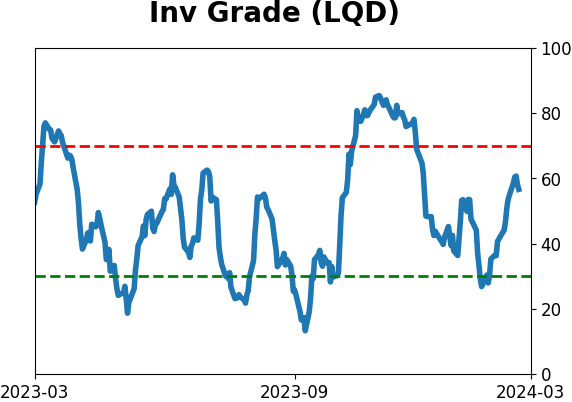
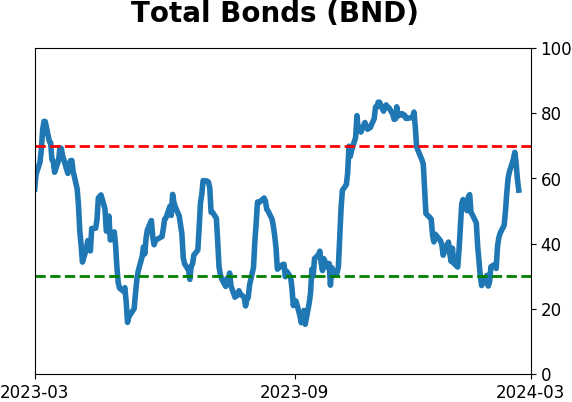
High-quality bonds have trusted higher
Investment-grade bonds triggered a new breadth thrust signal, indicating broad participation. Dean showed that after similar bursts in participation, investment-grade bonds (and stocks) rallied.
On Monday, a model that measures breadth thrust signals for investment-grade bonds triggered an alert. The model triggers when the 10-day sum of investment-grade advancing issues exceeds the 10-day sum of declining issues by a ratio of 1.41.
The investment-grade breadth thrust signal struggled as inflation reared its ugly head in 2021, forcing the Fed to hike interest rates aggressively. However, with inflation significantly lower and the Fed on hold, the precedent set in November 2023 suggests a potential shift in the backdrop toward a more favorable environment, echoing the signals observed before 2021.
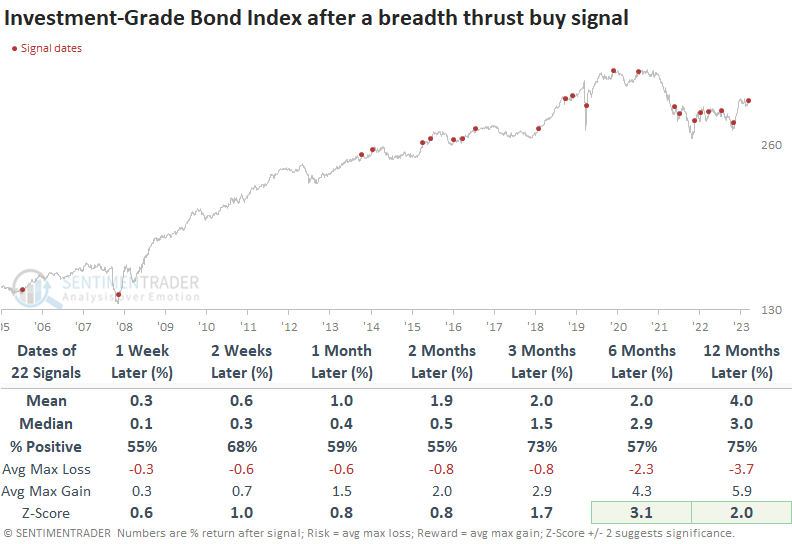
When investment-grade bonds trigger a breadth thrust, the S&P 500 displays excellent returns and win rates, with z-scores suggesting above-random returns.
After maintaining a sell signal since 2021, a 52-week high-low spread model for these bonds triggered a buy signal in late 2023, indicating a more favorable backdrop for investment-grade bonds. A positive model outlook corresponds to an annualized return of 6.6% for the iBOXX Investment-Grade Bond Index, whereas a negative stance results in a meager return of 2.6%.
About TradingEdge Weekly...
The goal of TradingEdge Weekly is to summarize some of the research published to SentimenTrader over the past week. Sometimes there is a lot to digest, and this summary highlights the highest conviction or most compelling ideas we discussed. This is NOT the published research; rather, it pulls out some of the most relevant parts. It includes links to the published research for convenience, and if you don't subscribe to those products, it will present the options for access.
Indicators at Extremes
|
|
|
Phase Table
|
|
|
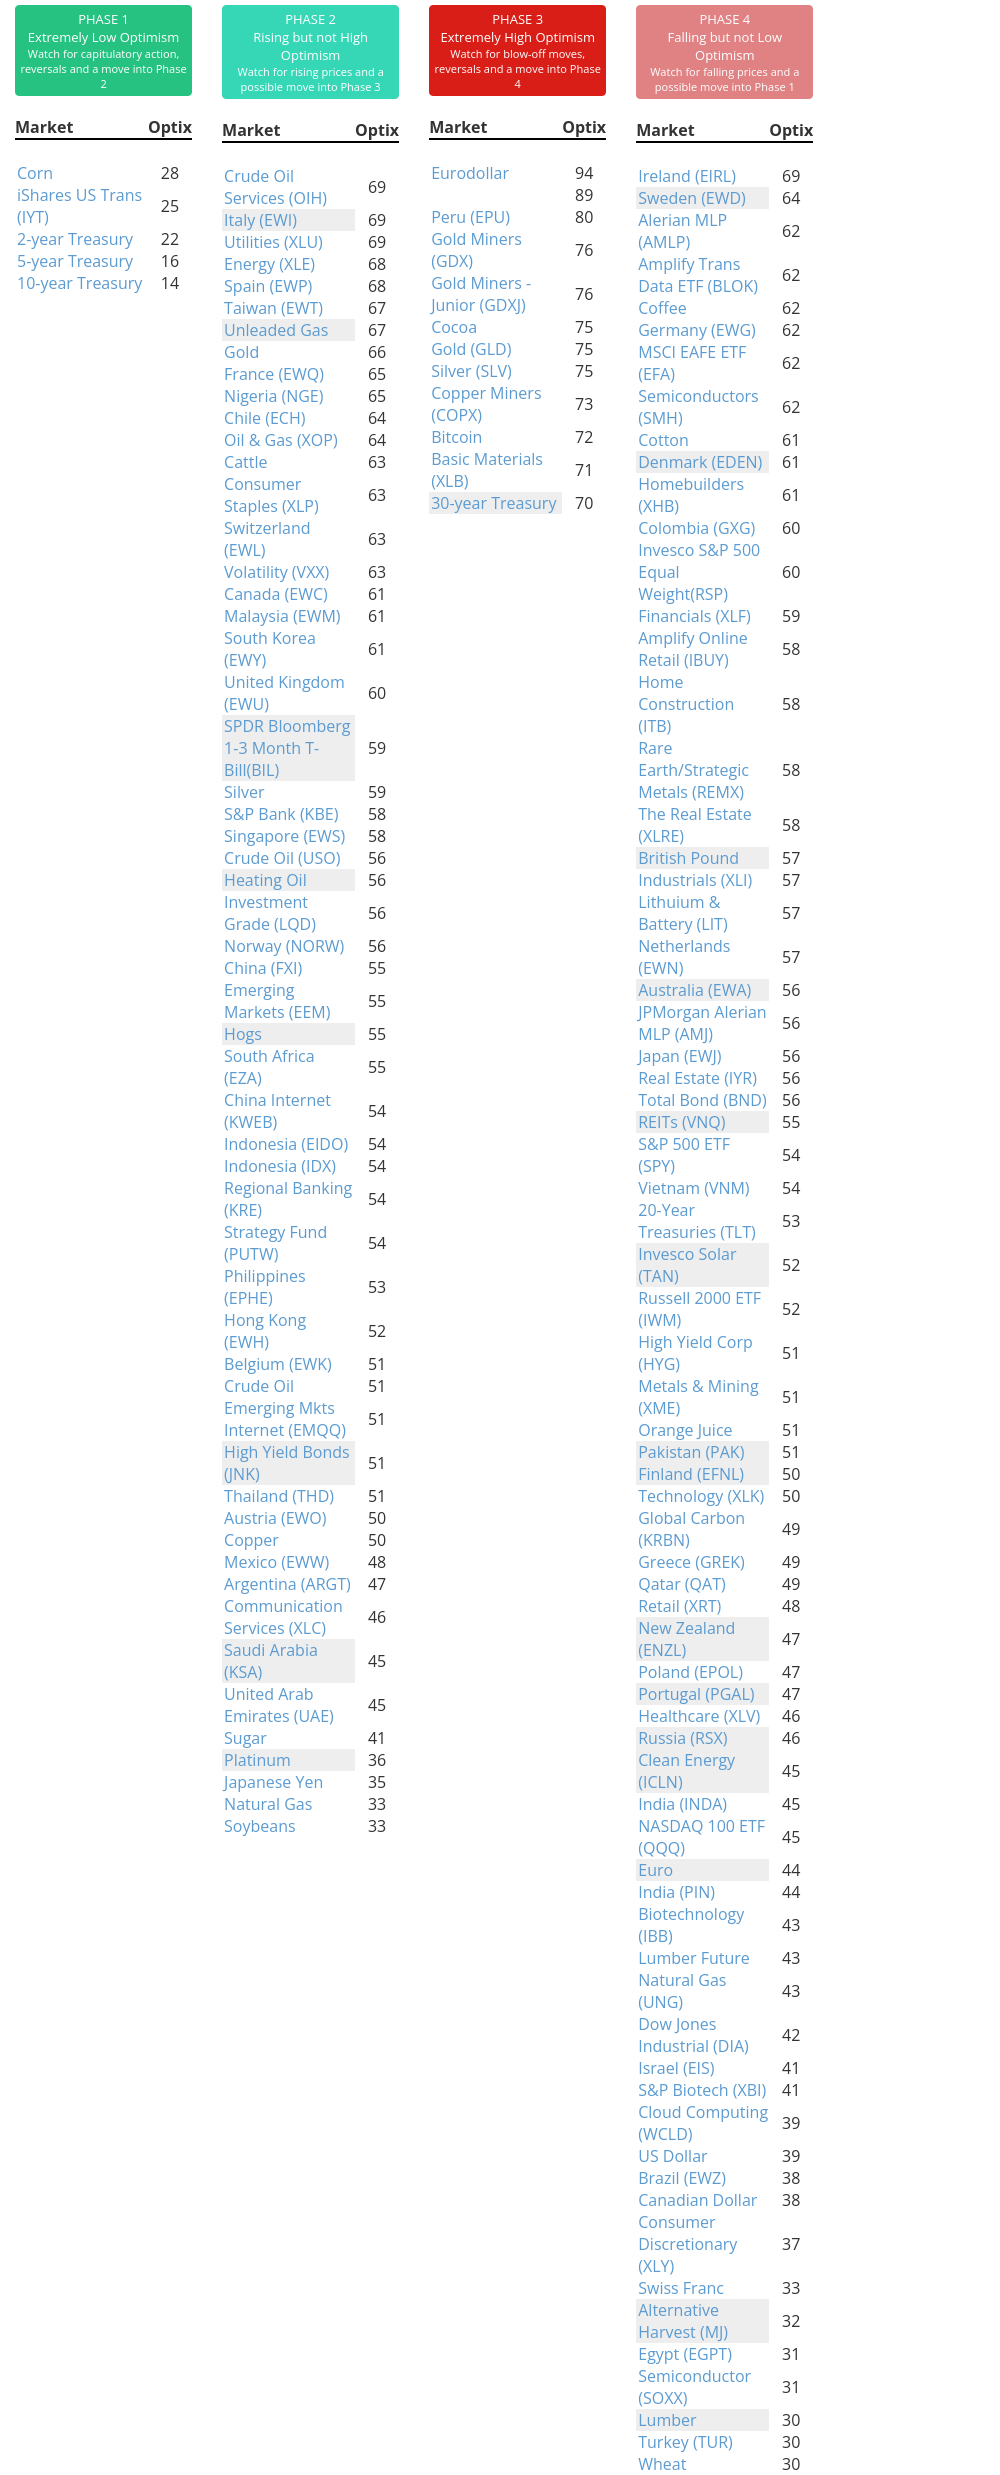
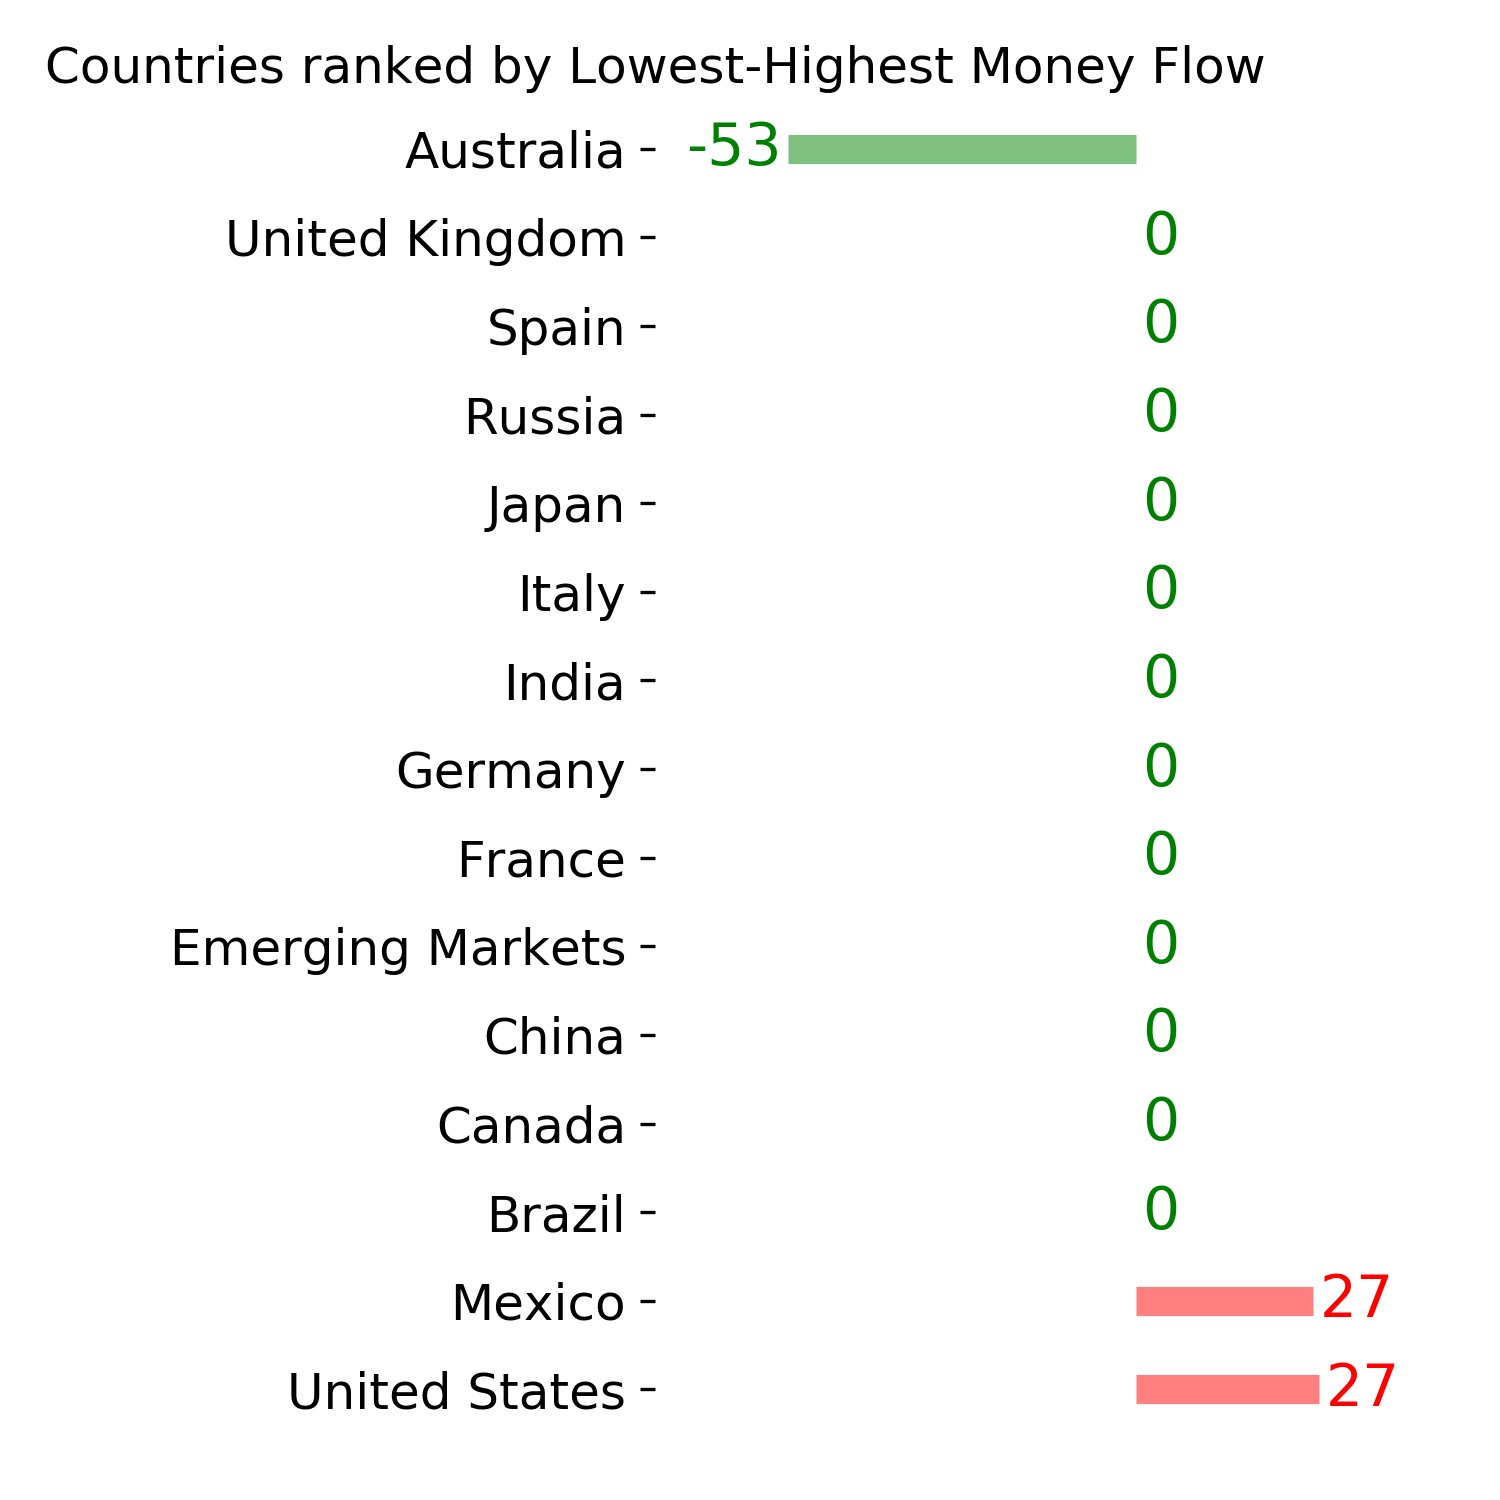
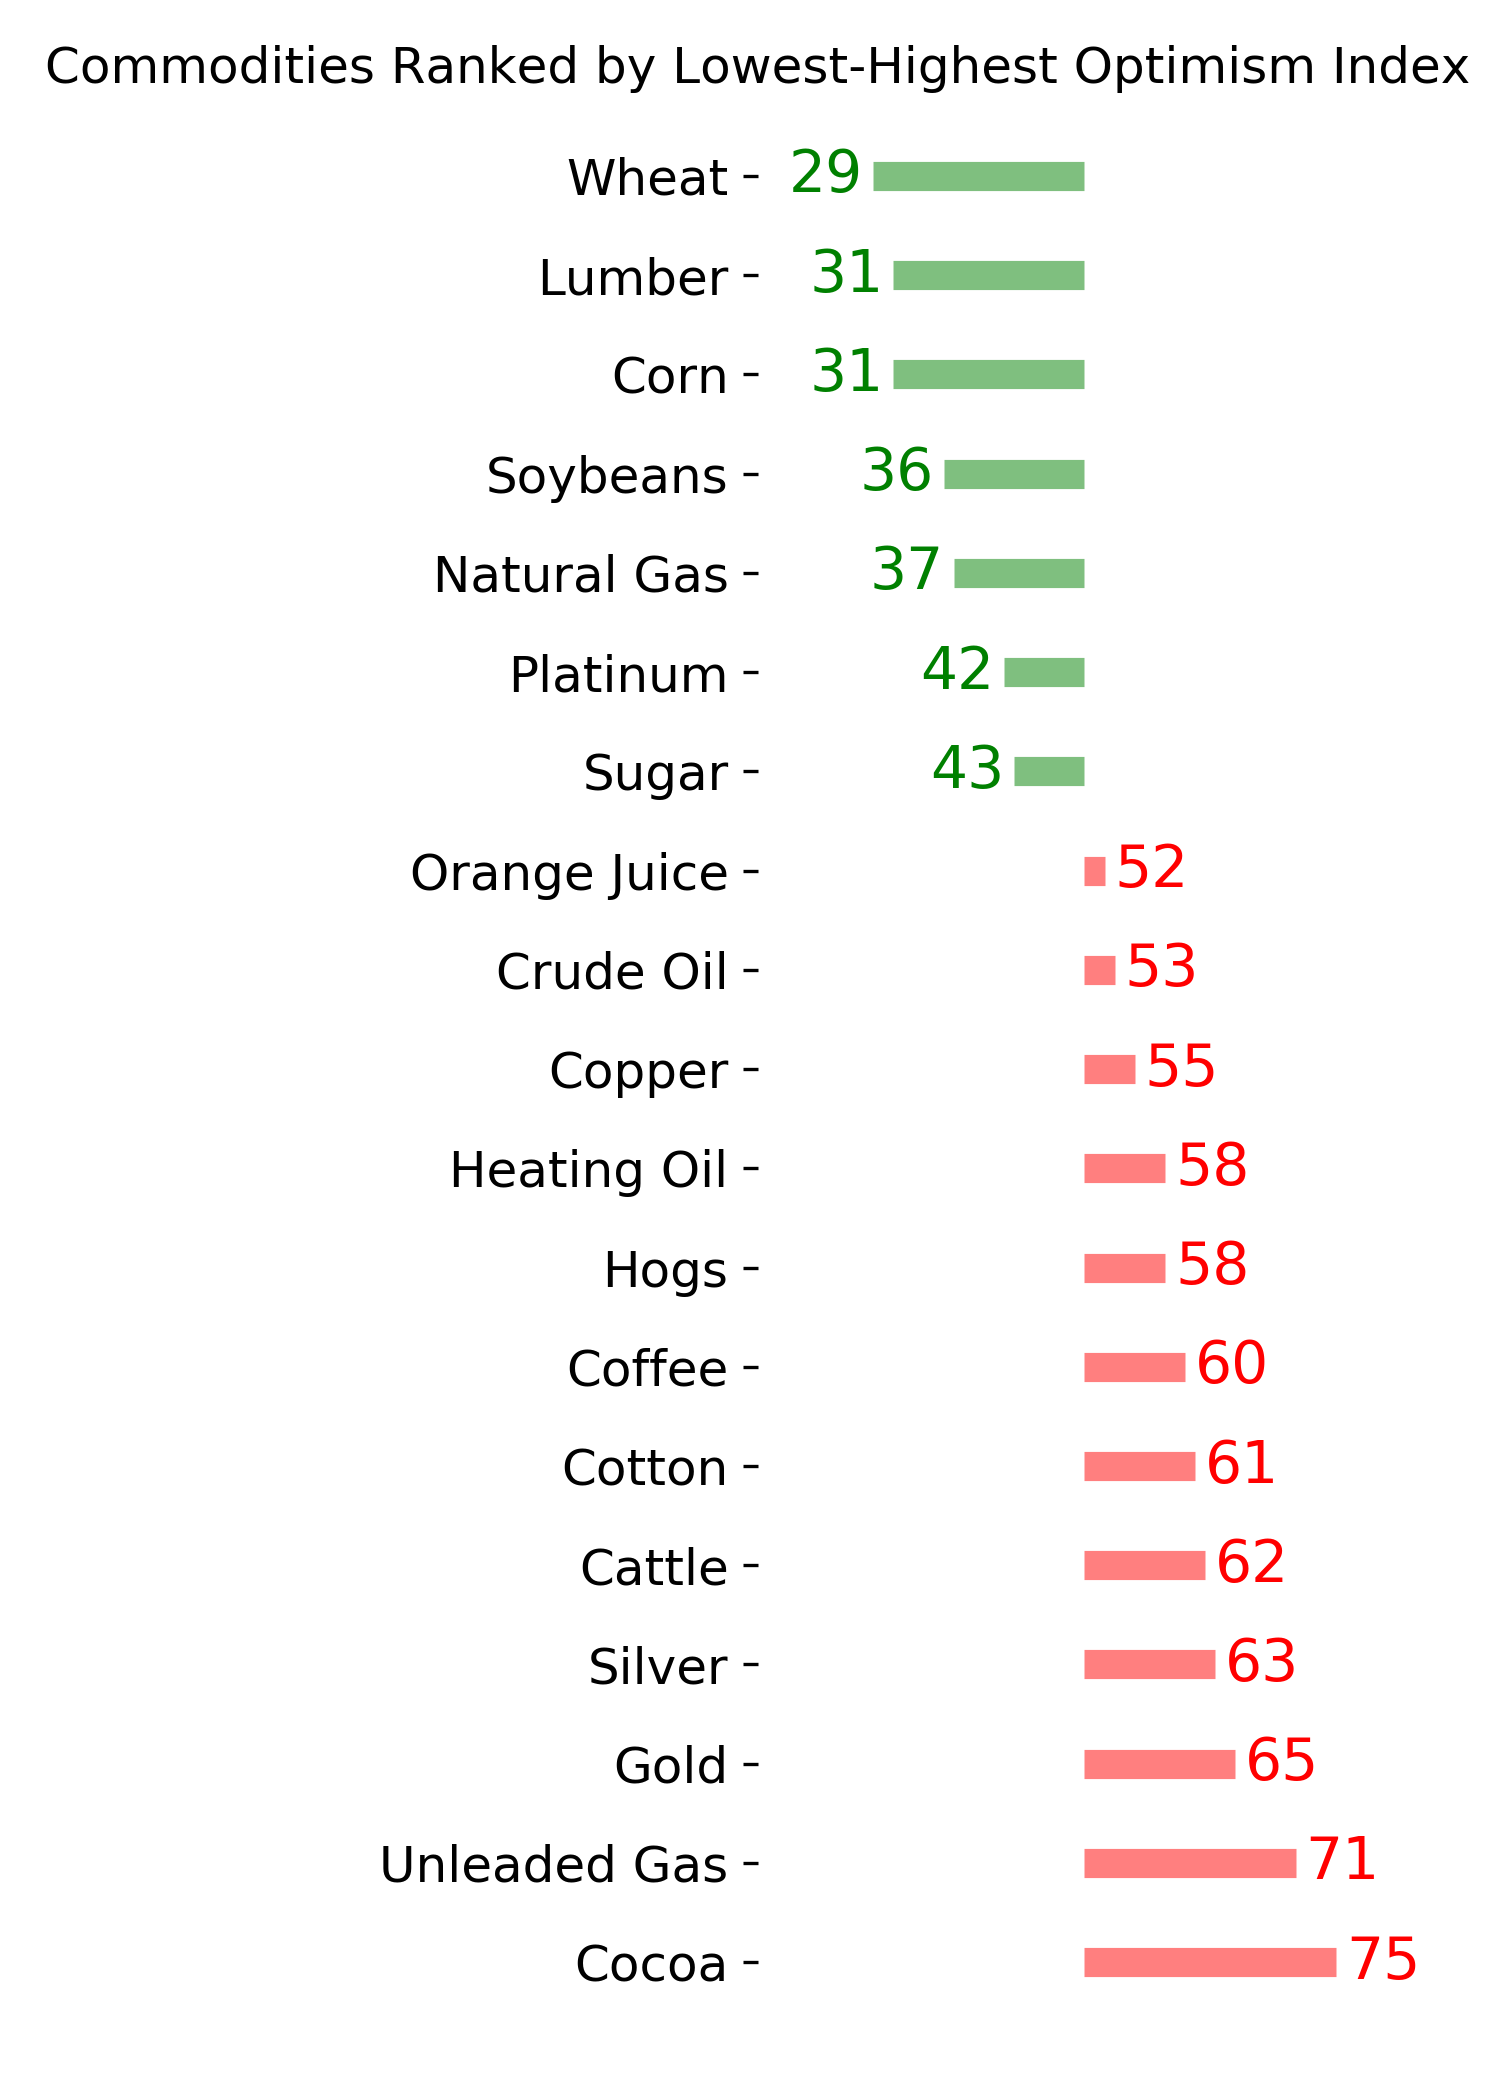
Ranks
|
|
|
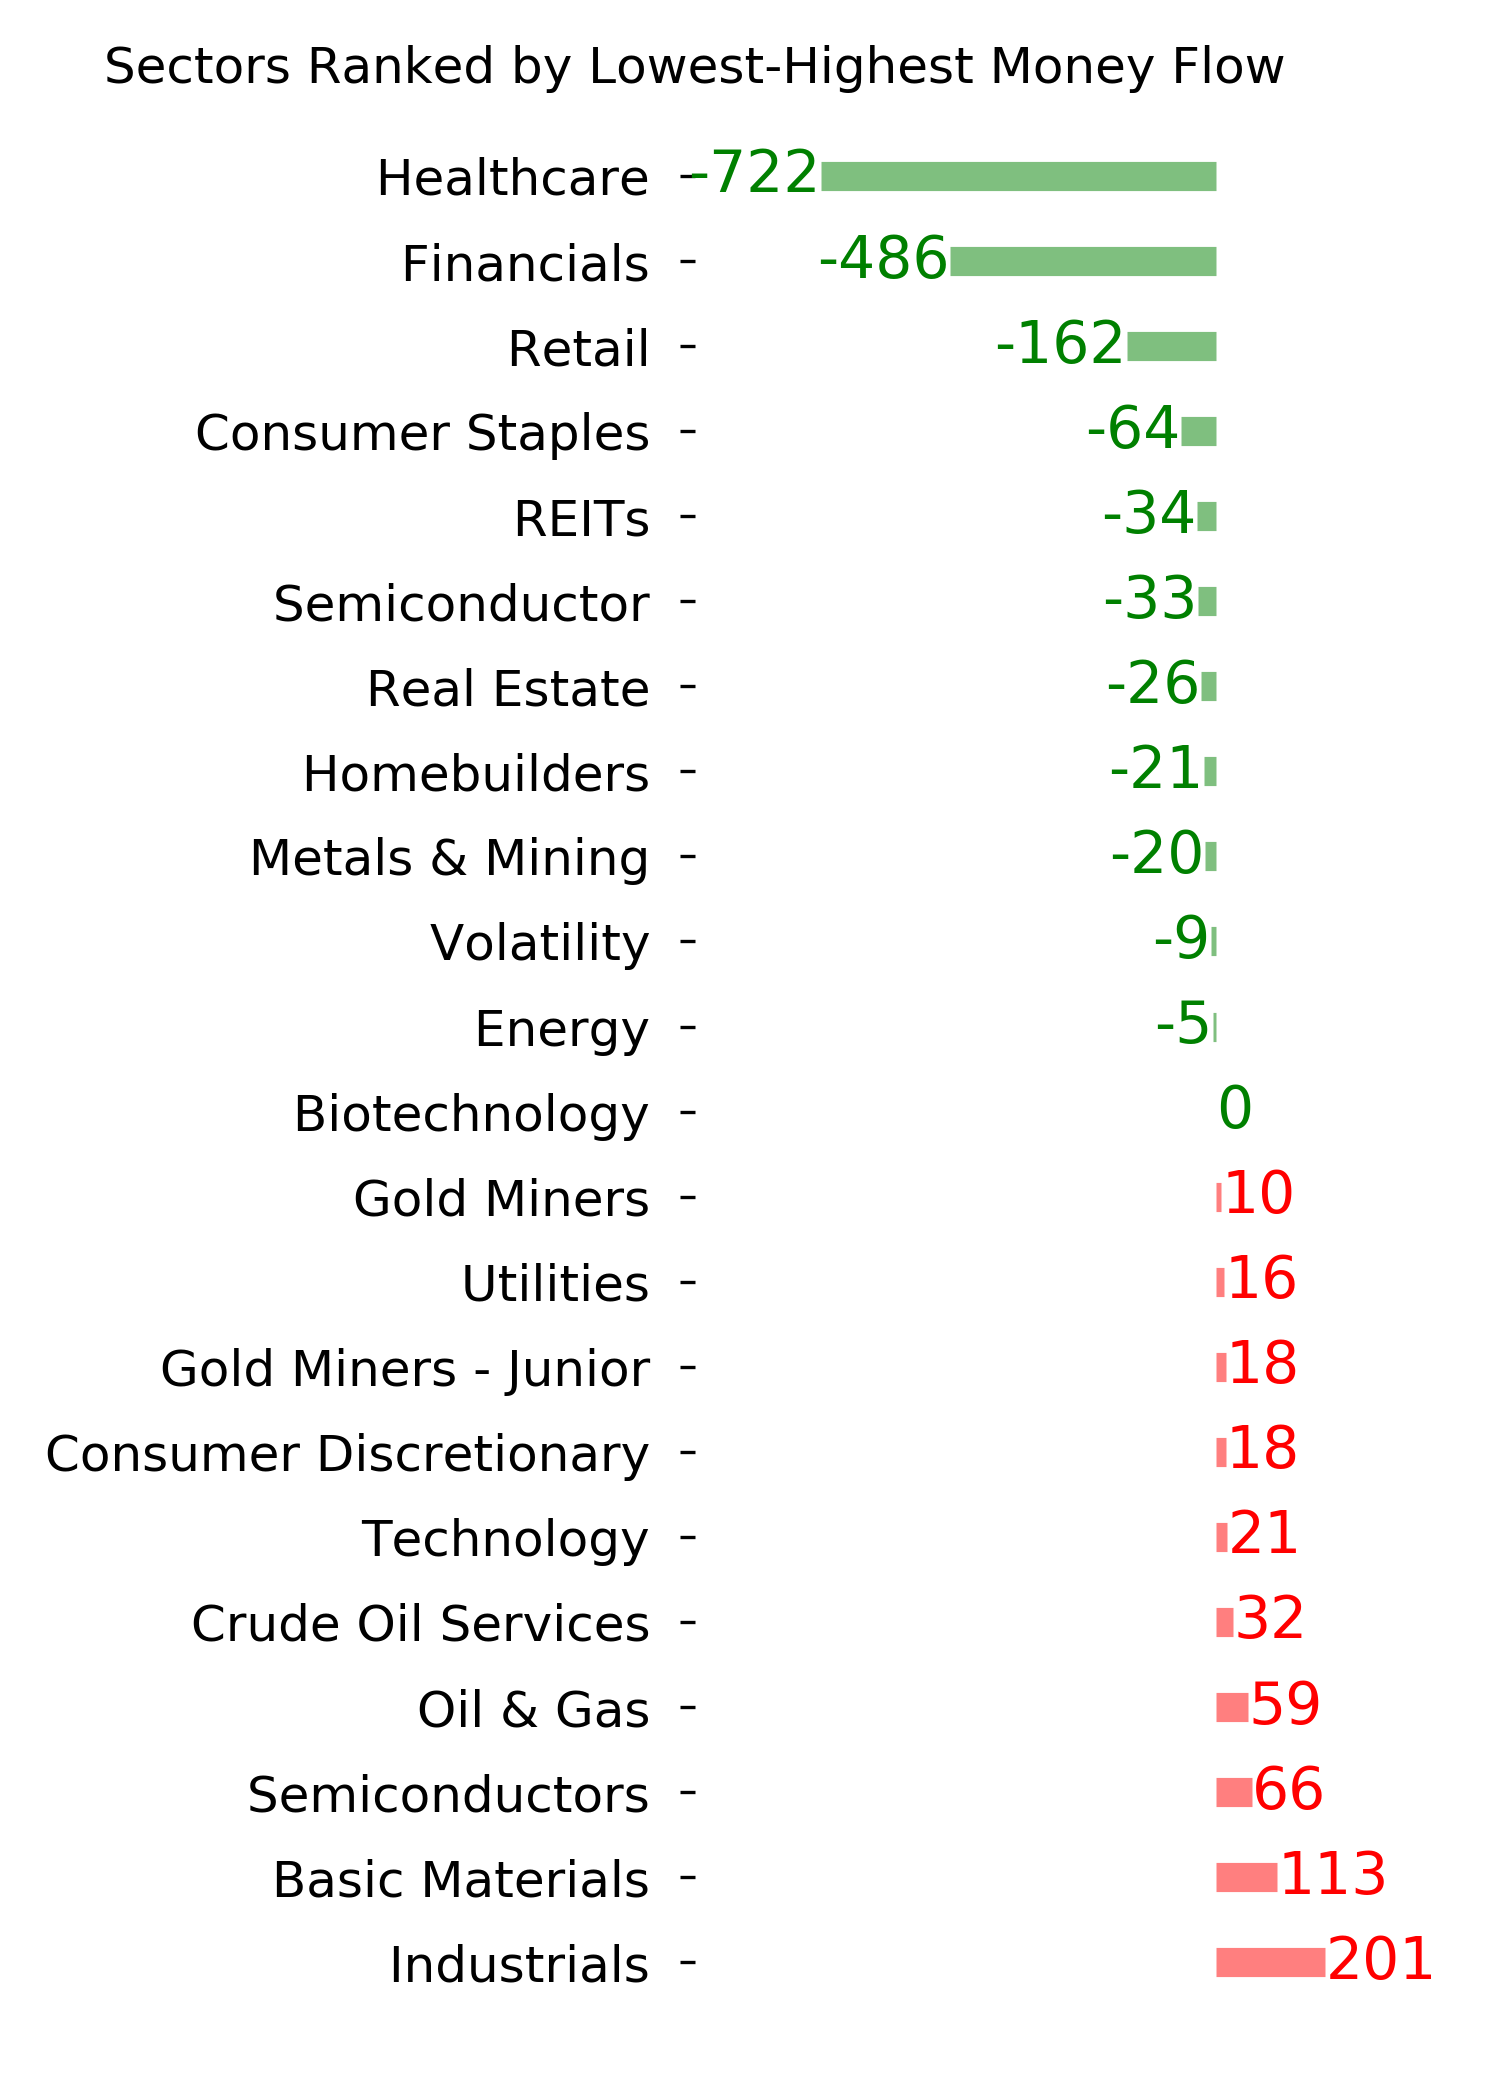
|
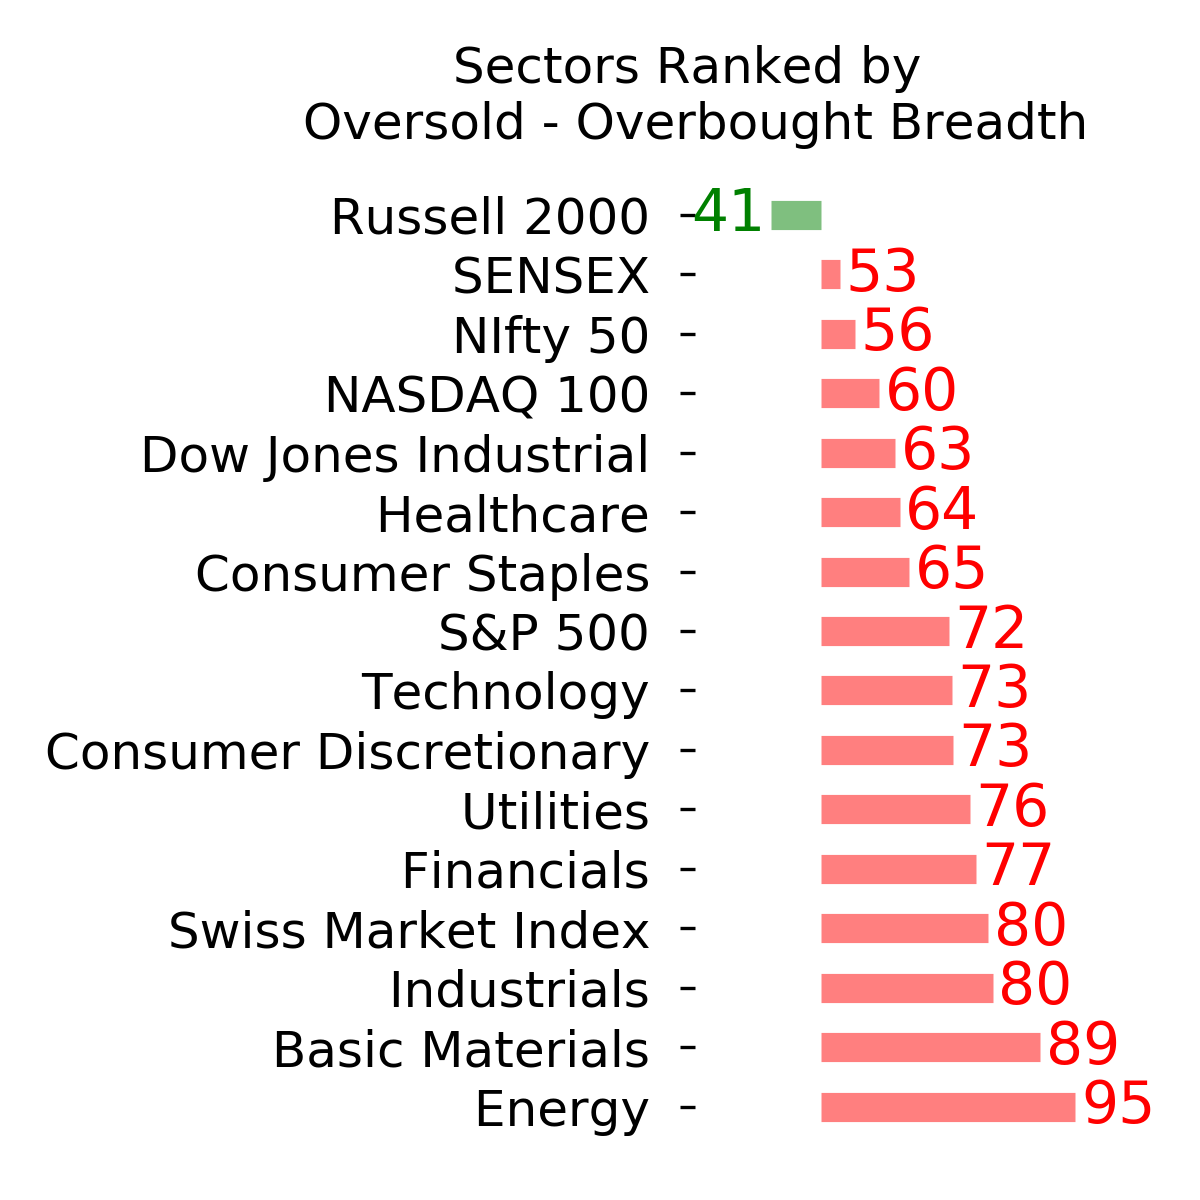
|
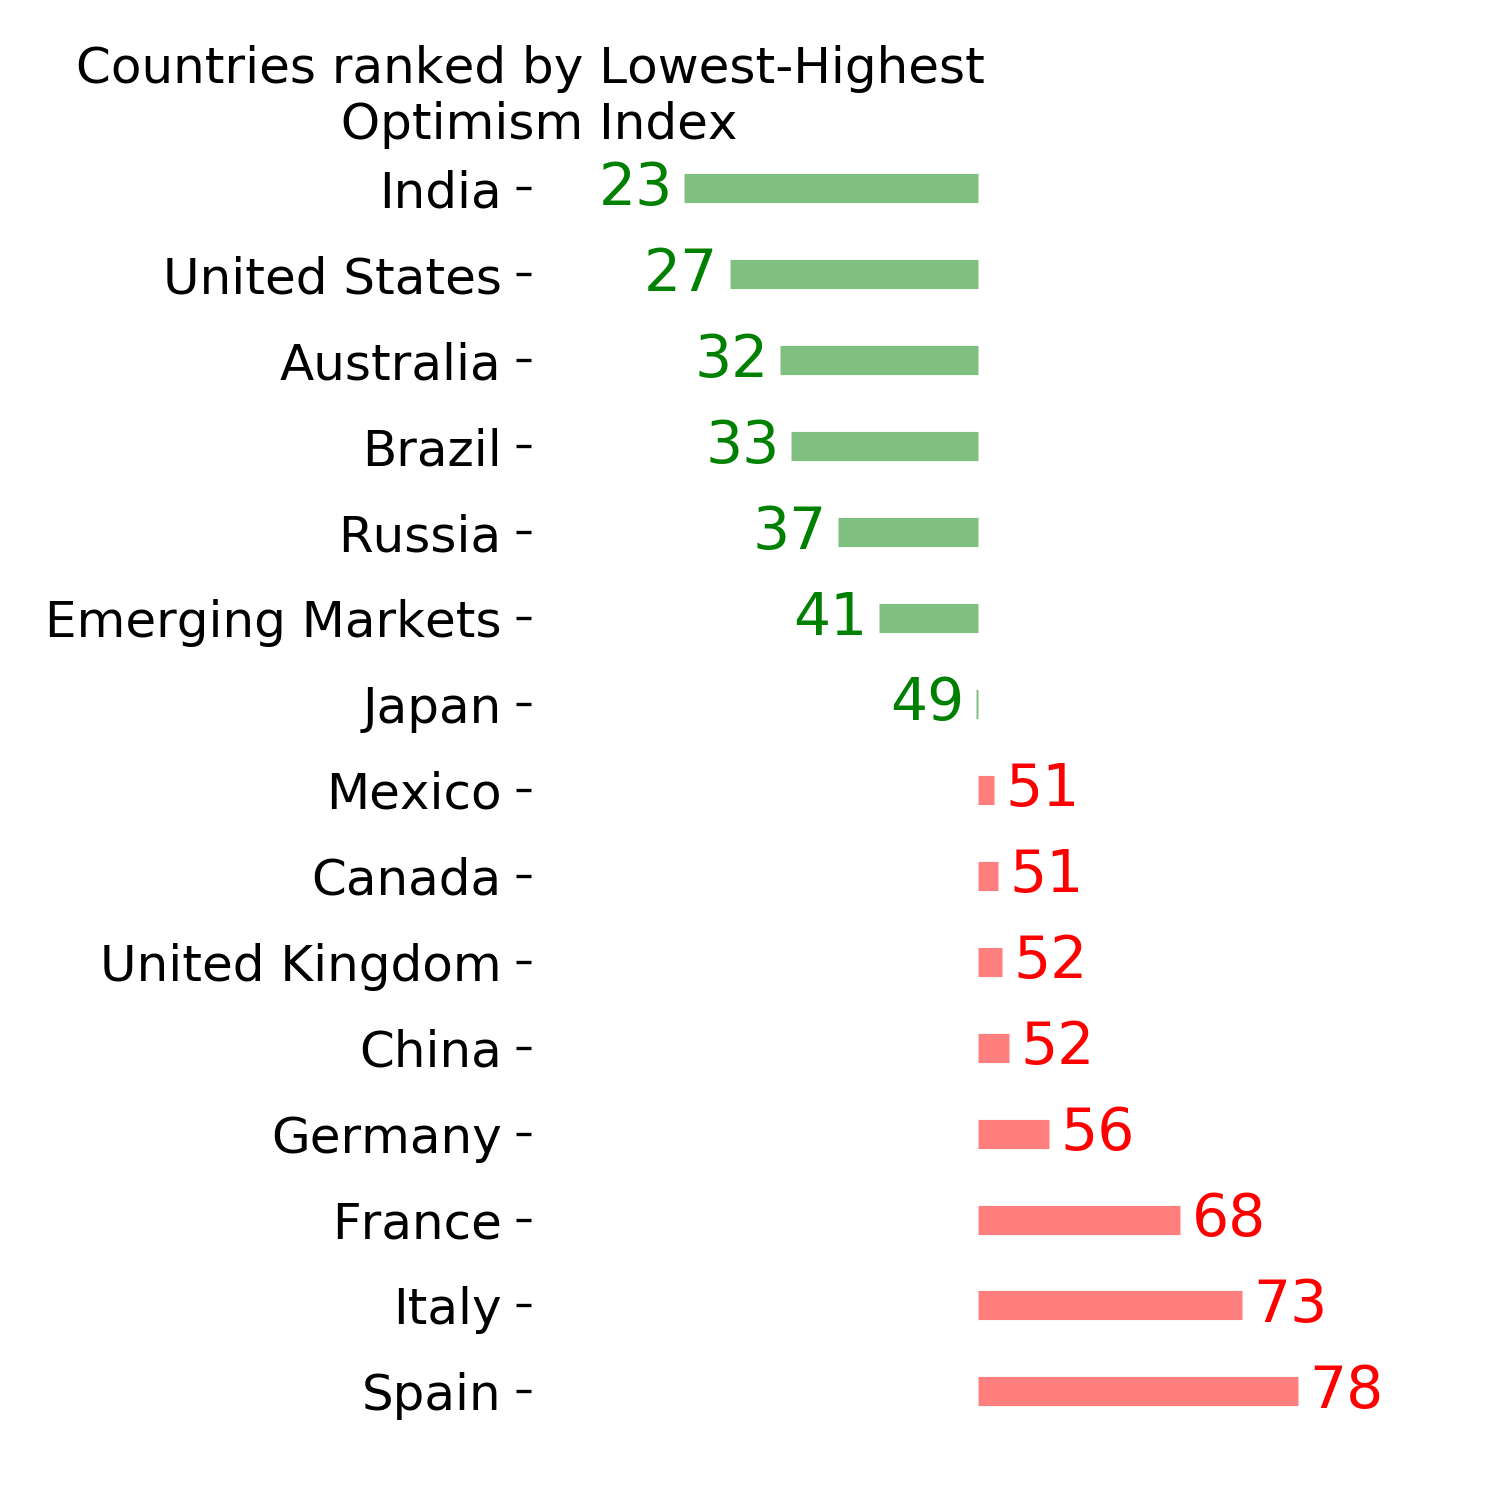
|
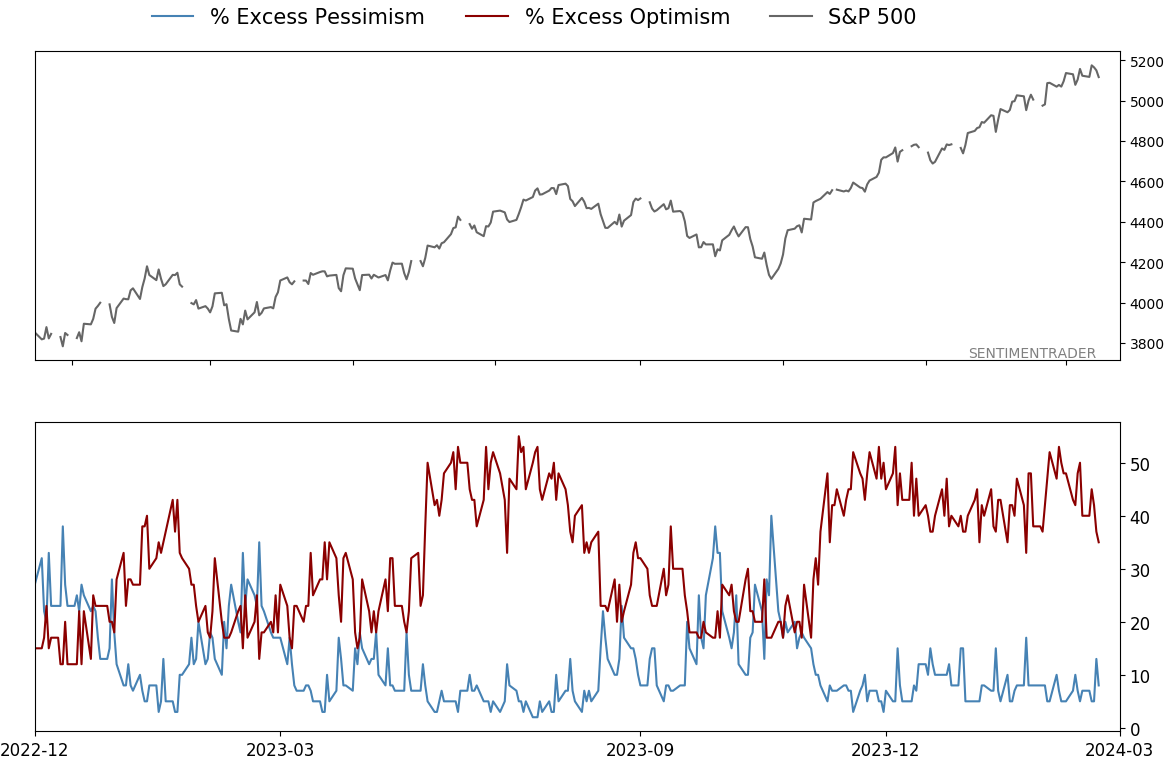
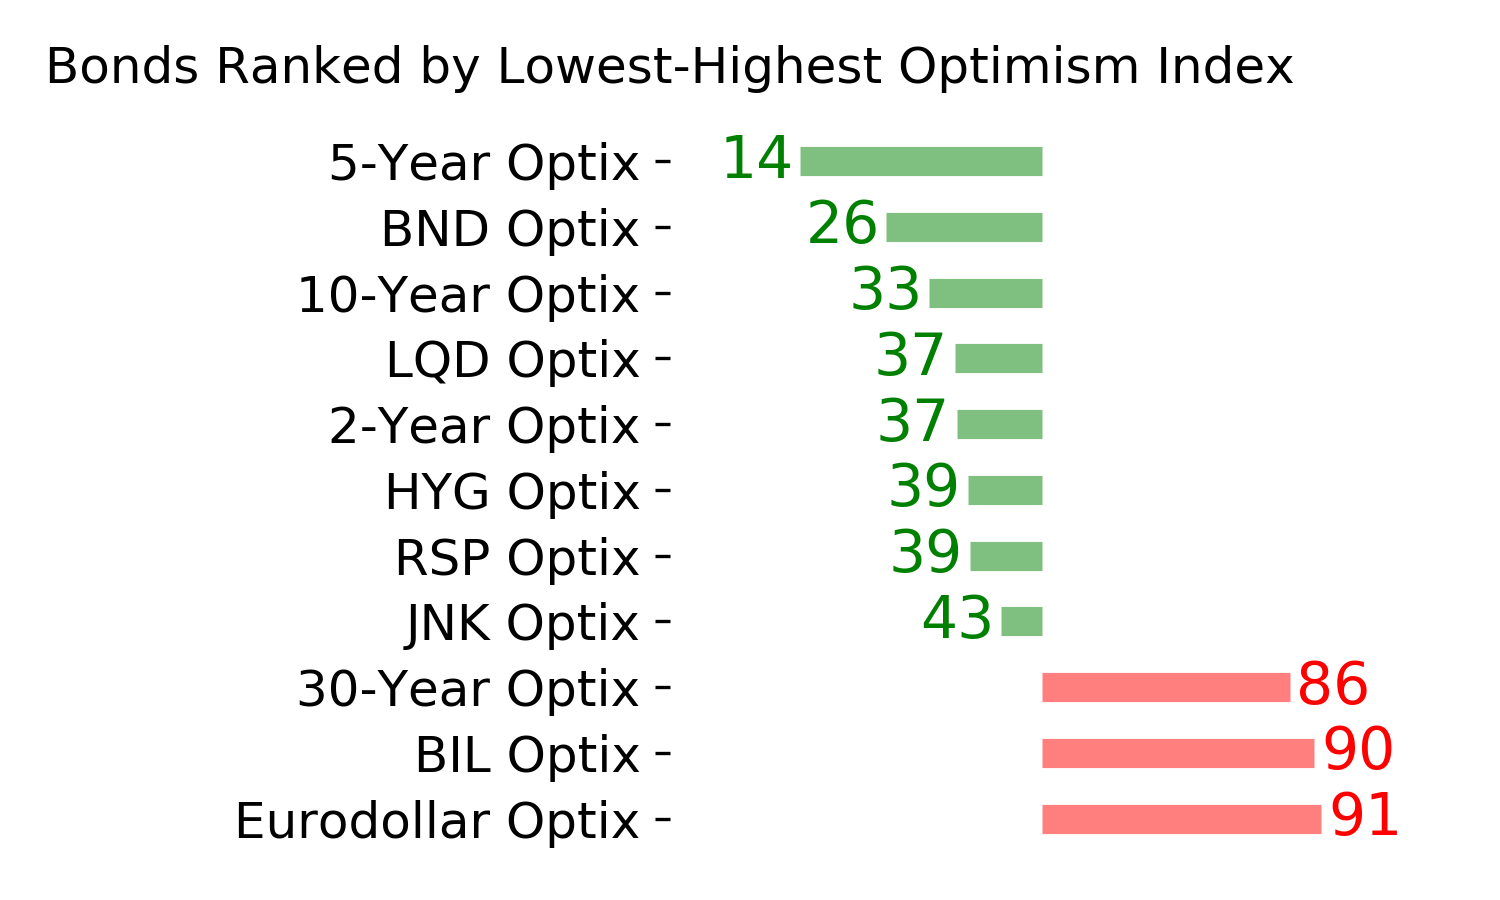
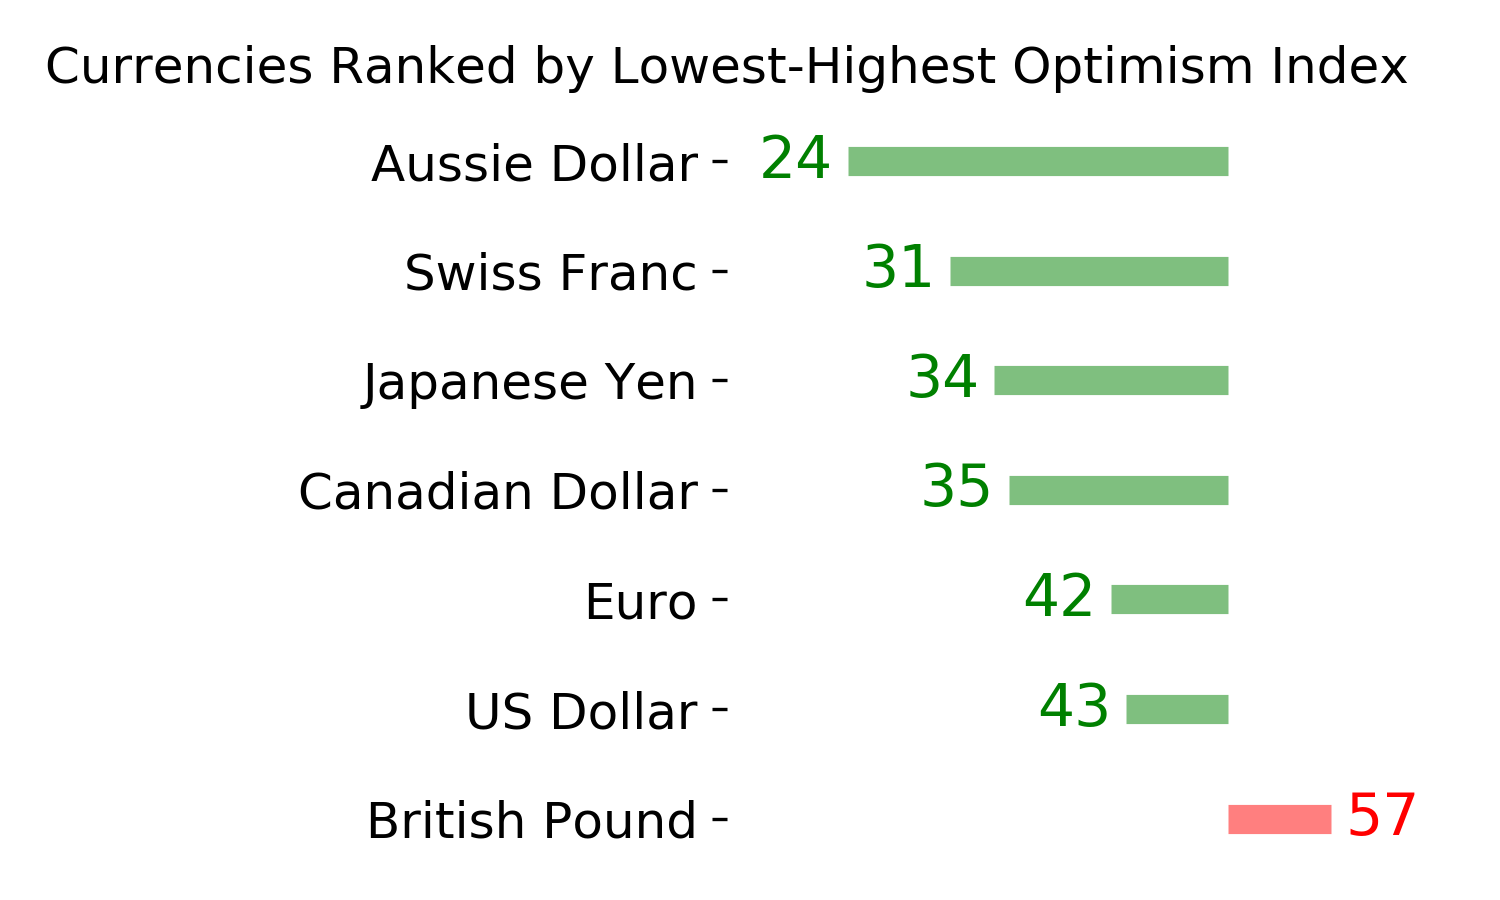
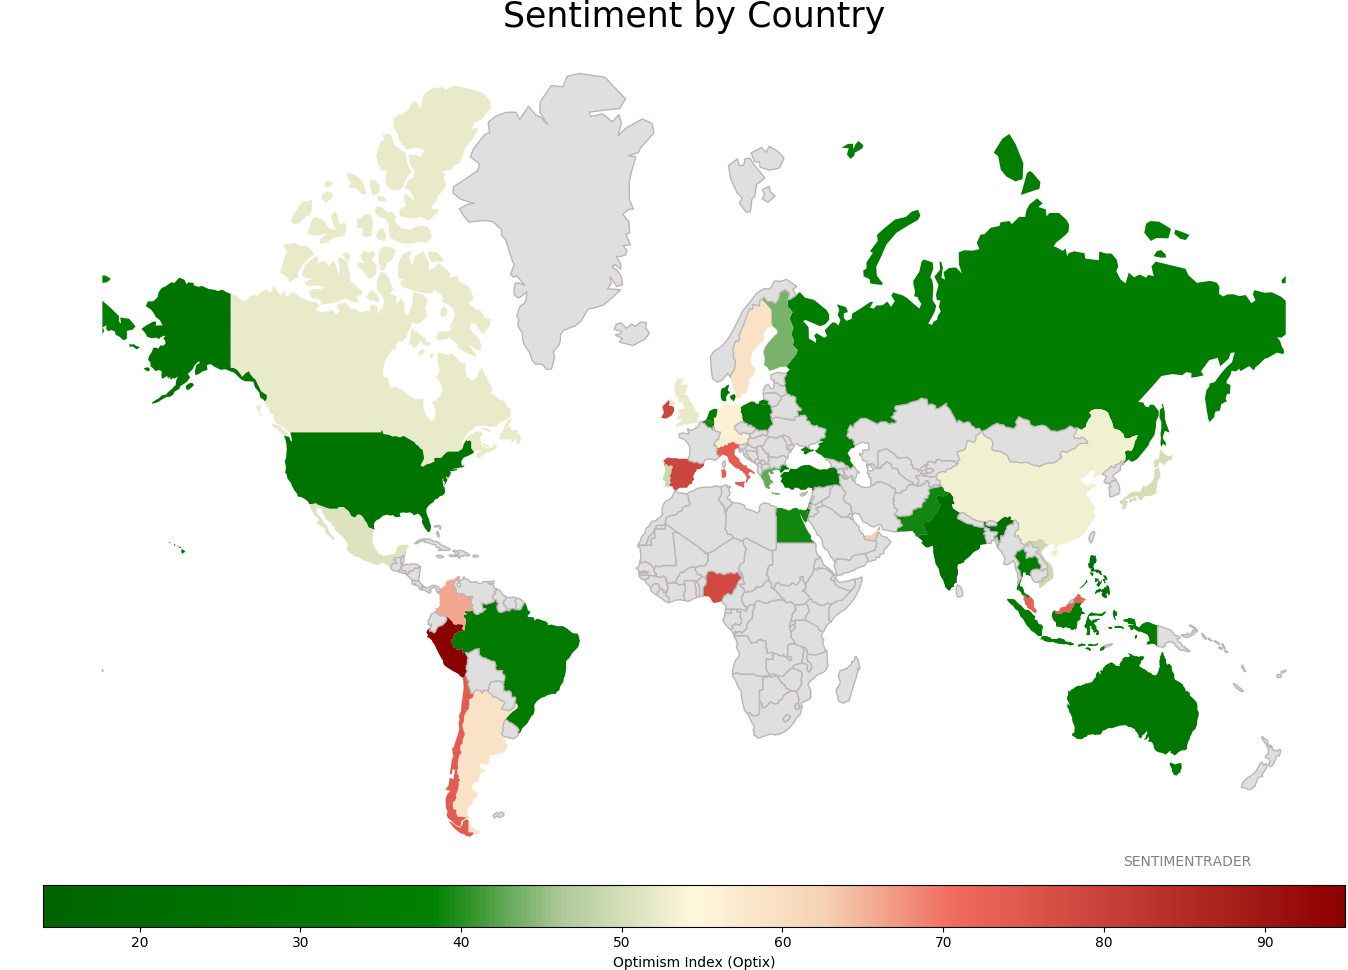
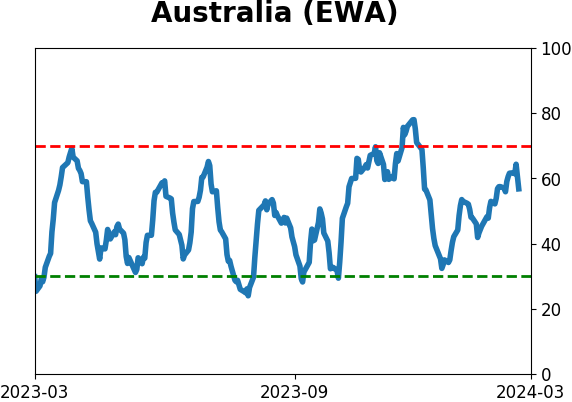
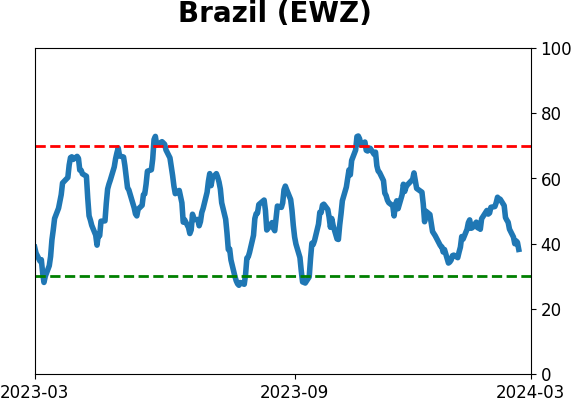
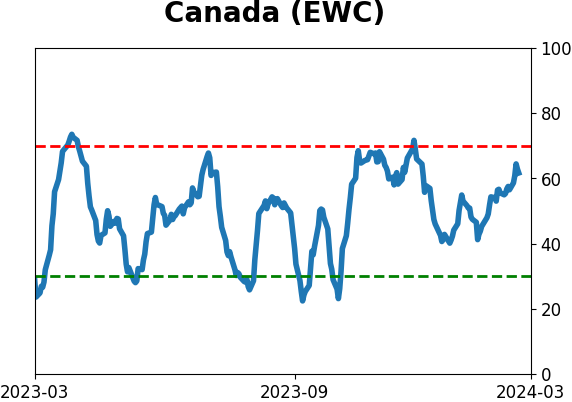
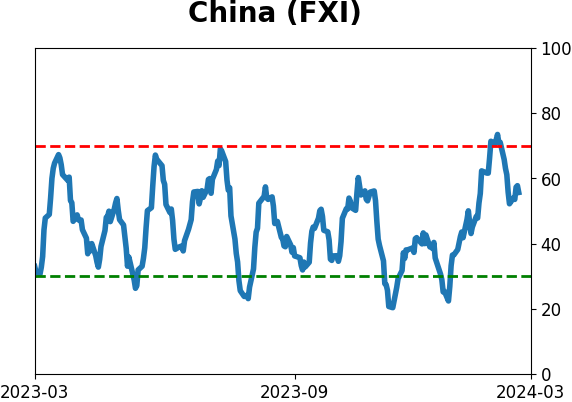
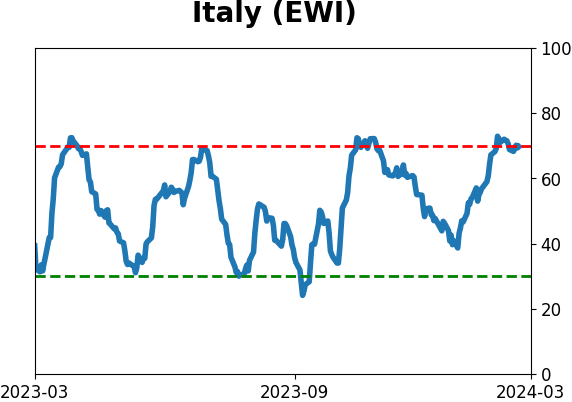
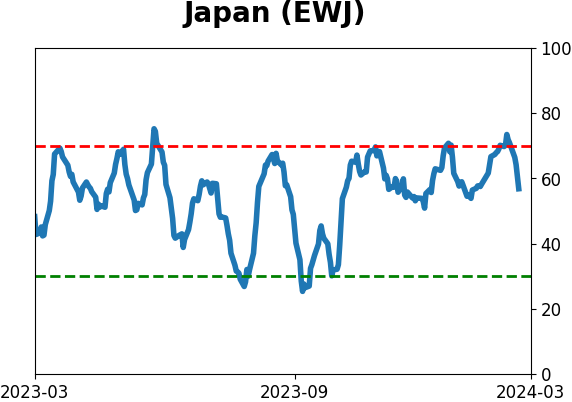
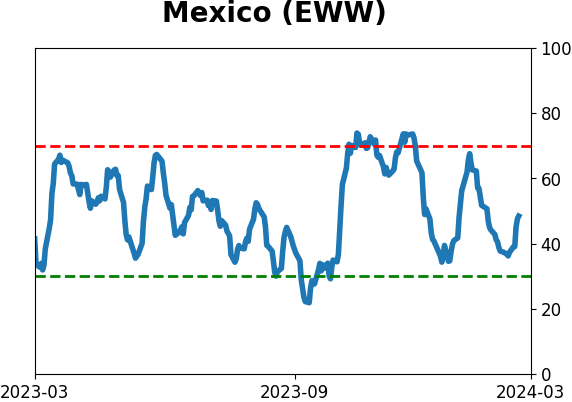
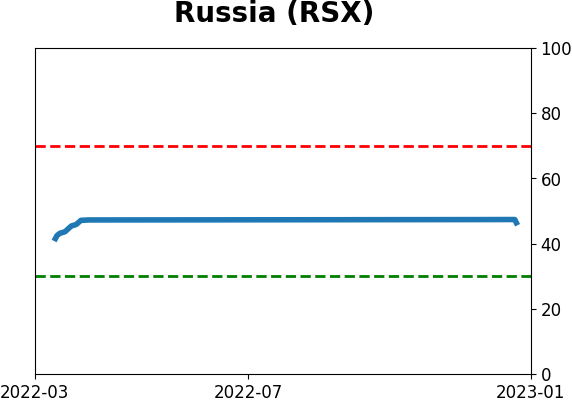
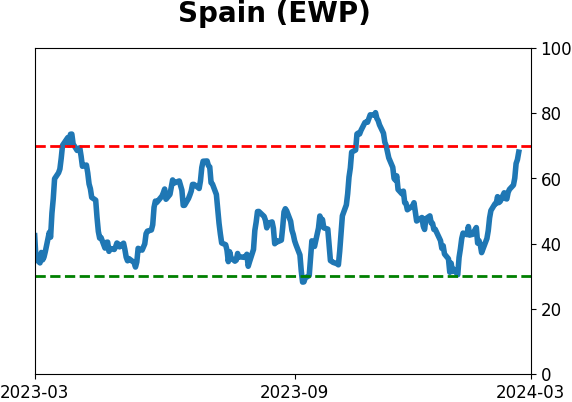
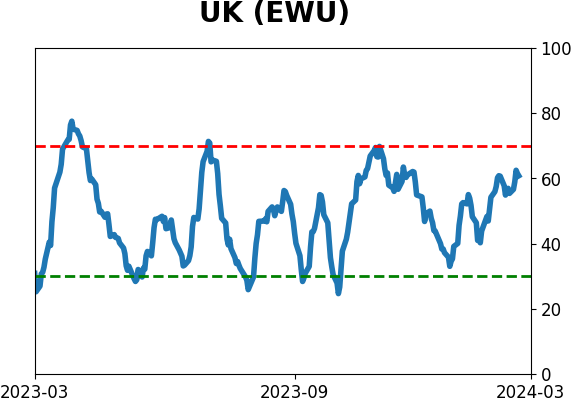
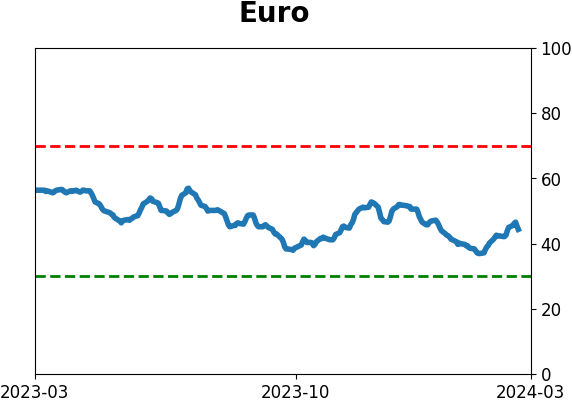
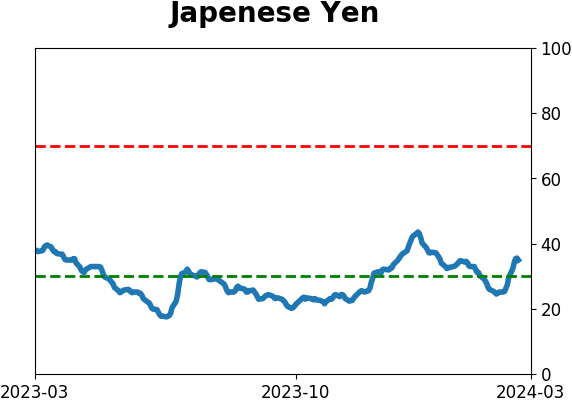
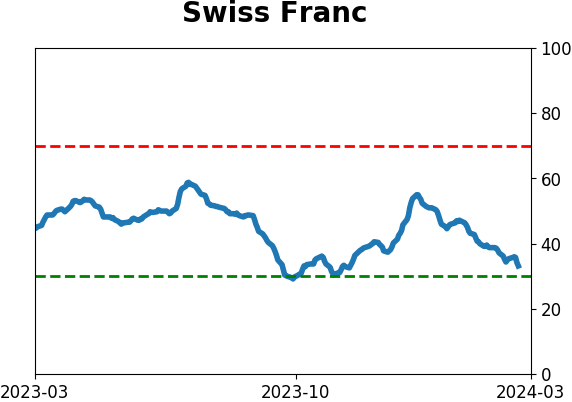
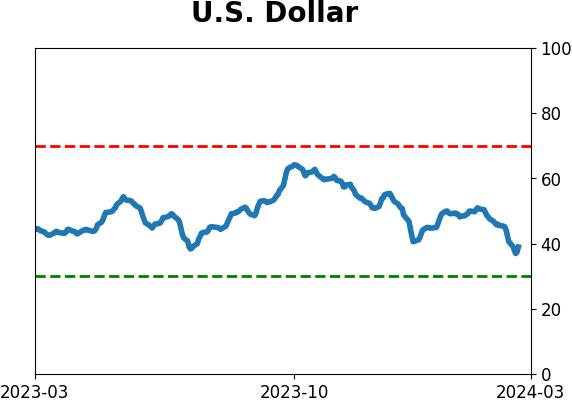
Sentiment Around The World
|
|
|
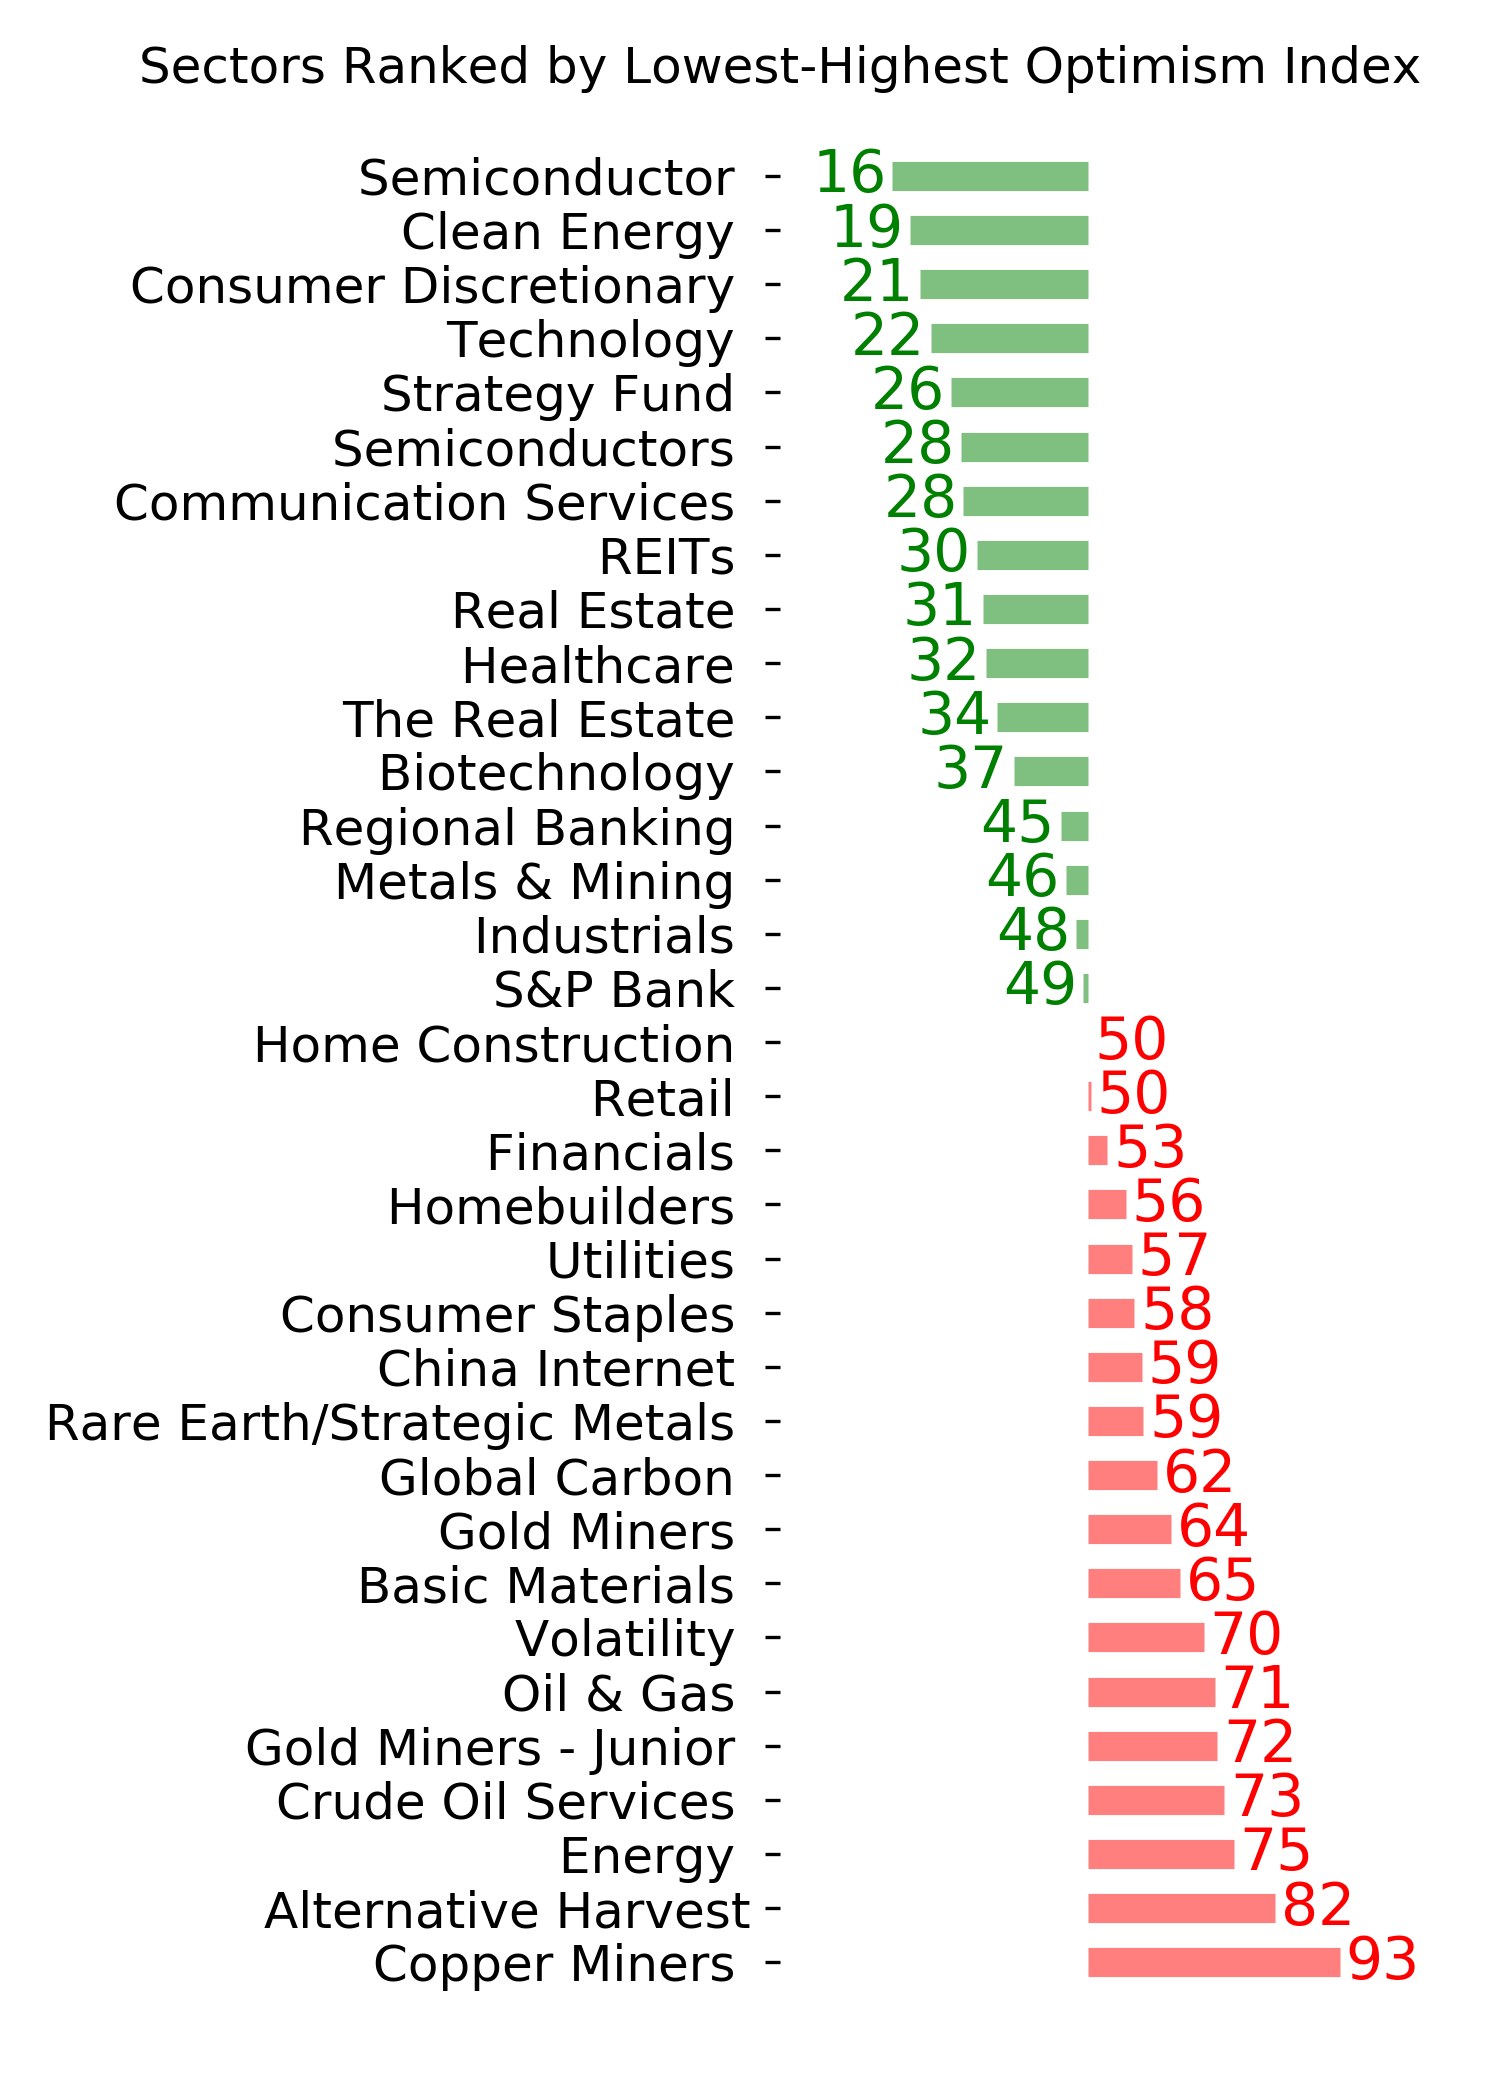
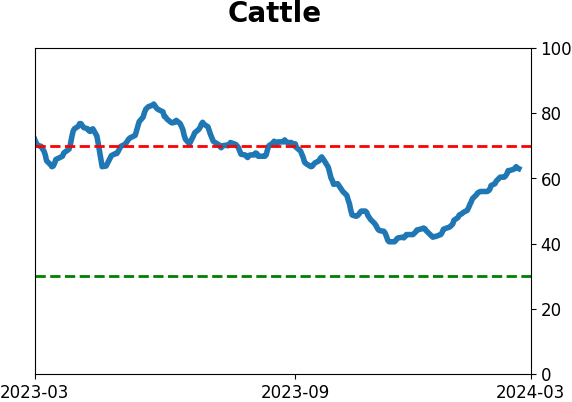
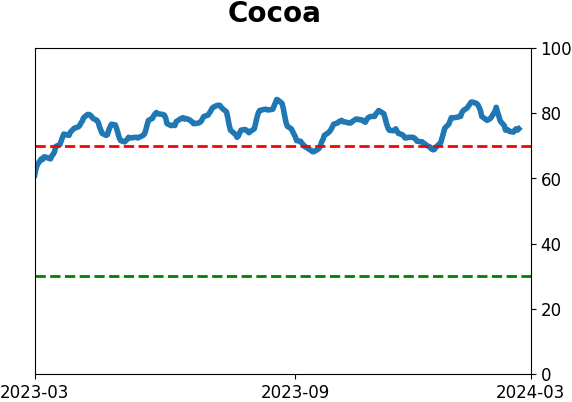
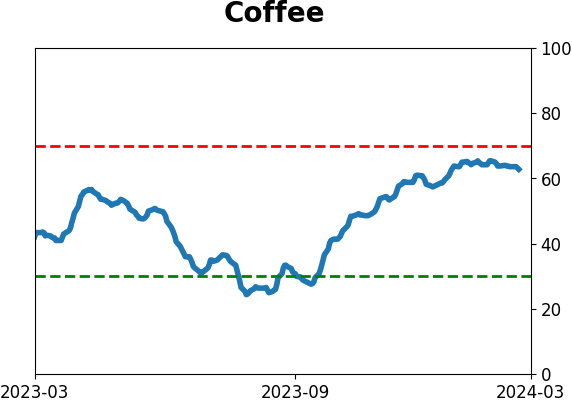
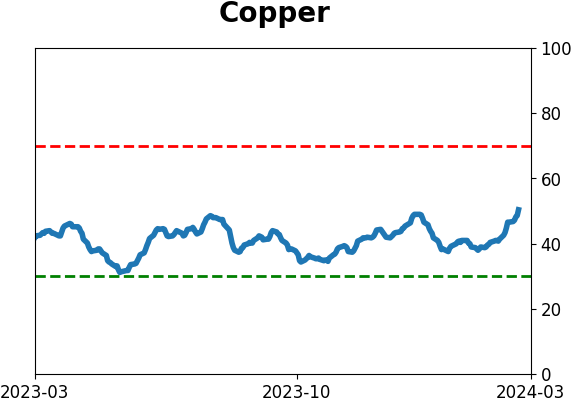
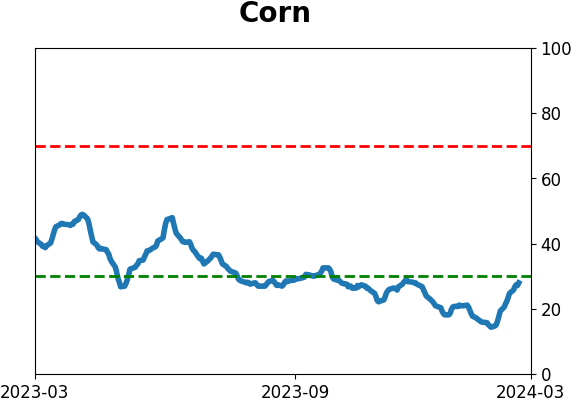
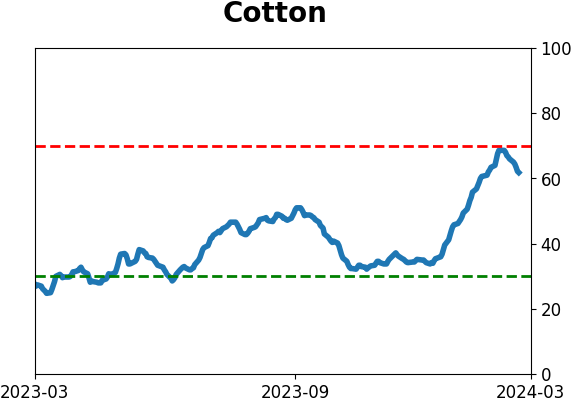
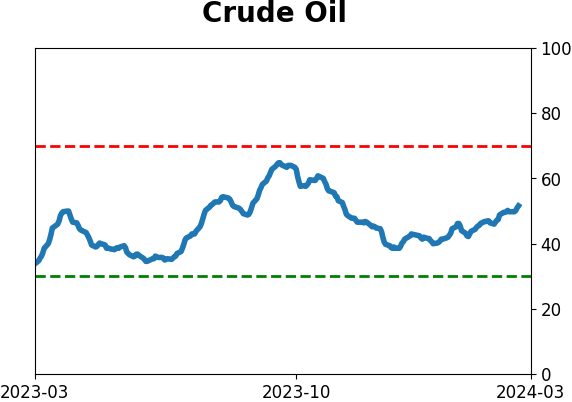
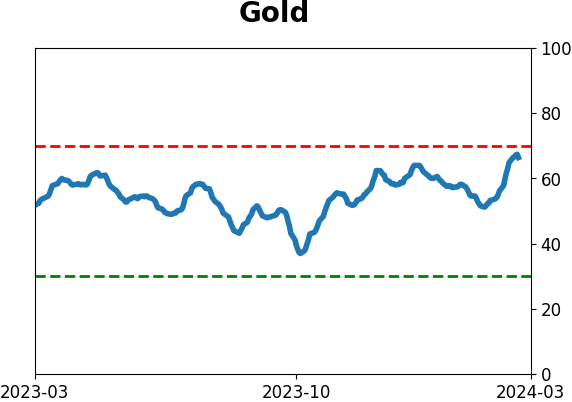
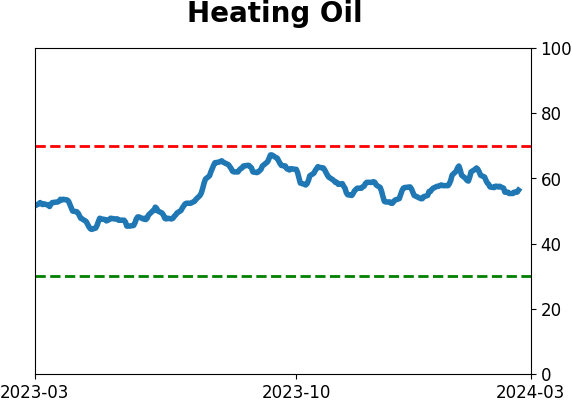
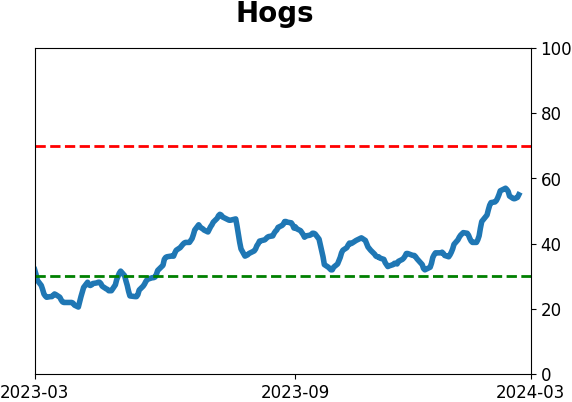
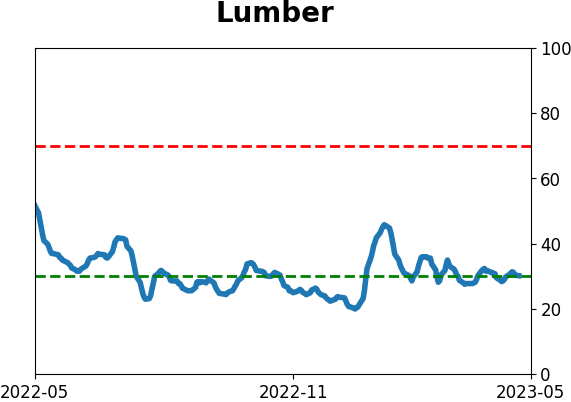
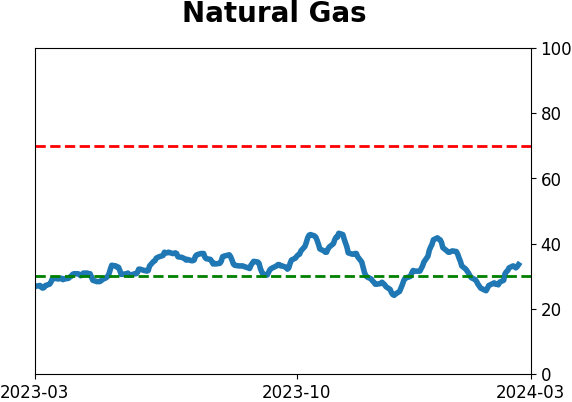
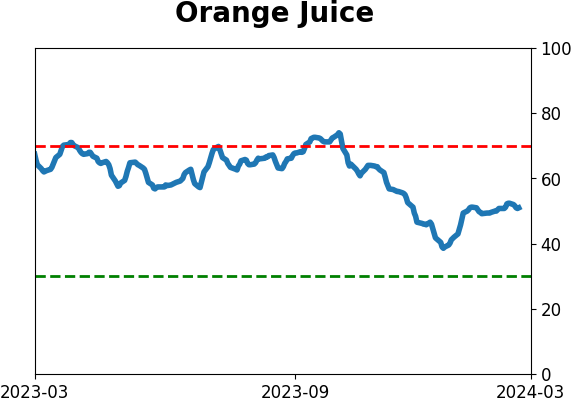
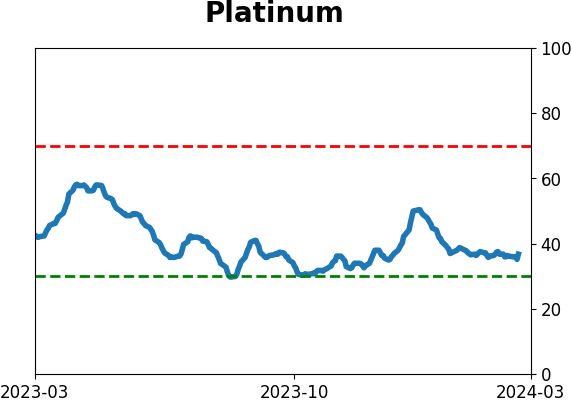
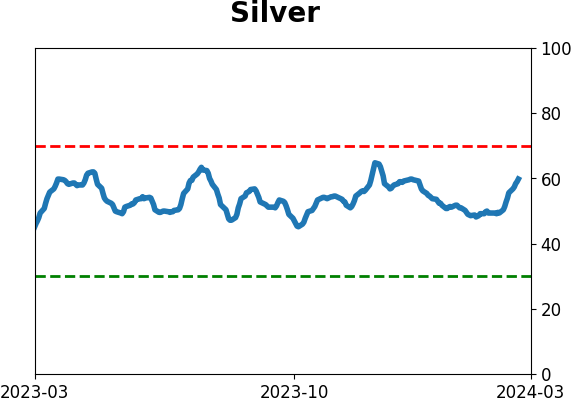
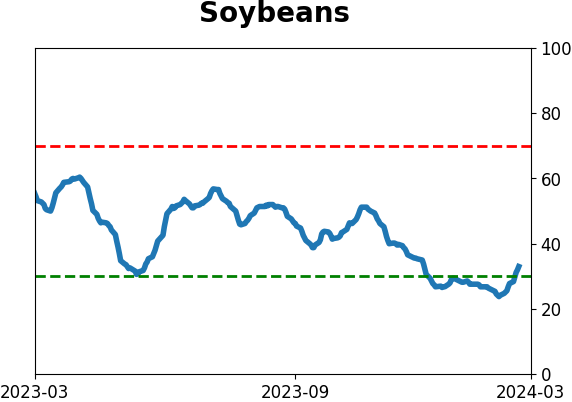
Optimism Index Thumbnails
|
|
|
|
|
|
|
|
|
|
|
|
|
|
|
|
|
|
|
|
|