Headlines
|
|
The Typical Sentiment Cycle shows panic is rising:
Based on an objective comparison to a Typical Sentiment Cycle, there is a better than 75% probability that we're now in the panic phase of the cycle. During non-recessionary periods, this has coincided with good (not great) forward returns for stocks.
|
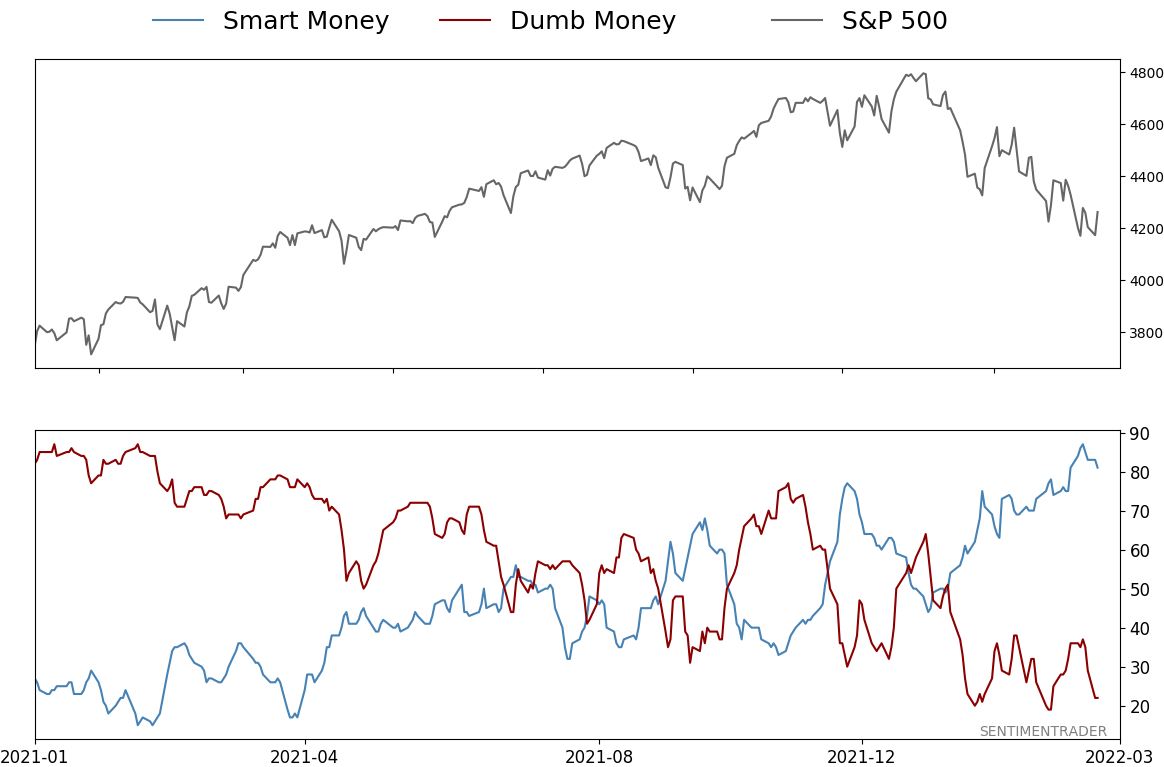
Smart / Dumb Money Confidence
|
Smart Money Confidence: 81%
Dumb Money Confidence: 22%
|
|
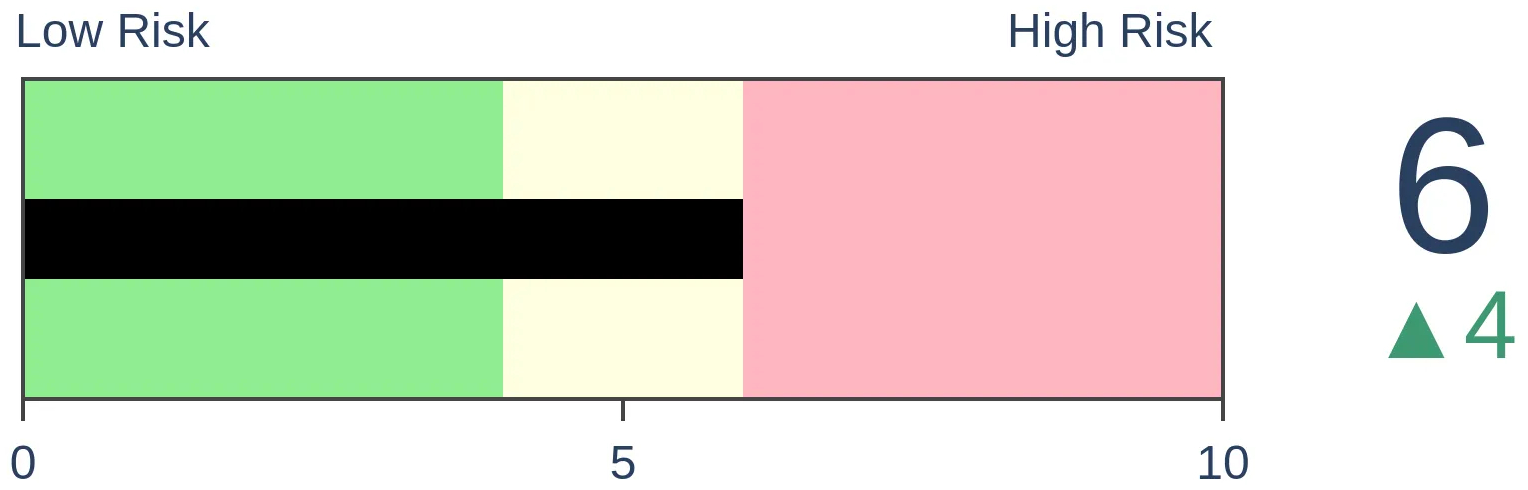
Risk Levels
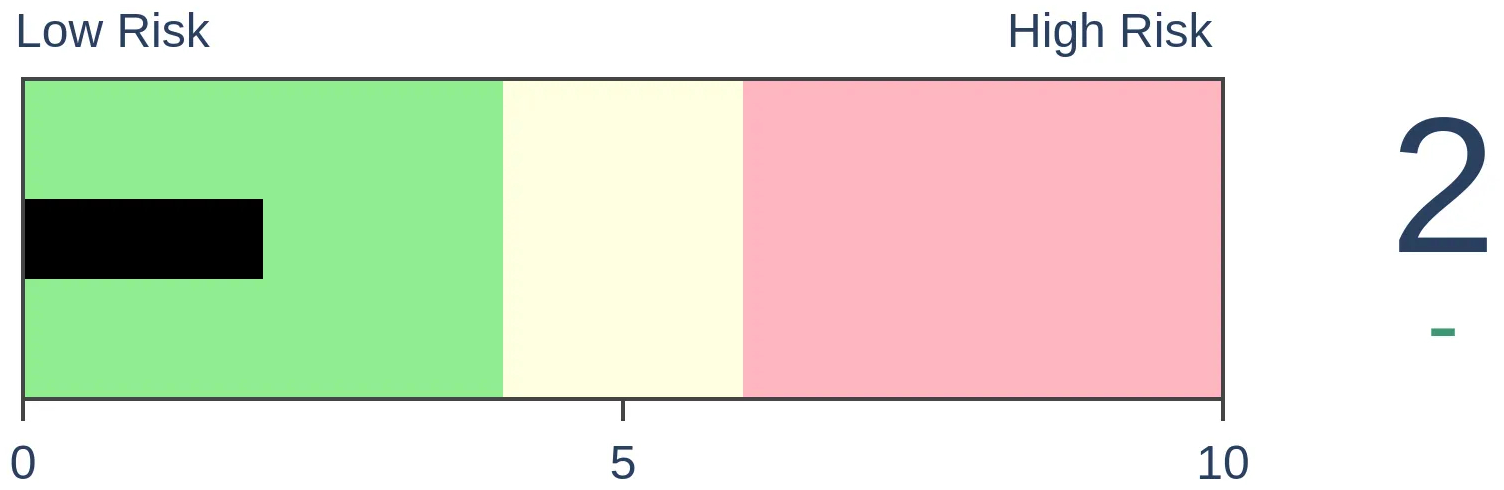
Stocks Short-Term
|
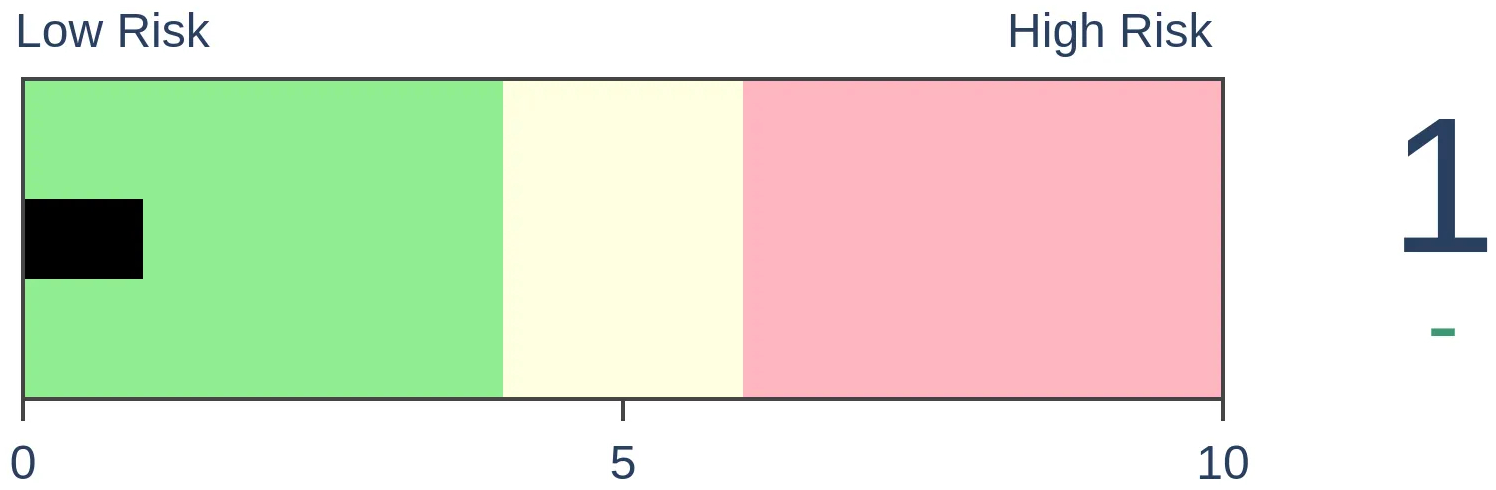
Stocks Medium-Term
|
|
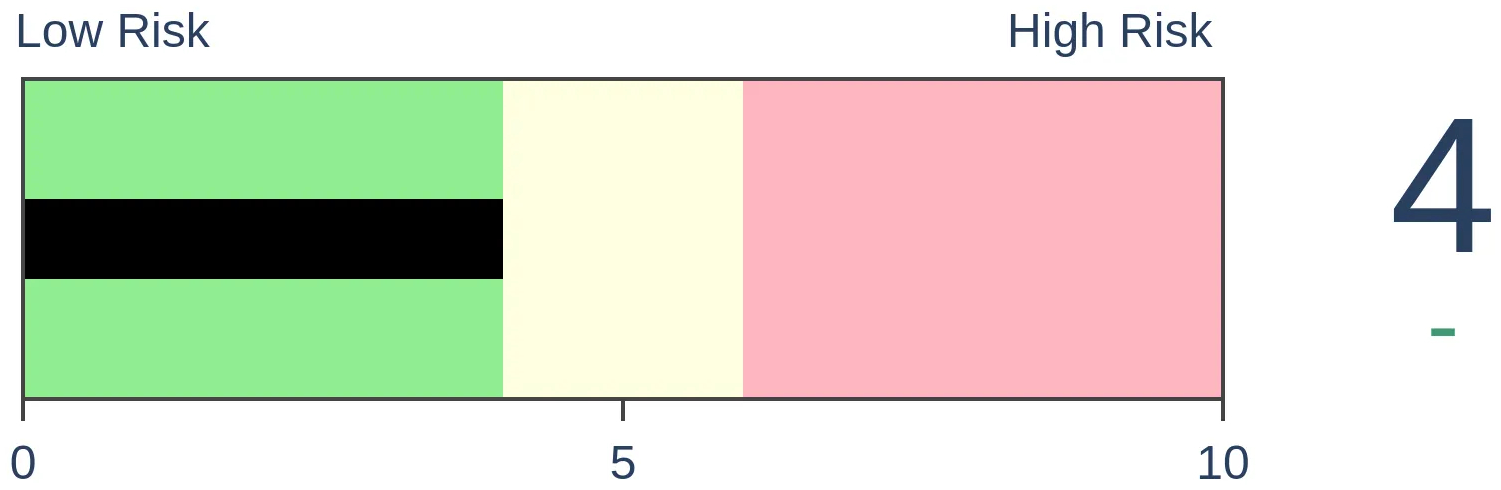
Bonds
|
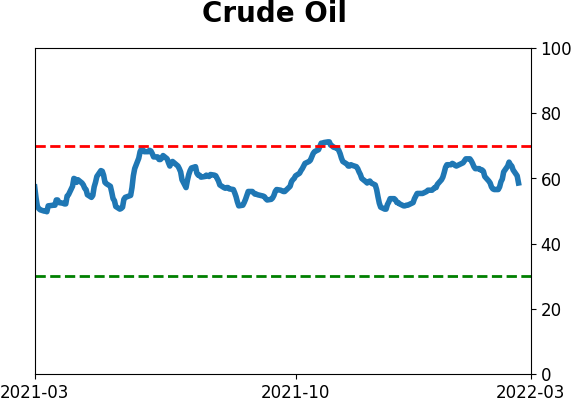
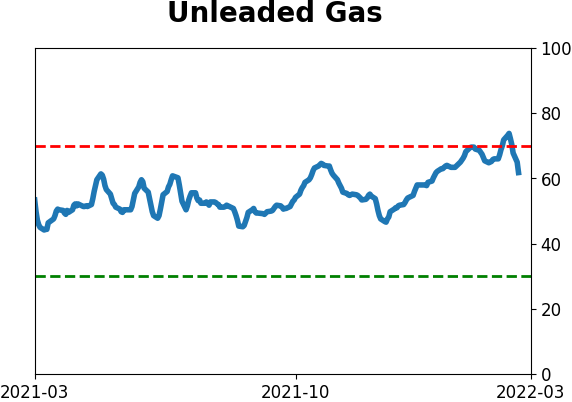
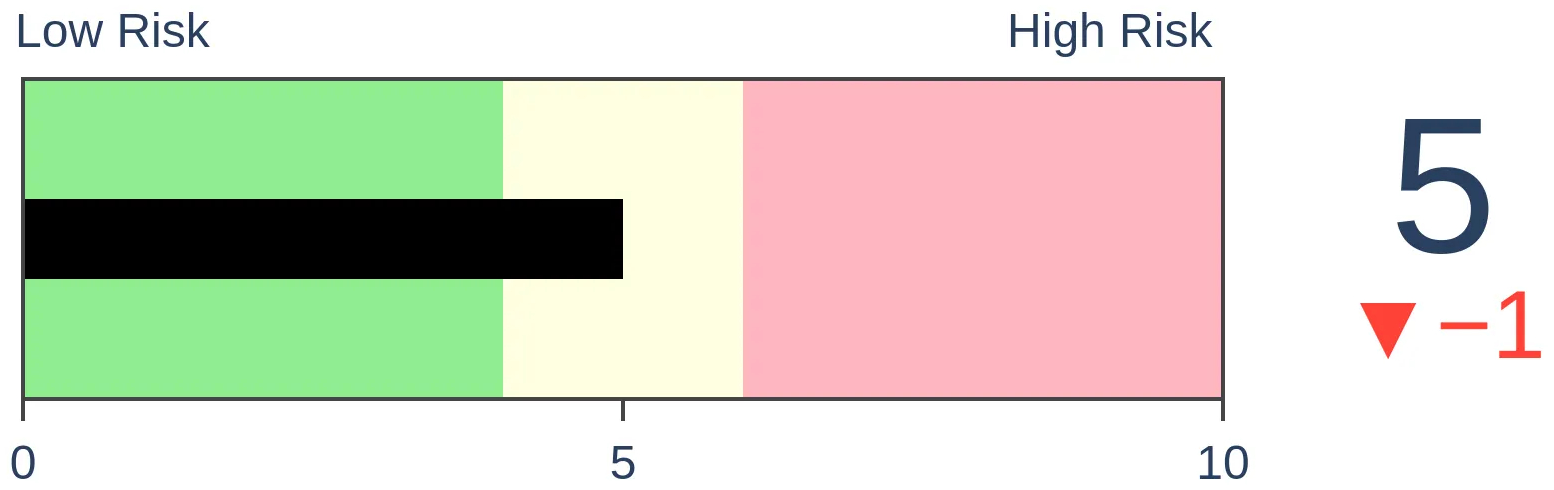
Crude Oil
|
|
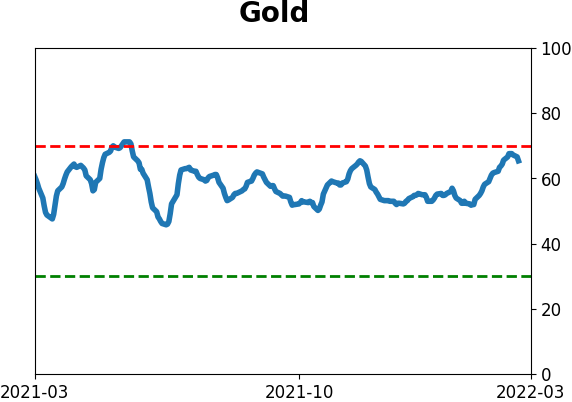
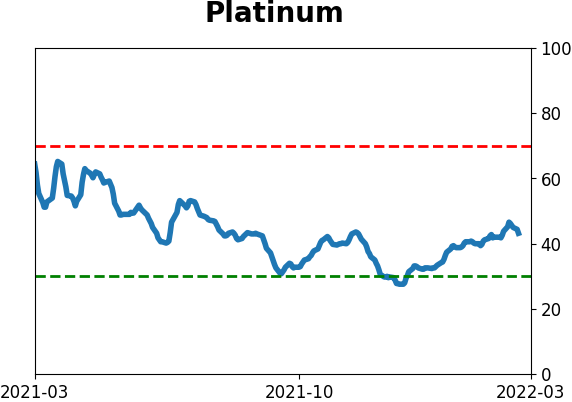
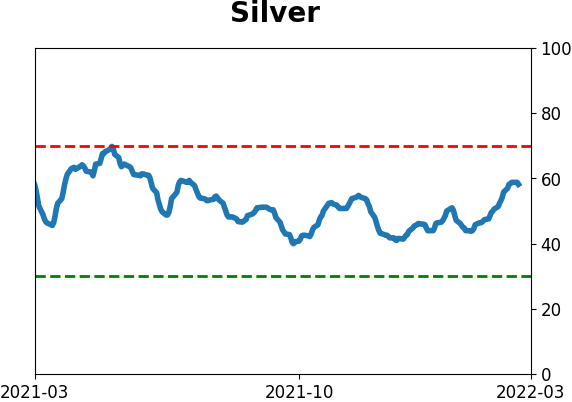
Gold
|
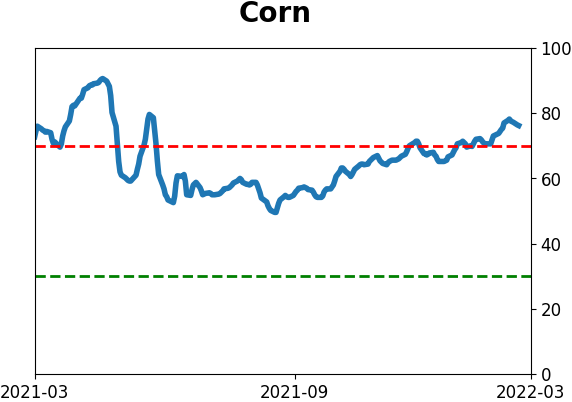
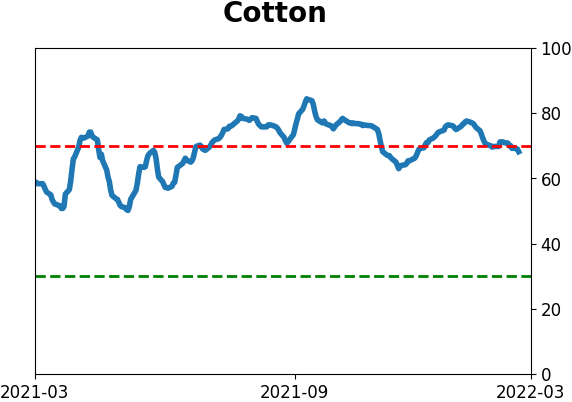
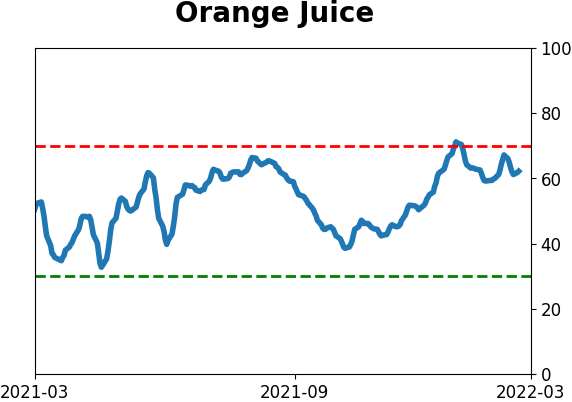
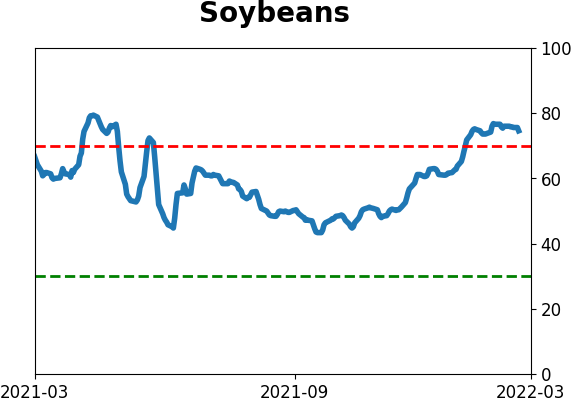
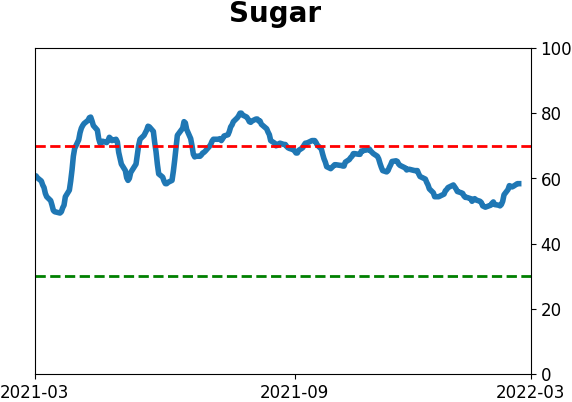
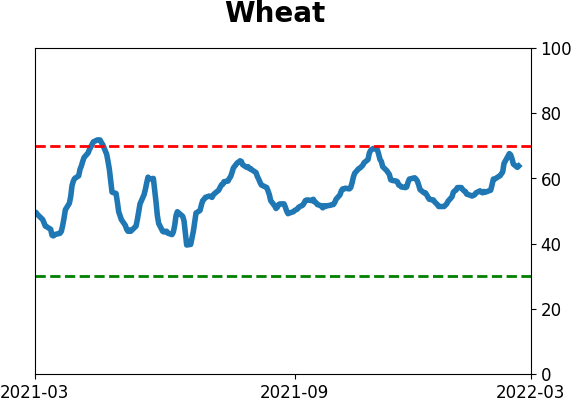
Agriculture

|
|
Research
By Jason Goepfert
BOTTOM LINE
Based on an objective comparison to a Typical Sentiment Cycle, there is a better than 75% probability that we're now in the panic phase of the cycle. During non-recessionary periods, this has coincided with good (not great) forward returns for stocks.
FORECAST / TIMEFRAME
None
|
Key points:
- Based on a Typical Sentiment Cycle, we've entered the panic phase
- There is a nearly 80% probability we've entered that part of the cycle
- Other moves into that phase during non-recessionary periods typically preceded good returns for stocks
A Typical Sentiment Cycle
Last September, we looked at how correlated the price action was to the four major parts of a Typical Sentiment Cycle. It proved to be a decent guide to likely future returns, based on how investors often behave at various points in the cycle.
A popular heuristic uses some version of the Cycle popularized by Justin Mamis in his 1999 book, The Nature of Risk. The Mamis chart encompasses the price path of U.S. stocks from roughly May 1990 through March 1991.
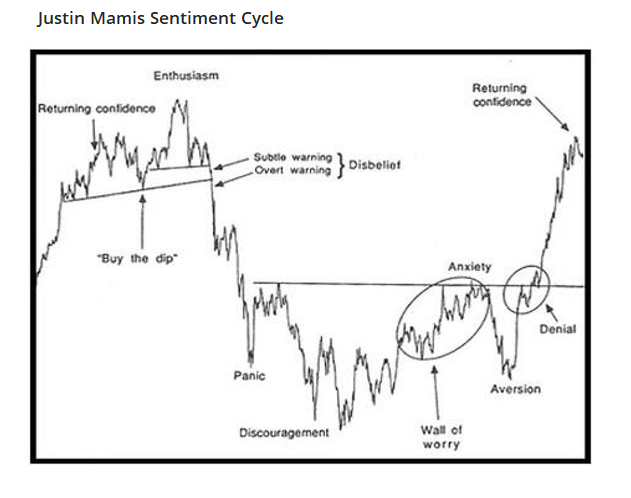
There are essentially 4 major parts to the cycle:
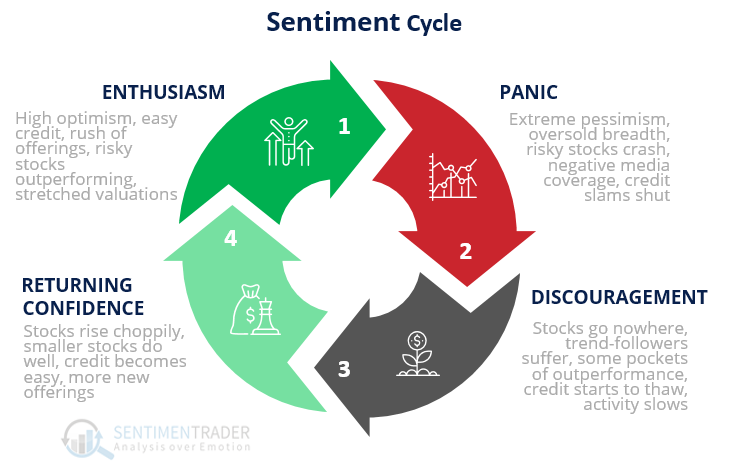
1. Enthusiasm - High optimism, easy credit, a rush of offerings, risky stocks outperforming, stretched valuations
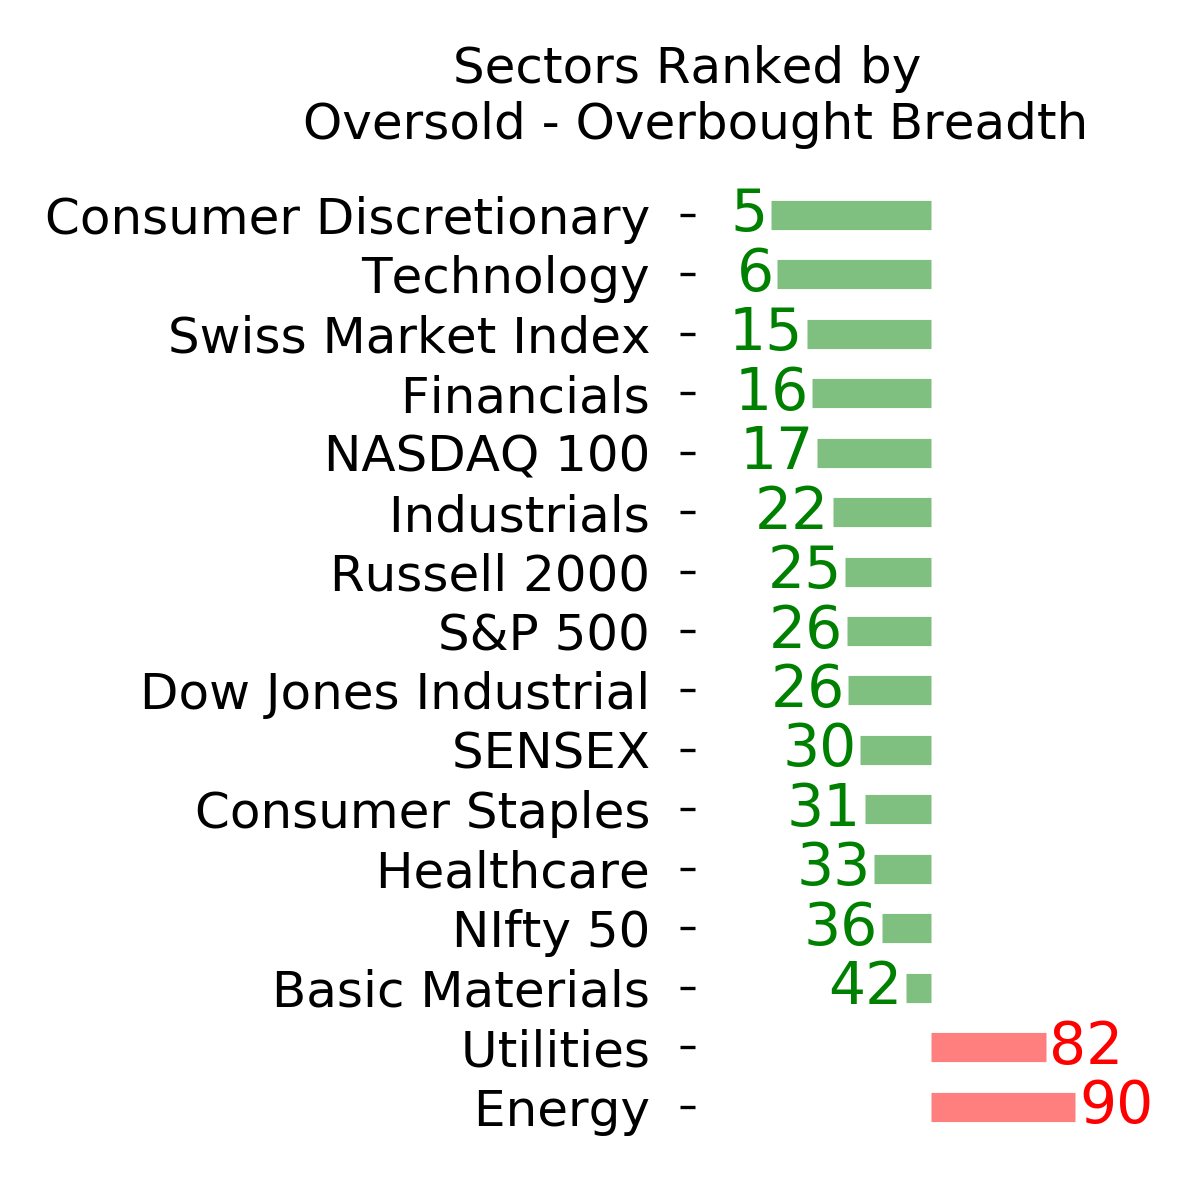
2. Panic - Extreme pessimism, oversold breadth, risky stocks crash, negative media coverage, credit slams shut
3. Discouragement - Stocks go nowhere, trend-followers suffer, some pockets of outperformance, credit starts to thaw, activity slows
4. Returning Confidence - Stocks rise choppily, smaller stocks do well, credit becomes easy, more new offerings
Where we are now - panic
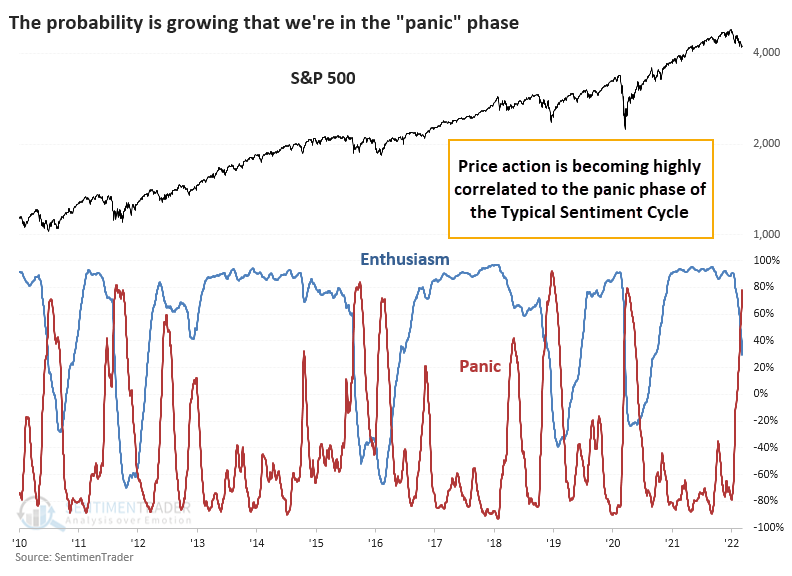
Instead of eyeballing things, we can compare recent market activity to various parts of the Typical Sentiment Cycle and see how investors are behaving relative to an "ideal" cycle. Based on that analysis, they're panicking. The S&P 500's price action just climbed above a 75% correlation to the panic phase.
With Monday's session being one of the most atrocious across most markets in months, this is going to rise even quicker into panic territory.
After the probability of being in the "panic" phase rose above 75% for the first time in at least a year, the S&P 500 performed okay. It did quite a bit better if the U.S. economy was not in a recession at the time. While economists will argue about whether we're about to fall into one (war, unfriendly Fed, spiking commodities, isolationist trade policies, near-inverted yield curve), it's virtually impossible that the NBER will declare that we're in one right now.
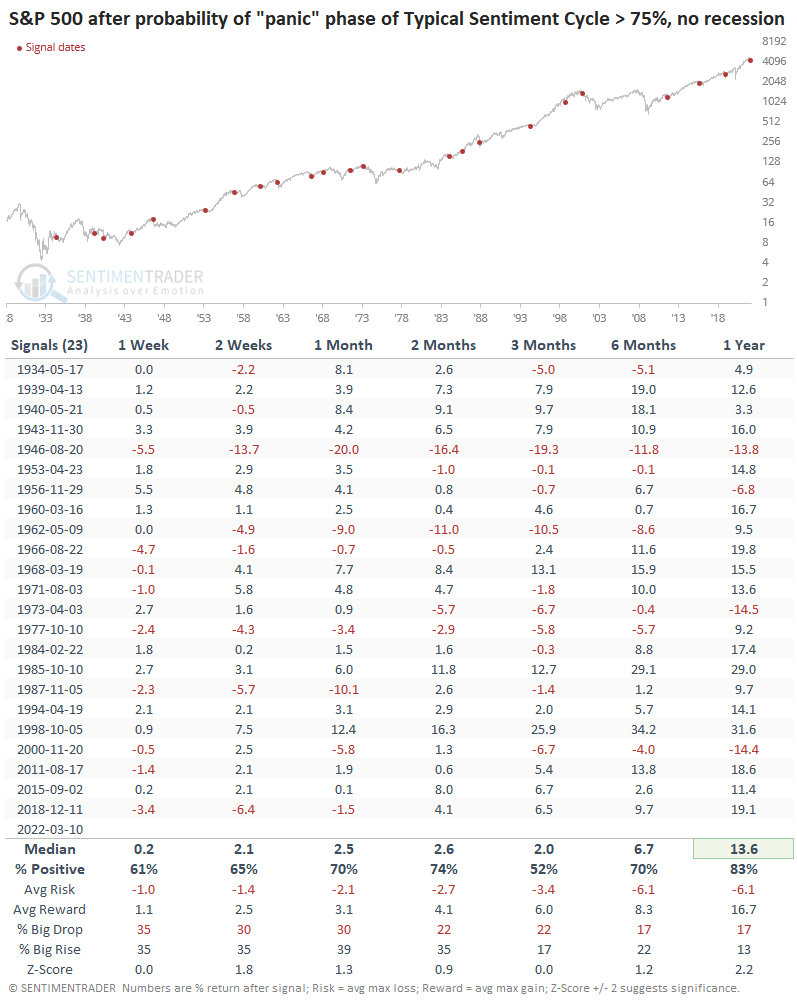
The entry into the panic phase of the cycle didn't mean that stocks rebounded quickly and sustainably every time. It preceded quick double-digit losses in 1946, 1962, 1987, and 2018. But, overall, reward exceeded risk, and the probability of a big rise exceeded that of a big drop. Just not by as much as we'd like to see to consider it an edge.
What the research tells us...
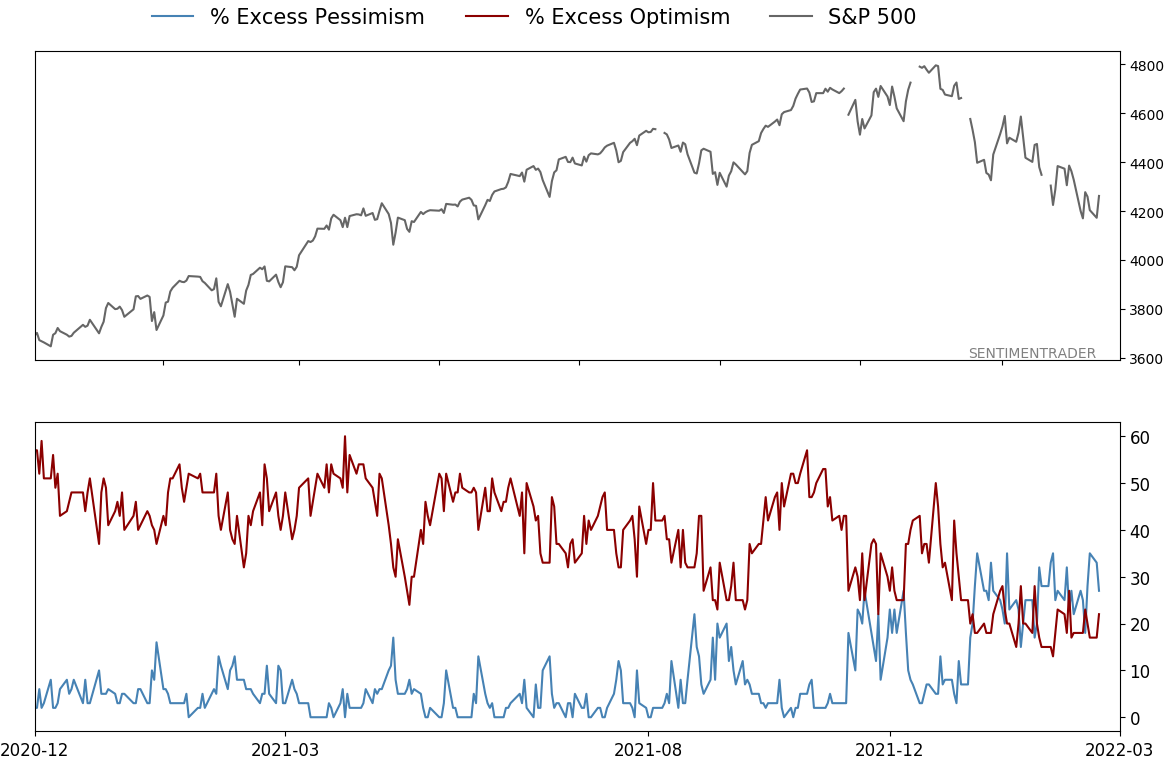
Based on a multitude of sentiment guides and price action itself, it's clear that investors are pessimistic at best and on the verge of outright panic. To see a multi-week to multi-month rebound, it's not necessary to witness a final flush that finally triggers panic selling, though it would be easier to make that case if we do get some true readings showing whites-of-their-eyes kinds of washouts.
Active Studies
| Time Frame | Bullish | Bearish | | Short-Term | 4 | 0 | | Medium-Term | 22 | 2 | | Long-Term | 15 | 5 |
|
Indicators at Extremes
Portfolio
| Position | Description | Weight % | Added / Reduced | Date | | Stocks | RSP | 21.4 | Added 10.2% | 2022-01-28 | | Bonds | 32.7% BND, 7.1% SCHP | 40.1 | Added 8.3% | 2021-10-26 | | Commodities | GCC | 2.4 | Reduced 2.1%
| 2020-09-04 | | Precious Metals | GDX | 4.6 | Reduced 4.2% | 2021-05-19 | | Special Situations | 7.6% KWEB, 4.9% XBI, 3.7% XLE, 1.8% PSCE | 18.0 | Added 4.6% | 2022-02-24 | | Cash | | 13.2 | | |
|
Updates (Changes made today are underlined)
With a typical time frame of several months in this account, I normally don't make changes so quickly. I've added back part of the stock exposure I took off earlier in January due to the washed-out conditions and extreme pessimism we're seeing across a wide array of metrics. The biggest issue is that the environment is unhealthy and we could be in the throes of a protracted bear market. Even so, the readings we've seen recently have a good record at preceding relief rallies, so we'll have to see how that pans out. Bond sentiment is trying to recover from a recent bout of pessimism, and gold stocks are doing their thing which is not much at all. They've been flat for six months. Chinese tech stocks were doing exactly what they're supposed to do, then did *not* by plunging to new lows. This is troubling on a shorter-term time frame, but this was never meant for a trade, rather a multi-year investment. Recent behavior is troubling and I will not be adding any exposure as long as that's the case. RETURN YTD: -3.4% 2021: +8.7%, 2020: +8.1%, 2019: +12.6%, 2018: +0.6%, 2017: +3.8%, 2016: +17.1%, 2015: +9.2%, 2014: +14.5%, 2013: +2.2%, 2012: +10.8%, 2011: +16.5%, 2010: +15.3%, 2009: +23.9%, 2008: +16.2%, 2007: +7.8%
|
|
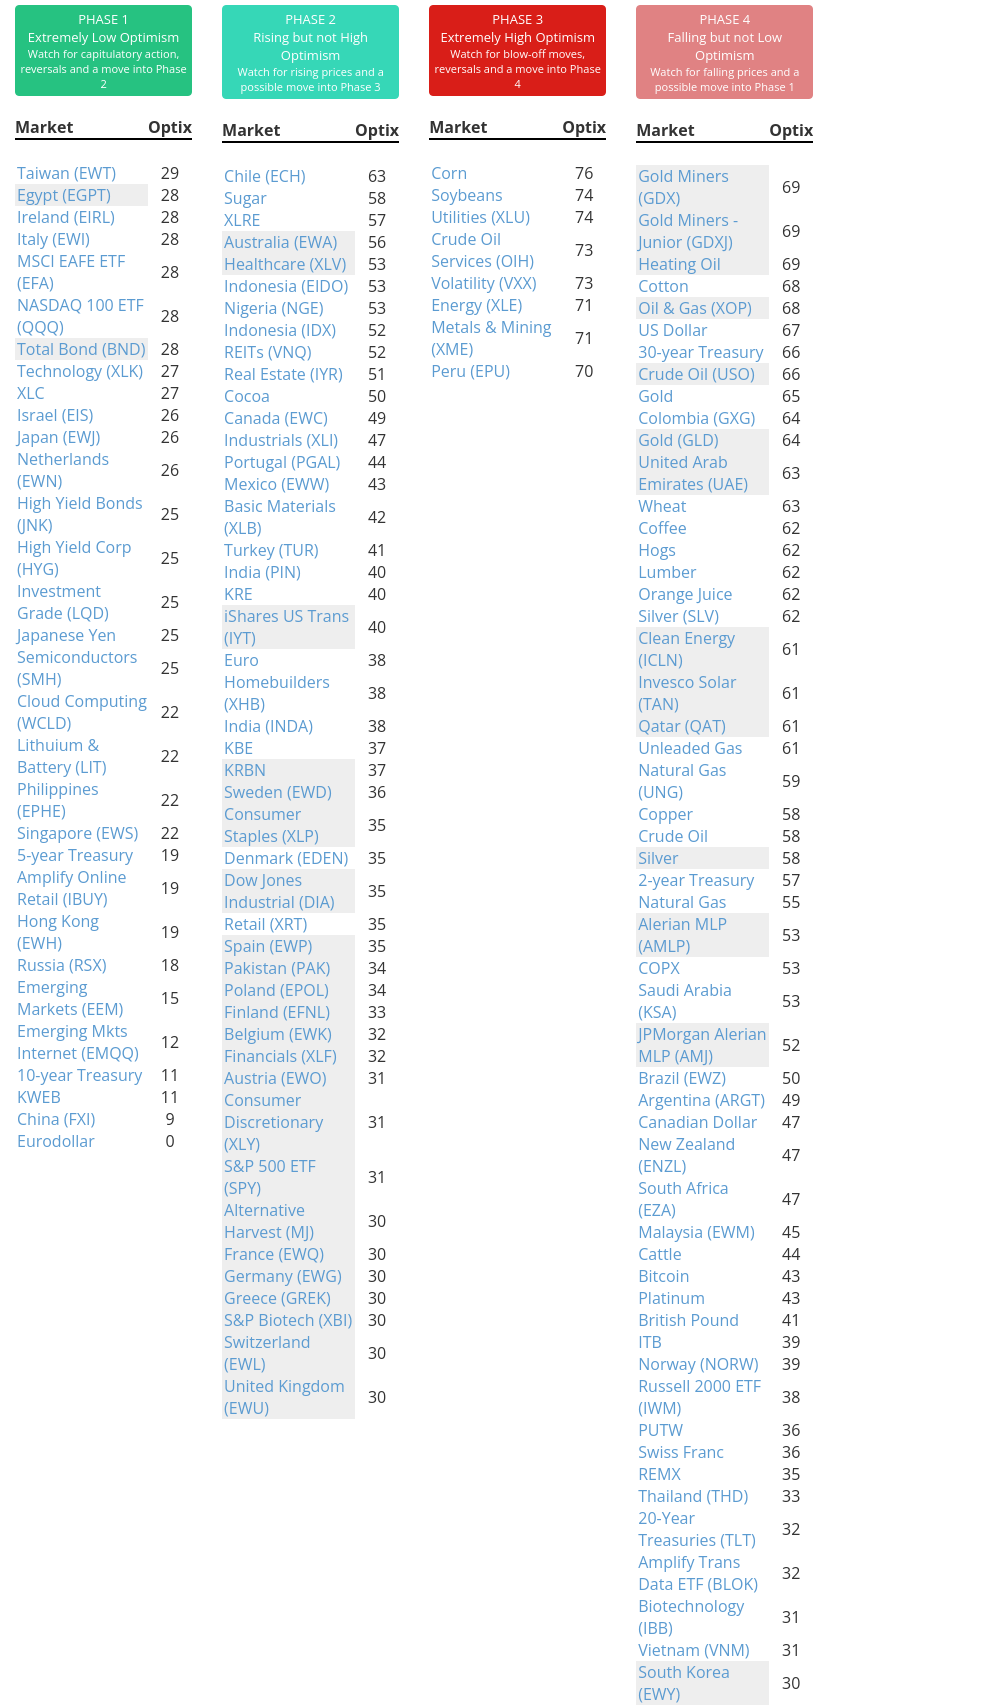
Phase Table
Ranks
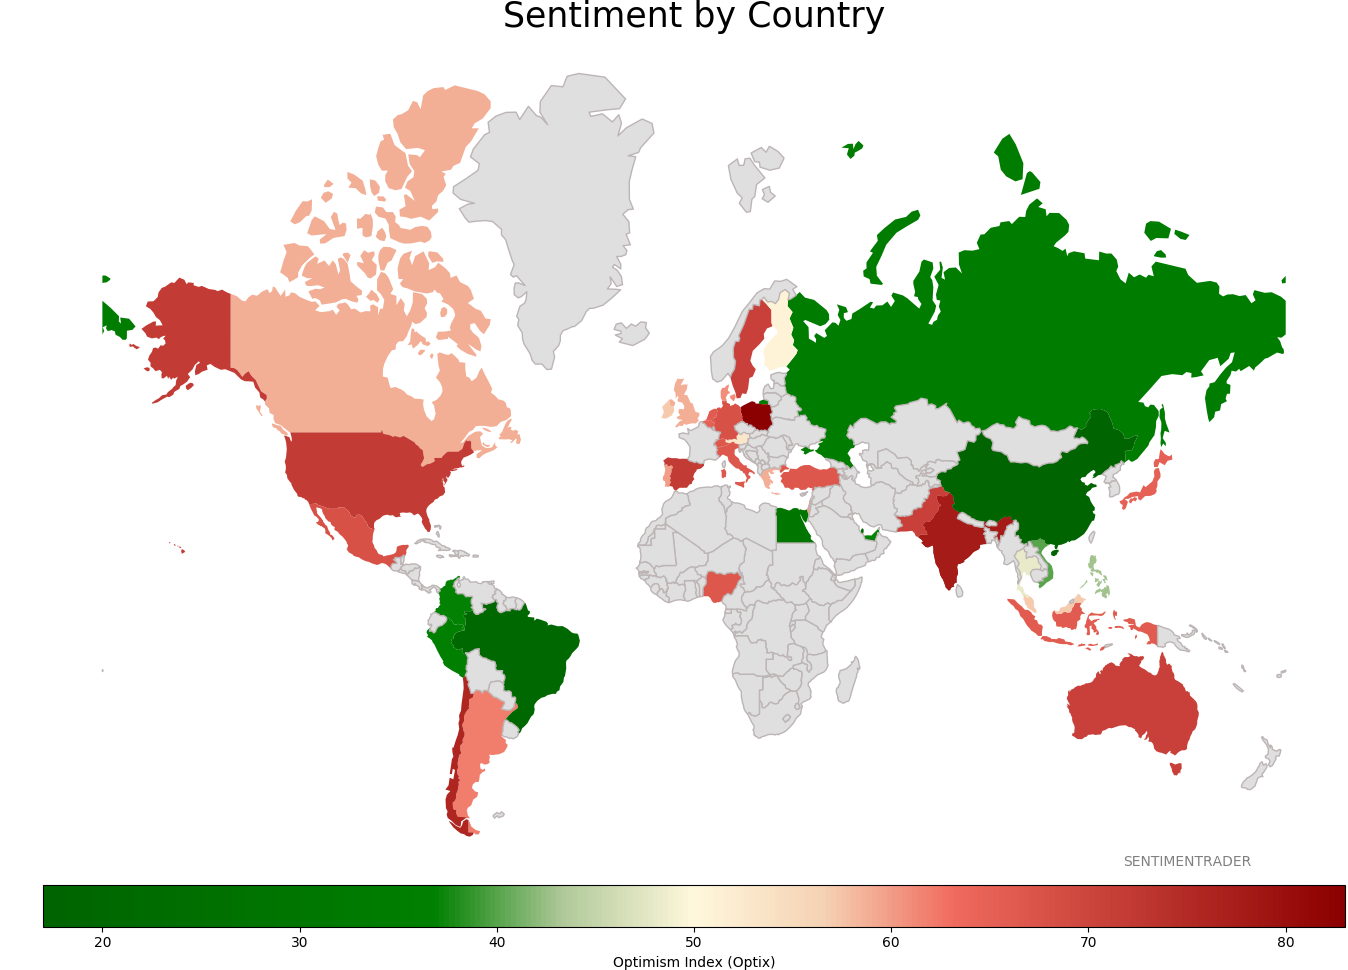
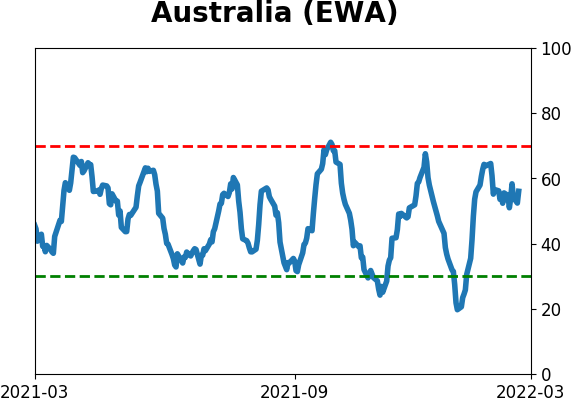
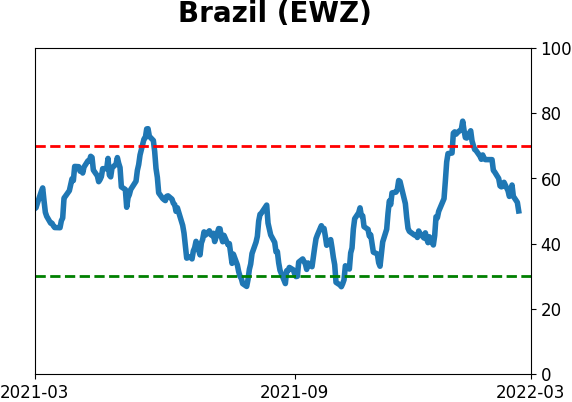
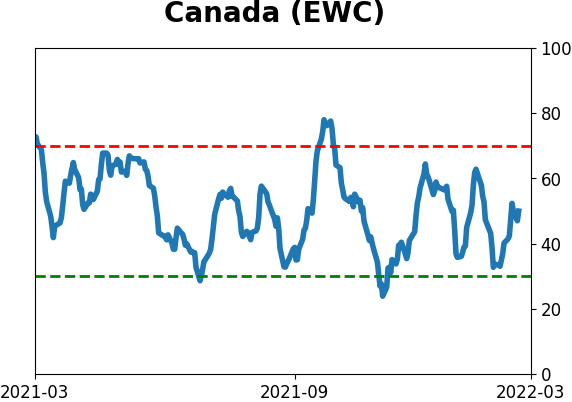
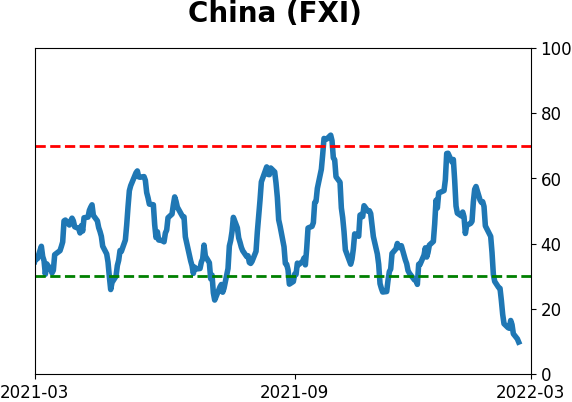
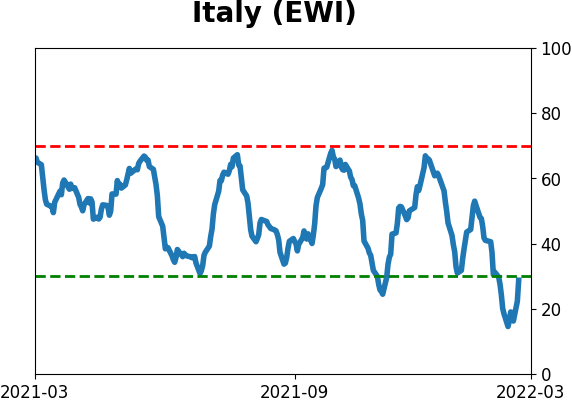
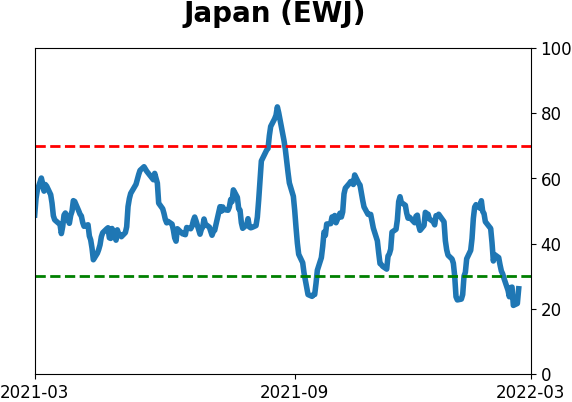
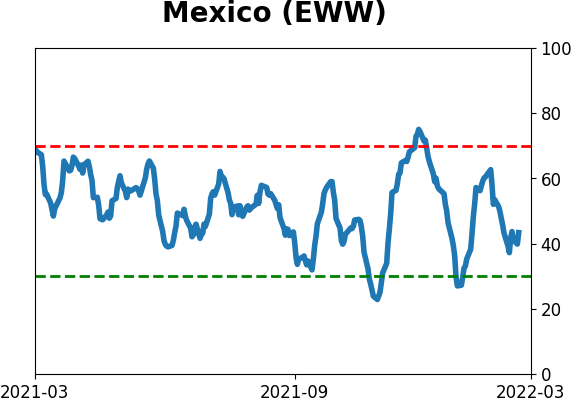
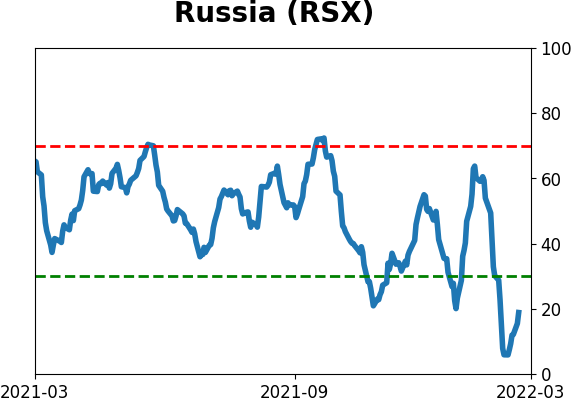
Sentiment Around The World
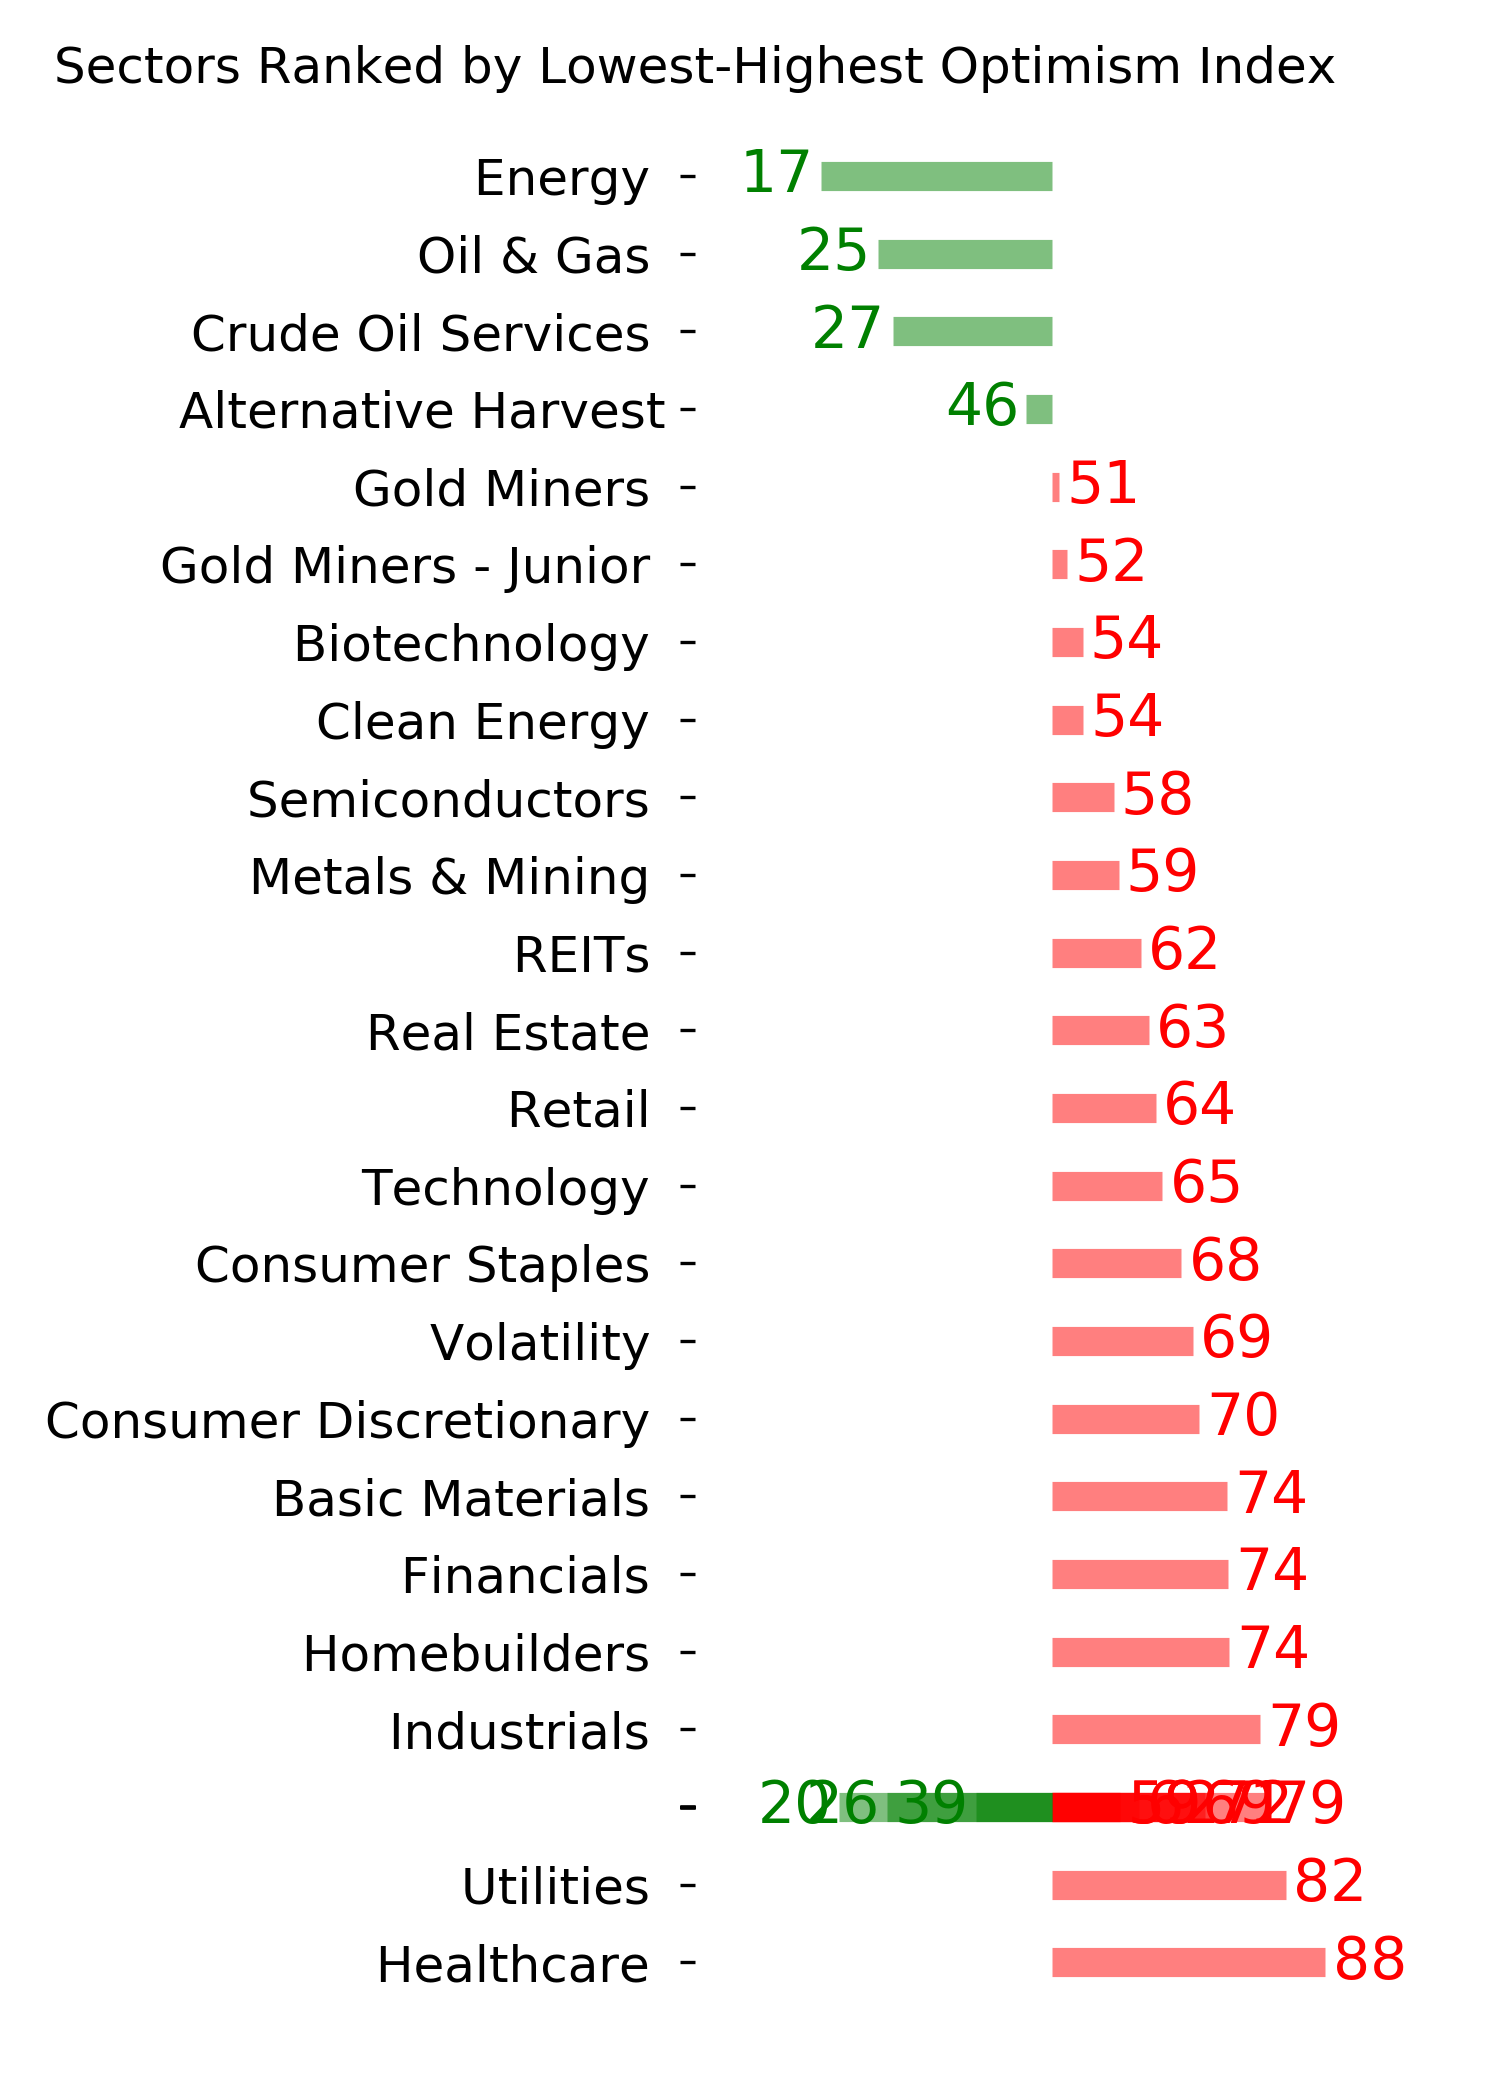
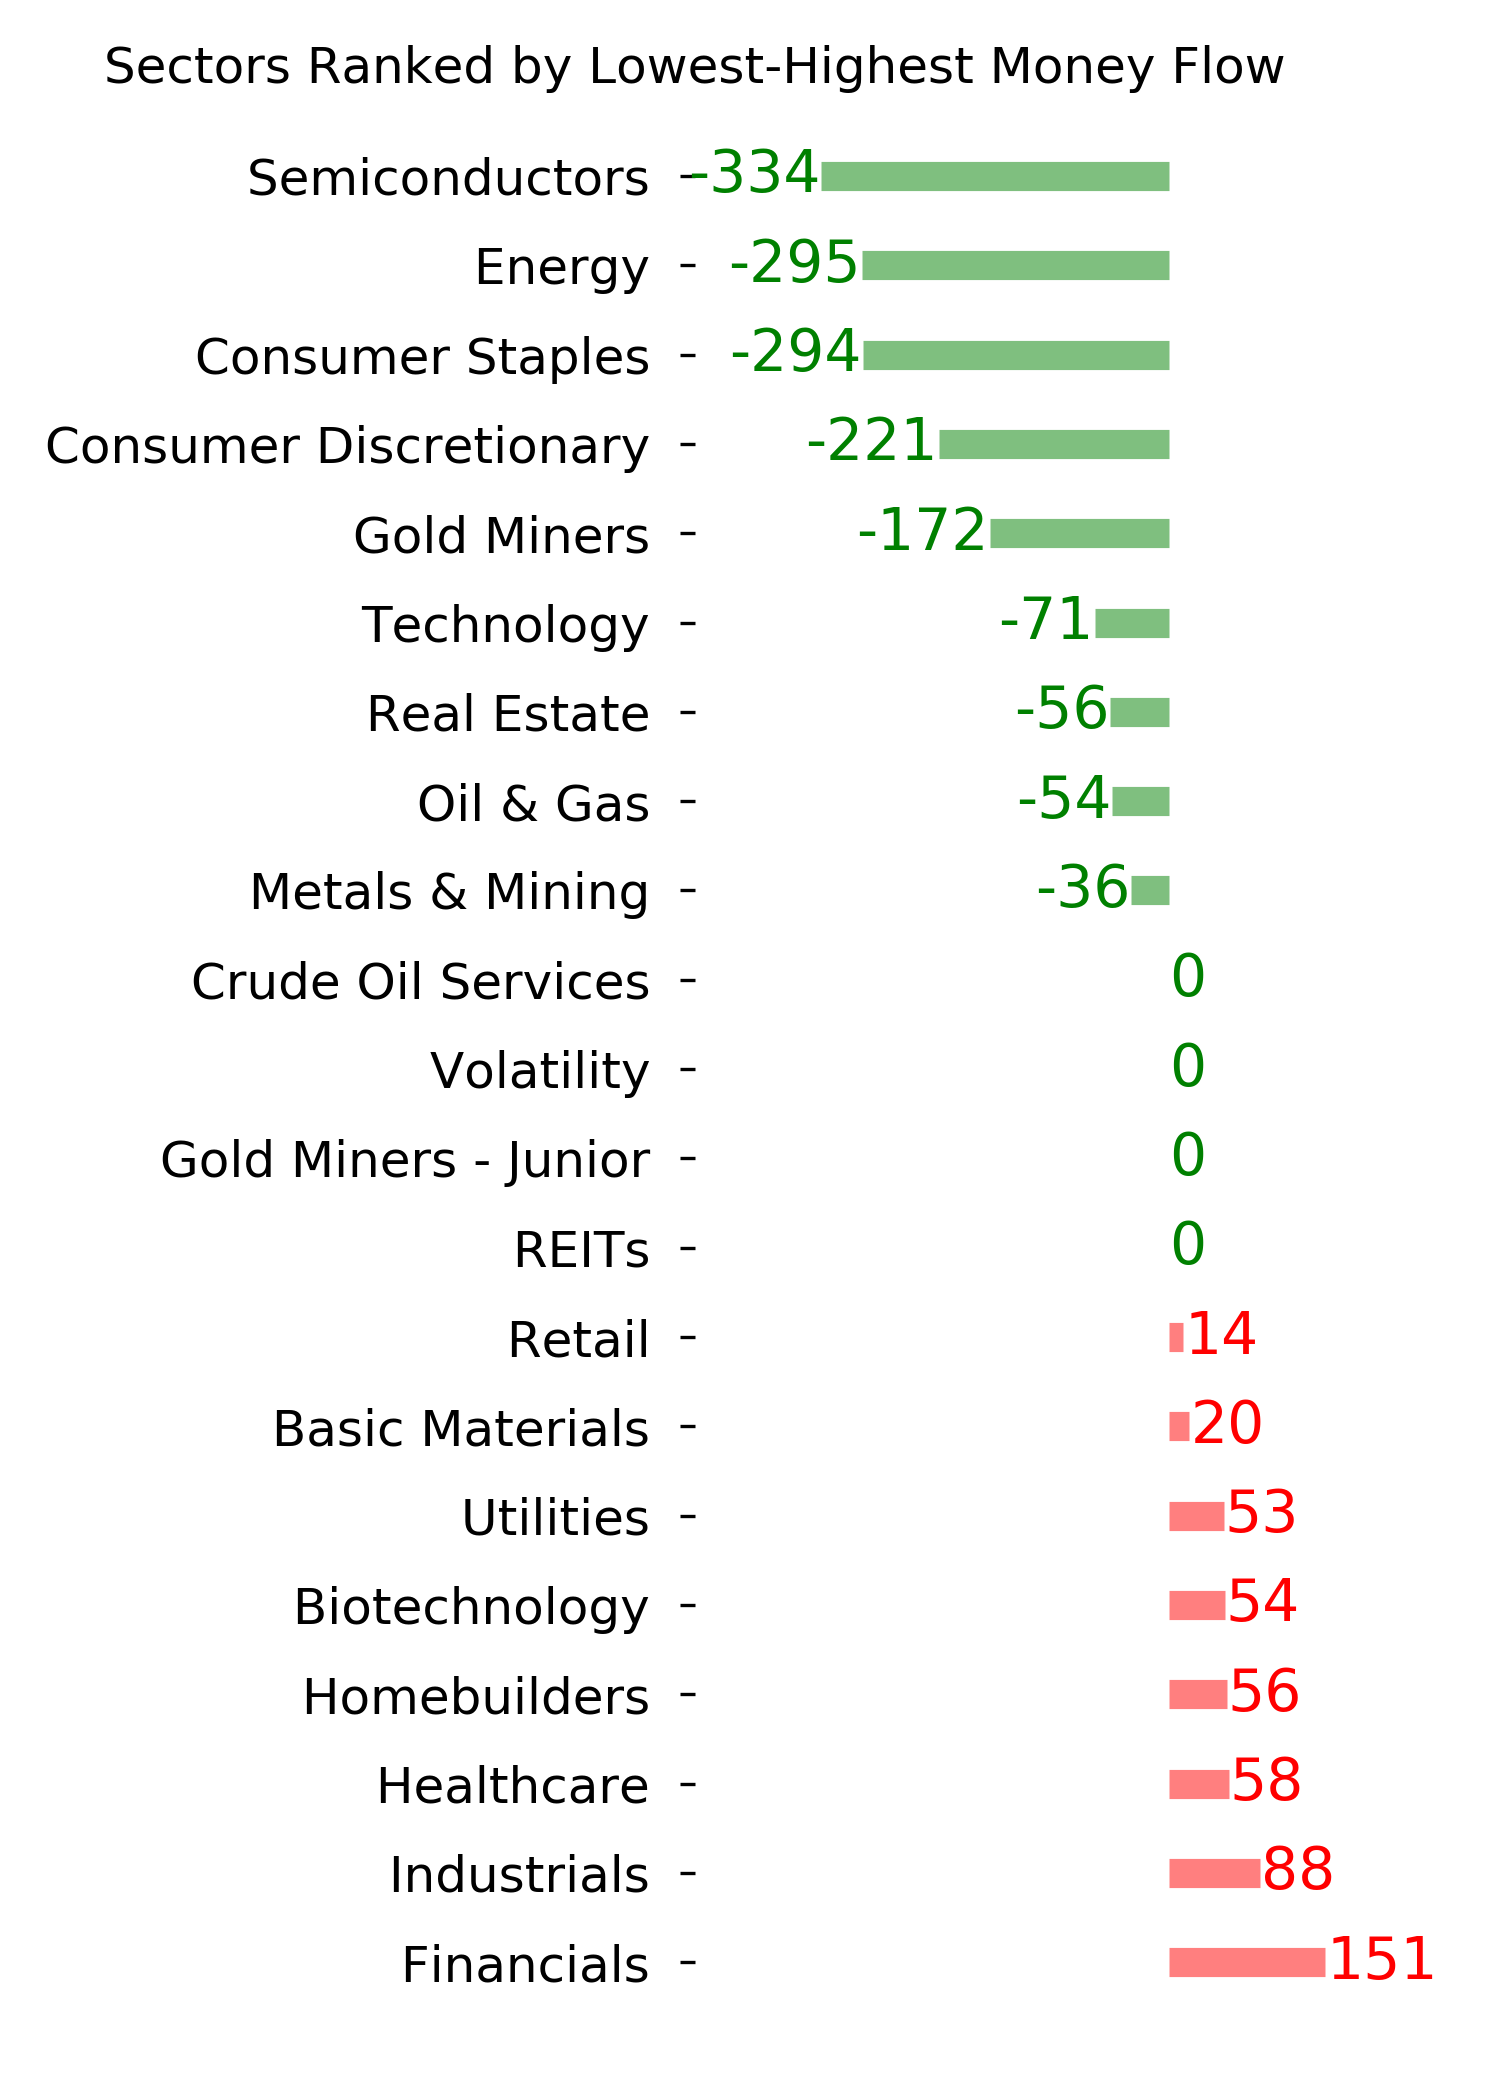
Optimism Index Thumbnails
|
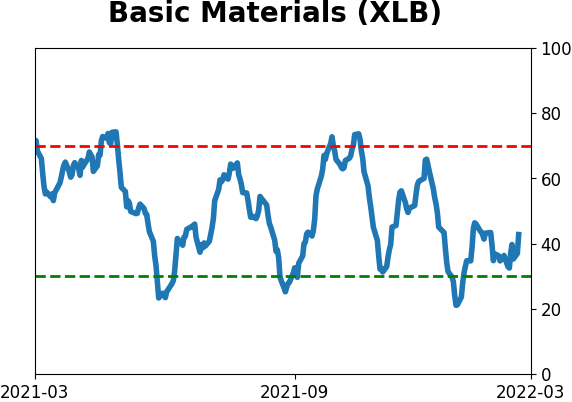
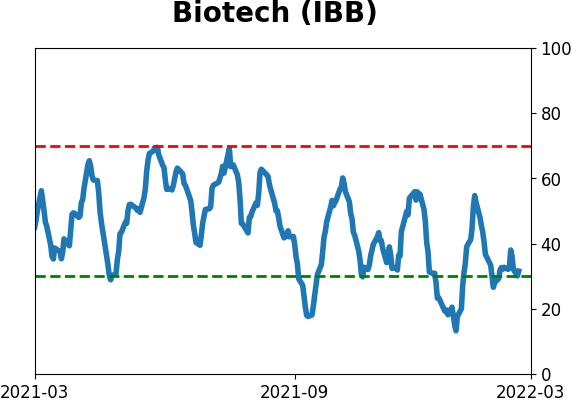
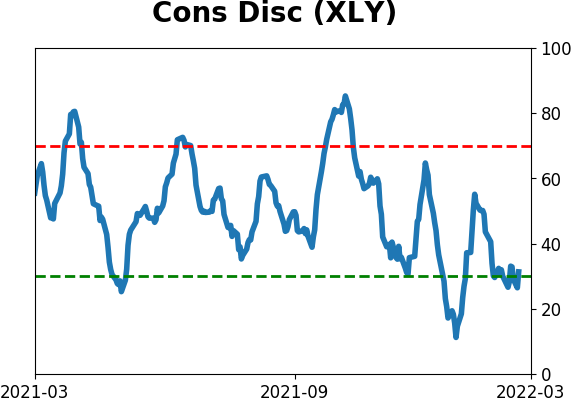
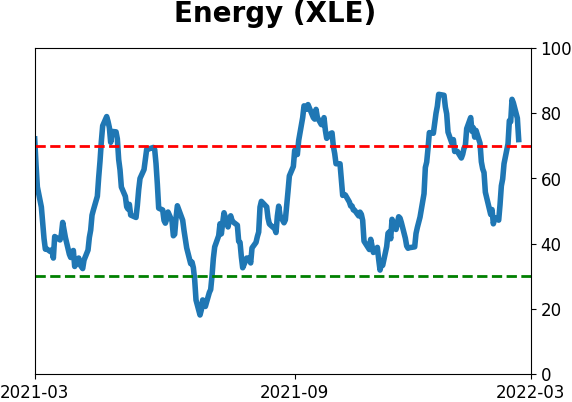
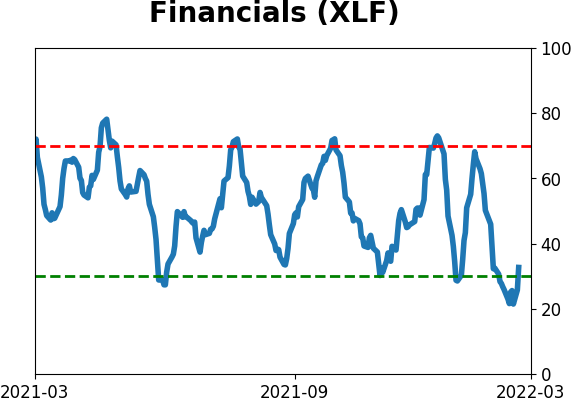
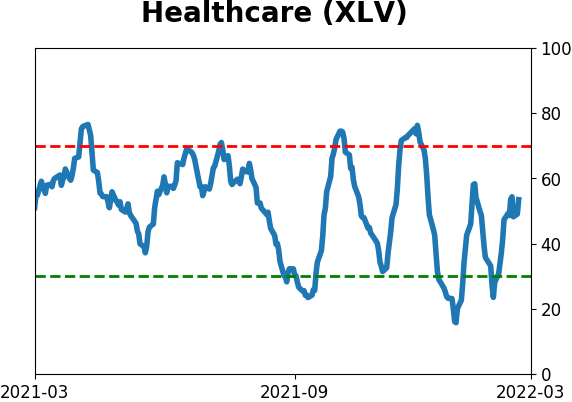
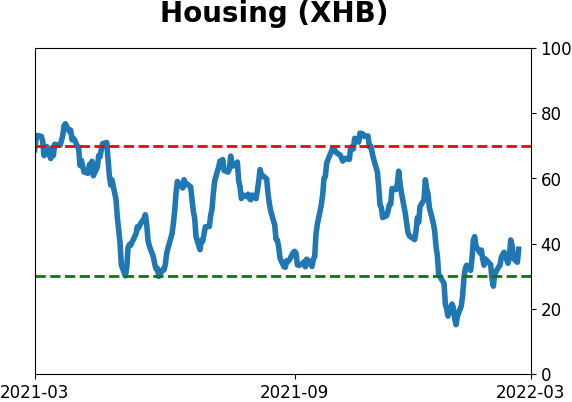
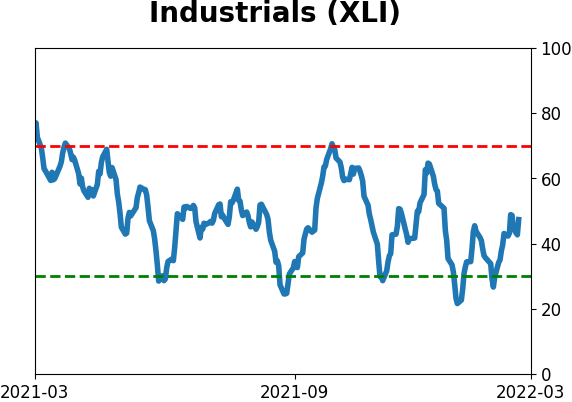
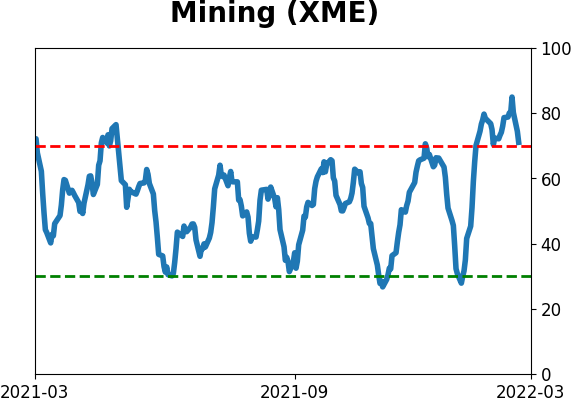
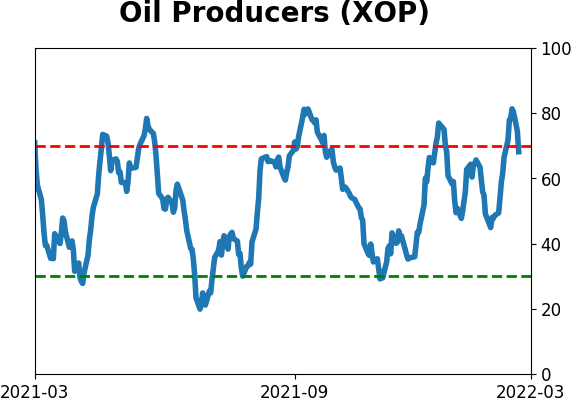
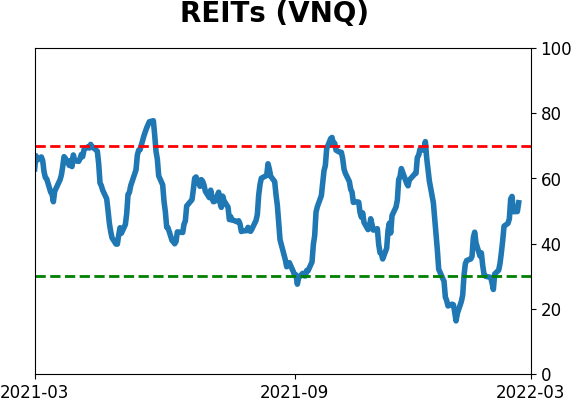
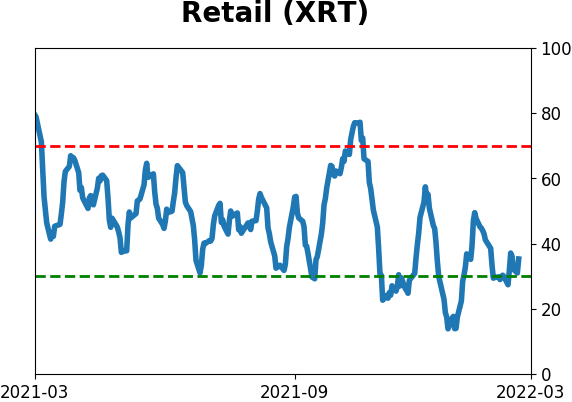
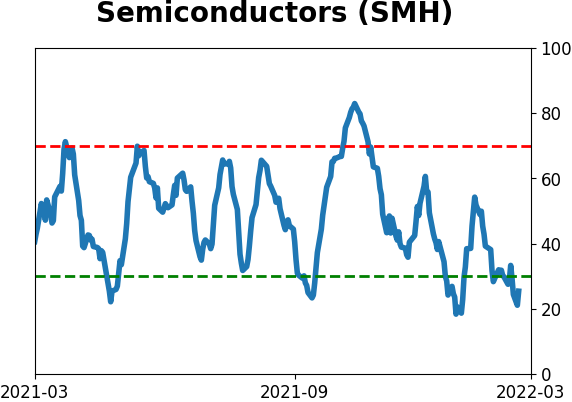
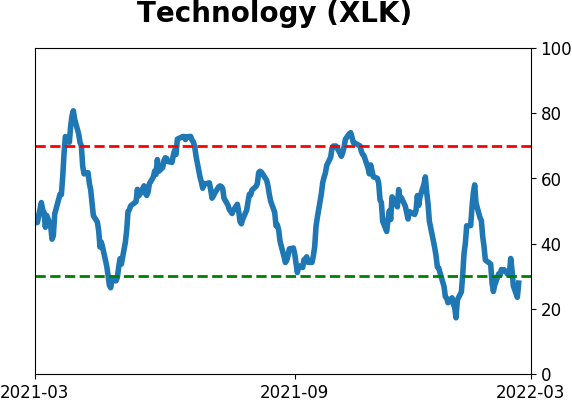
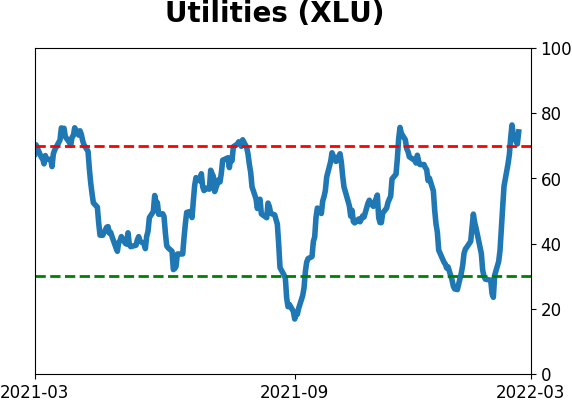
Sector ETF's - 10-Day Moving Average
|
|
|
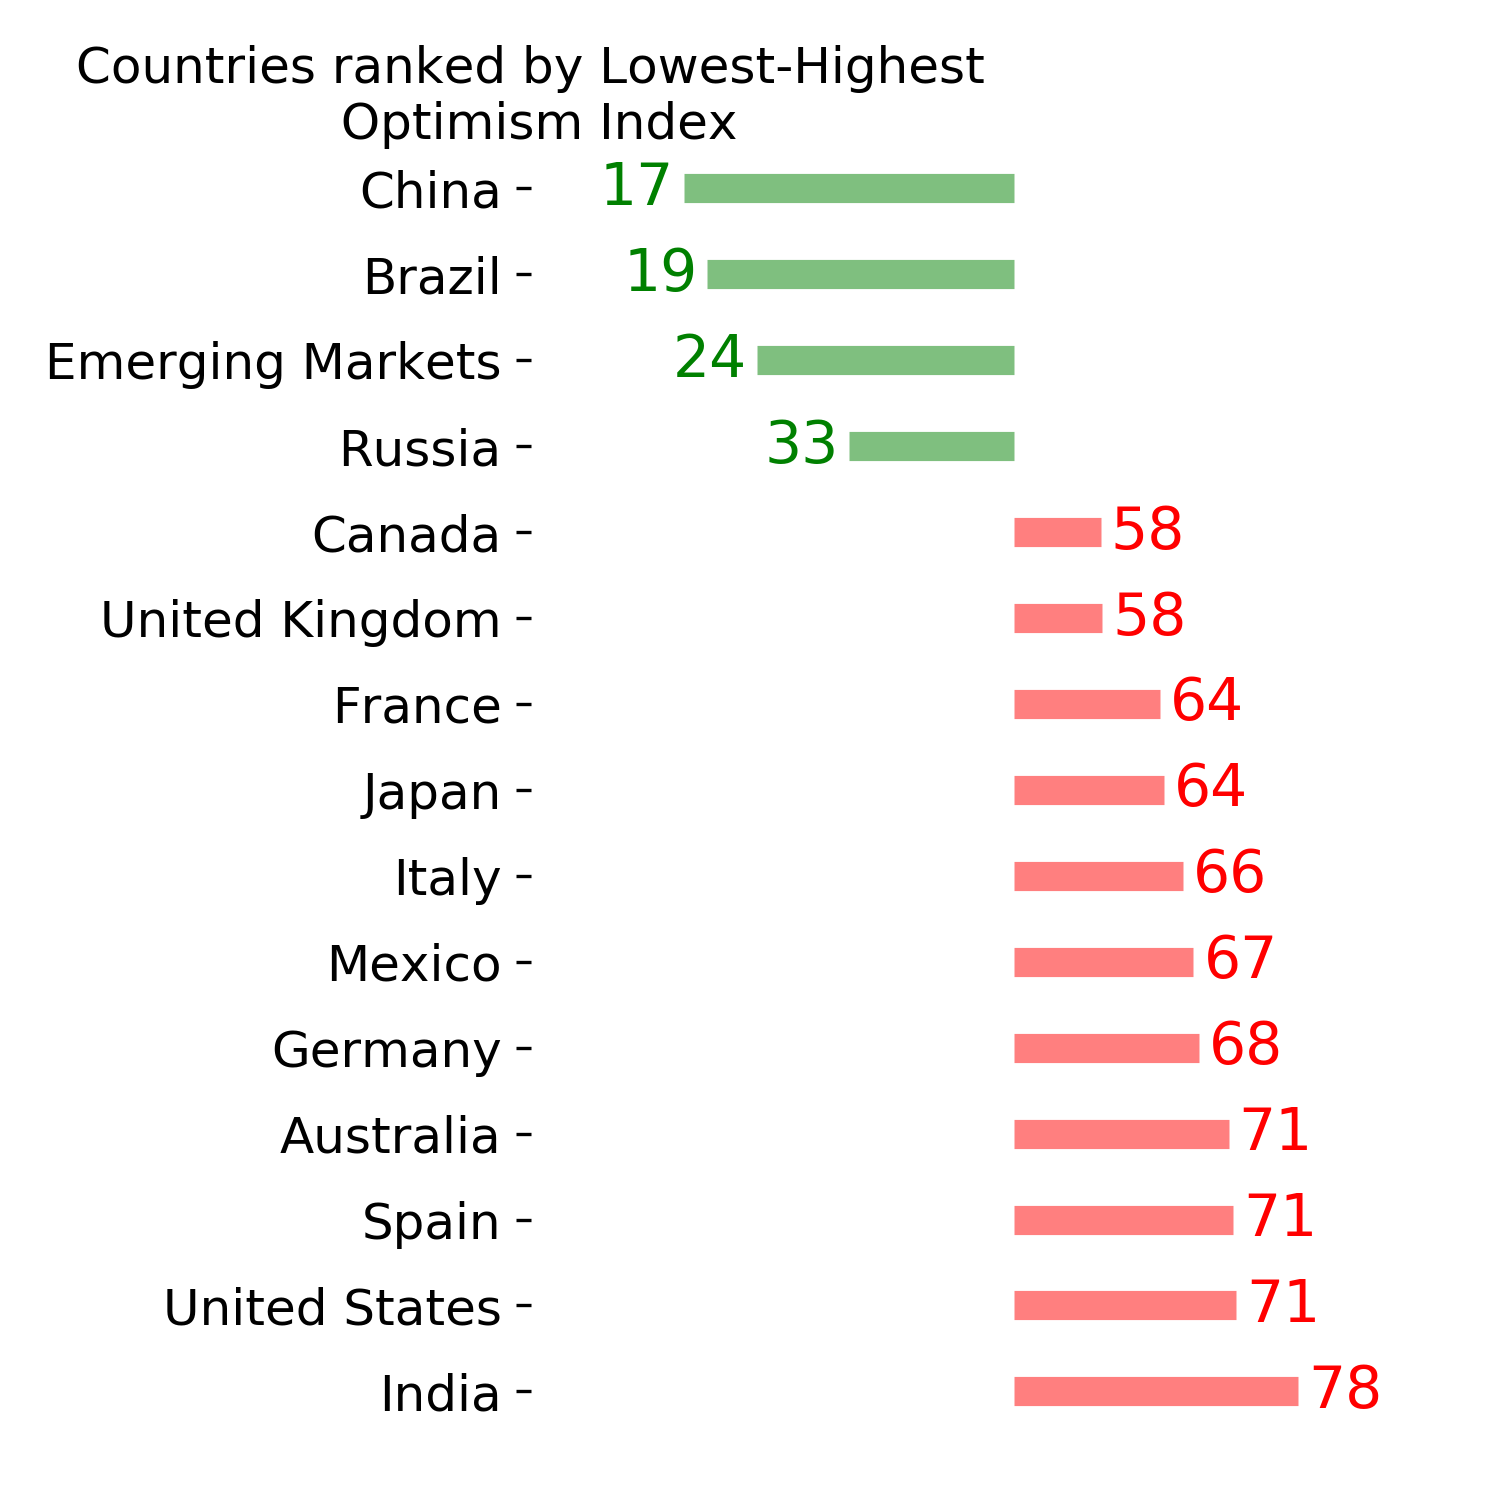
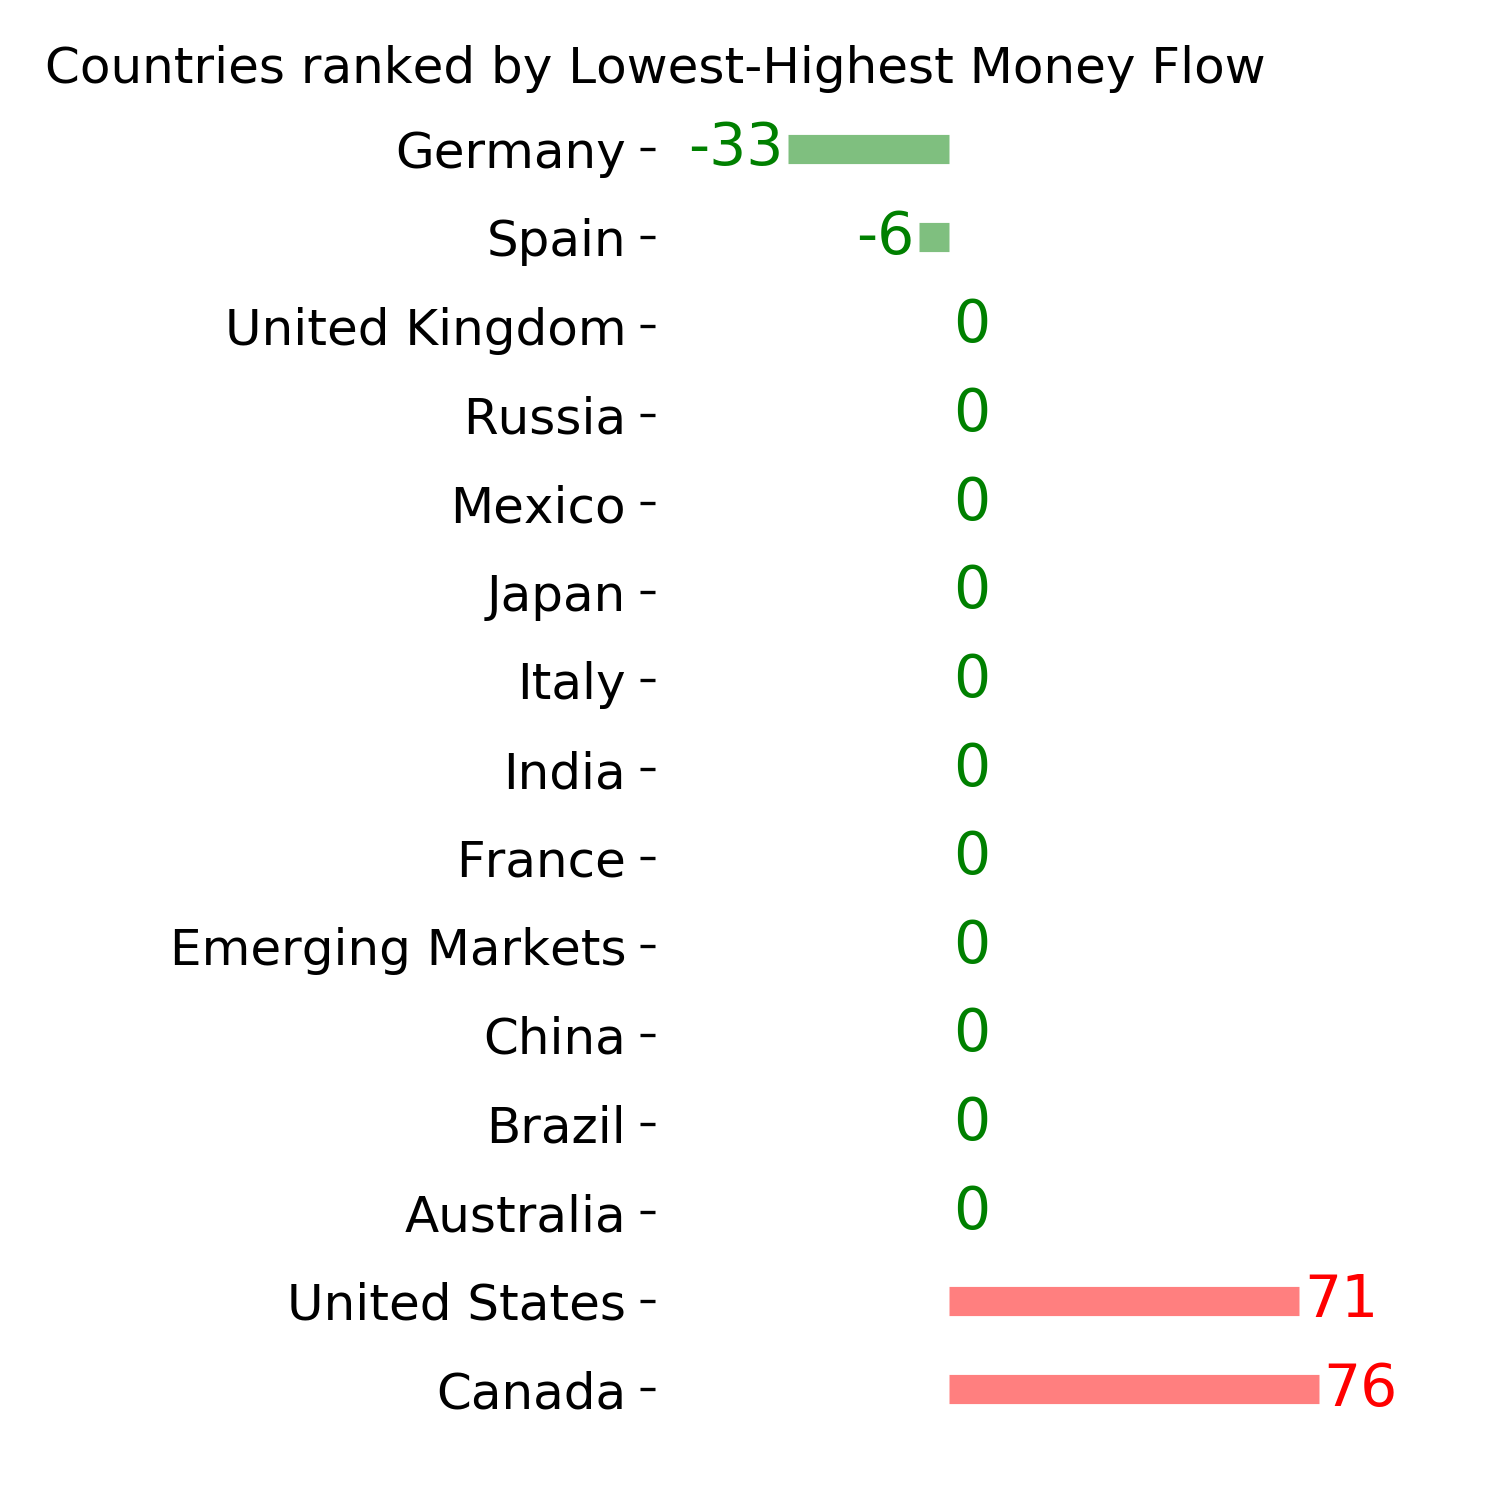
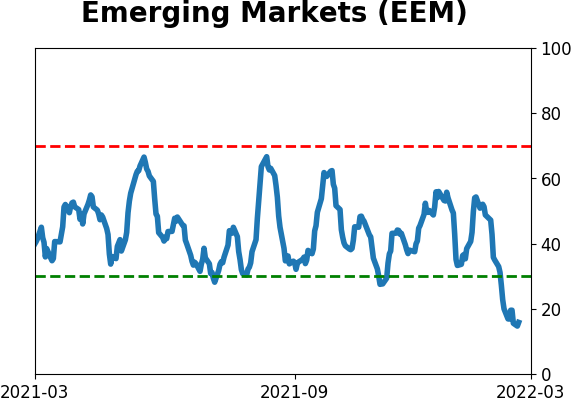
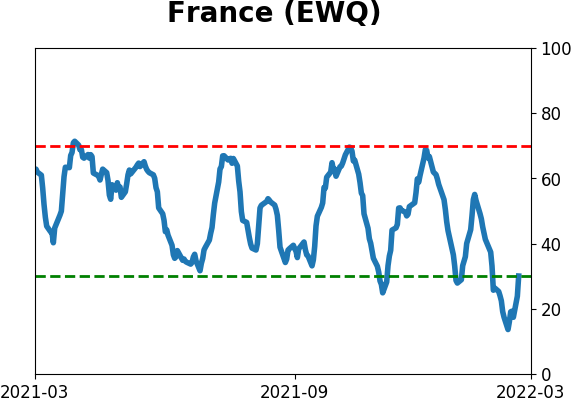
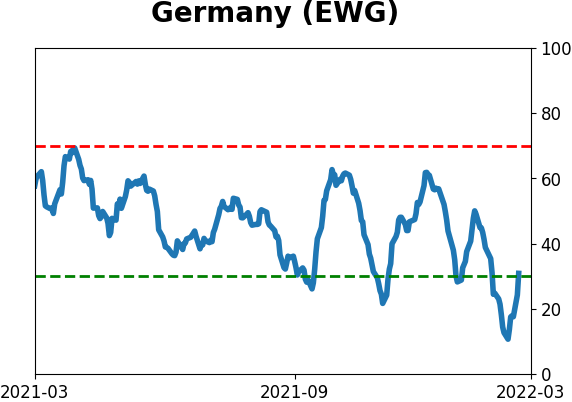
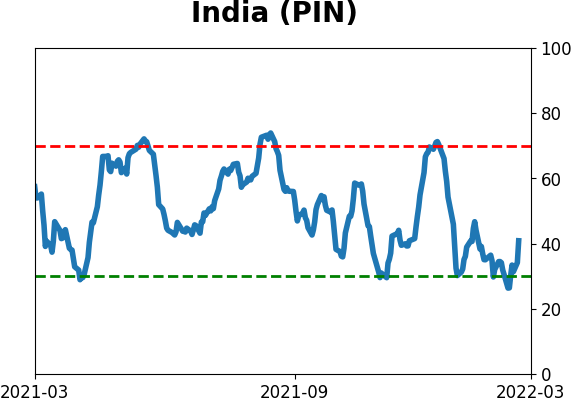
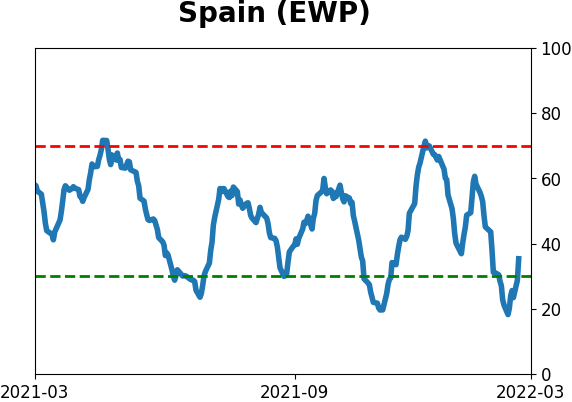
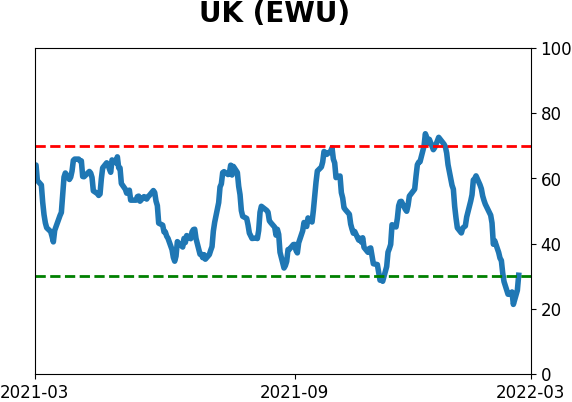
Country ETF's - 10-Day Moving Average
|
|
|
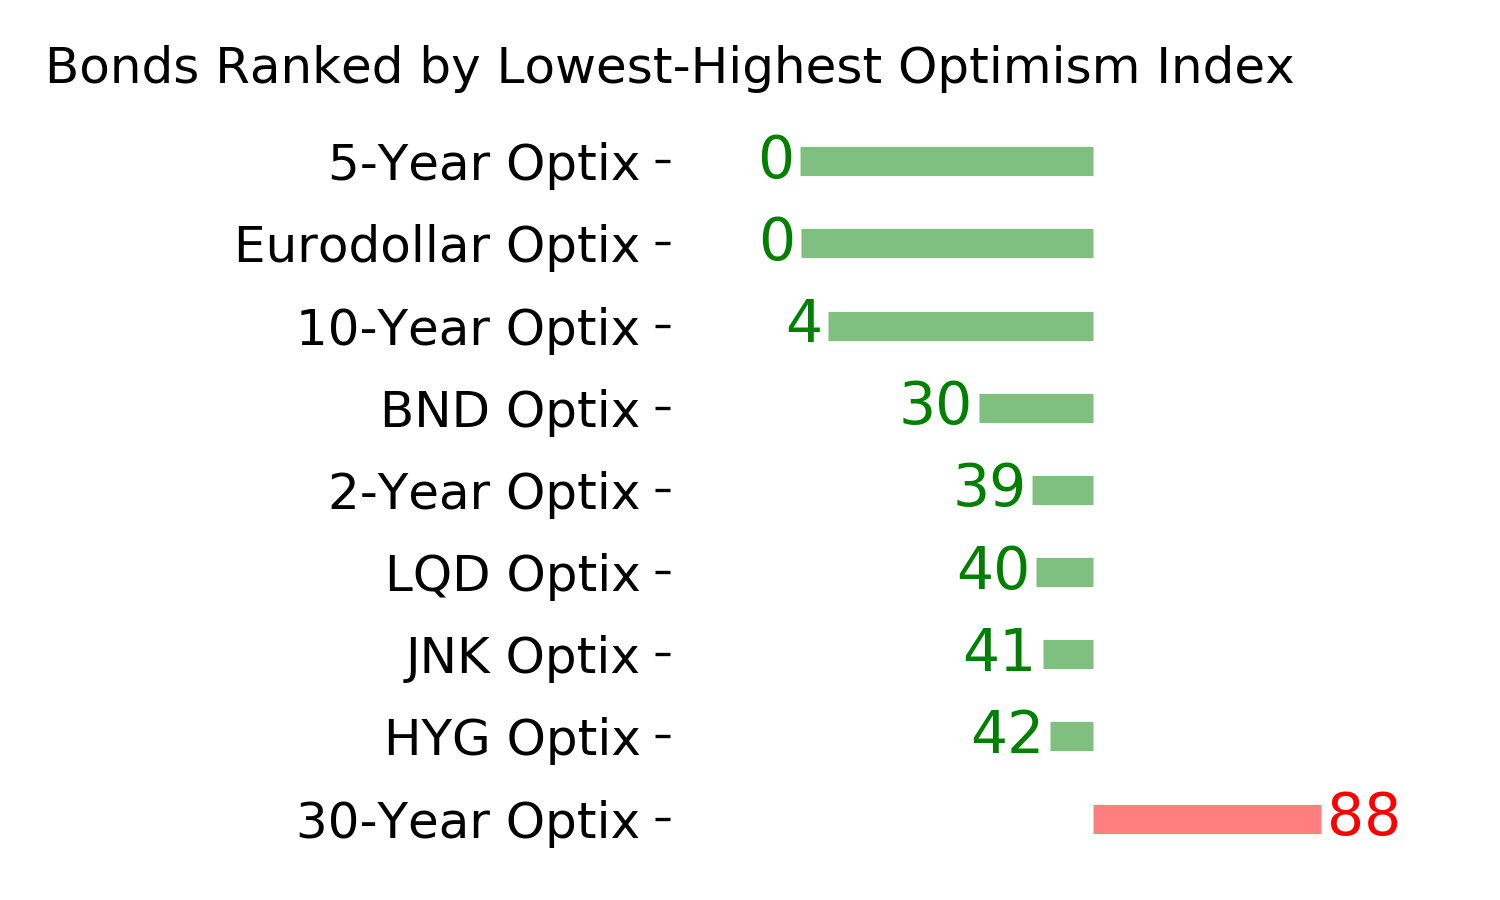
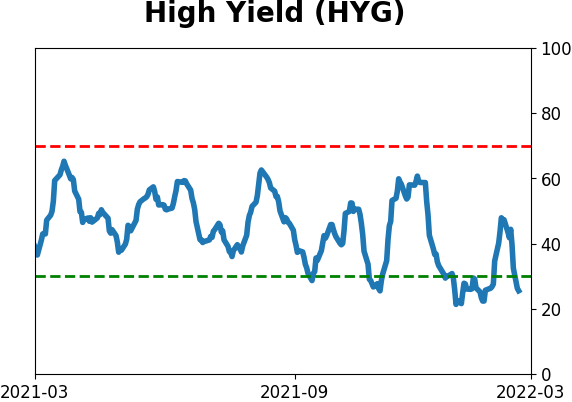
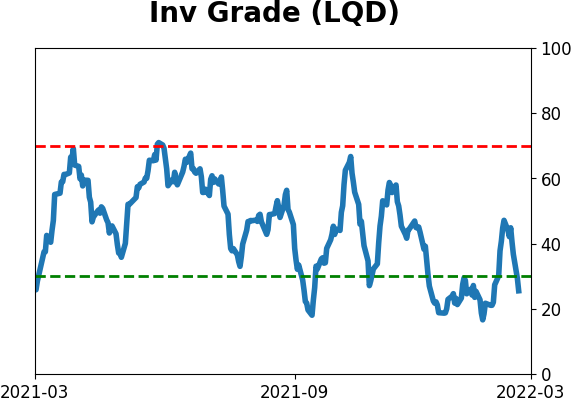
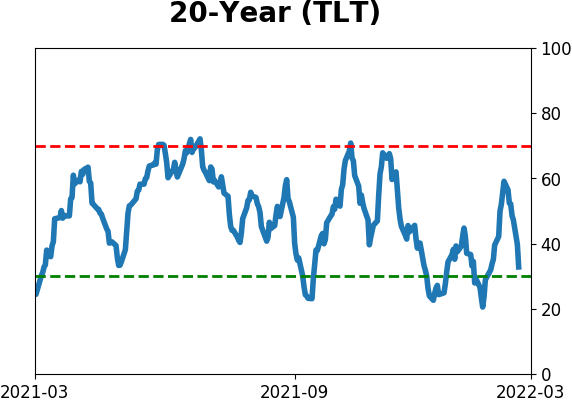
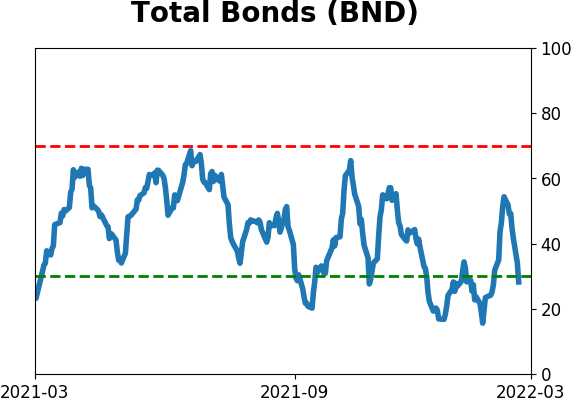
Bond ETF's - 10-Day Moving Average
|
|
|
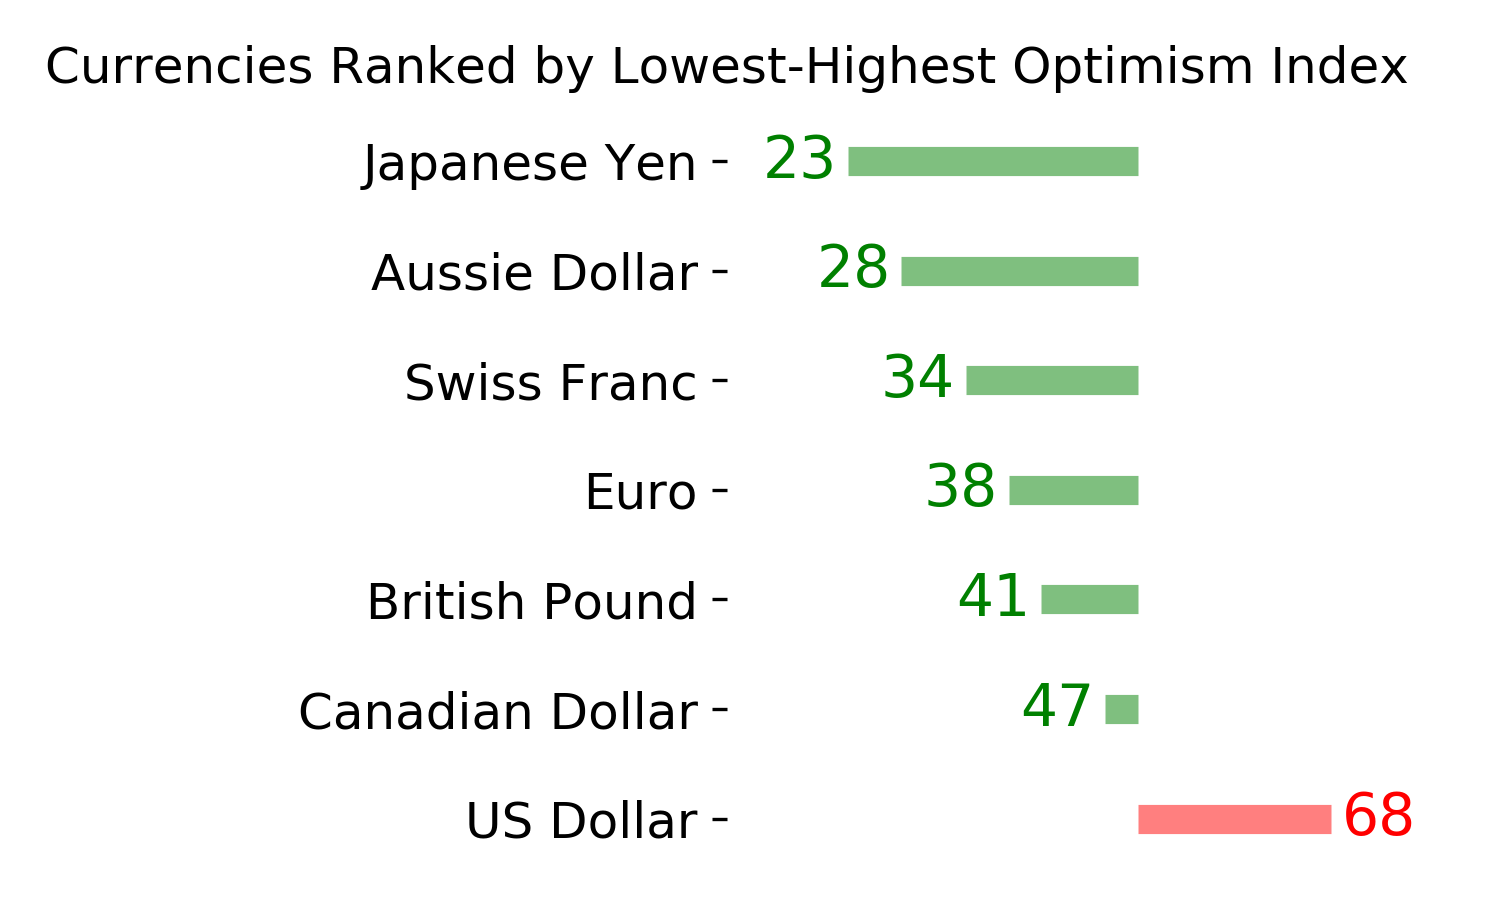
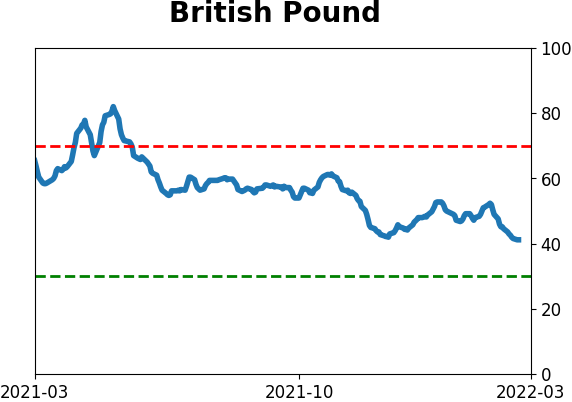
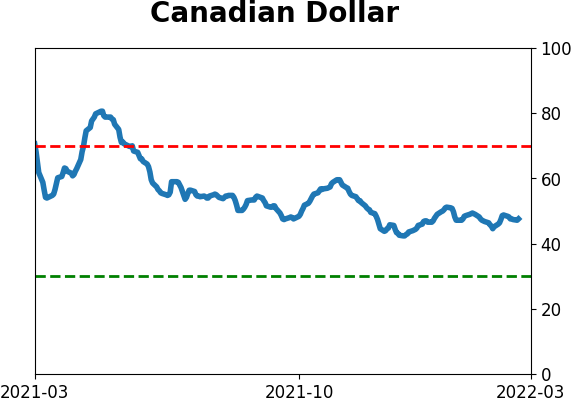
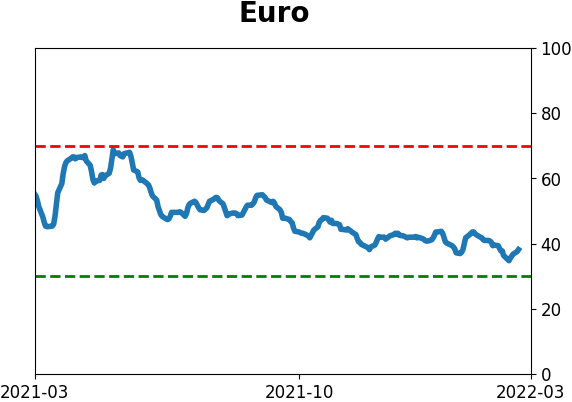
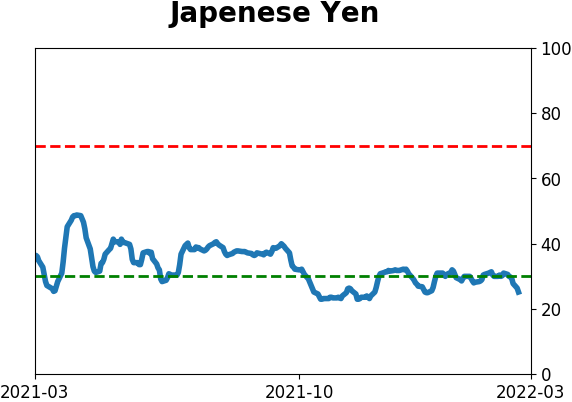
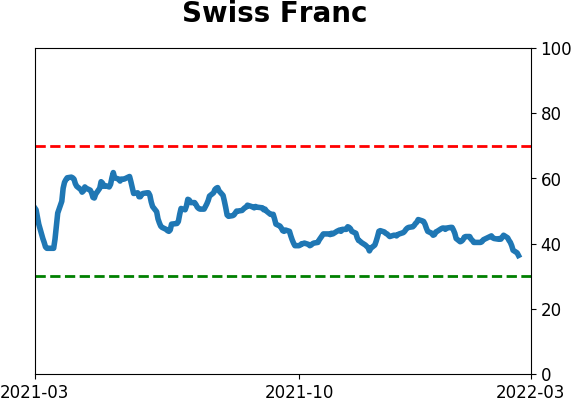
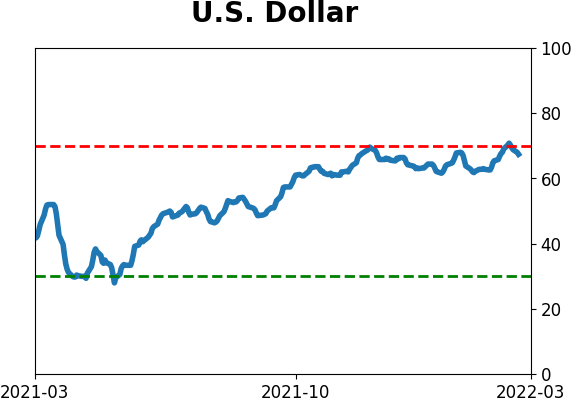
Currency ETF's - 5-Day Moving Average
|
|
|
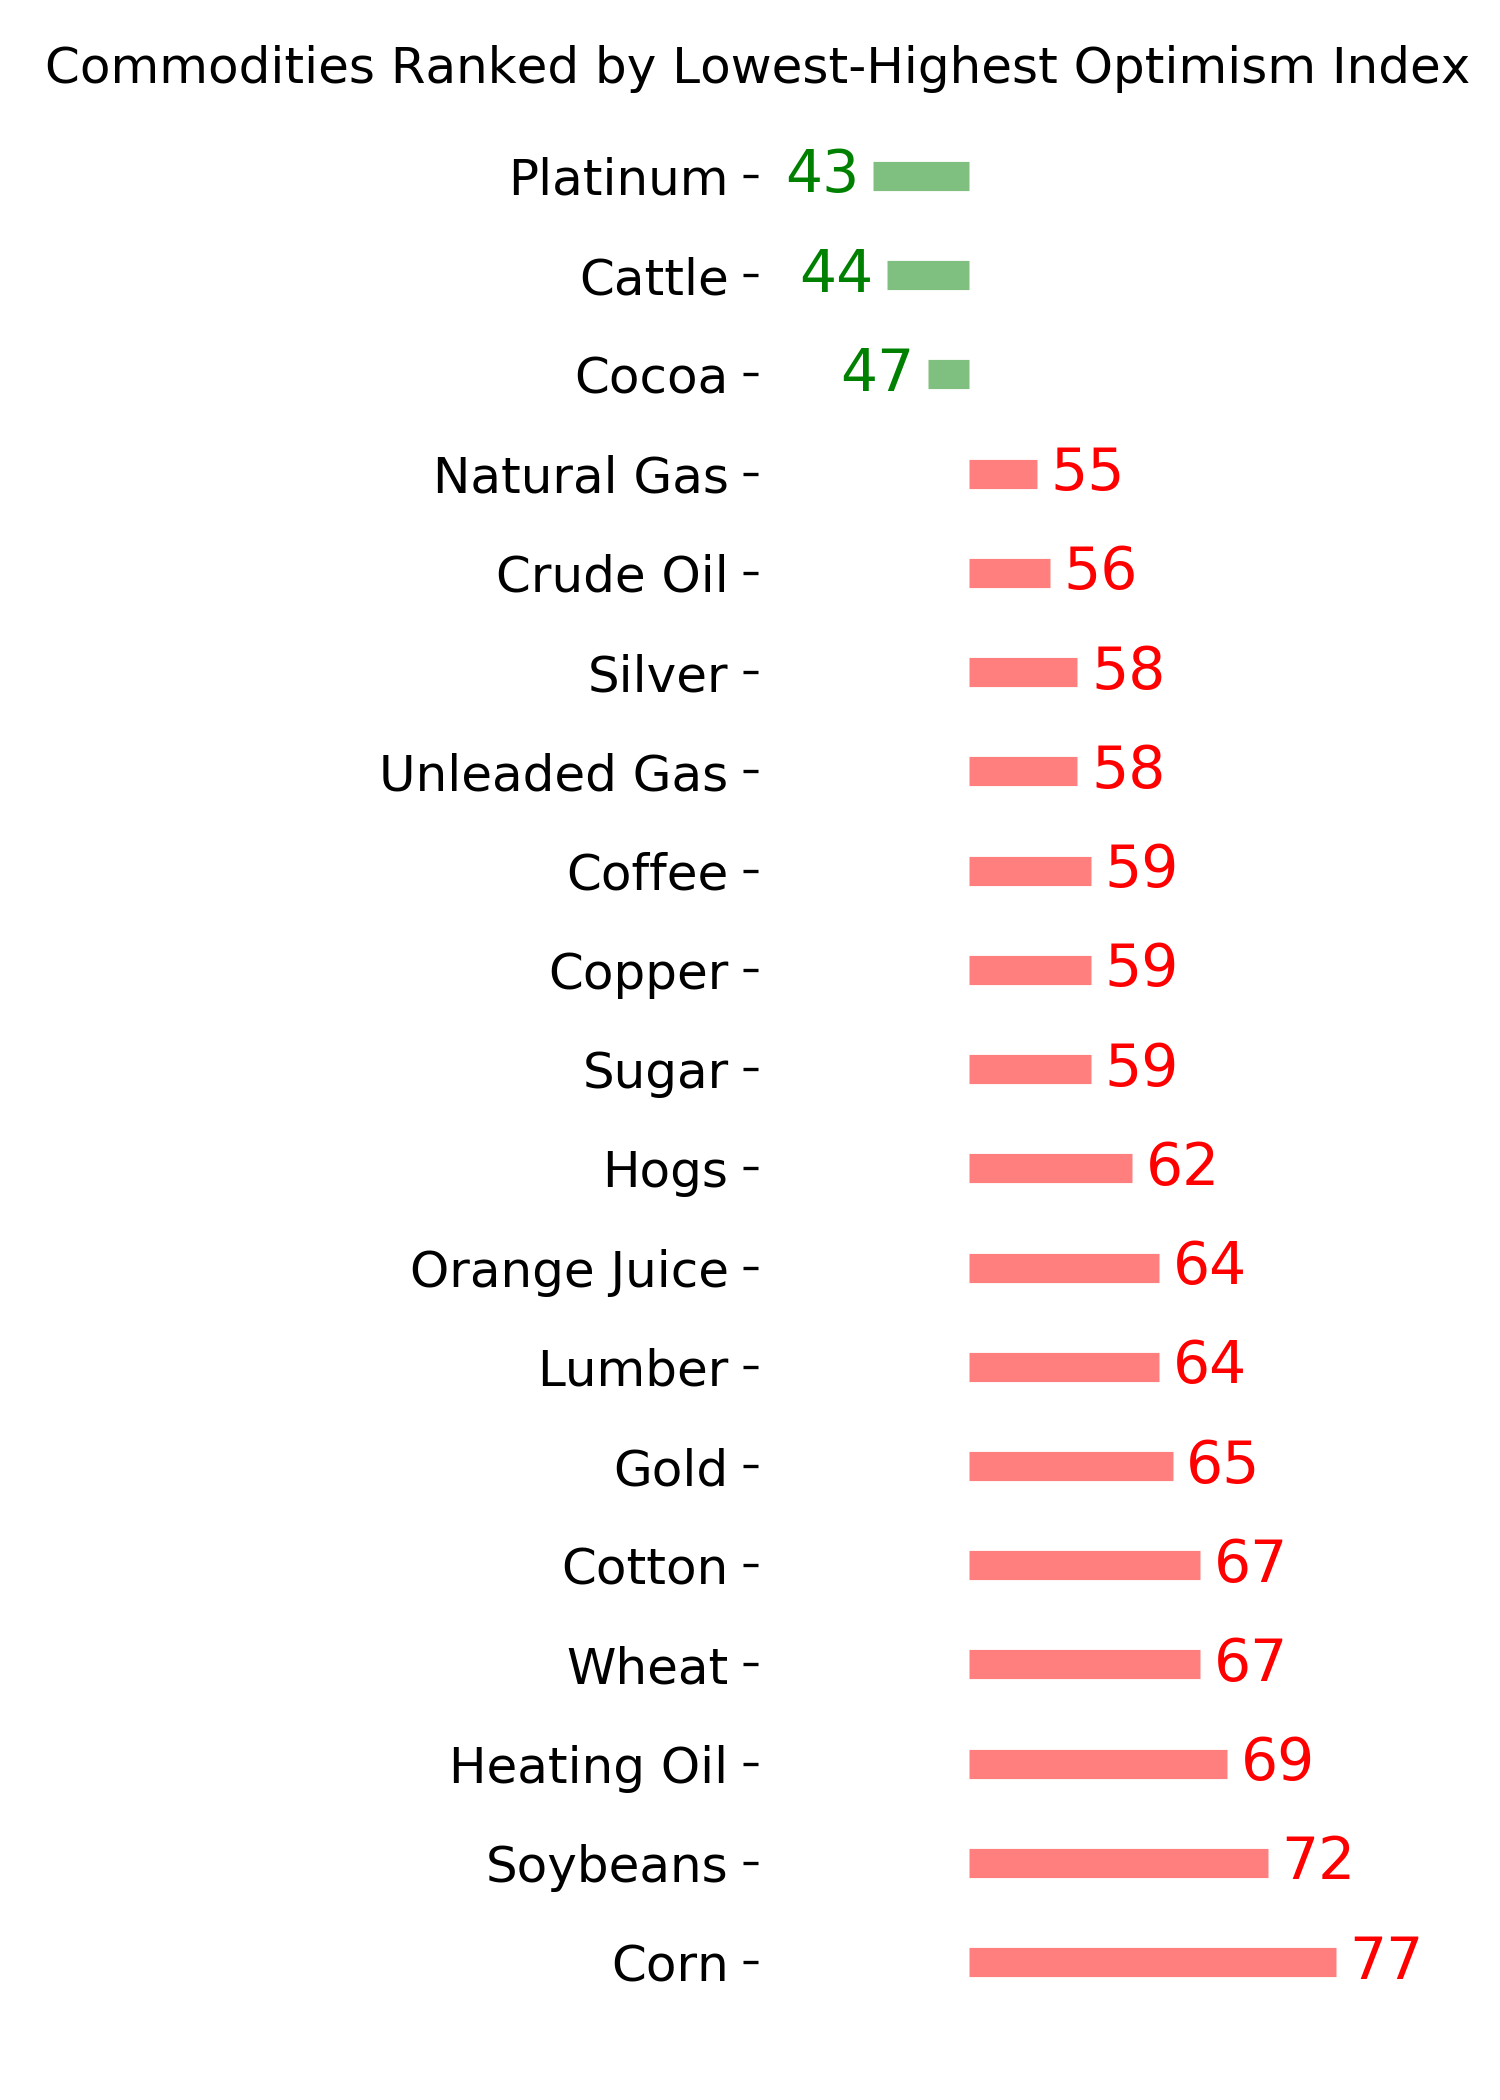
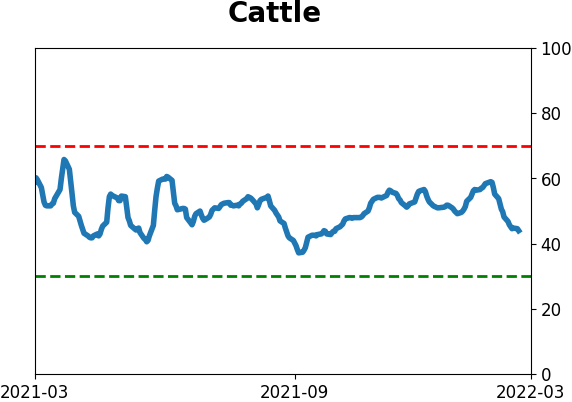
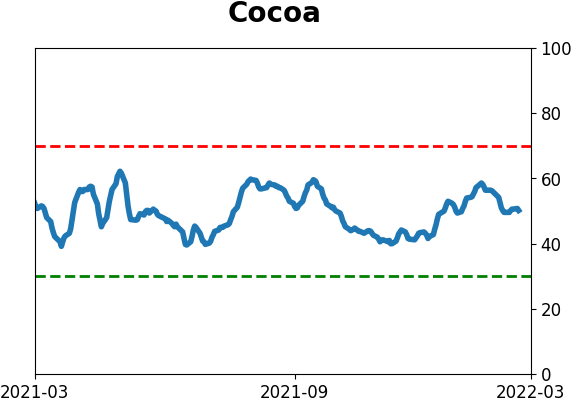
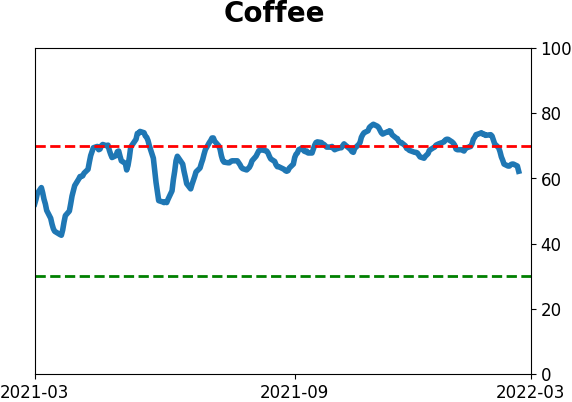
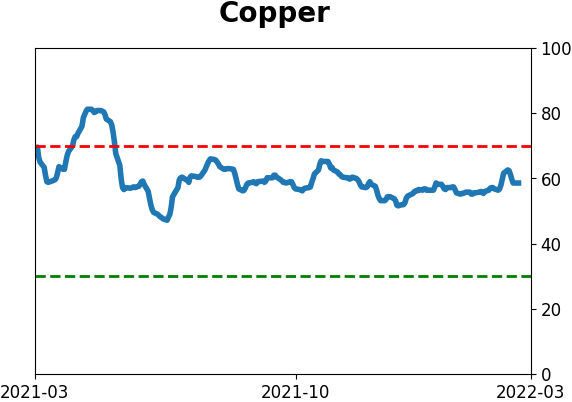
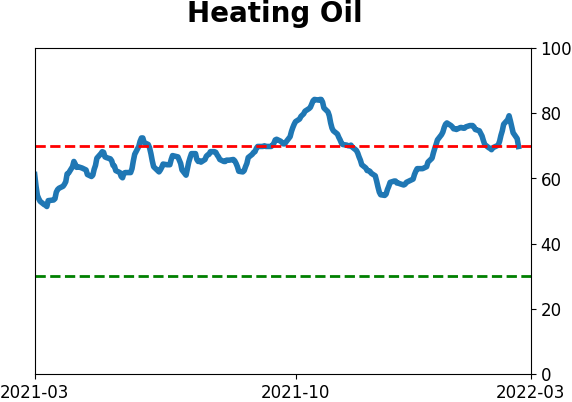
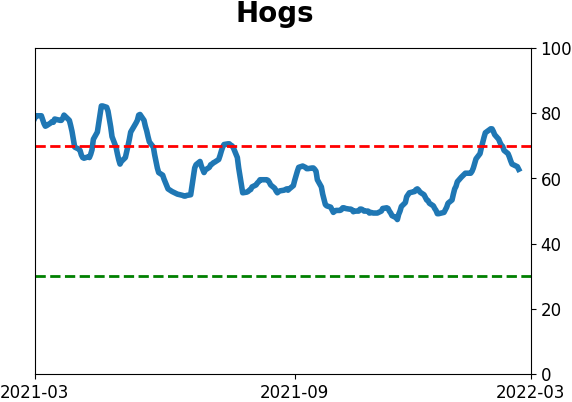
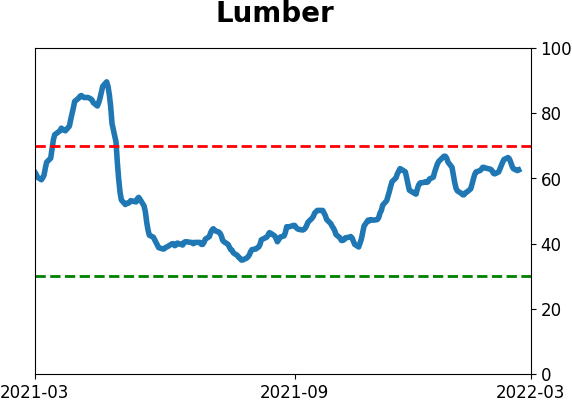
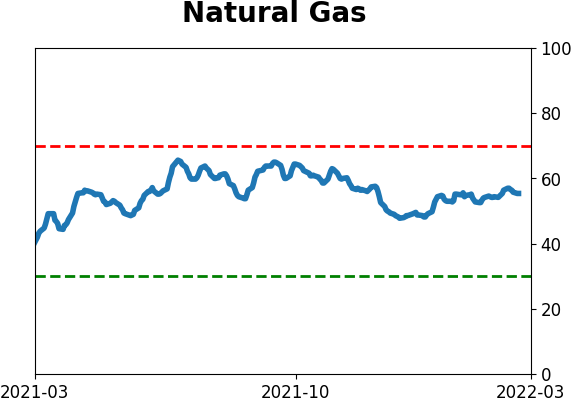
Commodity ETF's - 5-Day Moving Average
|
|