Headlines
|
|
Risk-on behavior is nearing record levels:
In aggregate, some of our most consistent and broad-based indicators are showing that investors are still in risk-on mode. The biggest danger is that risk-on behavior has been at a very high level for a prolonged period, which has preceded consistently poor returns.
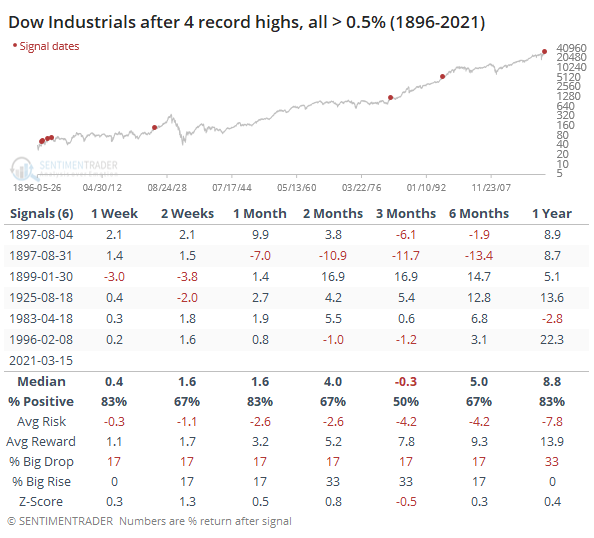
4 in a row: Whatever reason one wants to assign to the latest bout of incessant buying interest, it's been enough to push the venerable Dow Industrials Average to its 4th consecutive record high, gaining at least 0.5% on each of those days. This is only the 7th time it's managed to put in this kind of run since 1896.
Bottom Line:
See the Outlook & Allocations page for more details on these summaries STOCKS: Weak sell
The extreme speculation registered in January and February is starting to get wrung out. Internal dynamics have mostly held up, so a return to neutral sentiment conditions would improve the forward risk/reward profile substantially. We're still a ways off from that. BONDS: Weak buy
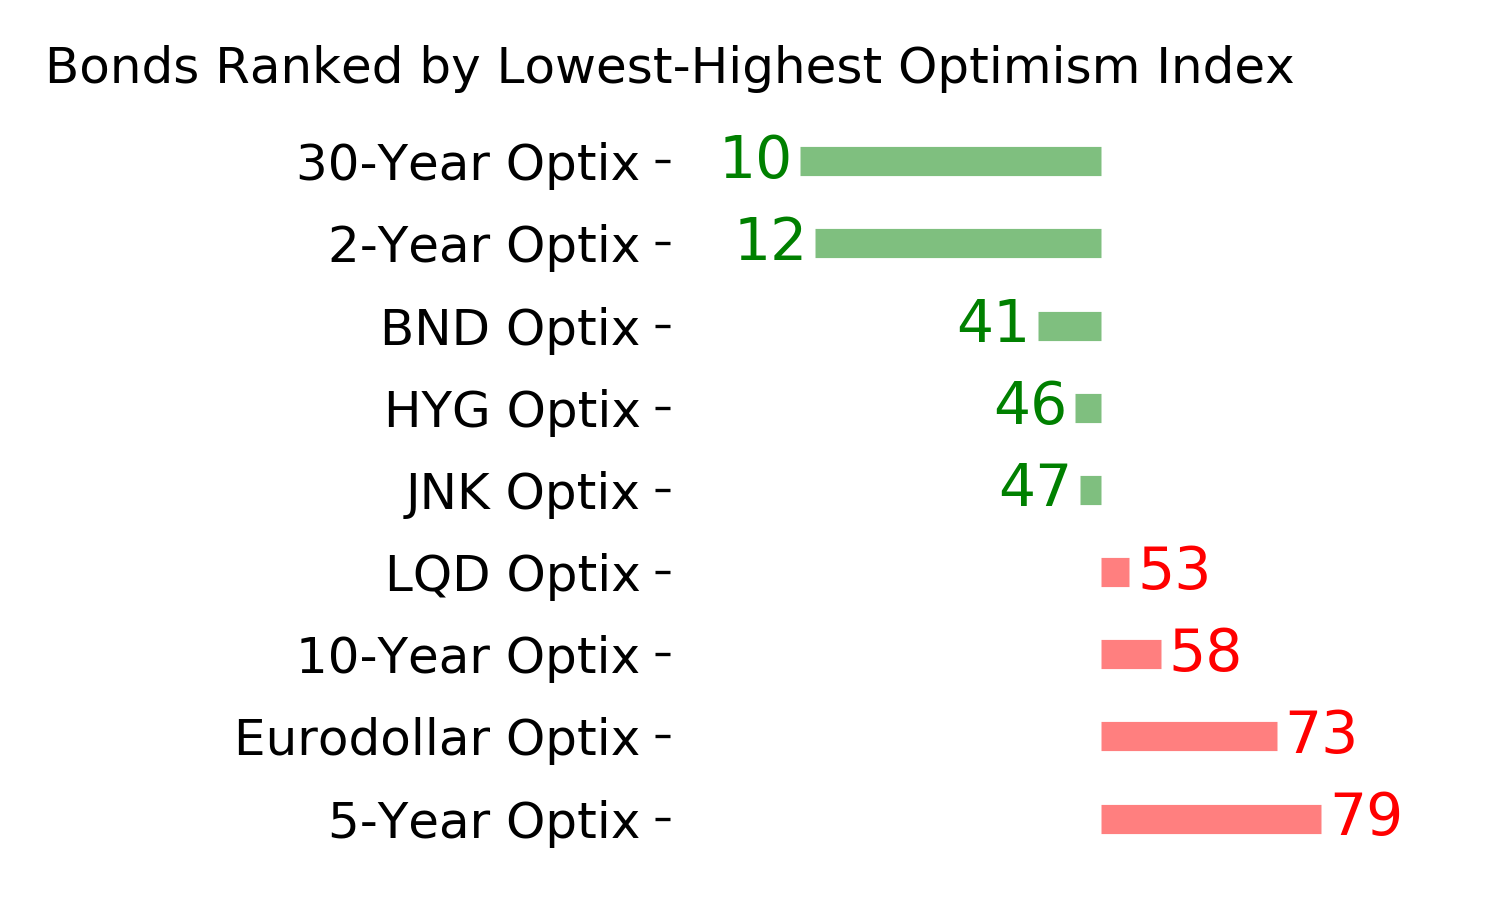
Various parts of the market have been hit in recent weeks, with mild oversold conditions. The Bond Optimism Index is now about as low as it gets during healthy bond market environments. Fixed income isn't responding well, so that needs to be monitored in case it's transitioning to a longer-term negative market environment. GOLD: Weak buy
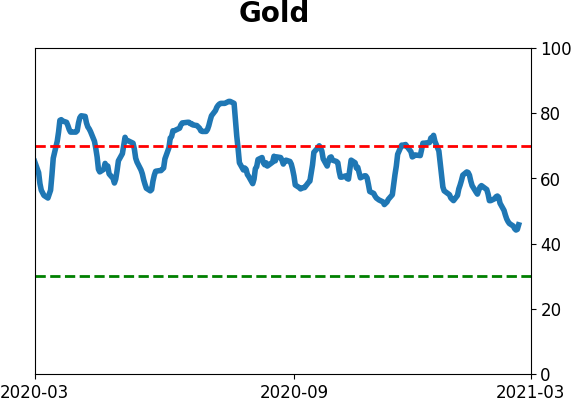
A dollar trying to rebound from a severe short position has weighed on gold and miners. The types of signals they've given in recent weeks, within the context of their recent surge, have usually resulted in higher prices over a medium- to long-term time frame. Like bonds, gold and miners aren't responding very well, and this needs to be monitored.
|
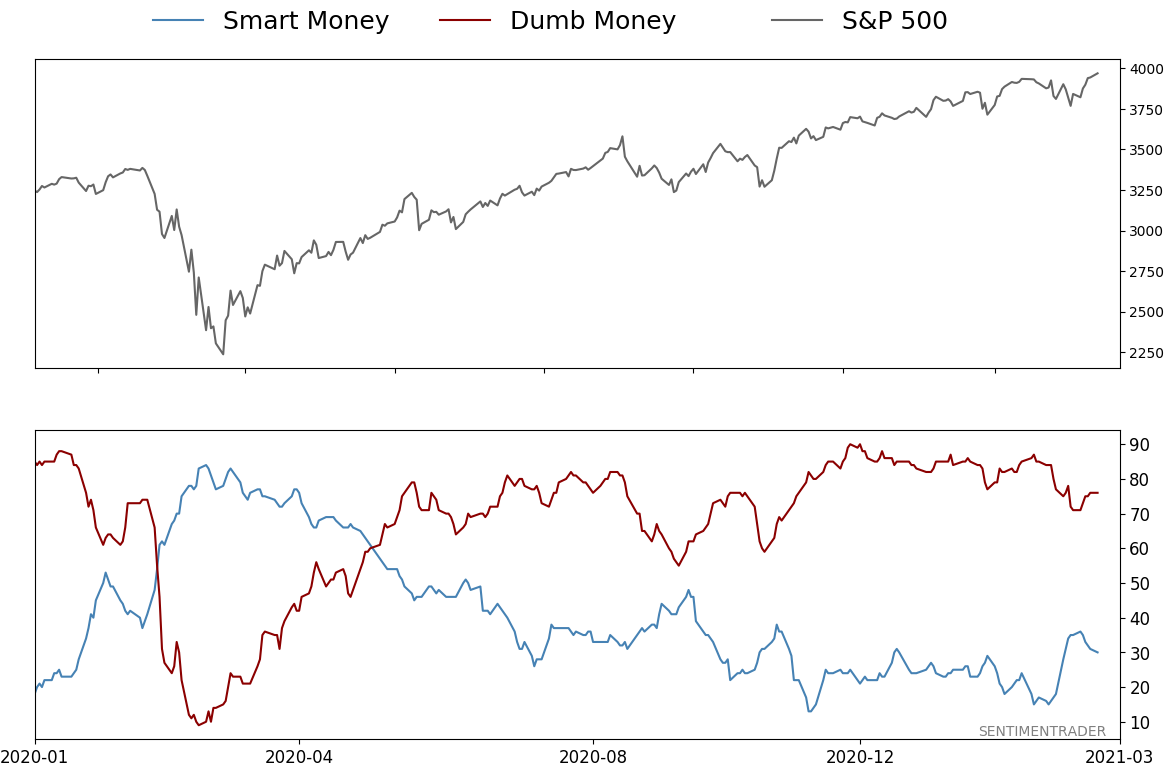
Smart / Dumb Money Confidence
|
Smart Money Confidence: 30%
Dumb Money Confidence: 76%
|
|
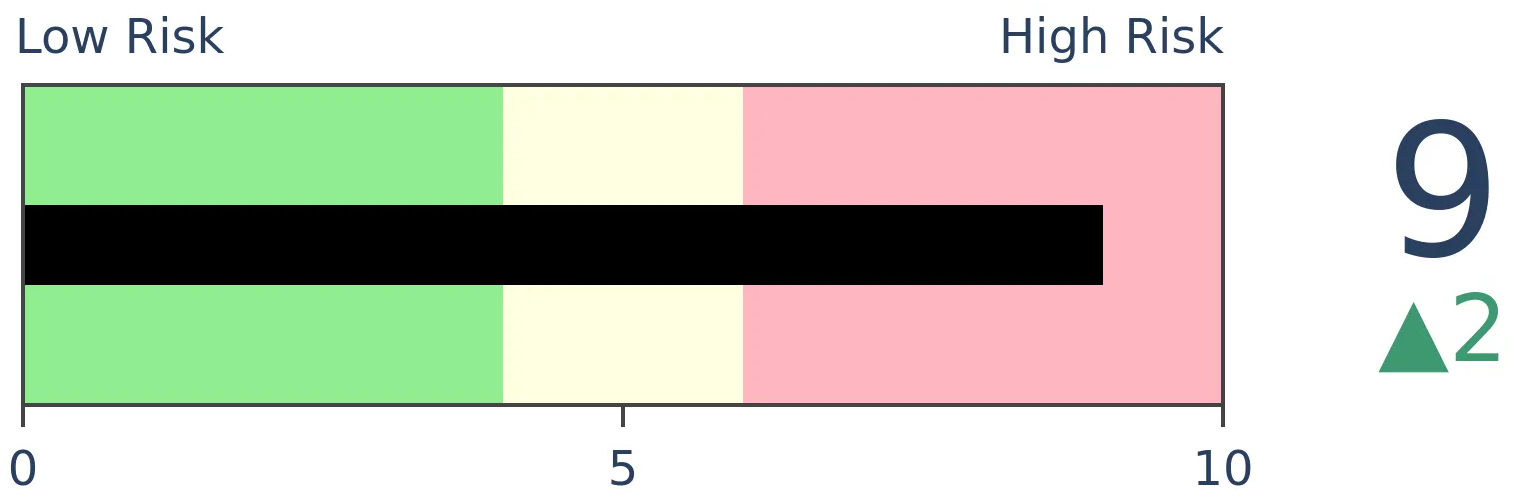
Risk Levels
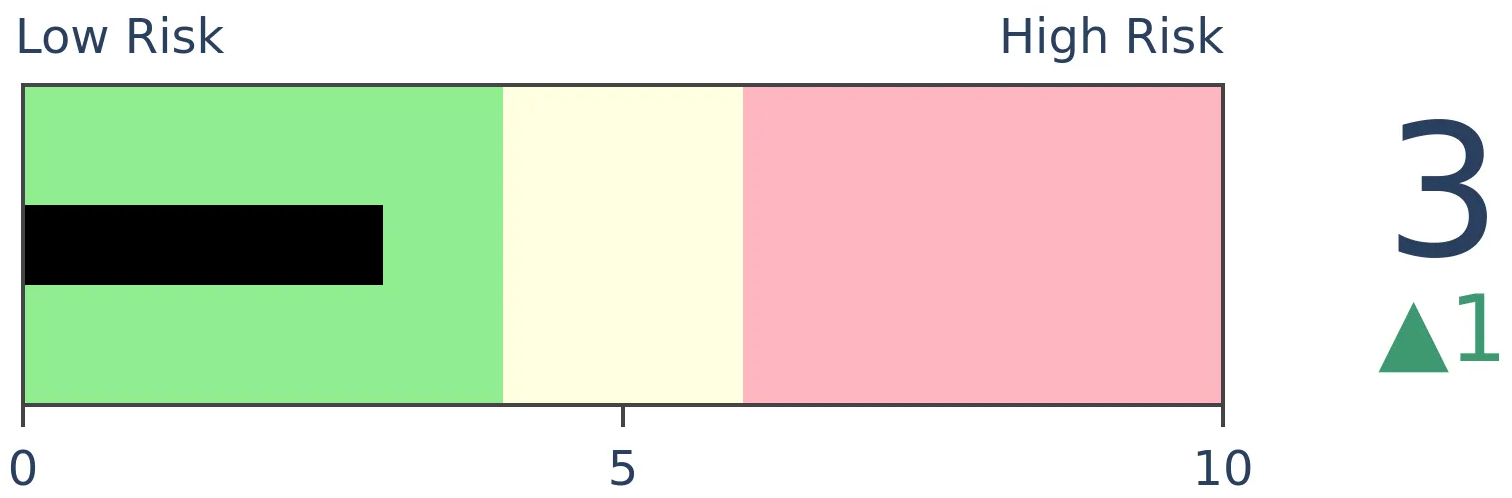
Stocks Short-Term
|
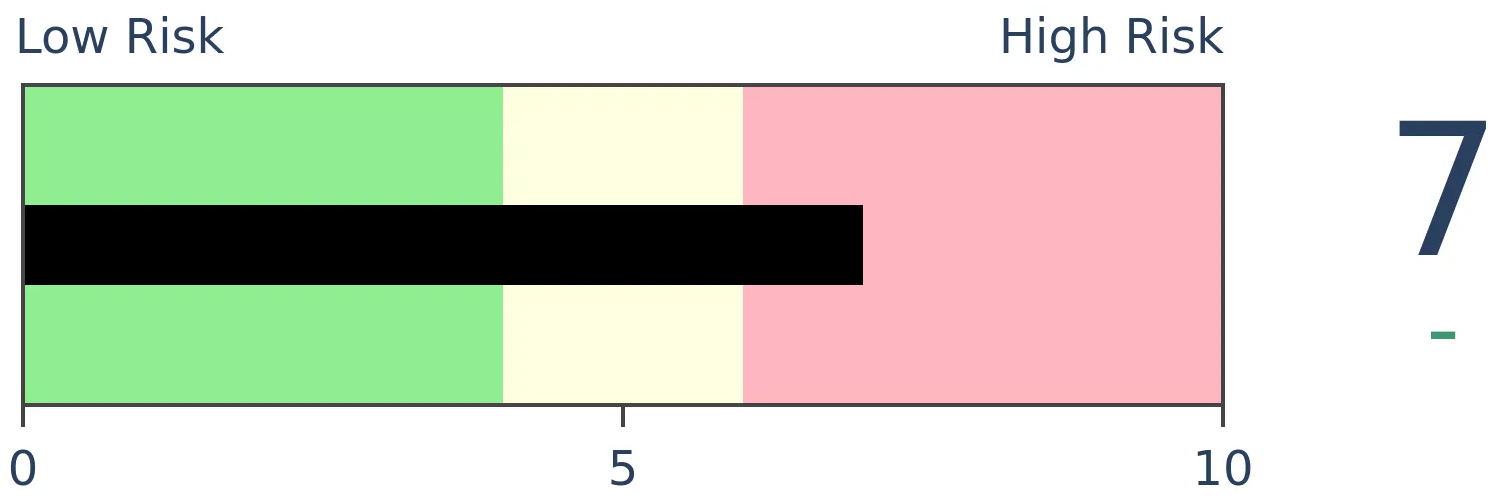
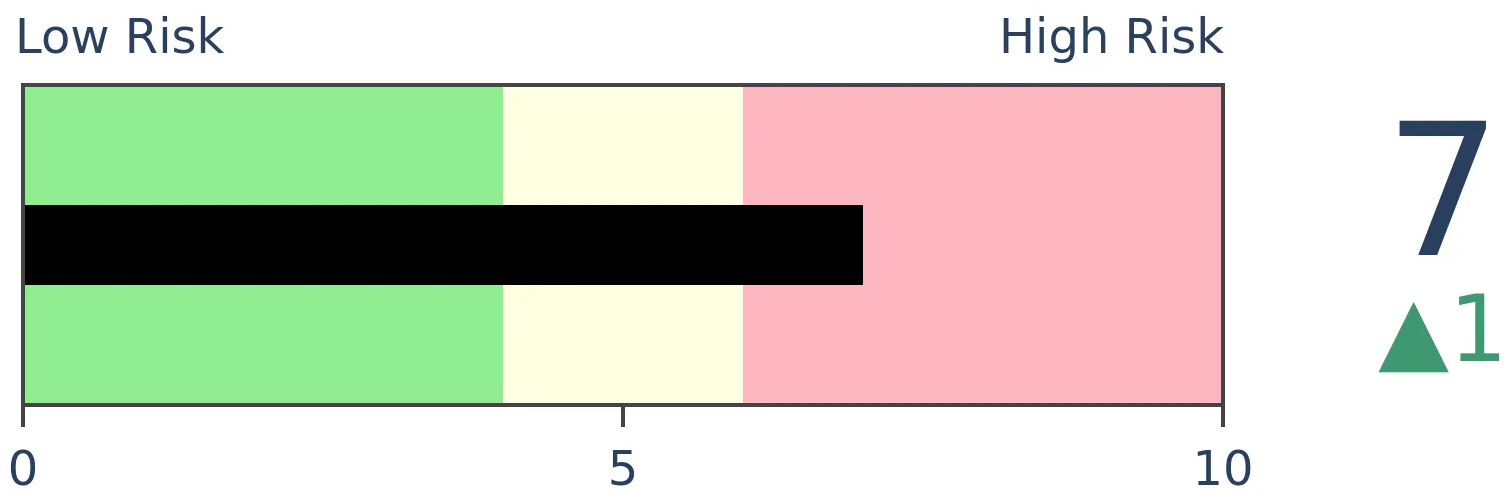
Stocks Medium-Term
|
|
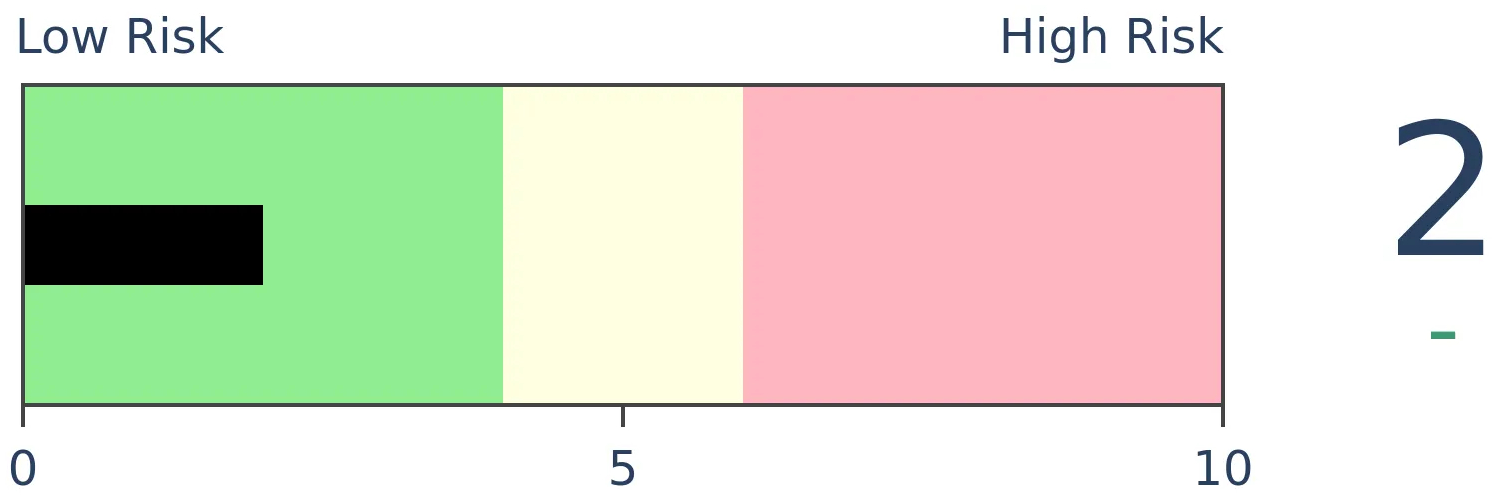
Bonds
|
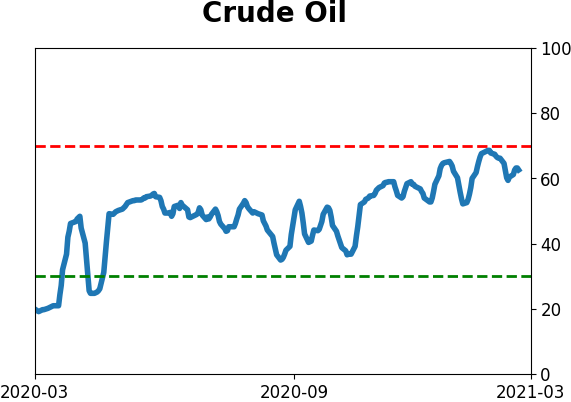
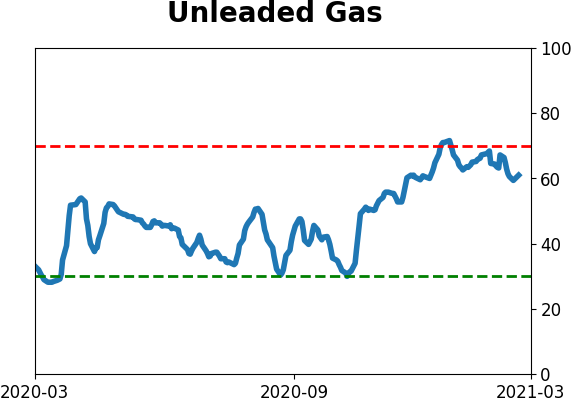
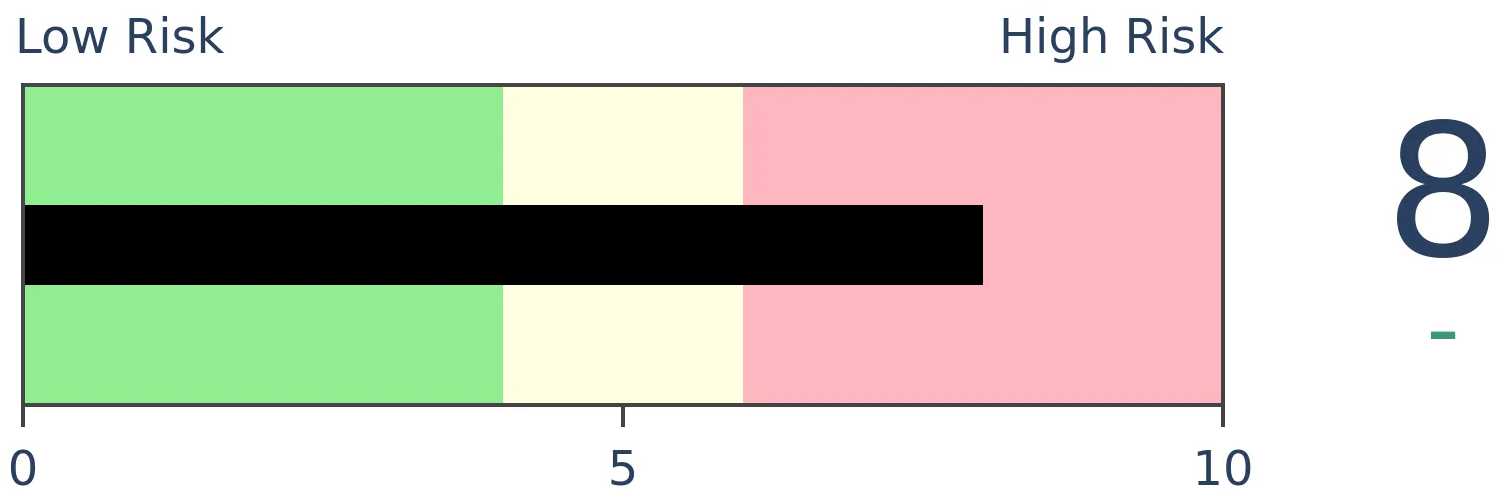
Crude Oil
|
|
Gold
|
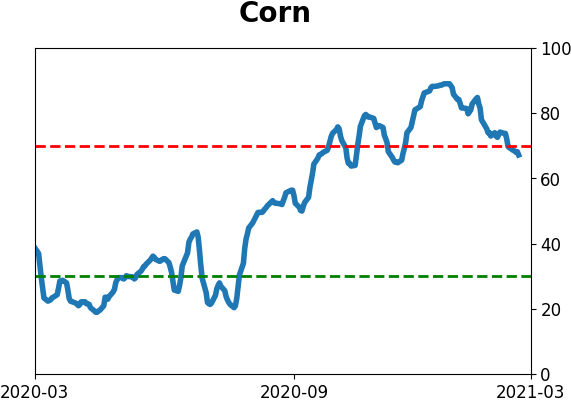
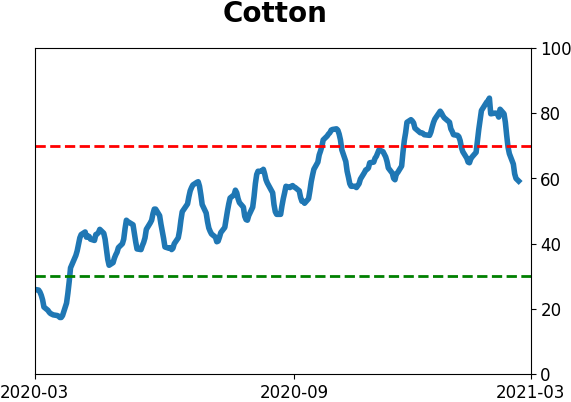
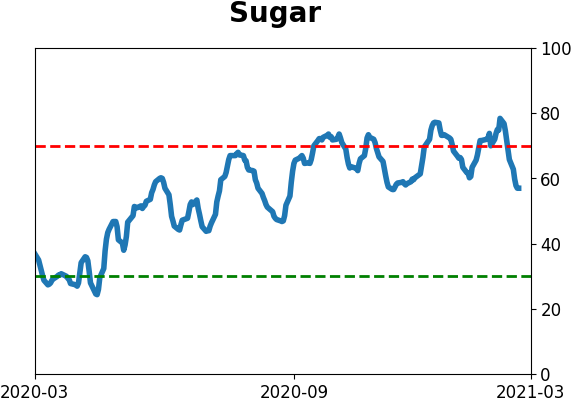
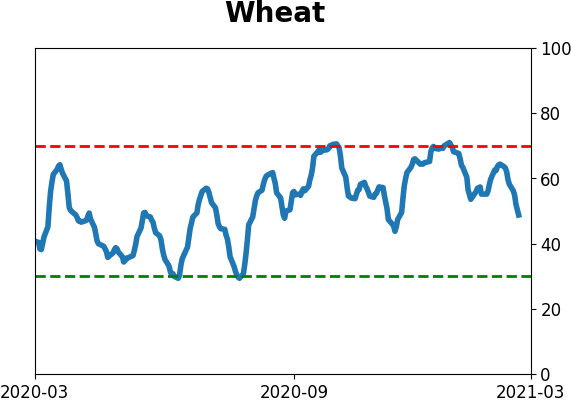
Agriculture
|
|
Research
BOTTOM LINE
In aggregate, some of our most consistent and broad-based indicators are showing that investors are still in risk-on mode. The biggest danger is that risk-on behavior has been at a very high level for a prolonged period, which has preceded consistently poor returns.
FORECAST / TIMEFRAME
SPY -- Down, Medium-Term
|
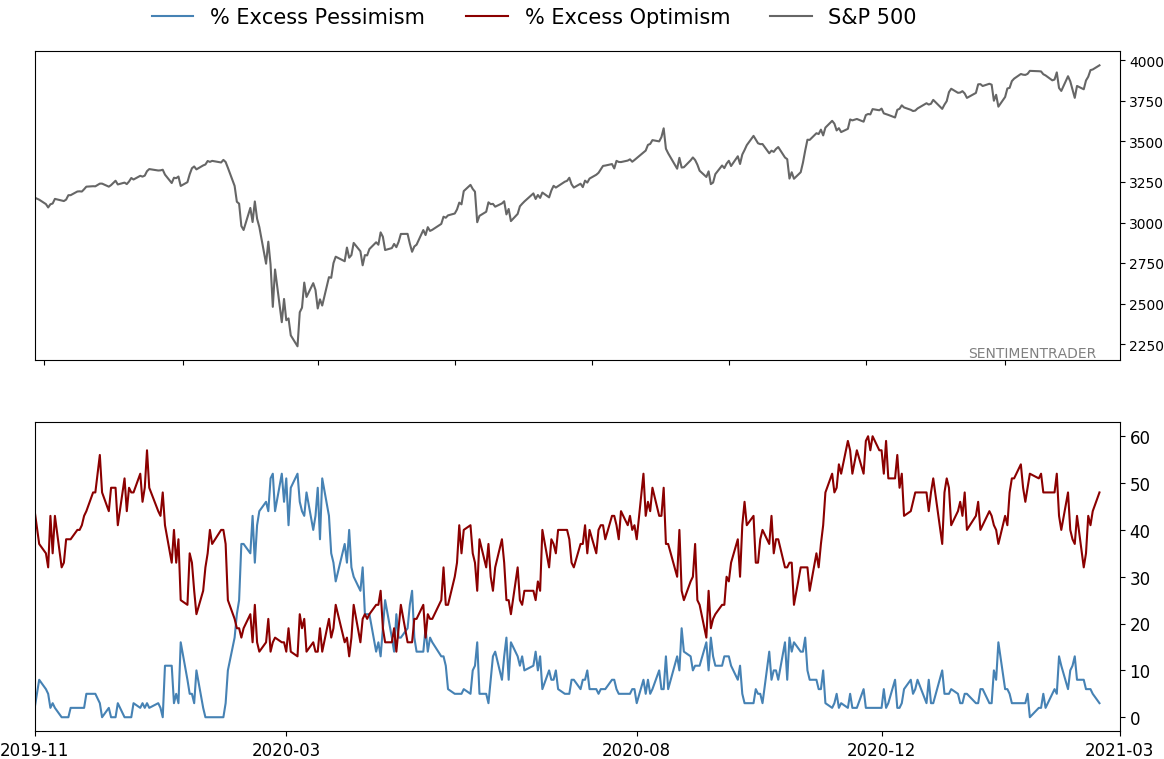
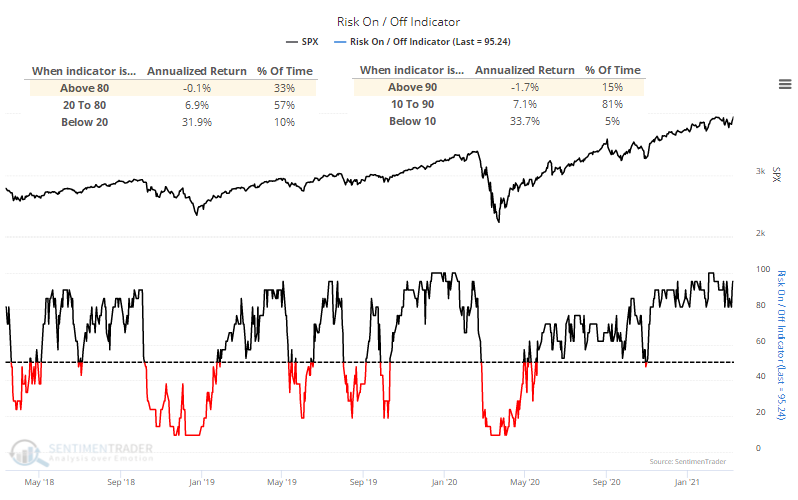
The new Risk-On / Risk-Off Spotlight page shows that most of the core indicators are still in risk-on mode. As long as that's the case, investors tend to be in buy-the-dip mode, which we saw again last week.
Like many other positive developments we've looked at over the last month or two, the biggest caveat is simply that the environment has been so positive for so long.
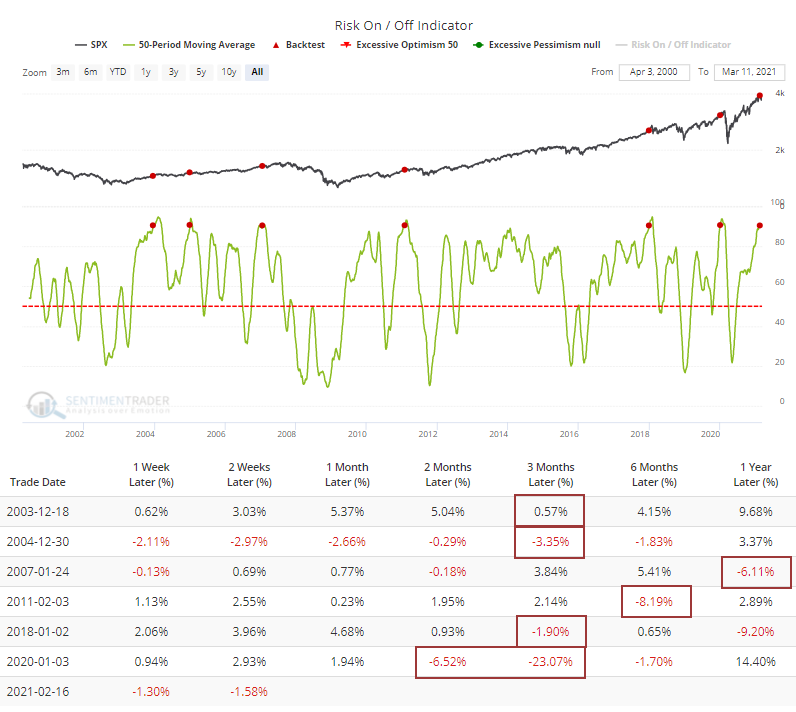
By the end of last week, nearly 100% of the indicators were in risk-on mode. That's so high that it has preceded weak returns. We should generally expect prices to rise when behavior is showing a risk-on mode. But when it gets above 80%, the S&P's annualized return was -0.1% and above 90% it was -1.7%.
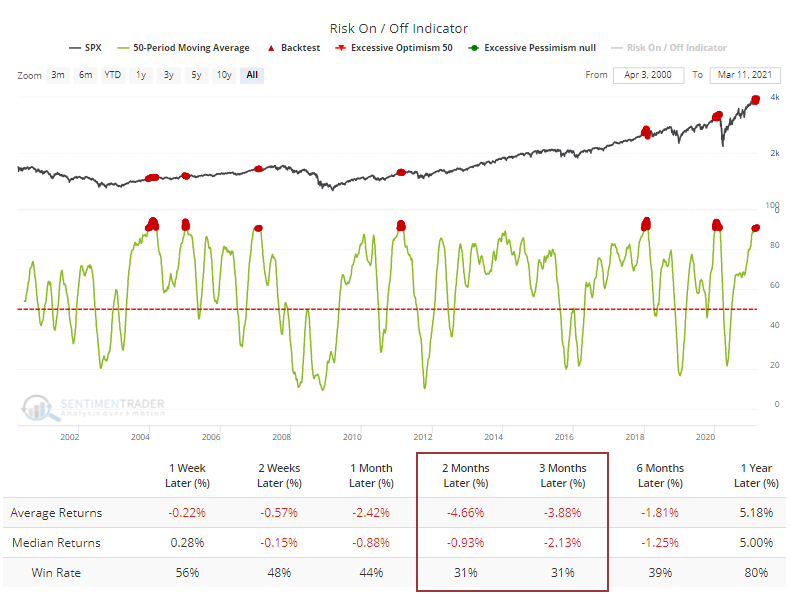
A risk-on mentality has been so prevalent for such a prolonged period that the 50-day average of the aggregate indicator has climbed above 90.5%, meaning that an average day over the past 50 sessions has seen more than 90% of the indicators displaying risk-on behavior.
The Backtest Engine shows us that when the 50-day average has been this high, future returns were poor. Out of 162 days that met the criteria, only 50 of them showed a positive return 3 months later. To run this test, click here and then the Run Backtest button. Premium users will be able to test the full history, dating back to 2000.
Higher-beta indexes like the Nasdaq Composite fared even worse. Using that index in the Backtest Engine, the median 3-month return was -3.9% with only a 24% probability of seeing a positive return.
If we only look at the first signal in 3 months, then all of them saw any further short-term gains peter out or turn to an outright negative in the months ahead.
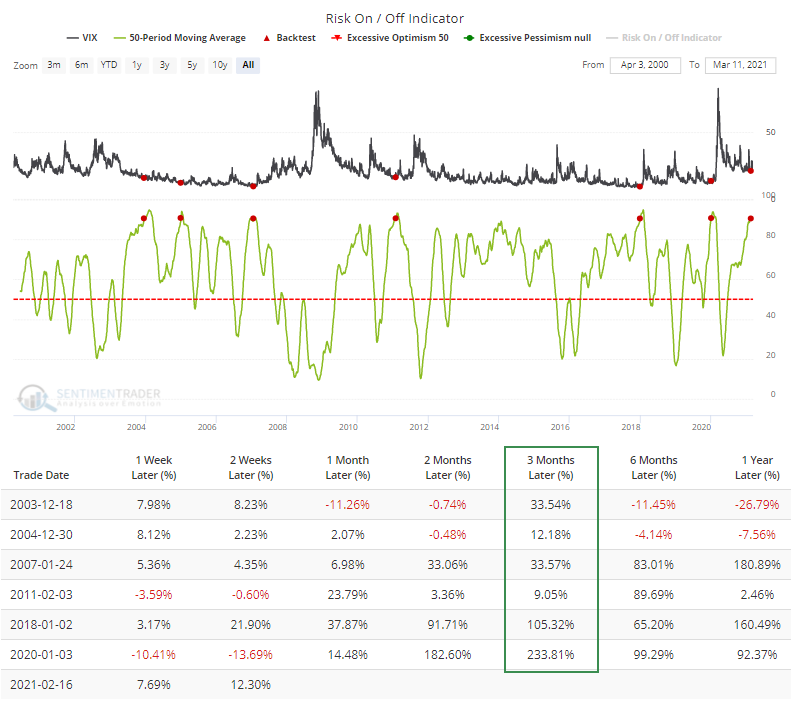
If we substitute the VIX for the S&P in the Backtest Engine, then we can see how much implied volatility or "fear" tended to spike over the next few months. It rose every time, and its average gain was substantial with a median gain of 34% and an average of 71%. This one is perhaps different in that it's triggering from a higher level.
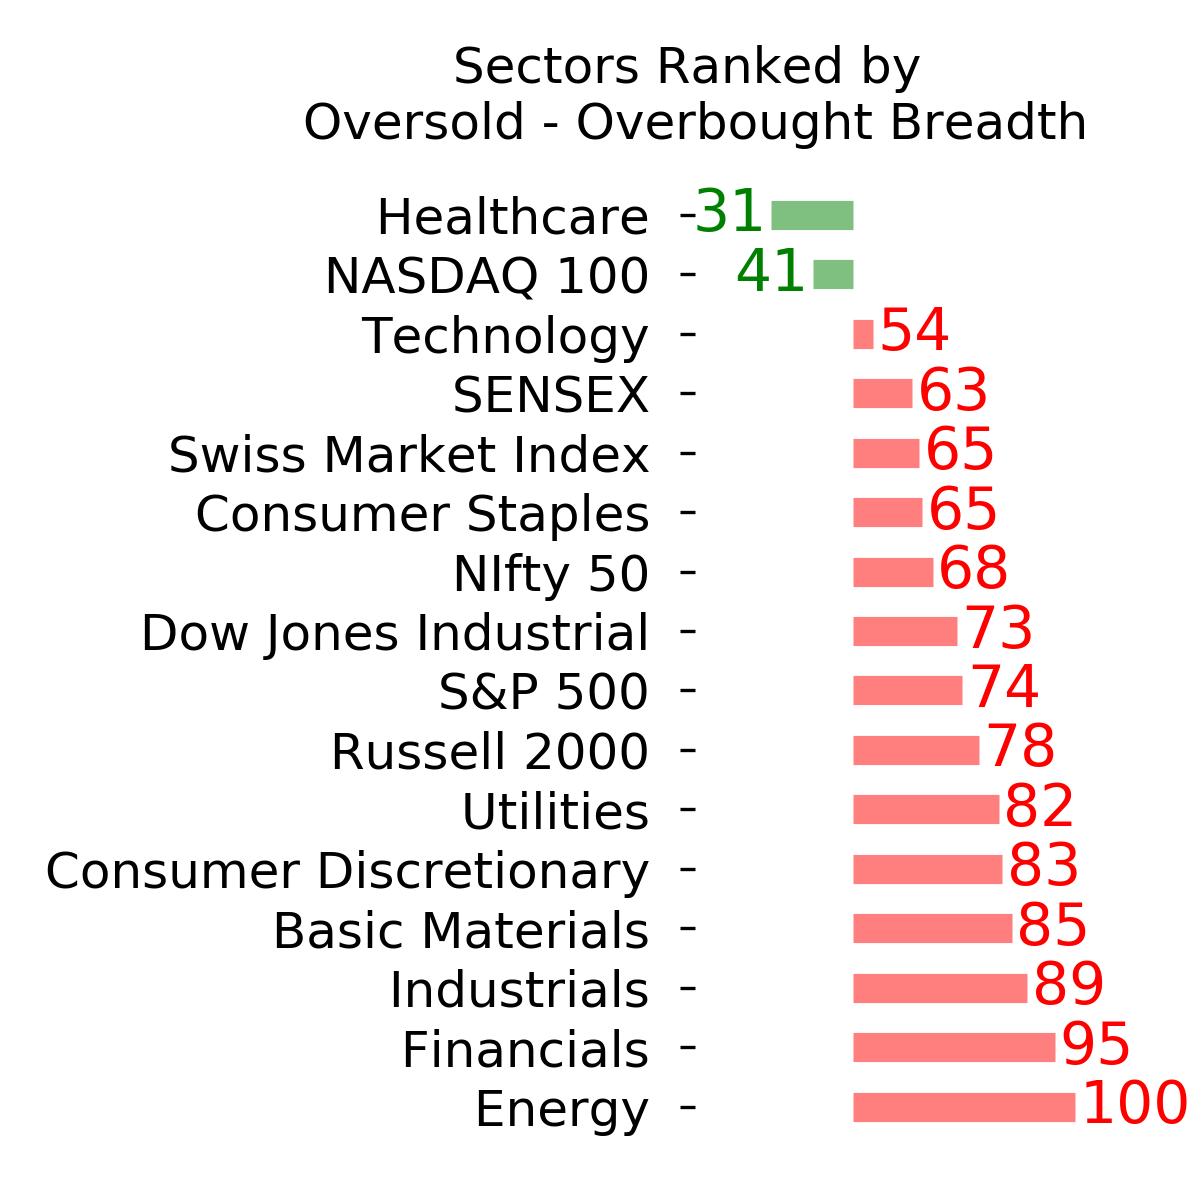
We're still not seeing some of the divergent internal breadth deterioration that often triggers after true extremes in sentiment. For the most part, other than some odd days here and there, the indexes are still showing internal strength. It would be unusual, though not unprecedented, to see a sharp and prolonged downturn given those conditions.
The biggest problem is simply that things have been so good for so long, and investors have grown so comfortable, that forward returns have consistently been weak and extremely unlikely to be sustained.
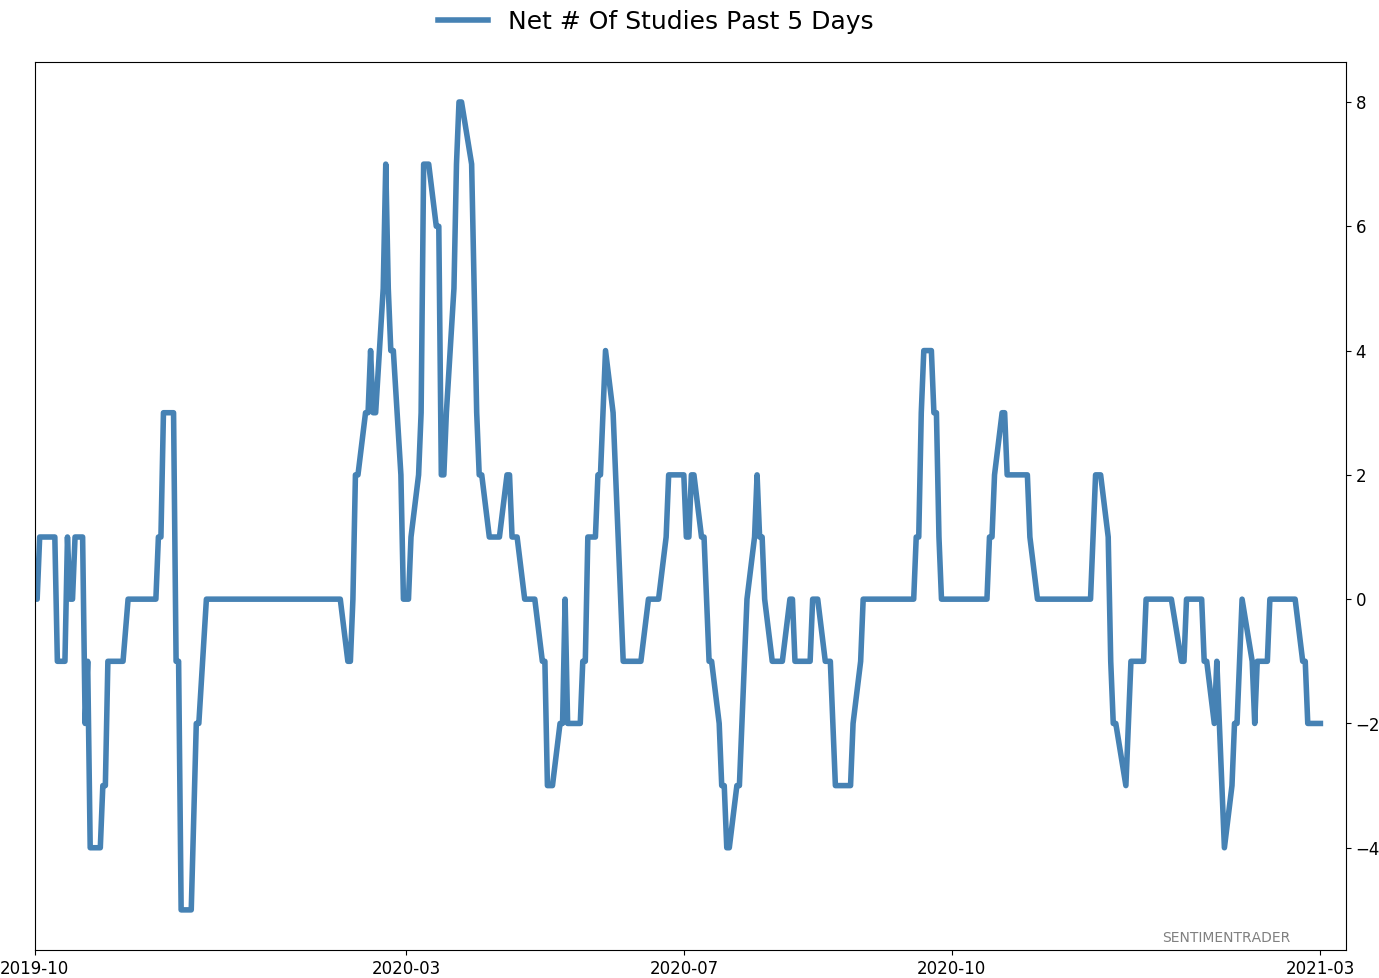
Active Studies
| Time Frame | Bullish | Bearish | | Short-Term | 0 | 0 | | Medium-Term | 2 | 10 | | Long-Term | 16 | 4 |
|
Indicators at Extremes
Portfolio
| Position | Description | Weight % | Added / Reduced | Date | | Stocks | RSP | 4.9 | Reduced 4% | 2021-02-09 | | Bonds | 30.0% BND, 8.8% SCHP | 38.8 | Added 15.1% | 2021-02-18 | | Commodities | GCC | 2.3 | Reduced 2.1%
| 2020-09-04 | | Precious Metals | GDX | 9.0 | Added 0.1% | 2021-02-18 | | Special Situations | 7.3% XLE, 4.8% PSCE | 12.1 | Reduced 5.6% | 2021-02-18 | | Cash | | 32.8 | | |
|
Updates (Changes made today are underlined)
With a market that has seen the kinds of broad participation and big breath thrusts like we did in the fall, it's hard to become too negative. Those kinds of conditions have consistently preceded higher returns over the next 6-12 months. It's the interim that's more of an issue. Even conditions like that haven't prevented some shorter-term pullbacks. And when we combine an environment where speculation is rampant and recent days have seen an increase in cracks under the surface of the indexes, it's enough to become more defensive over a short- to medium-term time frame. We still don't have much confirmation from the price action in the indexes, so those who are more conservative would likely wait before increasing cash levels. I've decreased risk exposure a bit more, mainly in terms of energy stocks and the ANGL fund, while adding more to the broader bond market. RETURN YTD: 7.4% 2020: 8.1%, 2019: 12.6%, 2018: 0.6%, 2017: 3.8%, 2016: 17.1%, 2015: 9.2%, 2014: 14.5%, 2013: 2.2%, 2012: 10.8%, 2011: 16.5%, 2010: 15.3%, 2009: 23.9%, 2008: 16.2%, 2007: 7.8%
|
|
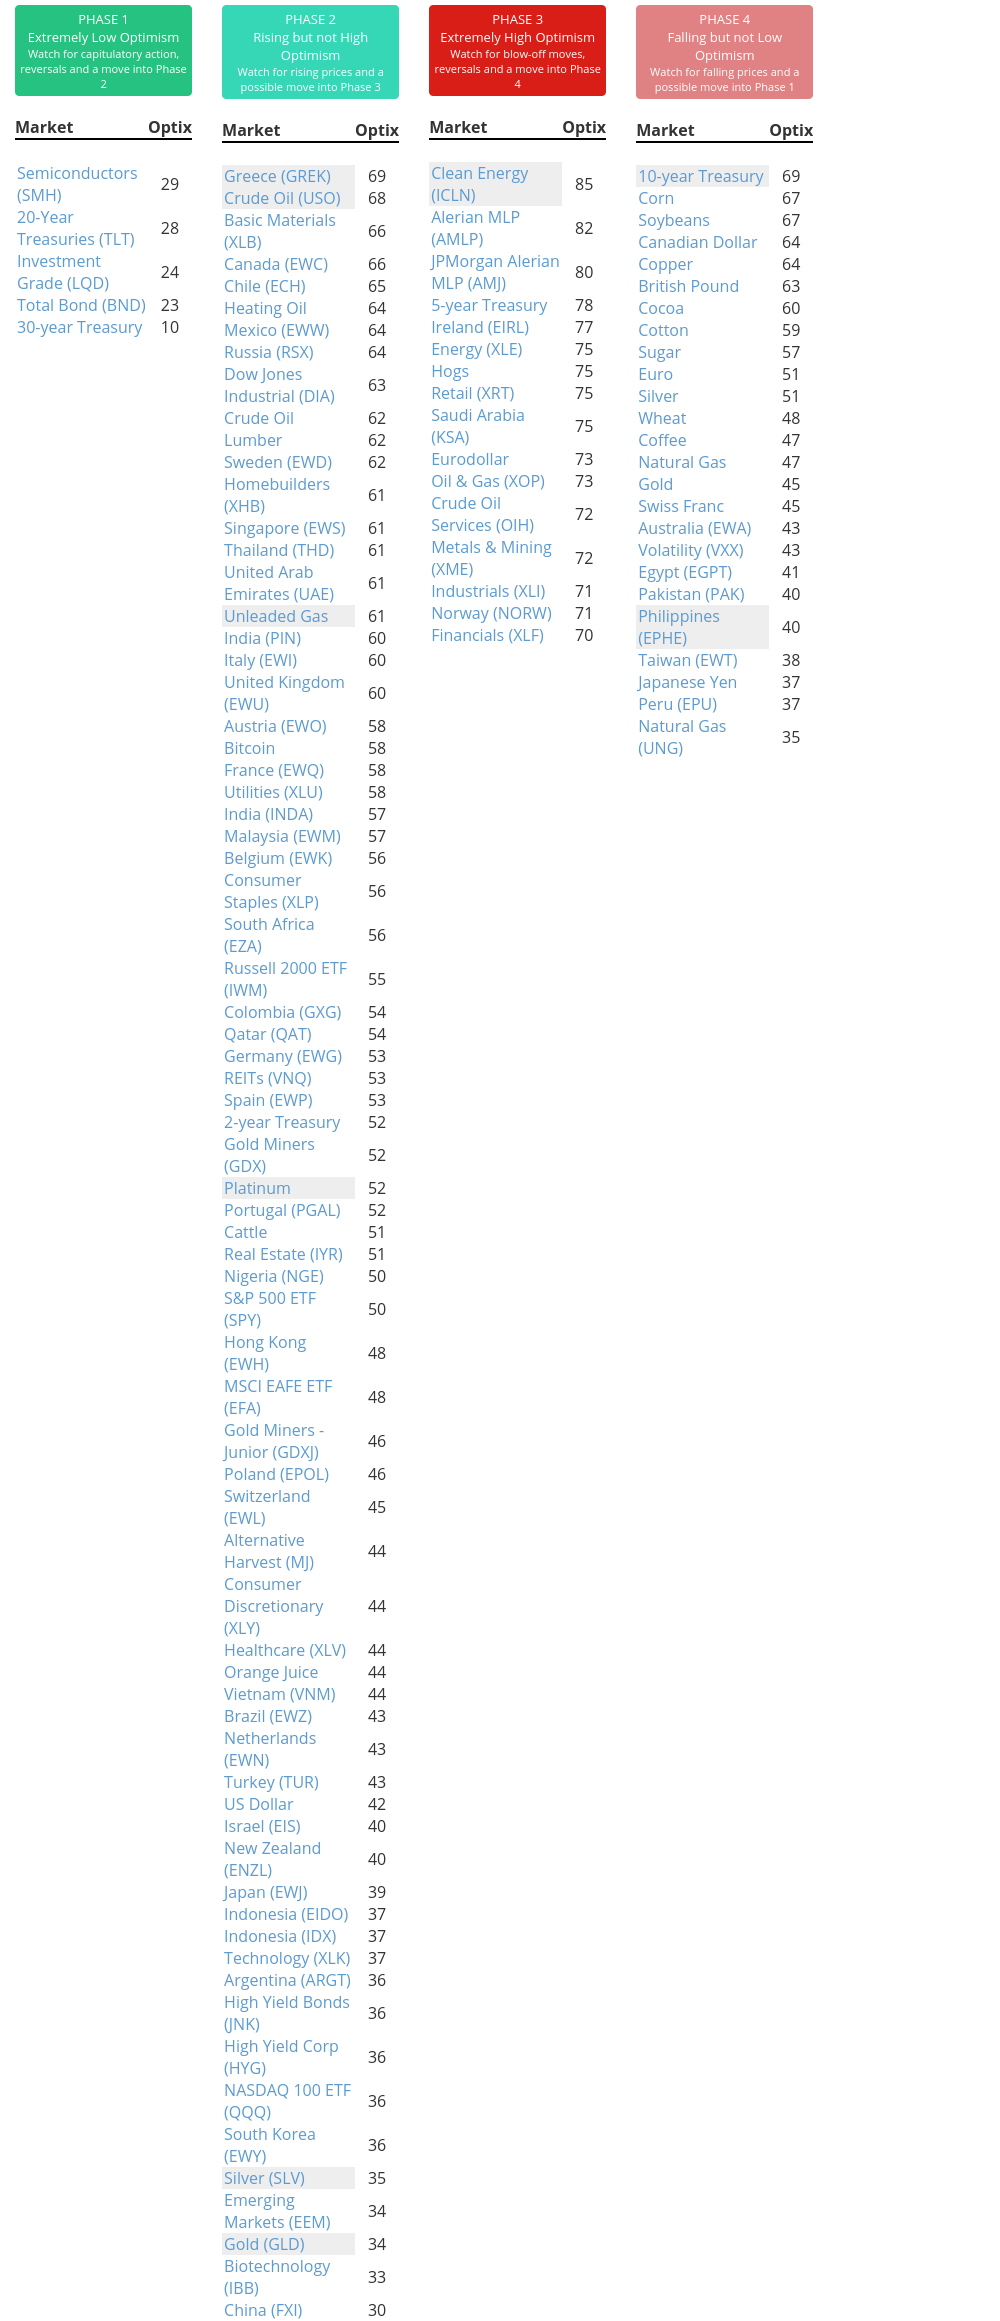
Phase Table
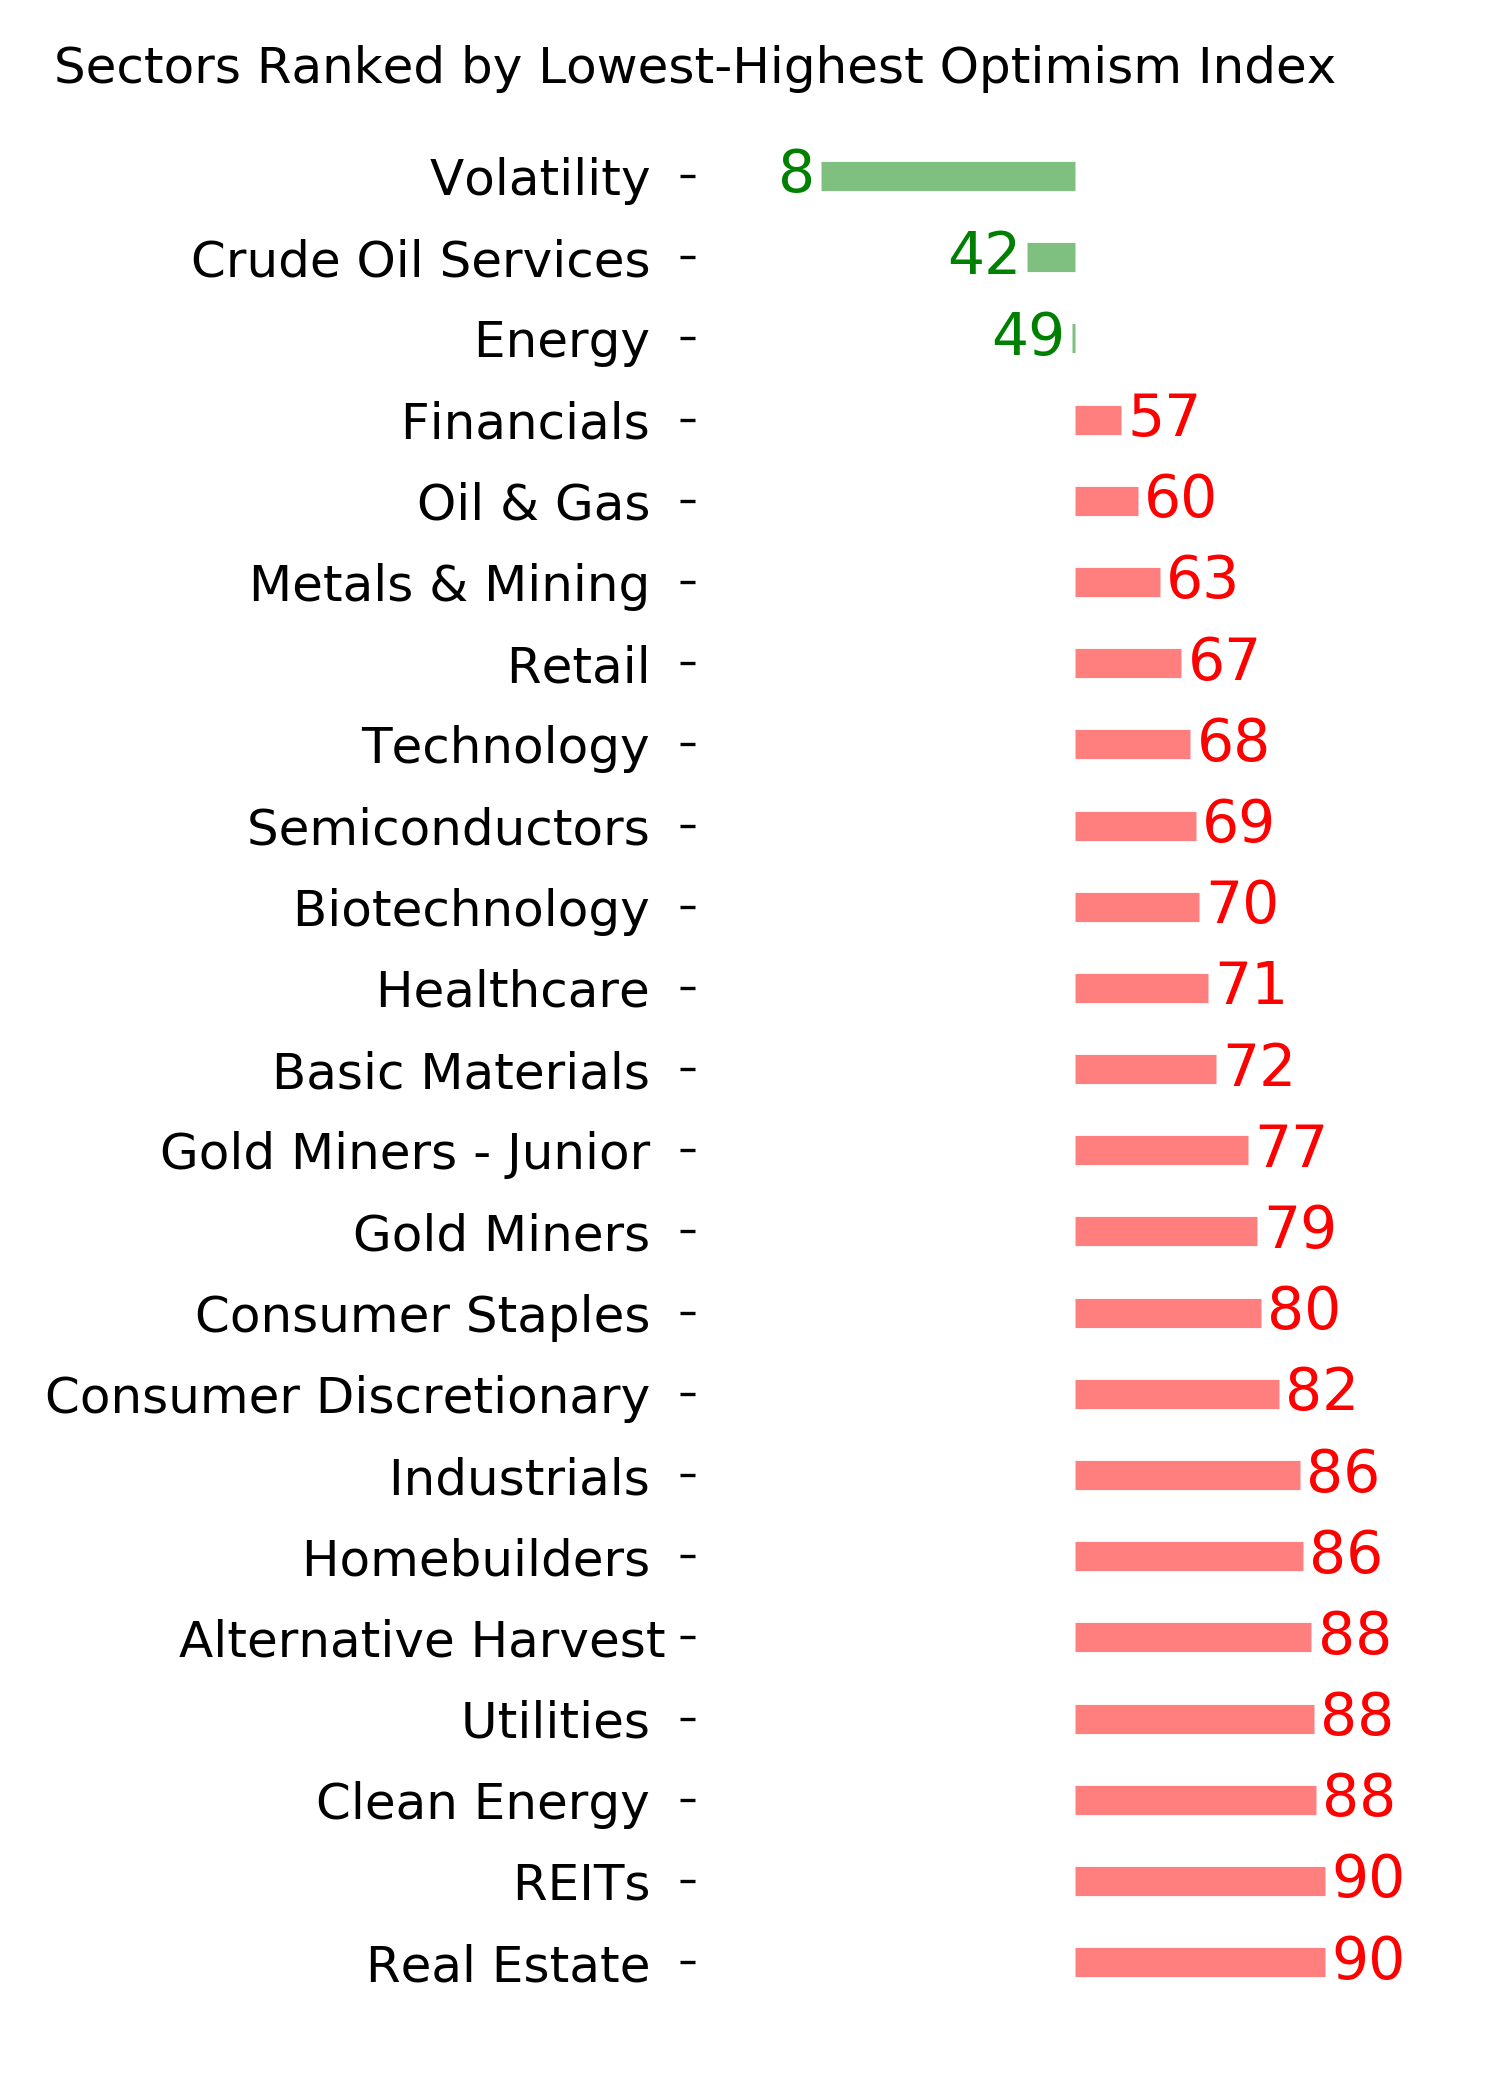
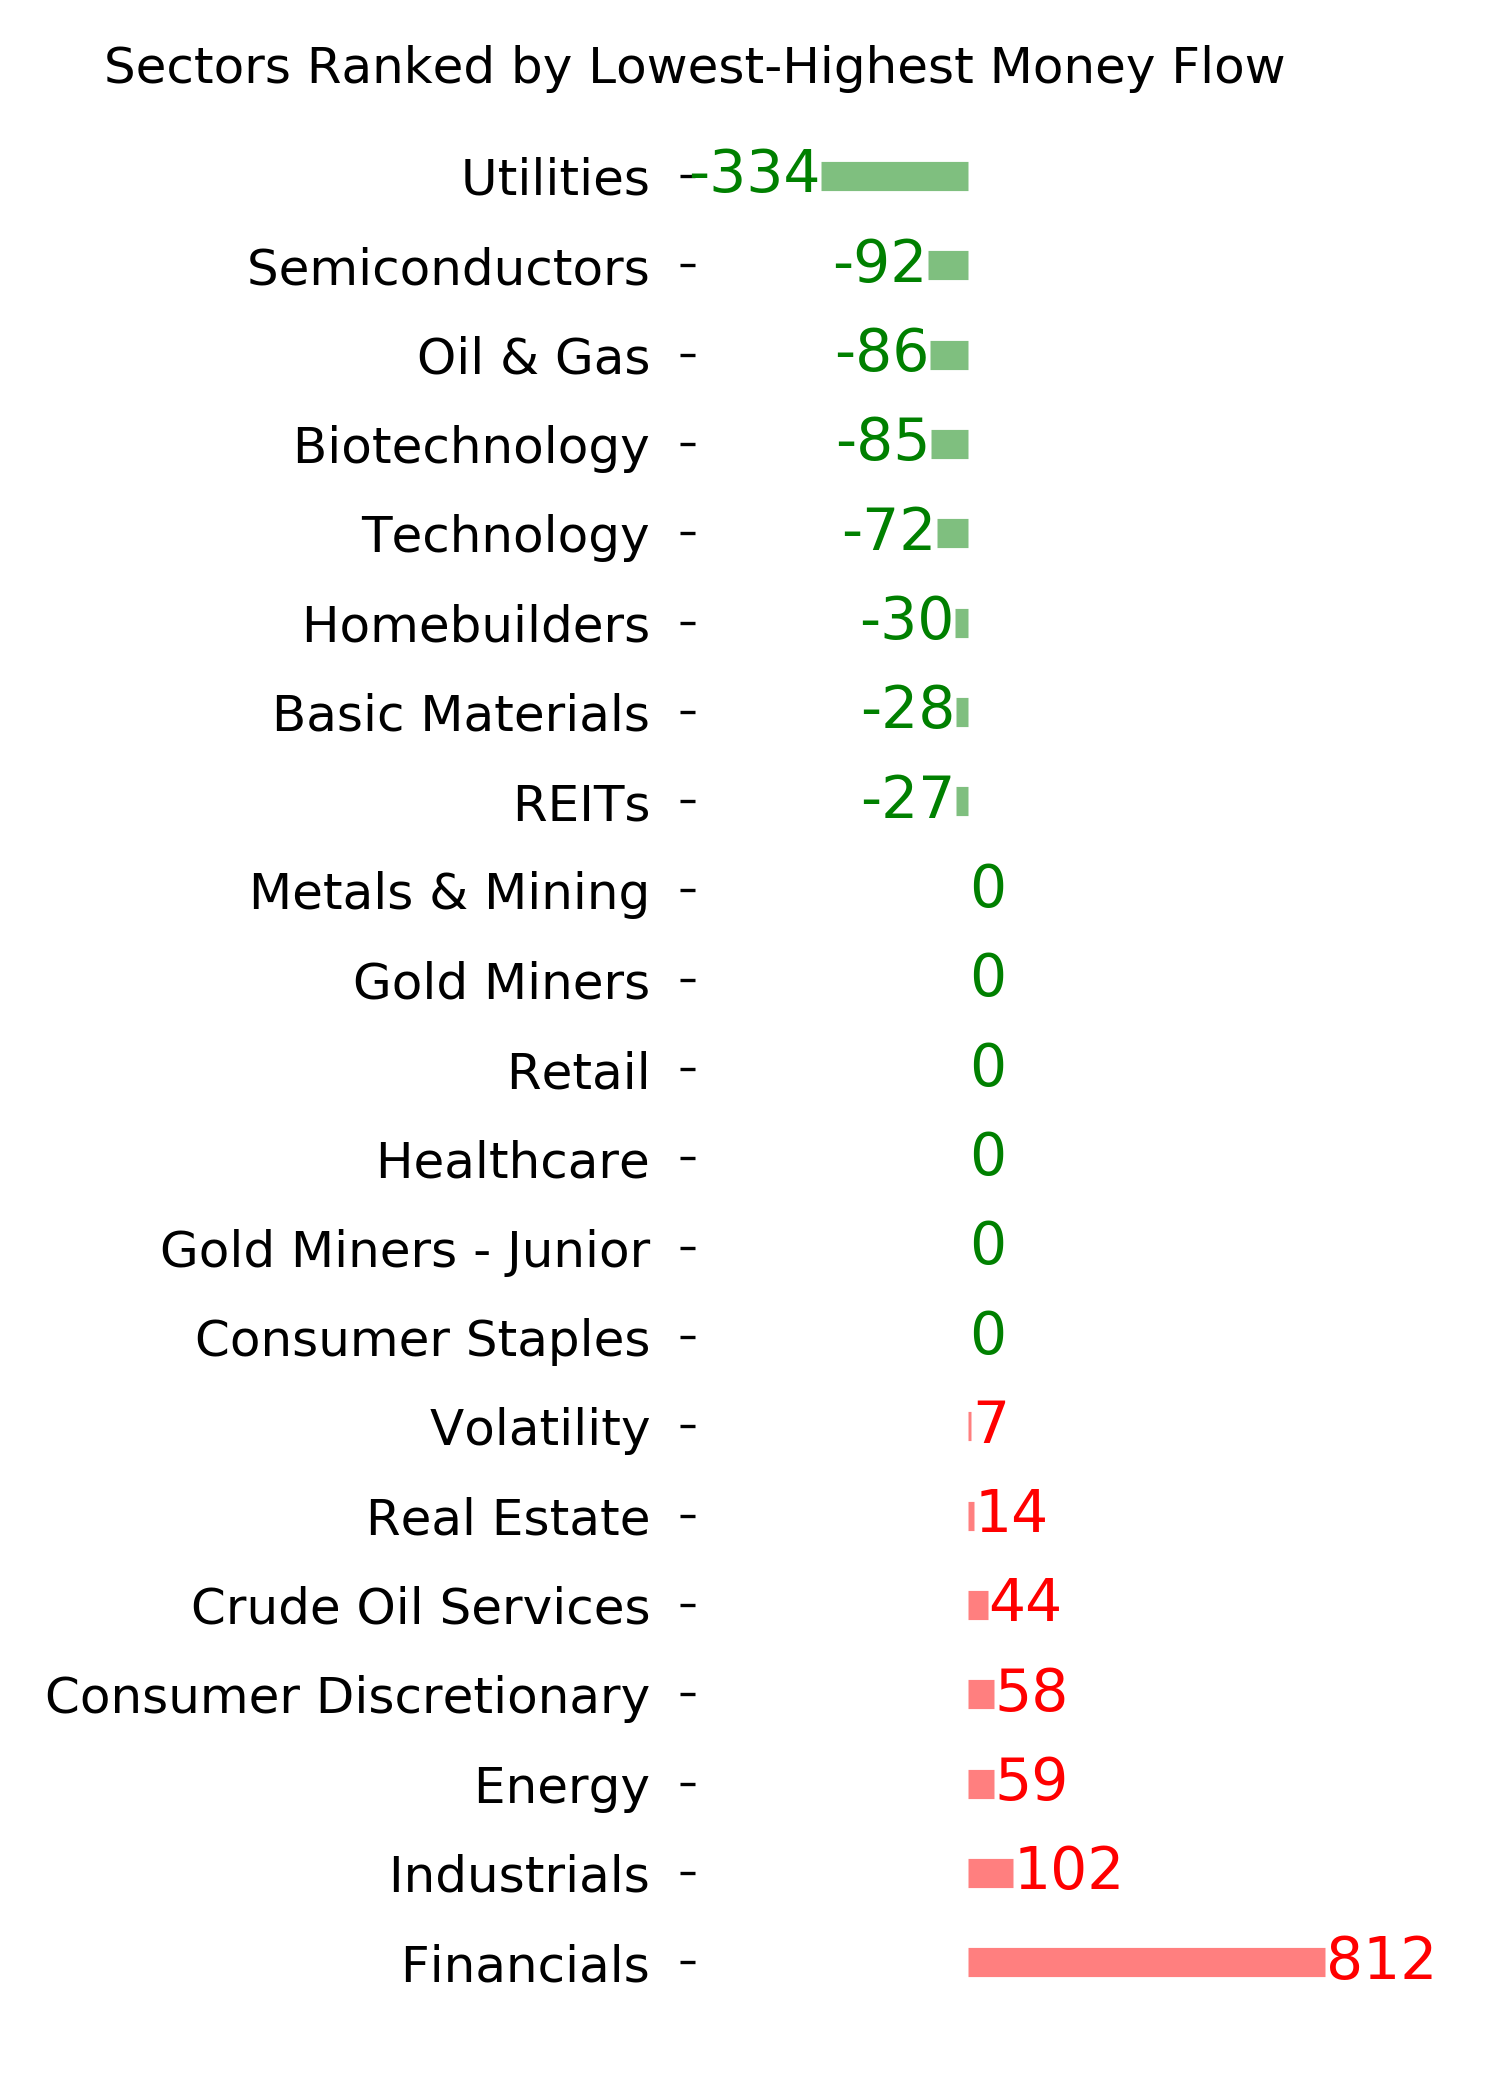
Ranks
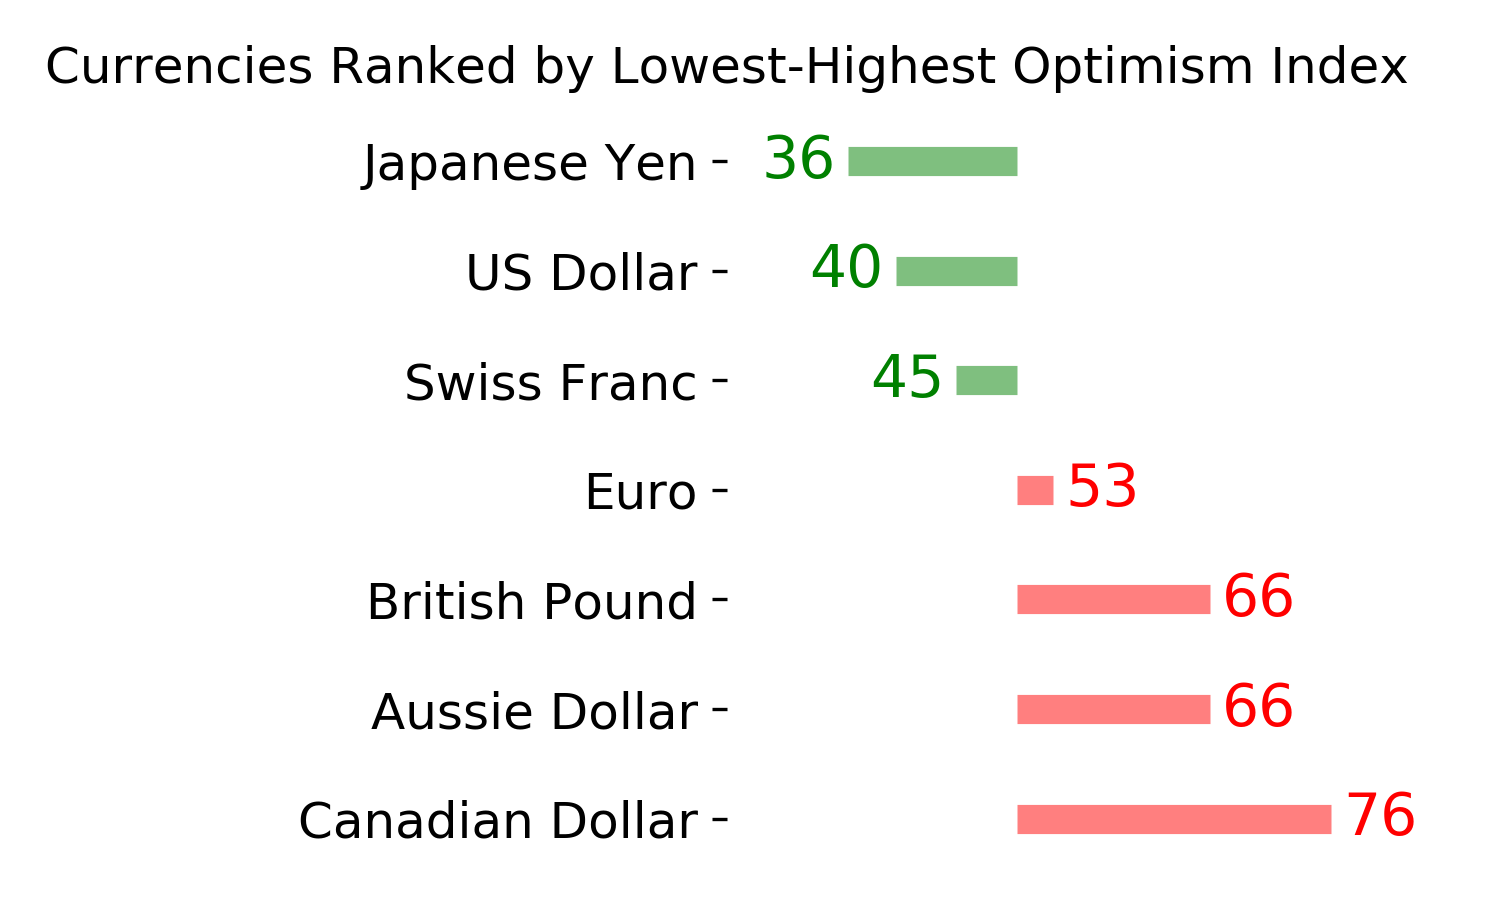
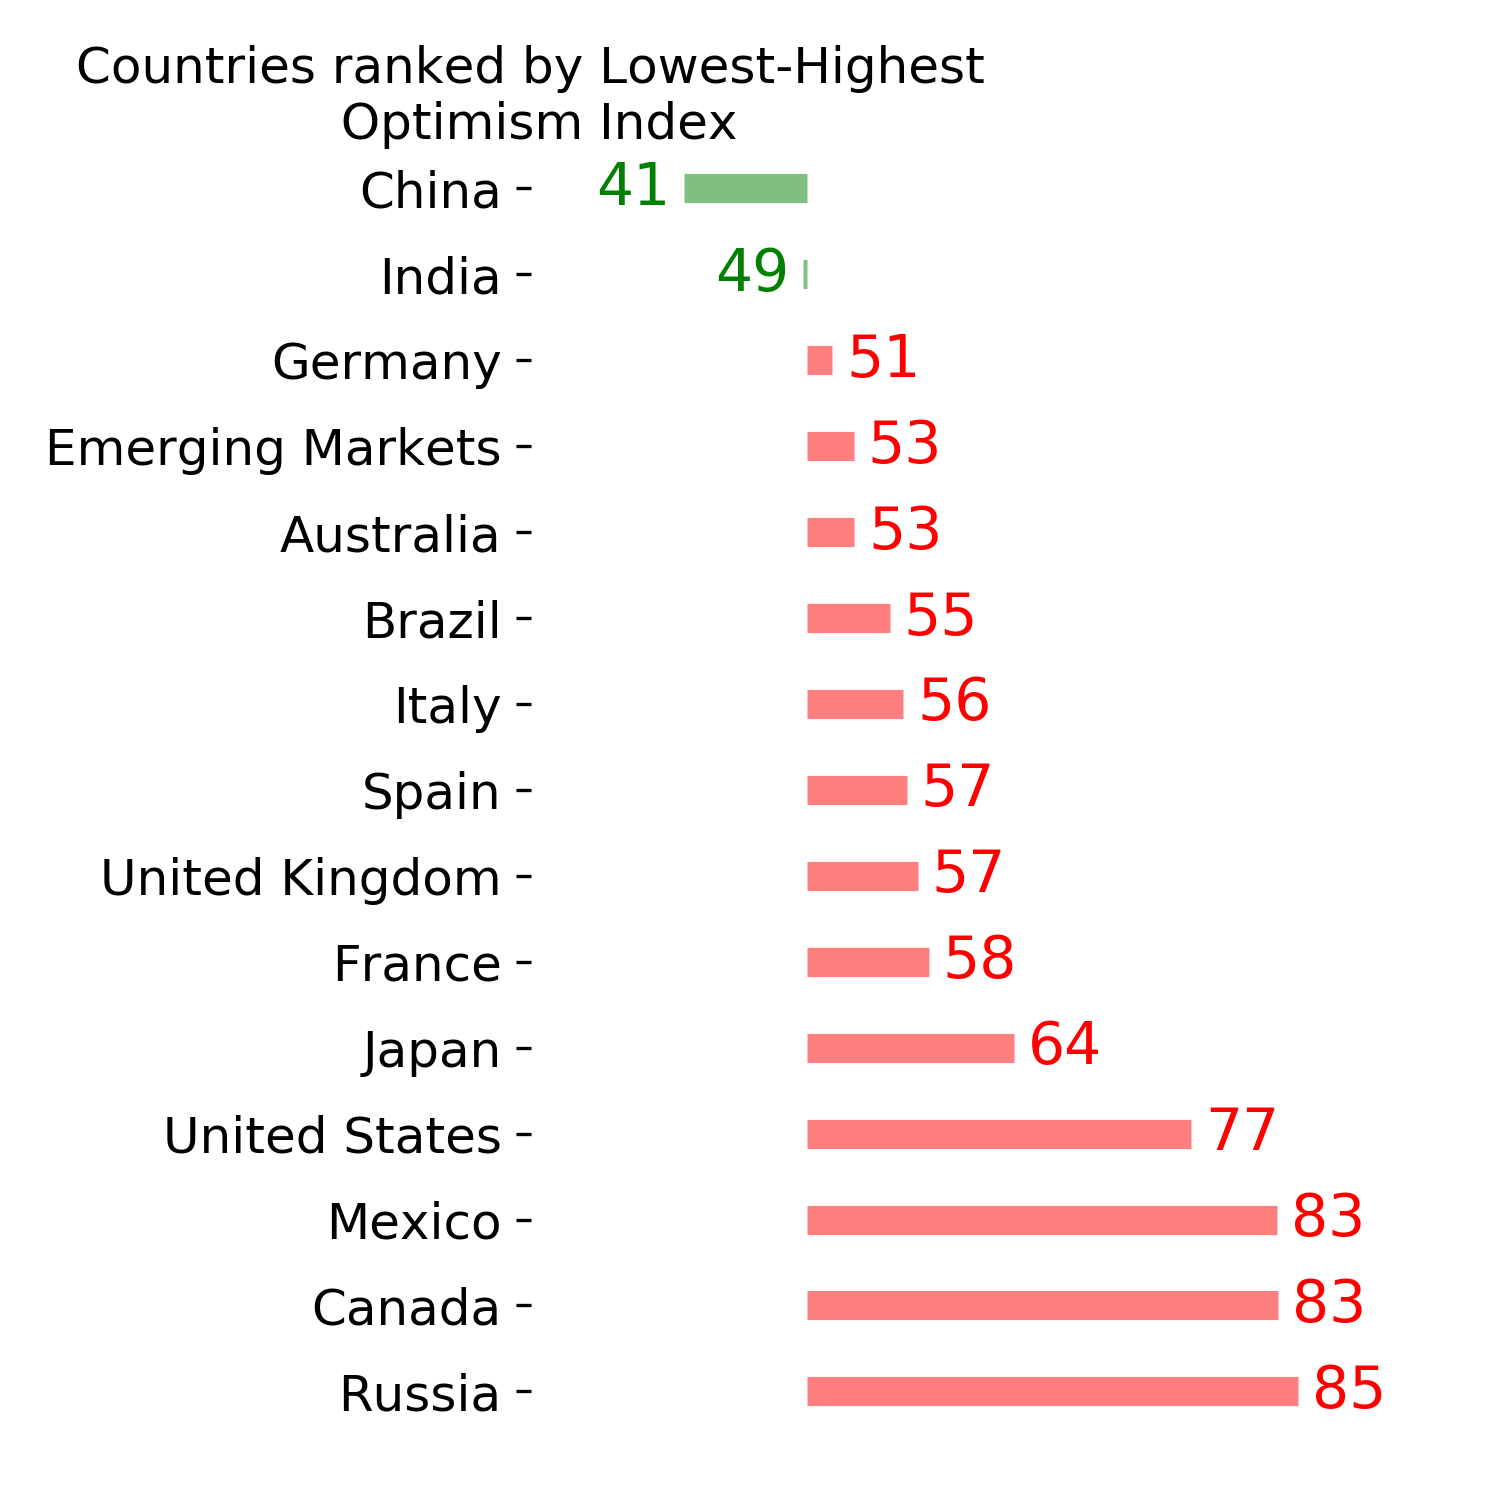
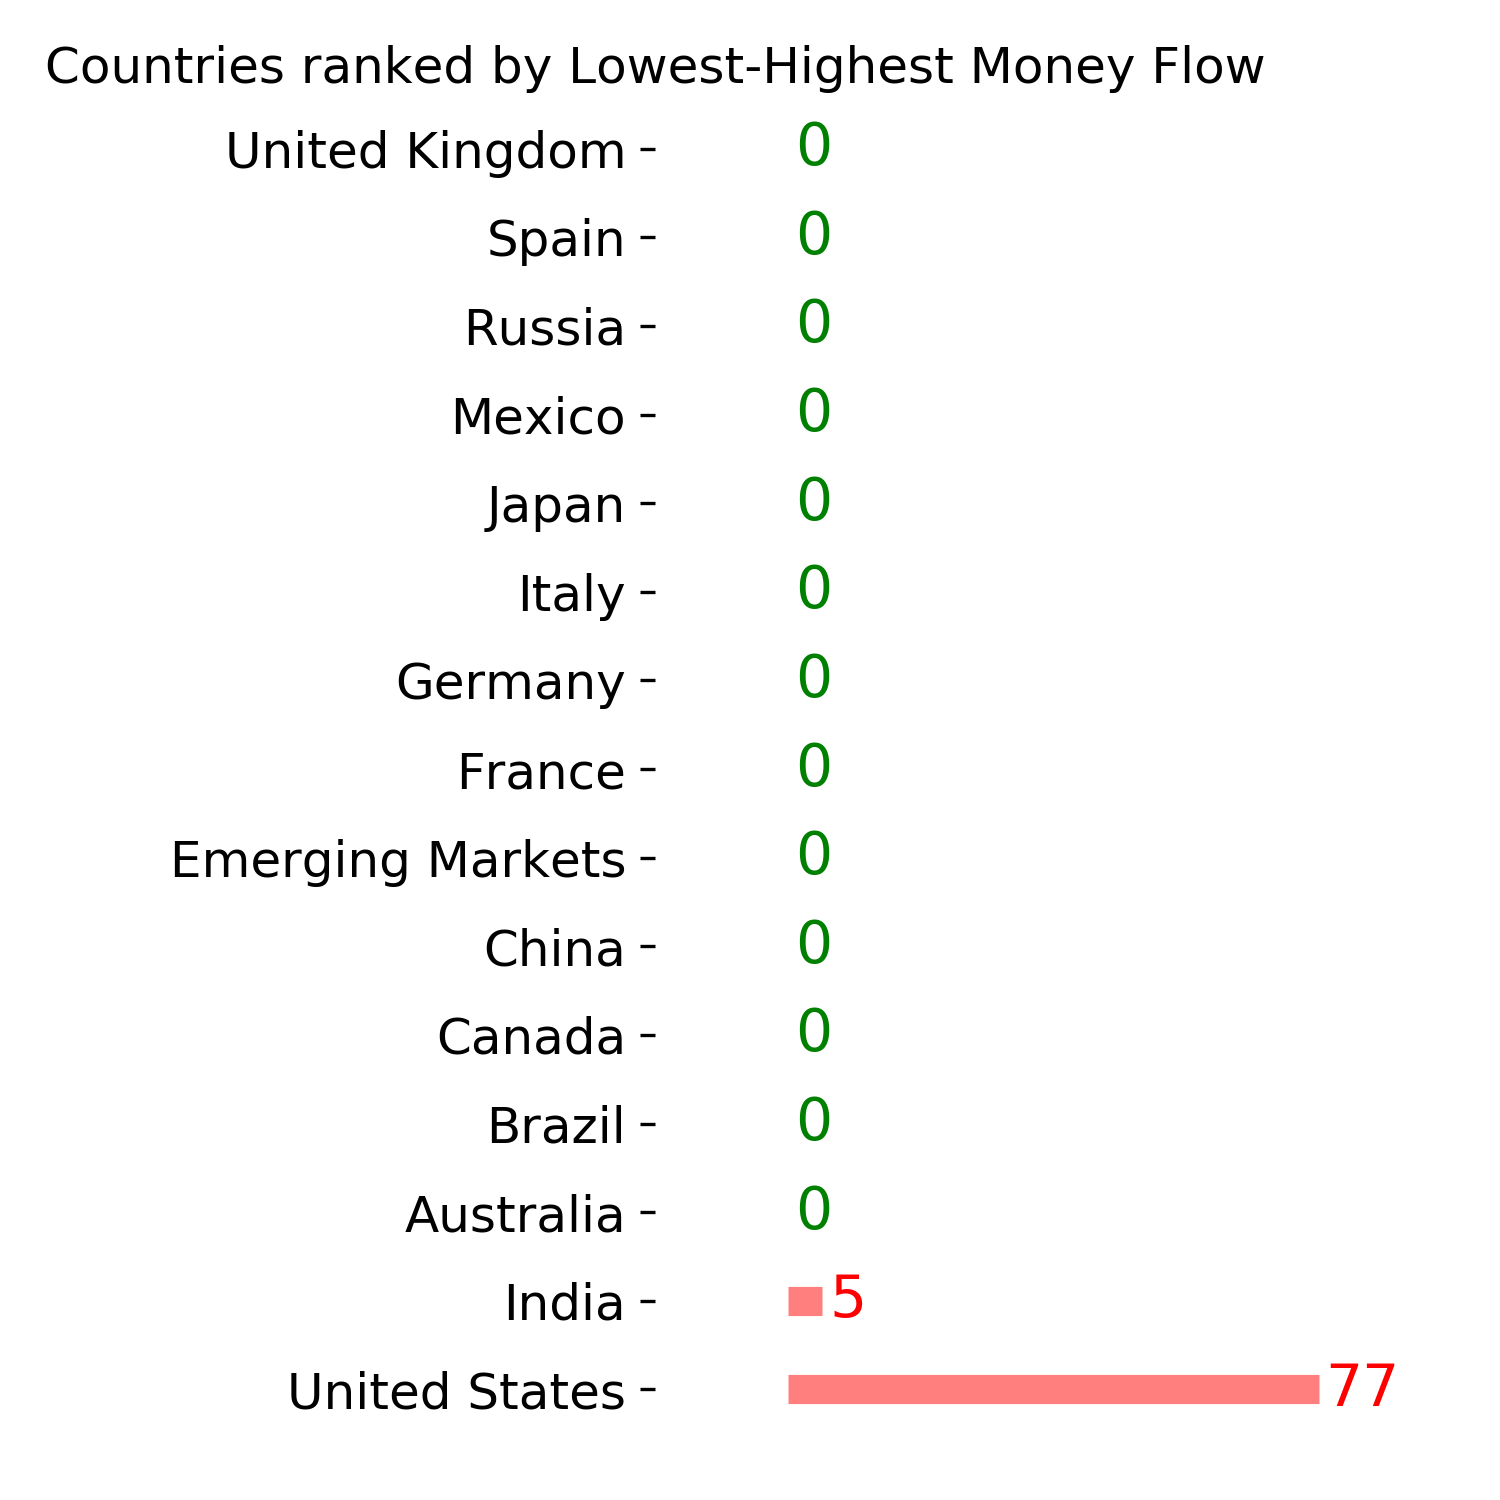
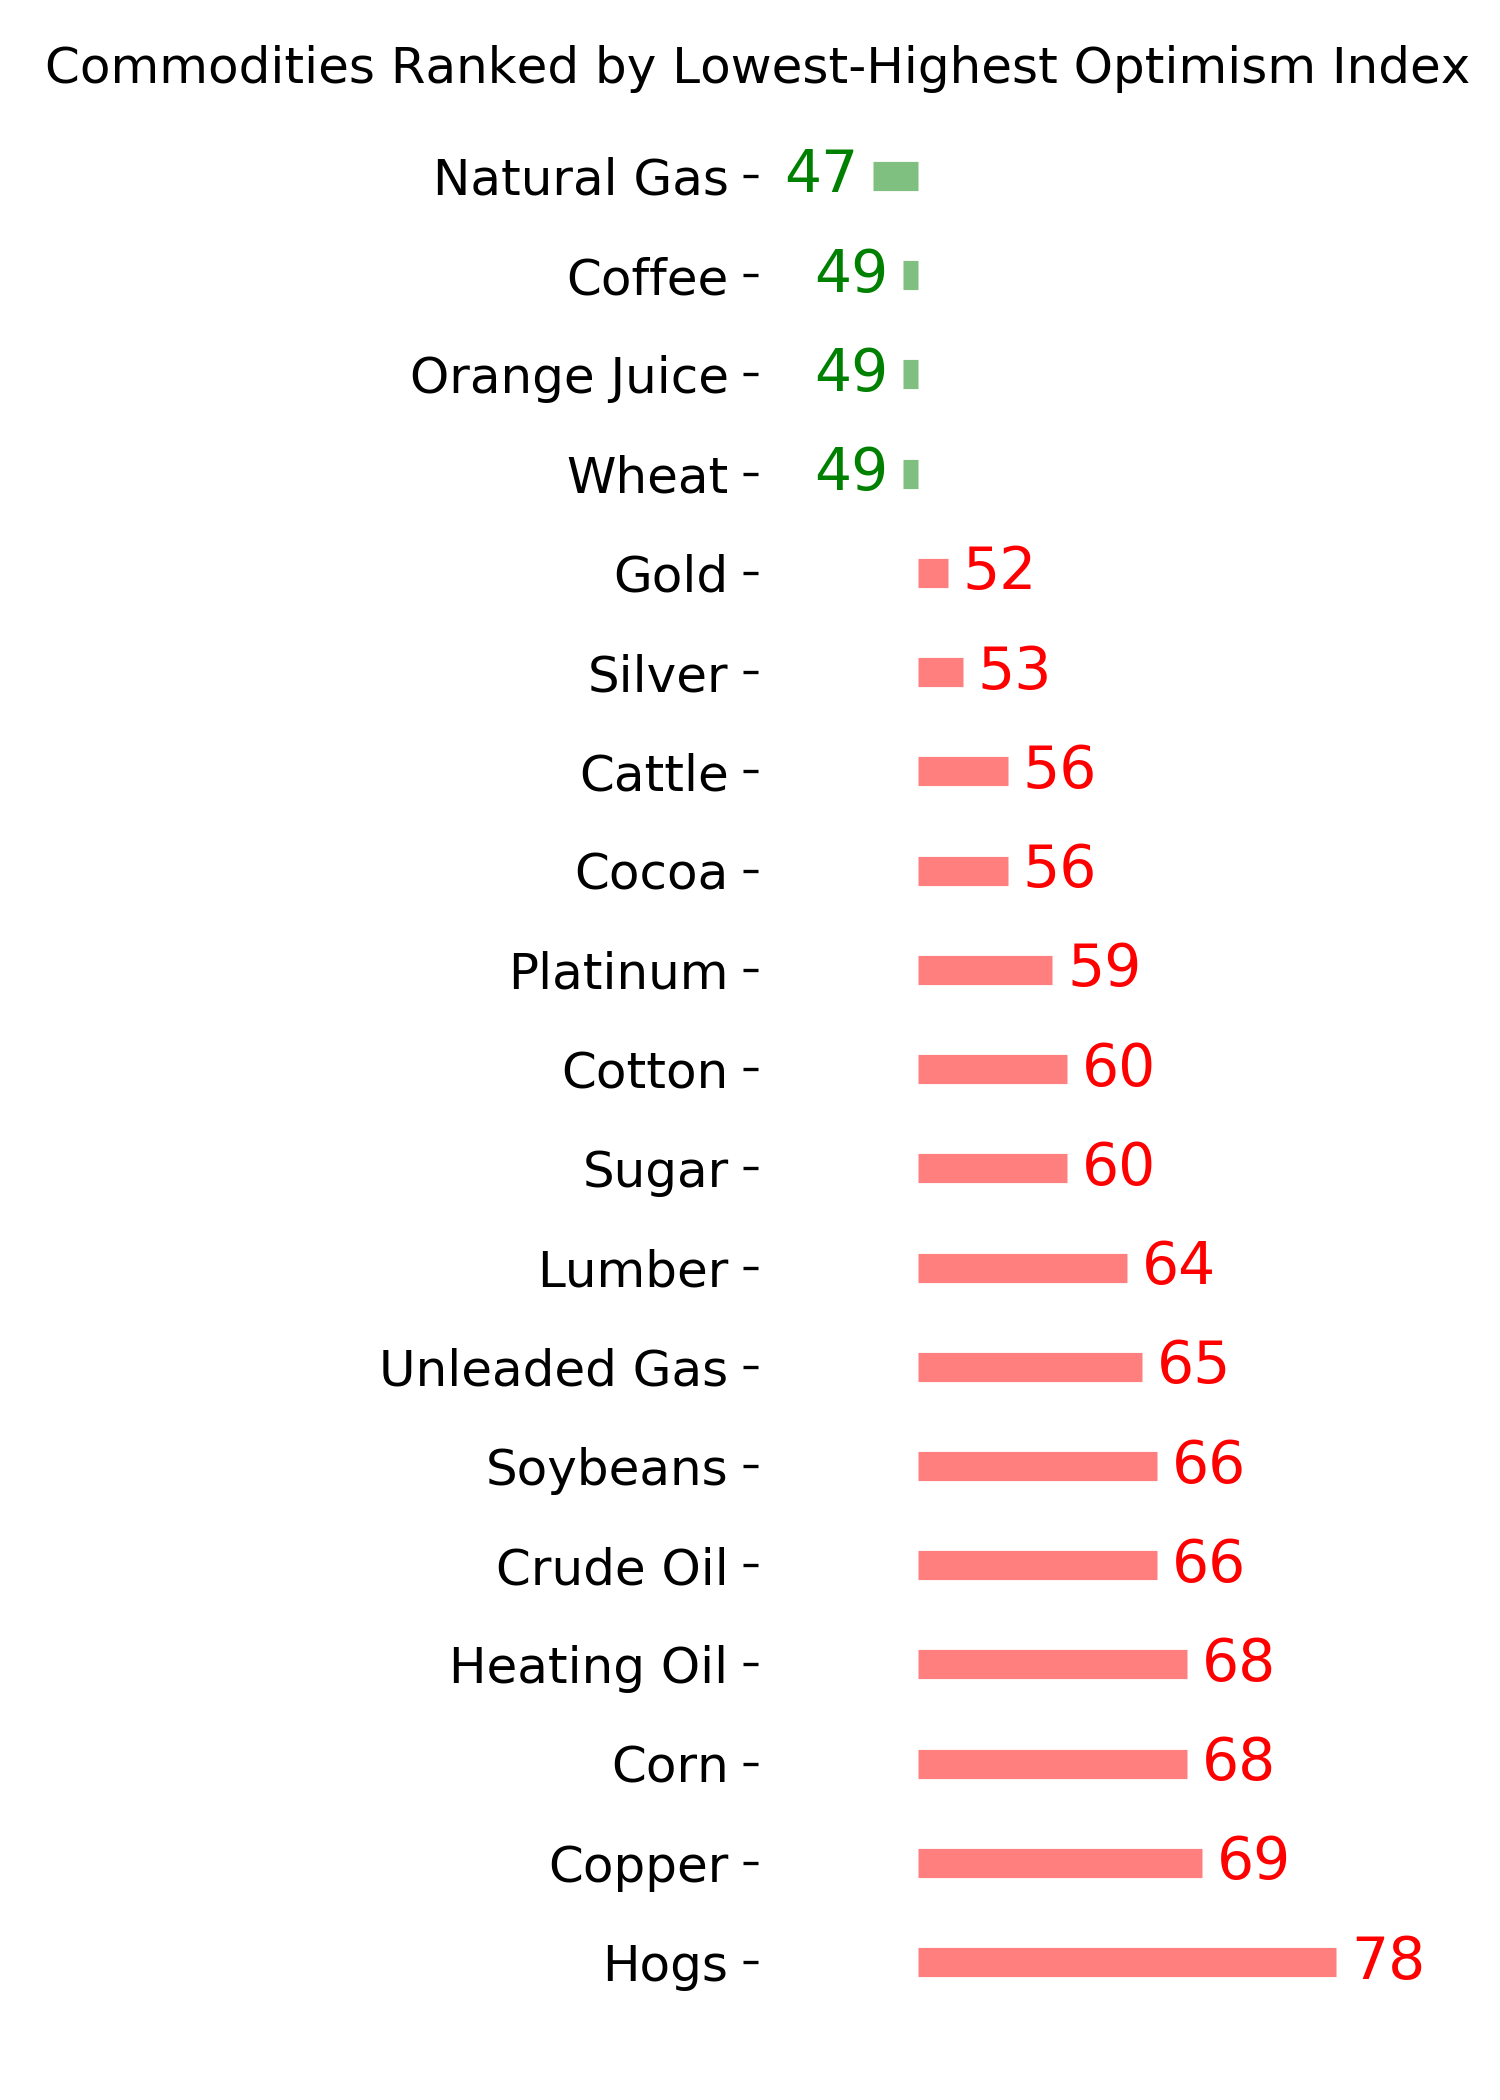
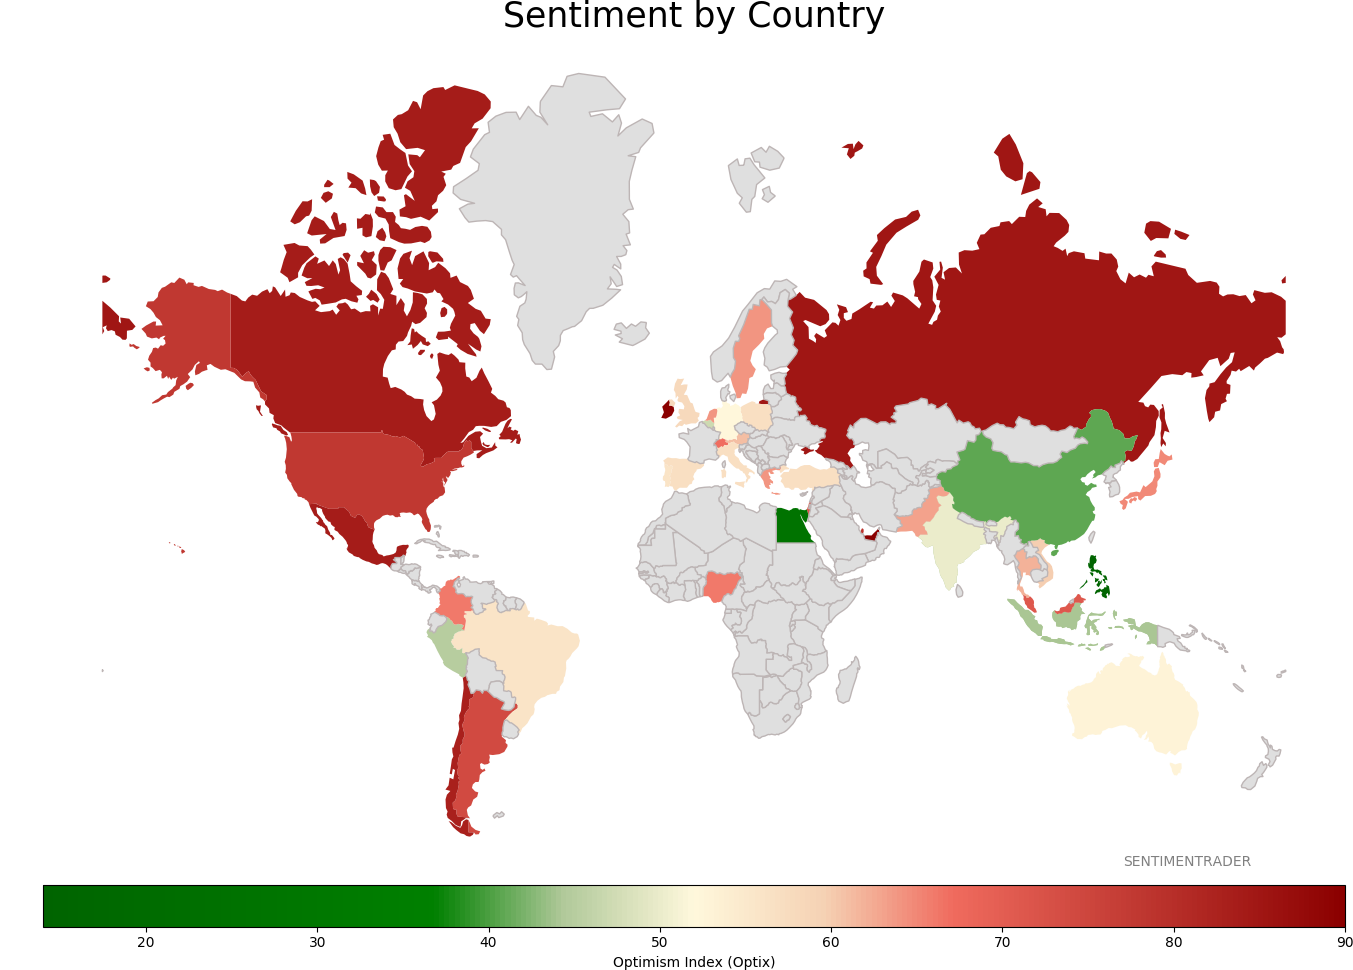
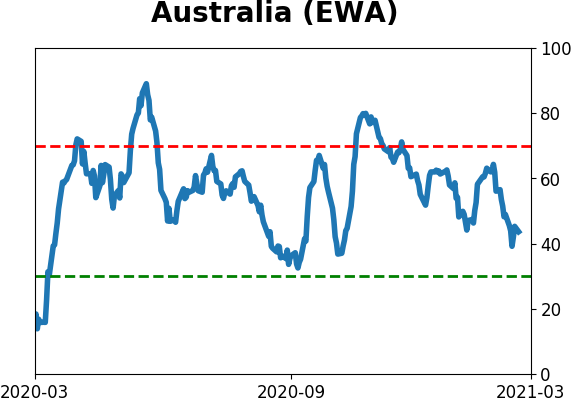
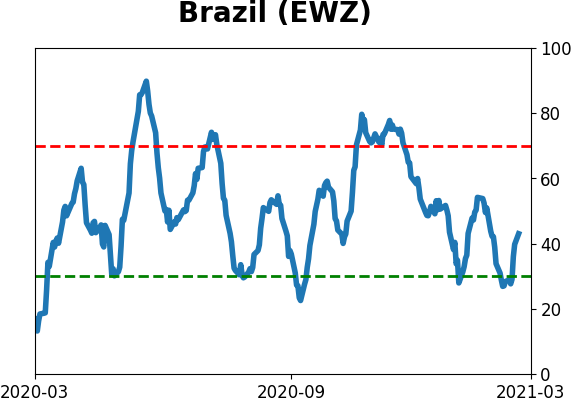
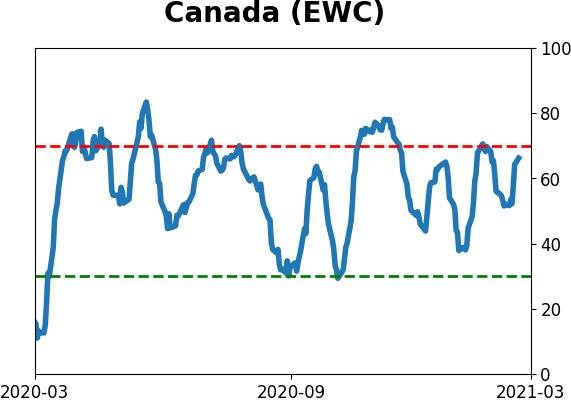
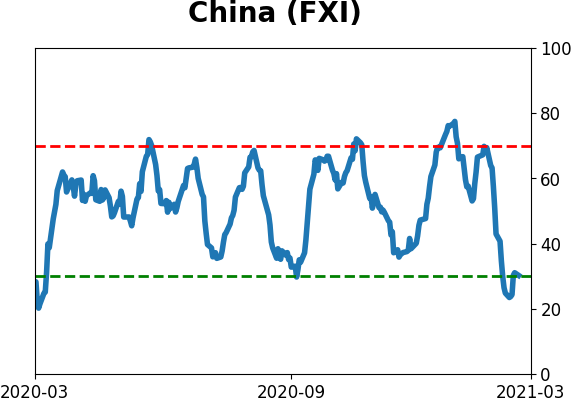
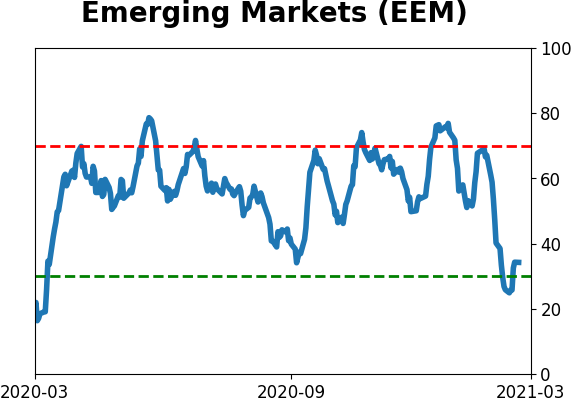
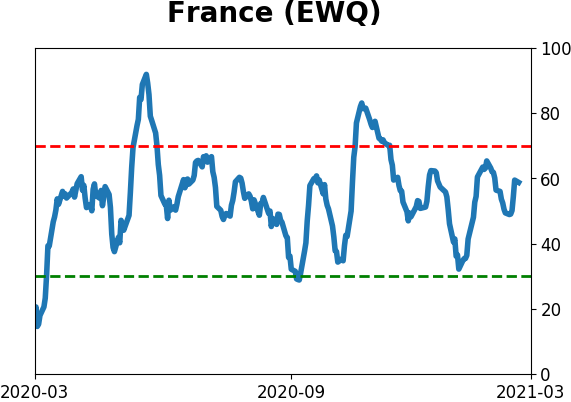
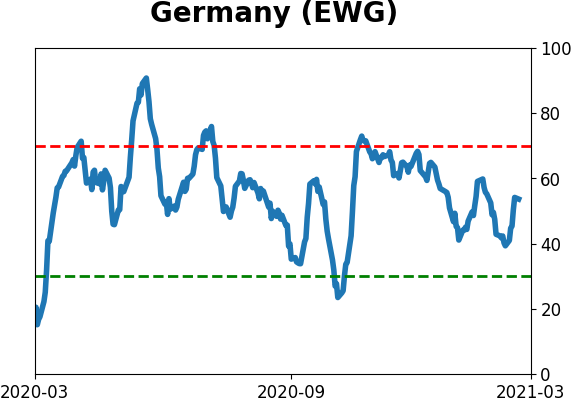
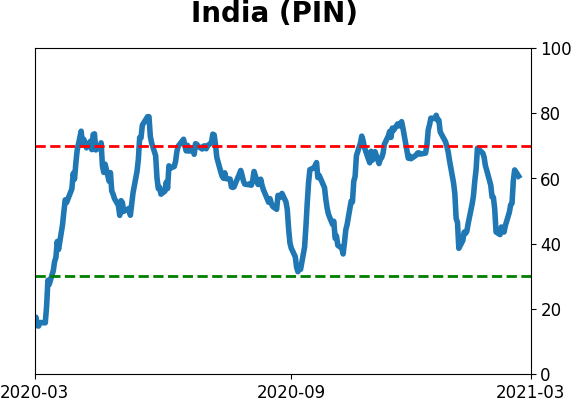
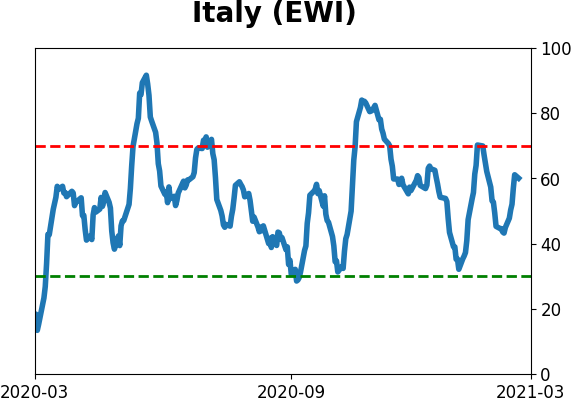
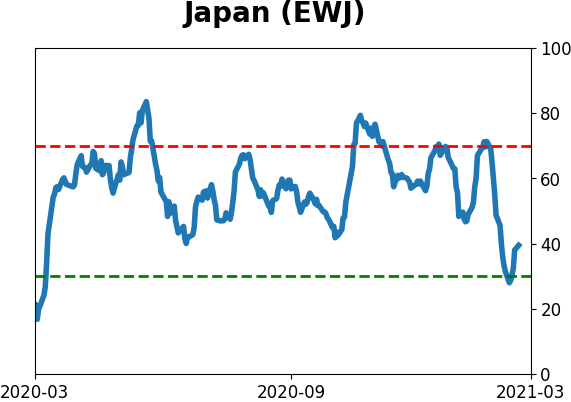
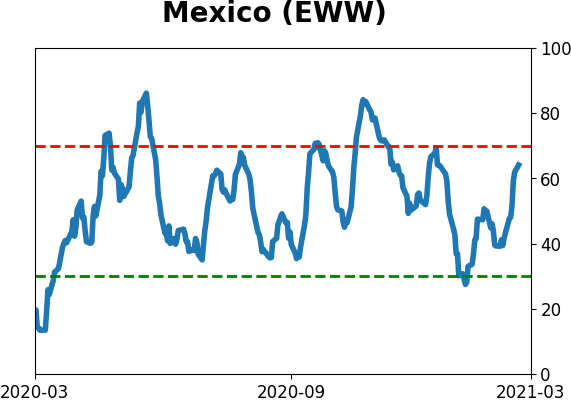
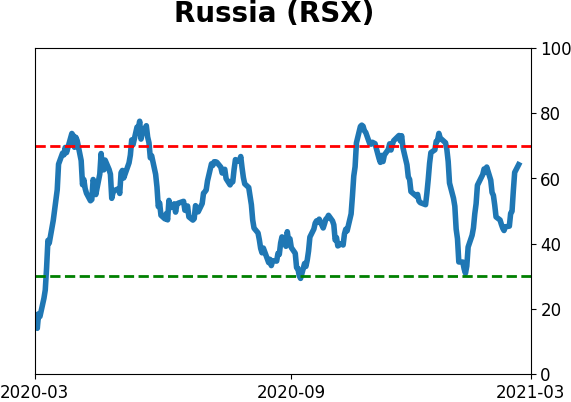
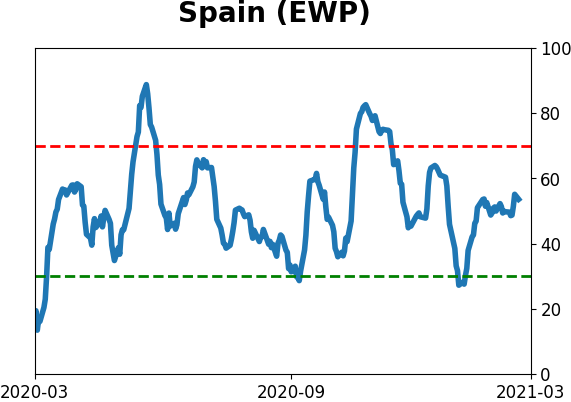
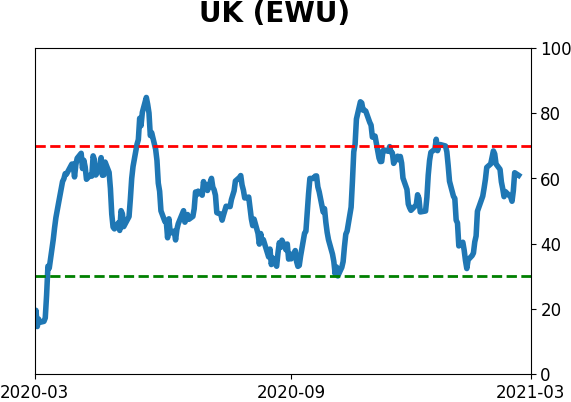
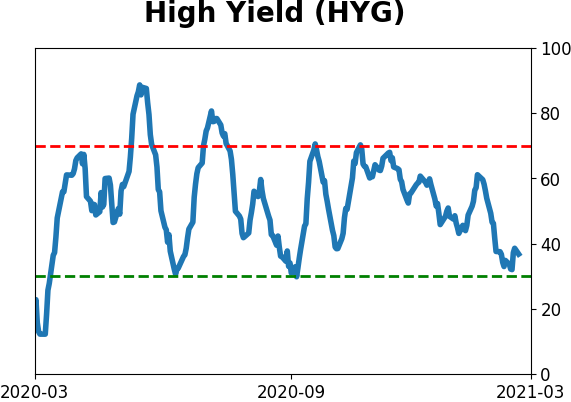
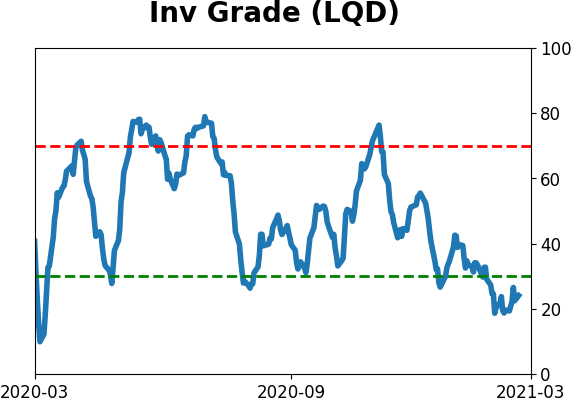
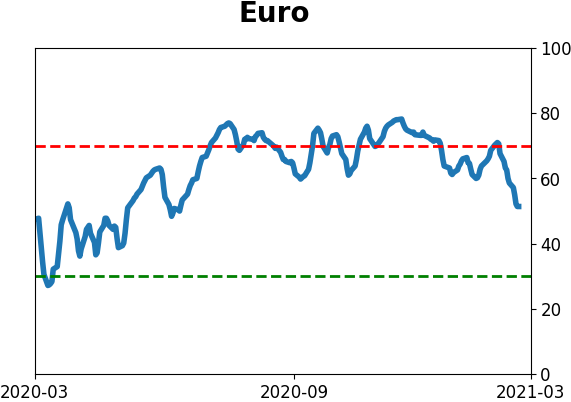
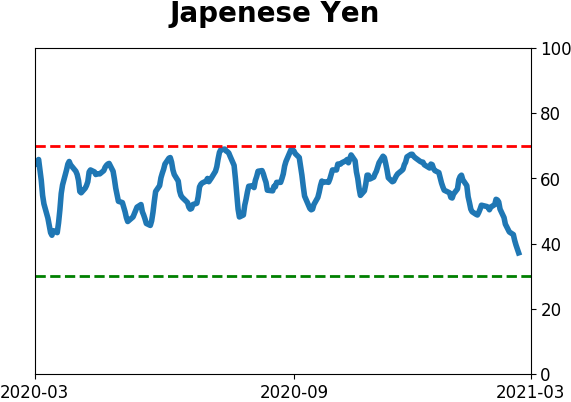
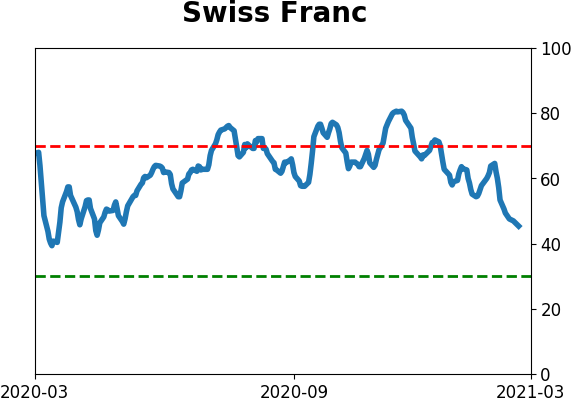
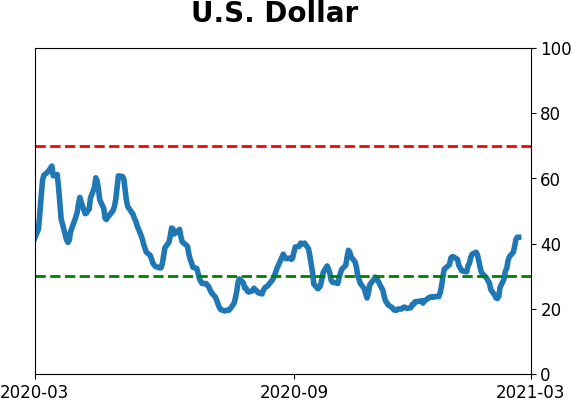
Sentiment Around The World
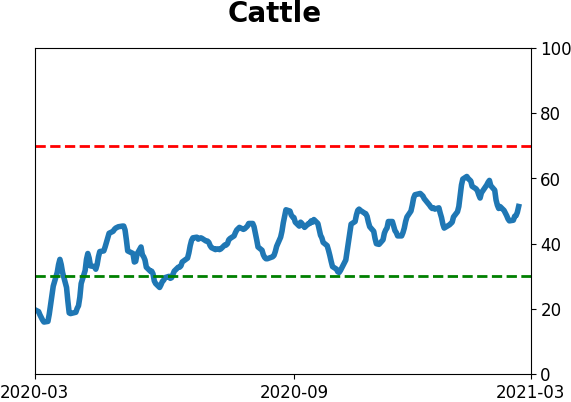
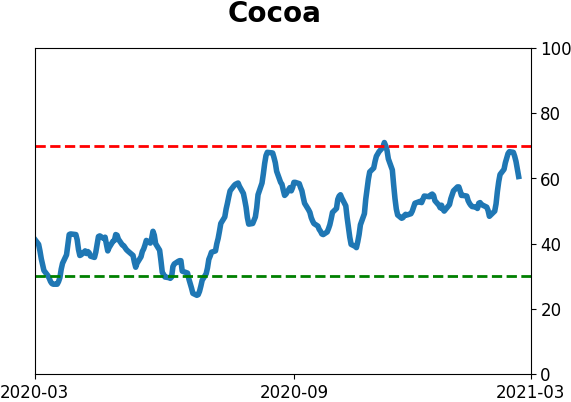
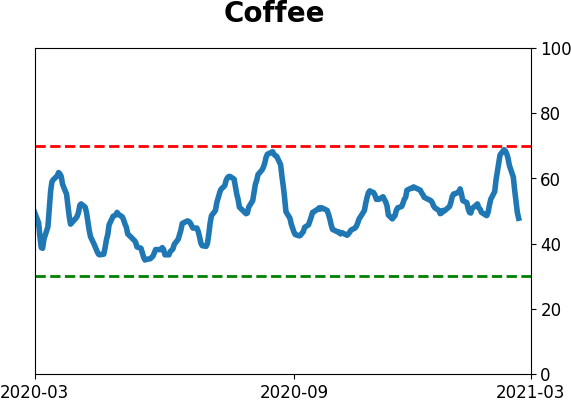
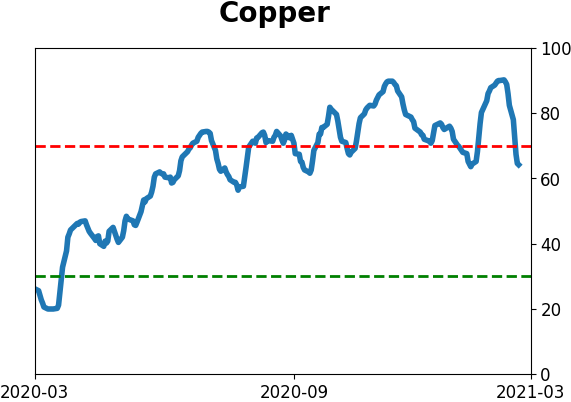
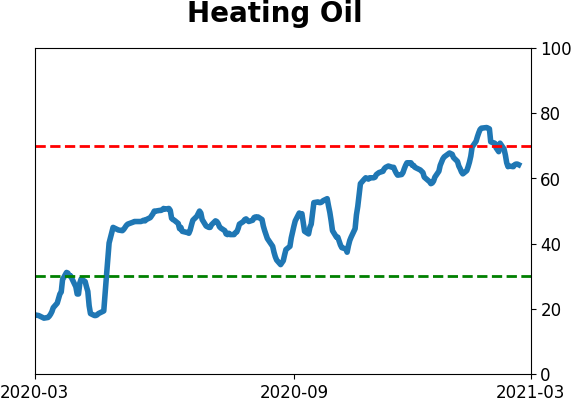
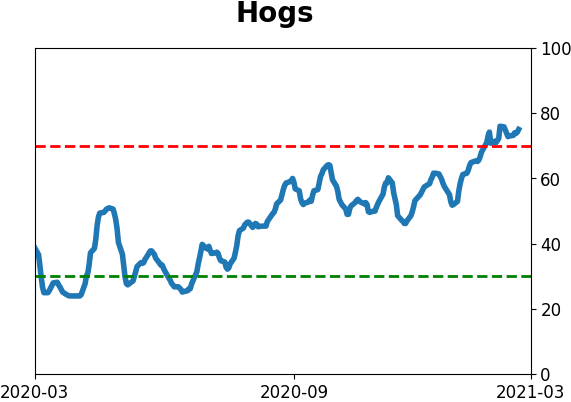
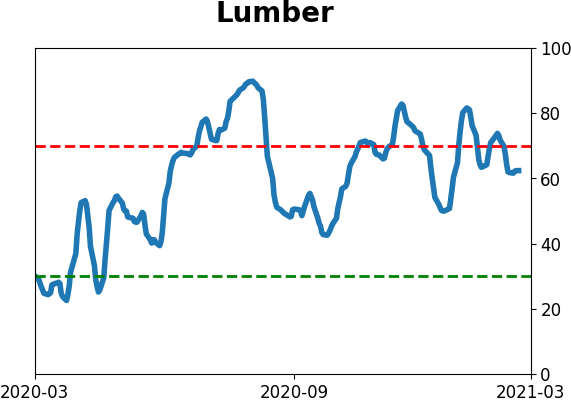
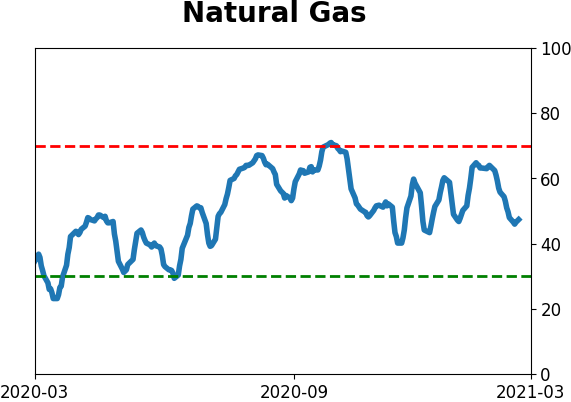
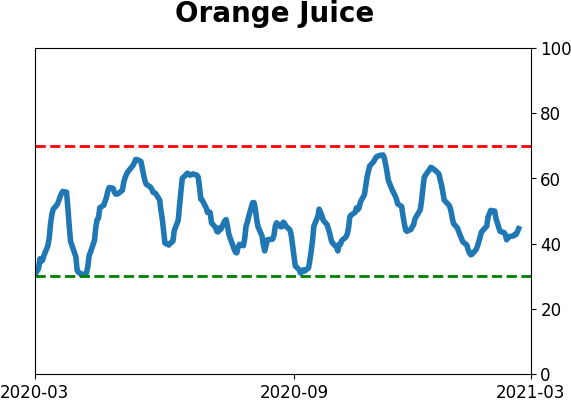
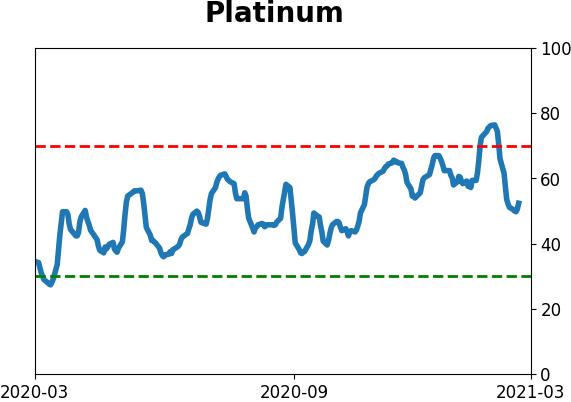
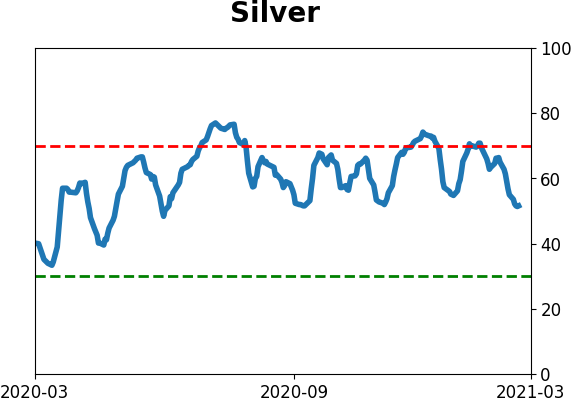
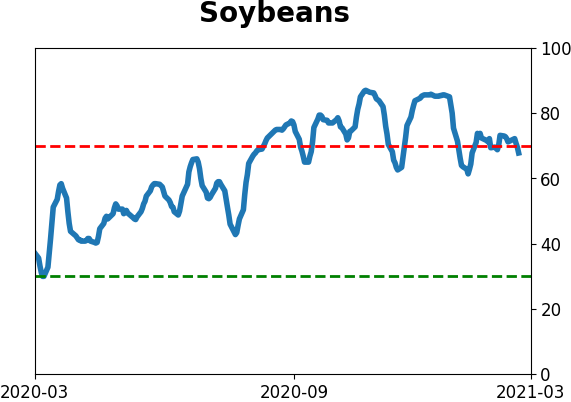
Optimism Index Thumbnails
|
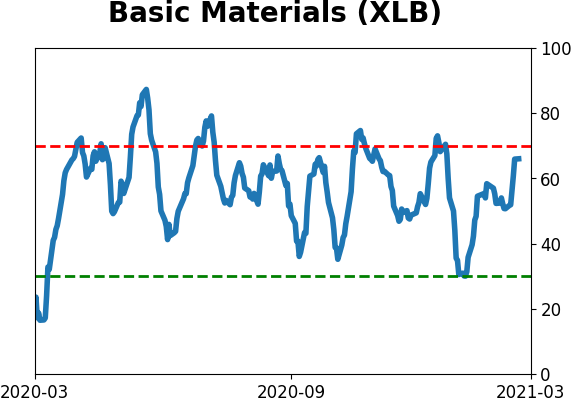
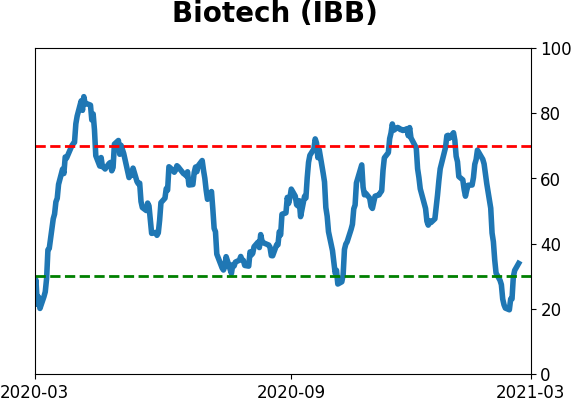
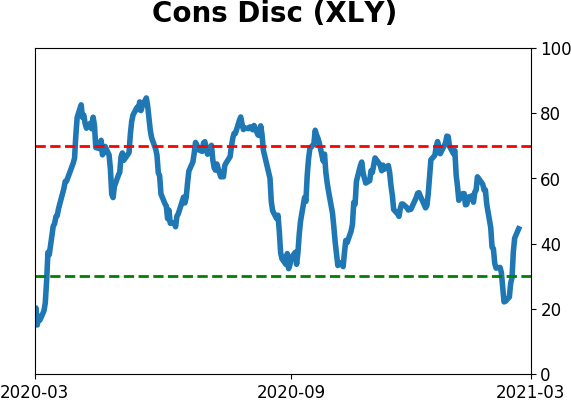
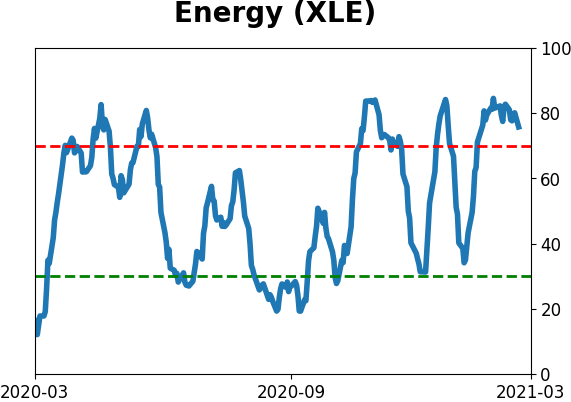
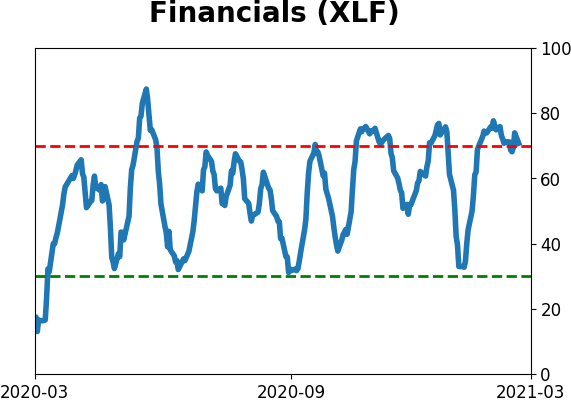
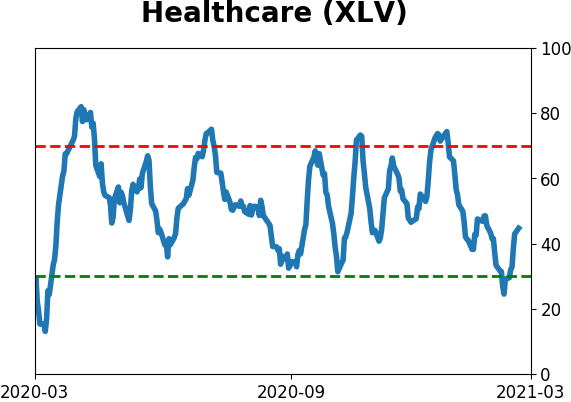
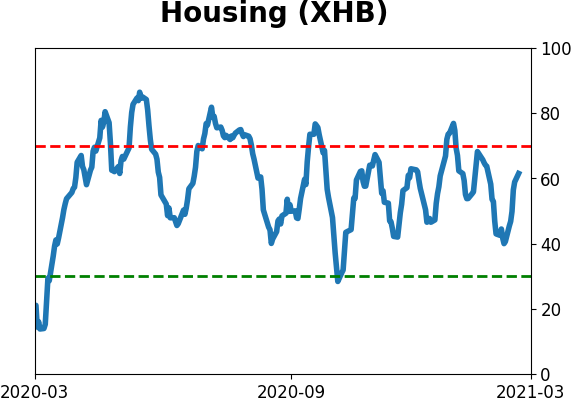
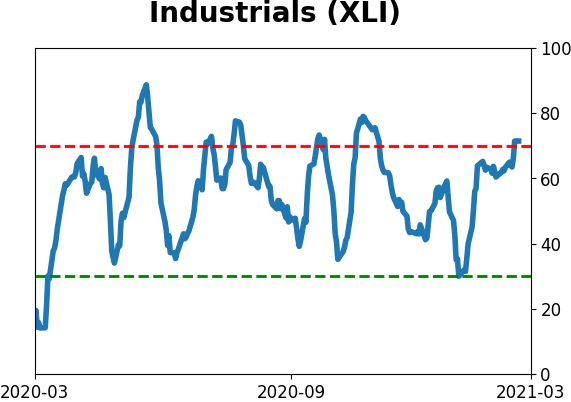
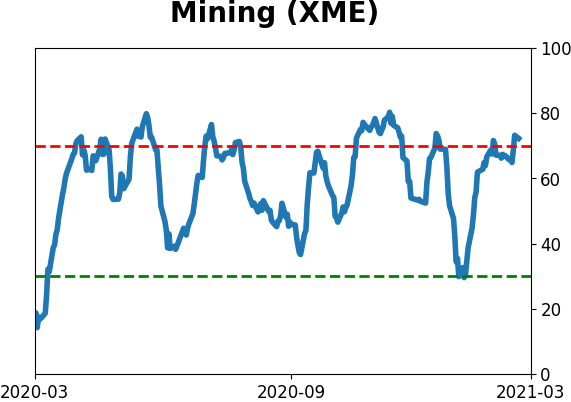
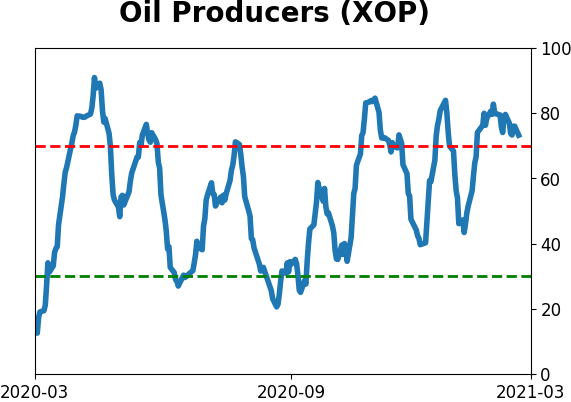
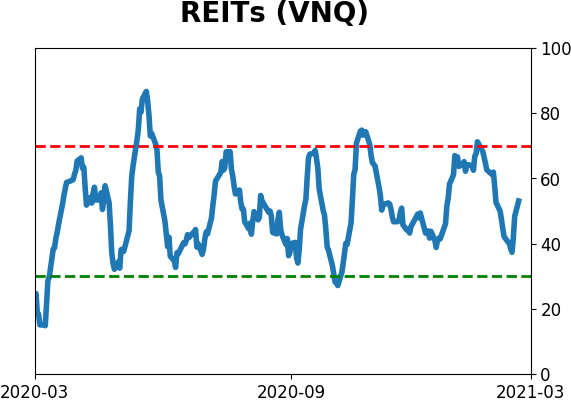
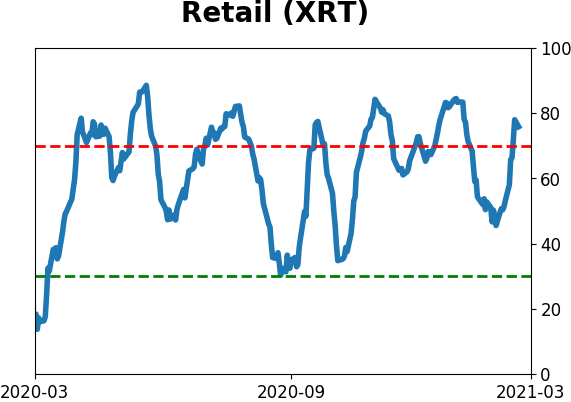
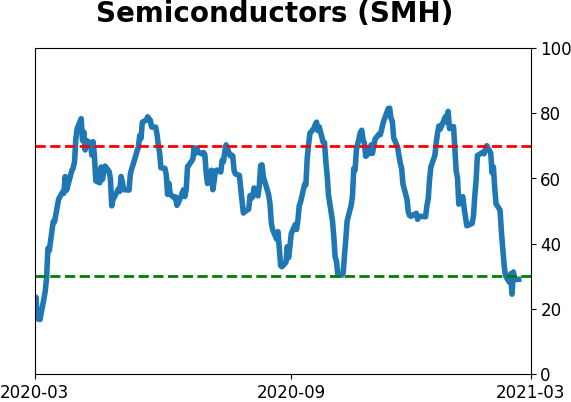
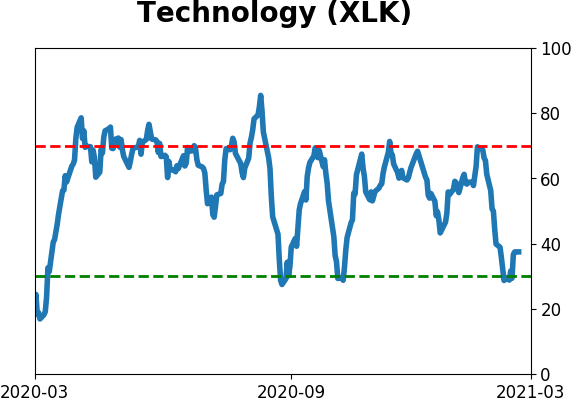
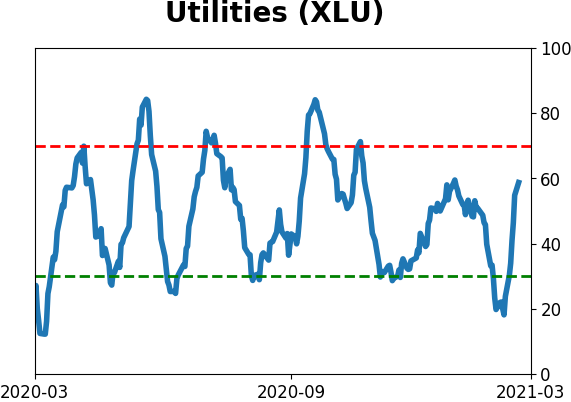
Sector ETF's - 10-Day Moving Average
|
|
|
Country ETF's - 10-Day Moving Average
|
|
|
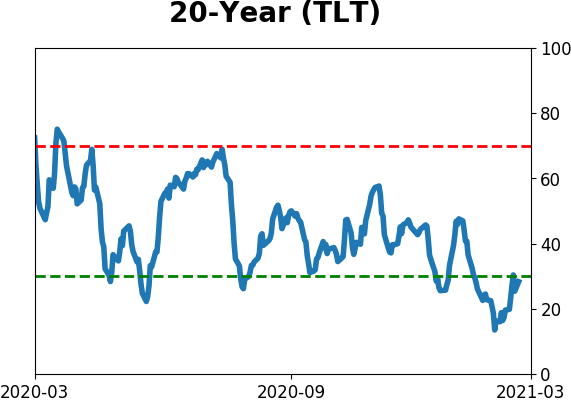
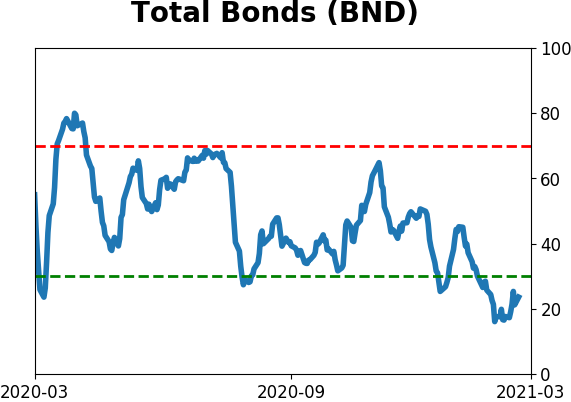
Bond ETF's - 10-Day Moving Average
|
|
|
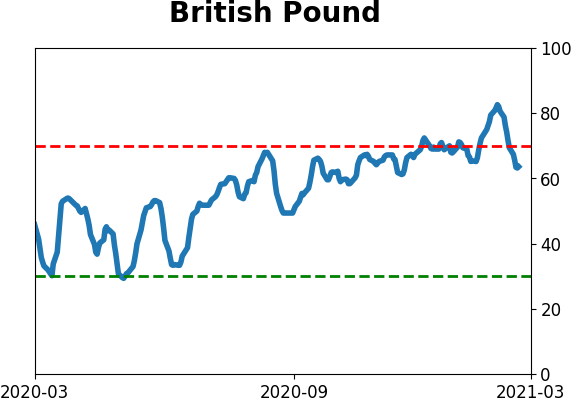
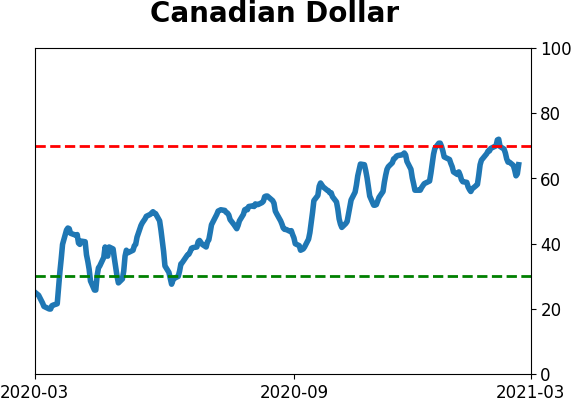
Currency ETF's - 5-Day Moving Average
|
|
|
Commodity ETF's - 5-Day Moving Average
|
|