Headlines
|
|
Small traders are buying puts but not for tail risk:
Even with massive volatility in parts of the market in recent weeks, options traders are not pricing in major tail risk. Indicators that reflect this behavior suggest complacency, but in reality, it likely just reflects low equity exposure. Small options traders are still buying a lot of puts, just not in far out-of-the-money contracts.
|
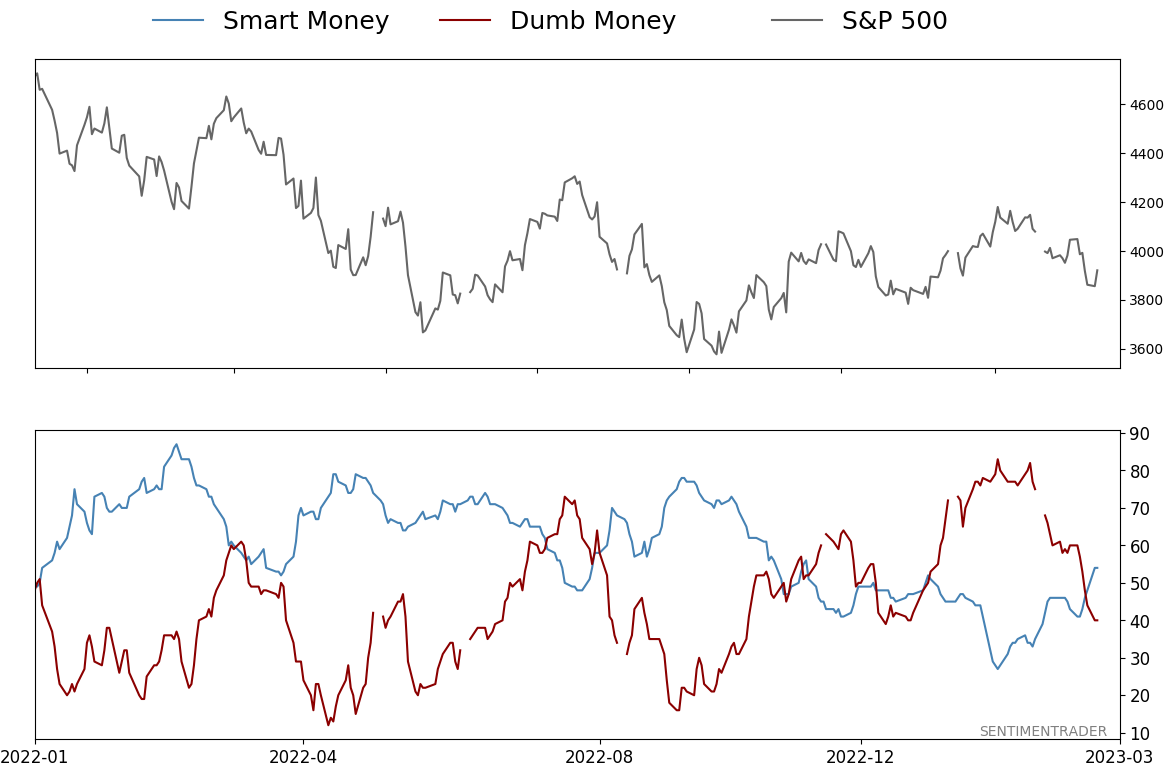
Smart / Dumb Money Confidence
|
Smart Money Confidence: 54%
Dumb Money Confidence: 40%
|
|
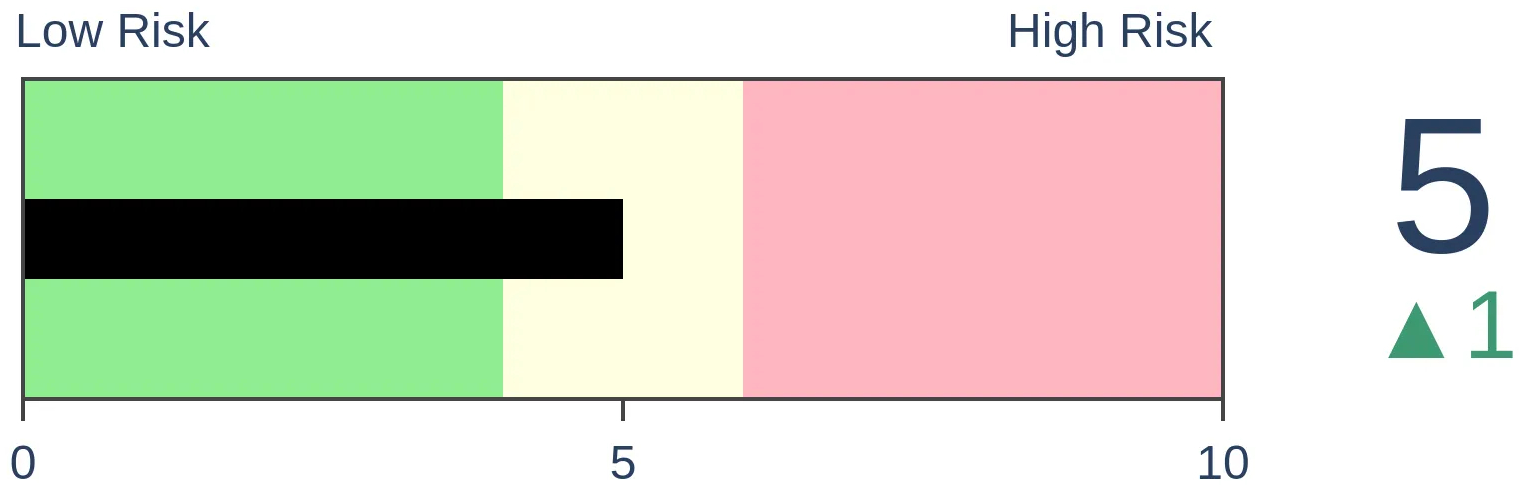
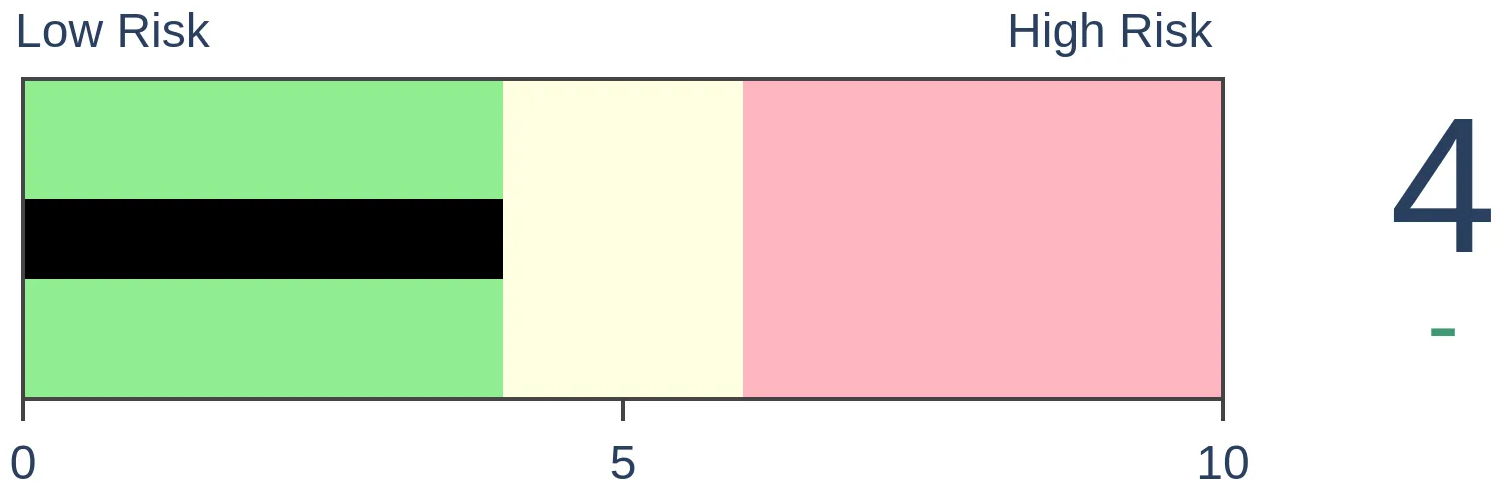
Risk Levels
Stocks Short-Term
|
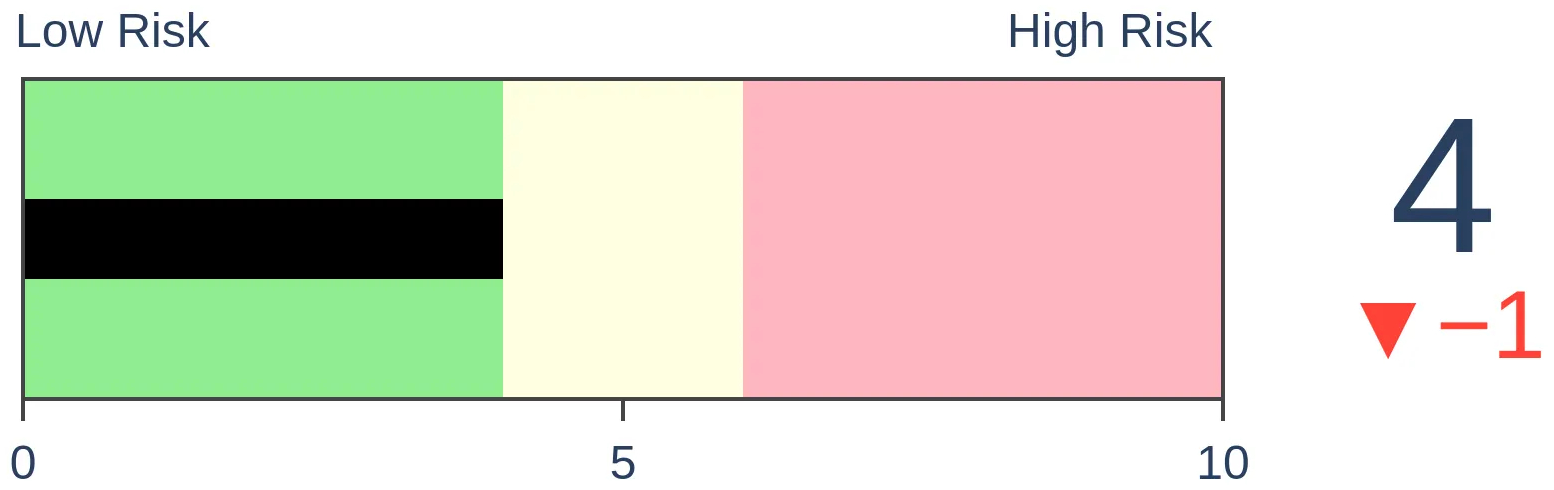
Stocks Medium-Term
|
|
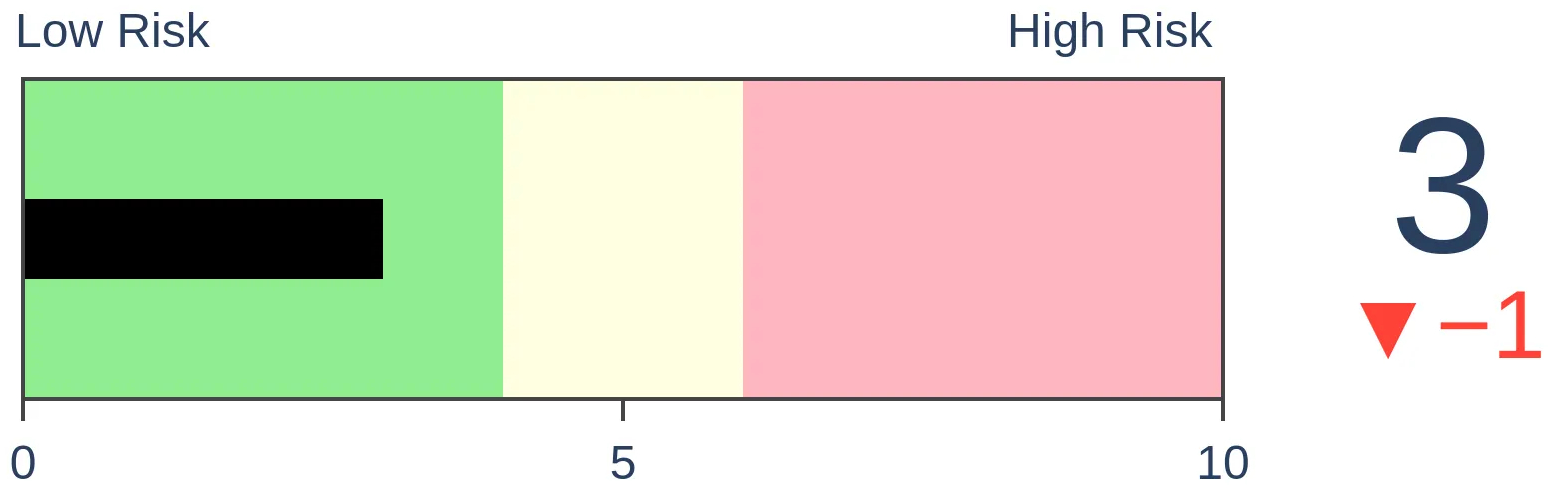
Bonds
|
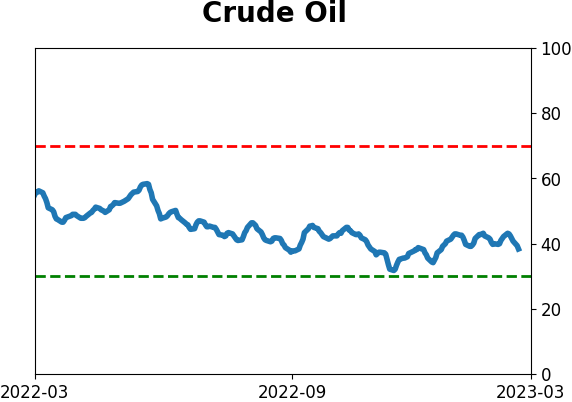
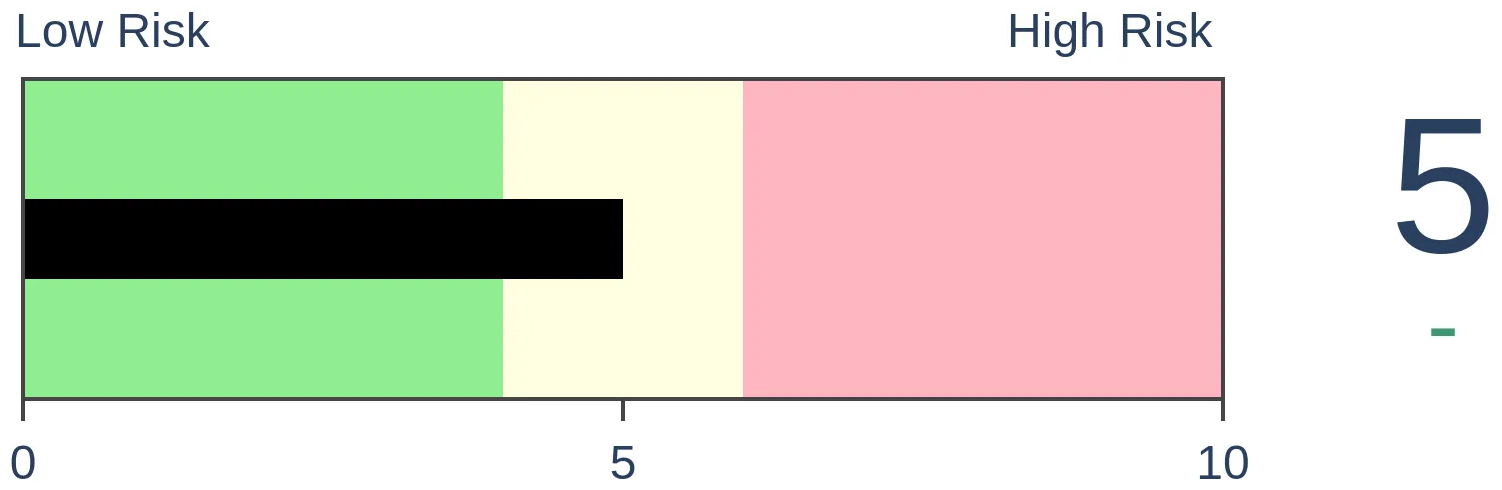
Crude Oil
|
|
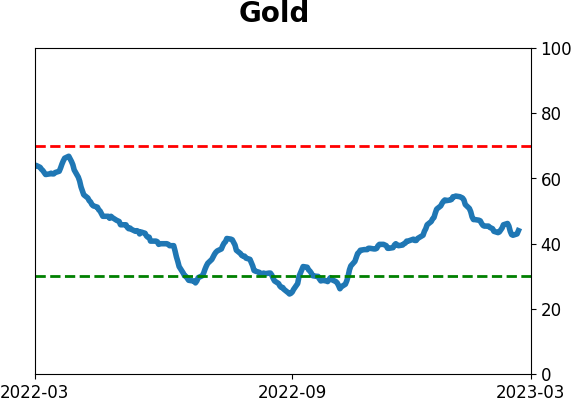
Gold
|
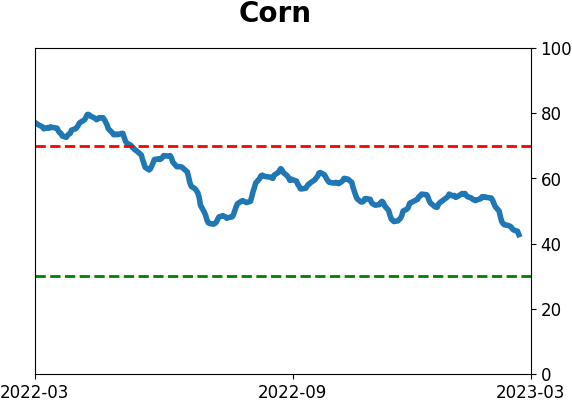
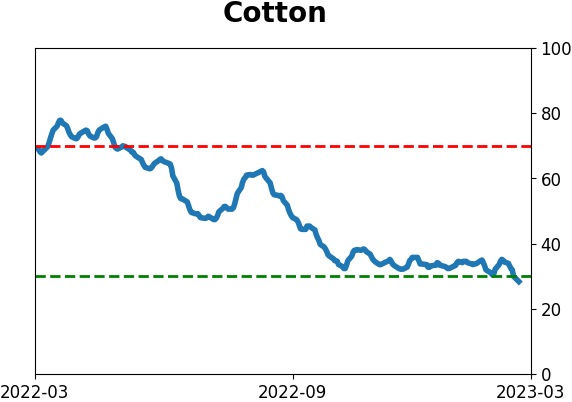
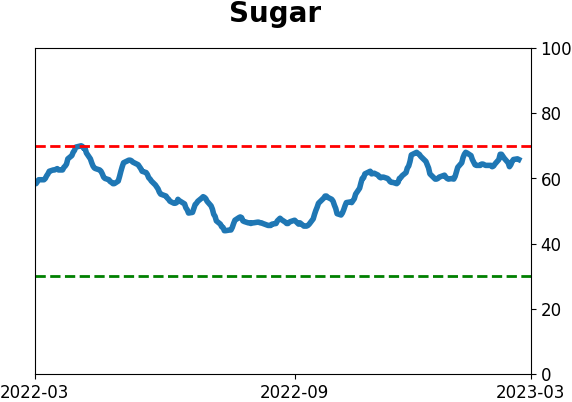
Agriculture

|
|
Research
By Jason Goepfert
BOTTOM LINE
Even with massive volatility in parts of the market in recent weeks, options traders are not pricing in major tail risk. Indicators that reflect this behavior suggest complacency, but in reality, it likely just reflects low equity exposure. Small options traders are still buying a lot of puts, just not in far out-of-the-money contracts.
FORECAST / TIMEFRAME
None
|
Key points:
- Options indicators are showing that traders have not priced in major tail risk
- In theory, this suggests complacency, but in practice, it has indicated the opposite
- Small traders are still spending a lot on puts, just not necessarily far out-of-the-money contracts
Options traders aren't panicking; they've just sold a lot
Stocks have been melting for a couple of weeks, and yet nobody's panicking. In fact, they don't seem interested at all in betting on a black swan.
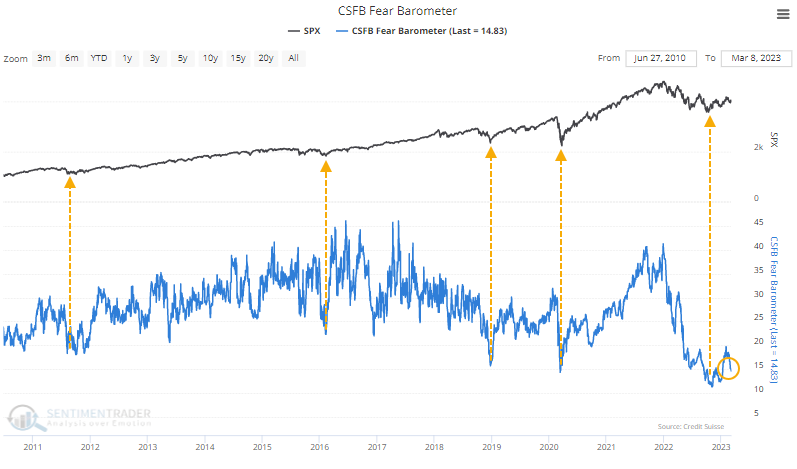
At least, that's the supposed conclusion from indicators like the CSFB Fear Barometer, which measures the relative cost of puts versus calls. The way the indicator was constructed, it was supposed to be a VIX-killer, a more reliable way to measure genuine fear among options traders.
In practice, it has turned out to be the exact opposite. Instead of high readings showing fear and coinciding with market bottoms, they coincide with peaks. And very low readings - supposedly evidence of complacency - have more closely aligned with bottoms. The trouble with the indicators is that after prolonged periods of losses, investors don't need to hedge against tail risk because they already have less exposure to the stock market.
As The Wall Street Journal notes:
Retail assets in money-market funds are hovering near records, Investment Company Institute and Federal Reserve data show. The funds, which invest in short-term debt securities including Treasury bills and commercial paper, are often used like checking accounts by consumers to store their ready cash.
And...
Investors have fled stock funds en masse. They have pulled more than $100 billion from U.S. equity mutual funds and exchange-traded funds since the beginning of last year, according to Refinitiv Lipper. The funds have suffered outflows for nine consecutive weeks, the longest such stretch since summer 2016.
This is notable now because these indicators have once again declined and hover near the lowest levels in a decade. The Fear Barometer, for example, has been depressed for months. It has spiked a bit due to the bank run hysteria but remains historically low.
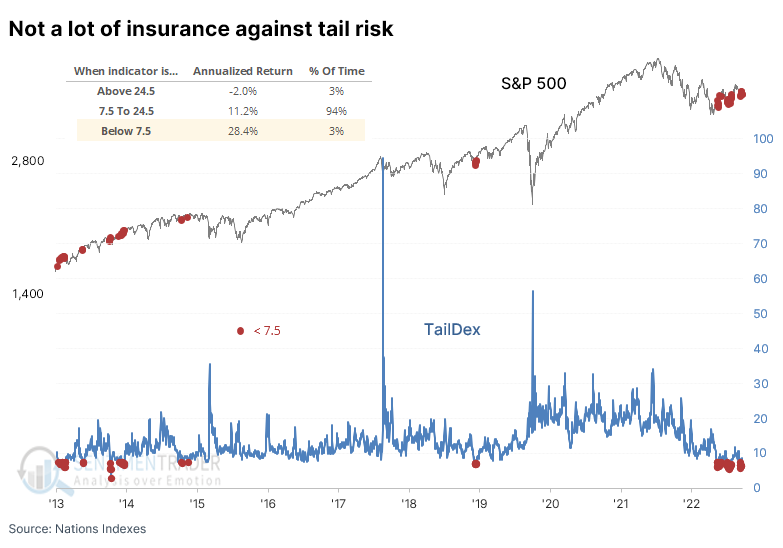
We can see similar behavior in the Nations TailDex index, designed to reflect moments of fear among options traders. It is now recording some of the lowest readings since its inception. But such "complacency" has preceded better annualized returns for the S&P 500 than most other levels in the indicator.
Among small traders, the amount of premium they're paying on puts overall has remained substantial. It reached a historic extreme a couple of times in 2022, equivalent to the bouts of pure panic over the past 23 years. For one of the few times in history, traders spent more on protective puts than speculative calls.
Instead of swinging to the call side en masse as stocks rallied, small traders have still been willing to pay up for puts, and it has spiked again over the last two weeks. They're not necessarily buying out-of-the-money contracts that would more likely impact the above indicators.
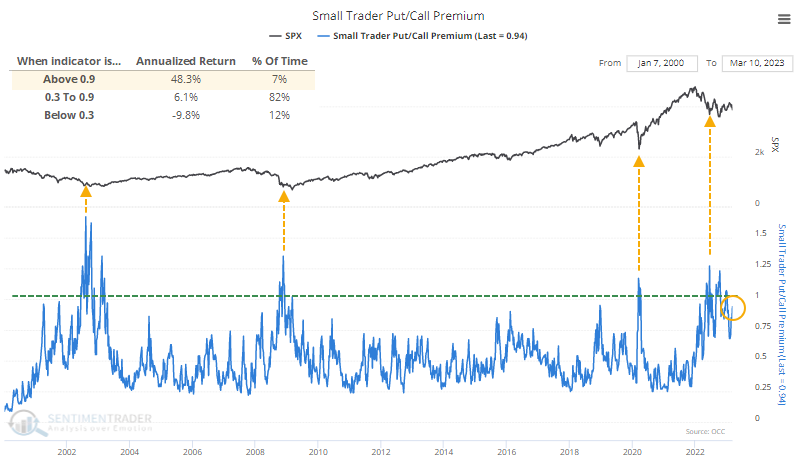
When the amount of money options traders spent on puts equaled 90% or more of what they spent on calls, which happened last week, the S&P 500's future annualized return was over +48%. When they spent 30% or less on puts, that return plummeted to -9.8%.
What the research tells us...
History is littered with indicators that should do one thing but, in real-time, reflect something completely different. Among them was the rush of "new, improved" indicators that were supposed to reflect fear in the options market. While they can still give meaningful insight into markets, they shouldn't be taken at face value.
When we look at the current readings and what they preceded for markets, the so-called complacency we're seeing now - even if it has lifted somewhat recently - is not a sign of complacency but rather a lack of hedging needed for reduced equity exposures. Over the past 10-20 years, similar behavior preceded mostly higher stock prices.
Indicators at Extremes
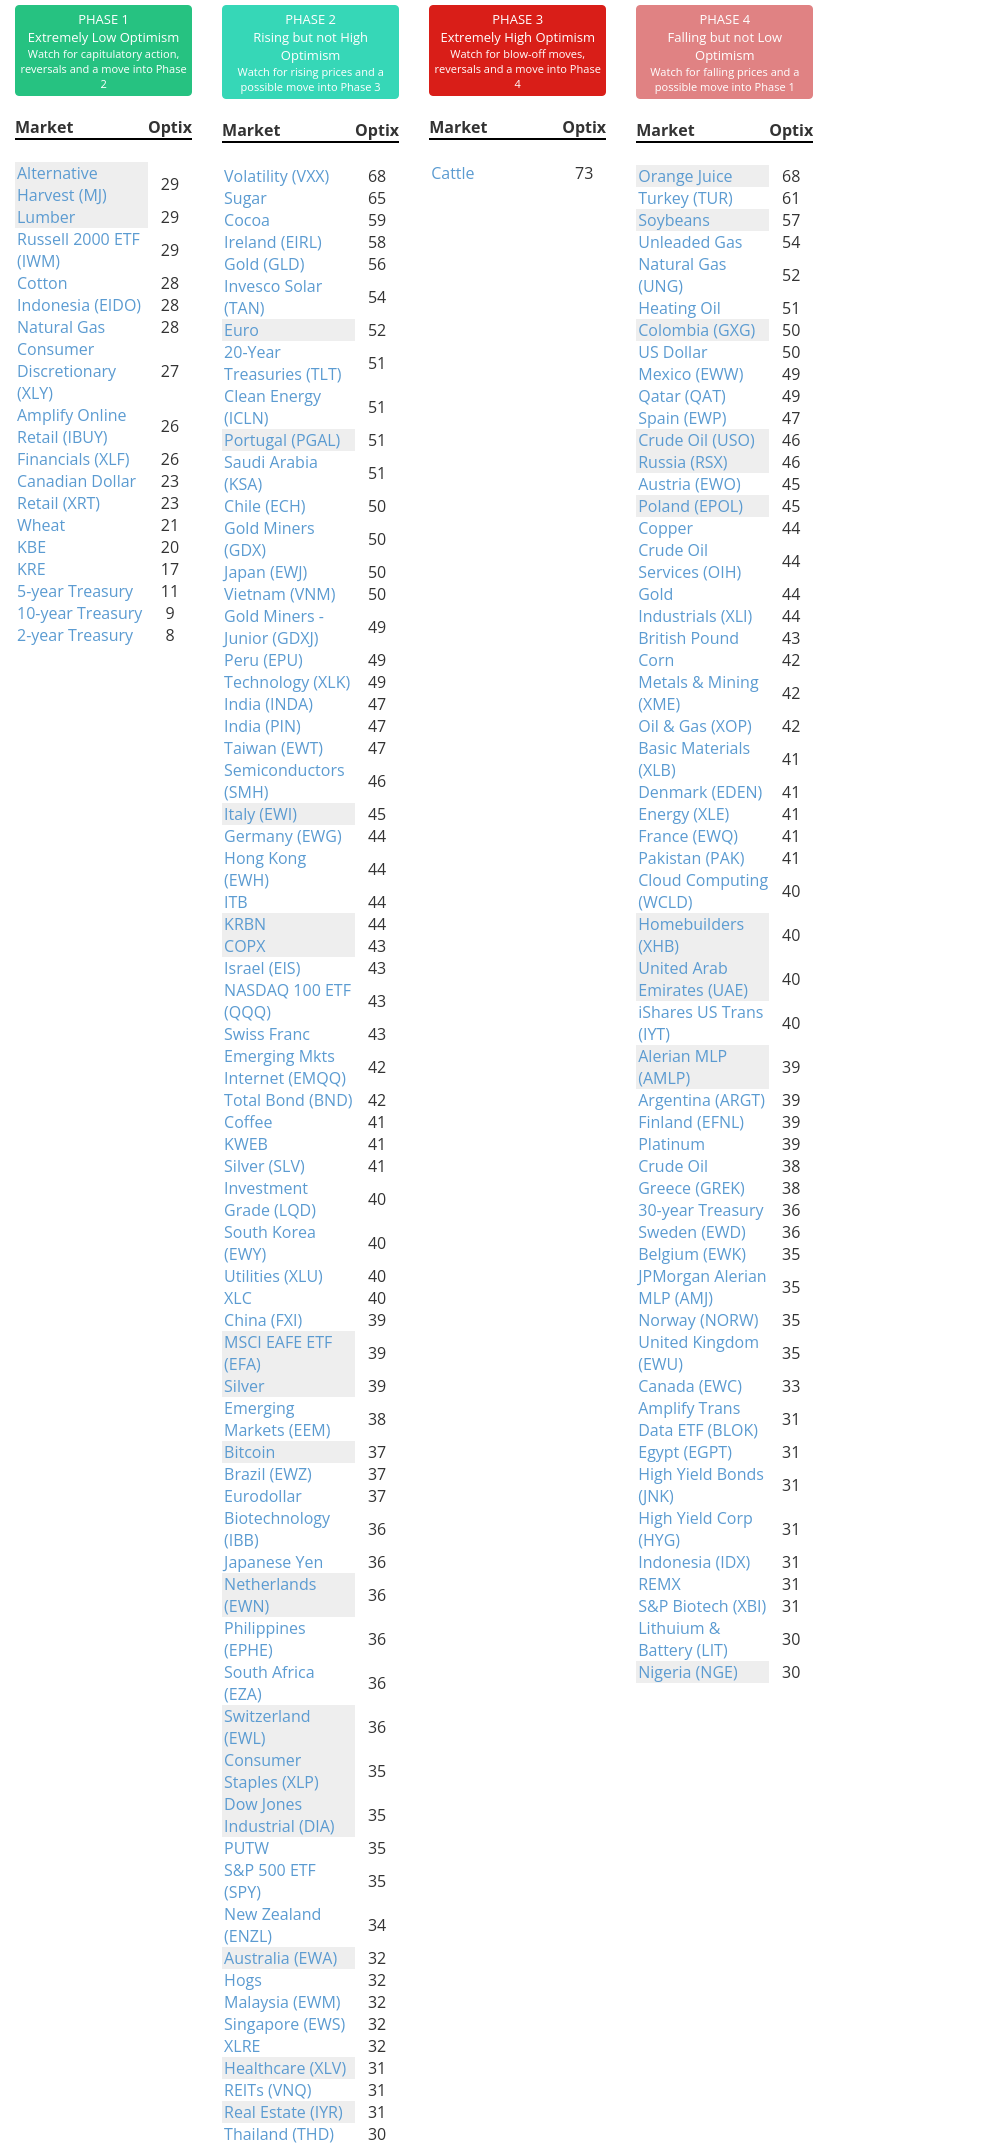
Phase Table
Ranks
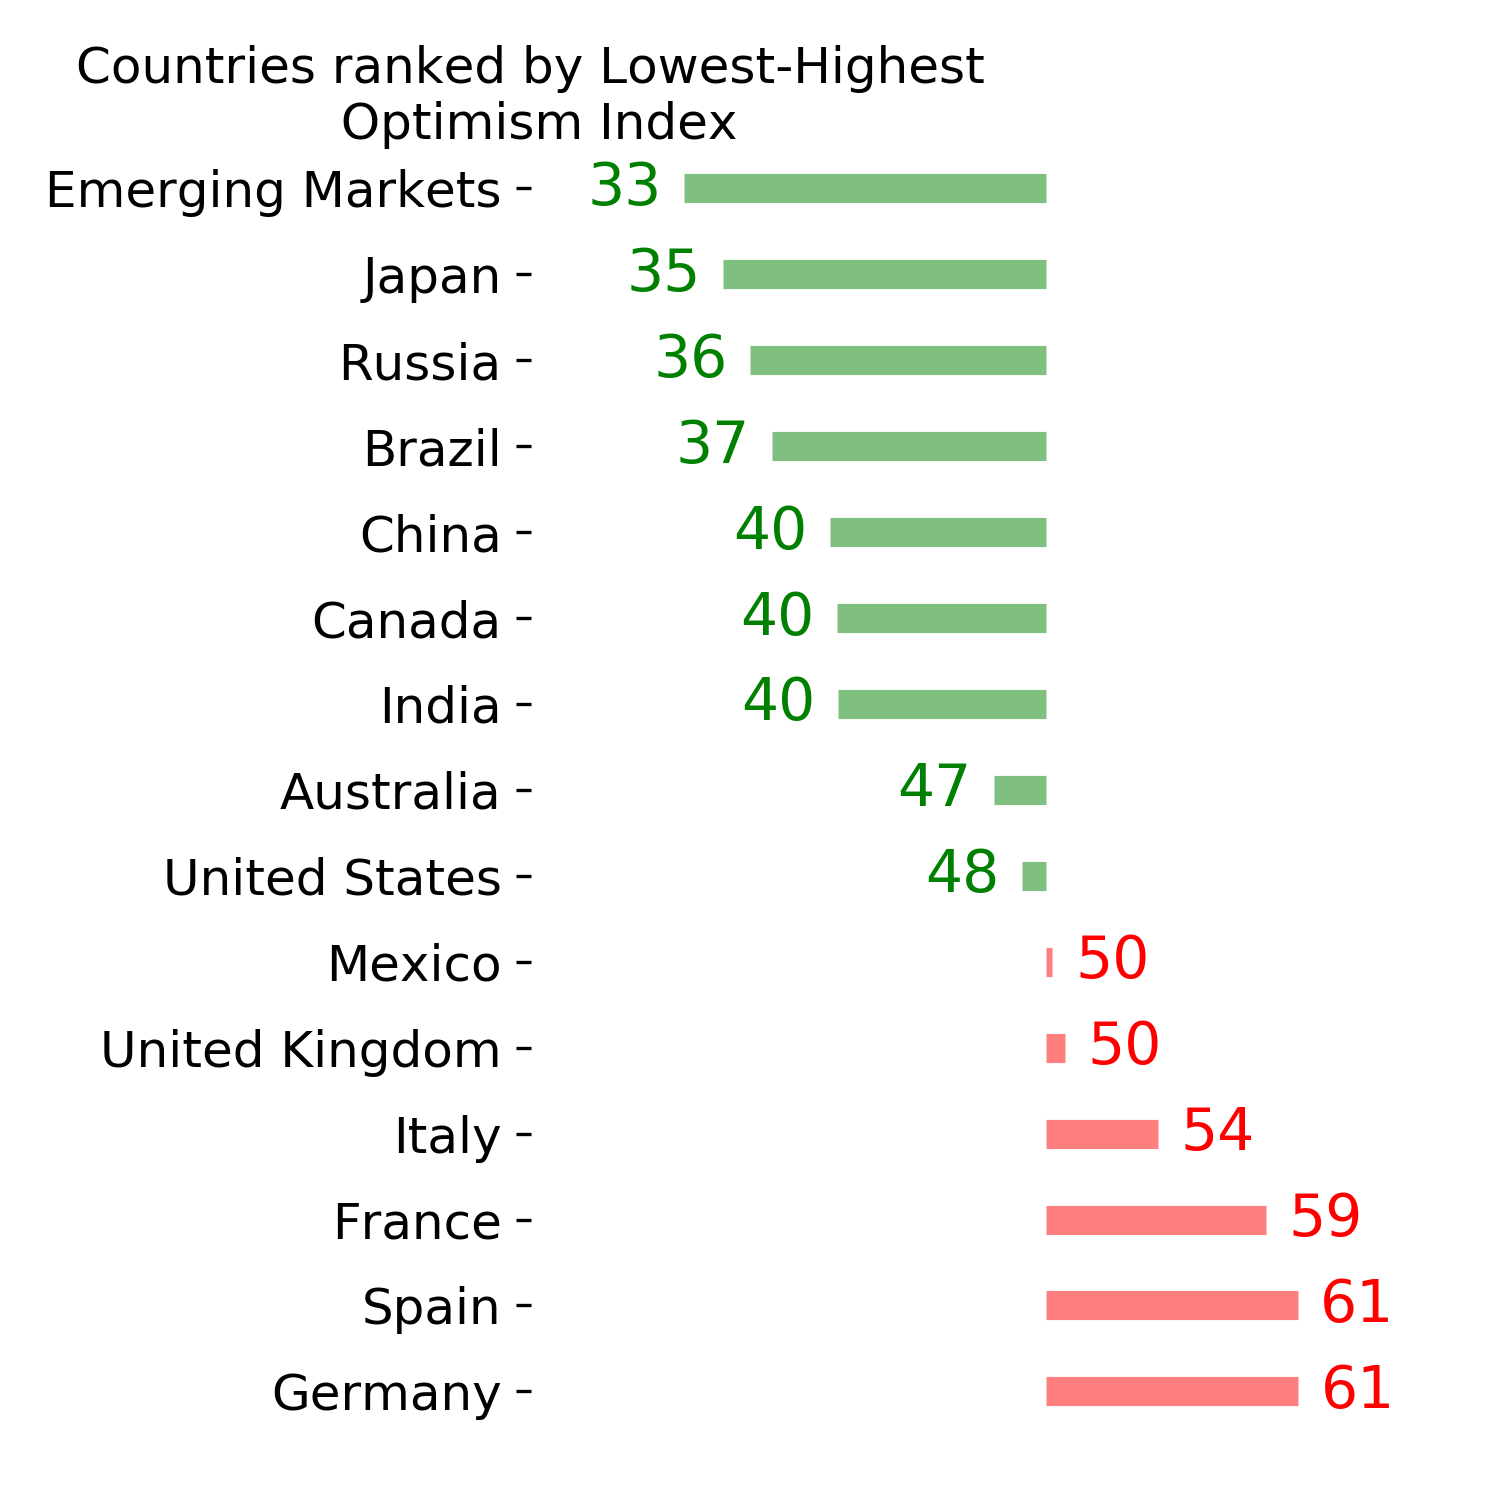
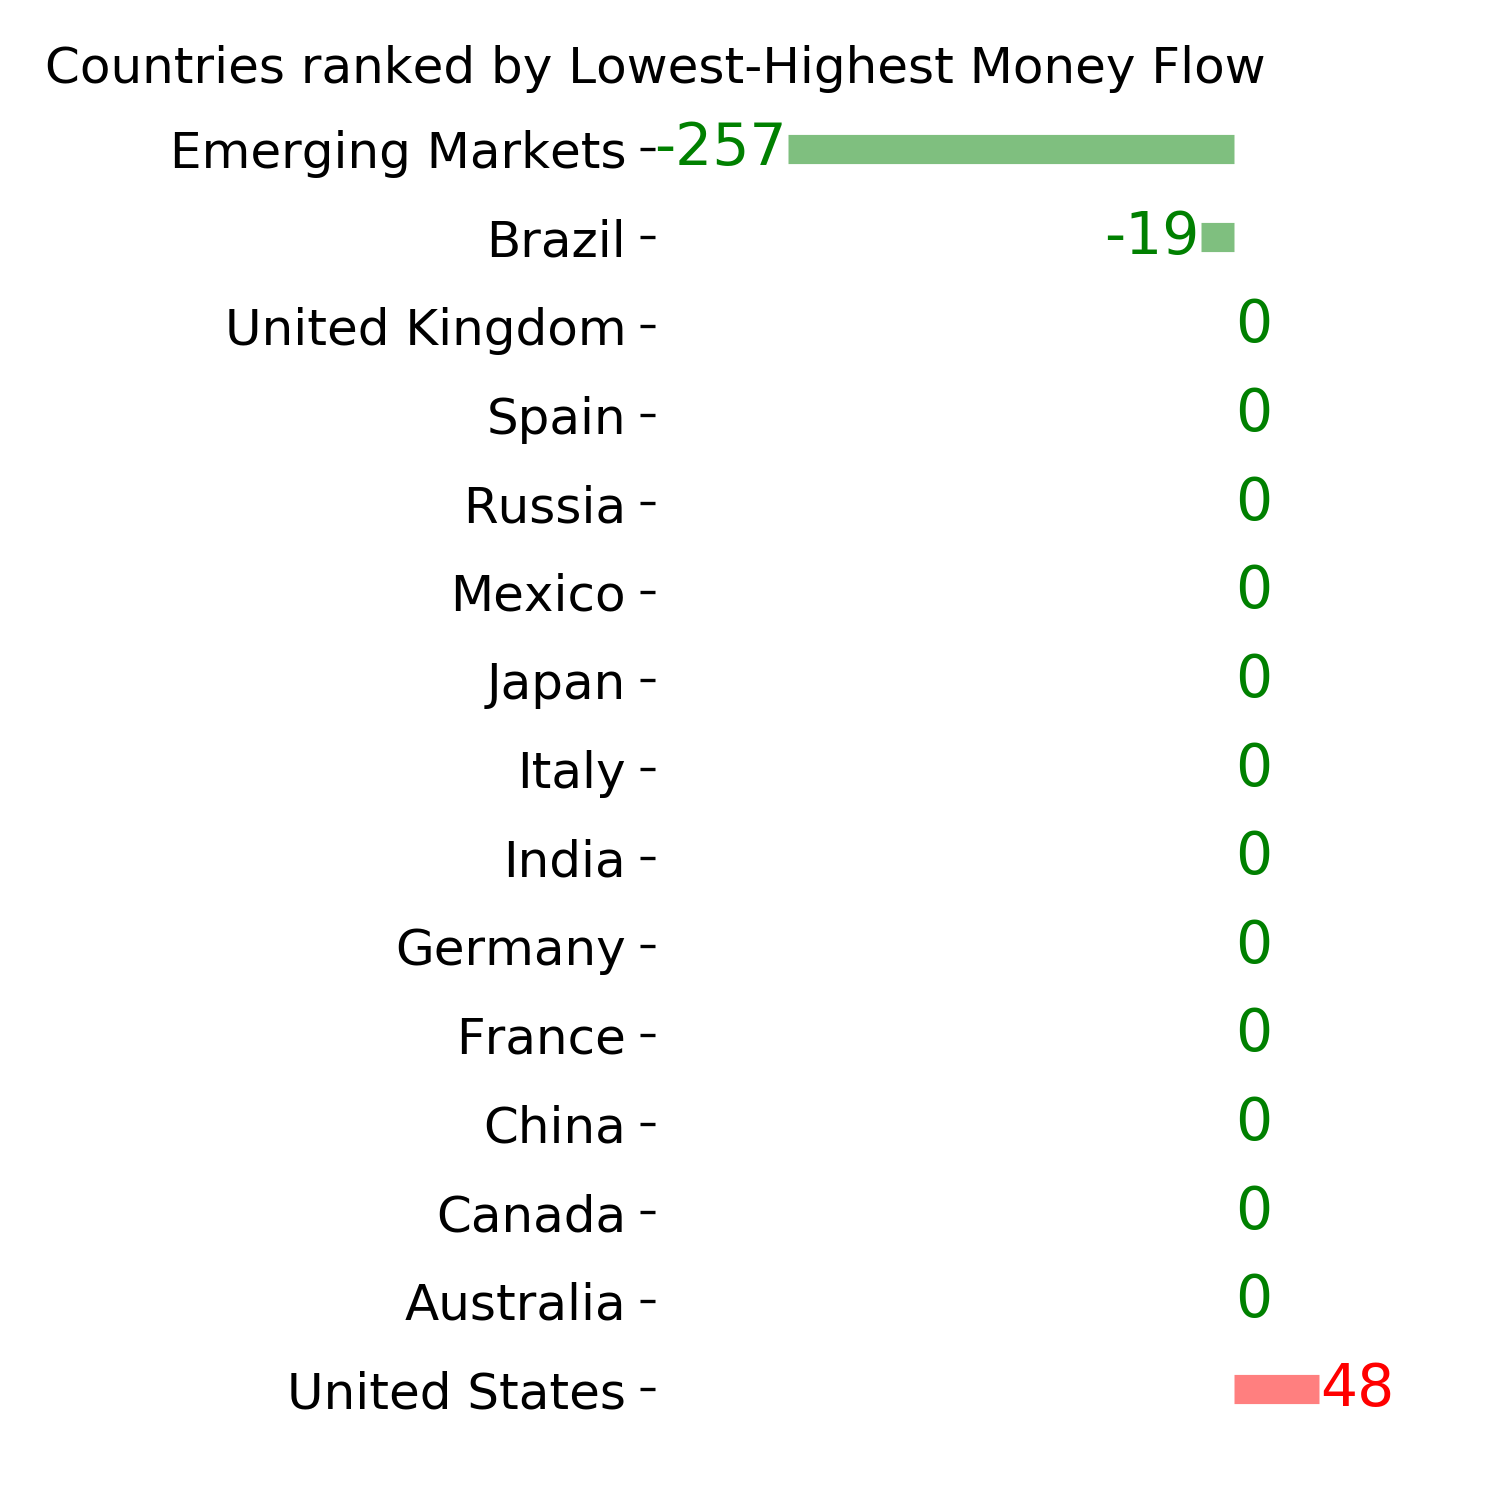
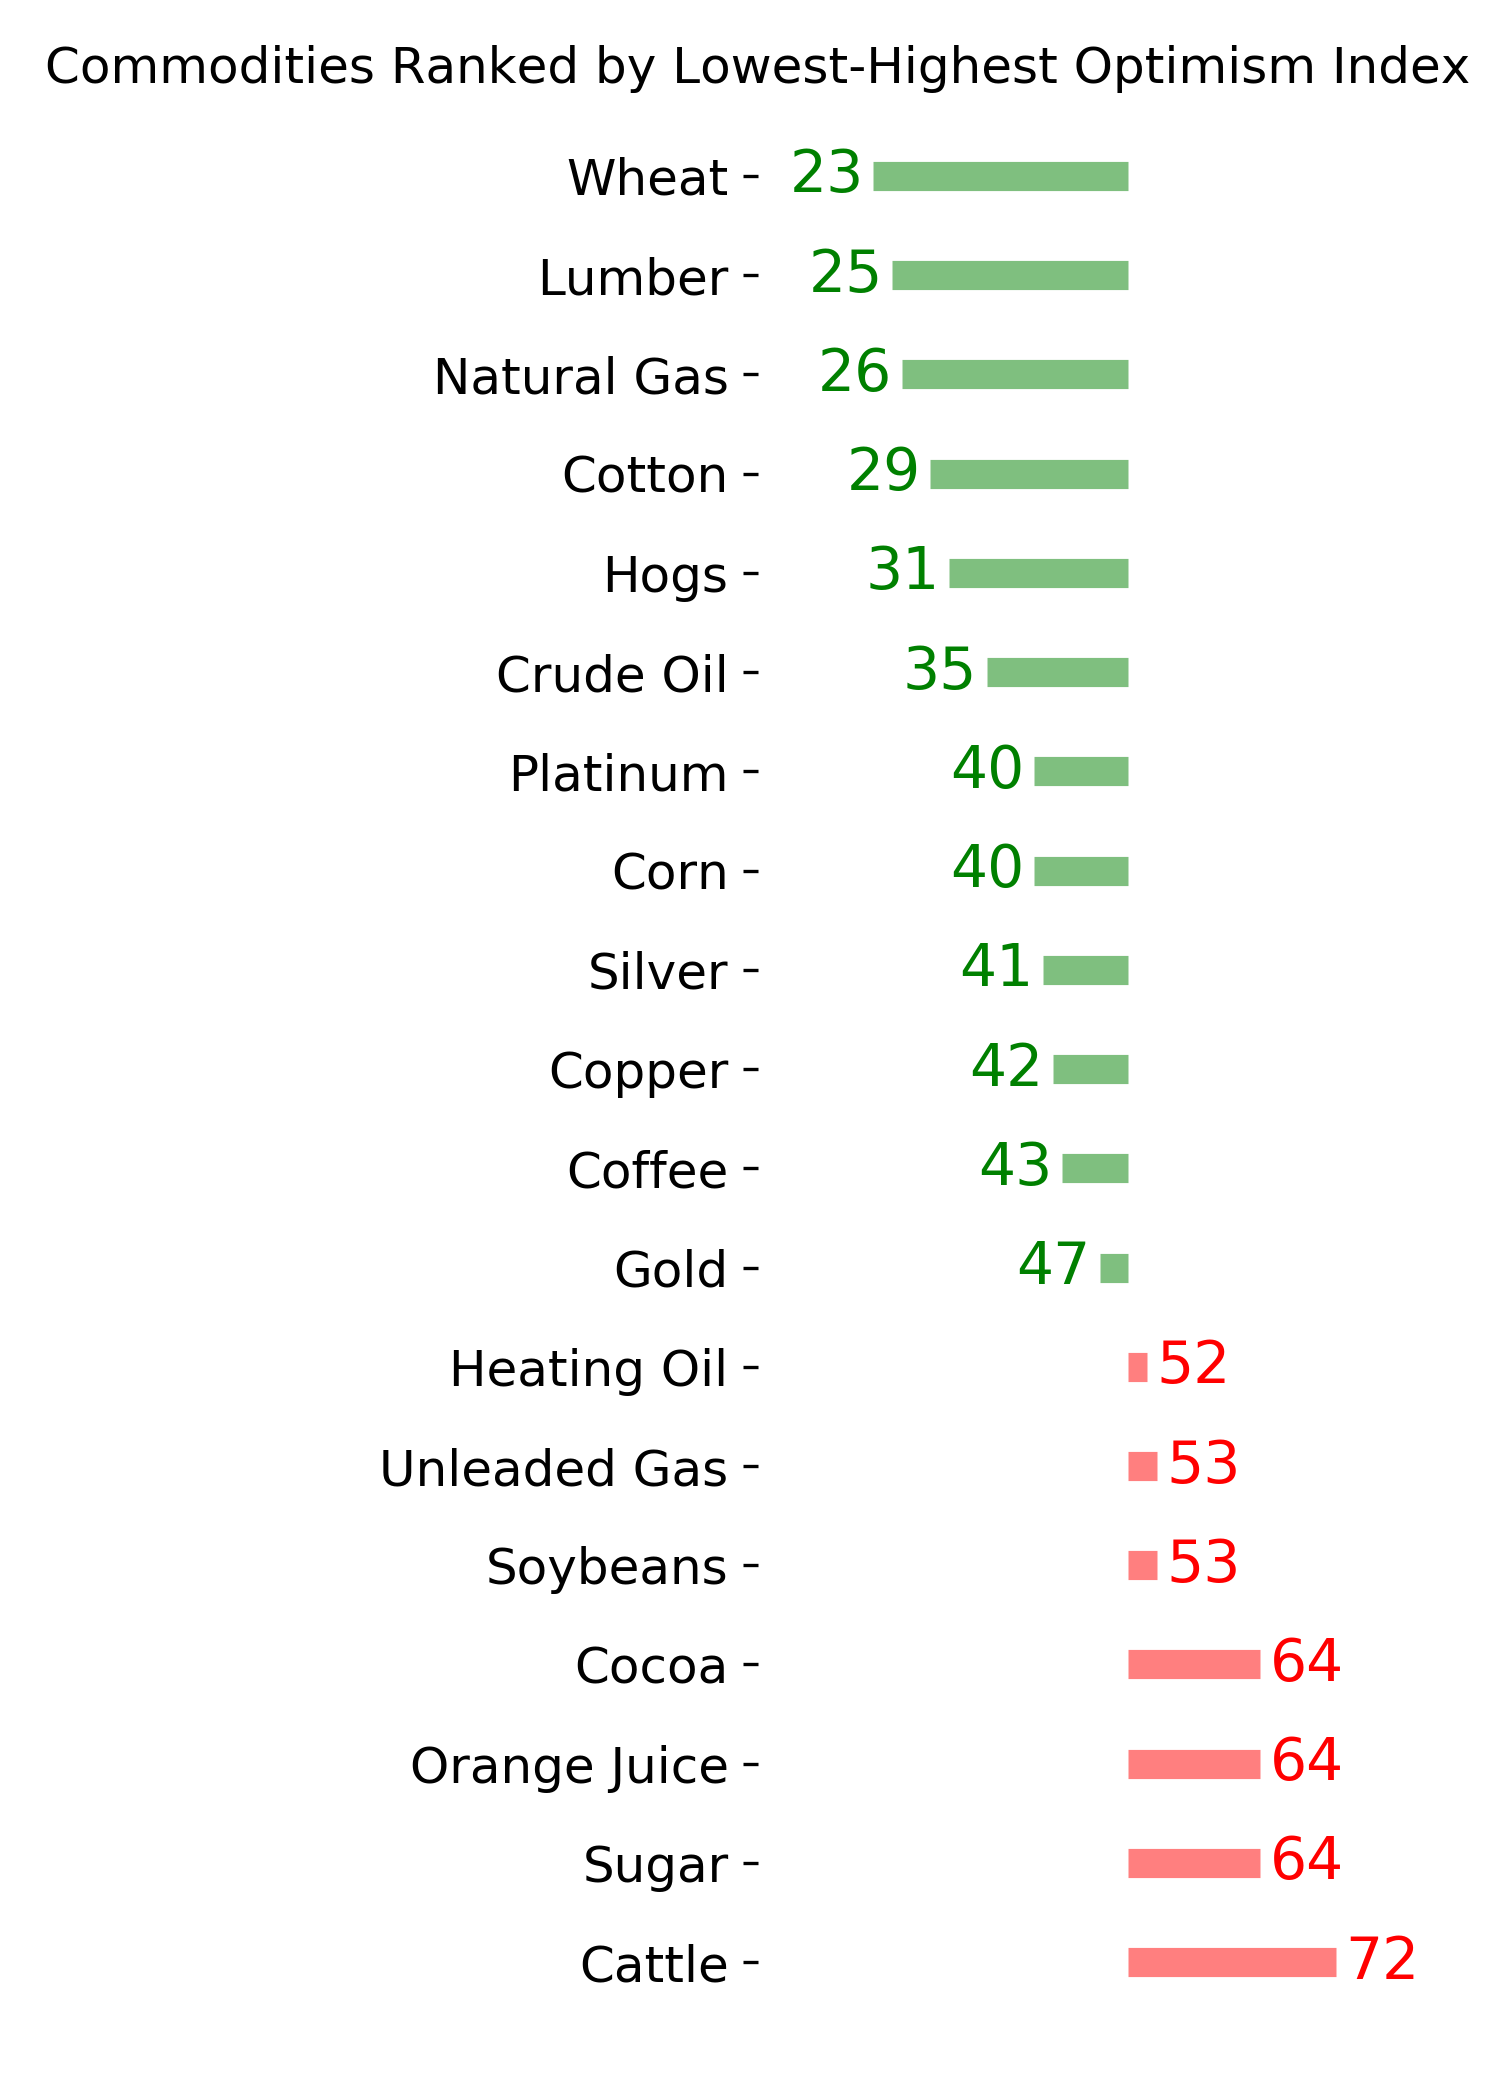
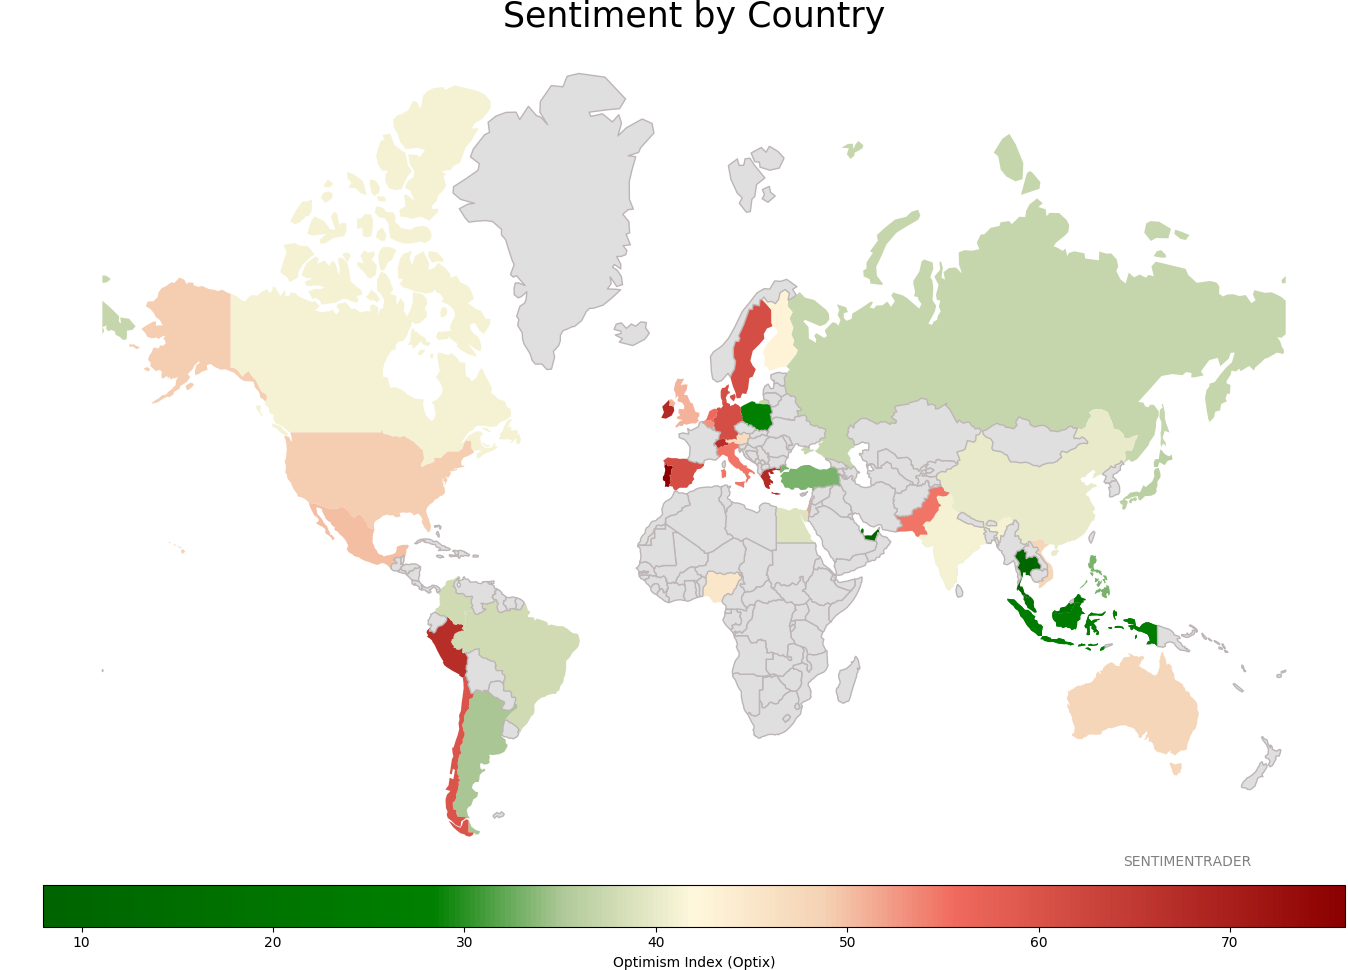
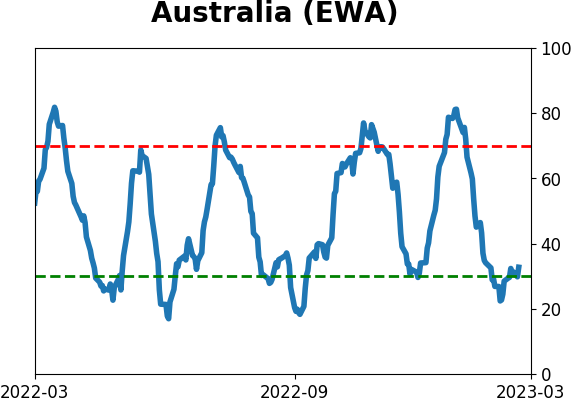
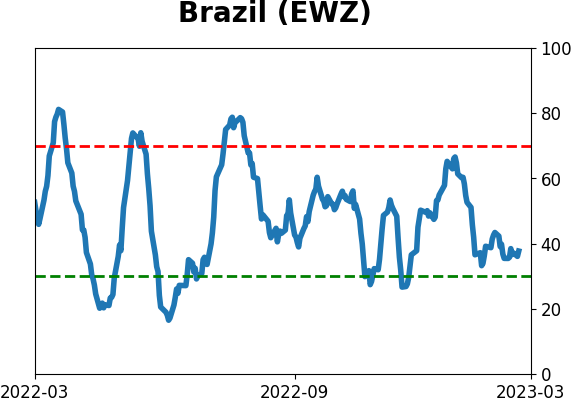
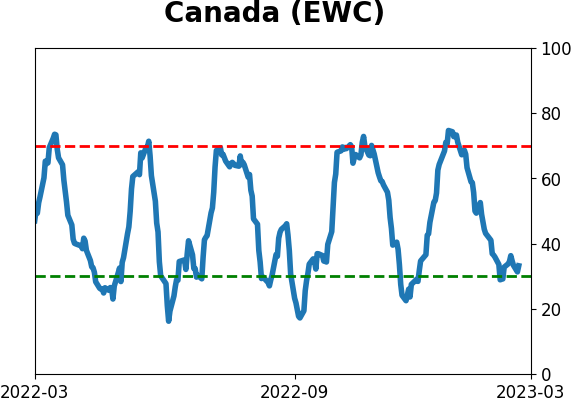
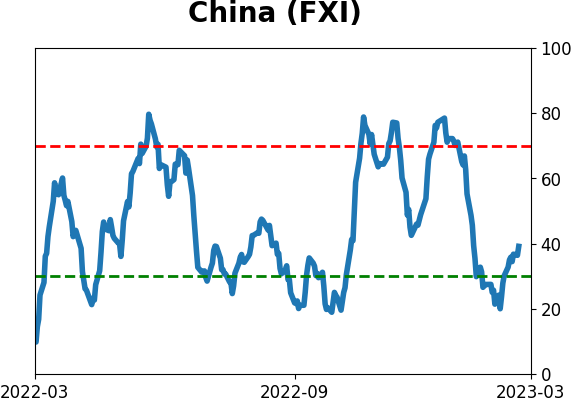
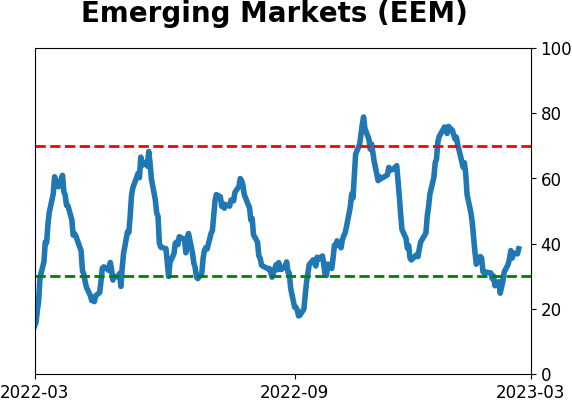
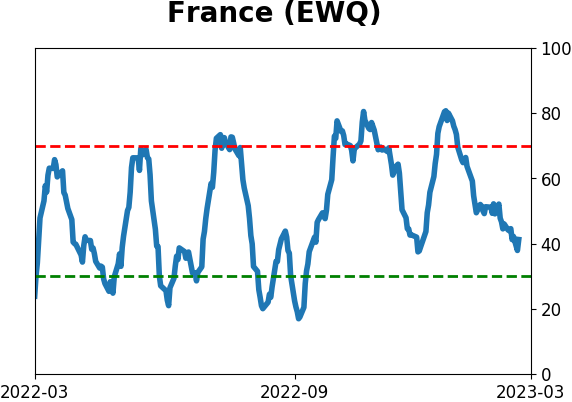
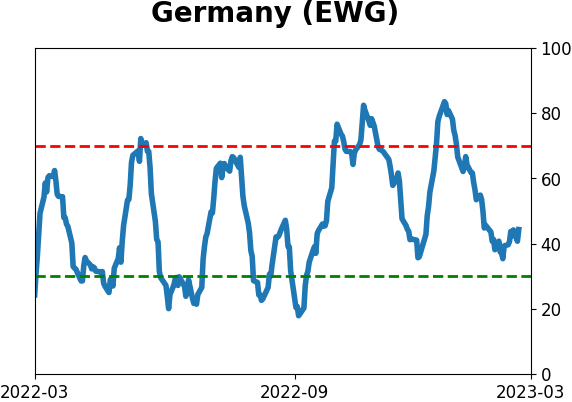
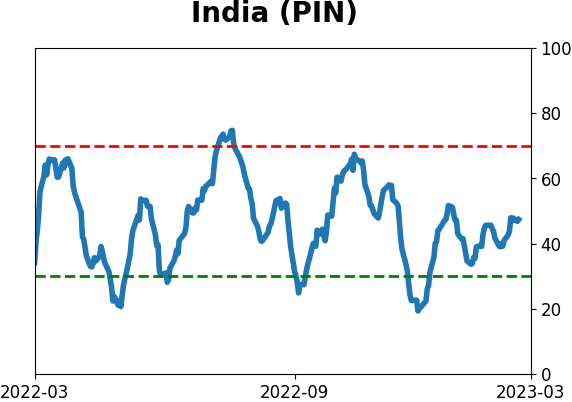
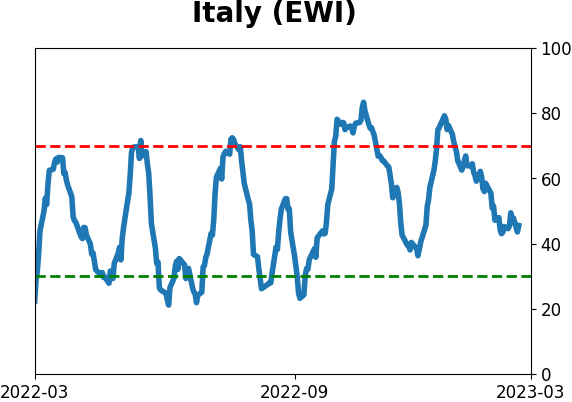
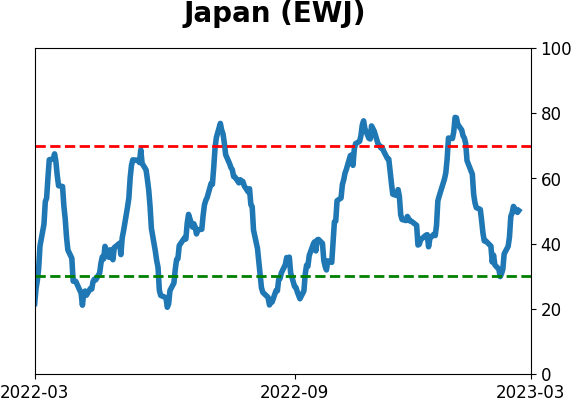
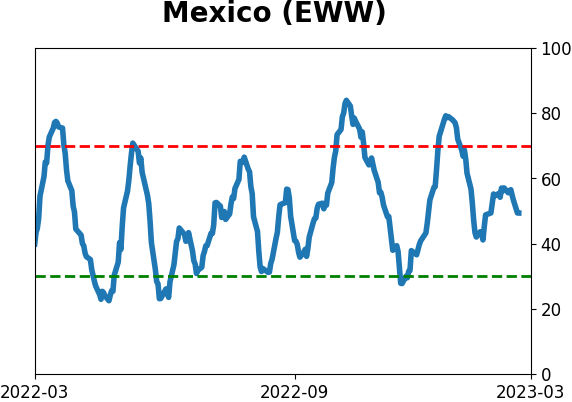
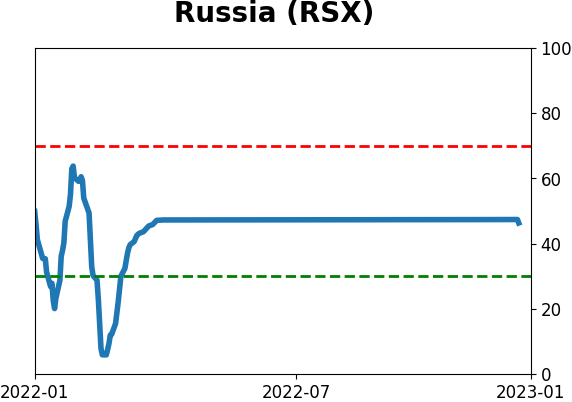
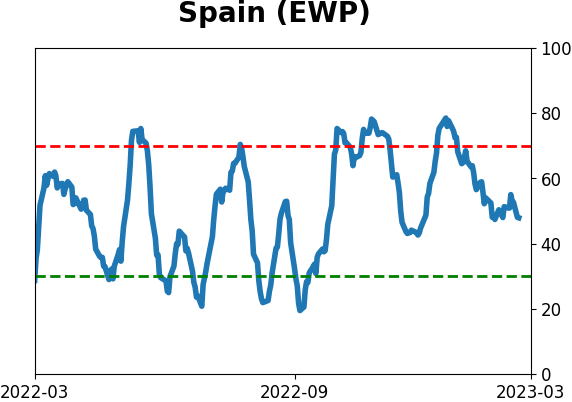
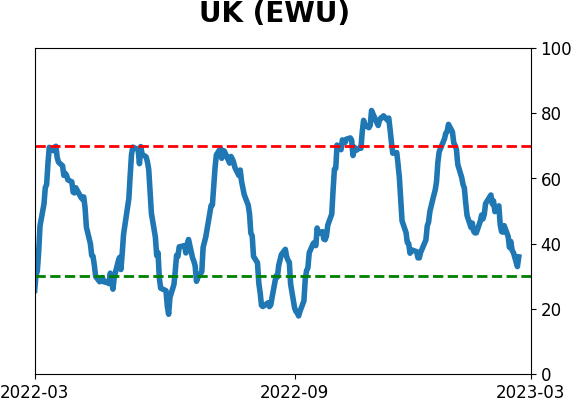
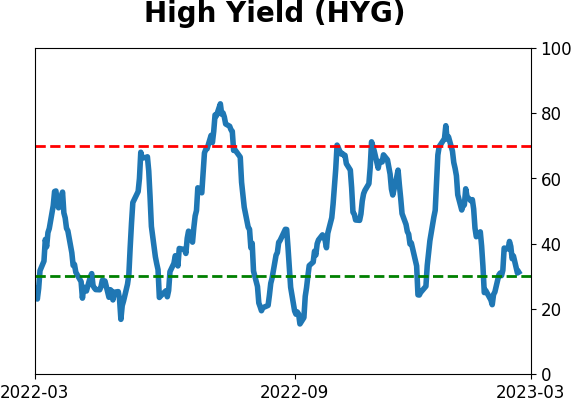
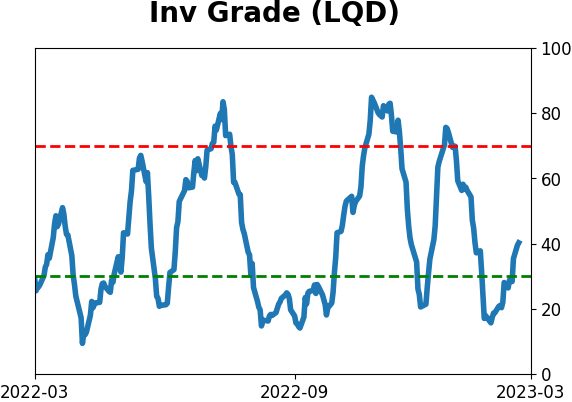
Sentiment Around The World
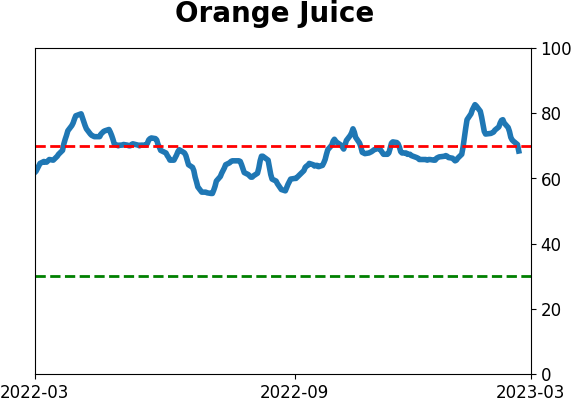
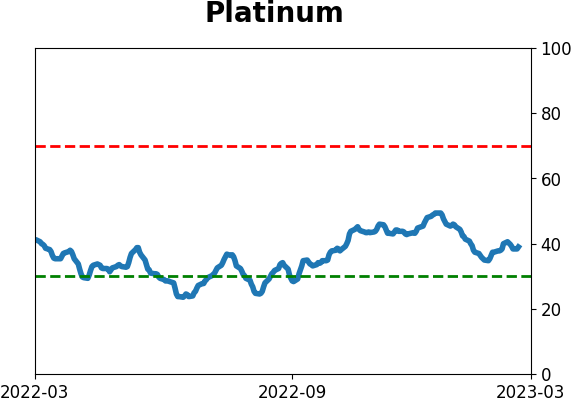
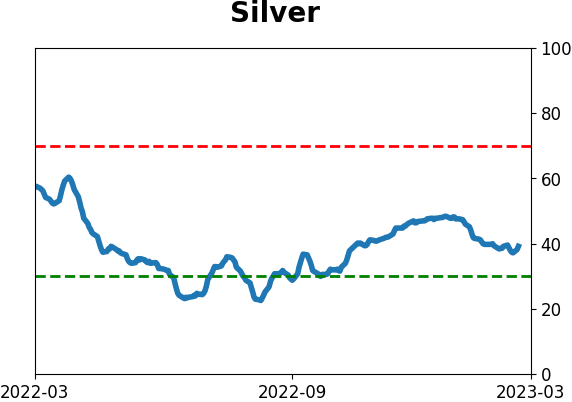
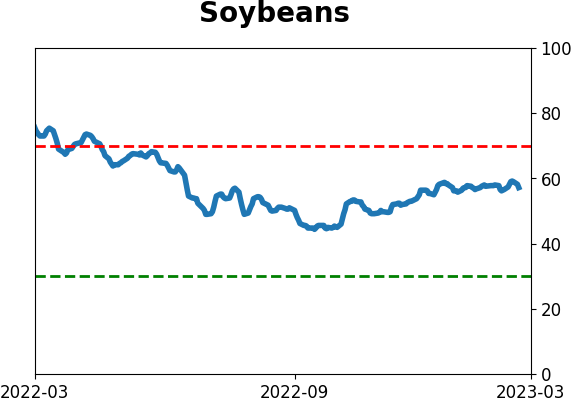
Optimism Index Thumbnails
|
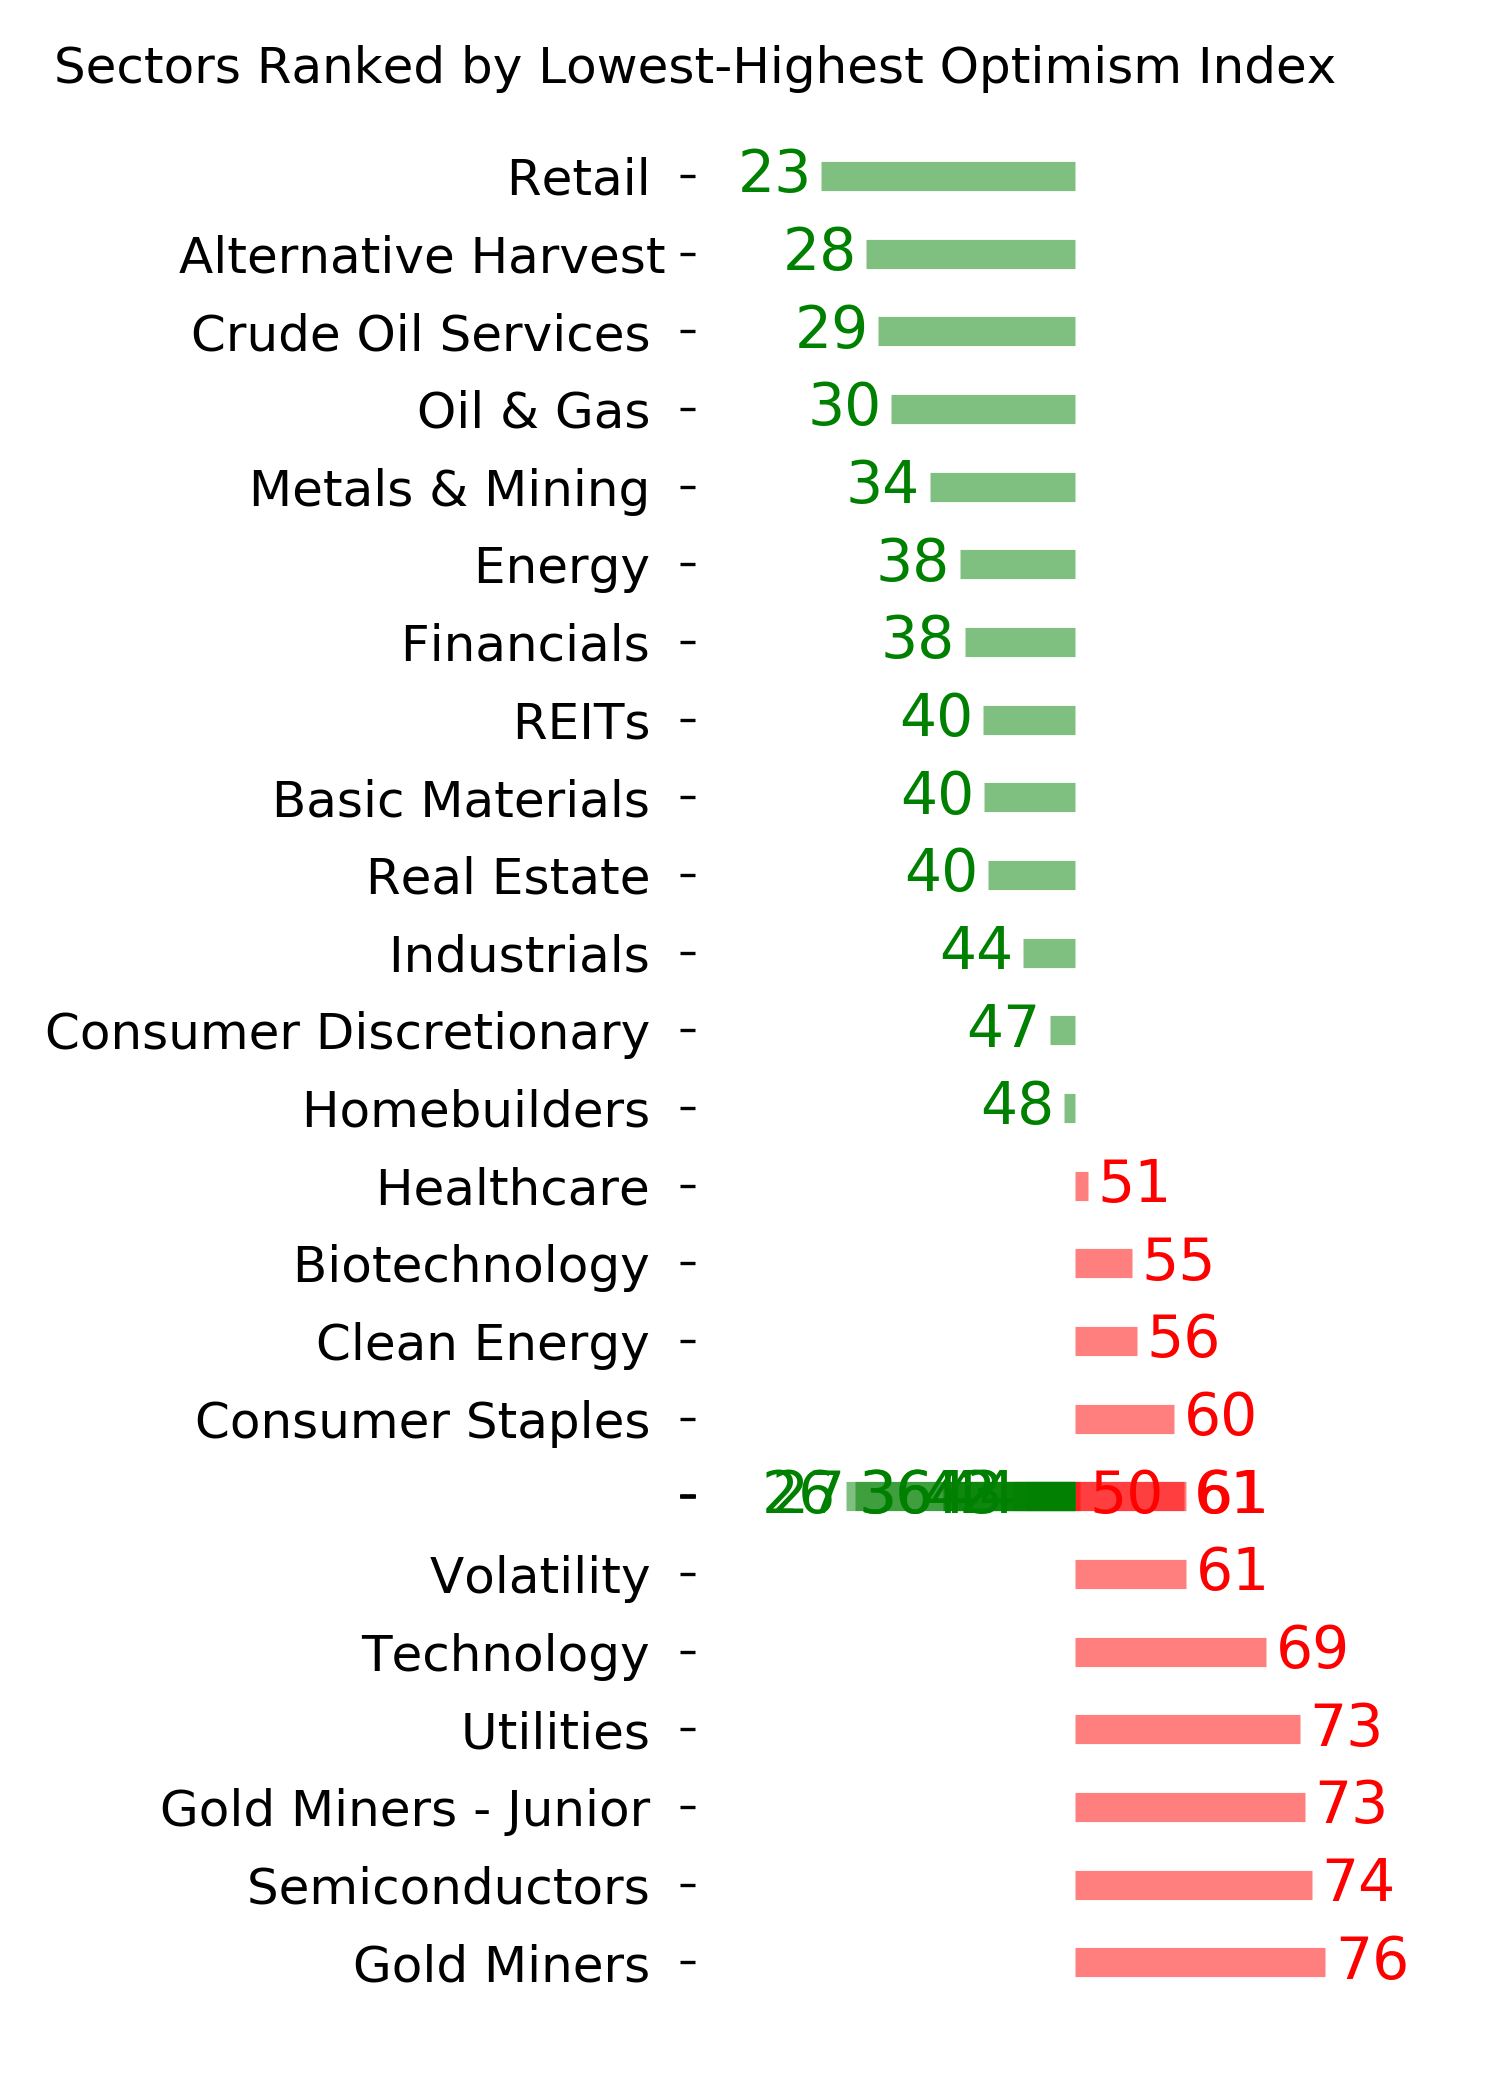
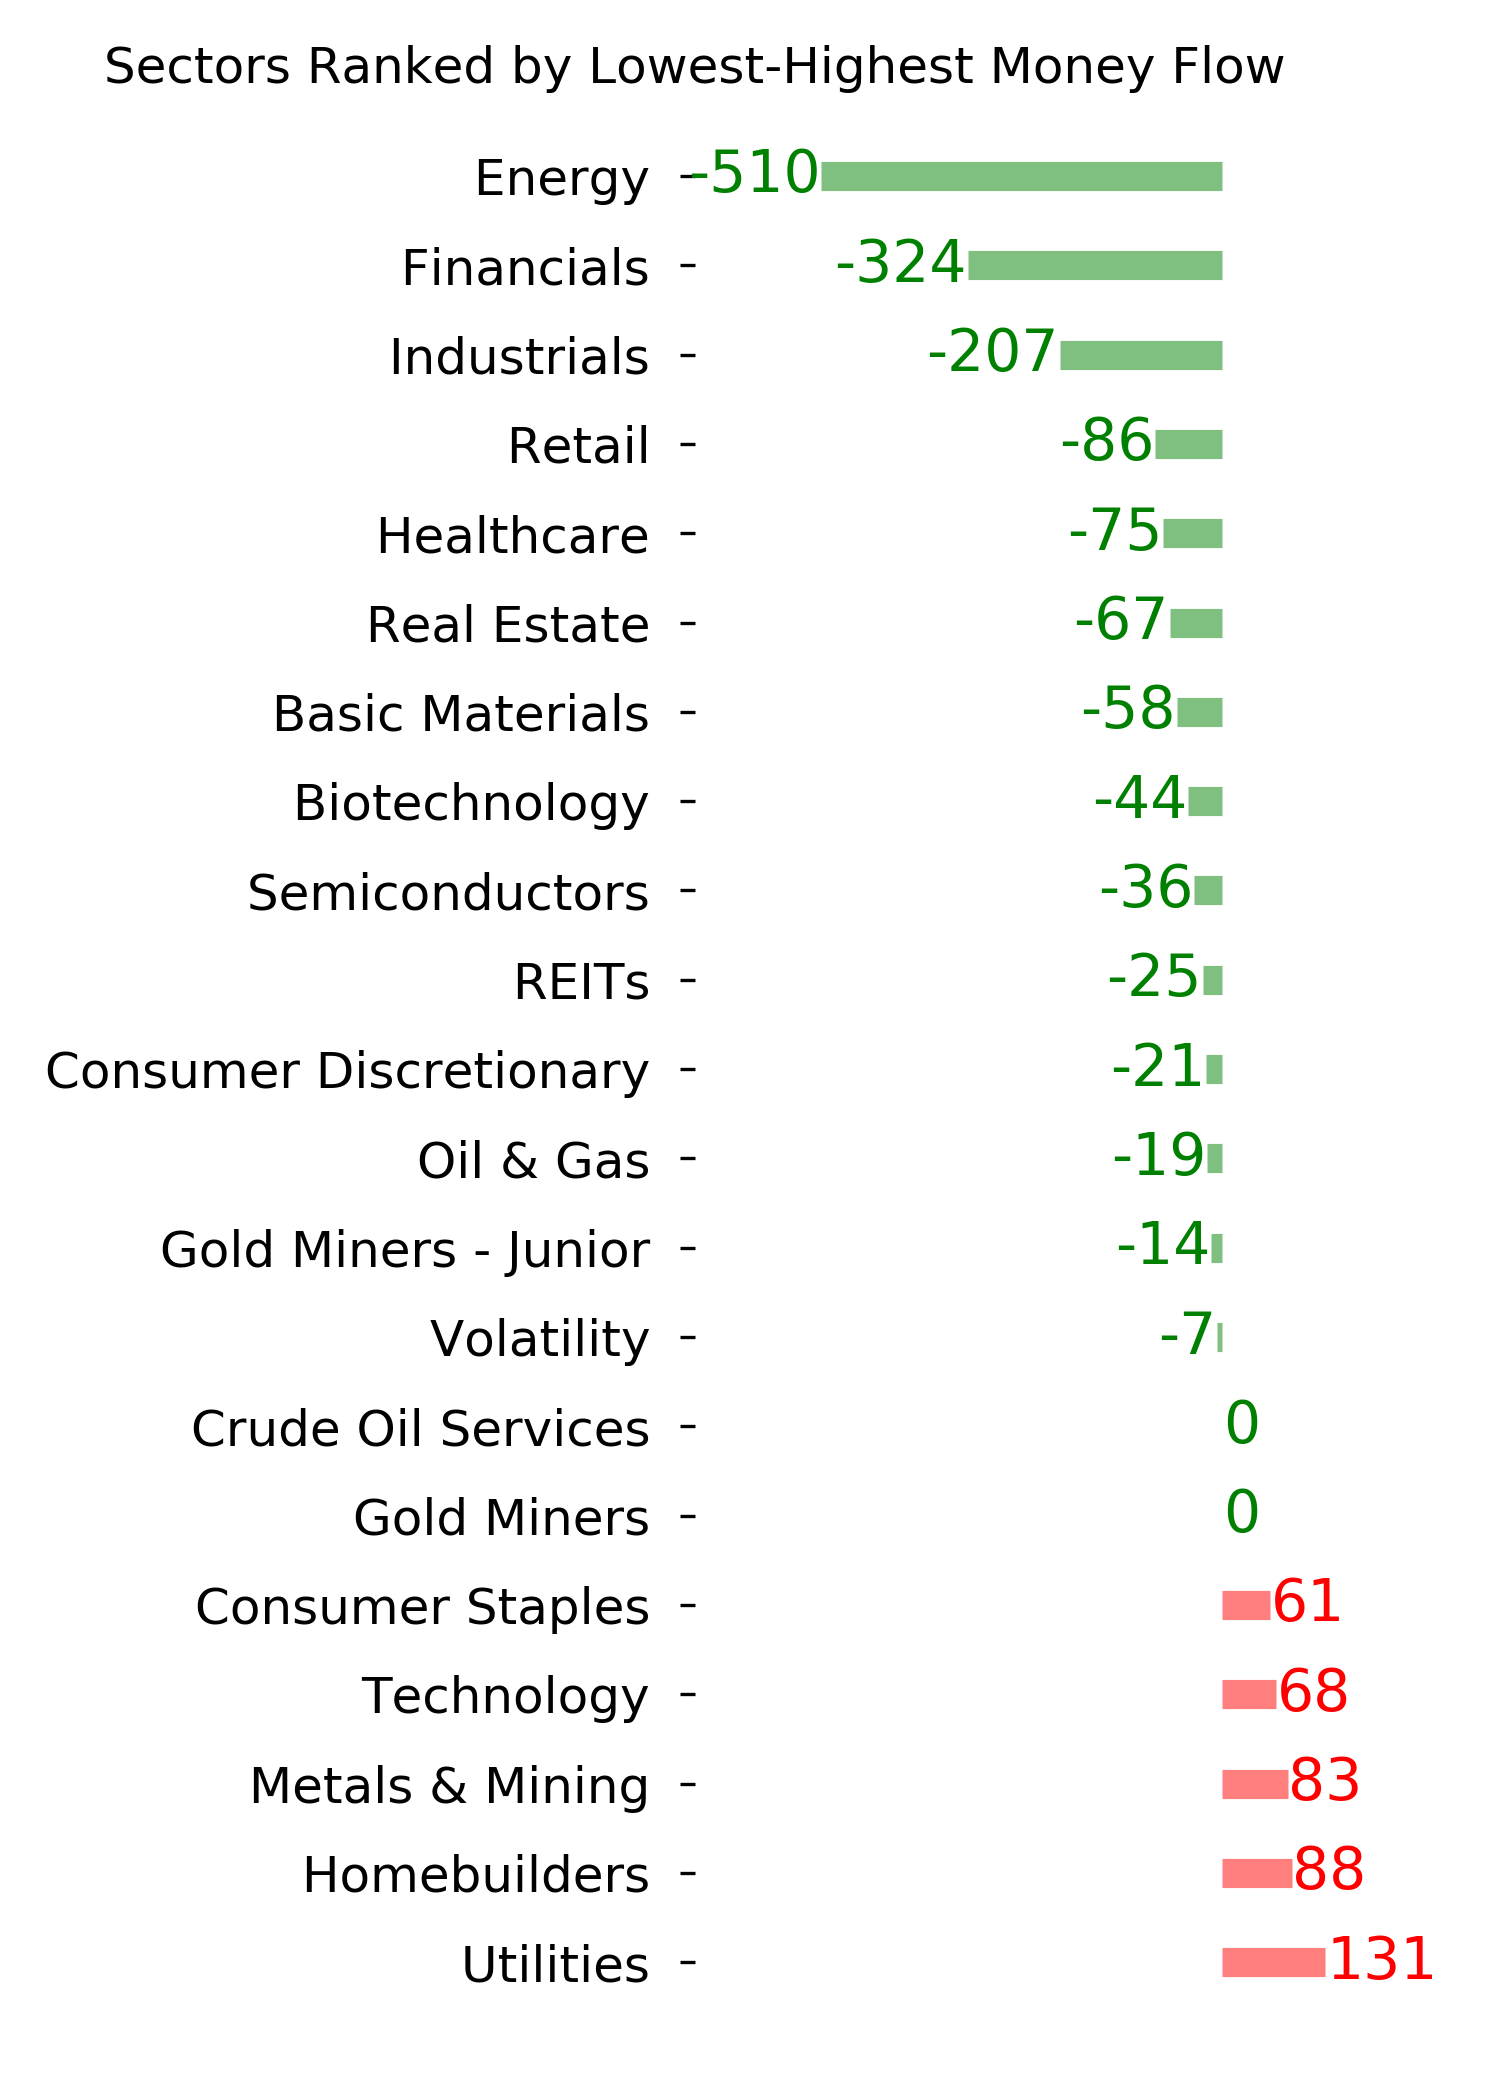
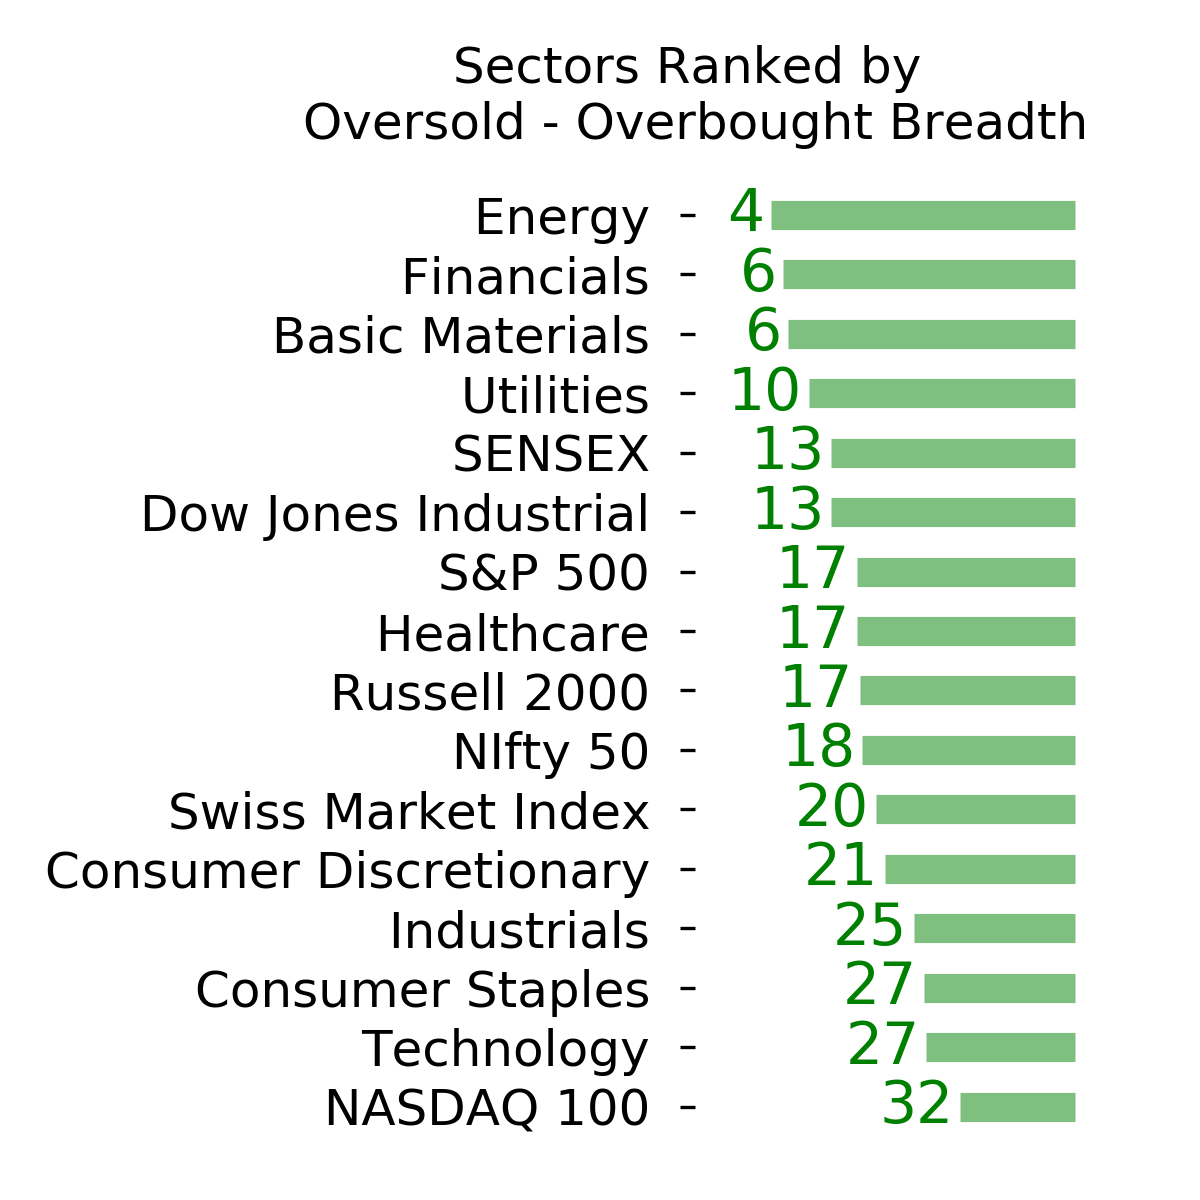
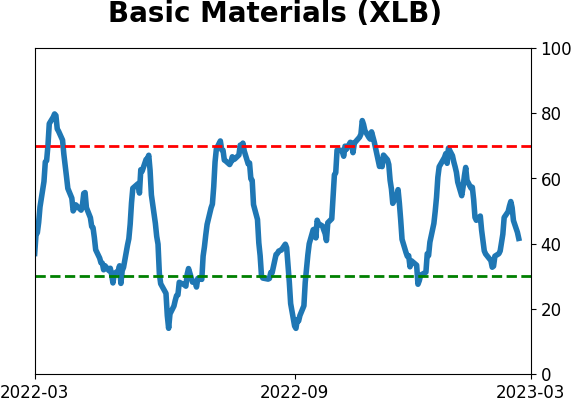
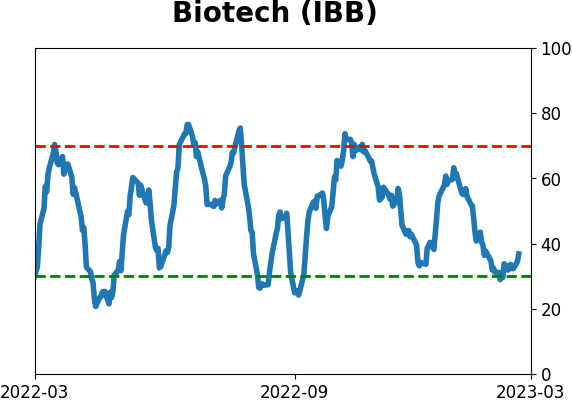
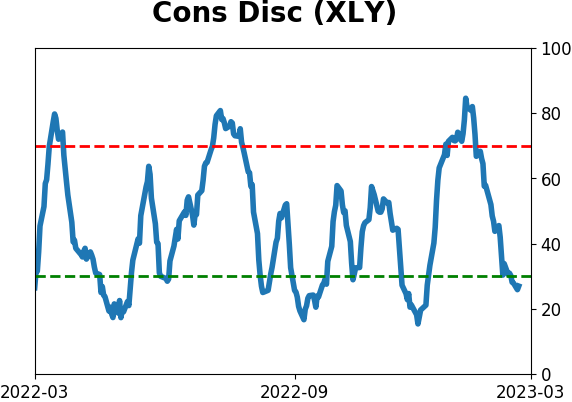
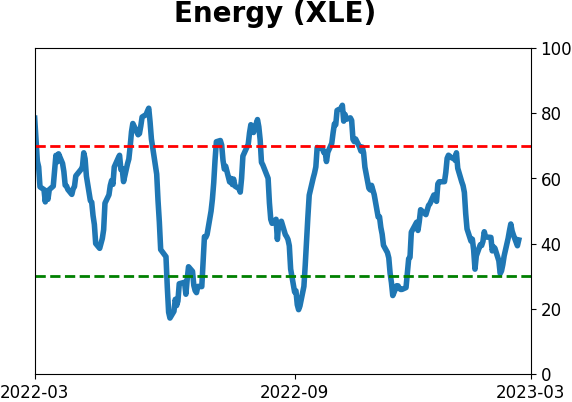
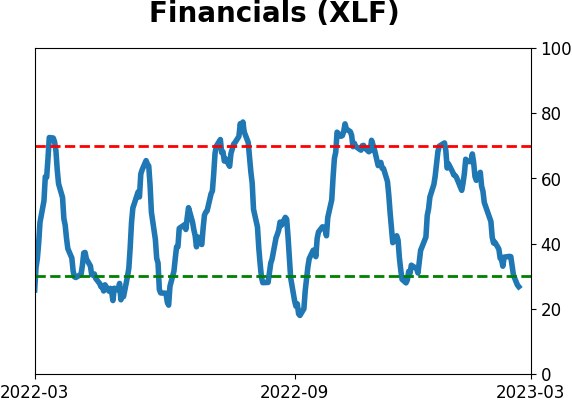
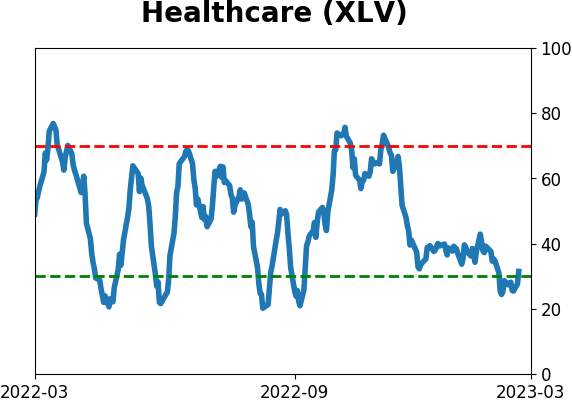
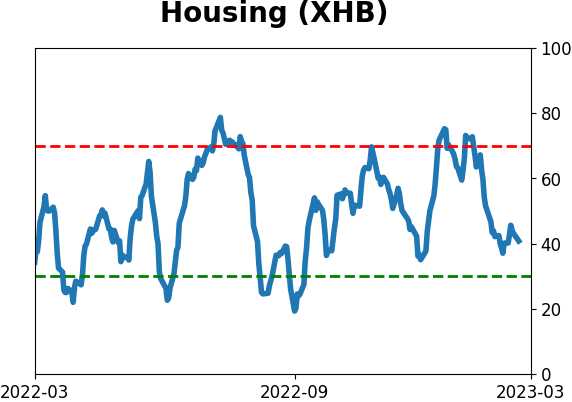
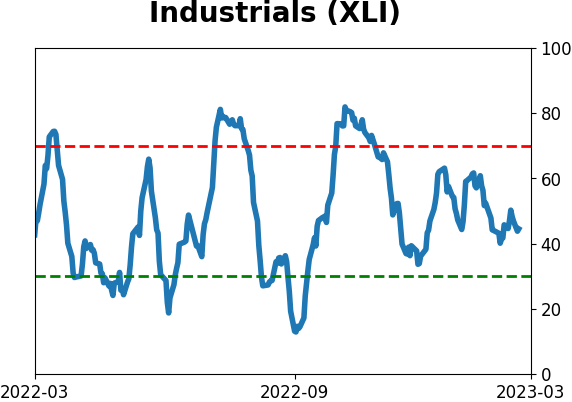
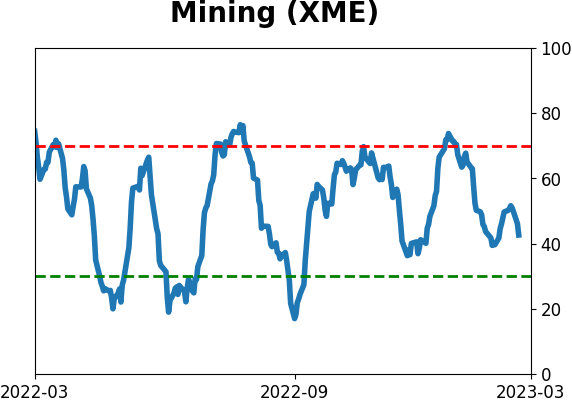
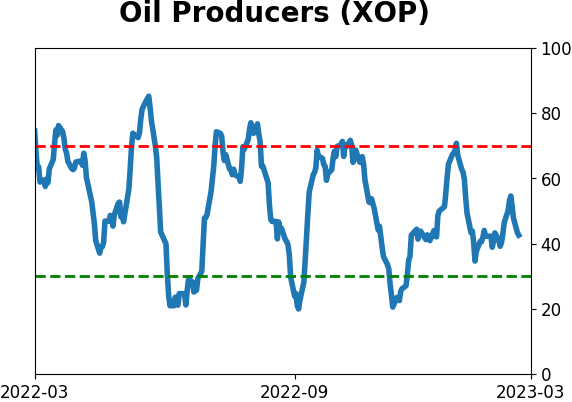
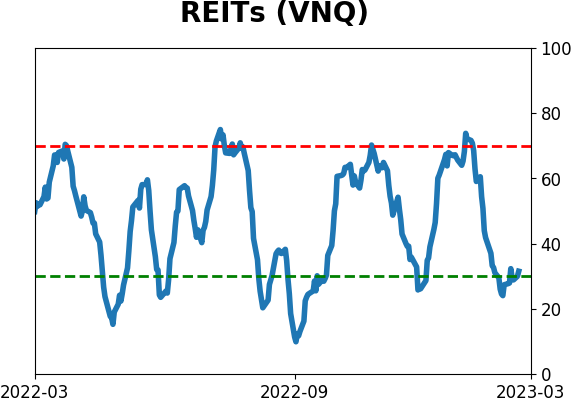
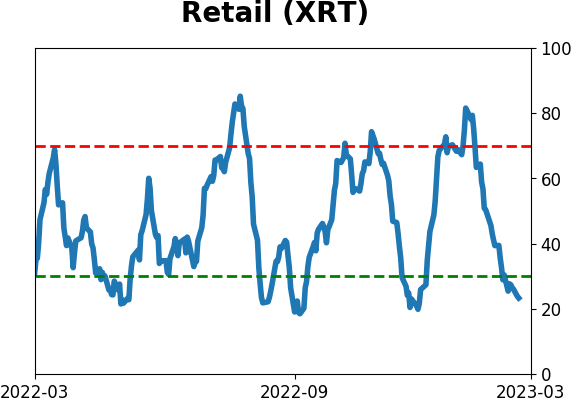
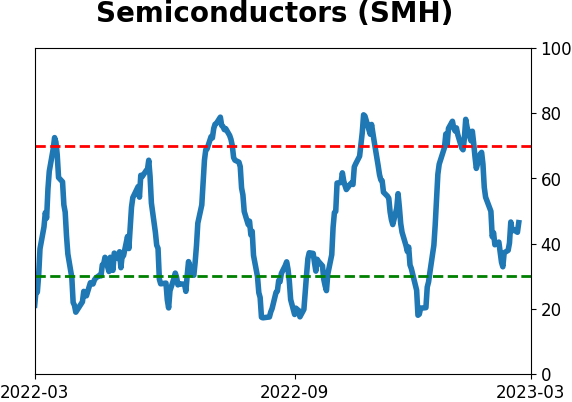
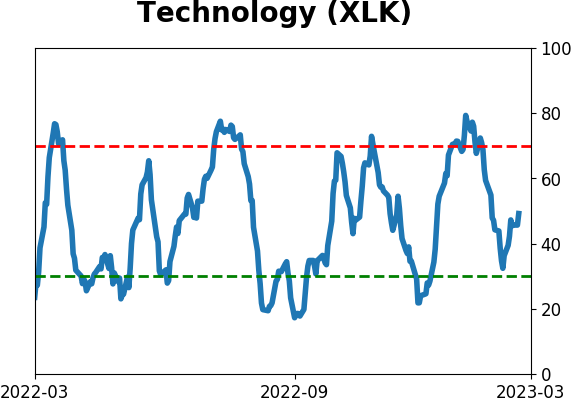
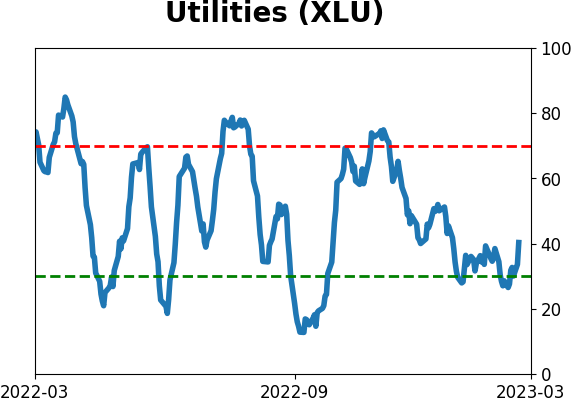
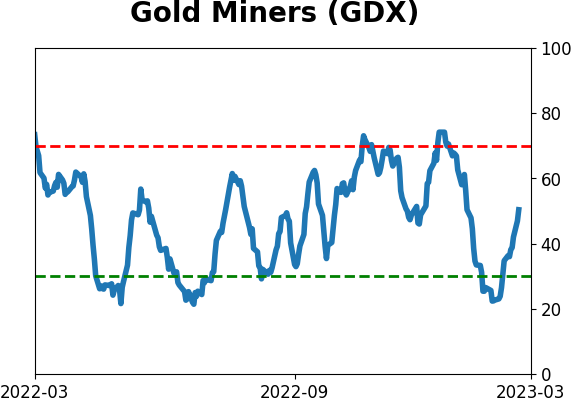
Sector ETF's - 10-Day Moving Average
|
|
|
Country ETF's - 10-Day Moving Average
|
|
|
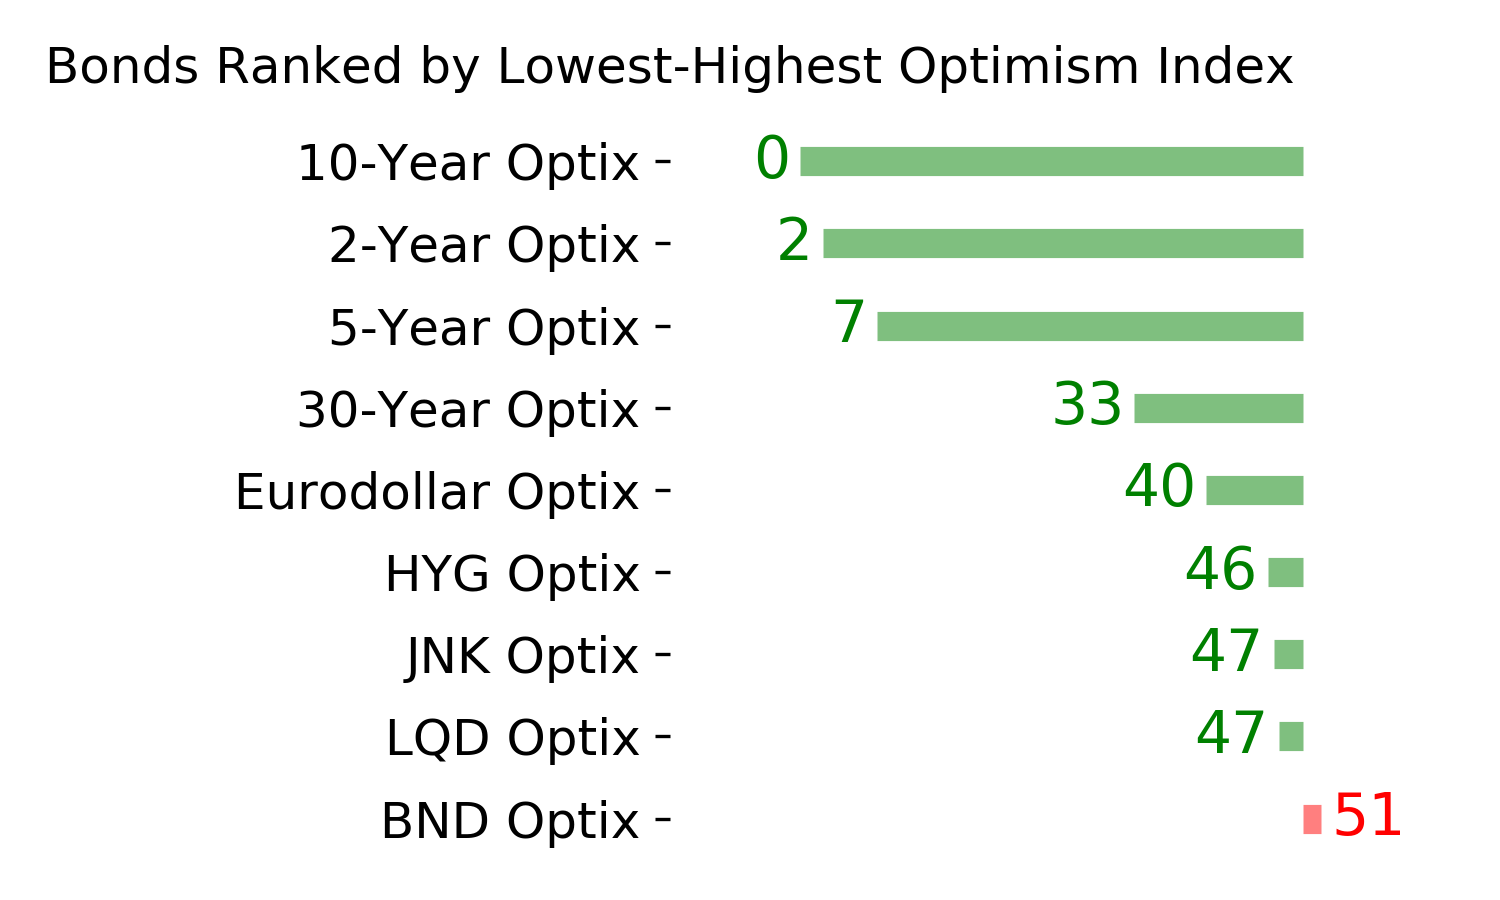
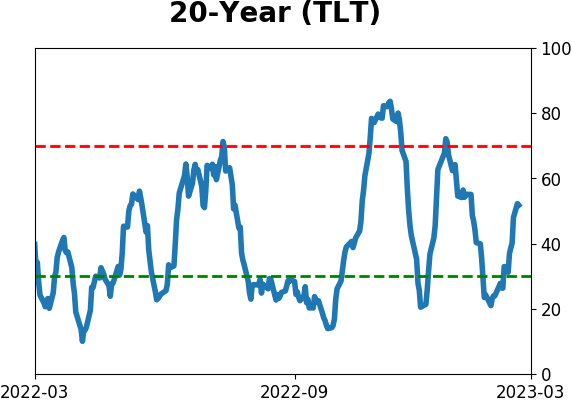
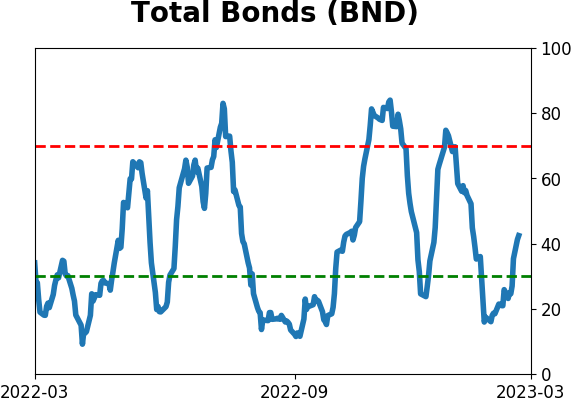
Bond ETF's - 10-Day Moving Average
|
|
|
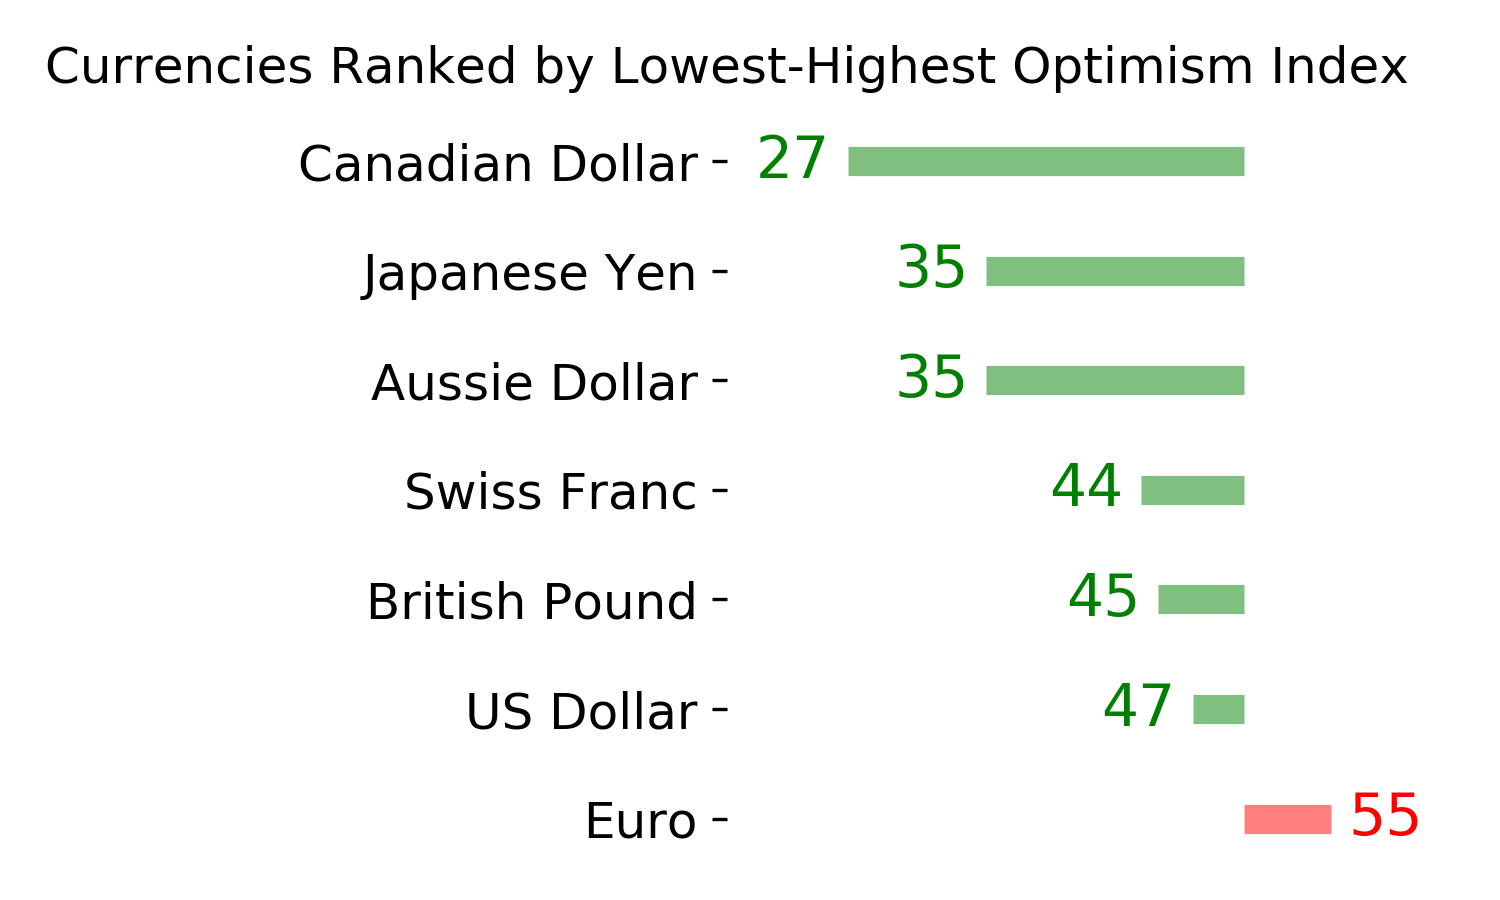
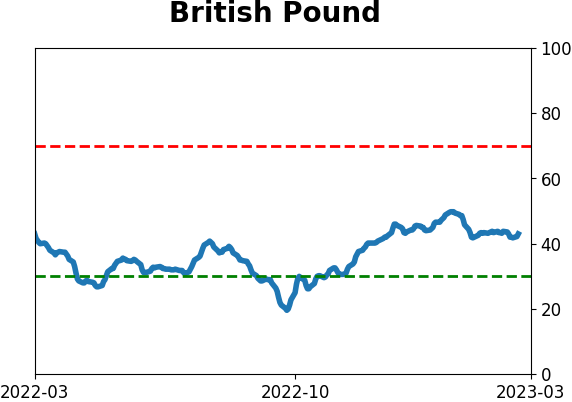
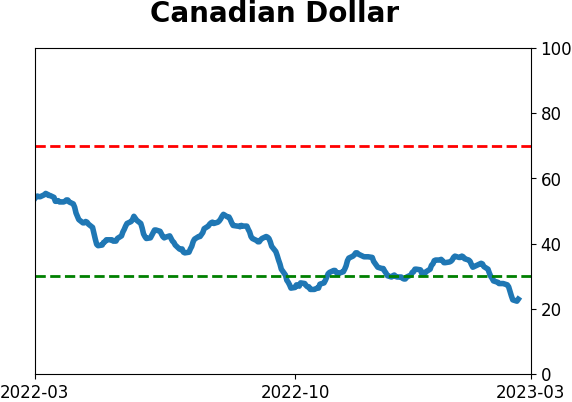
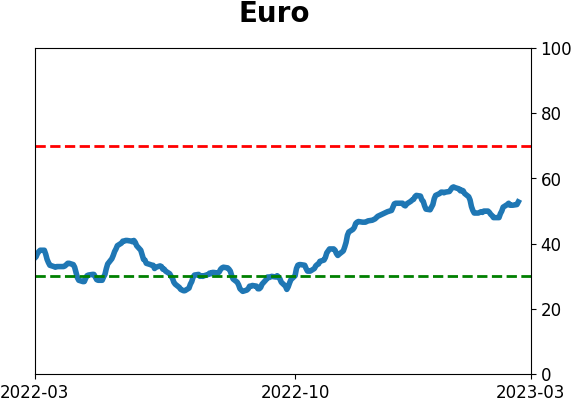
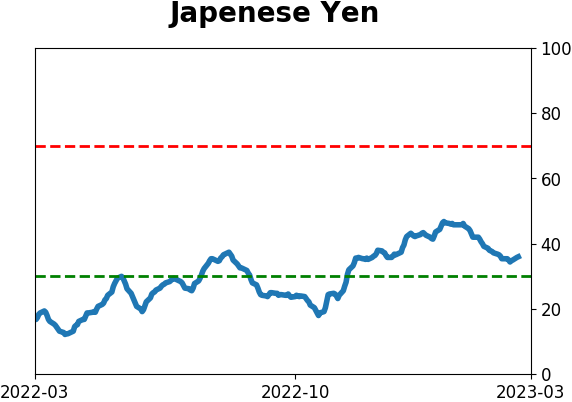
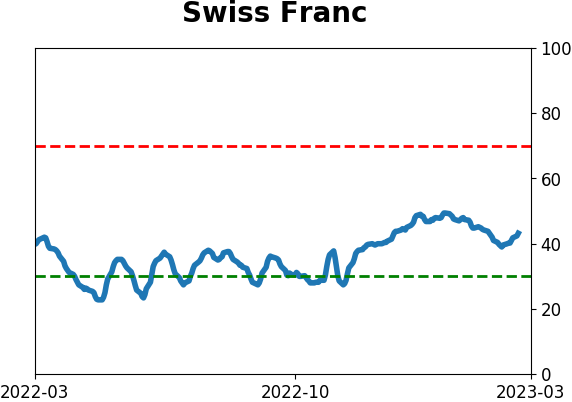
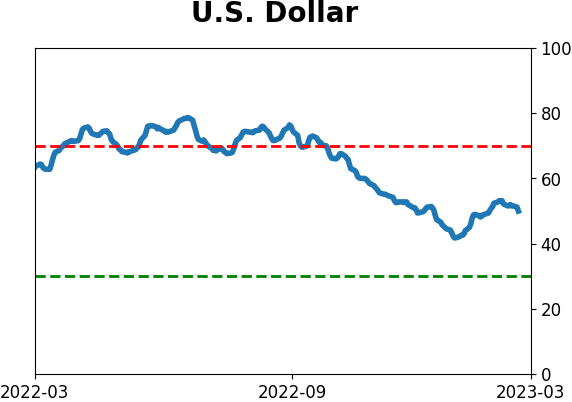
Currency ETF's - 5-Day Moving Average
|
|
|
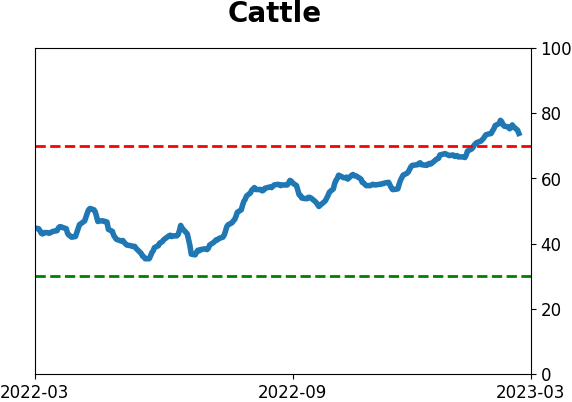
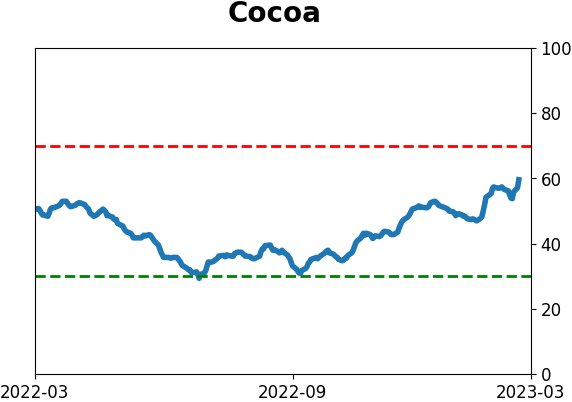
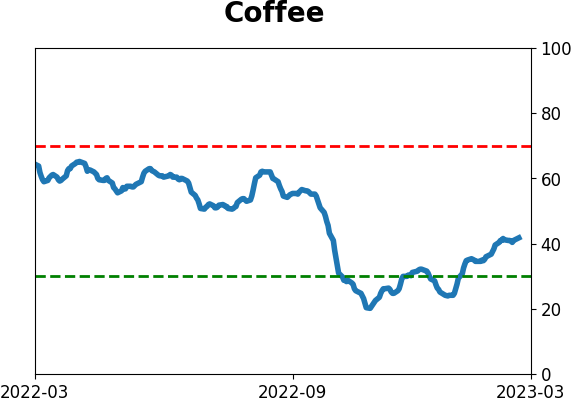
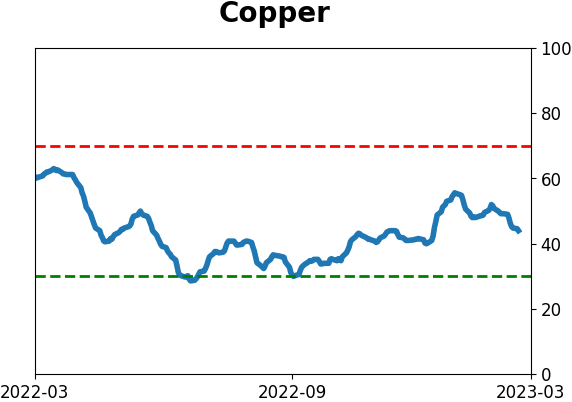
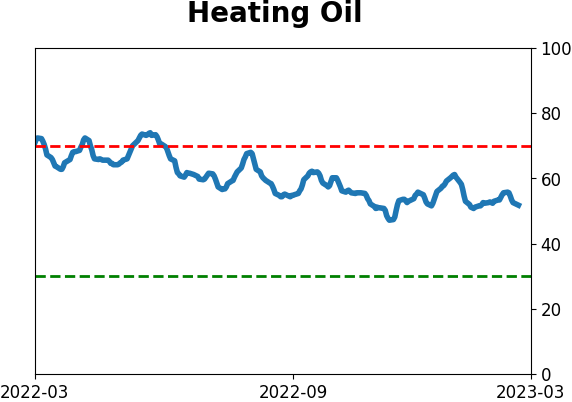
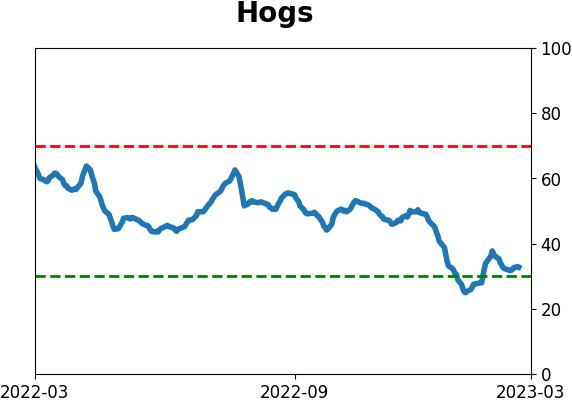
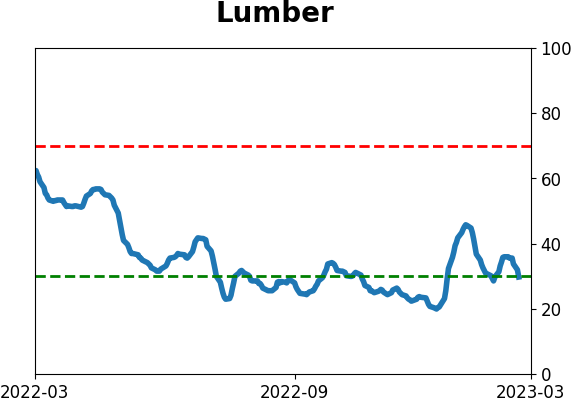
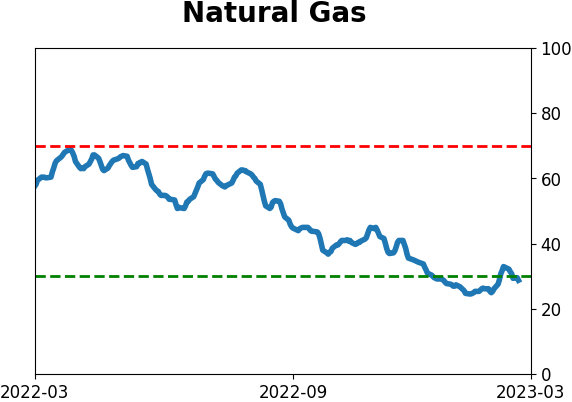
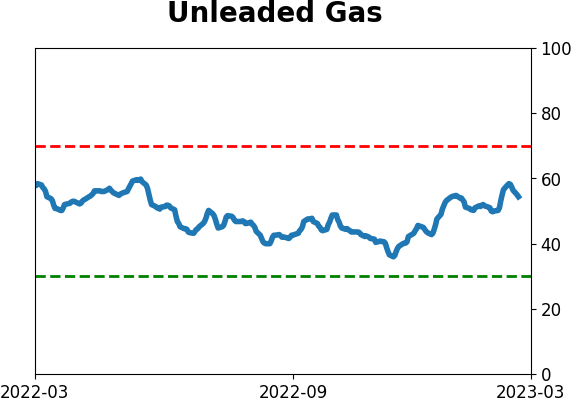
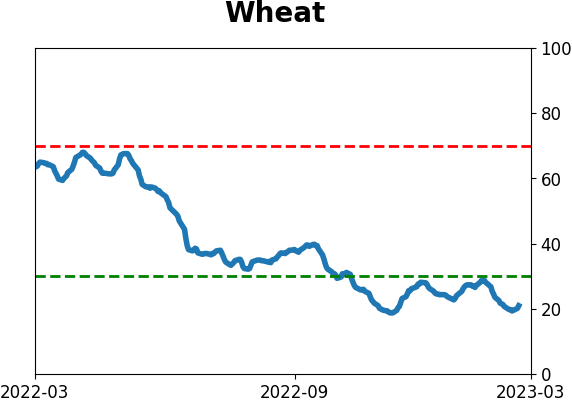
Commodity ETF's - 5-Day Moving Average
|
|