Headlines
|
|
Materials stocks join the new high party:
When we see a surge of participation in a broad sector or index, it usually precedes further gains over the following months. Defensive sectors are less prone to adding to positive momentum, and basic materials can be included in that tendency. Their recent push has a poor record of leading to more gains, though insider buying may help.
|
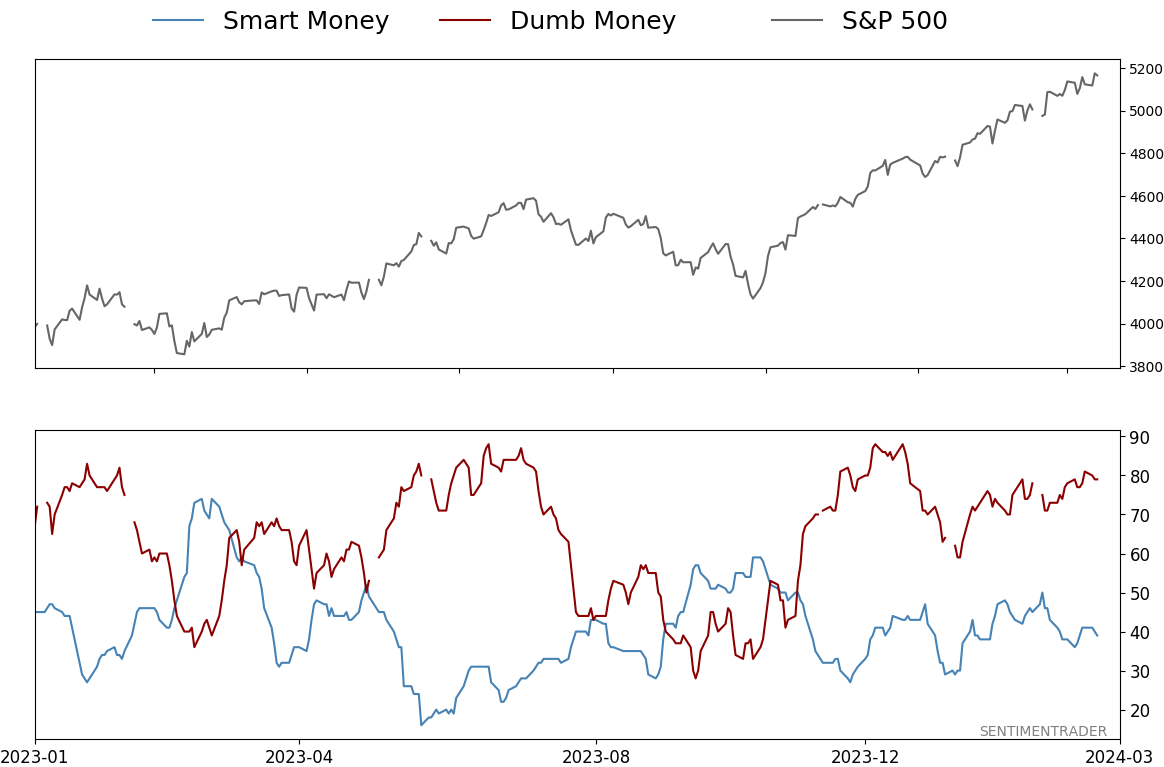
Smart / Dumb Money Confidence
|
Smart Money Confidence: 39%
Dumb Money Confidence: 79%
|
|
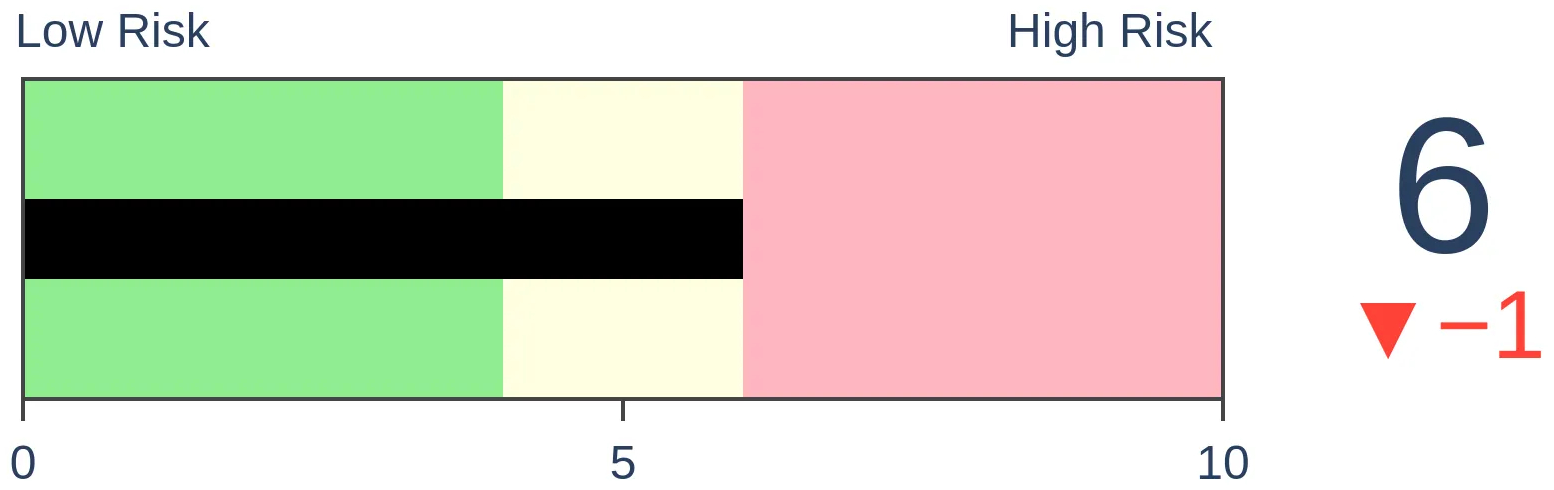
Risk Levels
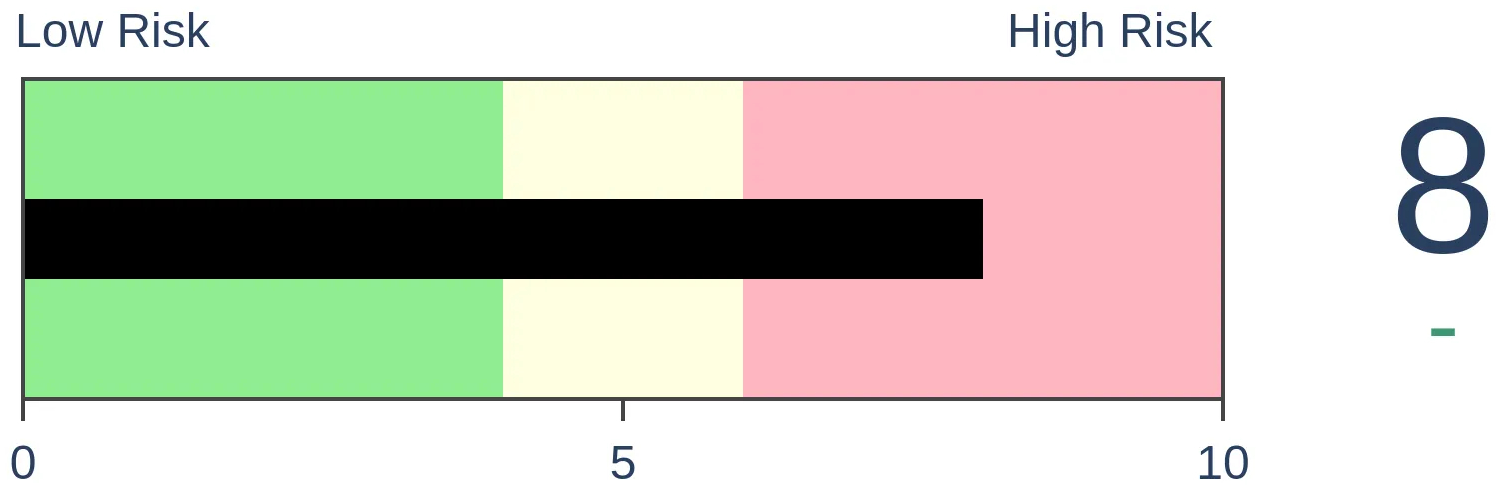
Stocks Short-Term
|
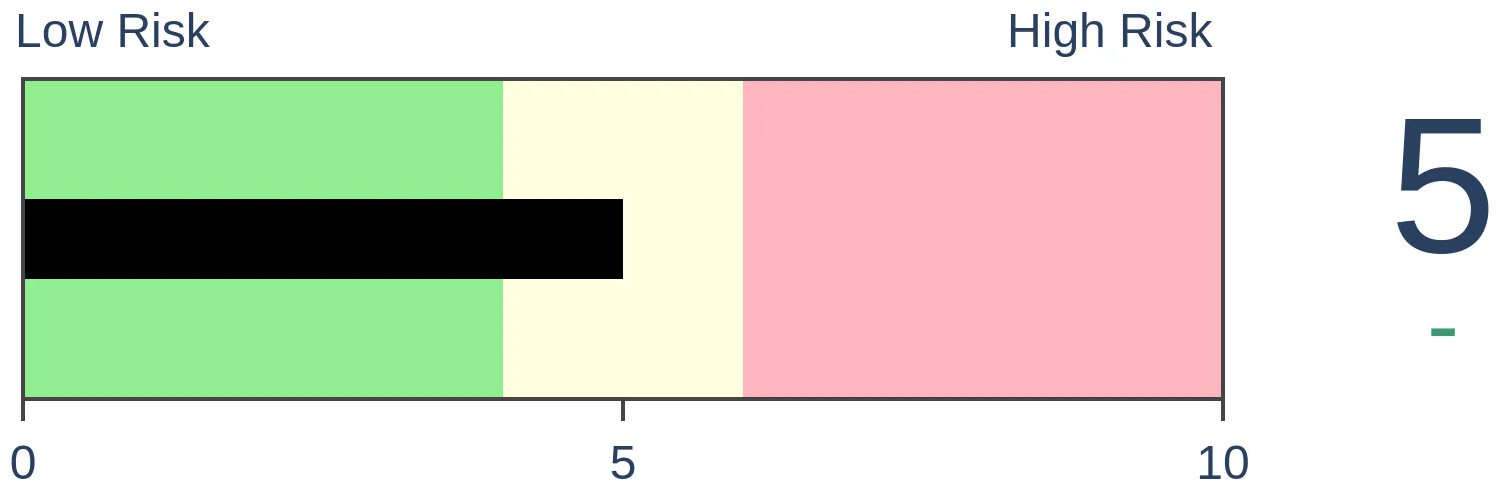
Stocks Medium-Term
|
|
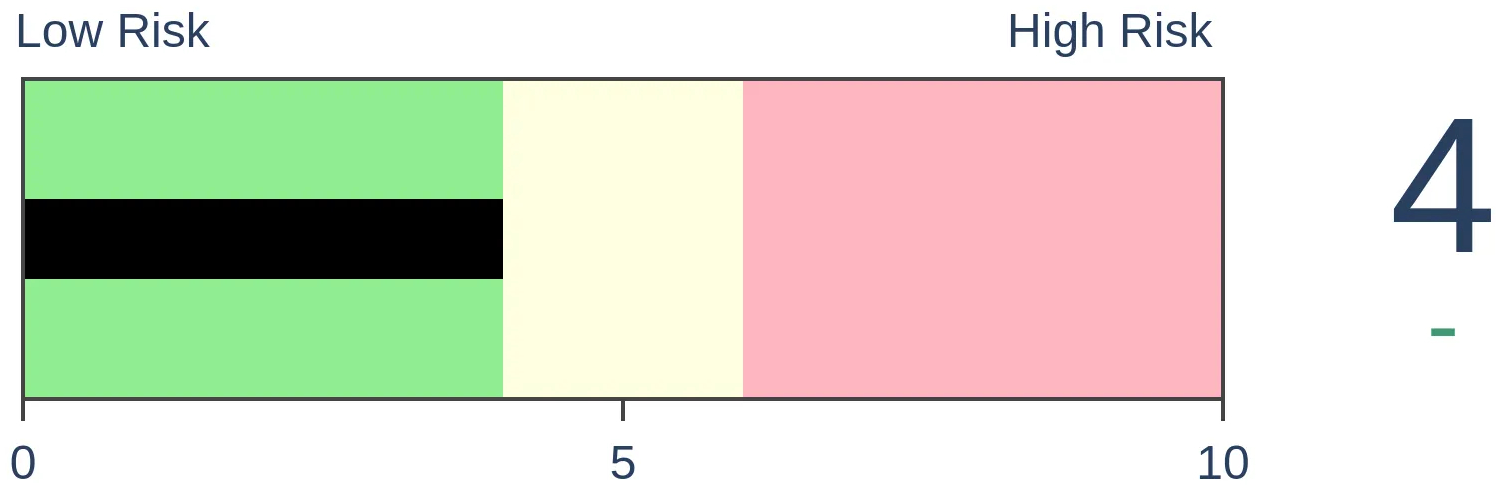
Bonds
|
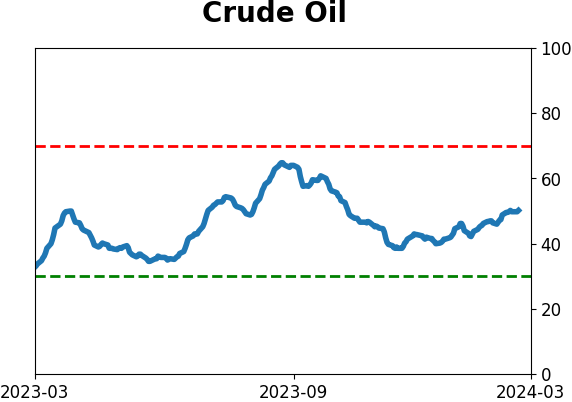
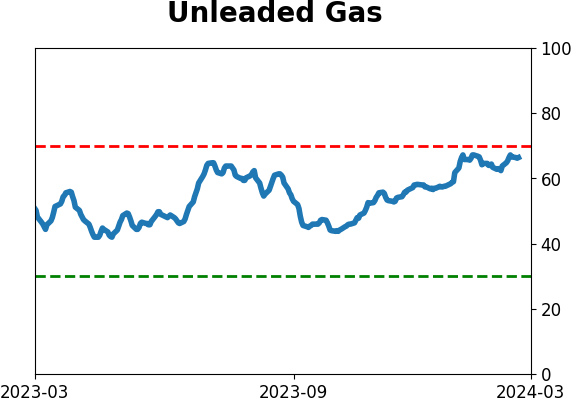
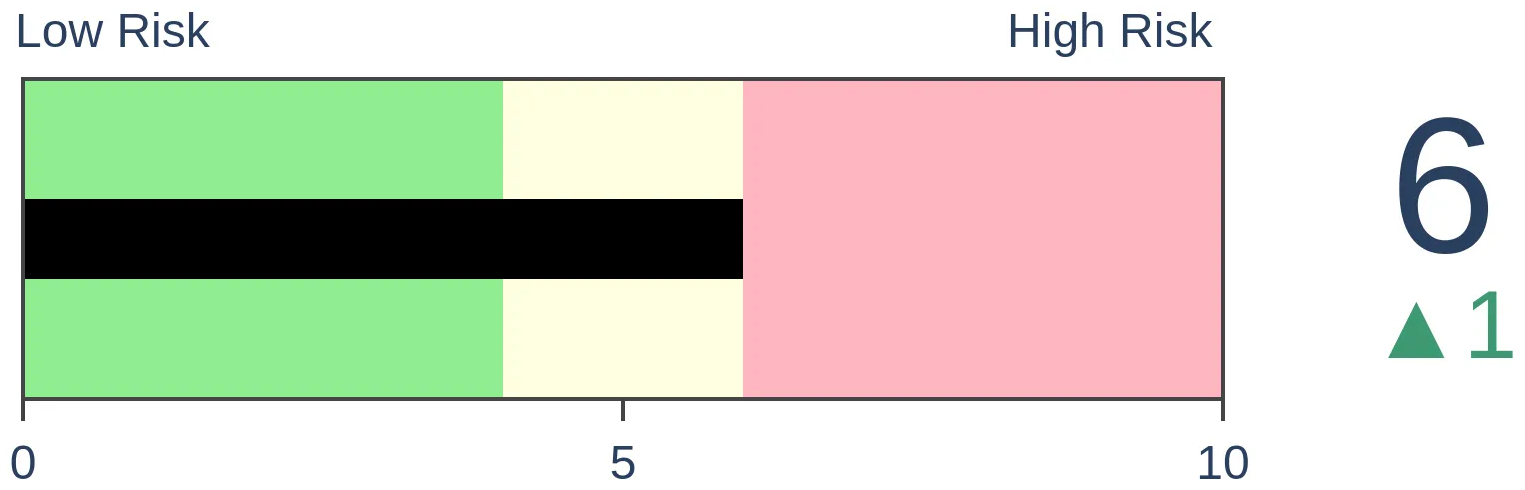
Crude Oil
|
|
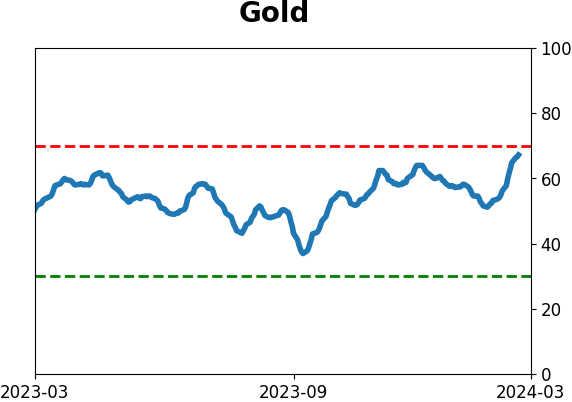
Gold
|
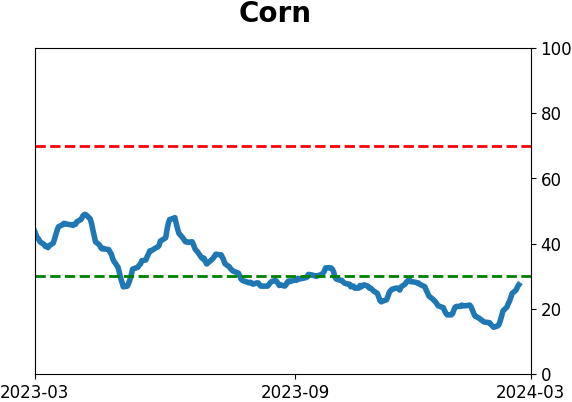
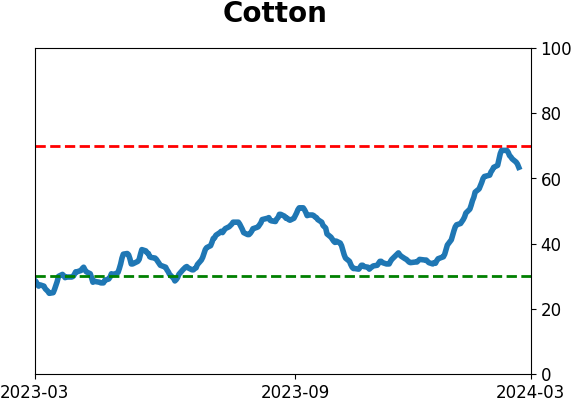
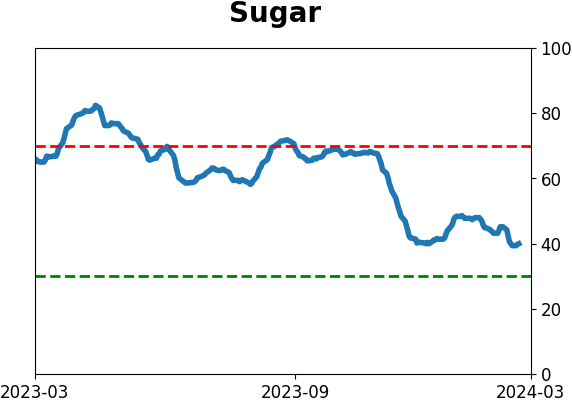
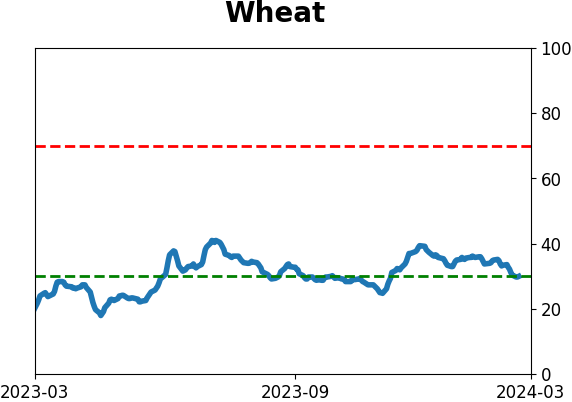
Agriculture

|
|
Research
By Jason Goepfert
BOTTOM LINE
When we see a surge of participation in a broad sector or index, it usually precedes further gains over the following months. Defensive sectors are less prone to adding to positive momentum, and basic materials can be included in that tendency. Their recent push has a poor record of leading to more gains, though insider buying may help.
FORECAST / TIMEFRAME
None
|
Key points:
- More than 30% of materials stocks recently pushed to a 52-week high
- Nearly all of them are trading above their medium-term moving averages, and internal momentum is impressive
- This is one sector that has had trouble holding upside momentum, but insider buying may limit any losses
Materials stocks have seen a concerted push to new highs
Some indexes and sectors react well to upside thrusts (broad U.S. market index, most cyclical stocks and sectors). Others don't (Chinese equities, gold stocks, some defensive stocks and sectors).
With the latter group, periods of investor enthusiasm tend to attract sellers rather than momentum players. While not usually considered a defensive sector, basic materials stocks have also found some trouble when momentum gets hot. They have been showing some signs of renewed investor interest lately, and nearly a third of them recently hit a 52-week high. The last time they spiked like this marked the peak in last 2021.
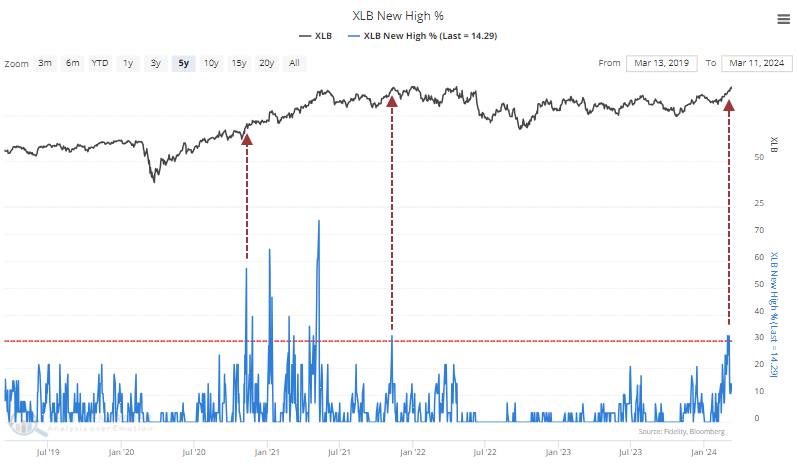
What's also evident from the chart is the time before that was late 2020, after they emerged from a prolonged slump, which is a more apt comparison to the current environment.
The table below shows every time in the past 70 years when more than 30% of materials stocks reached a 52-week high for the first time in at least two years. For most broader sectors and indexes, this type of reading will lead to more gains over the medium- to long-term. The materials sector isn't very broad, and as noted above, signs of momentum haven't been a great signal to jump in.
Over the next three months, the total return on the sector was negative, only 38% of the signals showed a positive return, and the average max loss exceeded the average max gain.
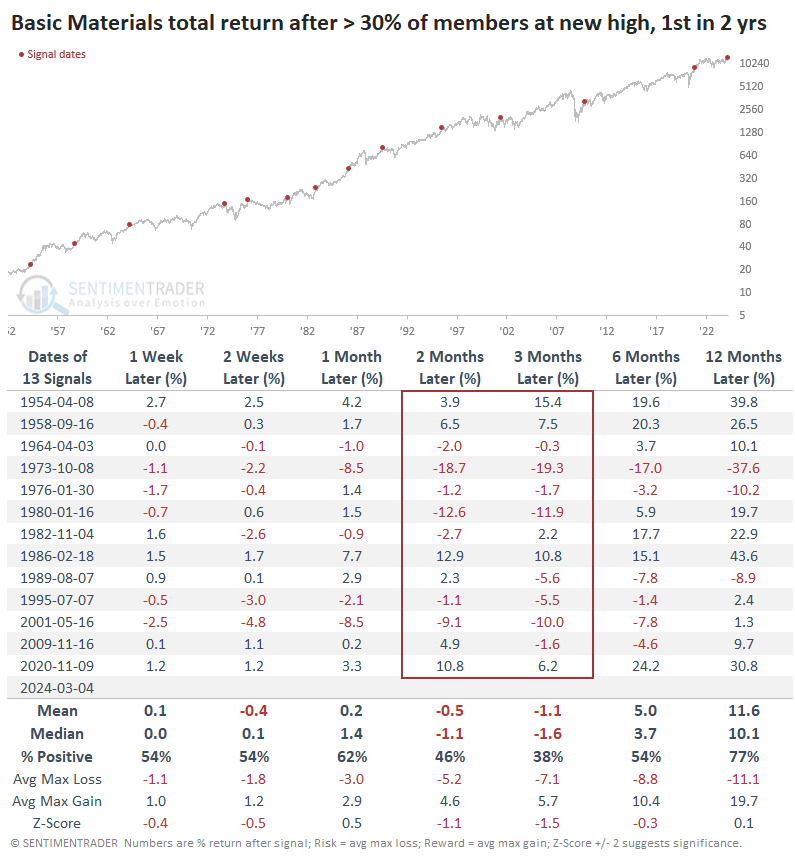
One wrinkle we often see with groups like this is that if the rally is real, investors will typically keep pushing them in the short term. Often, we see a high positive correlation between one-week and six- to twelve-month returns. That's the case here, as well. It's not perfect, but if investors continue to push materials stocks higher in the short-term (or at least not sell them aggressively), they tend to stick around longer term.
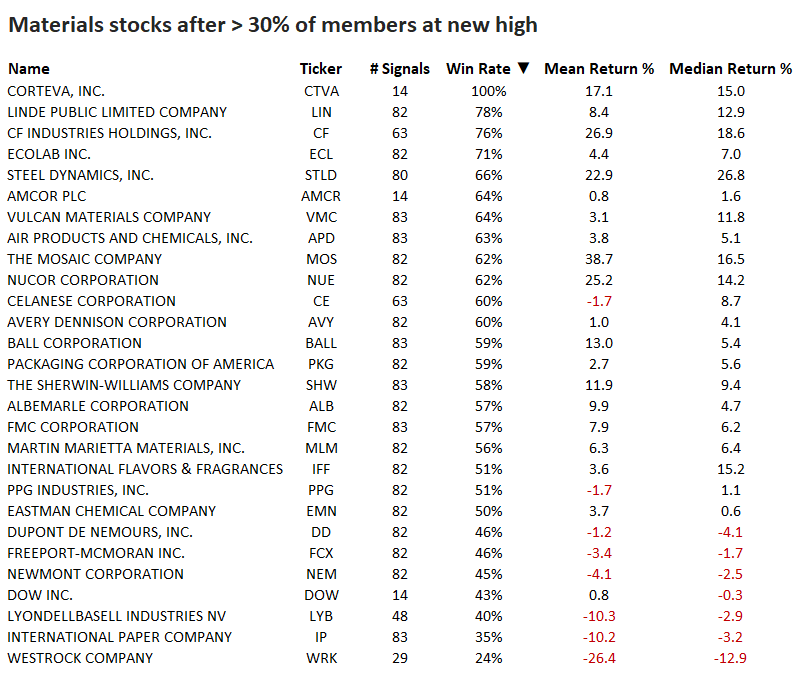
The table below focuses on more recent history of individual stocks within the S&P 500 materials sector. It shows the win rate and returns in the year following any day when 30% or more of stocks in the sector reached a 52-week high. It's sorted by Win Rate, with the best performers at the top and worst at the bottom.
Other indicators are showing overbought conditions amid impressive insider buying
Other medium- to long-term indicators have also jumped higher for the sector in recent days. More than 95% of the stocks are trading above their 50-day moving averages, which has also preceded mostly negative short-term returns in the XLB fund.
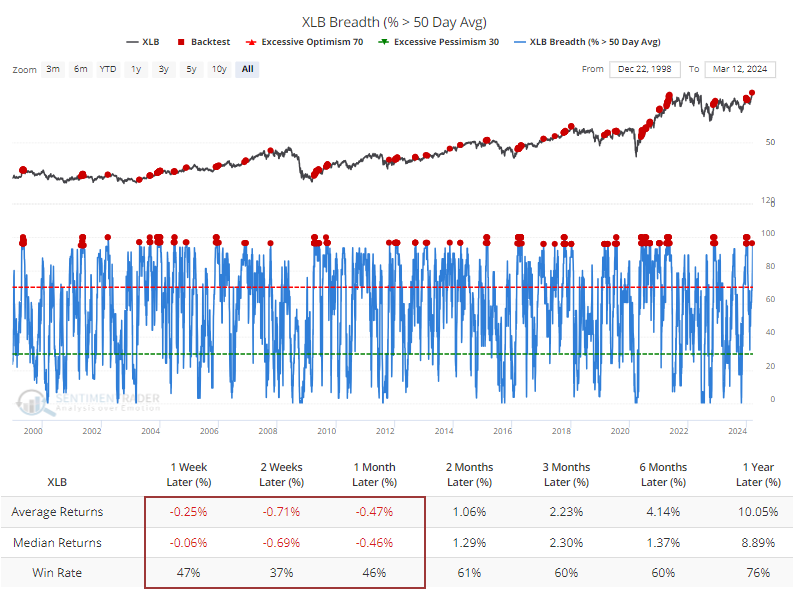
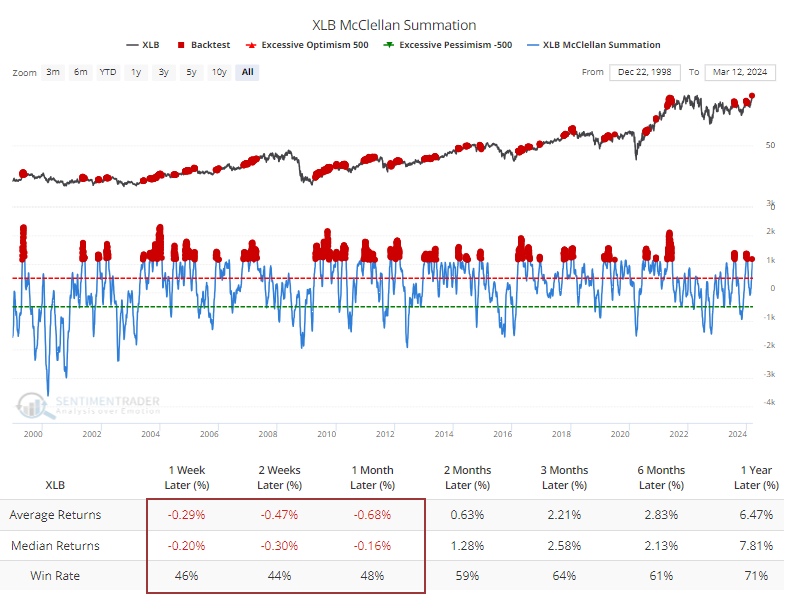
The move in these stocks has been impressive and persistent enough that the McClellan Summation Index for the sector has pushed above +1150. Again, XLB has had some difficulty adding to the positive momentum.
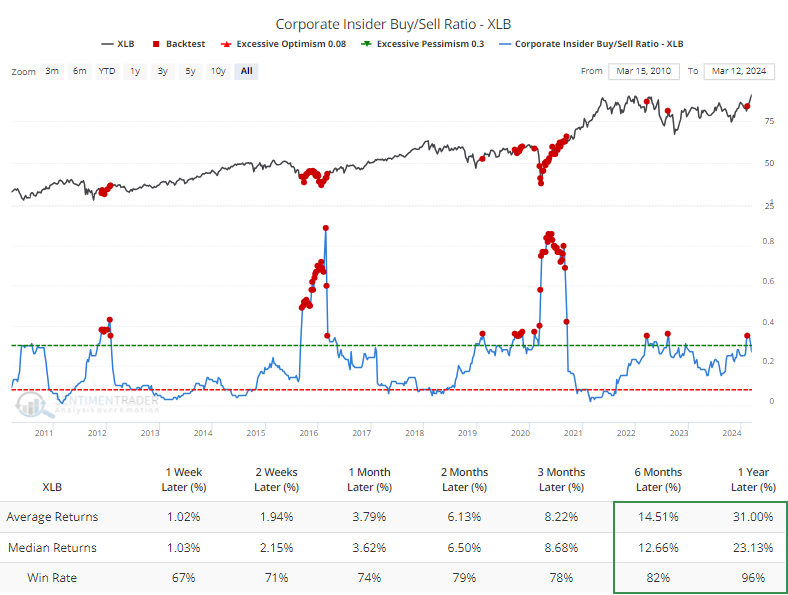
Potentially, the most compelling positive, from a longer-term point of view, is that corporate insiders have been loathe to sell and relatively eager to buy shares of their companies. The buy/sell ratio for firms in the materials sector is high compared to the past decade. It has gotten much higher during panics, and there were a couple of weeks in 2022 that gave terrible signals, but 6- to 12-month returns have been impressive after similar behavior.
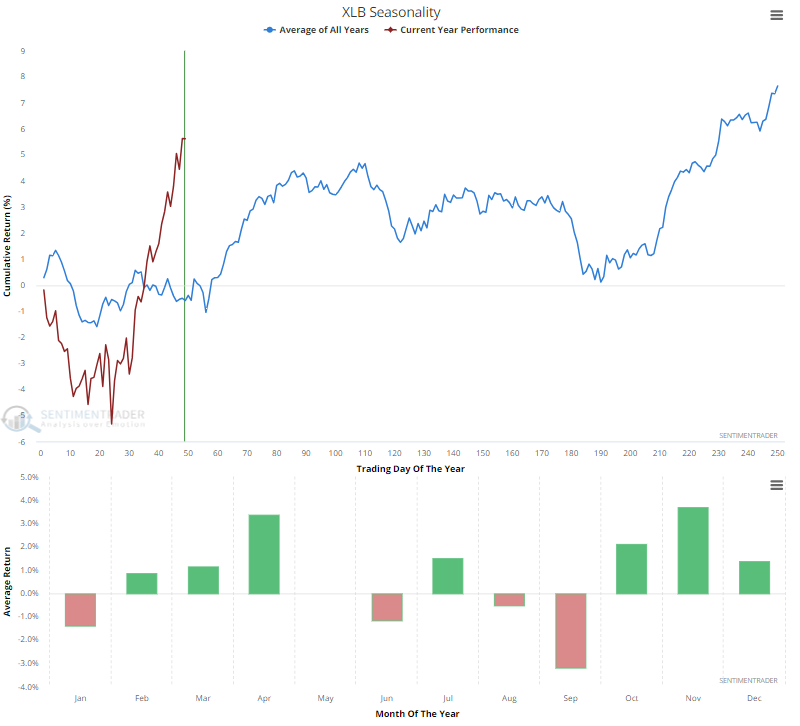
Because of the nature of their business, some of the stocks can be a bit more seasonally consistent over the years. The XLB fund started the year by adhering to its seasonal pattern very well, but in recent weeks, it has front-run what has typically been a positive trend into April. The summer months have been more of a struggle.
What the research tells us...
When we've looked at breadth thrusts from various perspectives for most sectors, and certainly for the broader U.S. stock market, they have consistently preceded gains over the following months. There are rare exceptions to this rule of thumb, usually in defensive sectors or those less correlated to moves in the broader market.
We see some evidence of that in the basic materials sector. When they've surged as in recent weeks, the stocks have had difficulty adding to their gains in the weeks and months ahead. Longer-term returns have usually been acceptable, and there are some promising signs in that time frame, such as a relatively high level of insider buying interest.
Indicators at Extremes
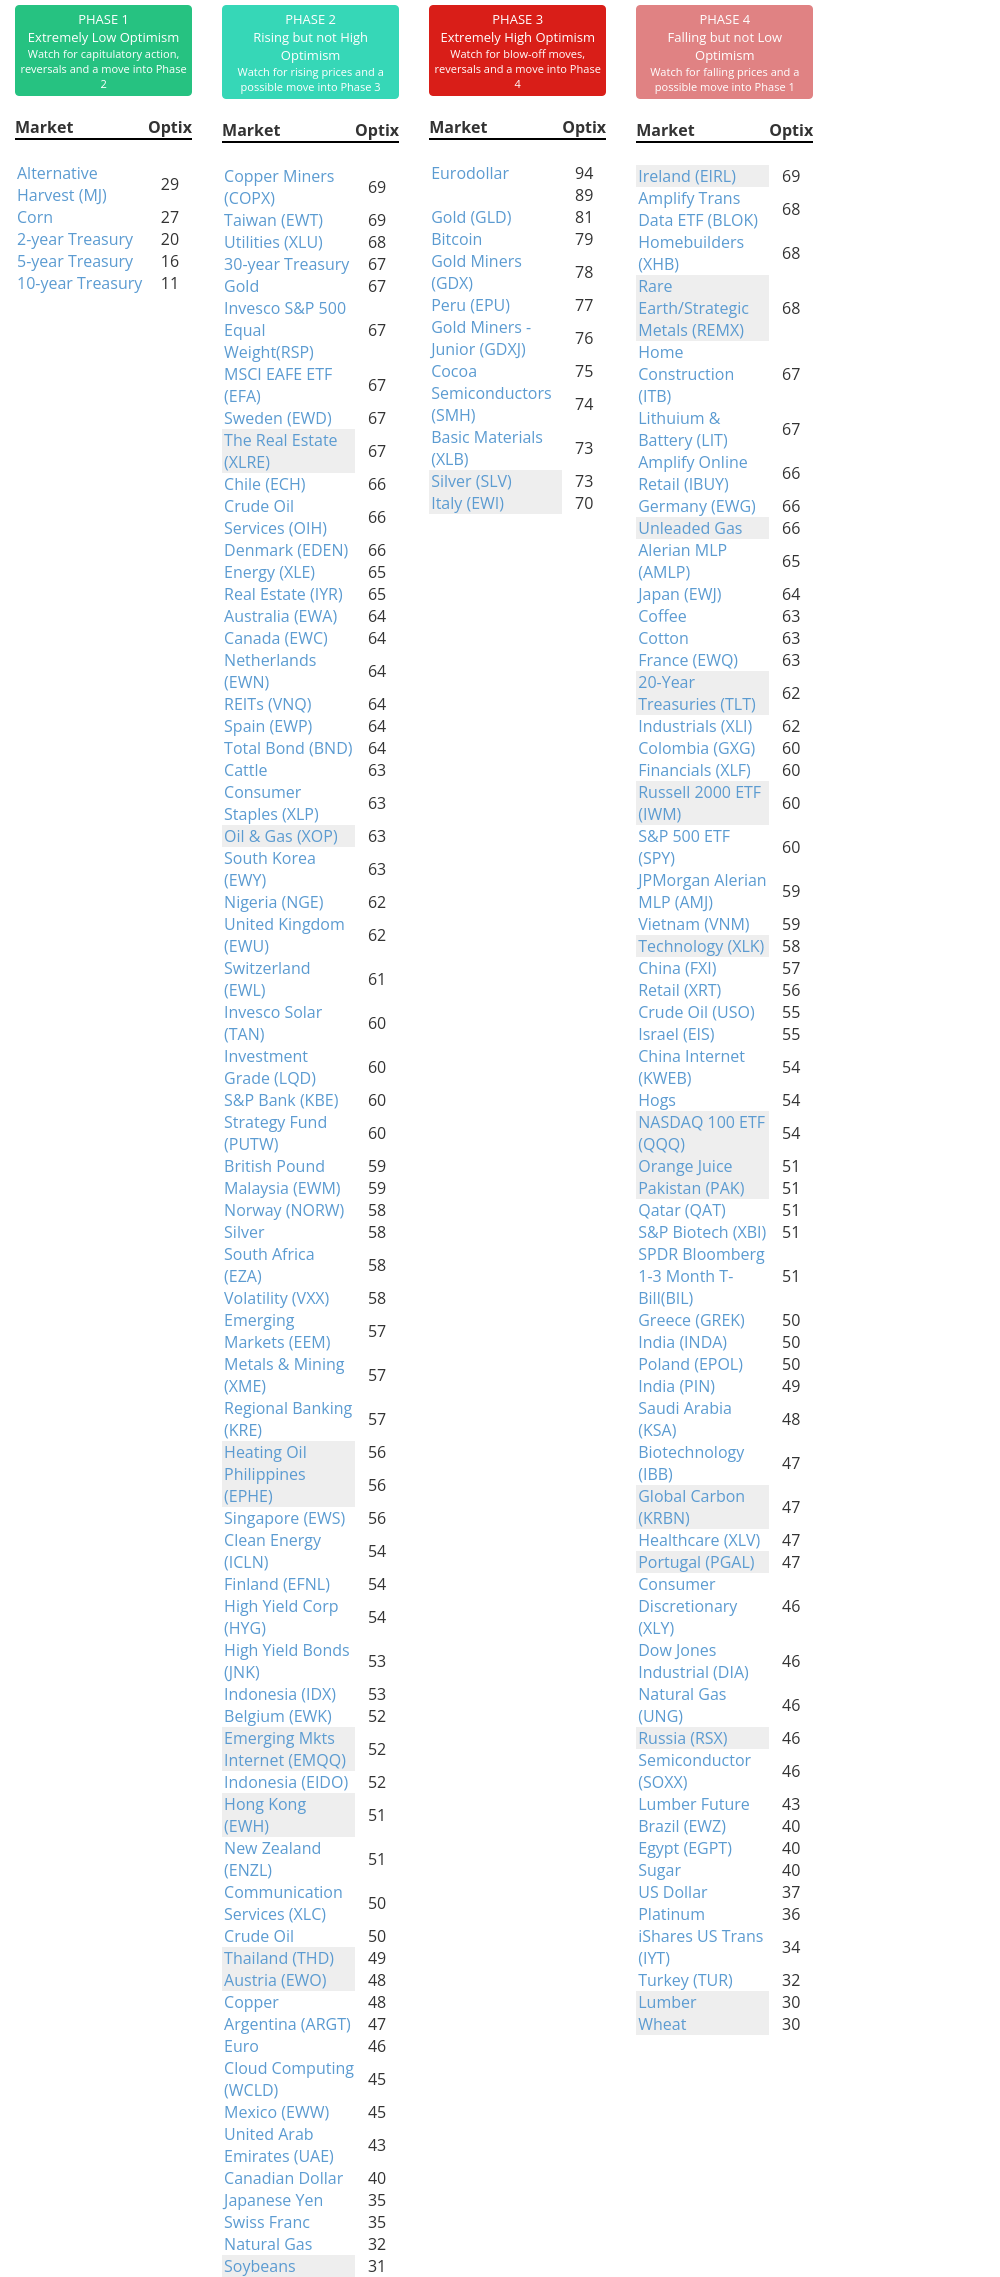
Phase Table
Ranks
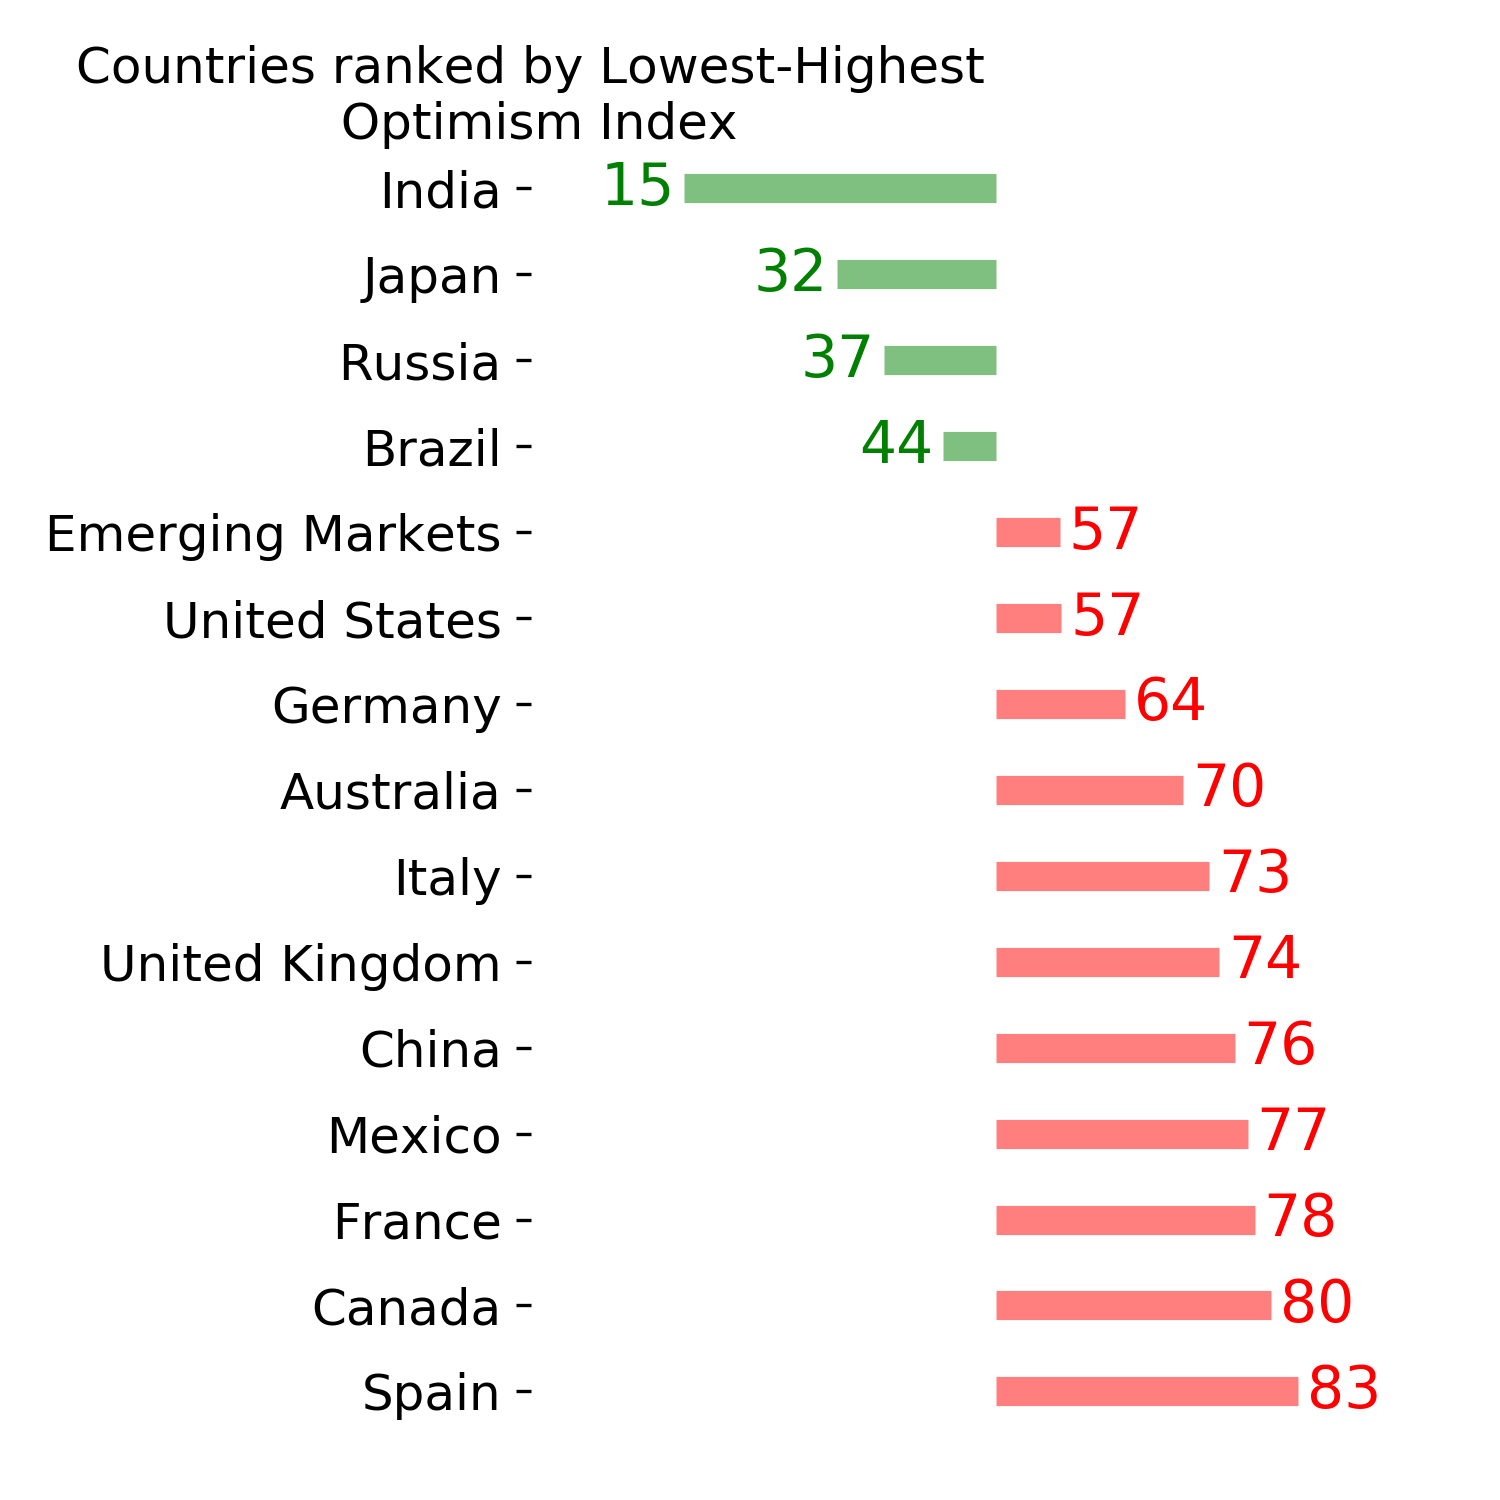
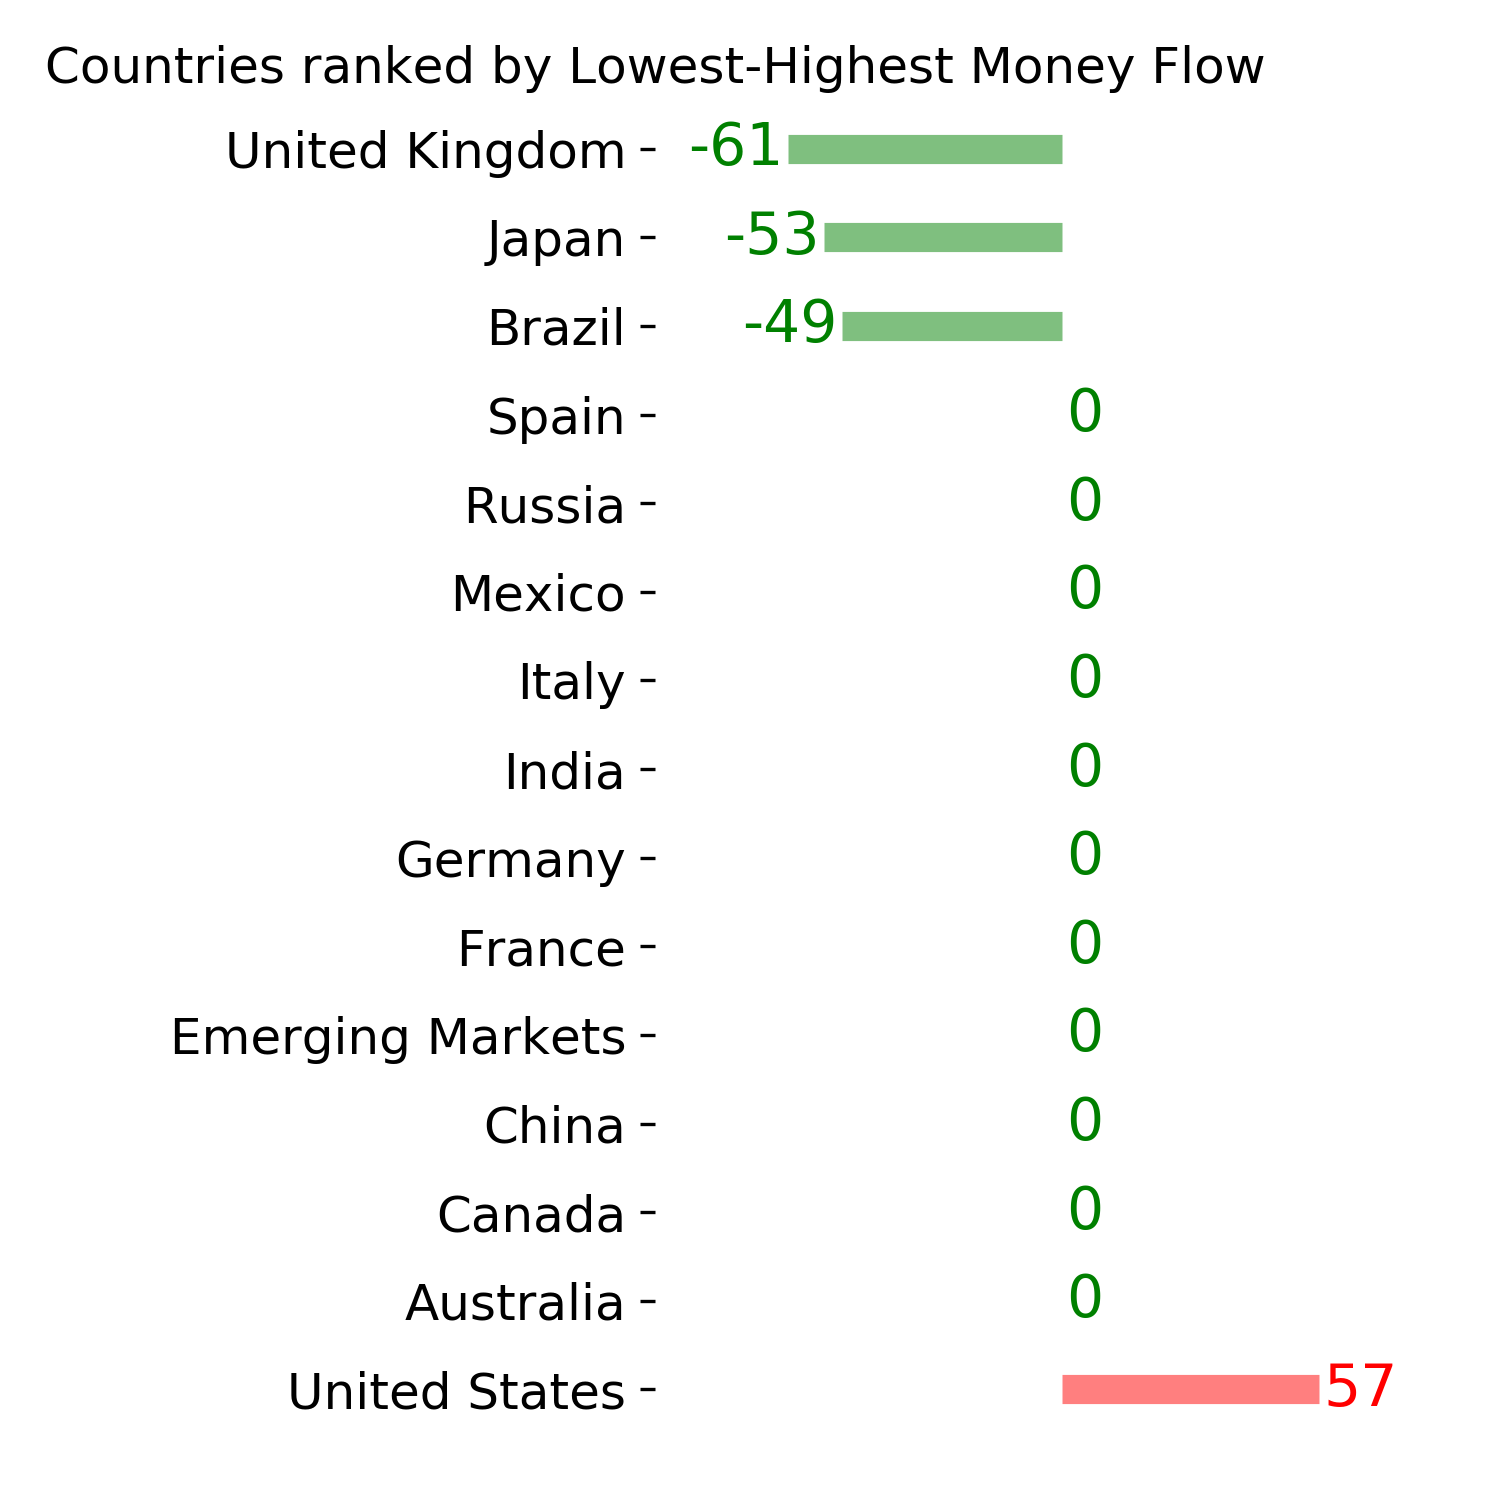
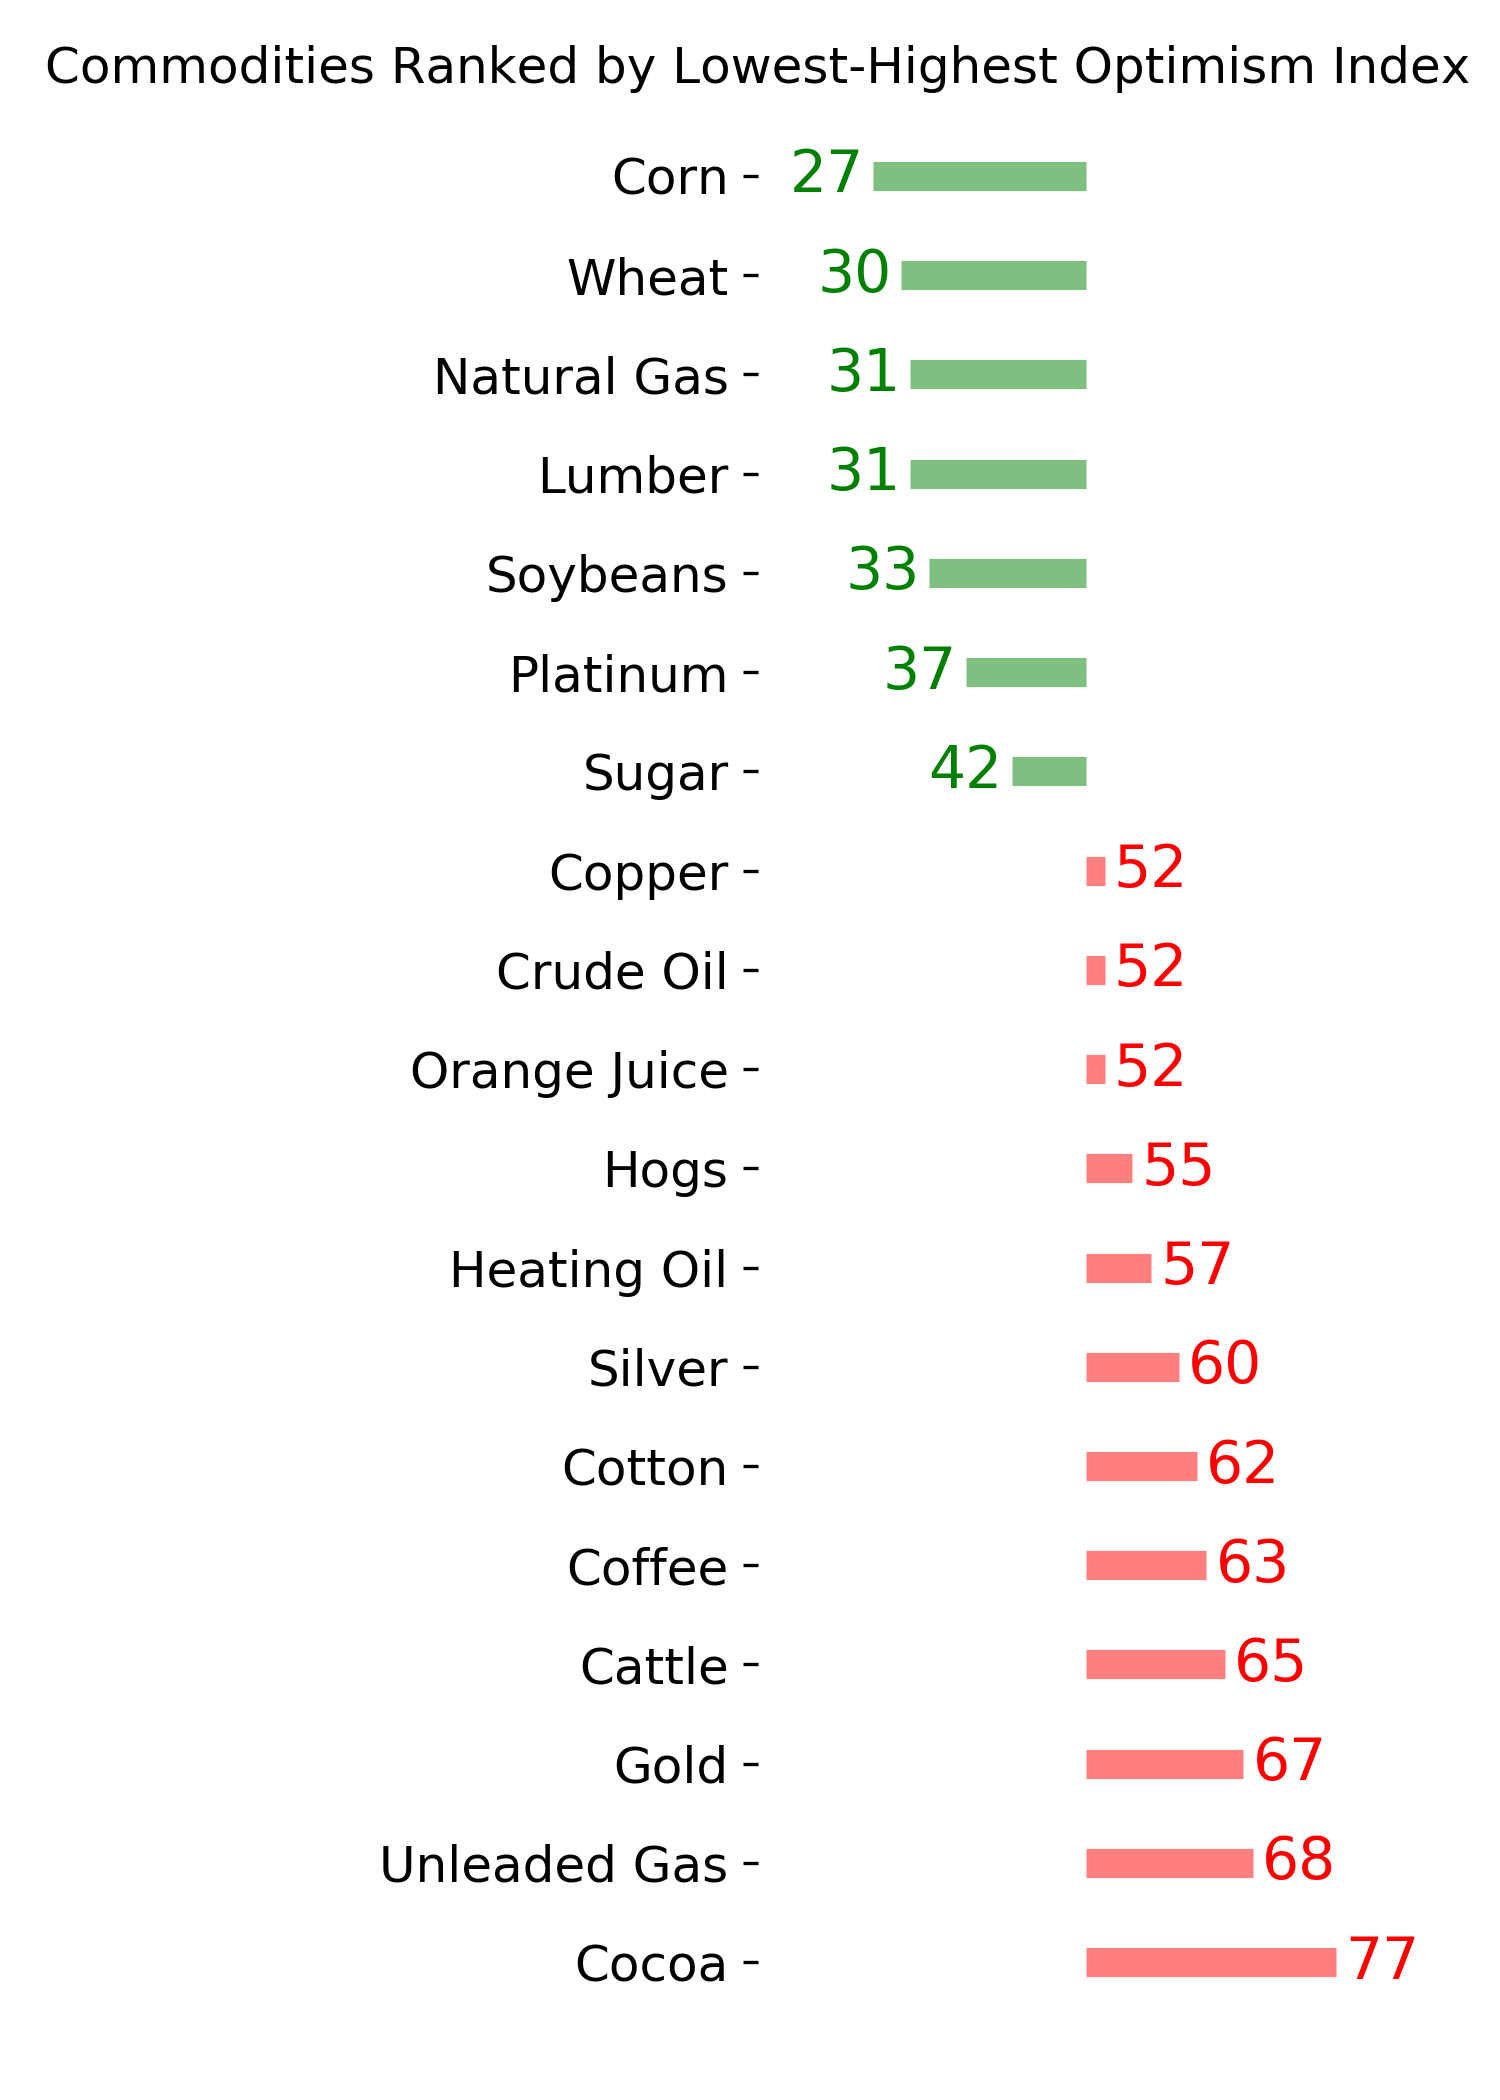
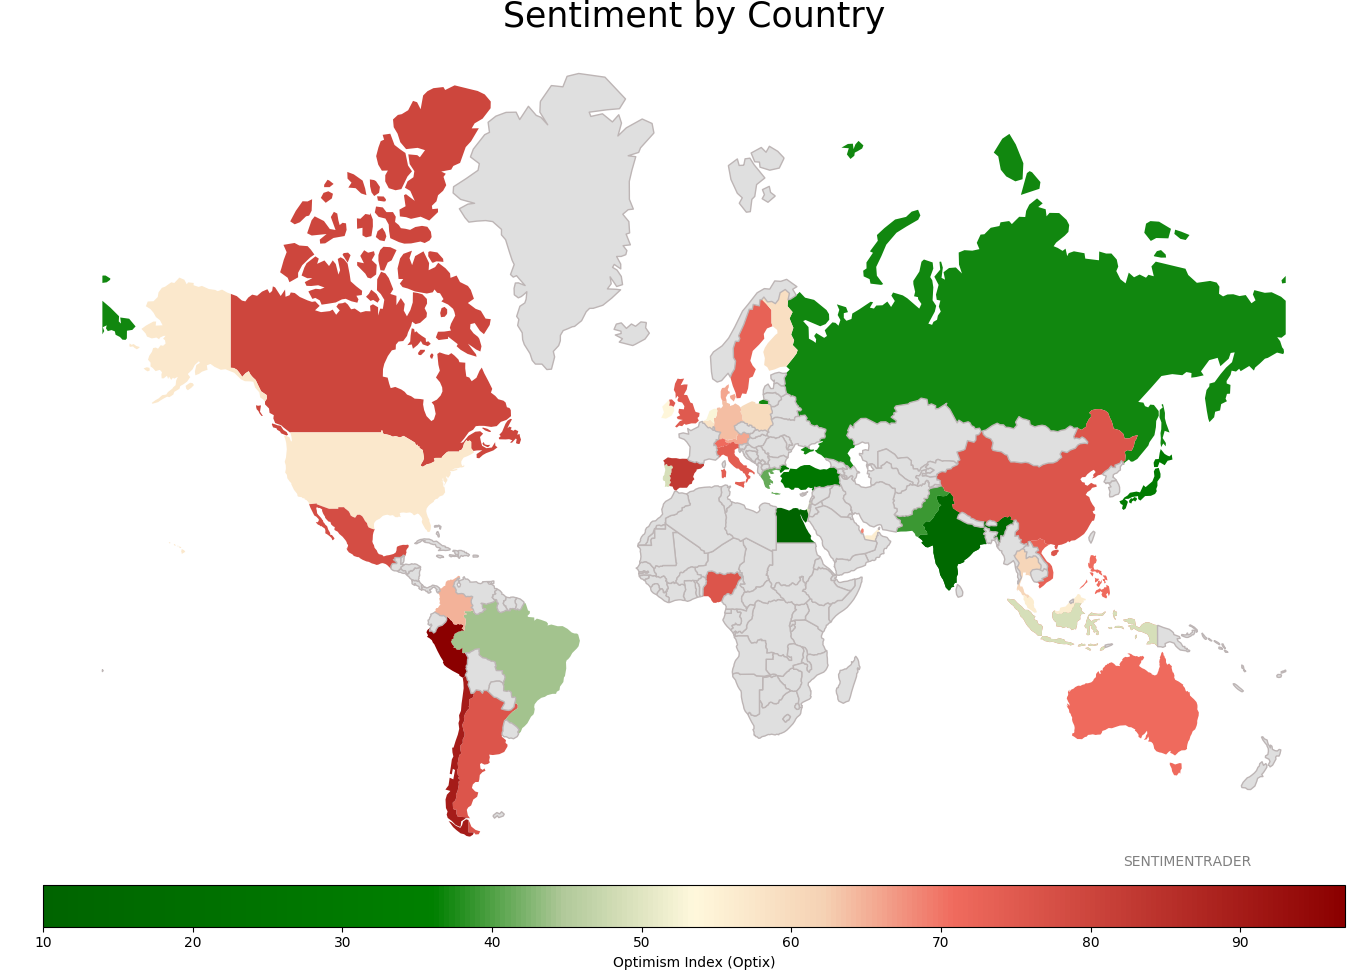
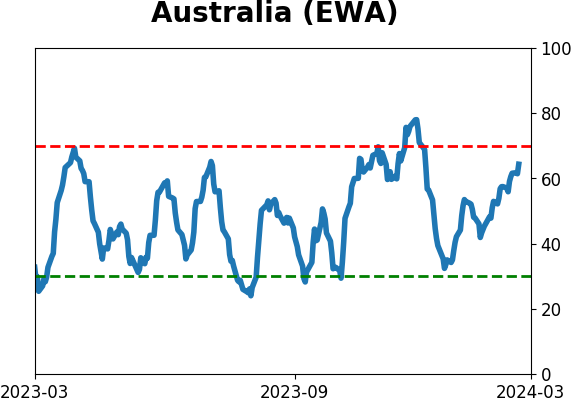
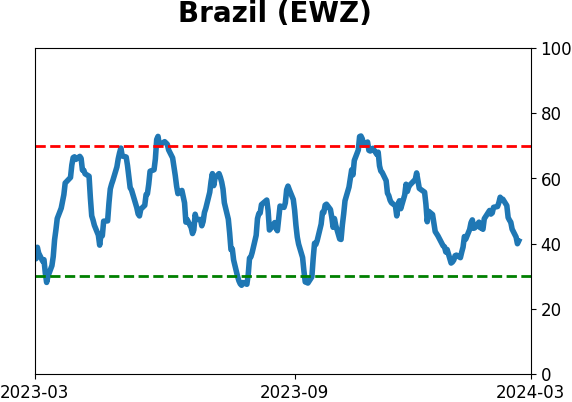
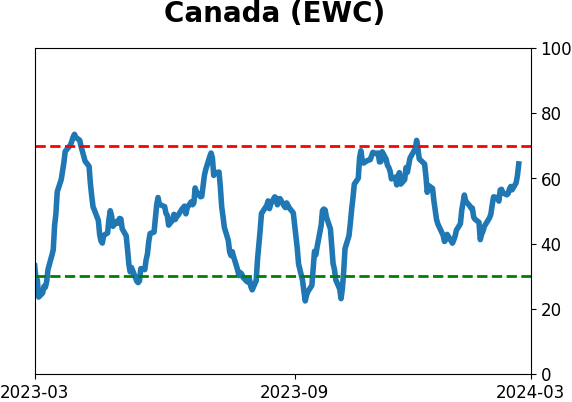
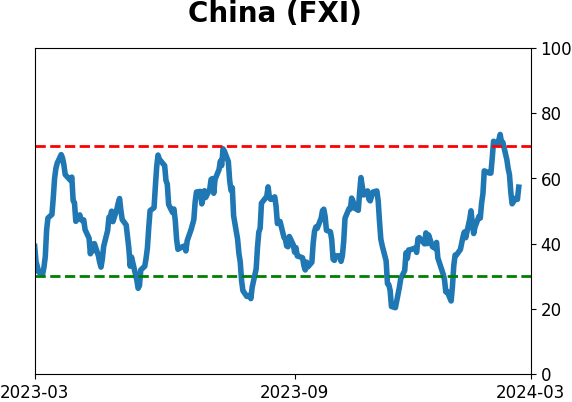
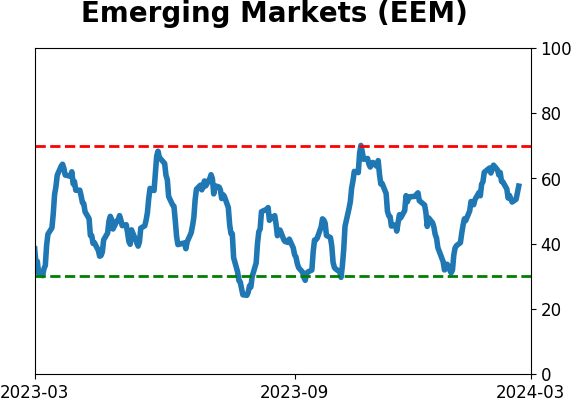
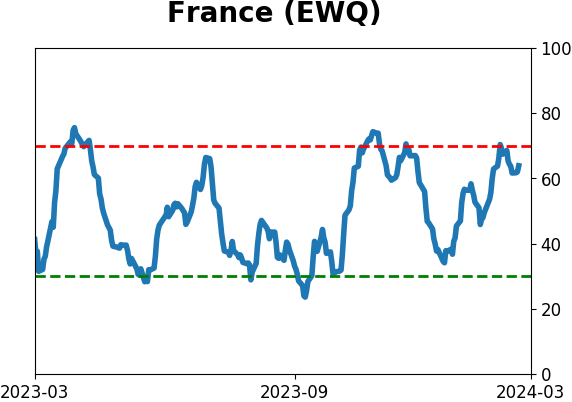
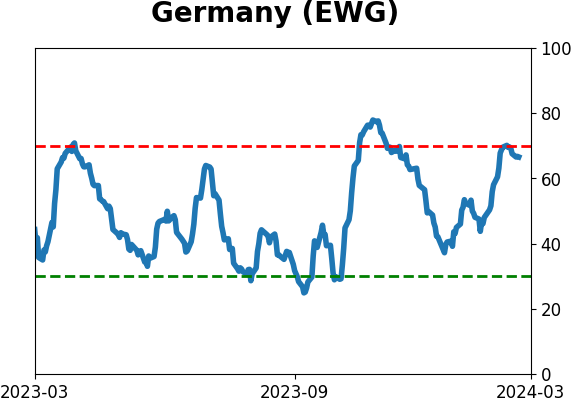
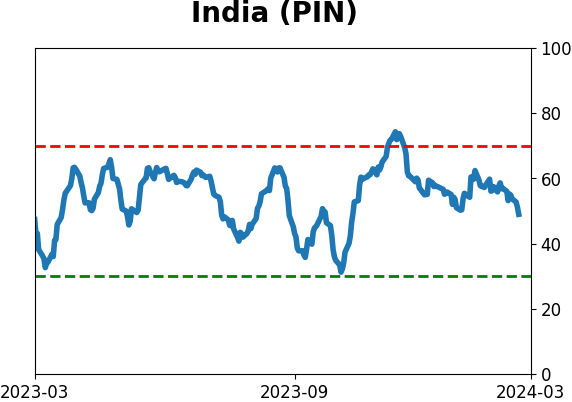
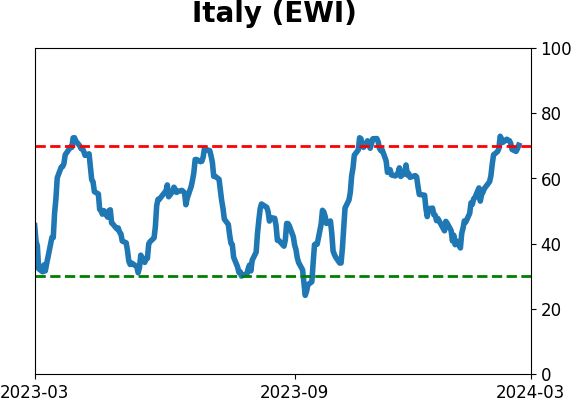
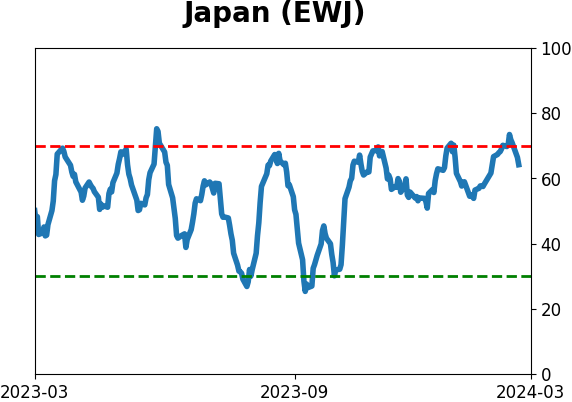
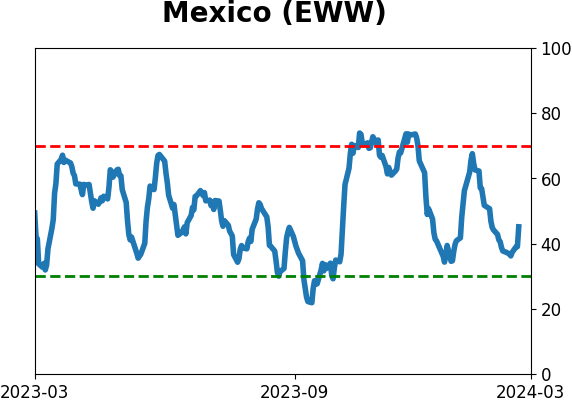
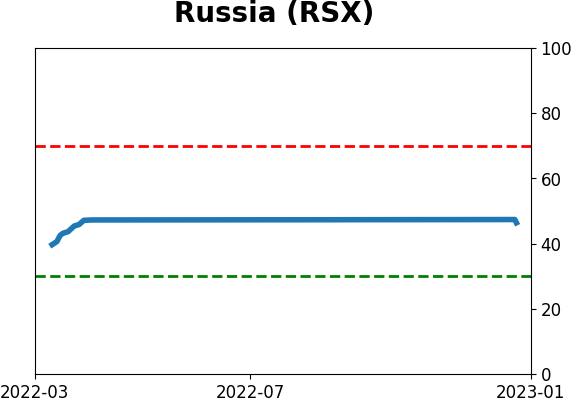
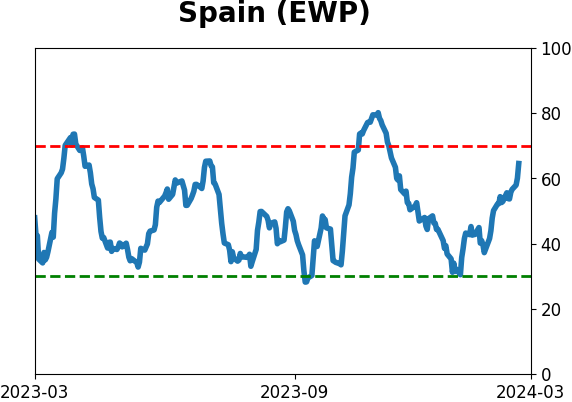
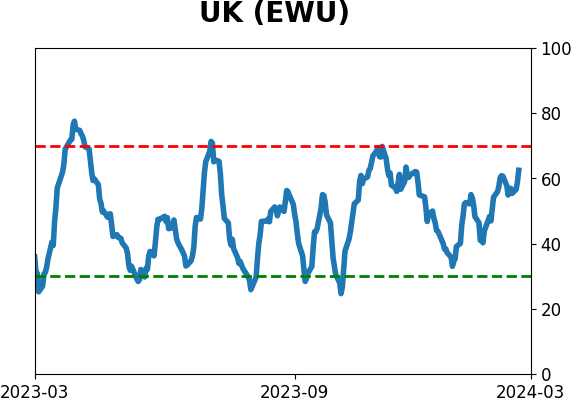
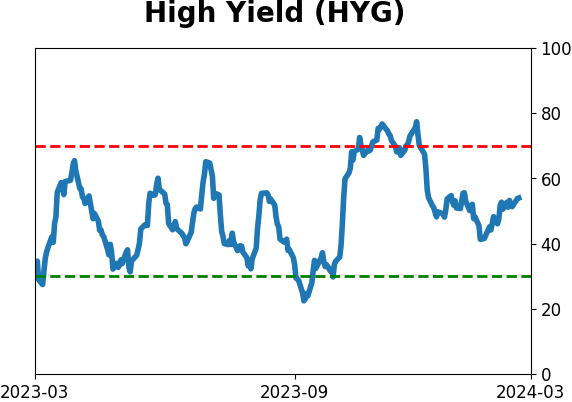
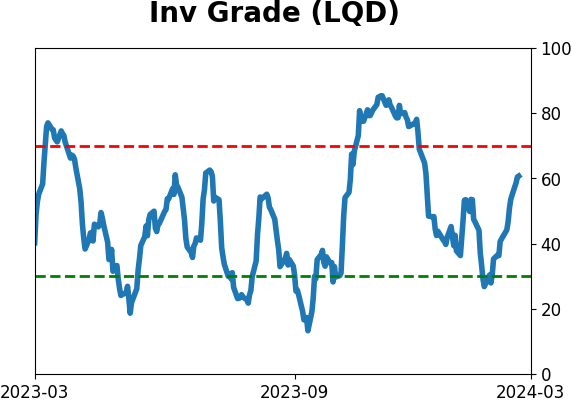
Sentiment Around The World
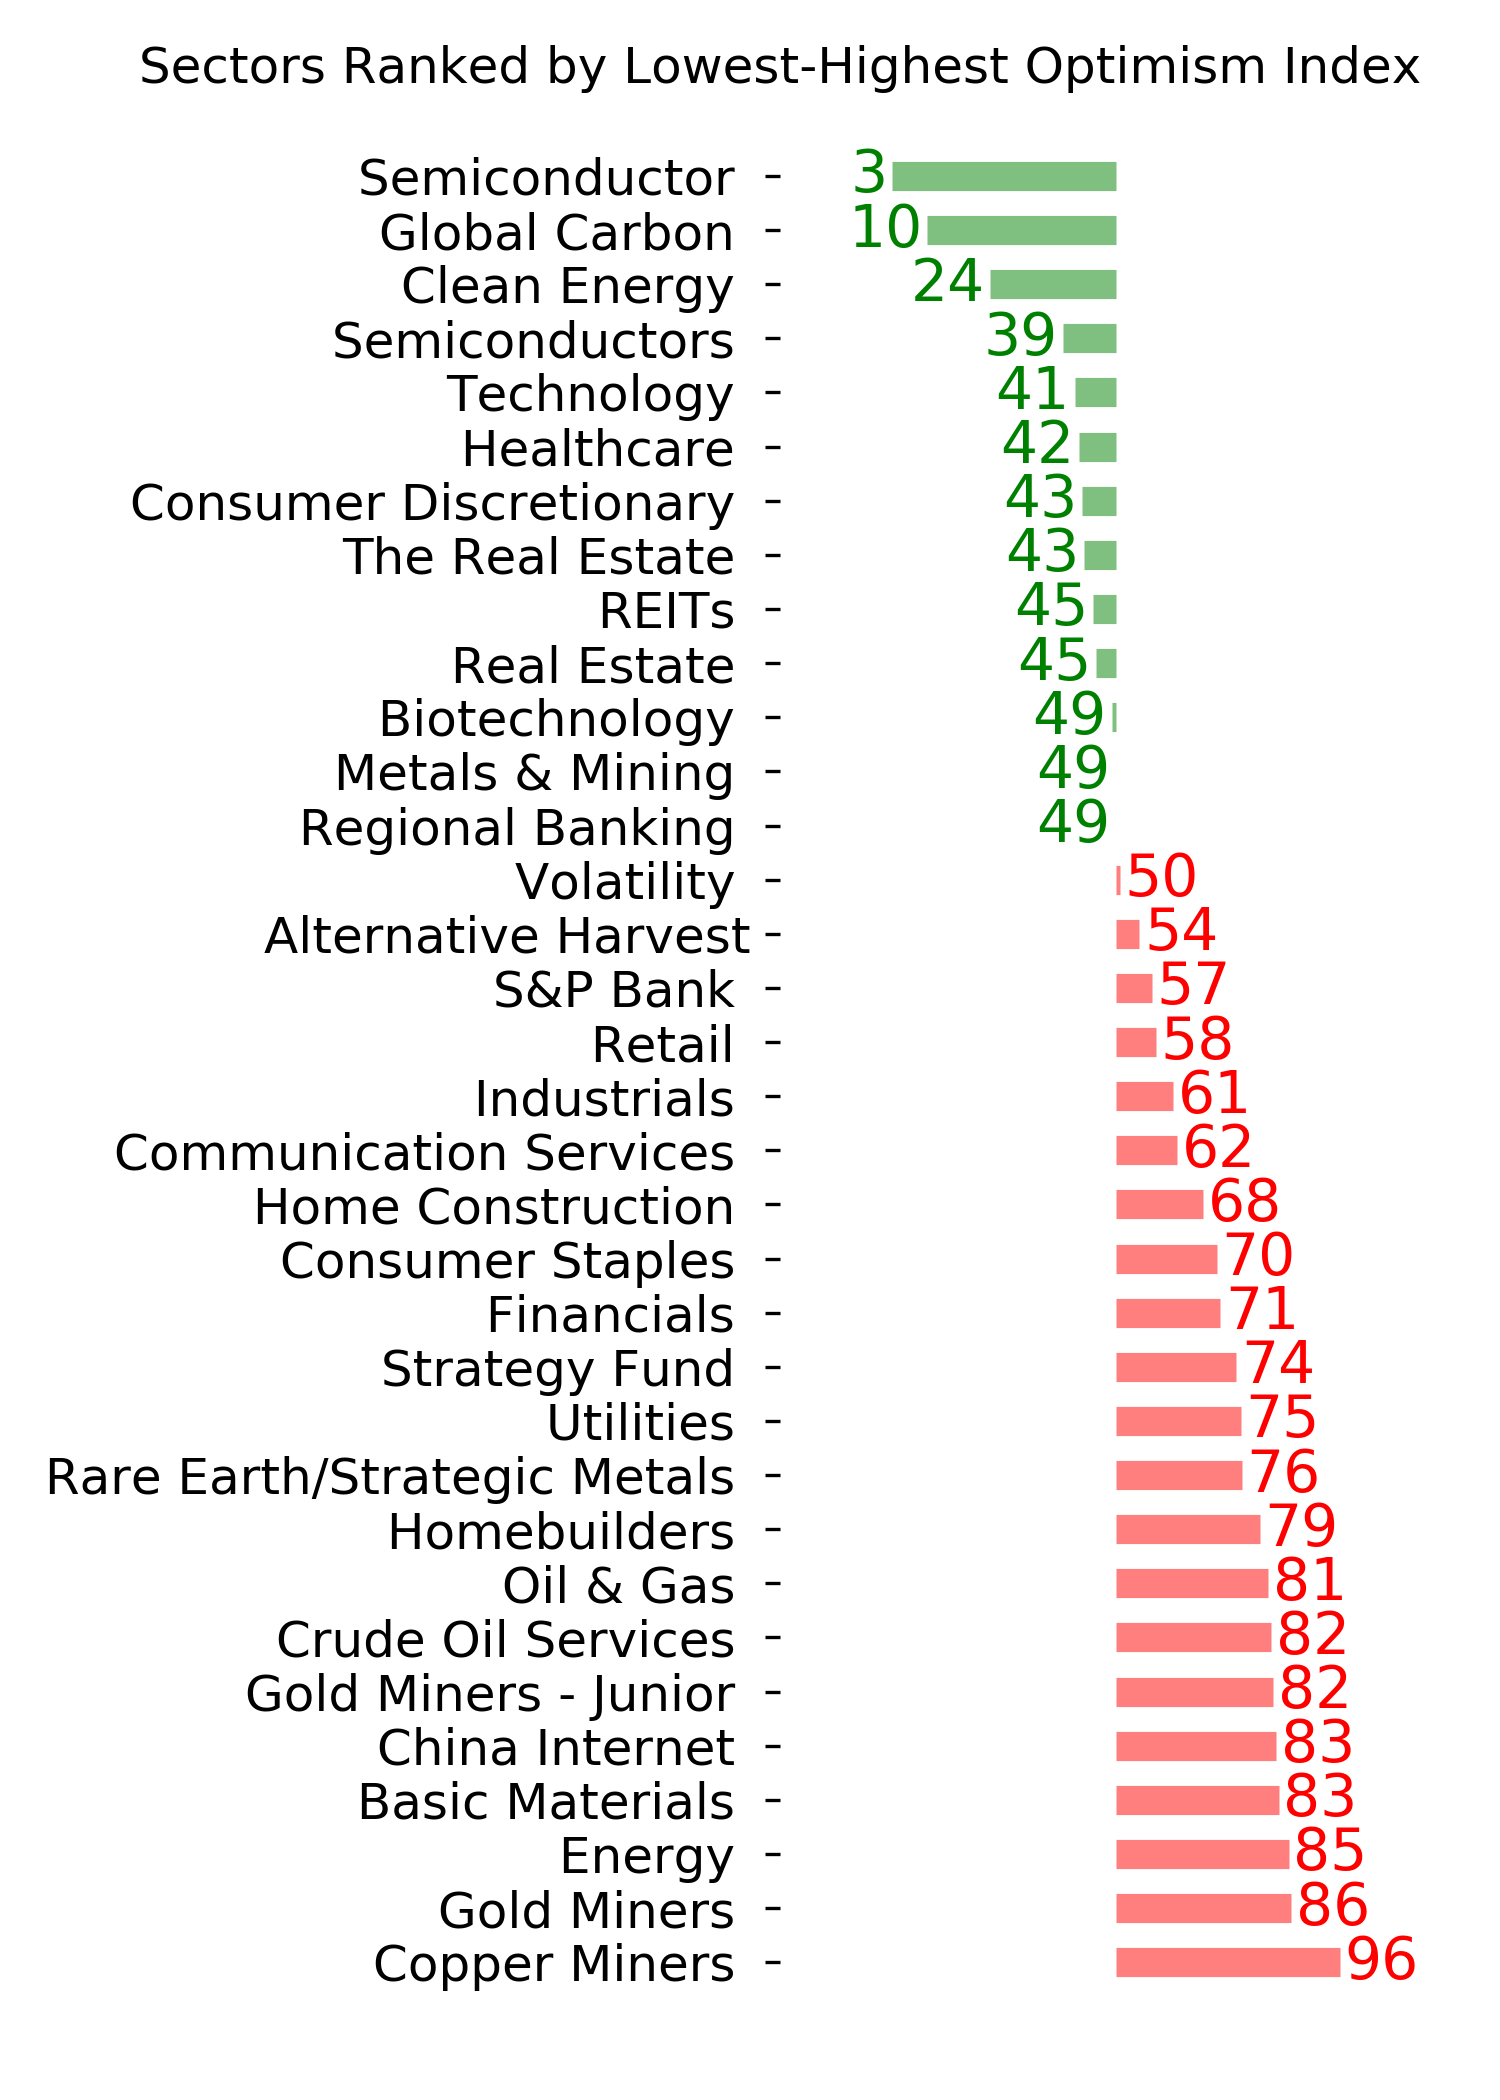
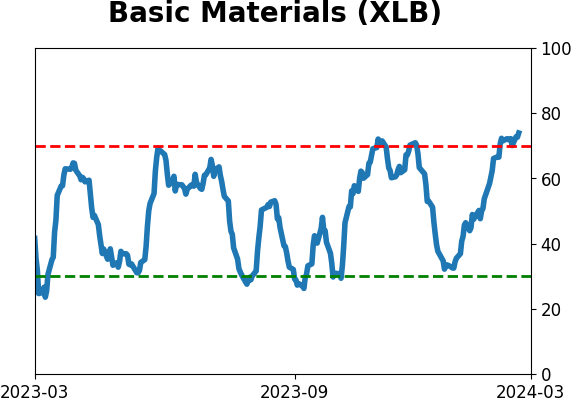
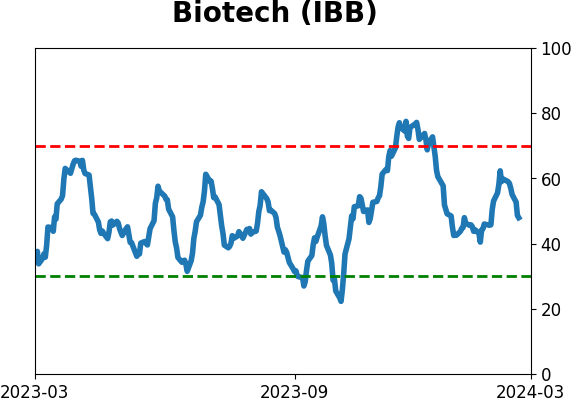
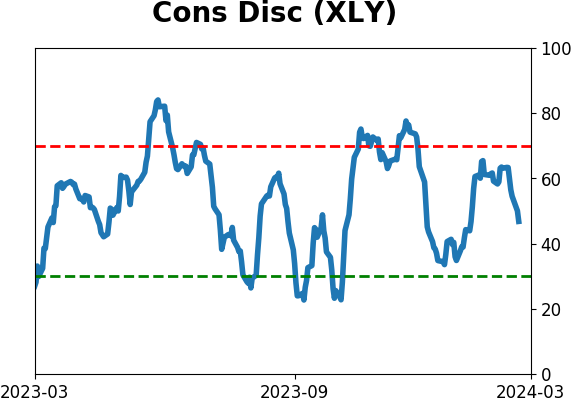
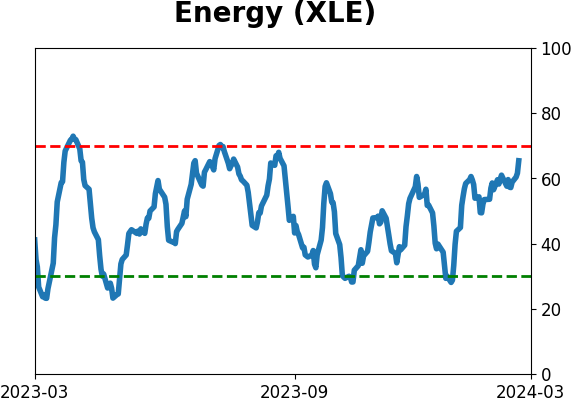
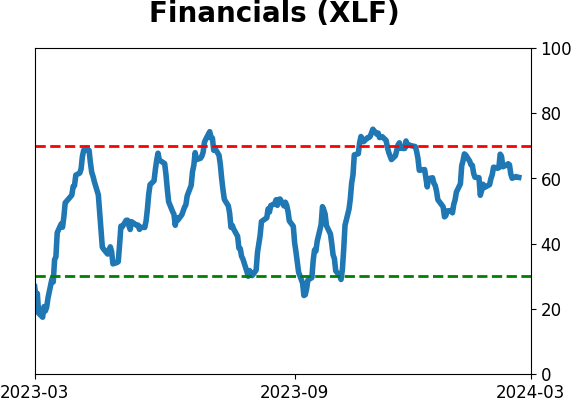
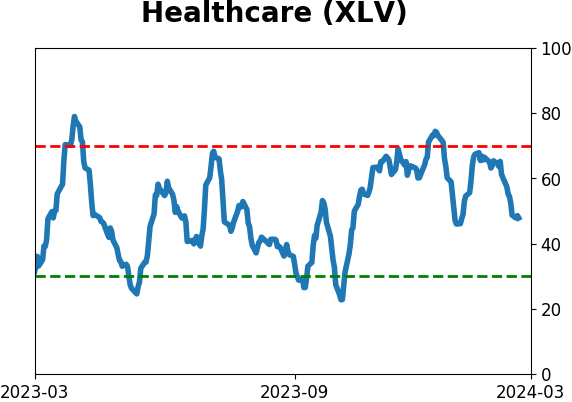
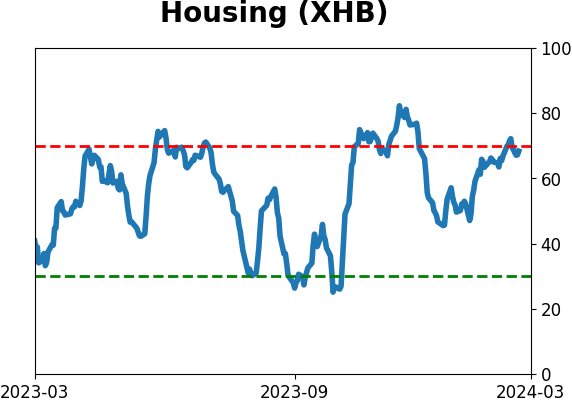
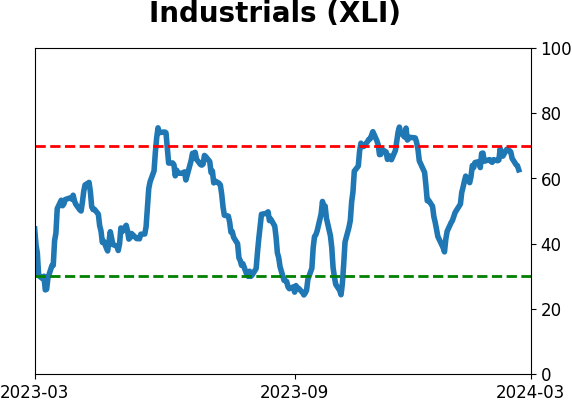
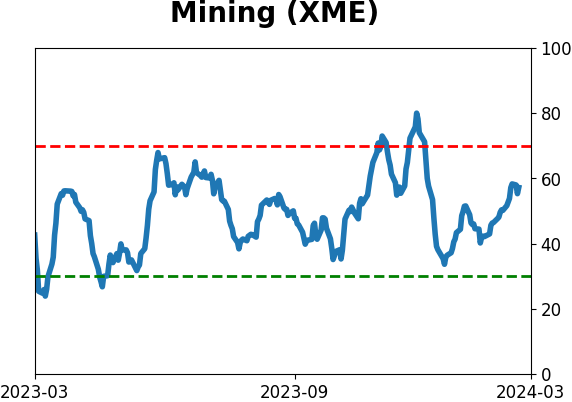
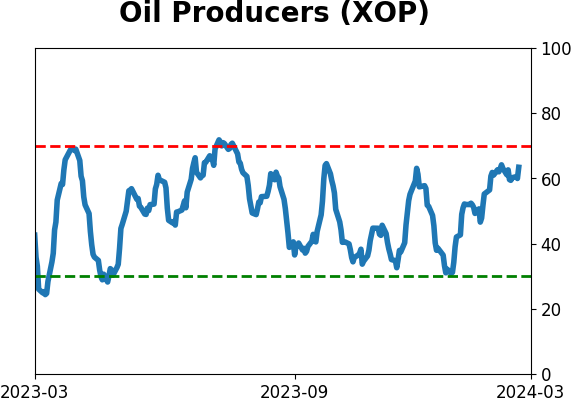
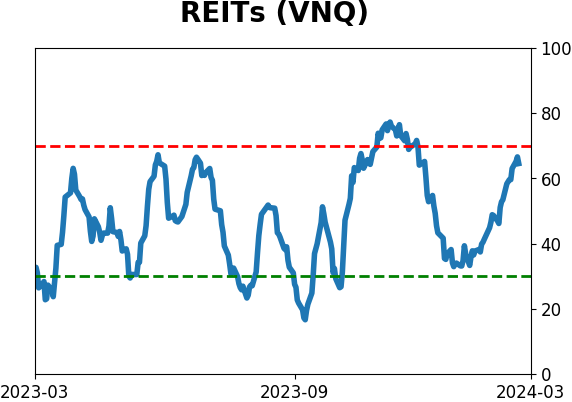
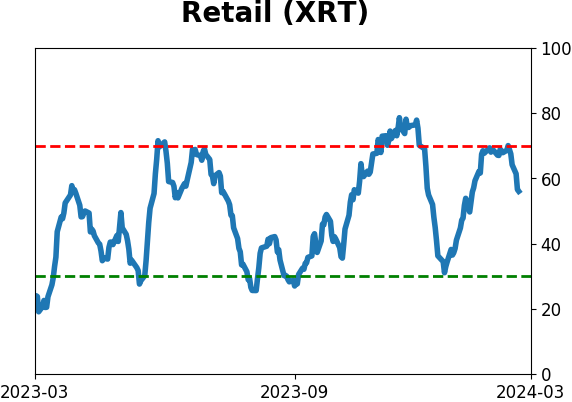
Optimism Index Thumbnails
|
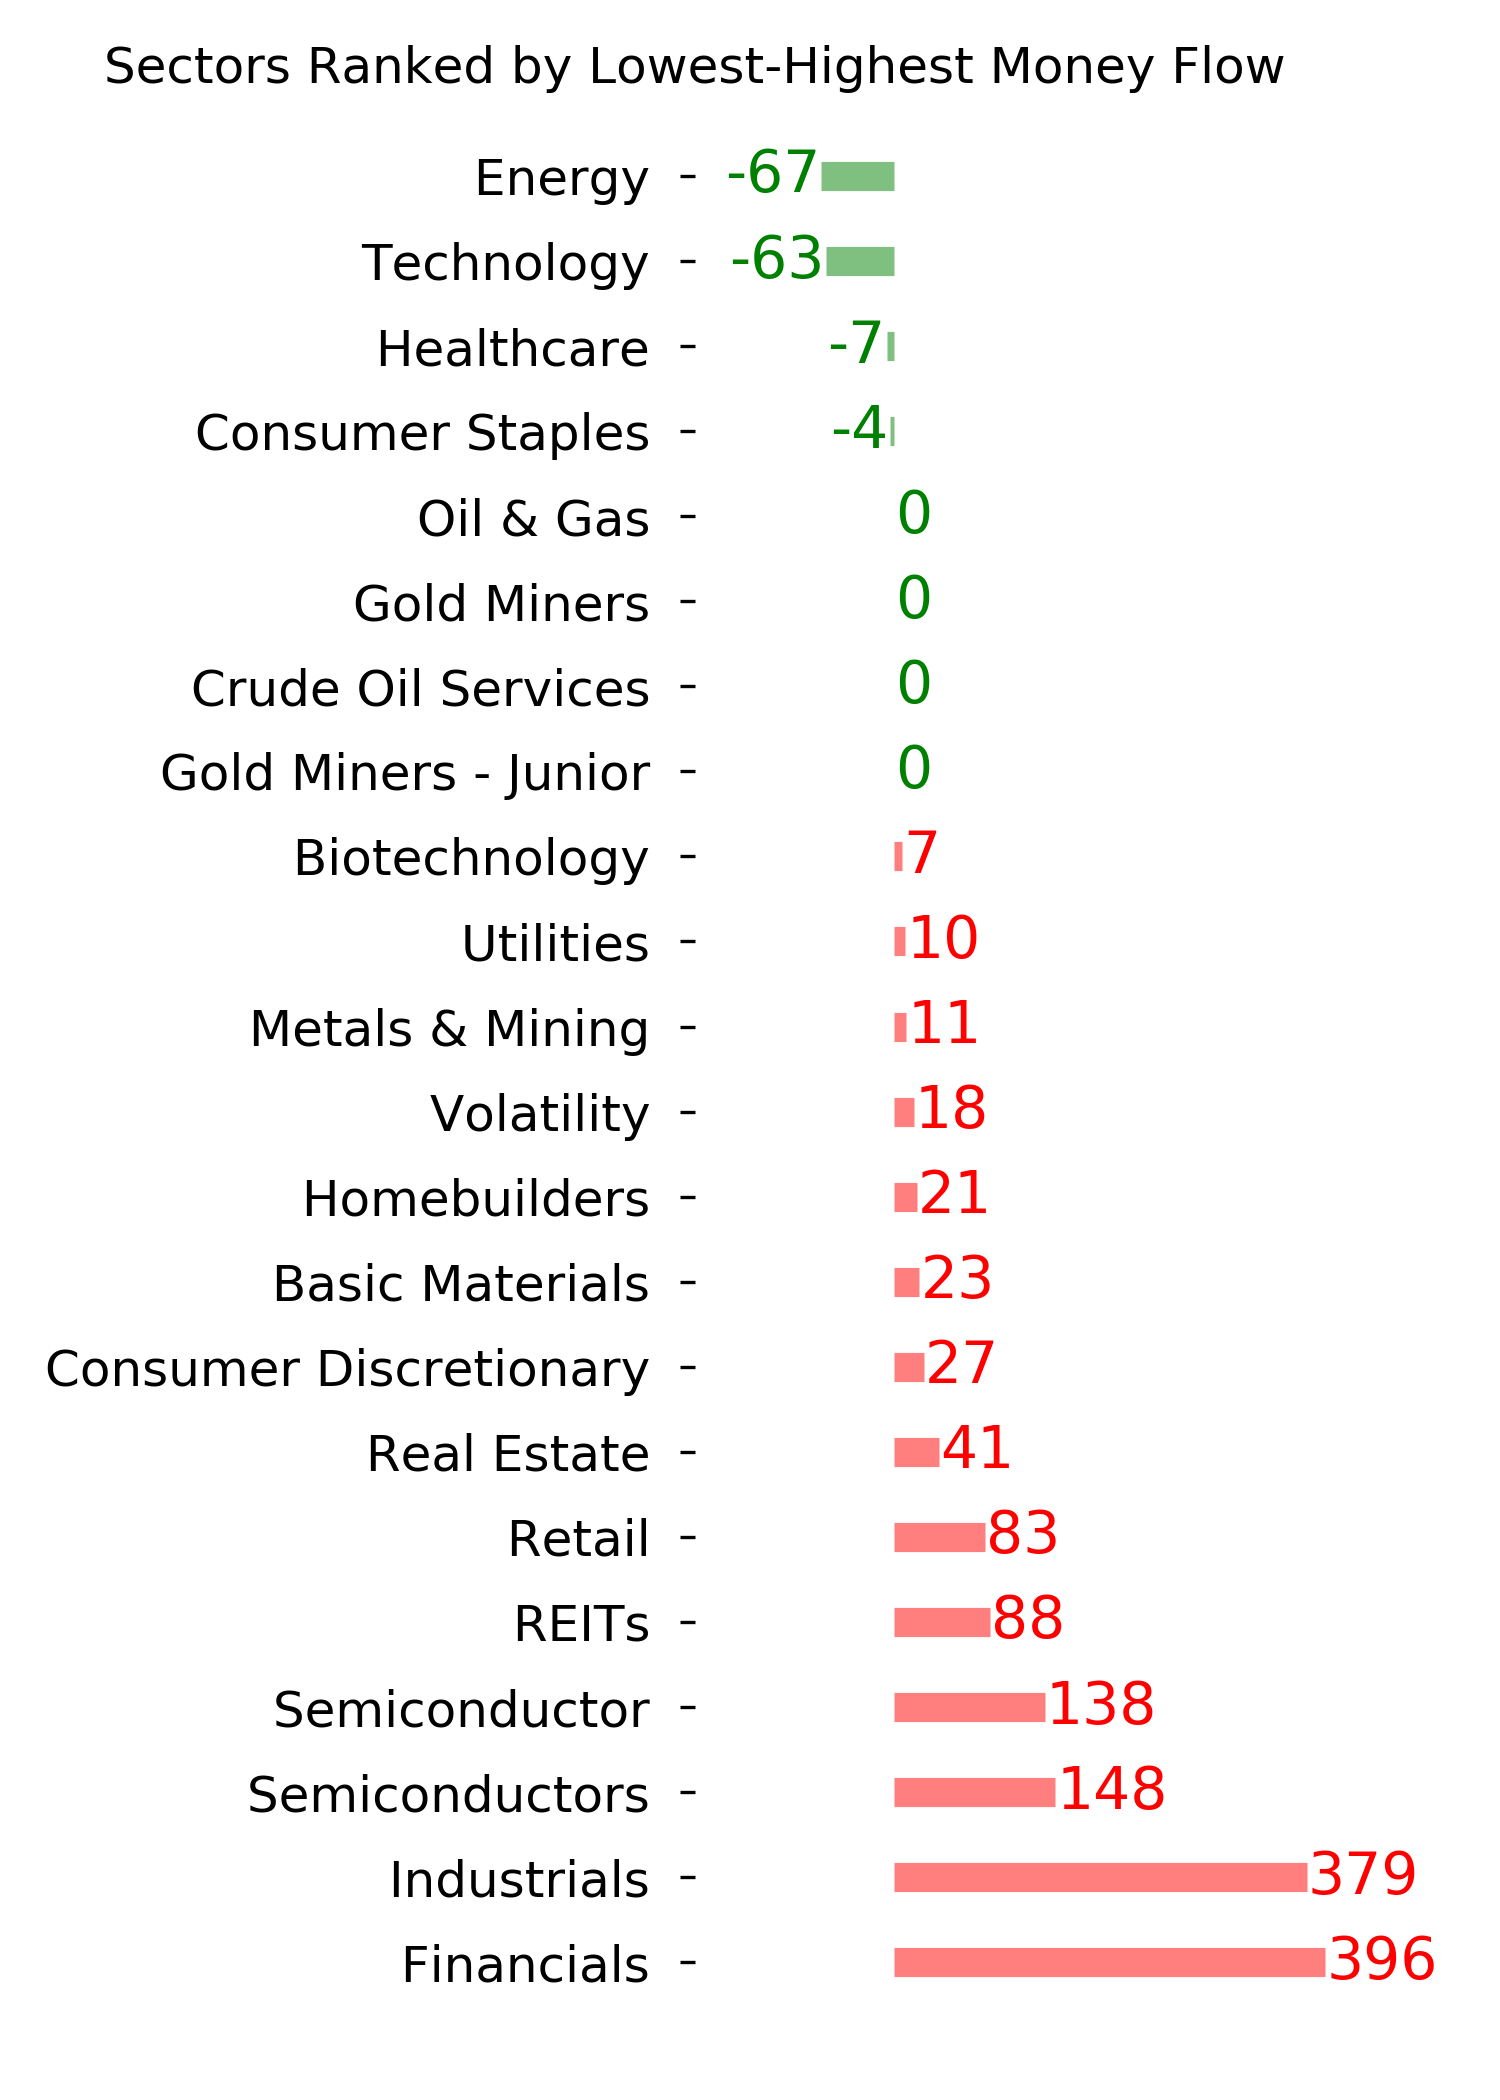
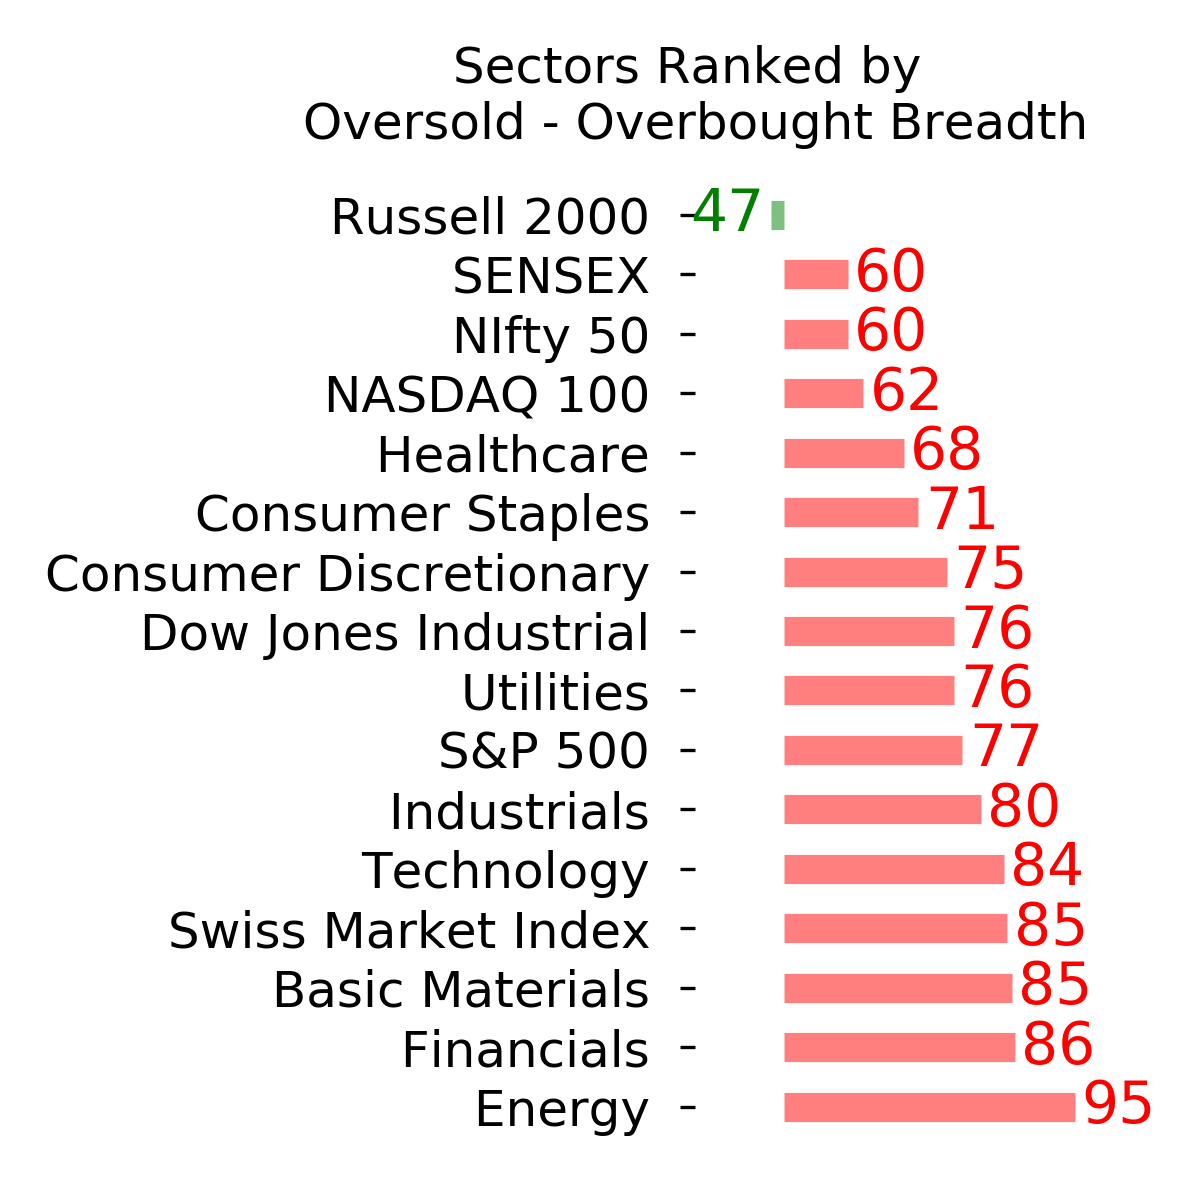
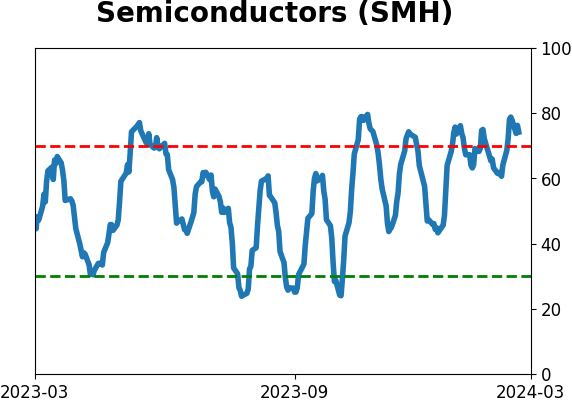
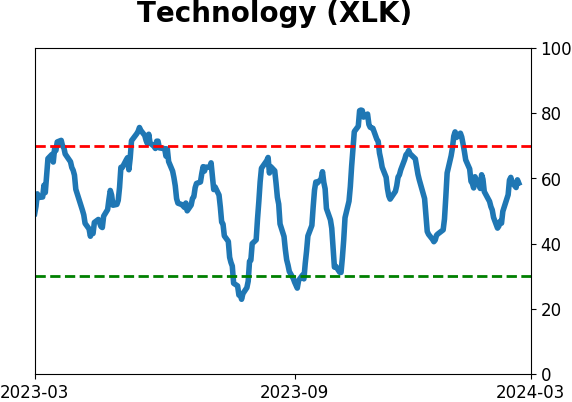
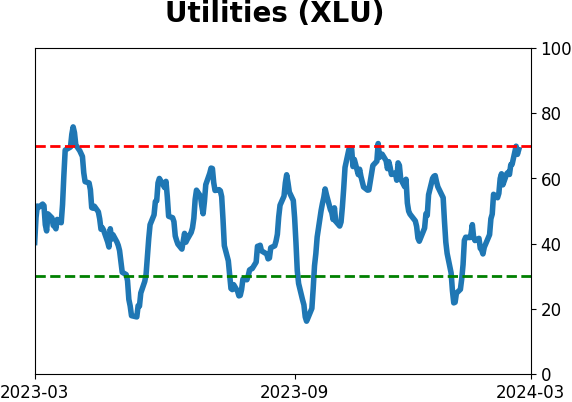
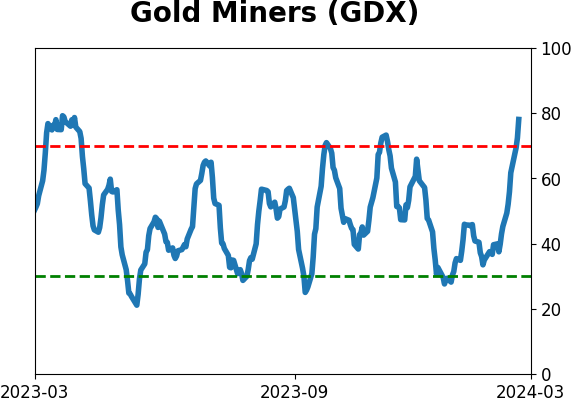
Sector ETF's - 10-Day Moving Average
|
|
|
Country ETF's - 10-Day Moving Average
|
|
|
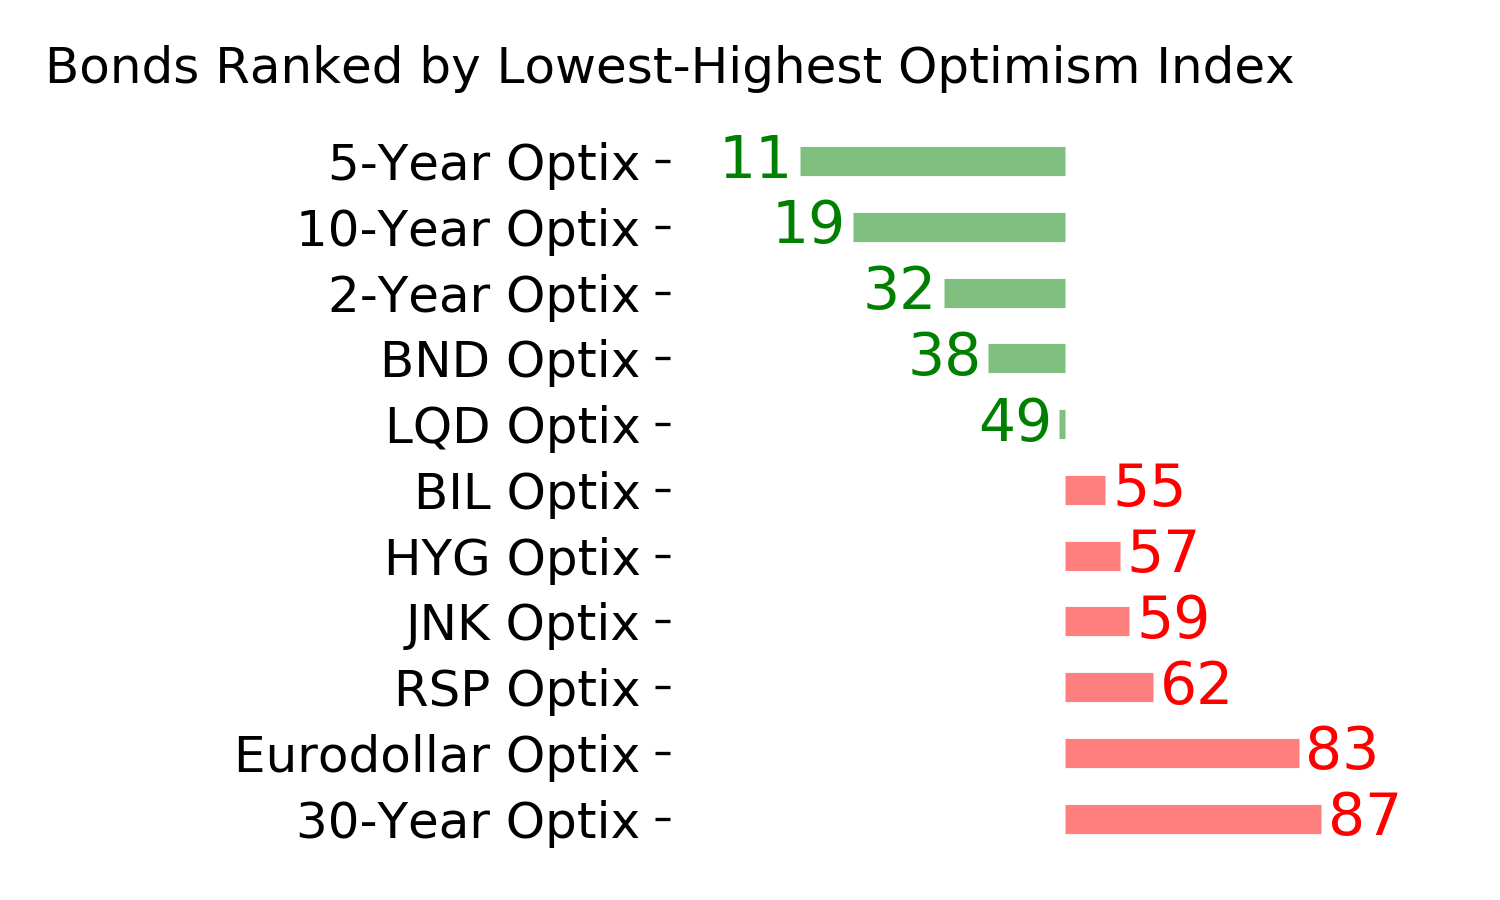
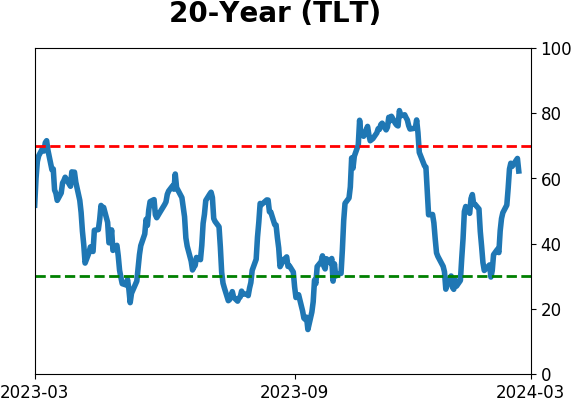
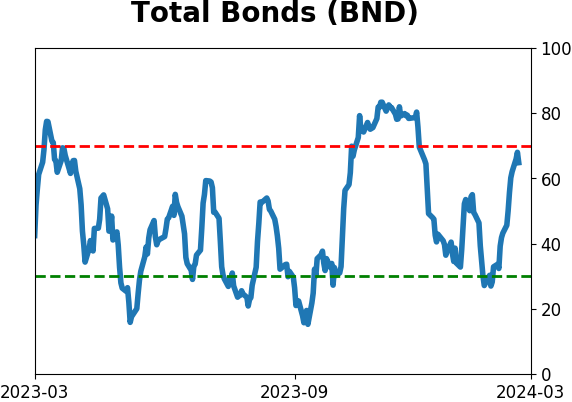
Bond ETF's - 10-Day Moving Average
|
|
|
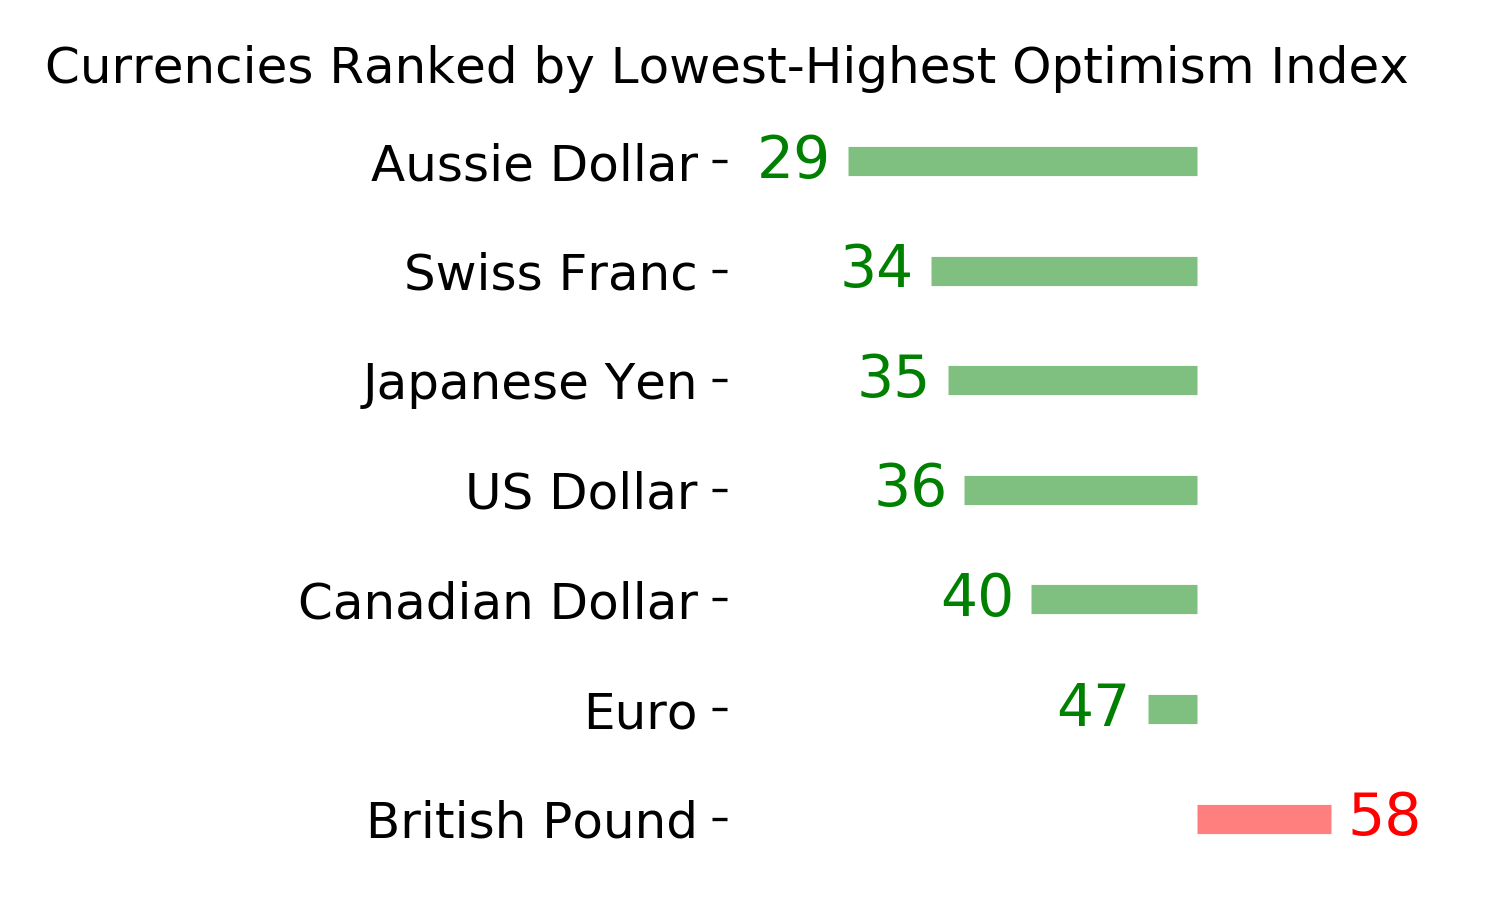
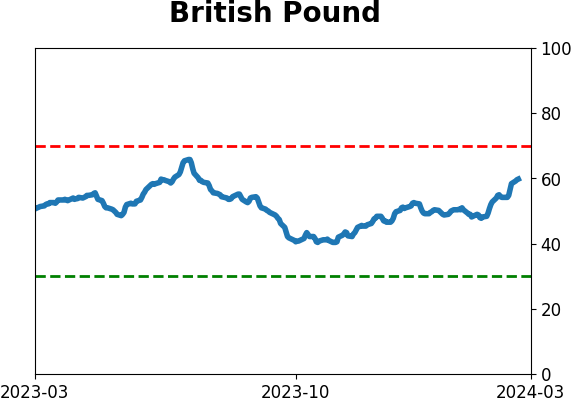
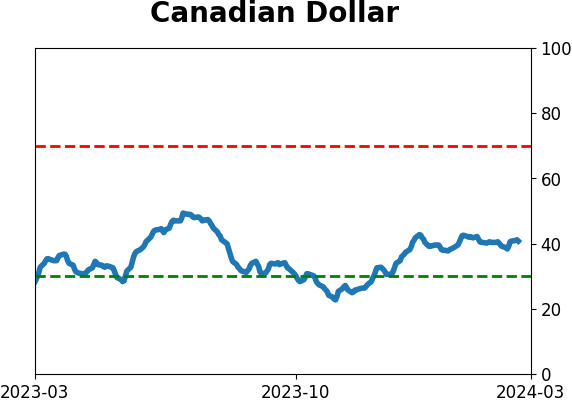
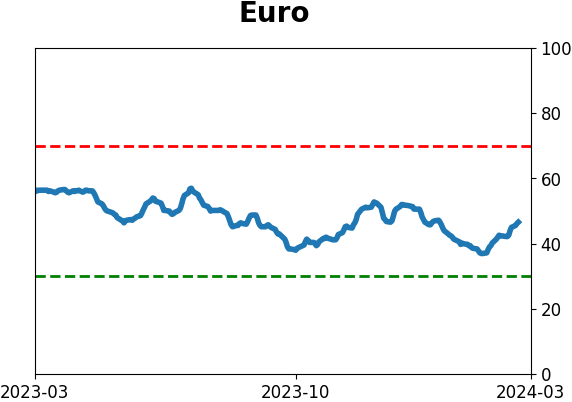
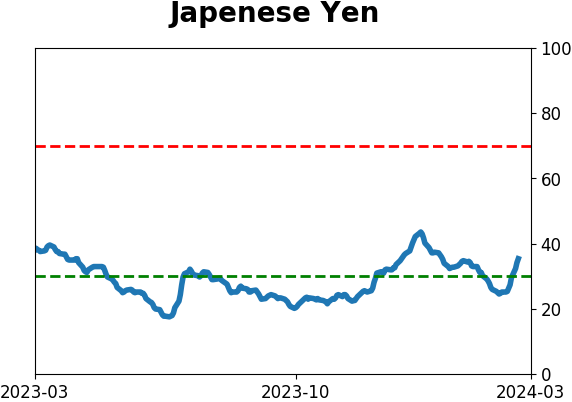
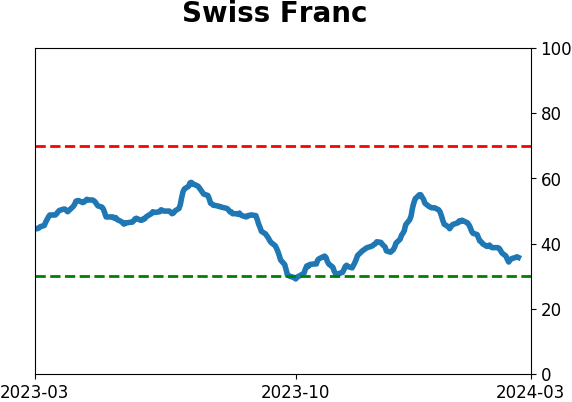
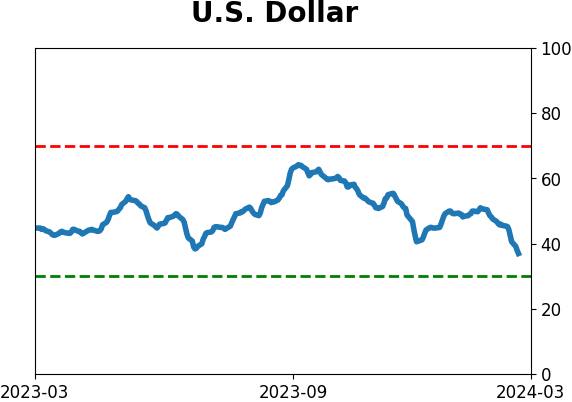
Currency ETF's - 5-Day Moving Average
|
|
|
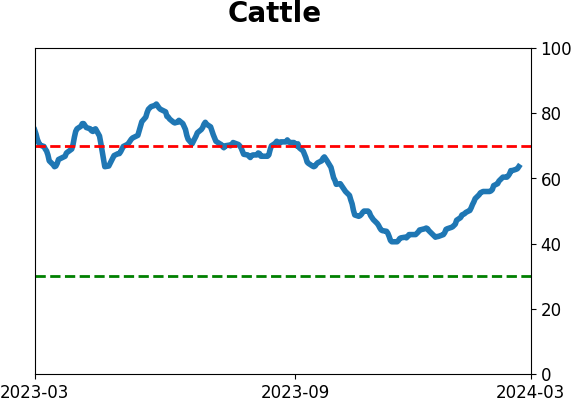
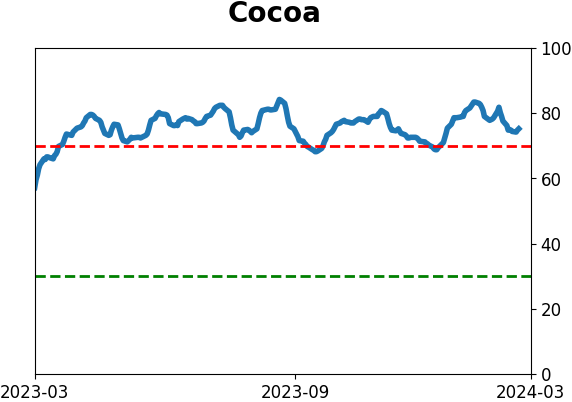
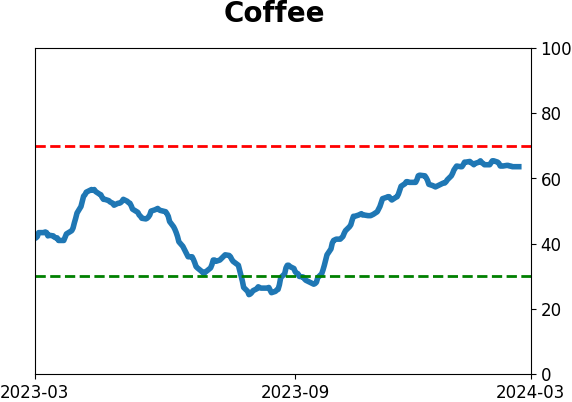
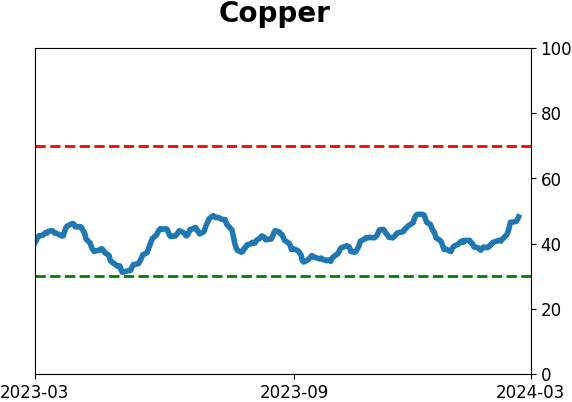
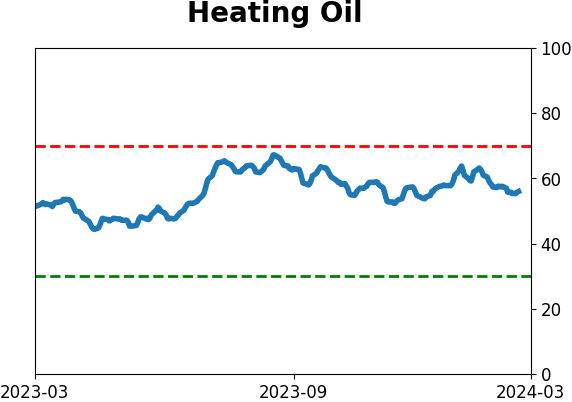
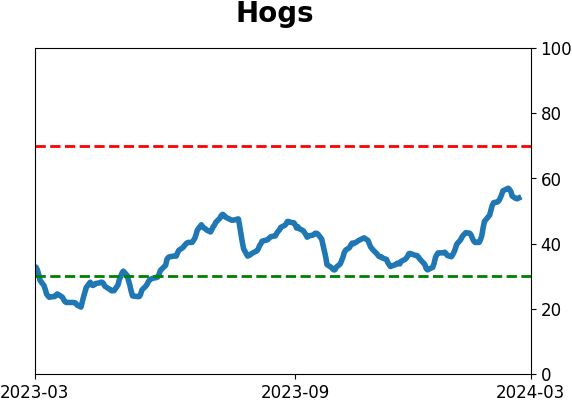
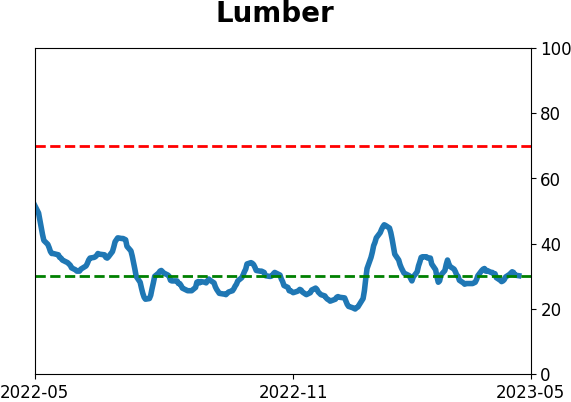
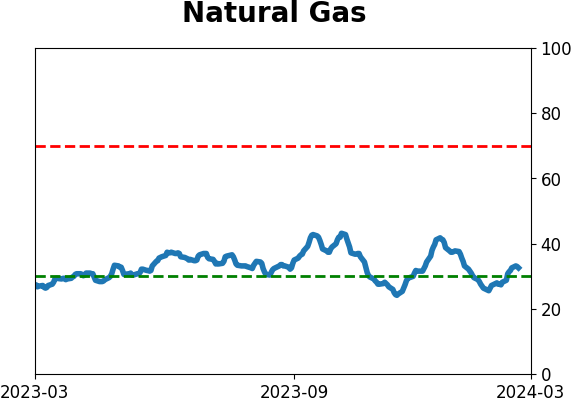
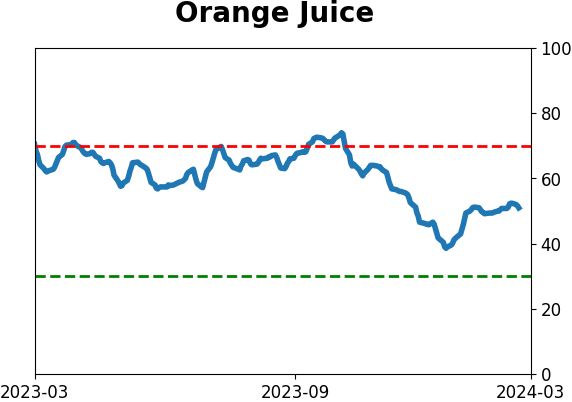
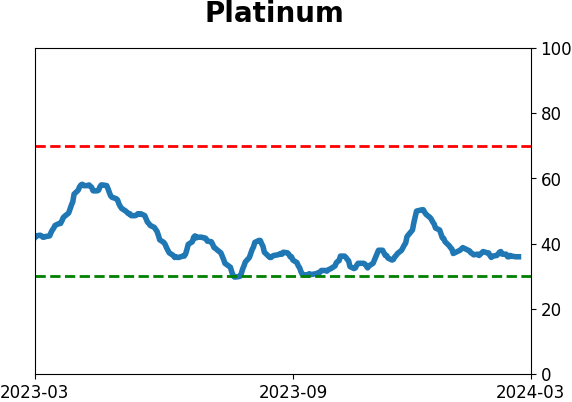
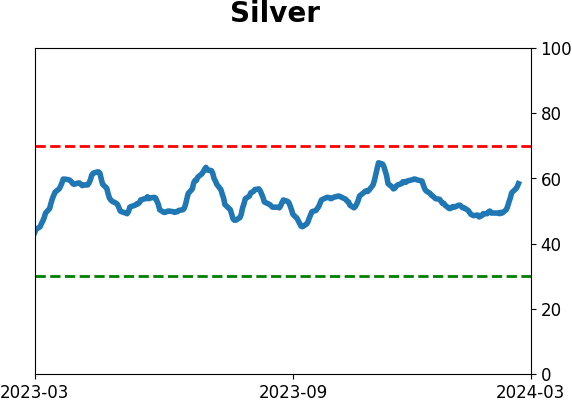
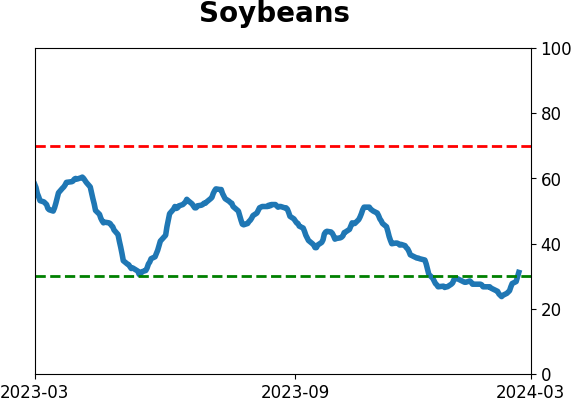
Commodity ETF's - 5-Day Moving Average
|
|