Headlines
|
|
A historic week of selling pressure as investors panic:
In the month following the four-month surge off the October low, investors have dumped stocks en masse several times. That does not negate the importance of the last four months. With three out of five days seeing more than 90% of S&P 500 stocks decline, this is a bout of selling pressure that saw gains six months later every time but once.
|
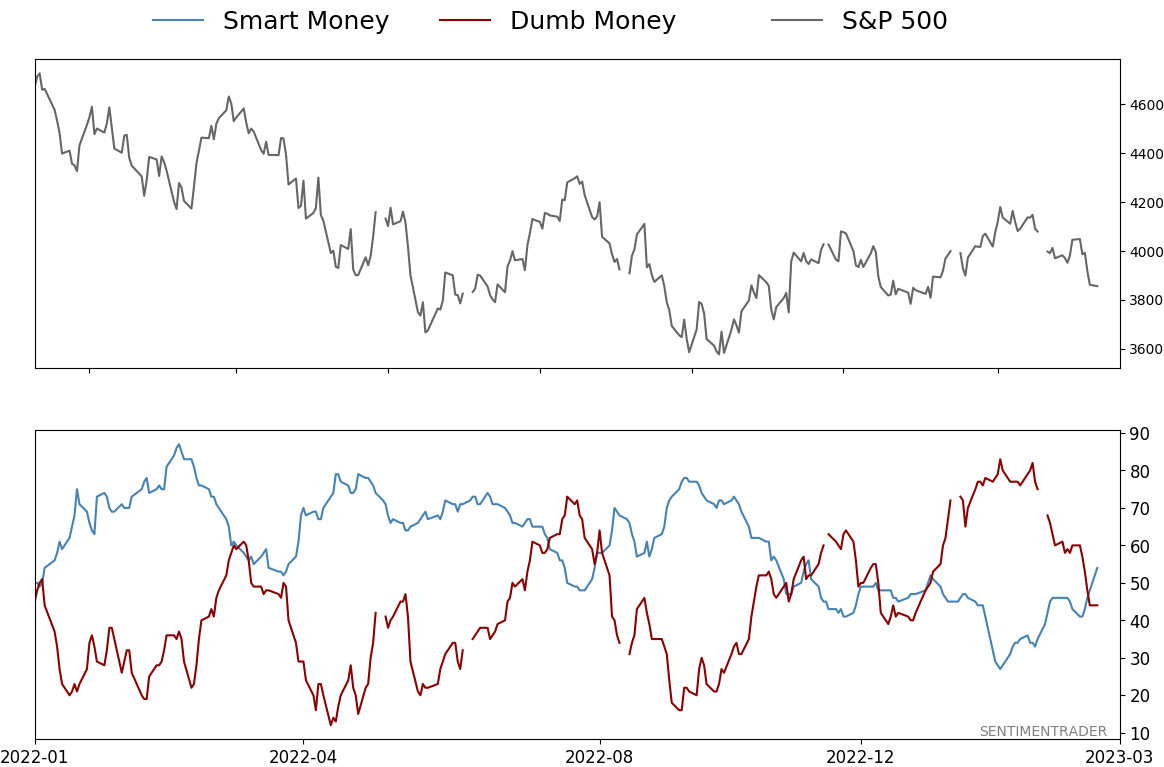
Smart / Dumb Money Confidence
|
Smart Money Confidence: 54%
Dumb Money Confidence: 44%
|
|
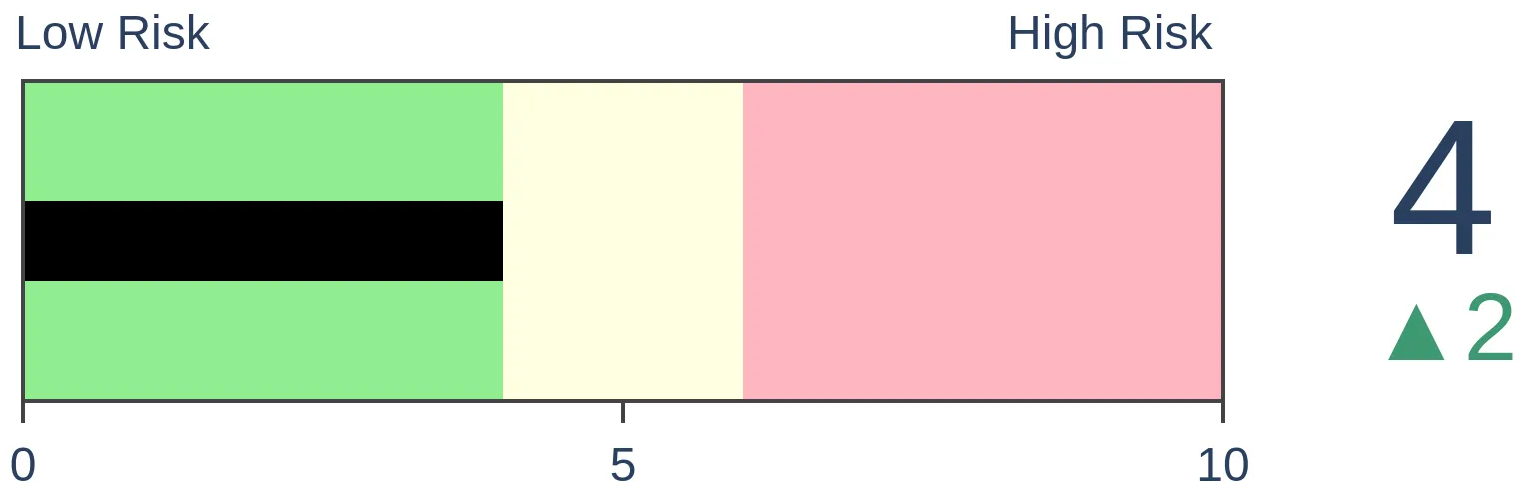
Risk Levels
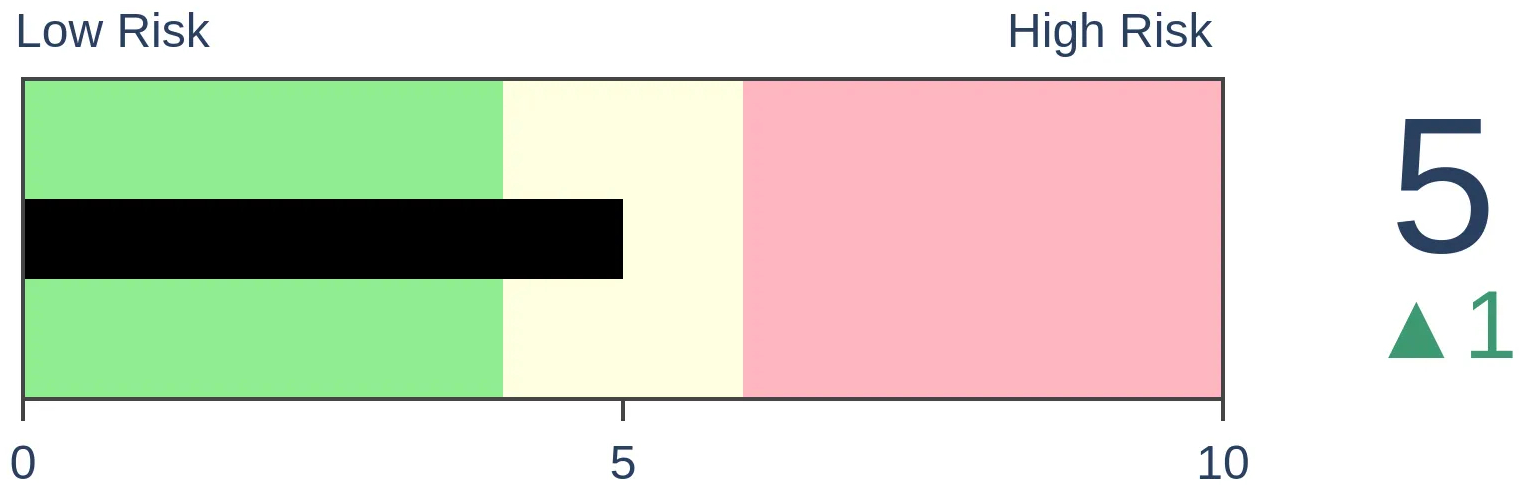
Stocks Short-Term
|
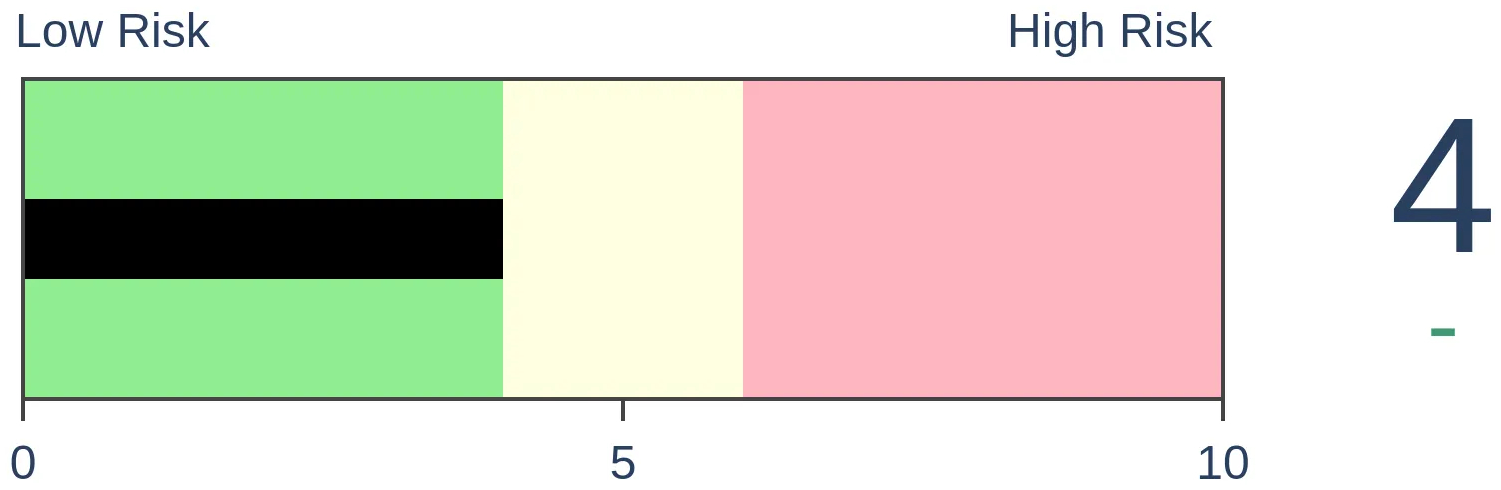
Stocks Medium-Term

|
|
Bonds
|
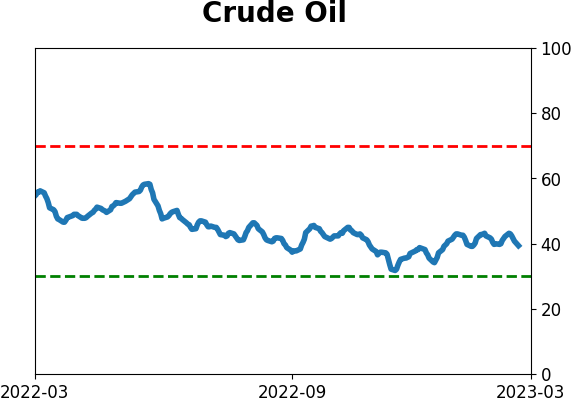
Crude Oil
|
|
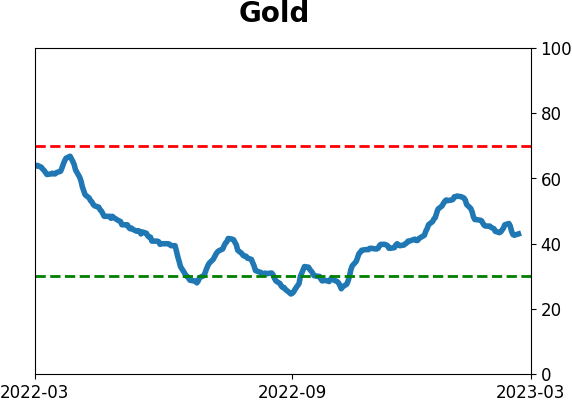
Gold
|
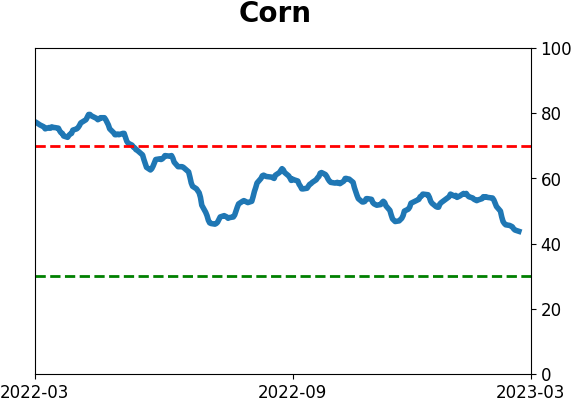
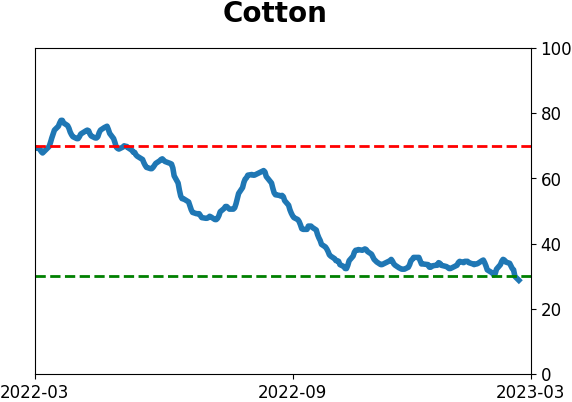
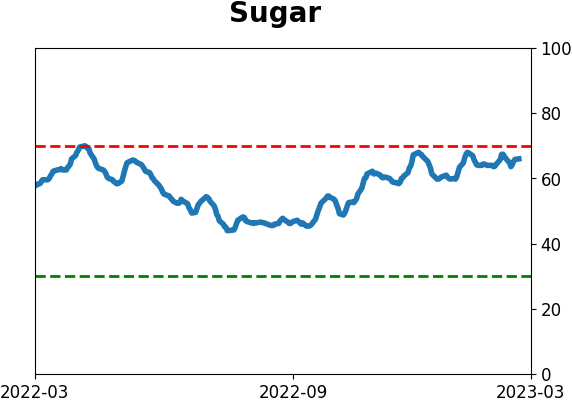
Agriculture

|
|
Research
By Jason Goepfert
BOTTOM LINE
In the month following the four-month surge off the October low, investors have dumped stocks en masse several times. That does not negate the importance of the last four months. With three out of five days seeing more than 90% of S&P 500 stocks decline, this is a bout of selling pressure that saw gains six months later every time but once.
FORECAST / TIMEFRAME
SPY -- Up, Long-Term
|
Key points:
- More than 90% of S&P 500 stocks declined during 3 of the past 5 trading days
- This is a historic bout of selling pressure that preceded gains in the index over the next six months
- Heavy selling pressure following 4-month thrusts off a bottom did not tend to negate those bottoms
A historic bout of intense selling pressure
A month ago, we saw that the 4-month period following the October bottoms had been rife with breadth thrusts. And then we saw that the first 95 days have been most correlated to nascent bull markets that tended to persist. Those argued that outside of some shorter-term volatility, the evidence leaned toward a 6-12 month continuation of the rally.
Since then, it's been a very tough go.
On consecutive days, and for three out of the past five sessions, more than 90% of stocks in the S&P 500 suffered declines. The only times investors have behaved like this in recent years were in March 2020 and June 2022.
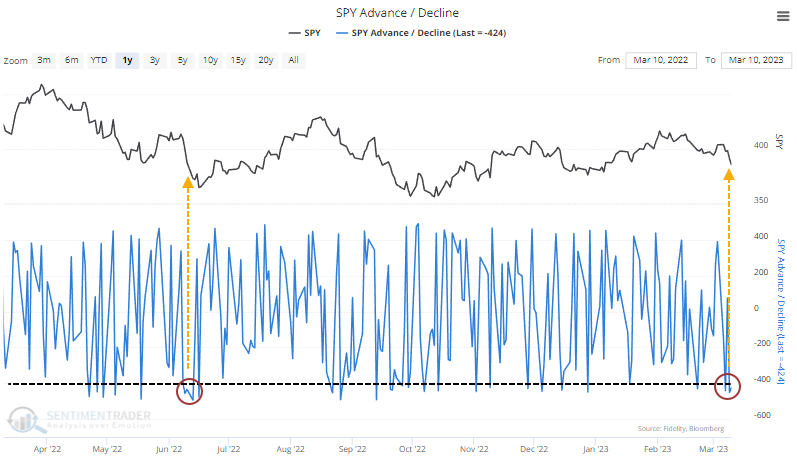
This is a rare cluster of such severe selling pressure, with previous bouts preceding gains in the S&P over the next six months every time but once. Granted, that "once" was during the teeth of the financial crisis and led to more than a 30% drawdown. It still showed a gain a year later, but a 30% haircut in the interim would have tested even the most ardent bull.
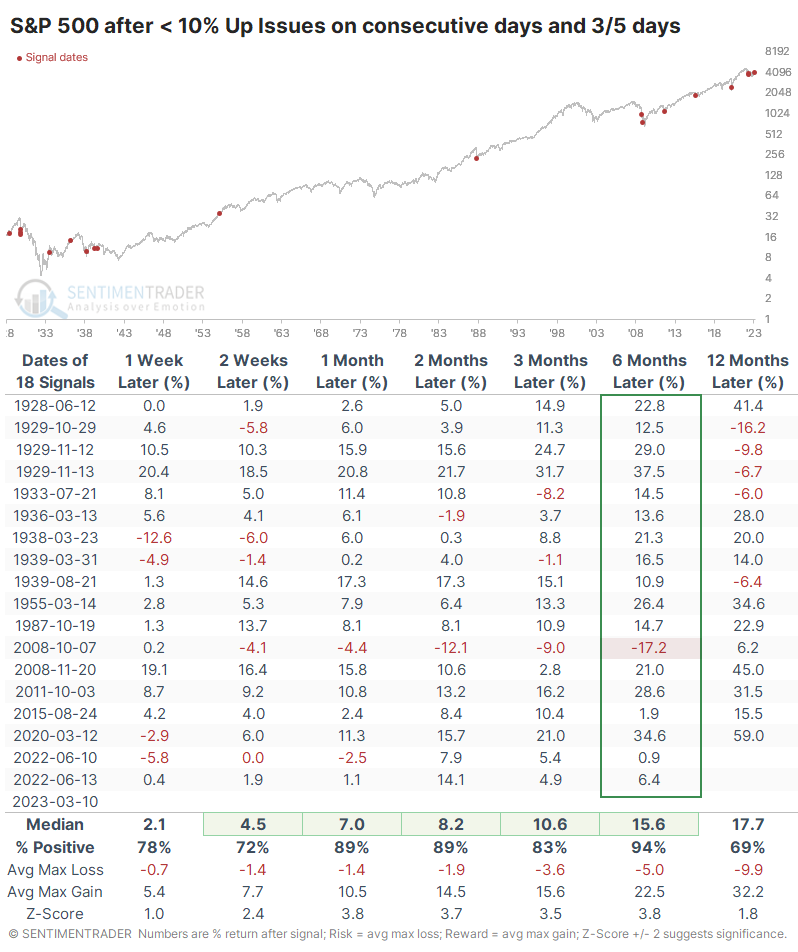
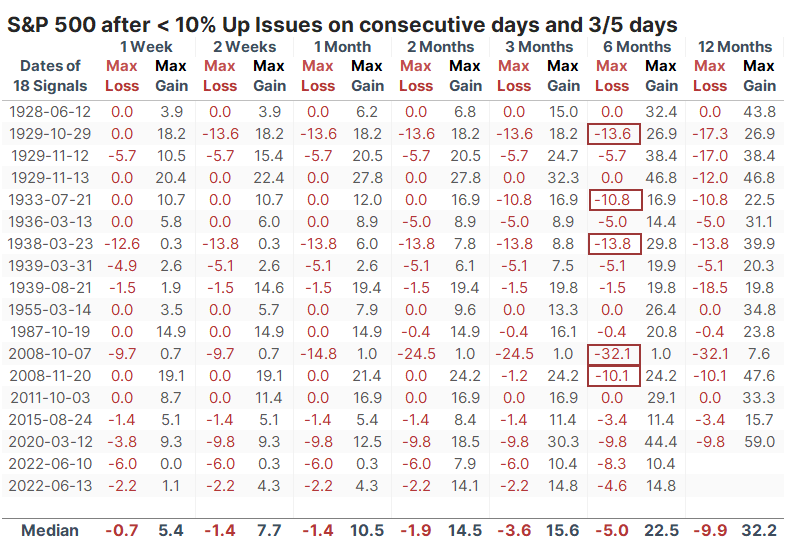
Only five signals suffered more than a 10% drawdown at any point within the next six months. Two of those were just barely and led to significant gains. The failure in October 2008 was the only one that didn't see double-digit upside within the next six months.
A failure of the 4-month bottom?
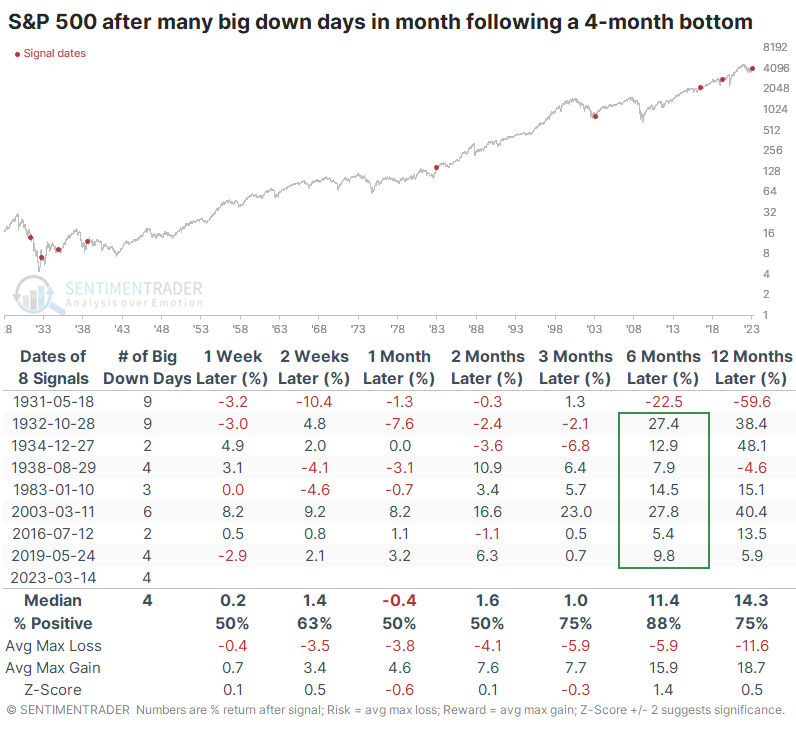
If we go back to that study of 4-month bottoms, we'll look for the ones with the most days with either 80% Up Issues or Up Volume. Then, we'll filter those that suffered the most big down days (with less than 20% Up Issues or Up Volume) over the following month. For the current signal, the month isn't up until Tuesday, but it will rank among the worst reactions no matter what happens today or tomorrow.
There weren't many, especially outside of the hyper-volatile 1930s. But except for the absolute failure in 1931, they all enjoyed a positive return six months later. In other words, a bevy of big down days in the month following a major 4-month rebound did not cancel out the positive implications from the initial bottoming phase except for that one instance.
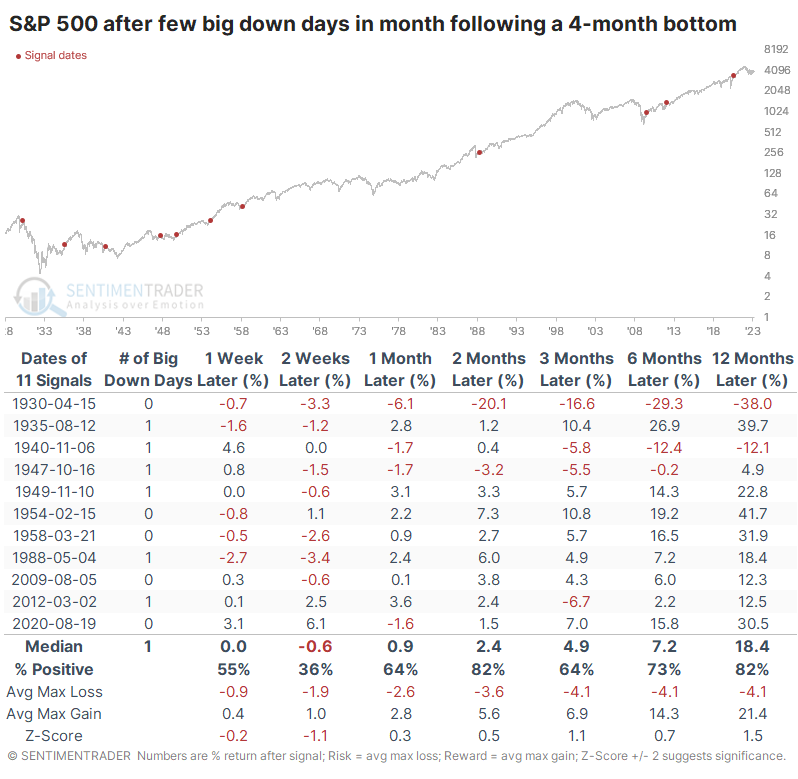
Now, let's look at the opposite scenario. These are times when investors never really rushed for the exits en masse in the month following a 4-month bottom. After these, returns were quite good, especially since 1950. What this shows us is that it wasn't necessary, or even particularly desirable, to see a lack of volatility in the month following a four-month surge off a bottom.
What the research tells us...
There is no shortage of gloom and doom, with investors' focus now shiftly hysterically to a potential bank run. There is always the potential that this is a repeat of the October 2008 type of signal noted above. It seems wildly unlikely, but many "wildly unlikely" things have transpired over the past three years. Based on historical behavior, it's much more likely that this is just another round of intense selling panic in which patient investors will find an opportunity to lower their cost basis for longer-gain gains.
Indicators at Extremes
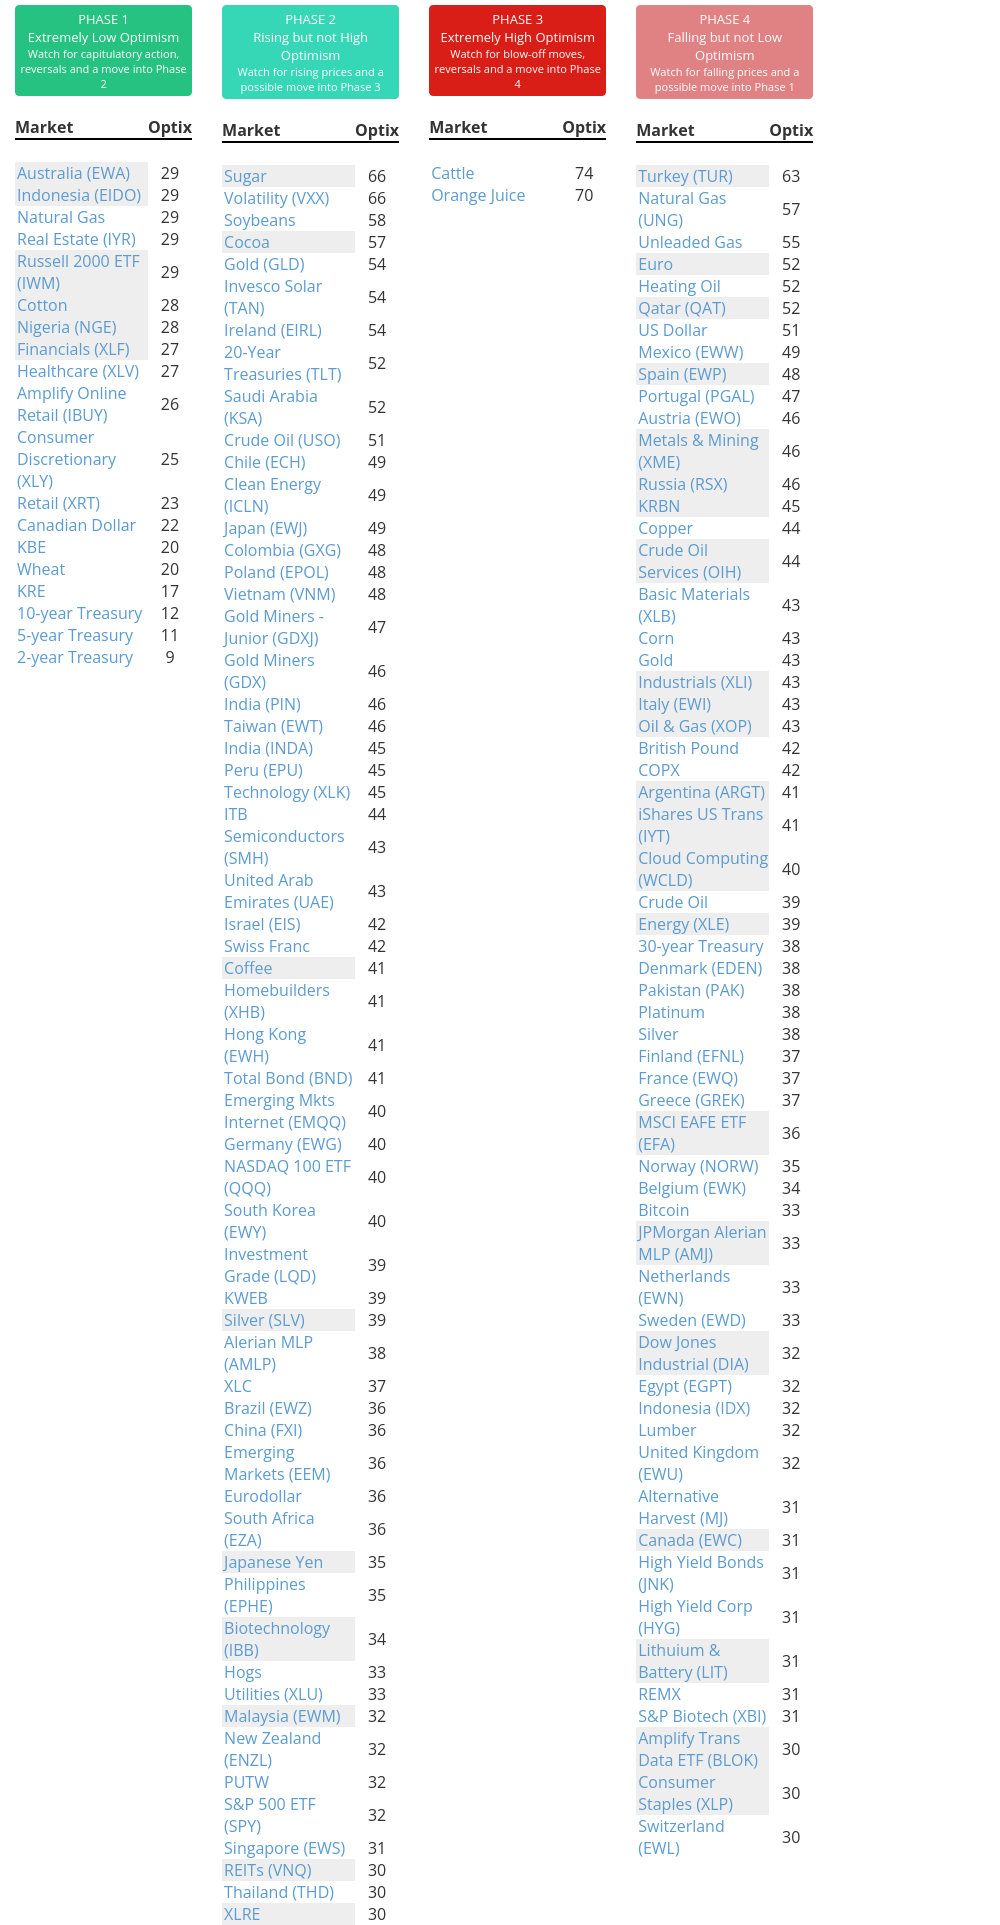
Phase Table
Ranks
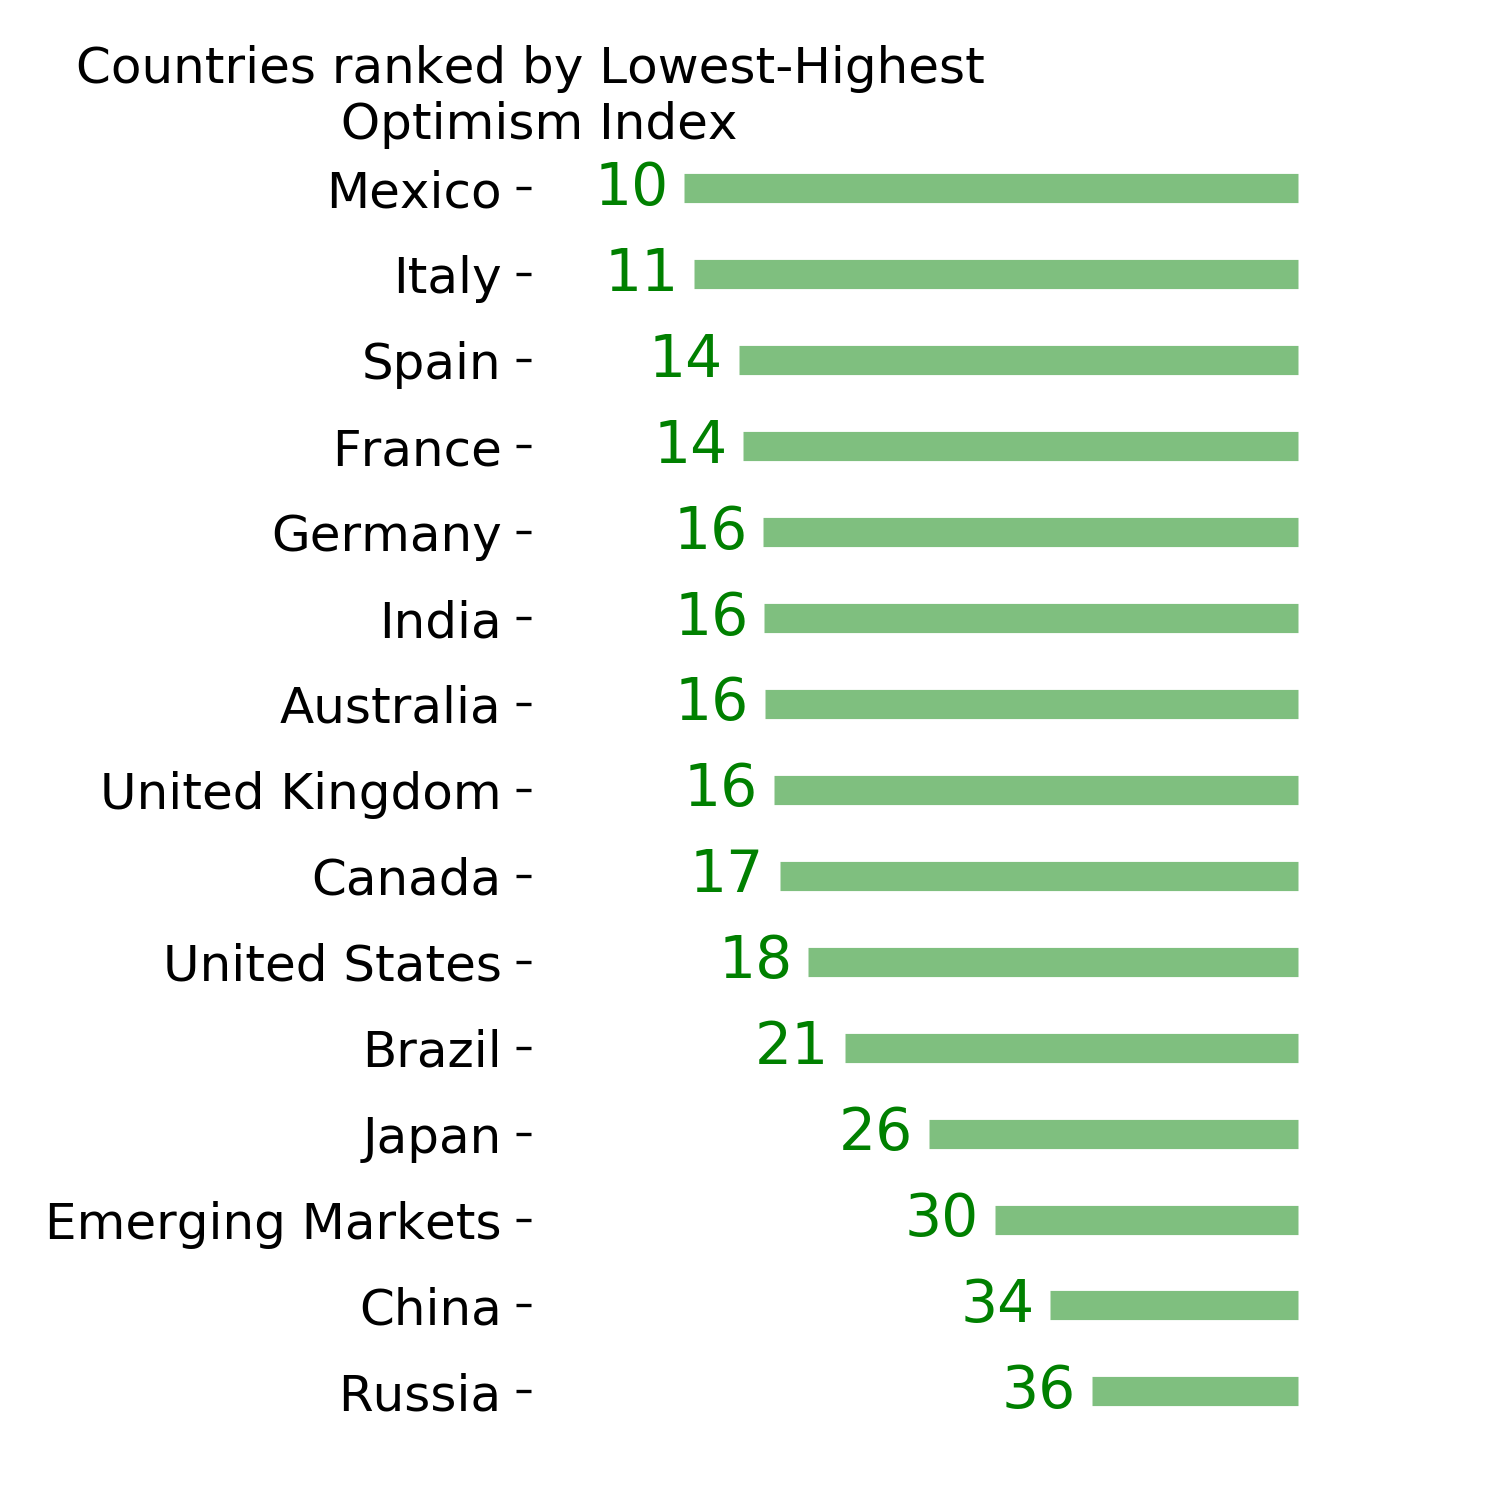
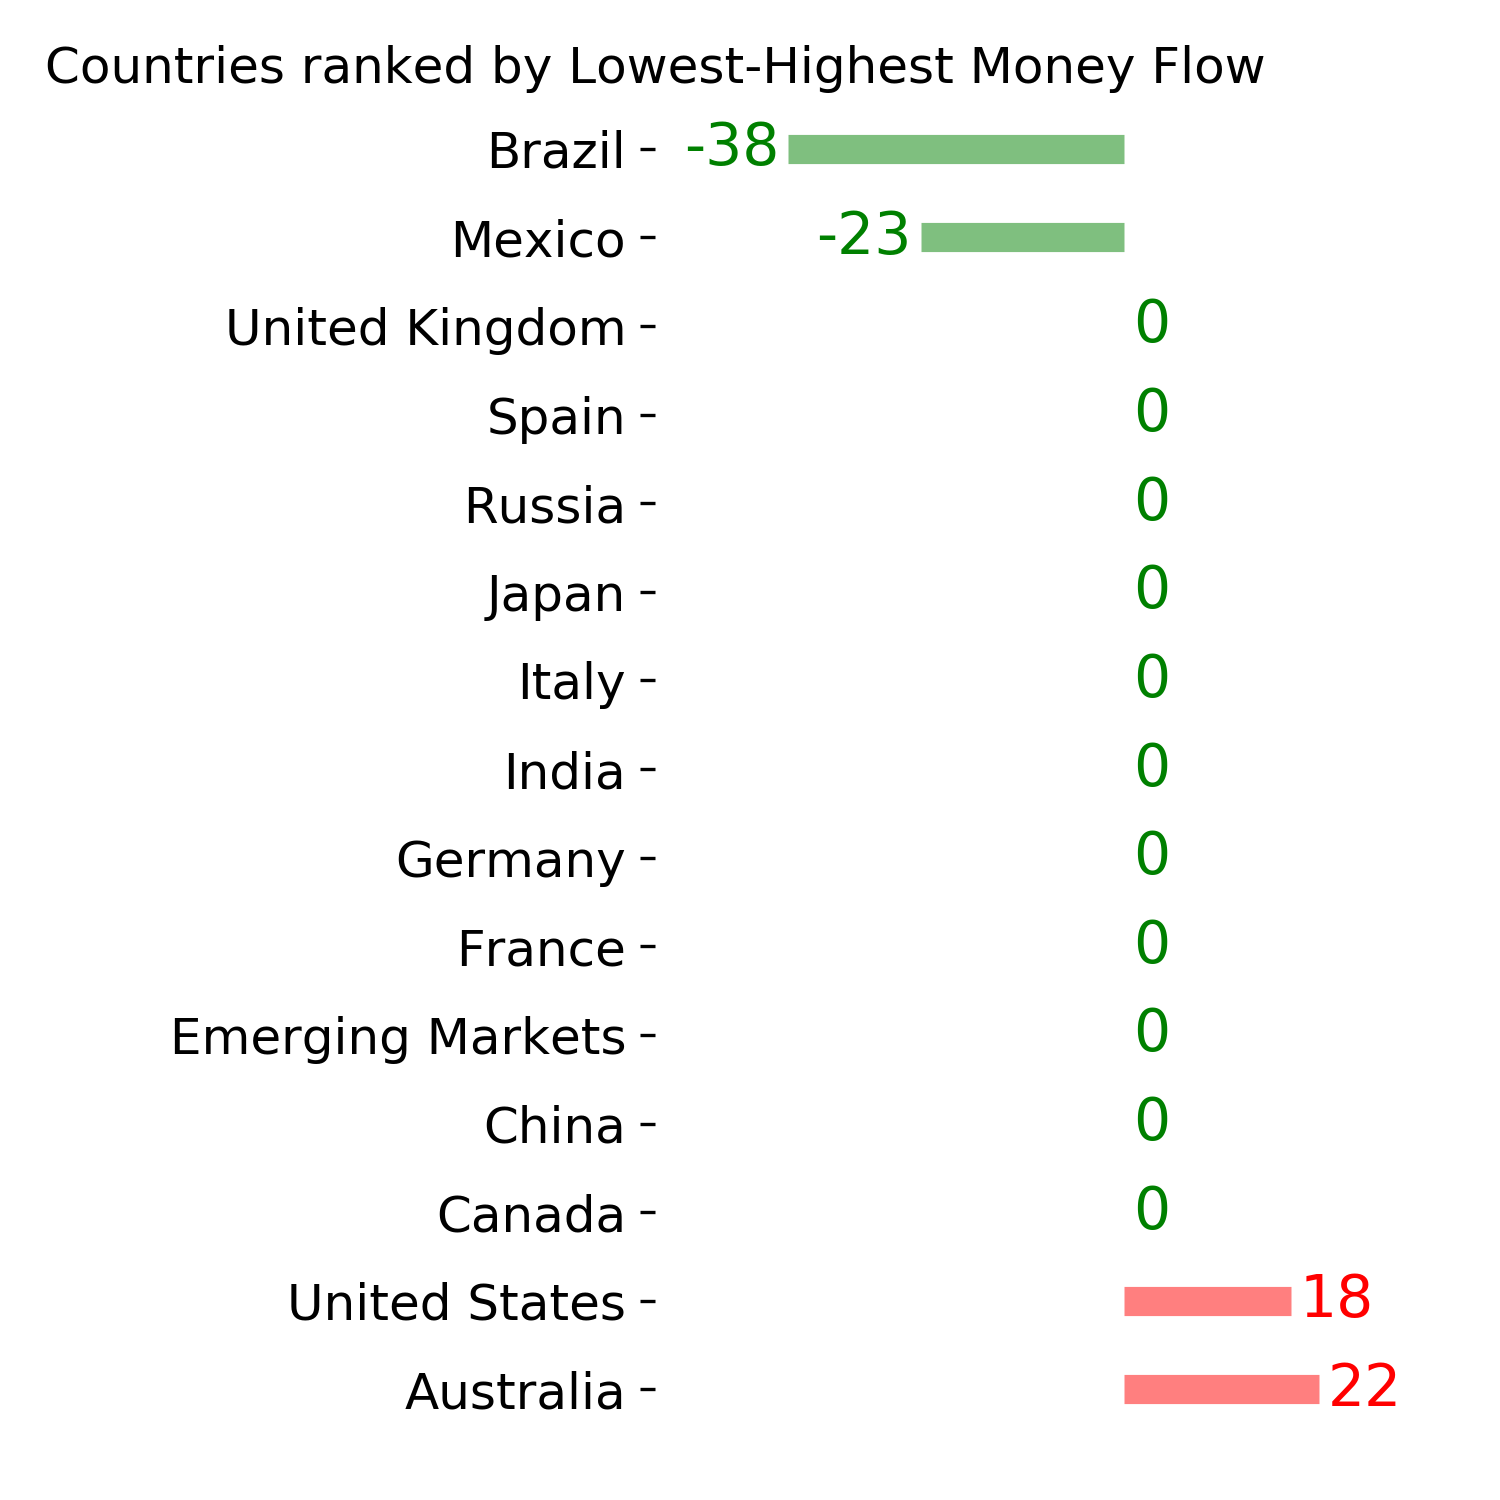
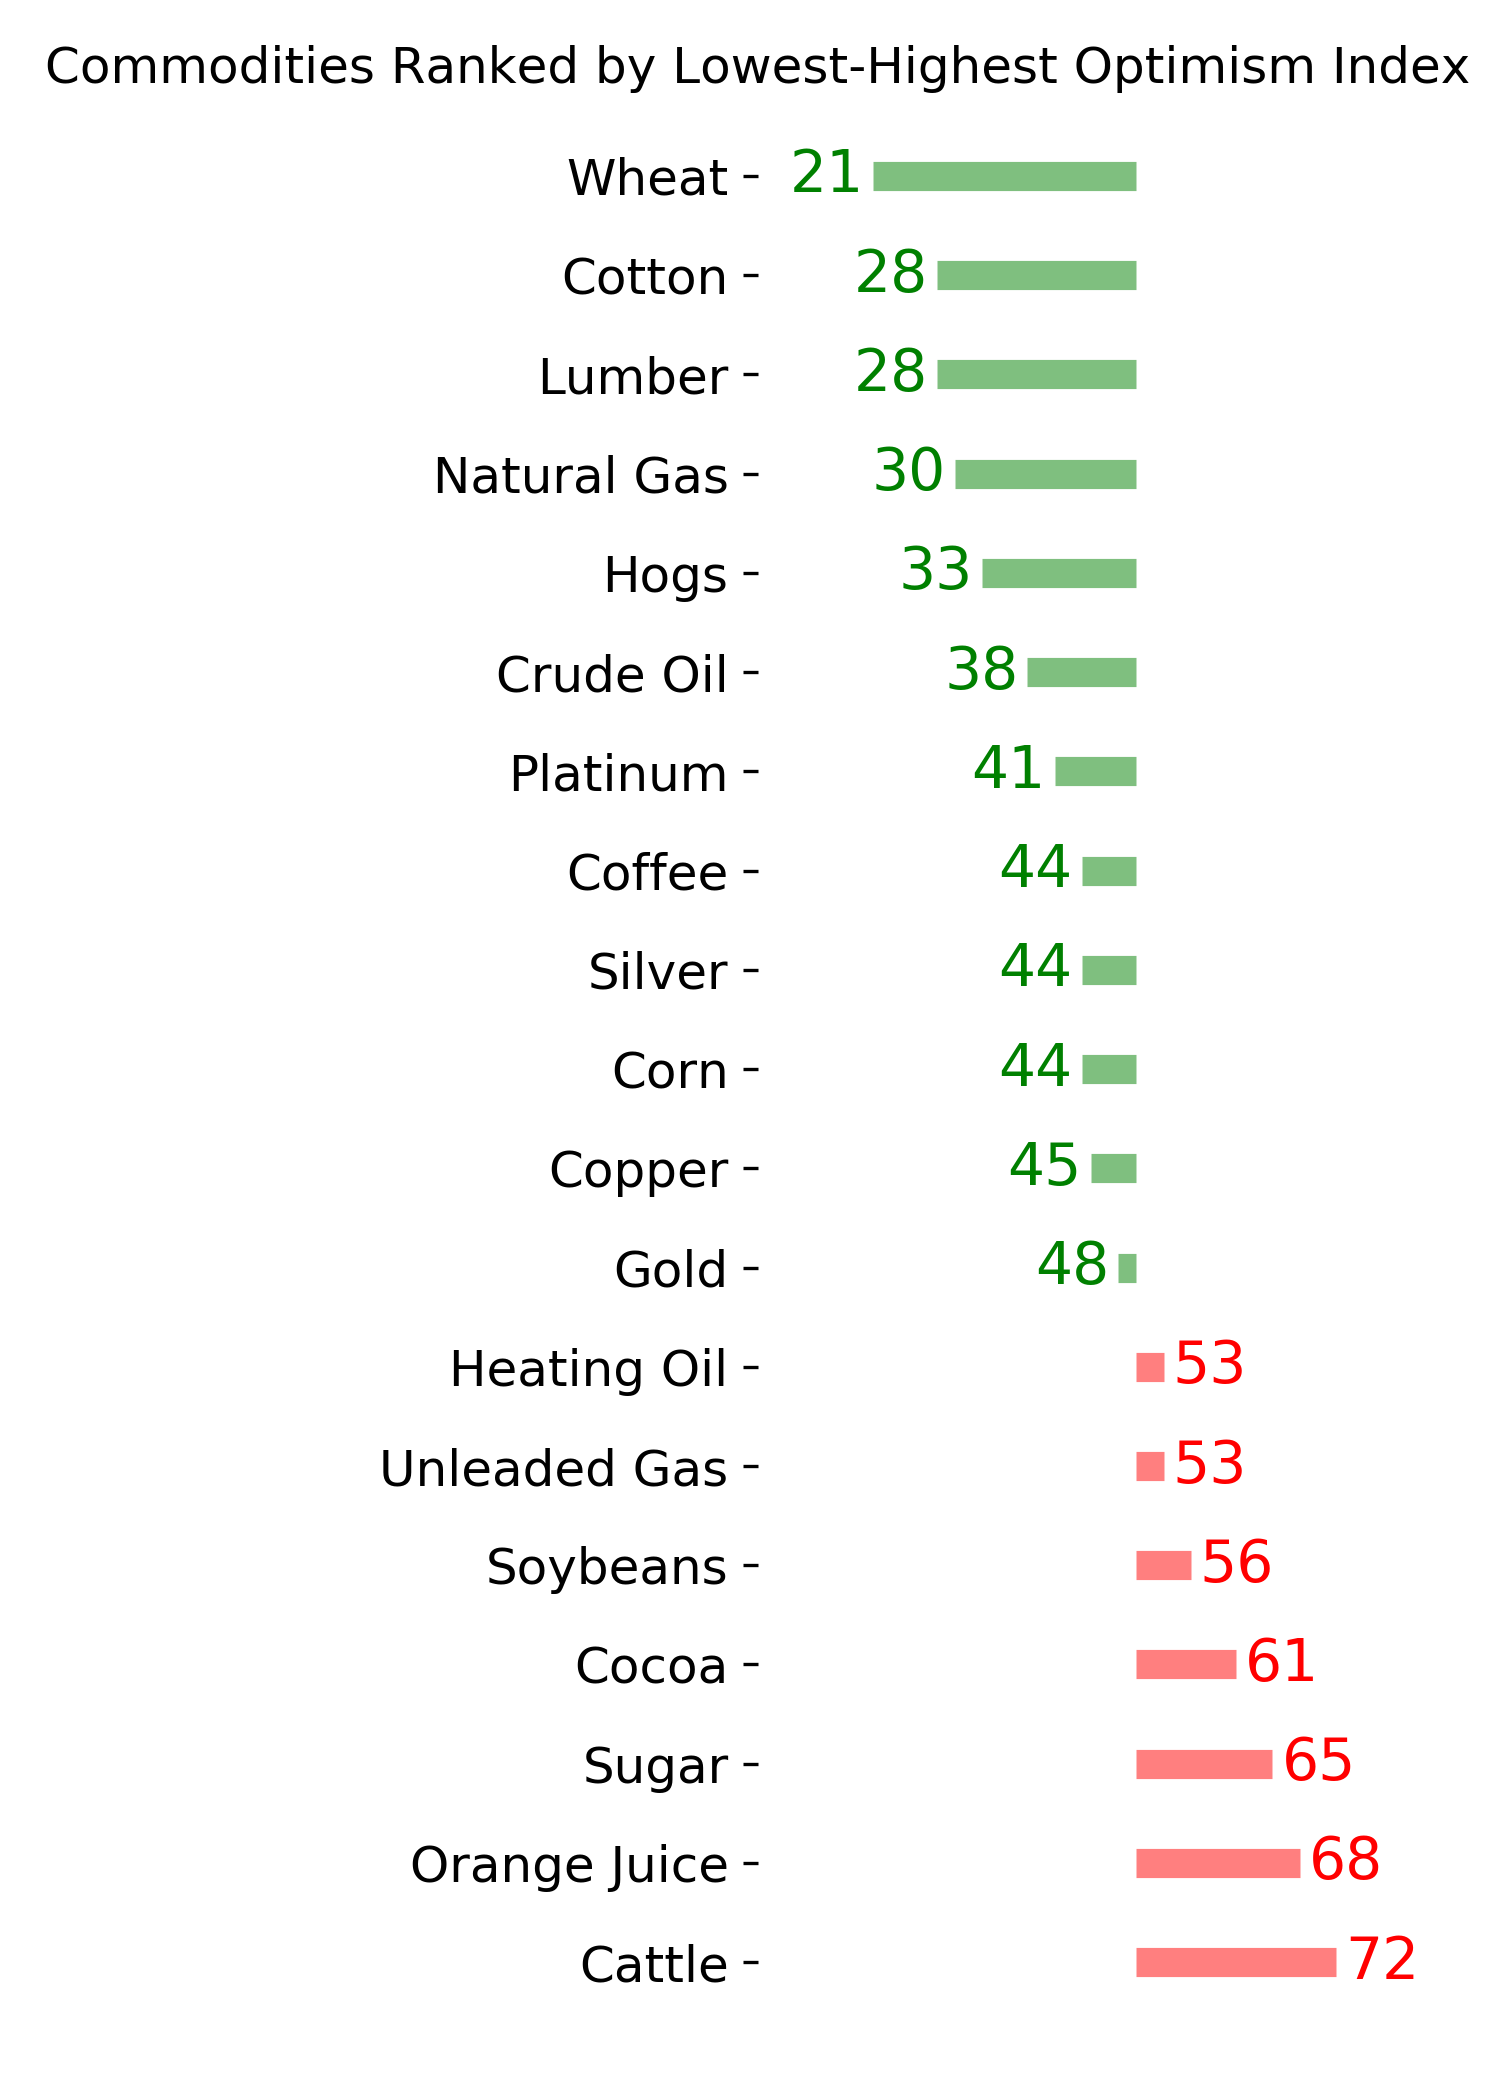
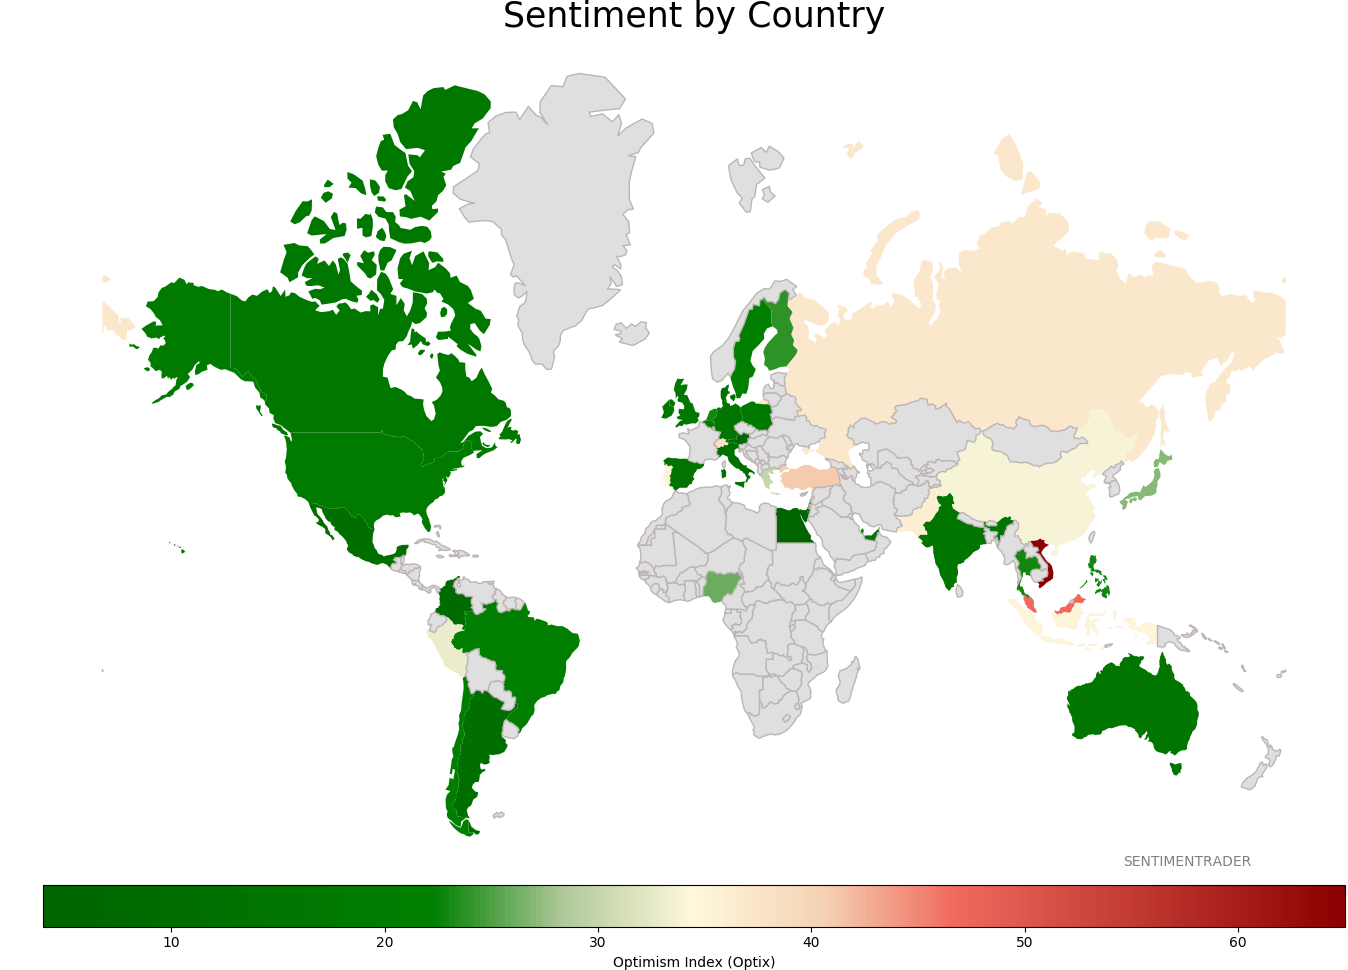
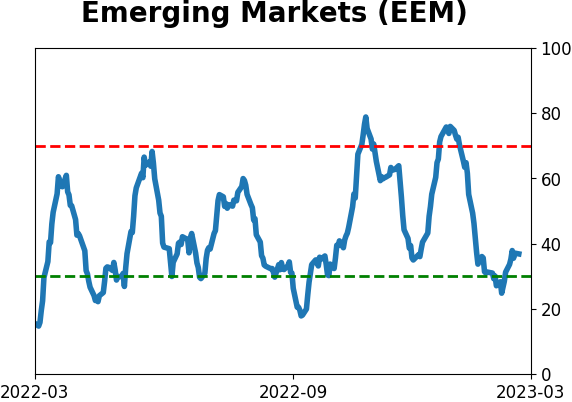
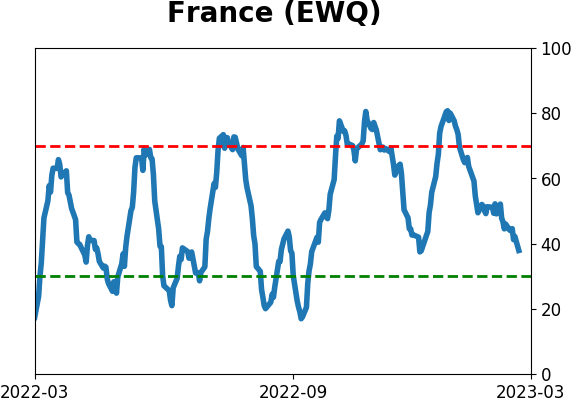
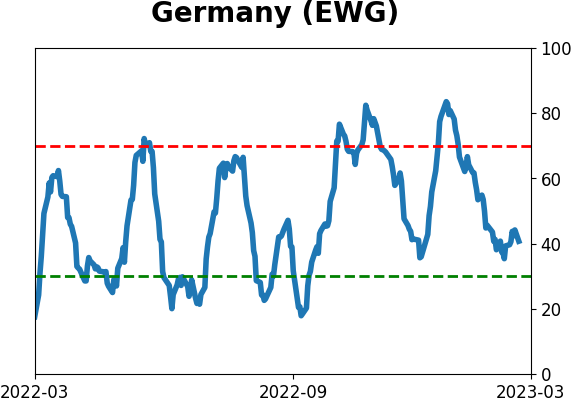
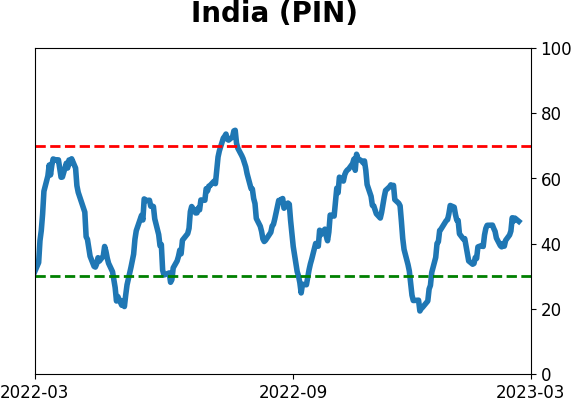
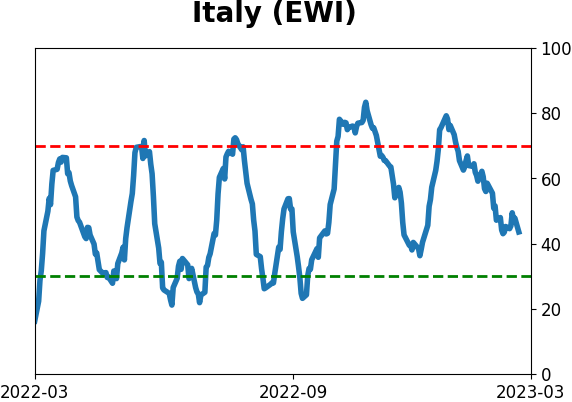
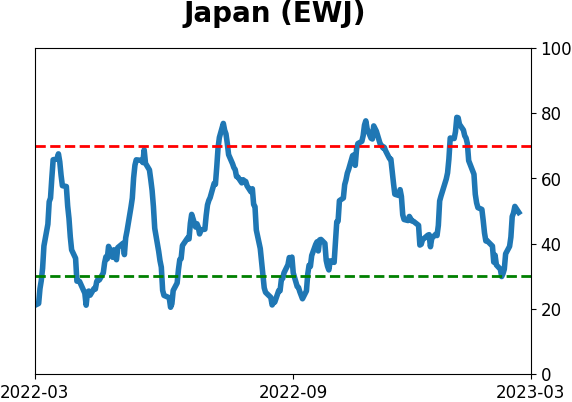
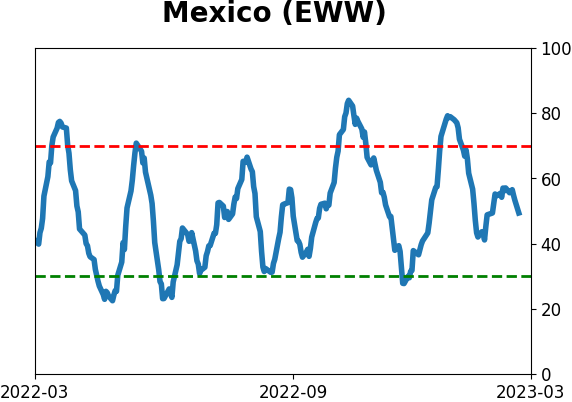
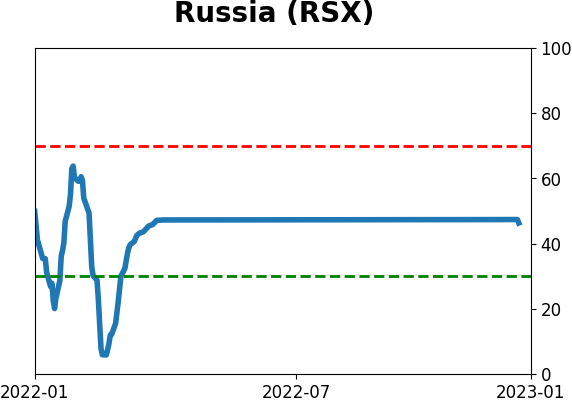
Sentiment Around The World
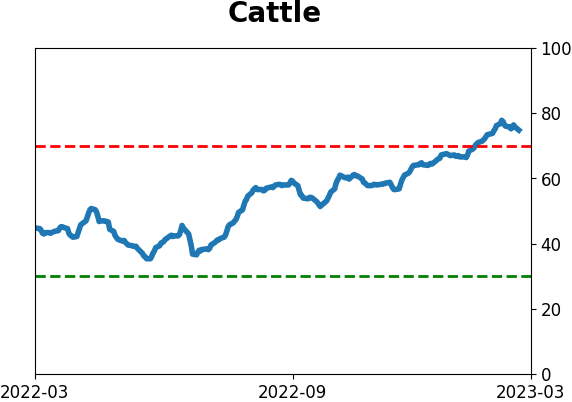
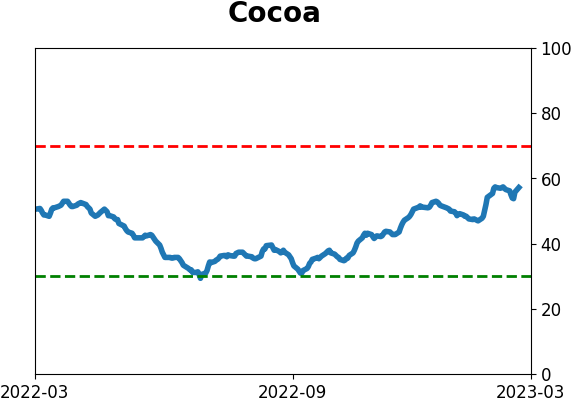
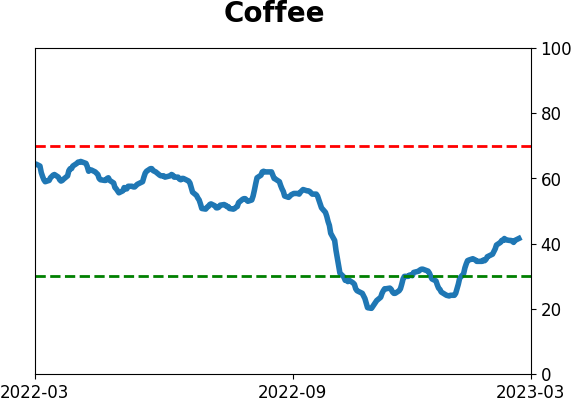
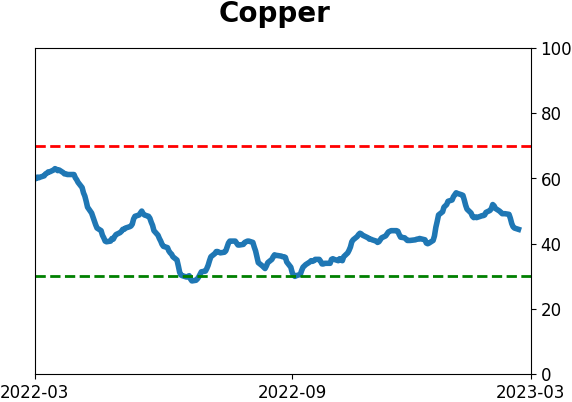
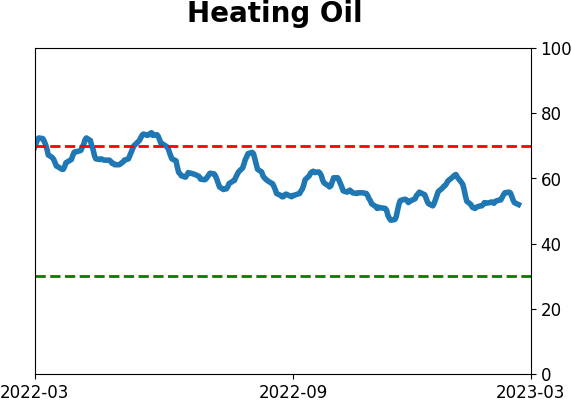
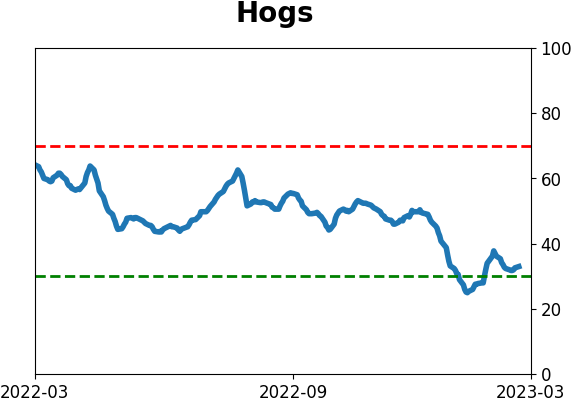
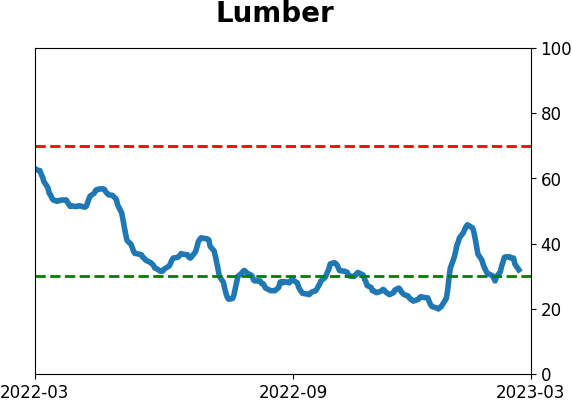
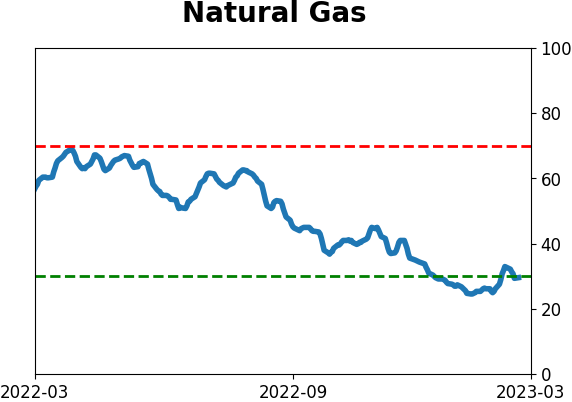
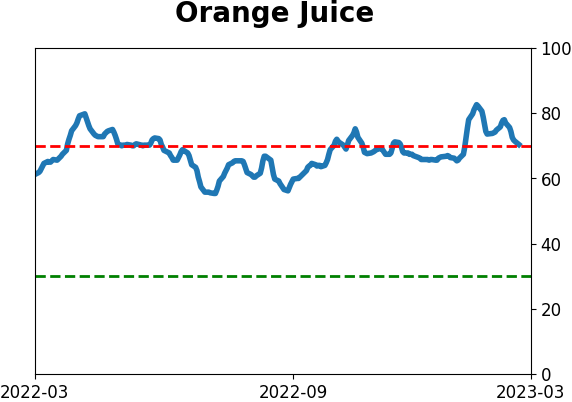
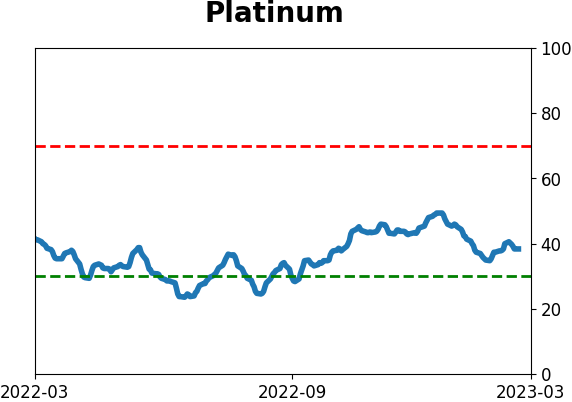
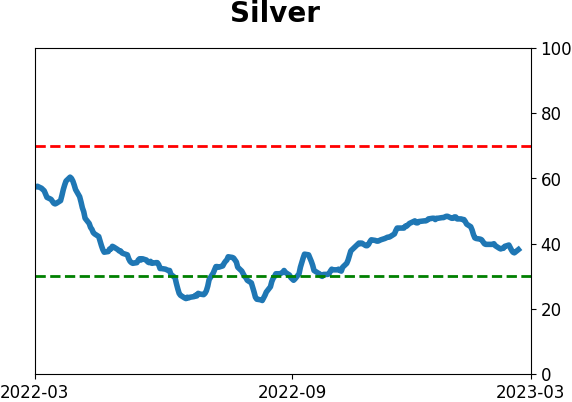
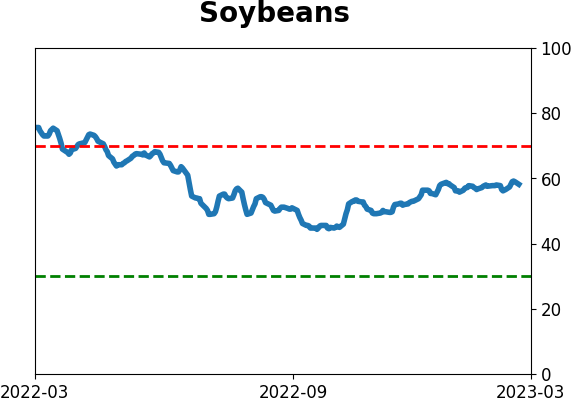
Optimism Index Thumbnails
|
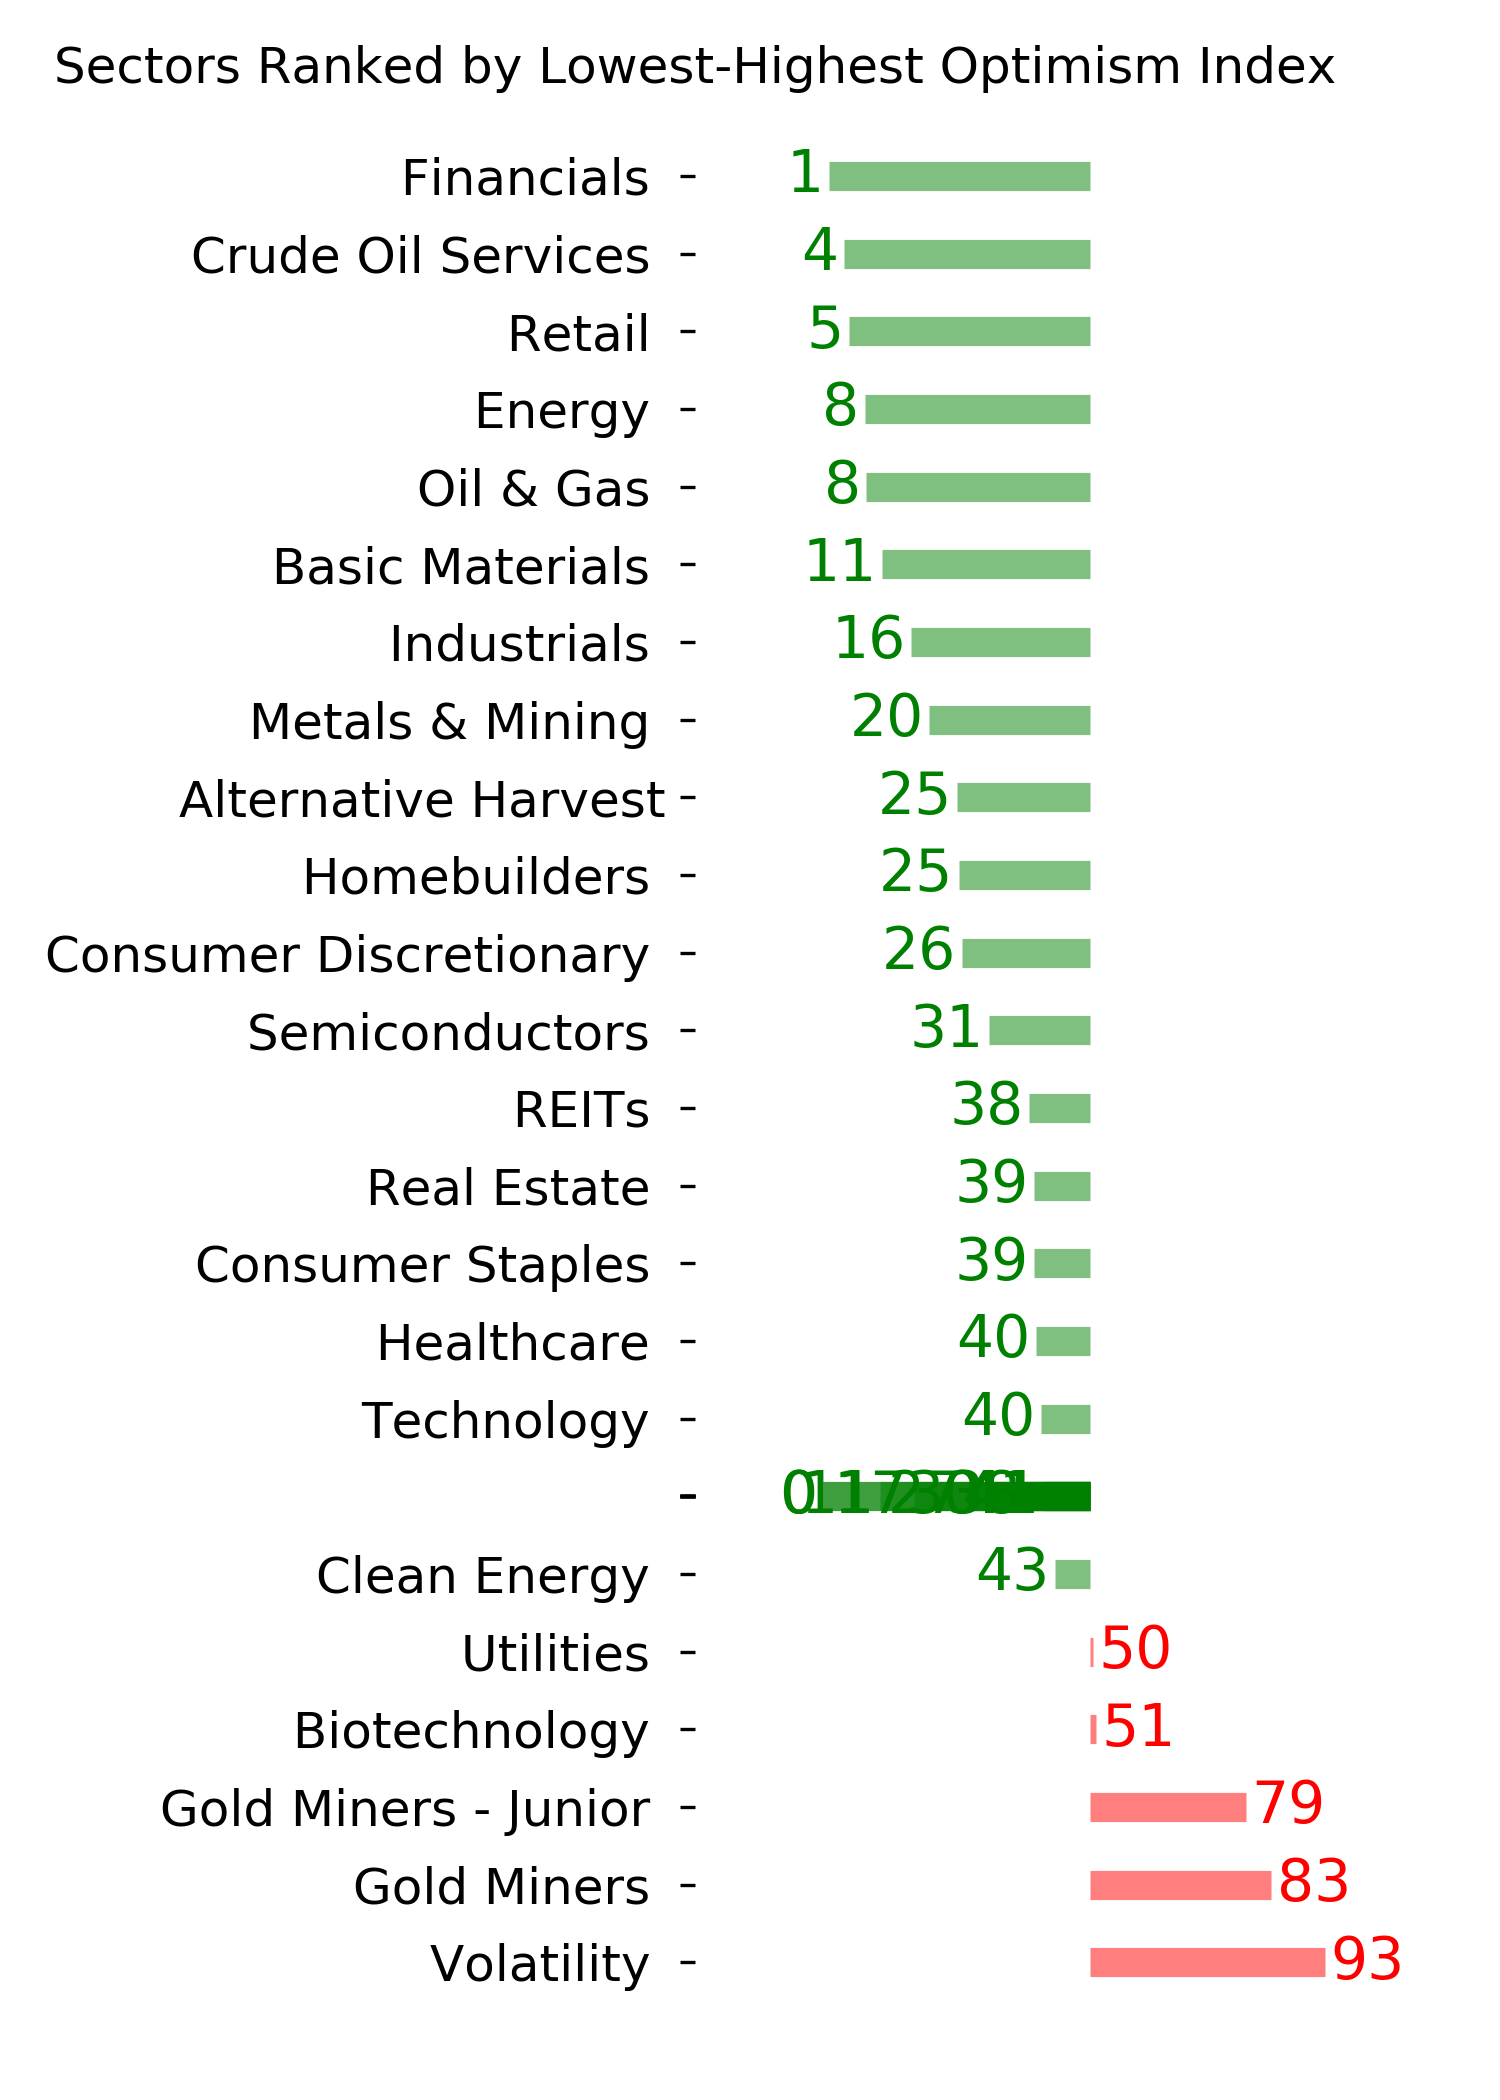
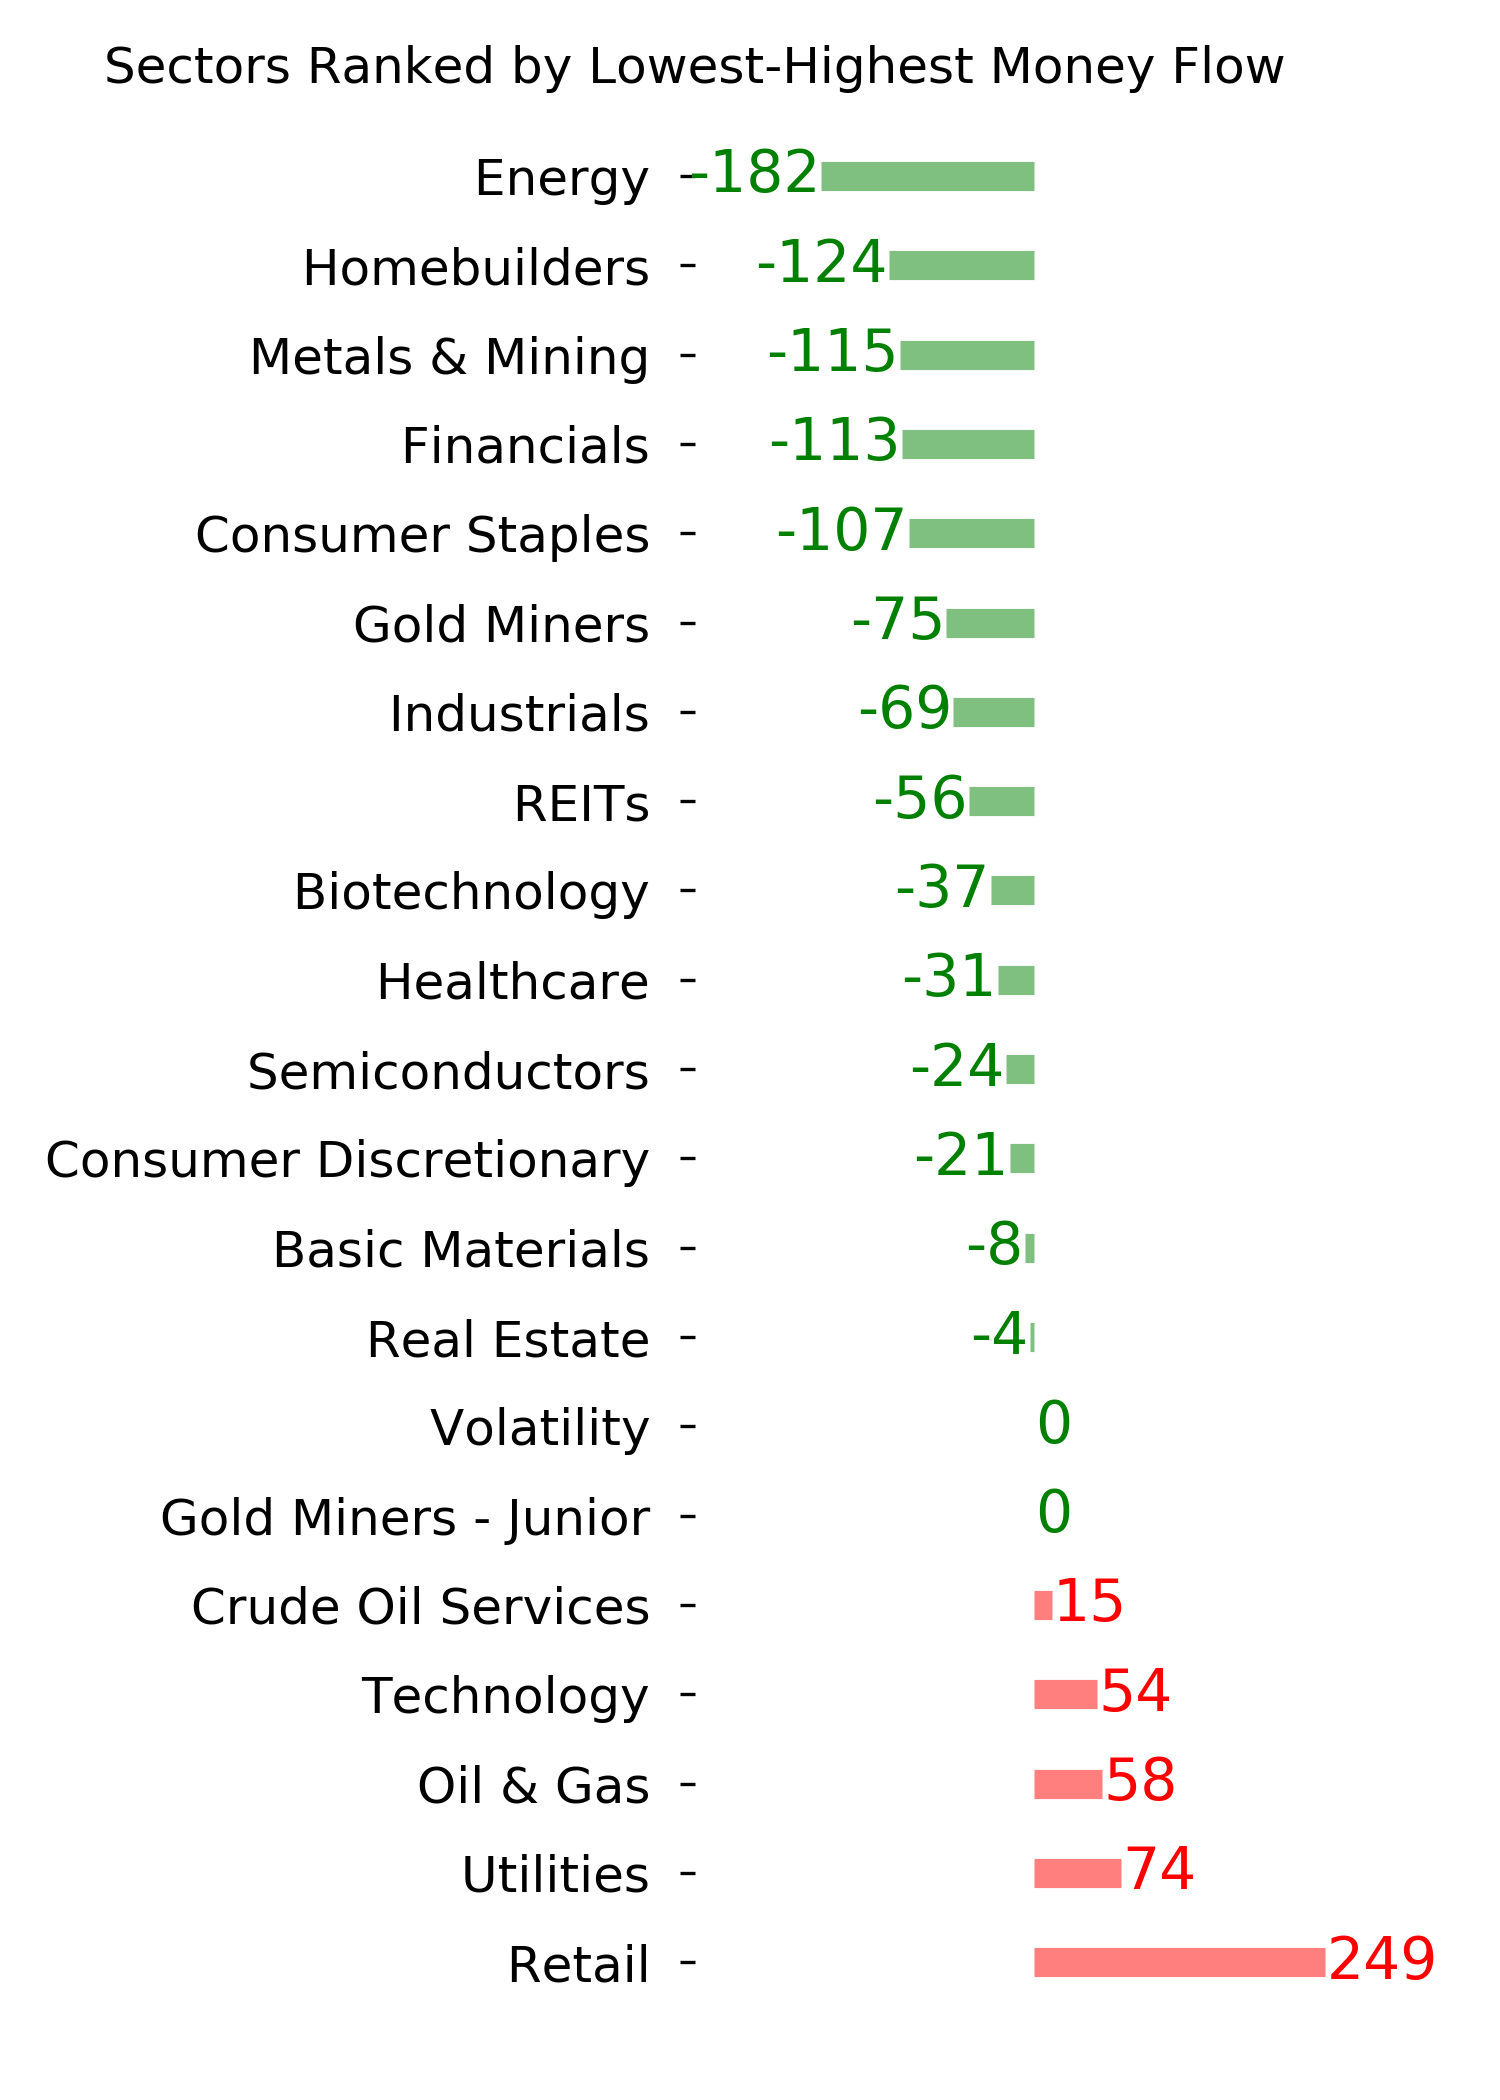
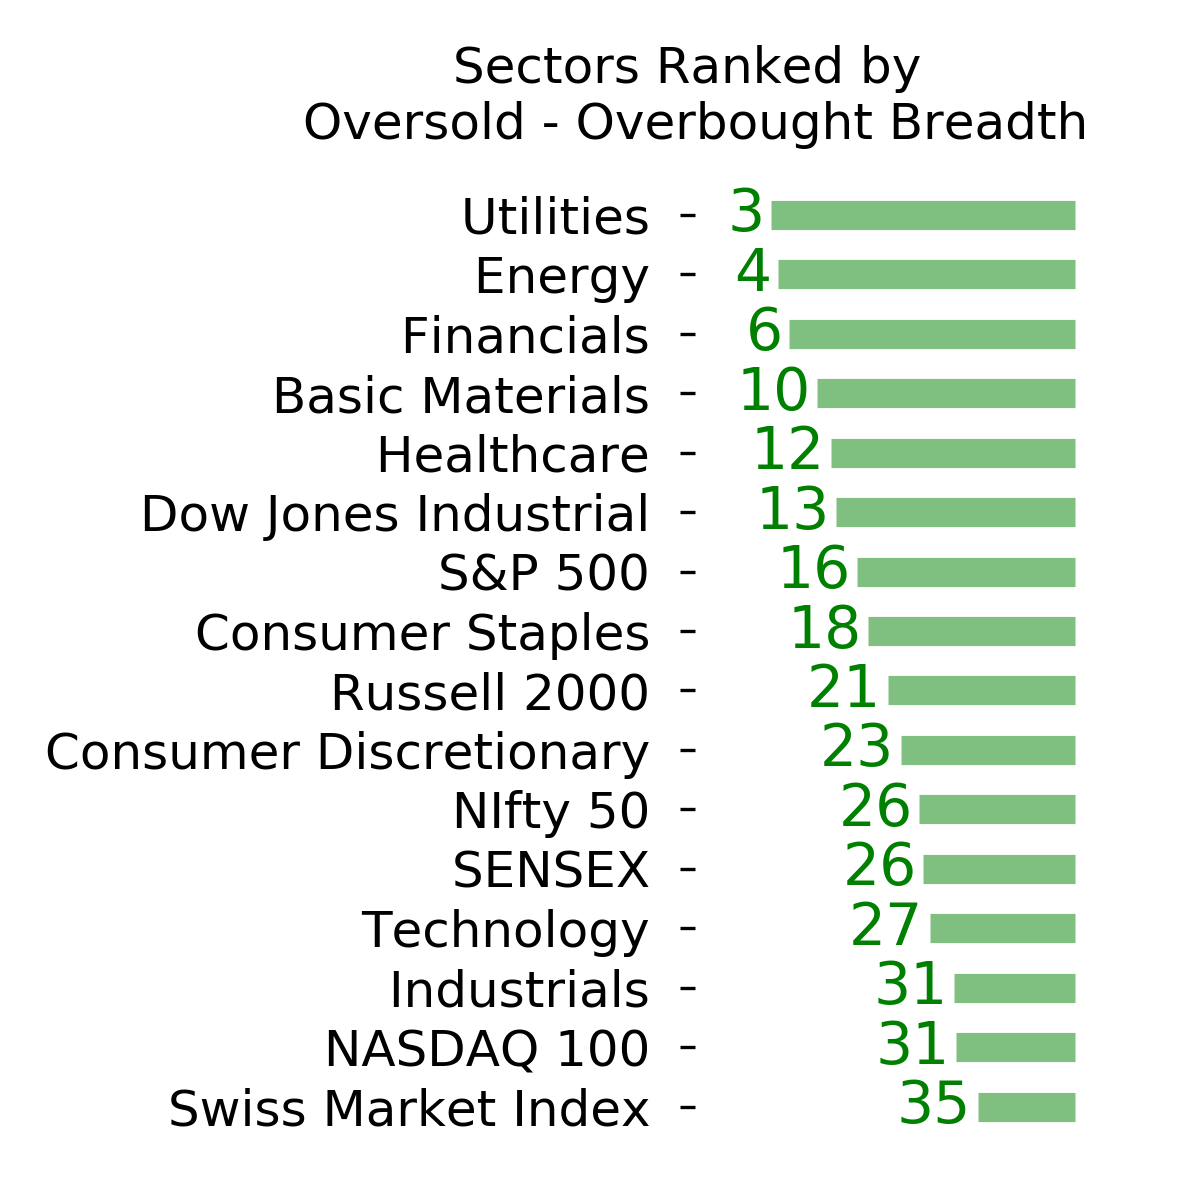
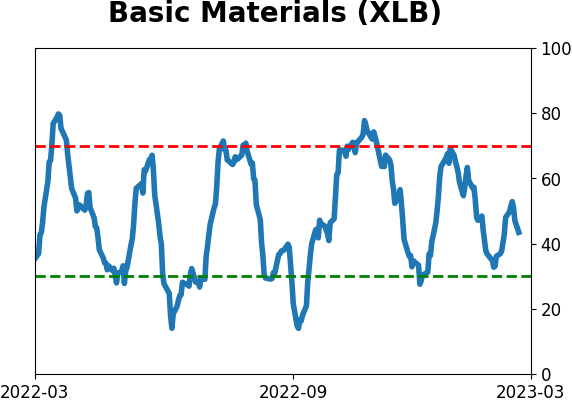
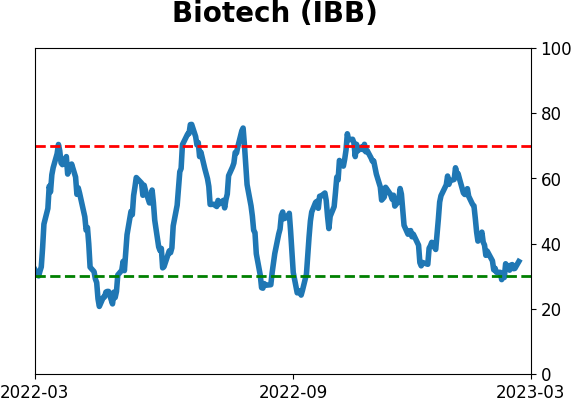
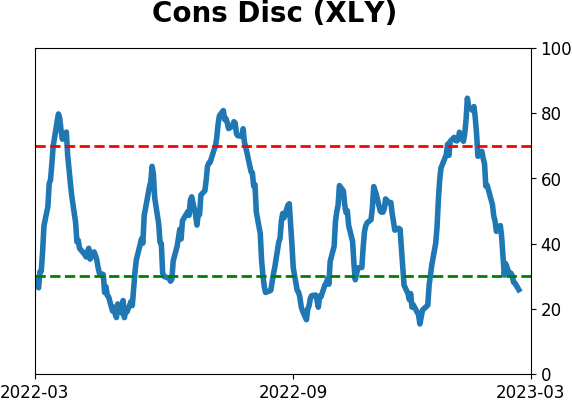
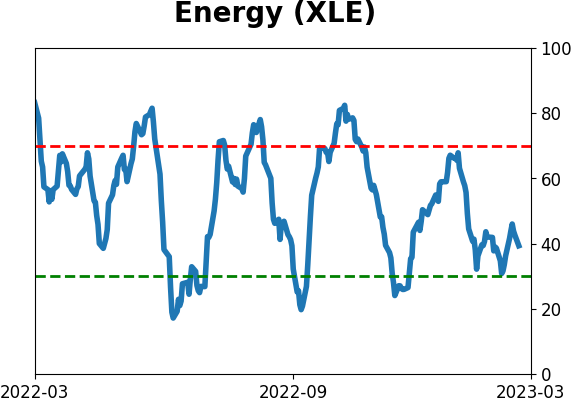
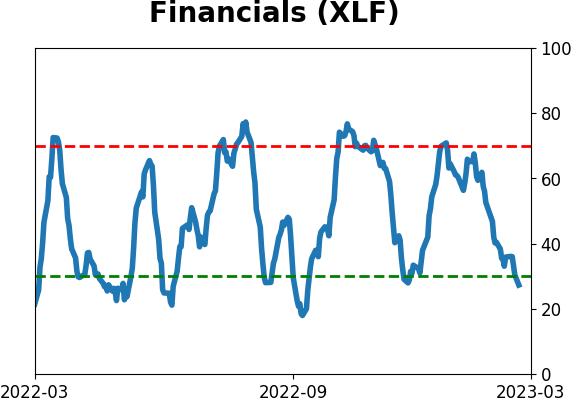
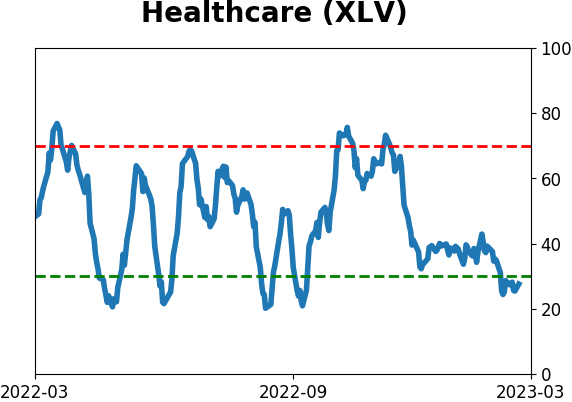
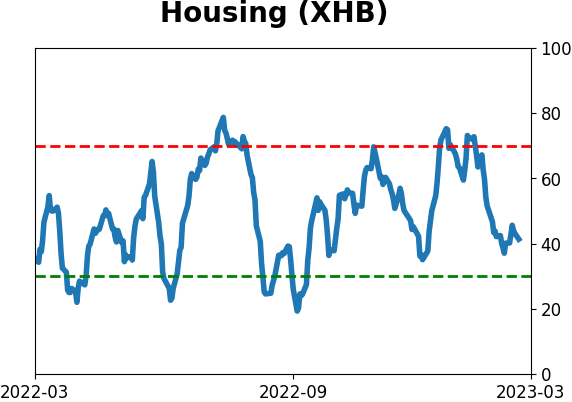
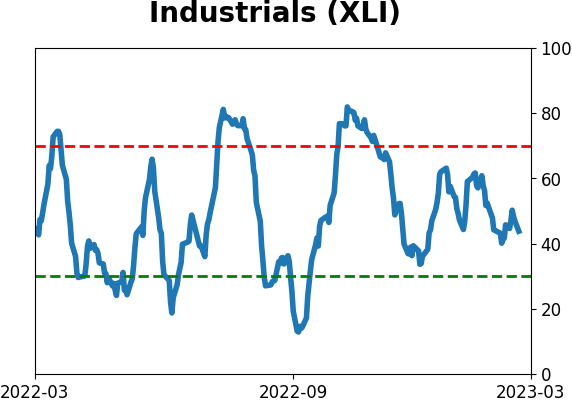
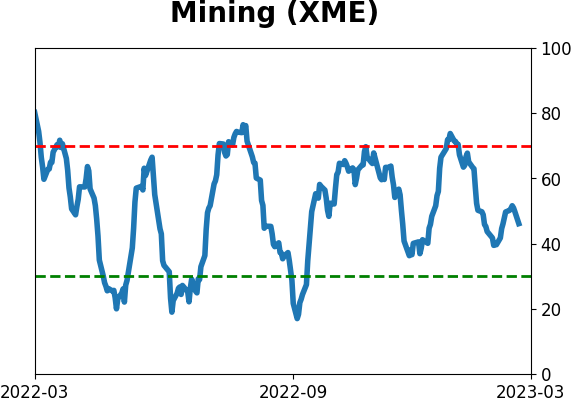
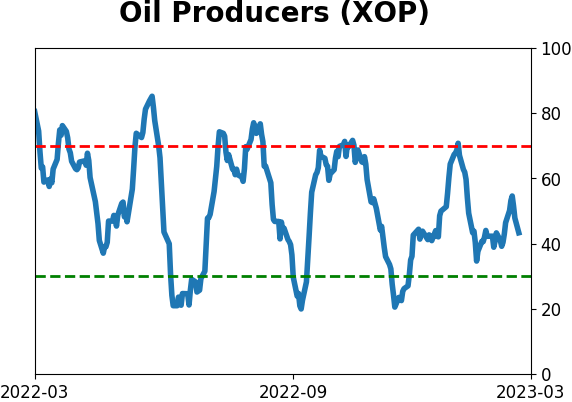
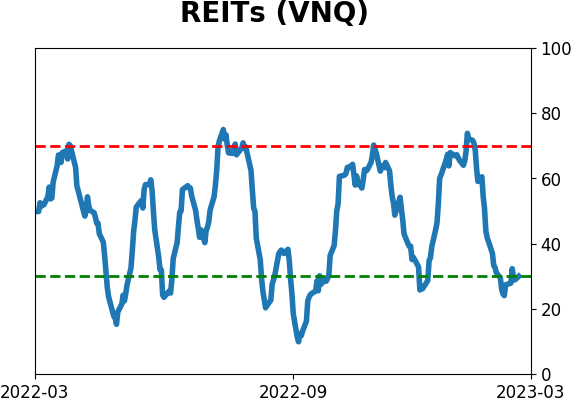
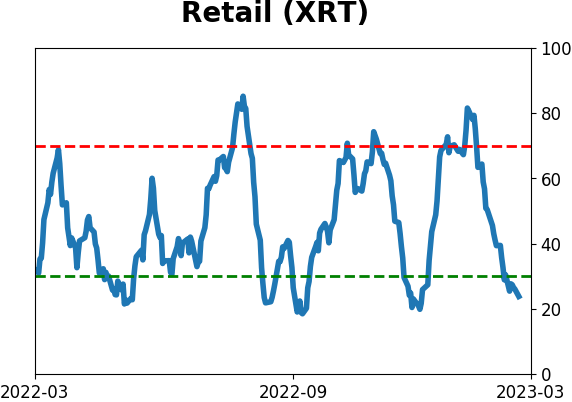
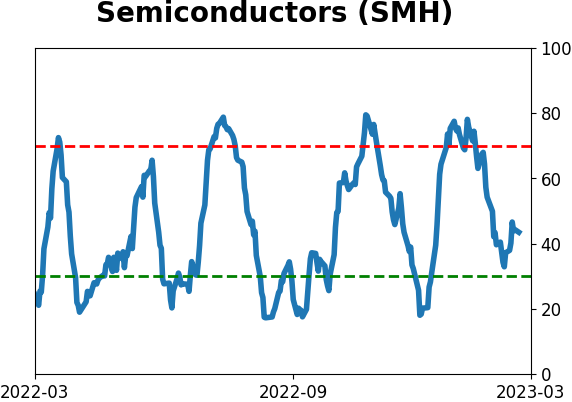
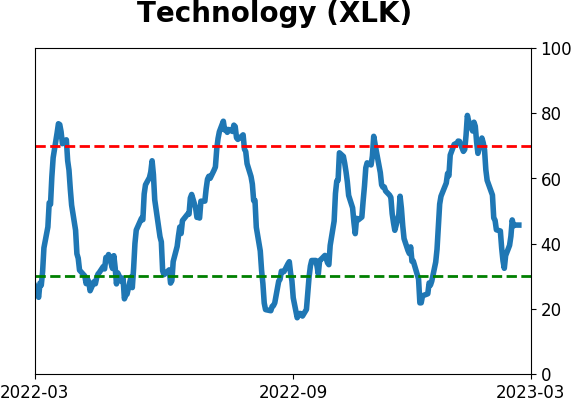
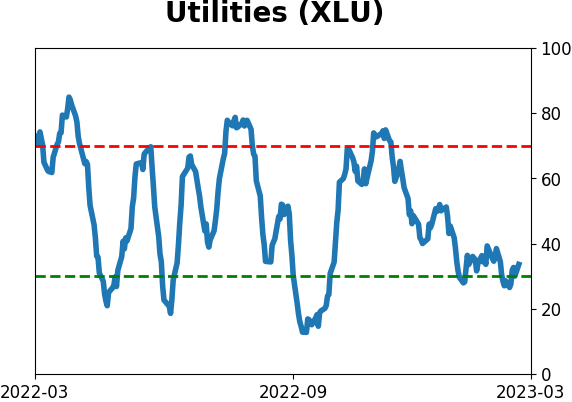
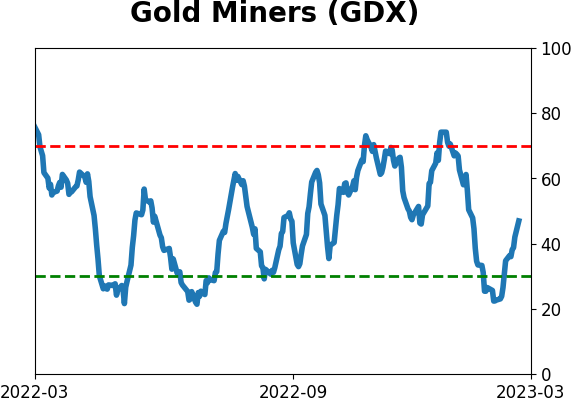
Sector ETF's - 10-Day Moving Average
|
|
|
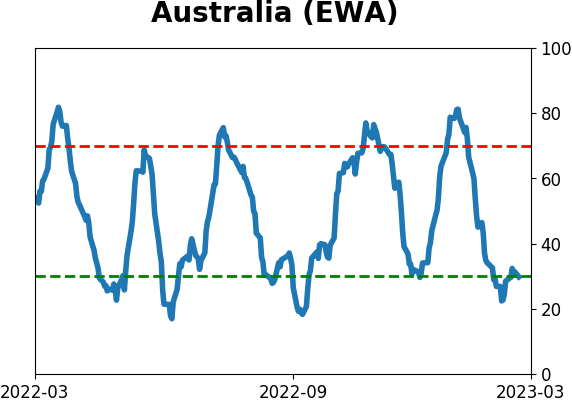
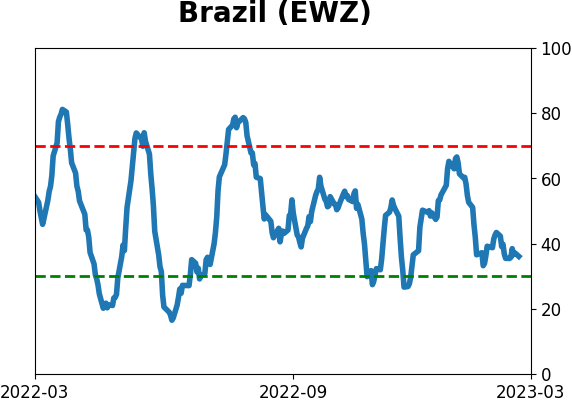
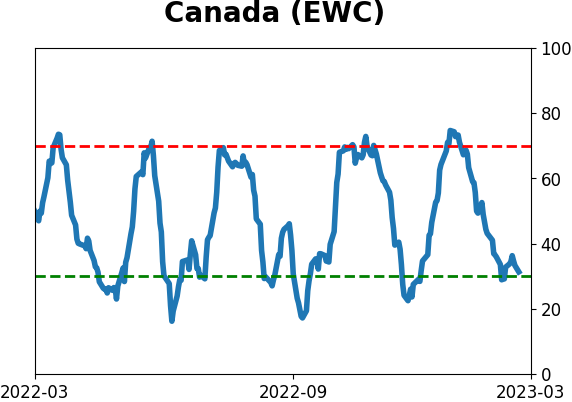
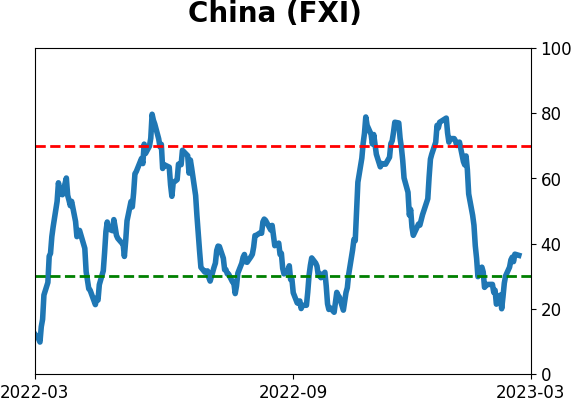
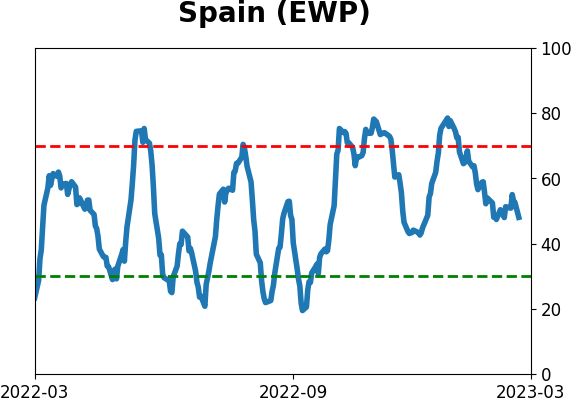
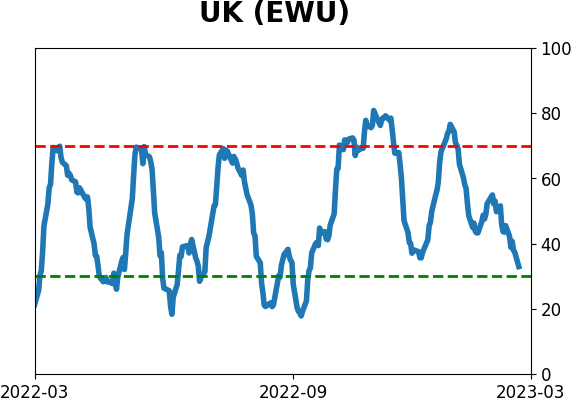
Country ETF's - 10-Day Moving Average
|
|
|
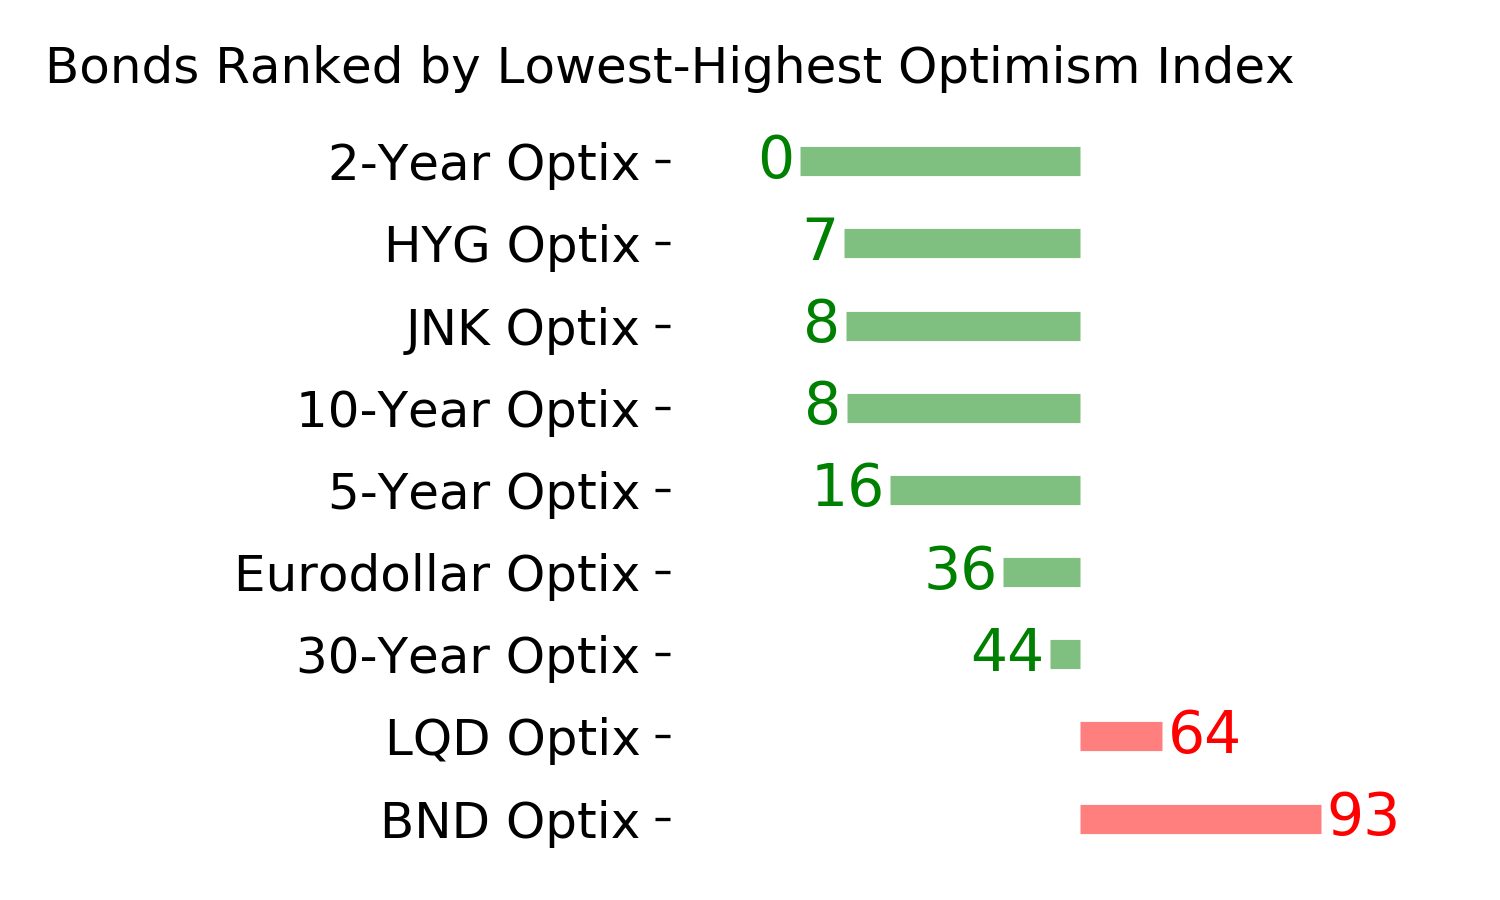
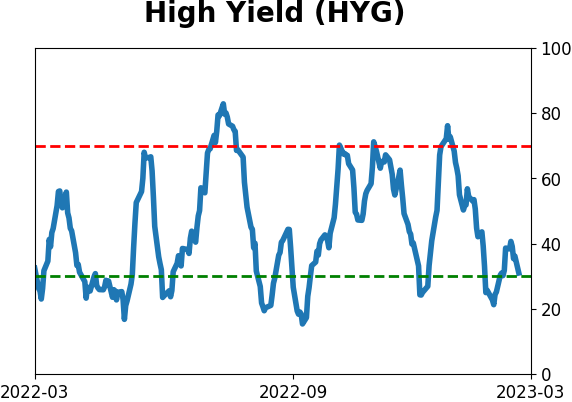
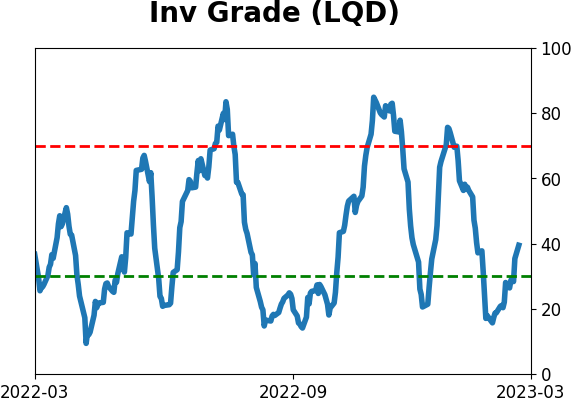
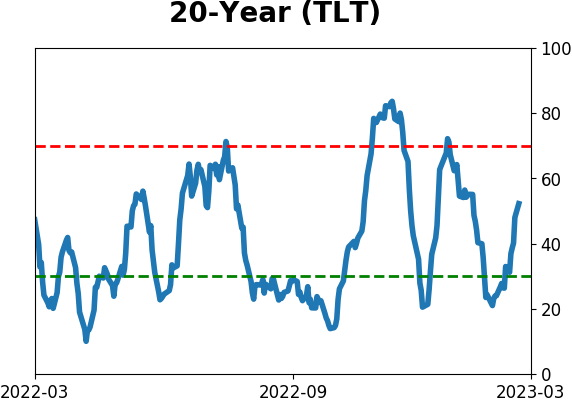
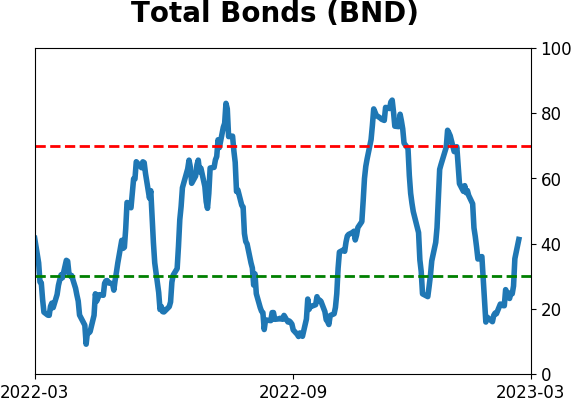
Bond ETF's - 10-Day Moving Average
|
|
|
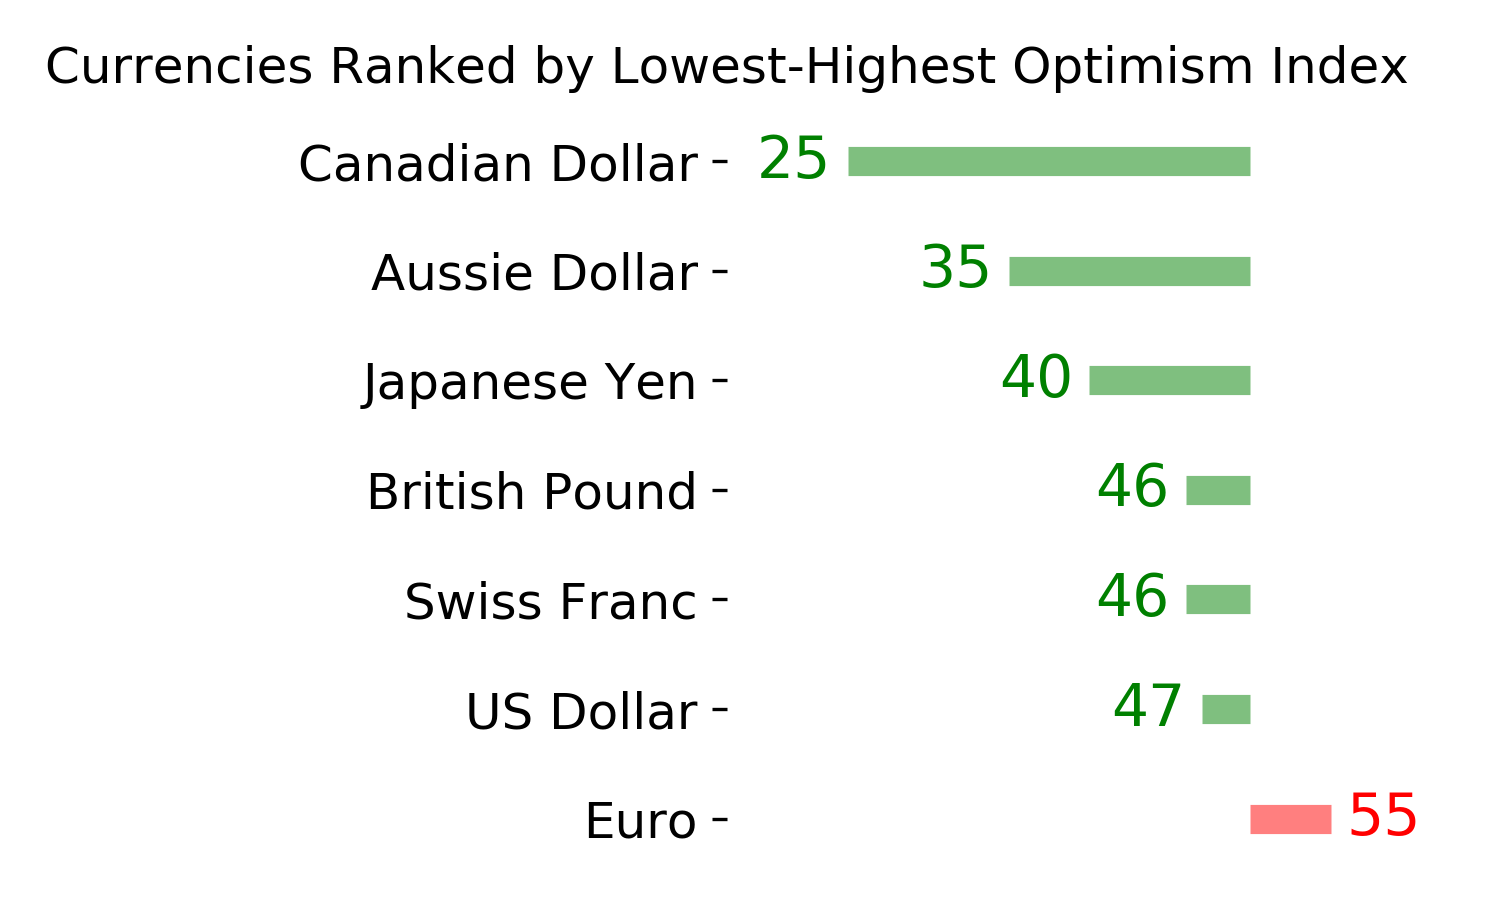
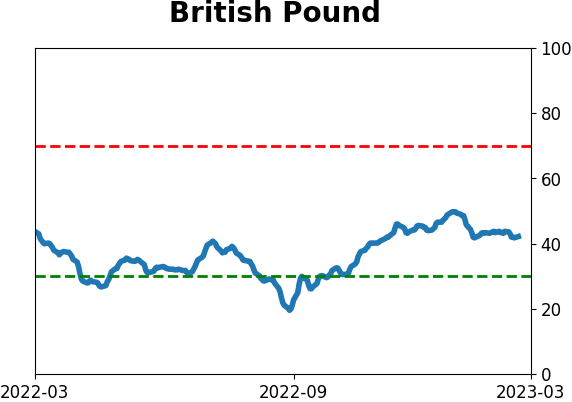
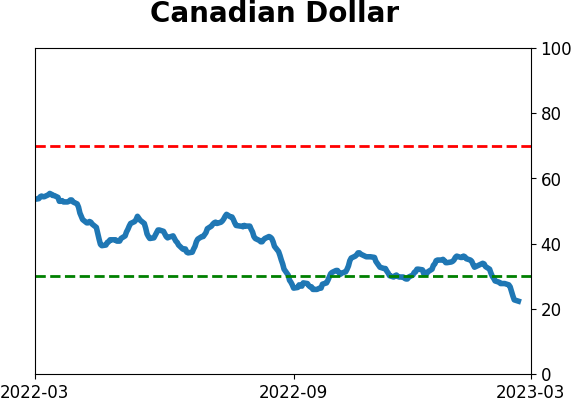
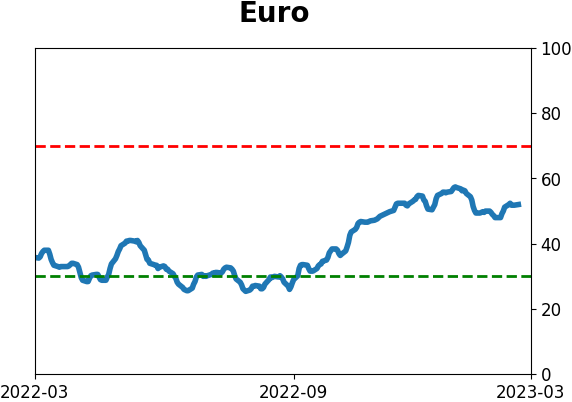
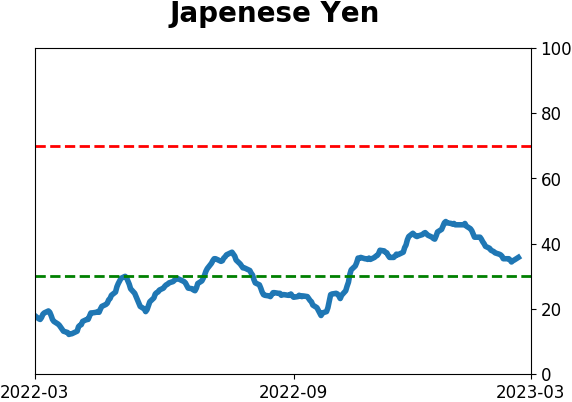
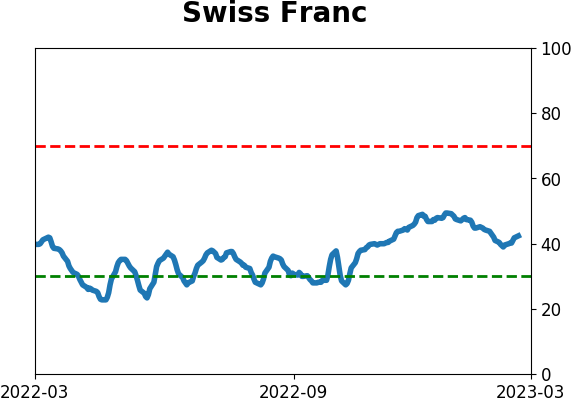
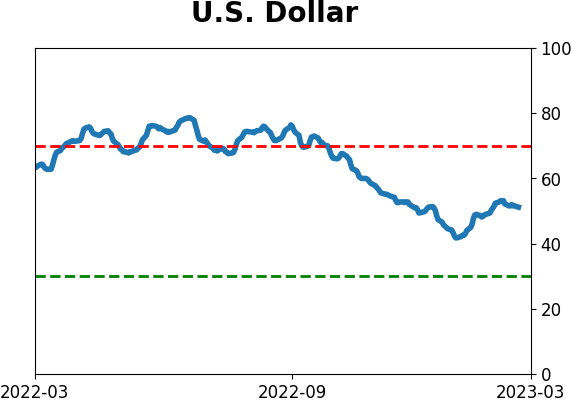
Currency ETF's - 5-Day Moving Average
|
|
|
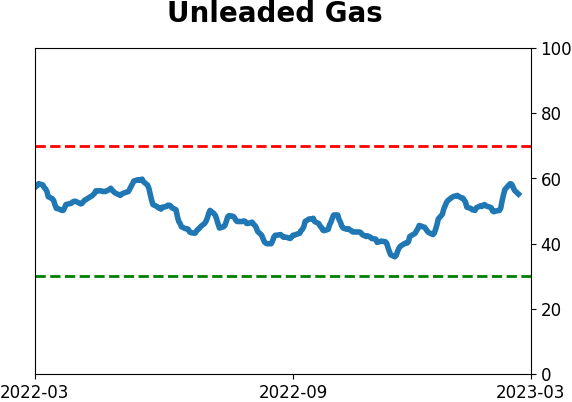
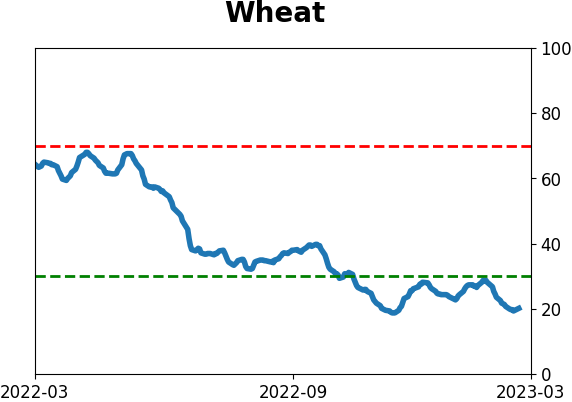
Commodity ETF's - 5-Day Moving Average
|
|