Headlines
|
|
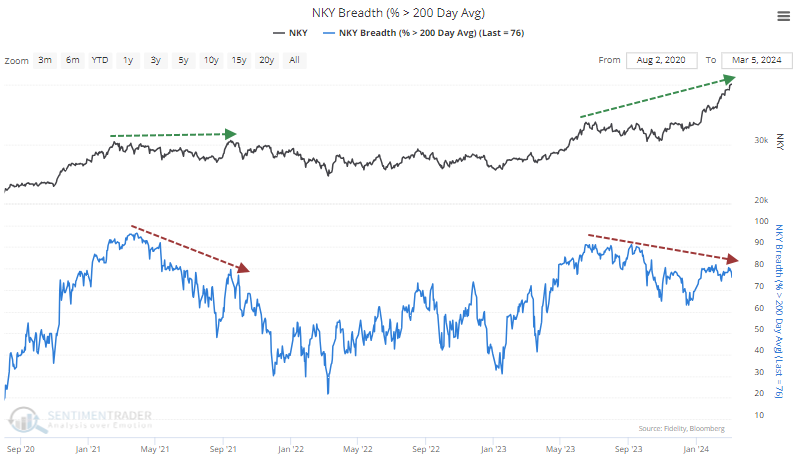
As the Nikkei surged, fewer stocks went along for the ride:
The Nikkei 225 index of Japanese stocks has rallied strongly for weeks. But fewer stocks have been participating in the advance, leading to divergences between the index and many of its breadth indicators. Unlike most U.S. indexes, however, similar behavior tended to precede more gains for the Nikkei.
|
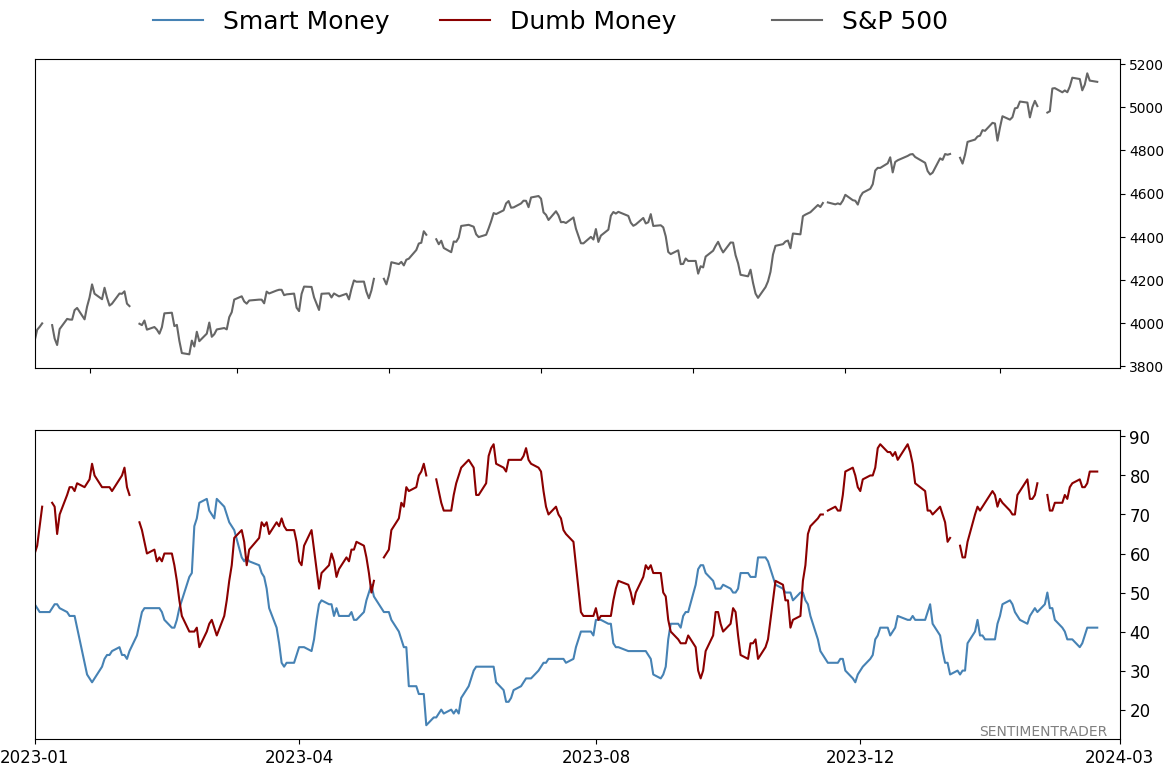
Smart / Dumb Money Confidence
|
Smart Money Confidence: 41%
Dumb Money Confidence: 81%
|
|
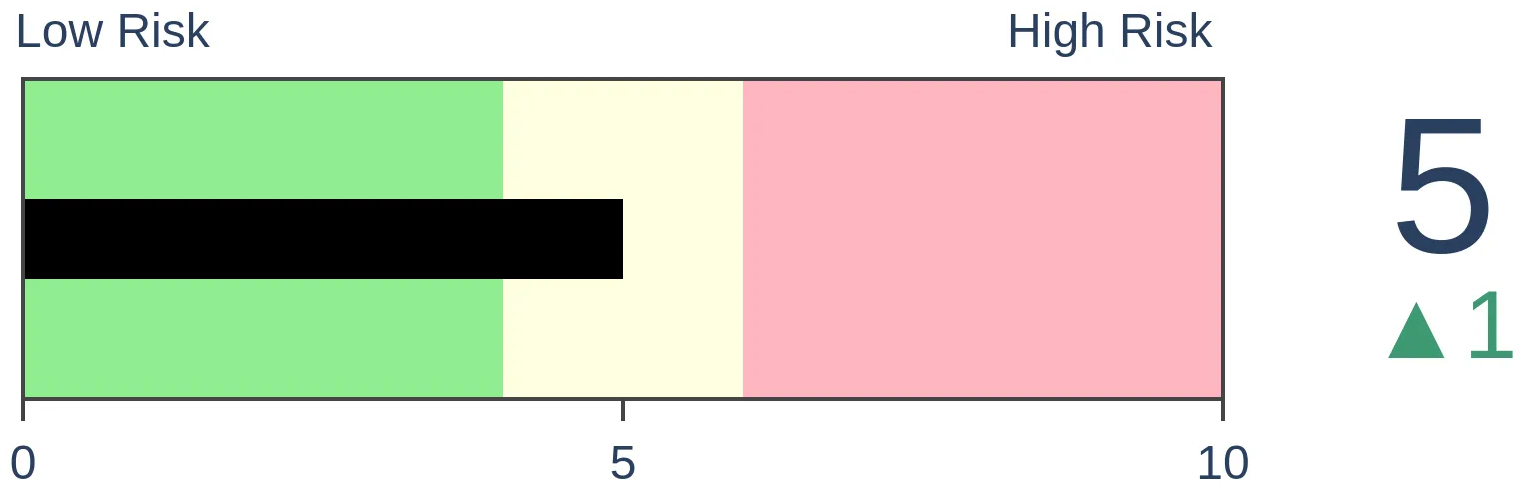
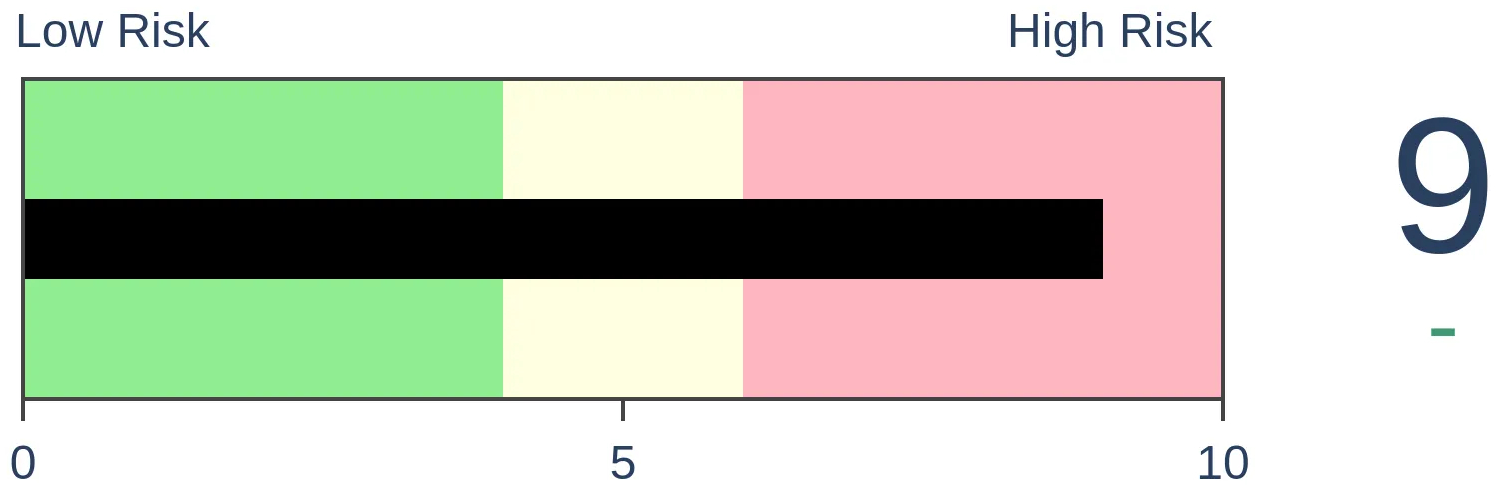
Risk Levels
Stocks Short-Term
|
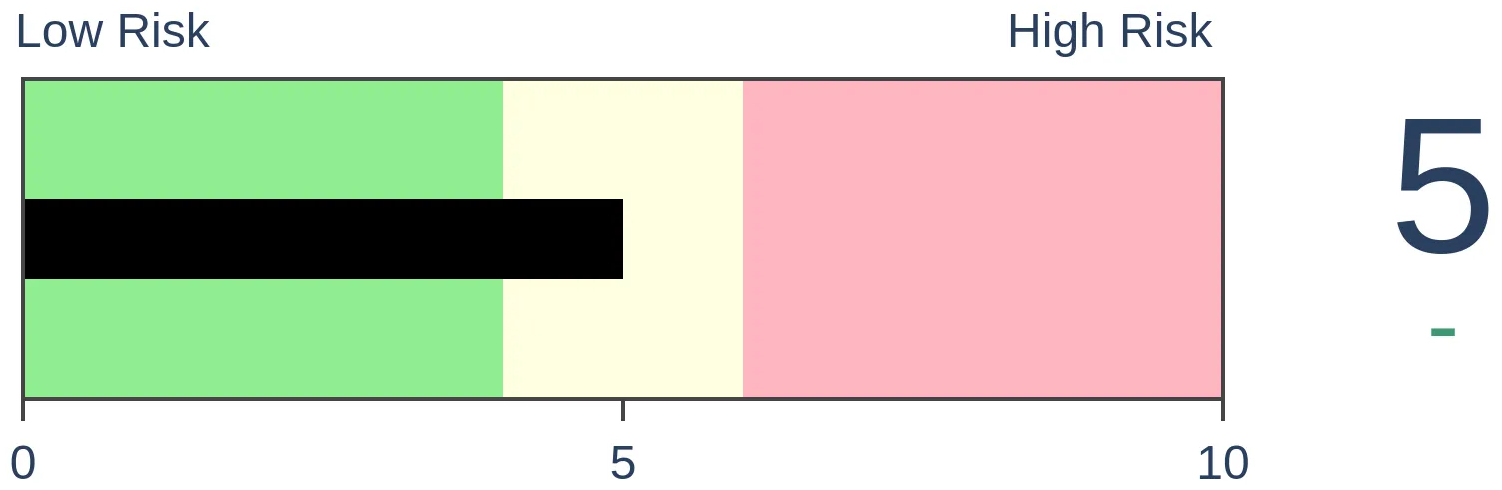
Stocks Medium-Term
|
|
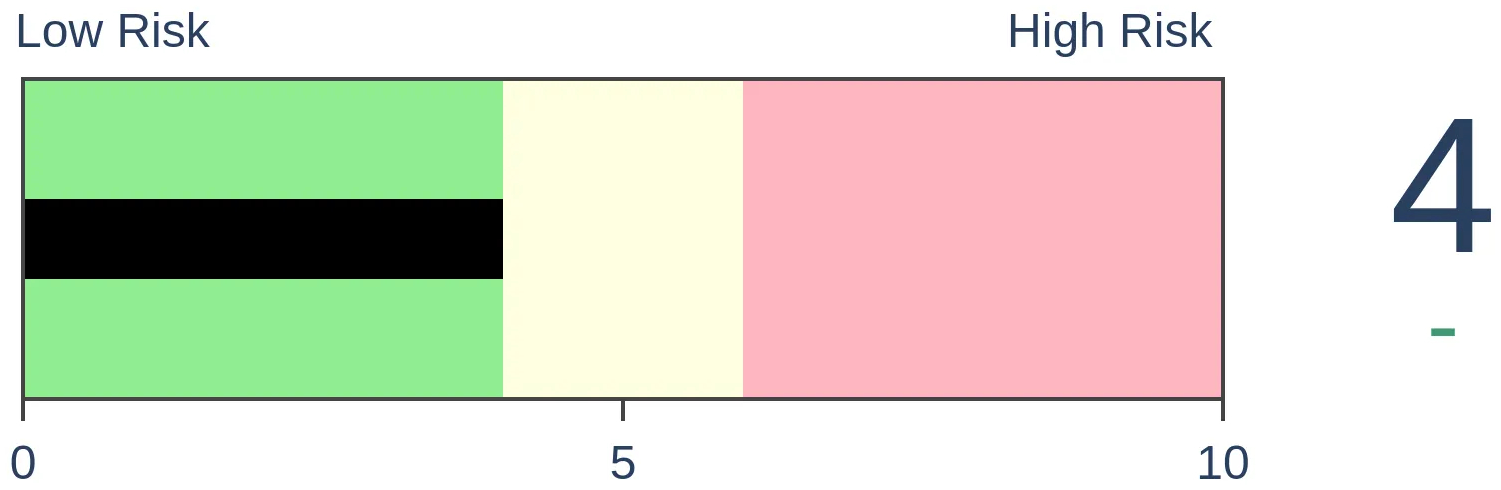
Bonds
|
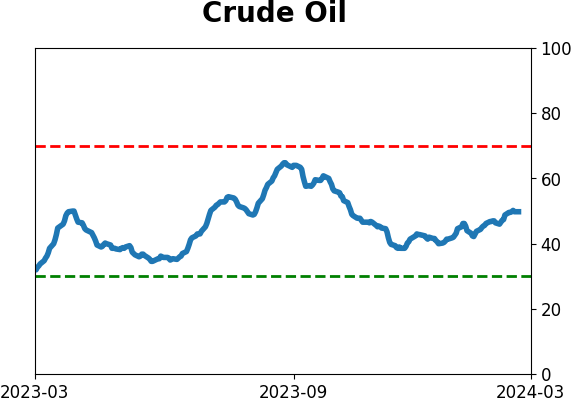
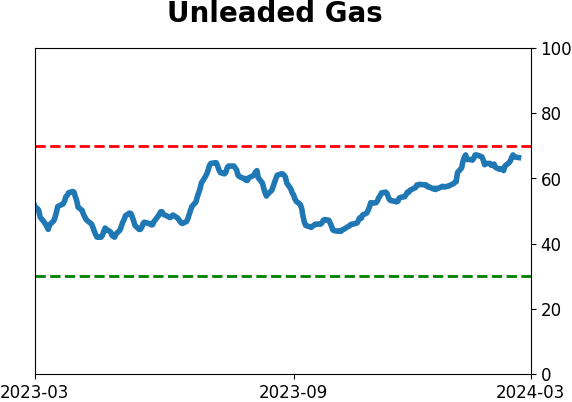
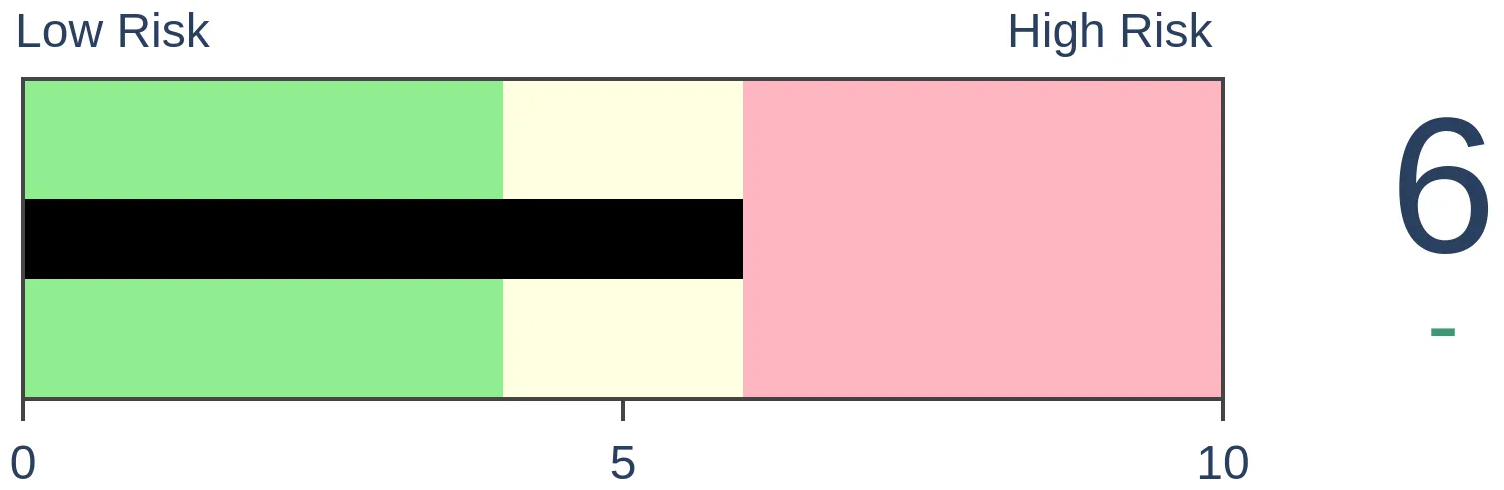
Crude Oil
|
|
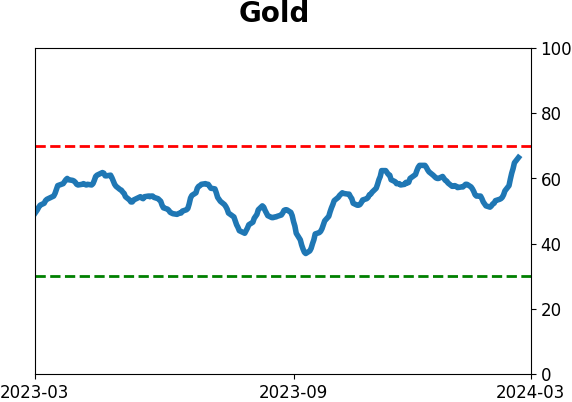
Gold
|
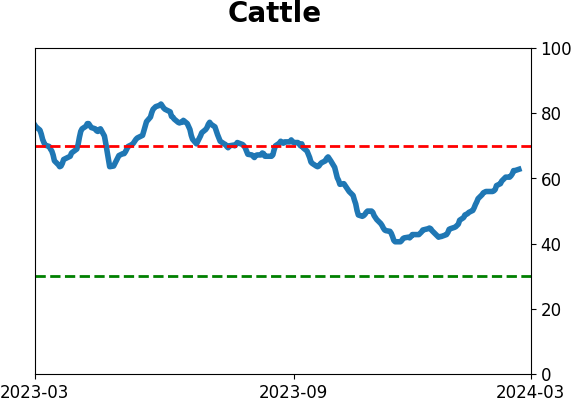
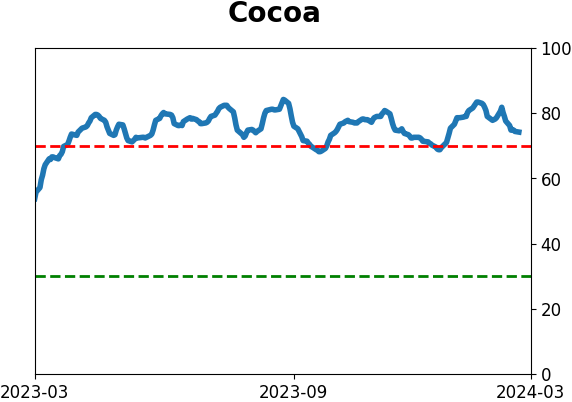
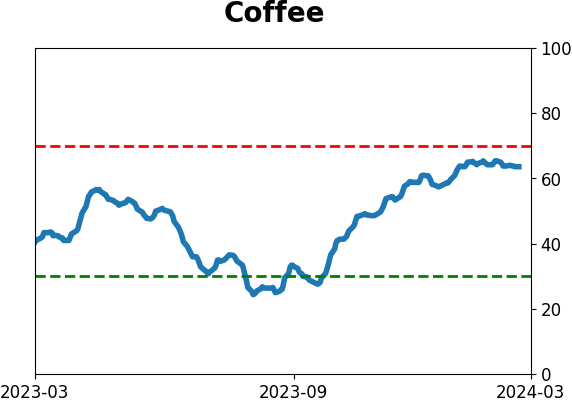
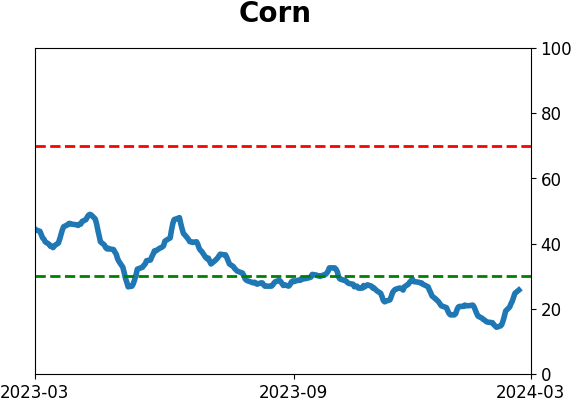
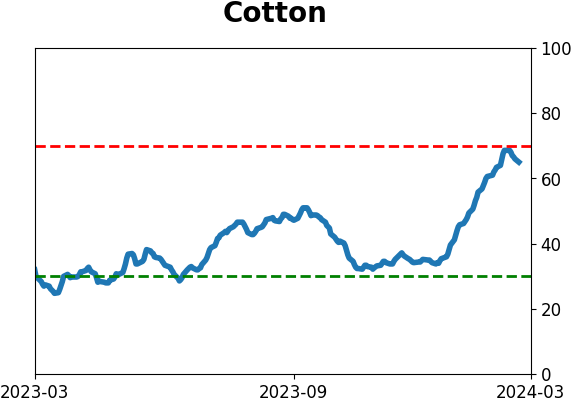
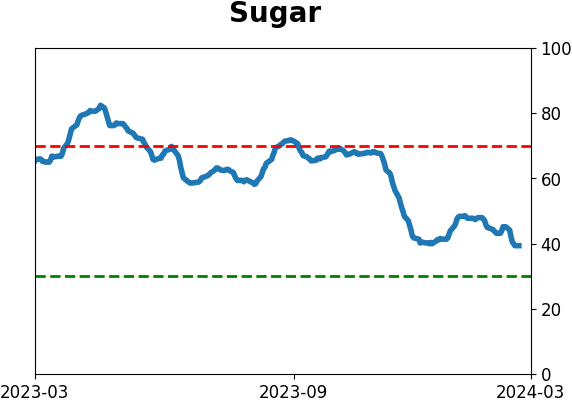
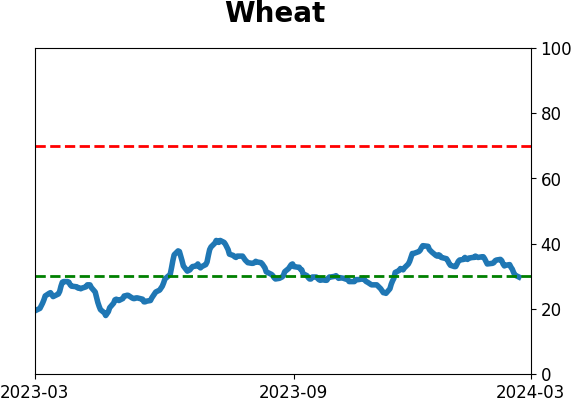
Agriculture

|
|
Research
By Jason Goepfert
BOTTOM LINE
The Nikkei 225 index of Japanese stocks has rallied strongly for weeks. But fewer stocks have been participating in the advance, leading to divergences between the index and many of its breadth indicators. Unlike most U.S. indexes, however, similar behavior tended to precede more gains for the Nikkei.
FORECAST / TIMEFRAME
None
|
Key points:
- Japan's Nikkei 225 index has been on a nice run, but fewer stocks are participating
- Divergences in some breadth metrics are stark and rarely seen over the past 25 years
- Unlike many U.S. indexes, however, similar breadth divergences did not consistently precede weakness for the Nikkei
Fewer Japanese stocks are holding their long-term uptrends as the Nikkei surges
One of the most celebrated breakouts, among many this year, is the Nikkei 225. The Japanese market index broke above 40,000 for the first time, marking the end of a very long slog in a drawdown.
It's a bit curious that not as many stocks are participating in the advance as bulls might hope.
Divergences between an index and its constituent stocks can be resolved either by dragging the index lower or the index pulling the stocks higher. In theory, that can't happen; in practice, it's a handy heuristic. Basically, we just look to see whether divergences tend to be successful warnings or not.
In the Nikkei, the answer is usually "not."
When the Nikkei pushed to a 52-week high late in 2021, fewer stocks within the index were trading above their long-term 200-day moving averages than earlier in the year. That divergence was a successful warning that something odd was afoot. This time, the breakout has been much more persistent, but we're still not seeing as many stocks in uptrends as earlier in 2023.
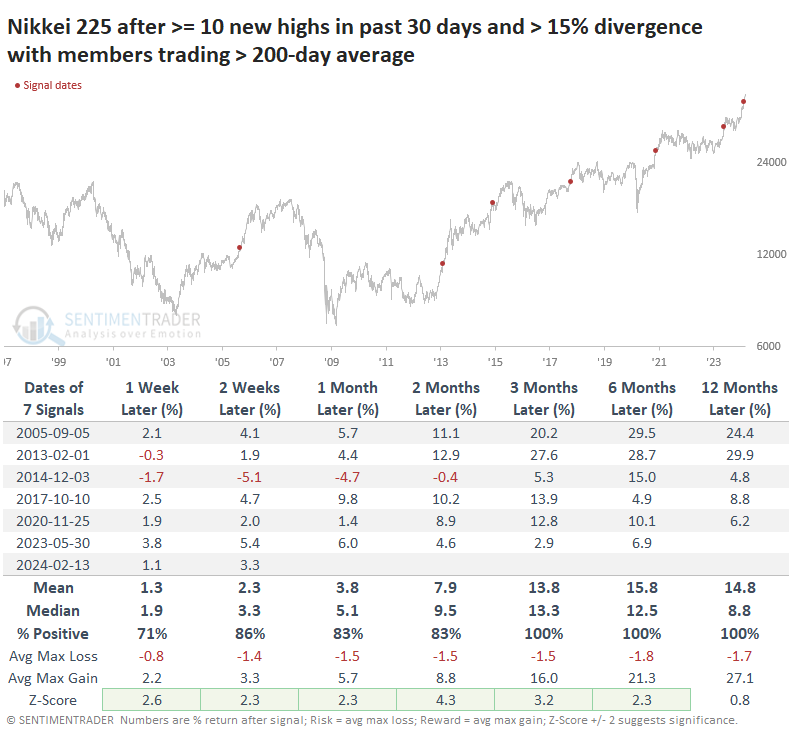
The table below shows every time in the past 25 years when the Nikkei closed at a 52-week high for at least ten sessions out of the past thirty. During that stretch, the percentage of stocks above their 200-day averages was at least 15% below the peak reading over the past year - bearish divergences.
So much for "bearish"...these divergences resolved in the upward direction of the index each time over the next 3-12 months. None of them preceded a substantial drawdown for the Nikkei.
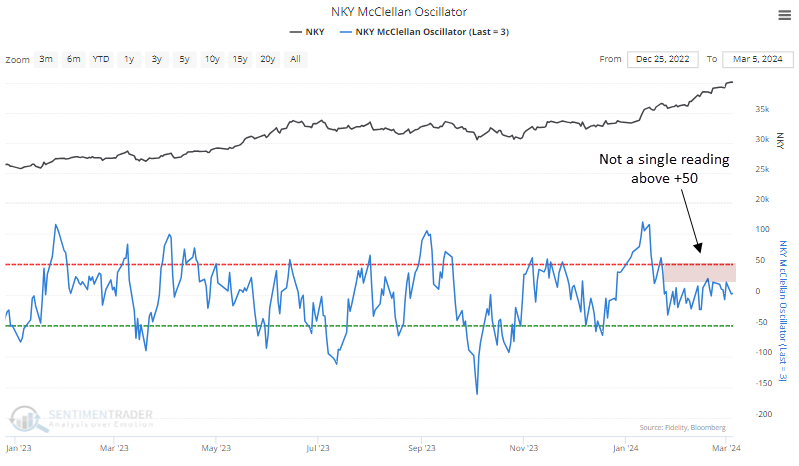
Internal momentum hasn't spiked at all
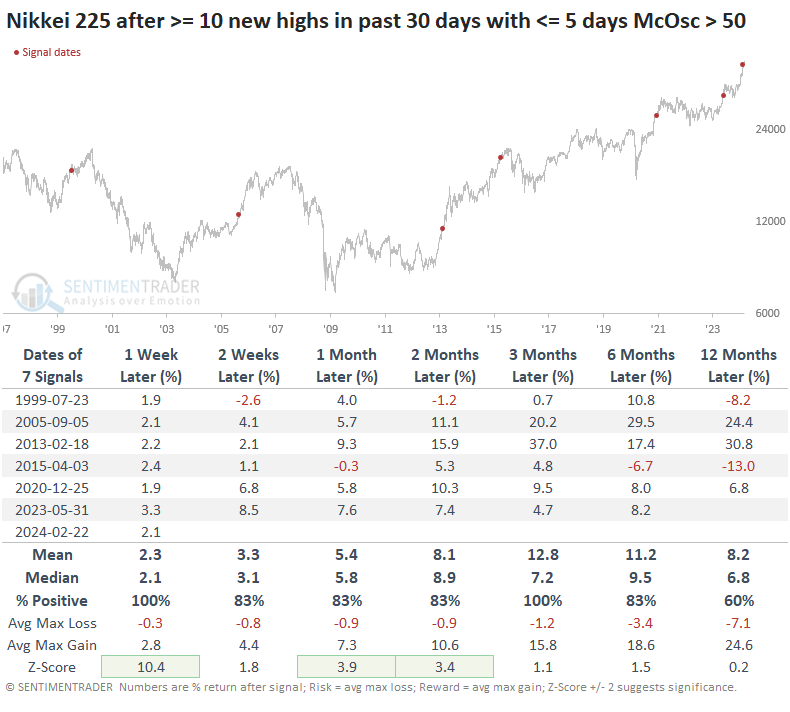
Even more oddly, during this run over the past thirty days, the McClellan Oscillator hasn't poked above +50 even once. Not even close. This is highly atypical for a move like the Nikkei has enjoyed over the past month+.
There were only three other times something similar happened, and all three scored more gains over the next several months. The last signal, from 2015, did end up rolling over within the next six months but not before chopping higher for several months.
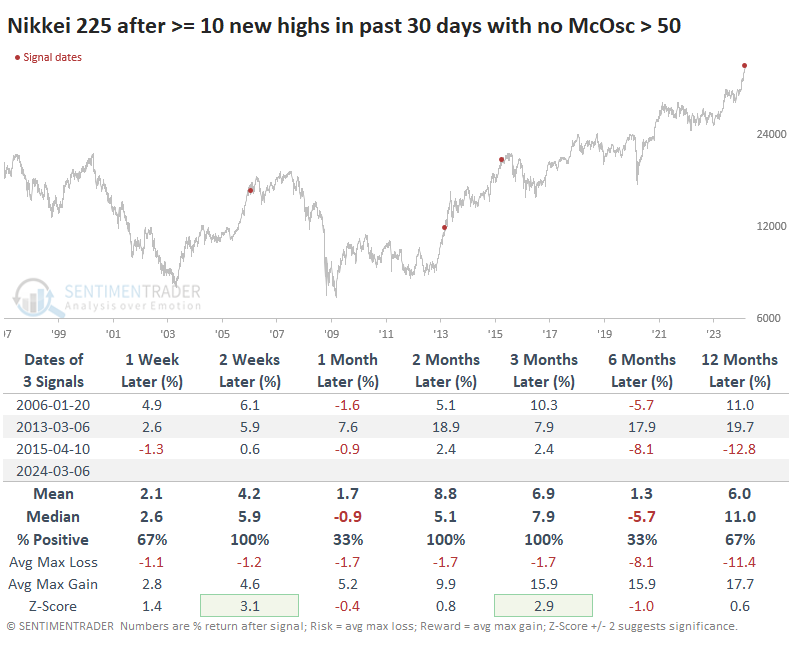
When we try to get a larger sample size by relaxing the parameters, we can see that this situation is still highly unusual. Even if there were five or fewer days with a McOsc above +50, we still get only seven instances. And all of those still preceded more gains over the next three months.
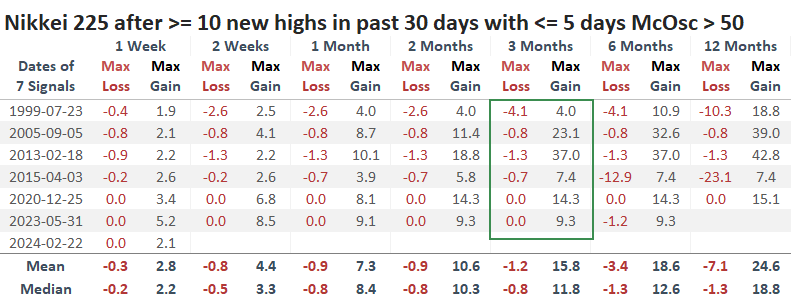
The table of maximum gains and losses across time frames shows that during the next three months, the Nikkei never suffered a loss more than -4.1% after any of the seven signals while rallying an average of nearly +12% at some point during those same stretches.
What the research tells us...
When a broad index rallies like the Nikkei has done, for as long as it has, it often pays to look at the breadth metrics for that index to see if most of the component stocks are going along for the ride. When they don't, it usually precedes some trouble for the index.
There are signs of negative divergences like this for the Nikkei, but that index has acted differently than we usually see among U.S. indexes. Rather than the index "catching down" to the divergences, it has typically resolved the trouble by rising even further. The sample sizes of similar behavior are awfully small, which makes it hard to have high confidence in the conclusions. Still, there's at least some evidence that a lack of participatory momentum under the surface of that index may not necessarily be a good reason to sell for anything more than a garden variety pullback.
Indicators at Extremes
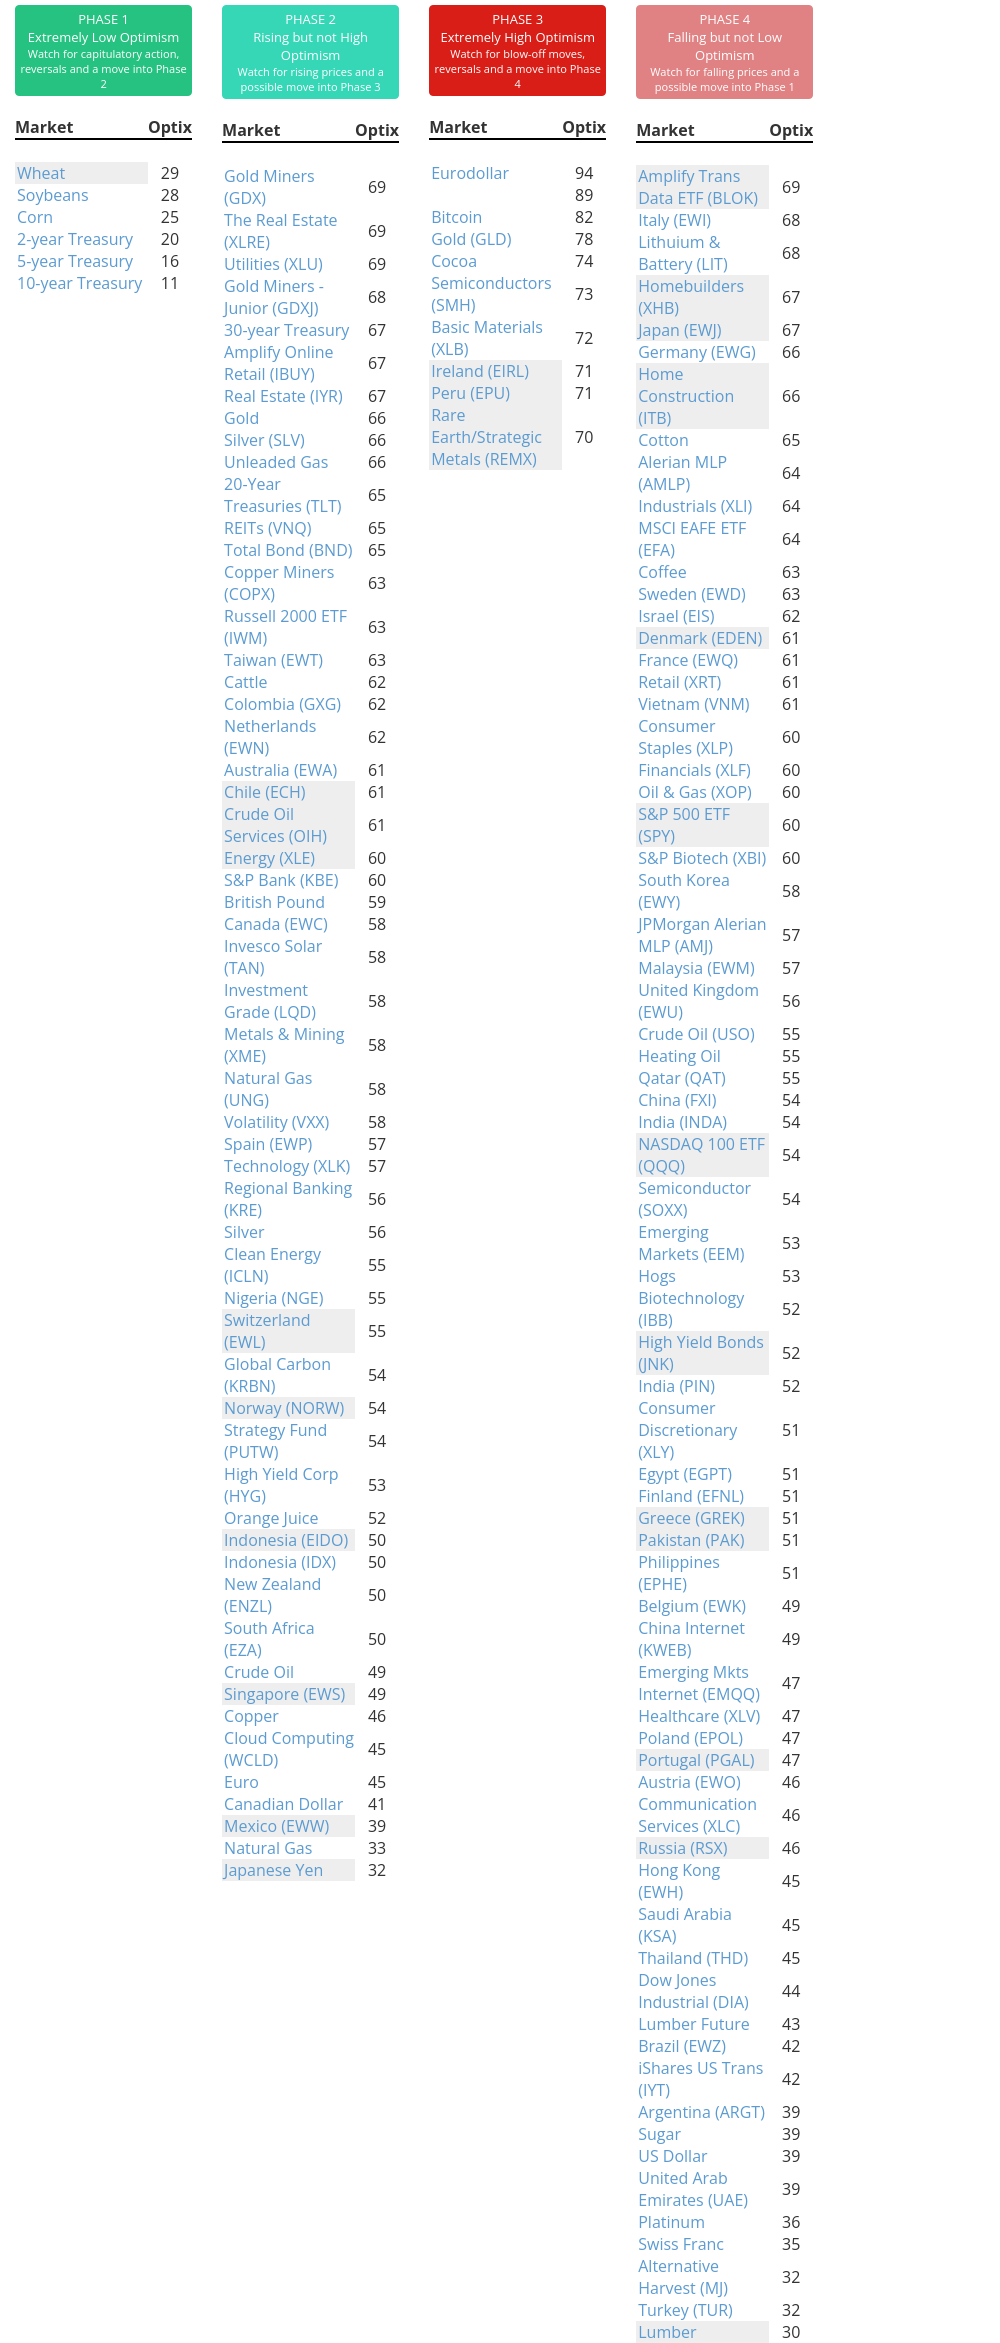
Phase Table
Ranks
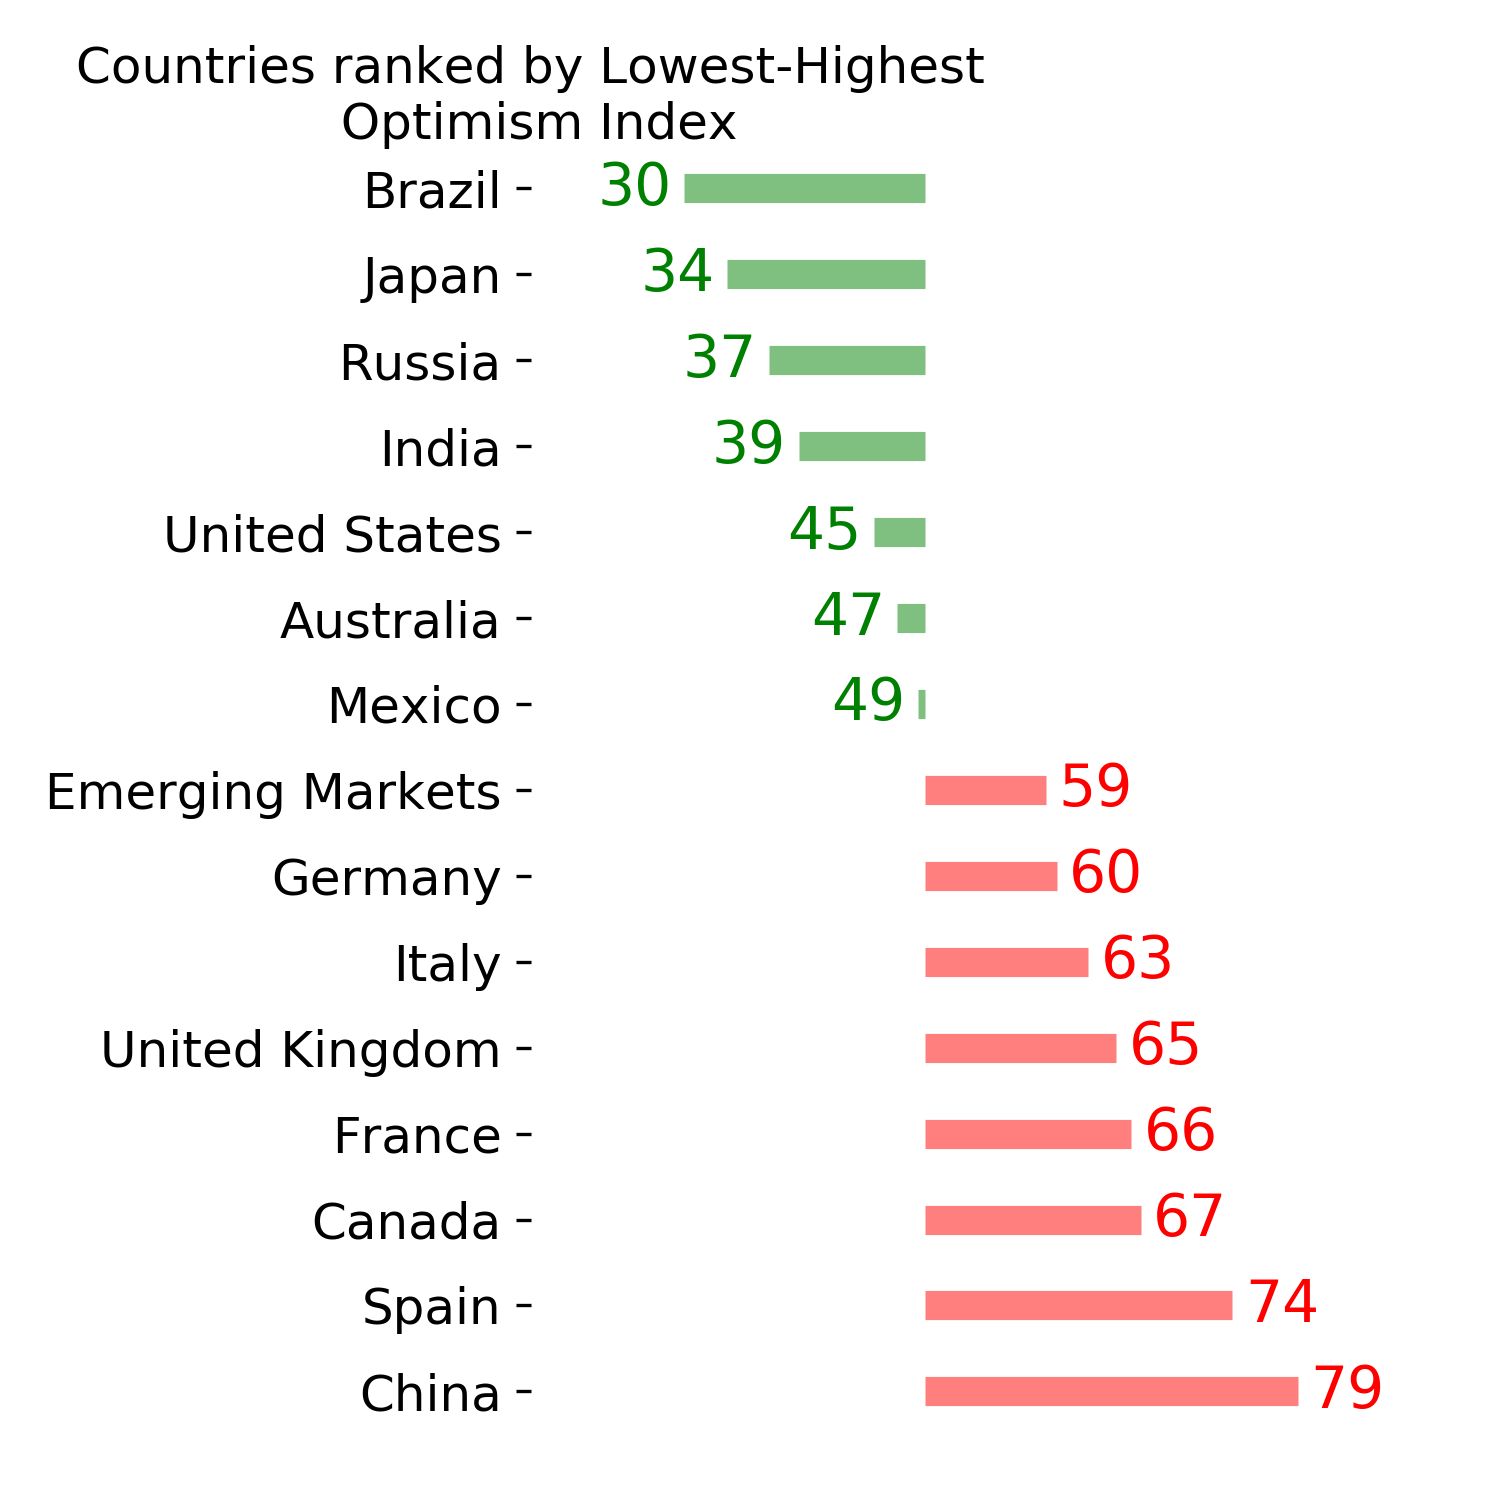
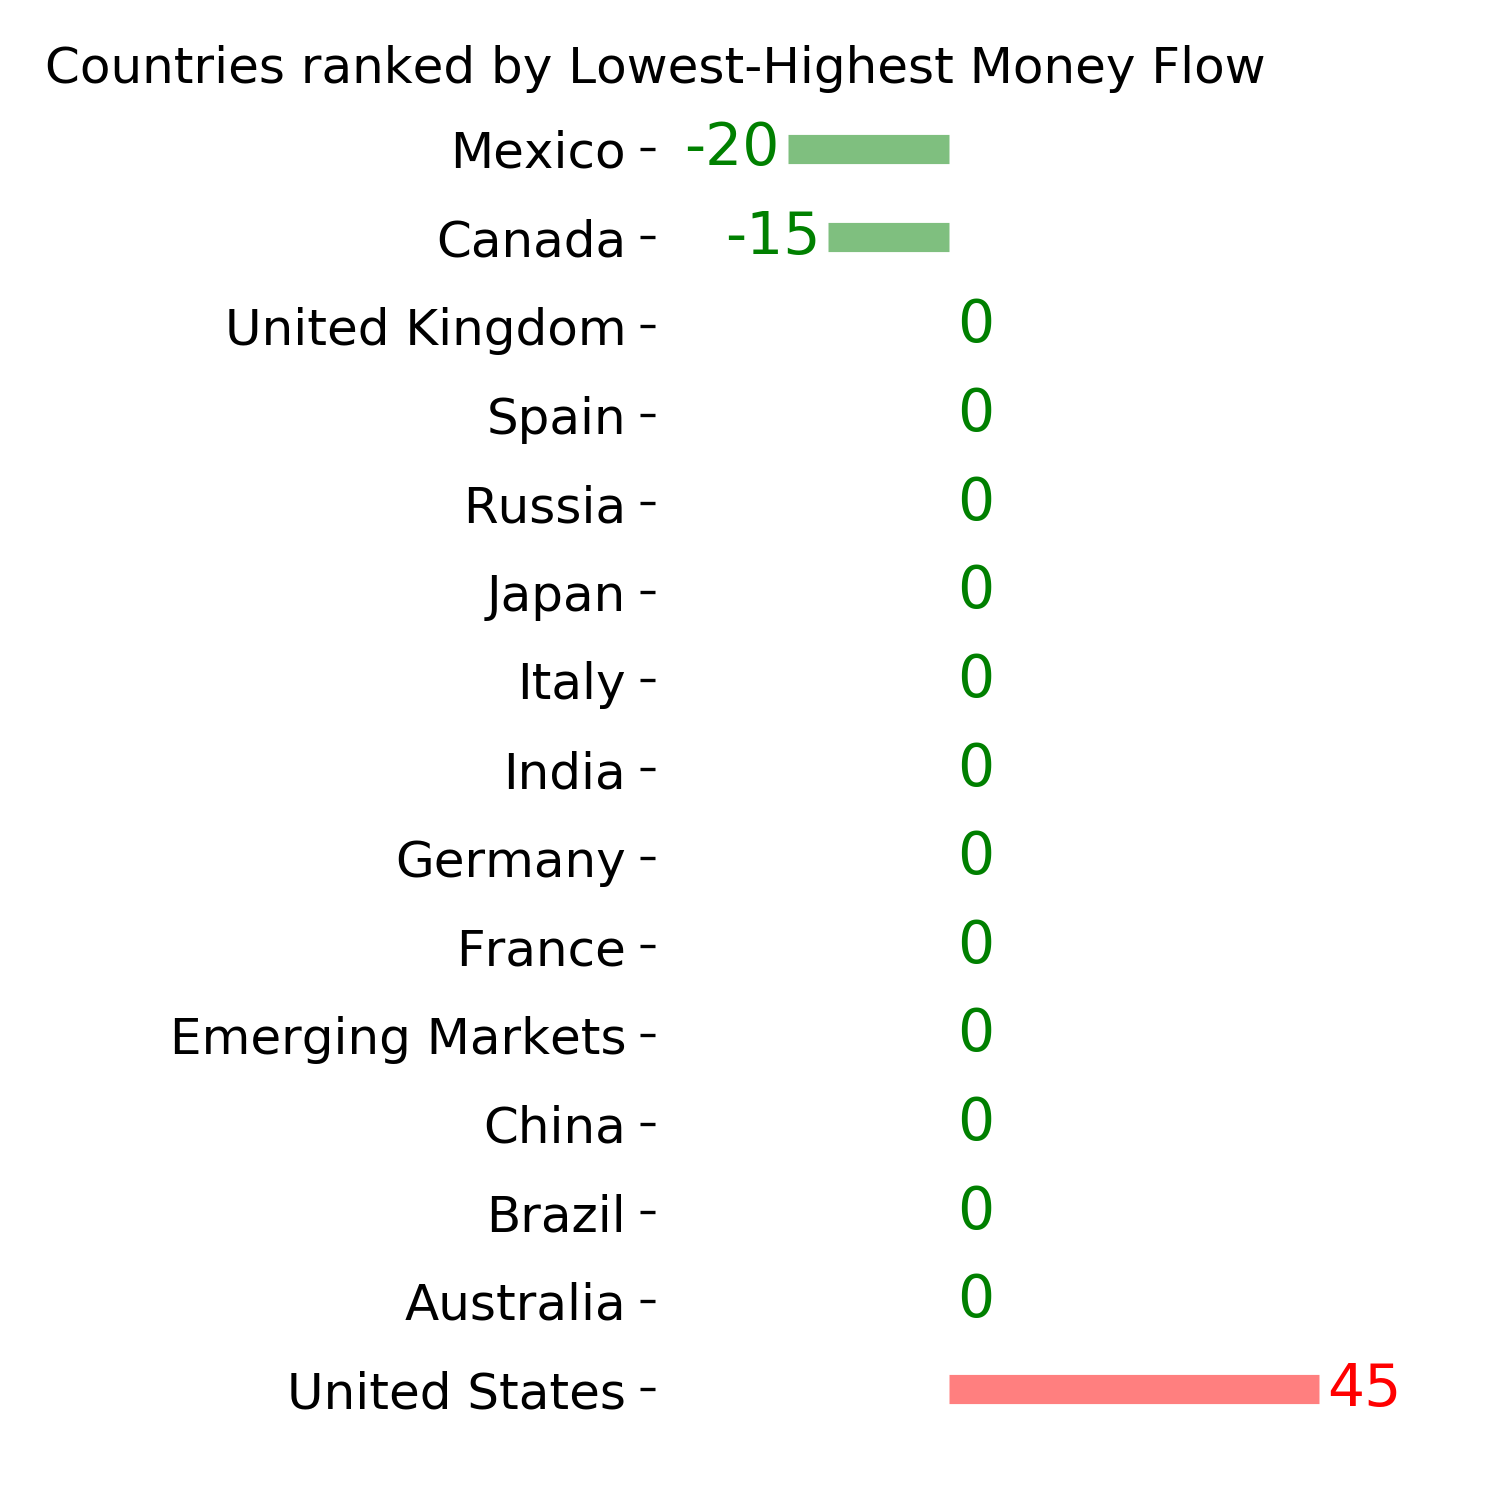
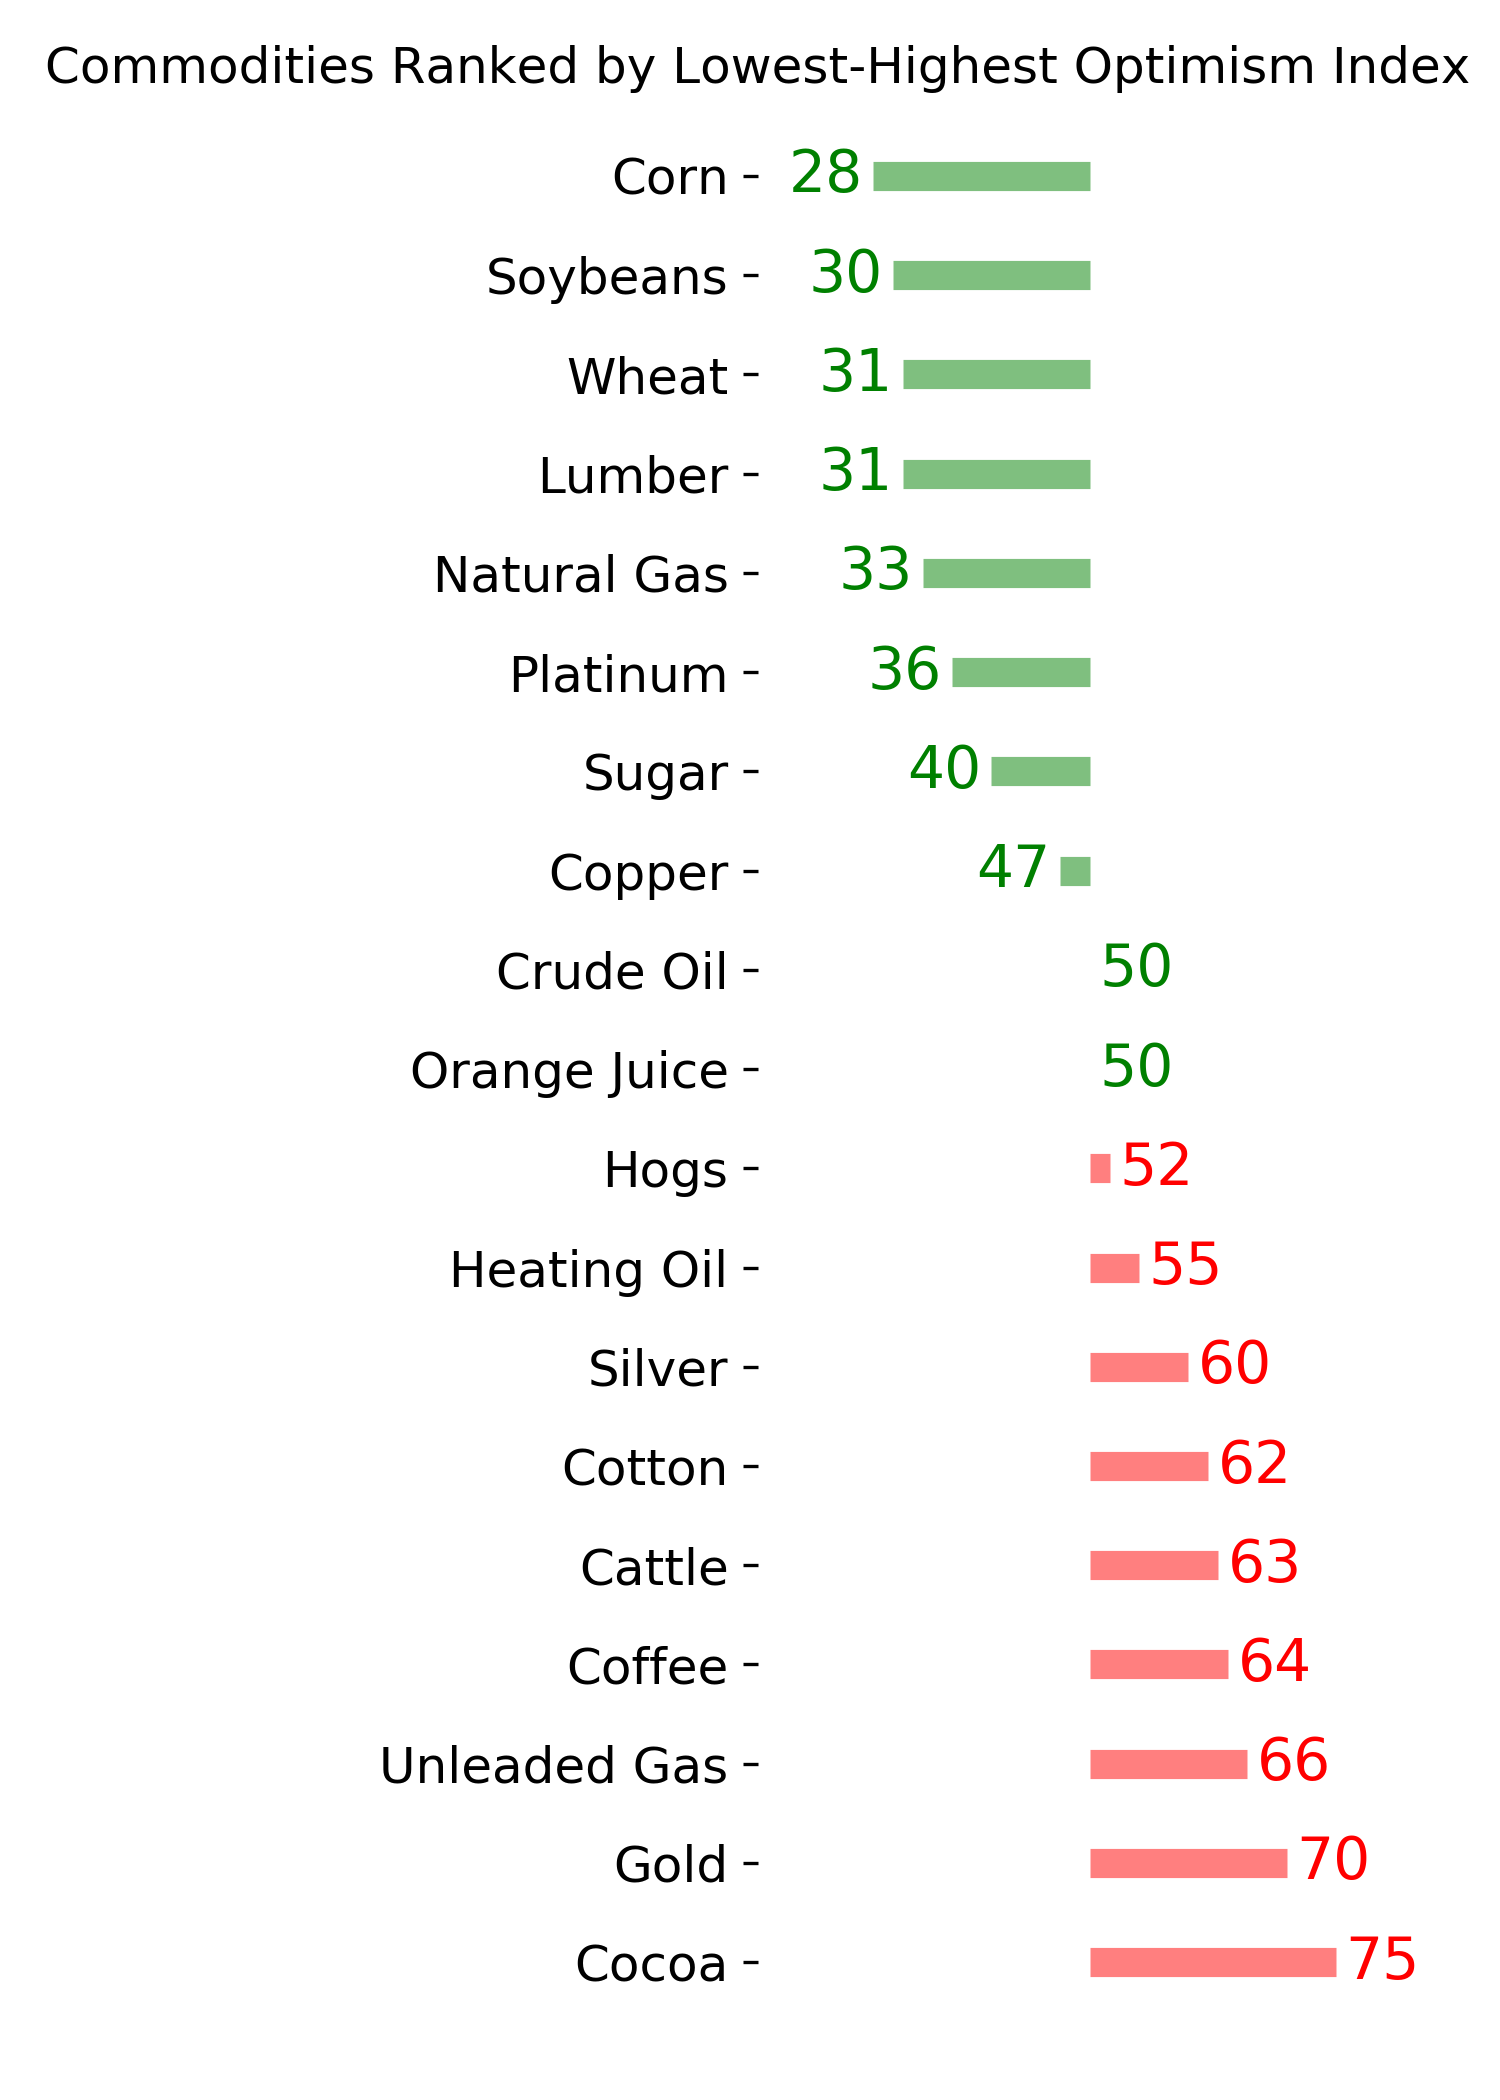
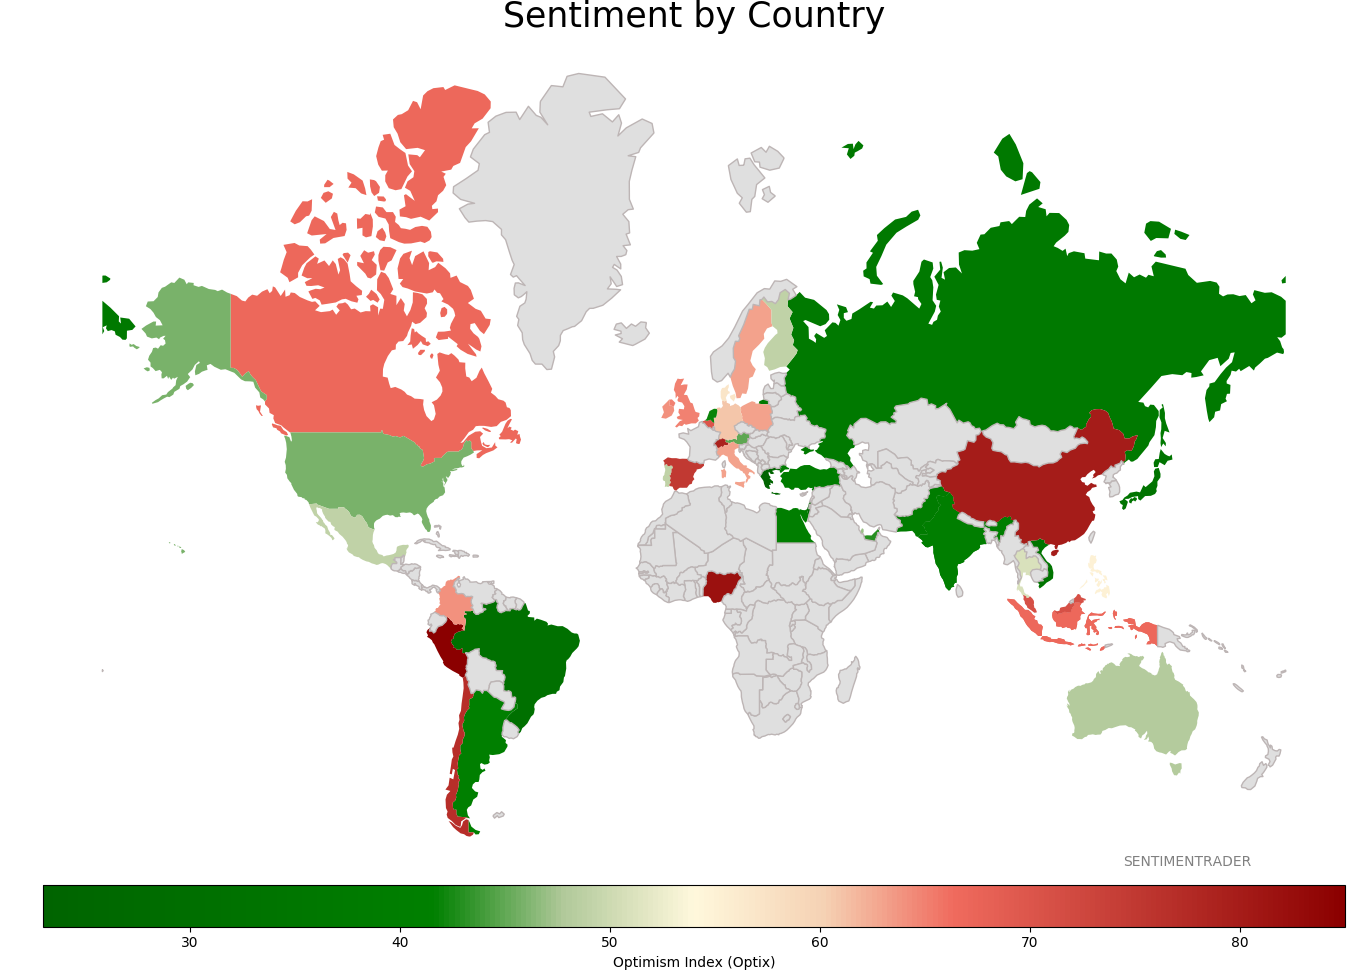
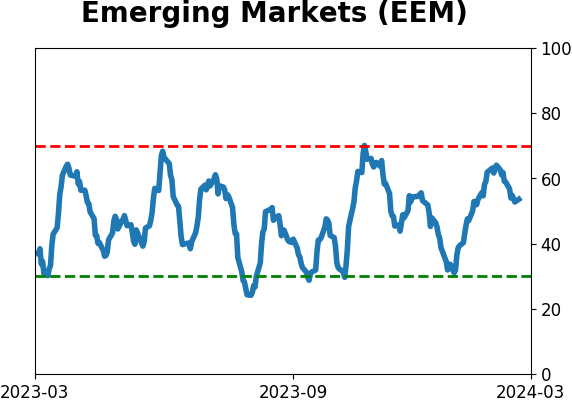
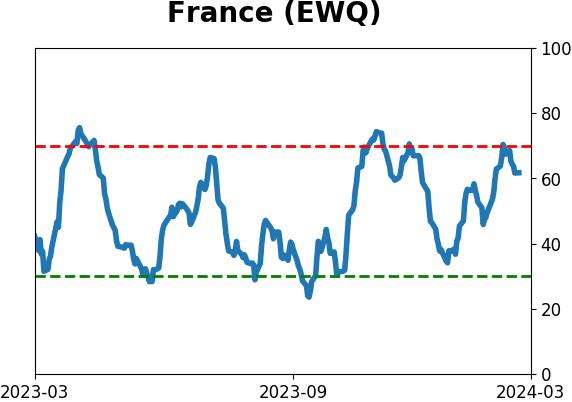
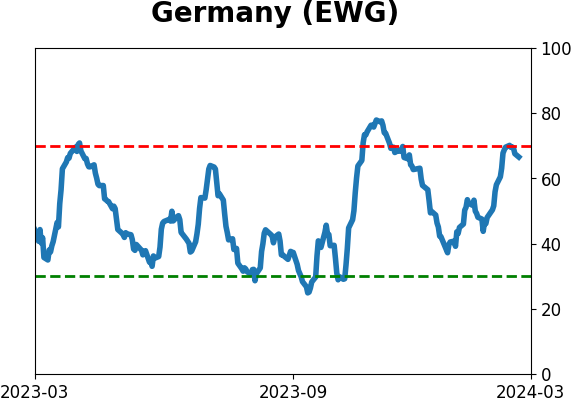
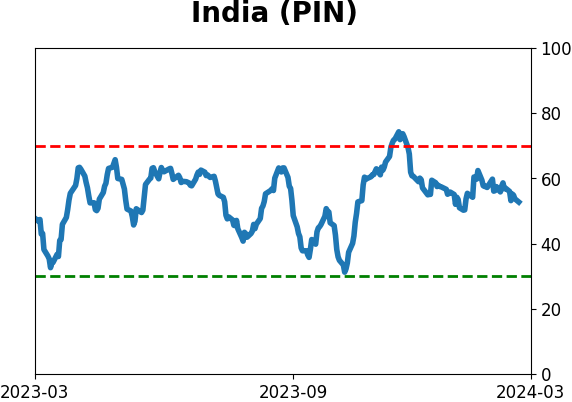
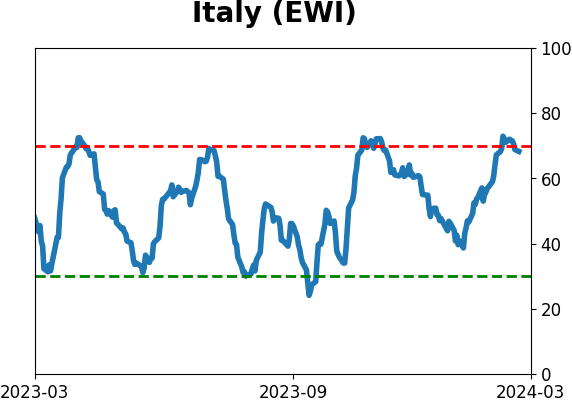
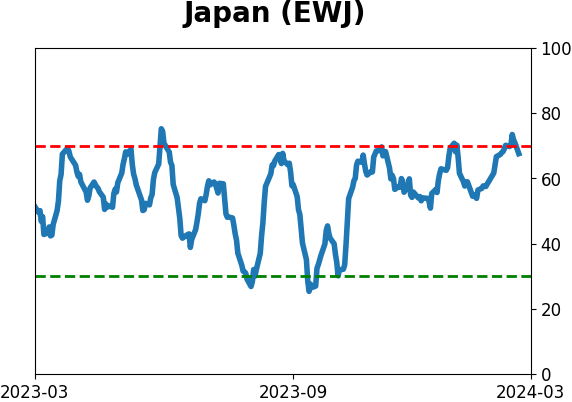
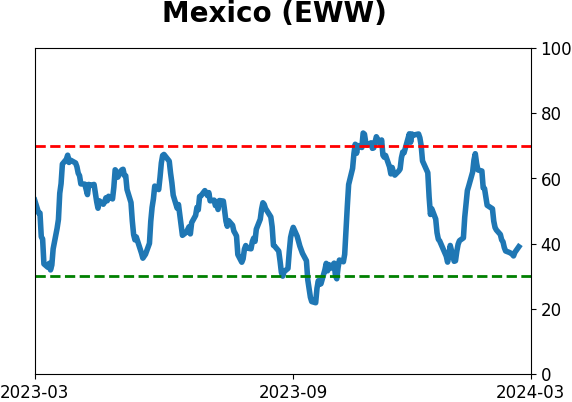
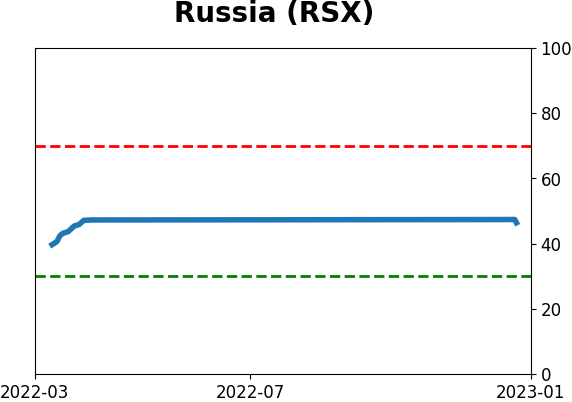
Sentiment Around The World
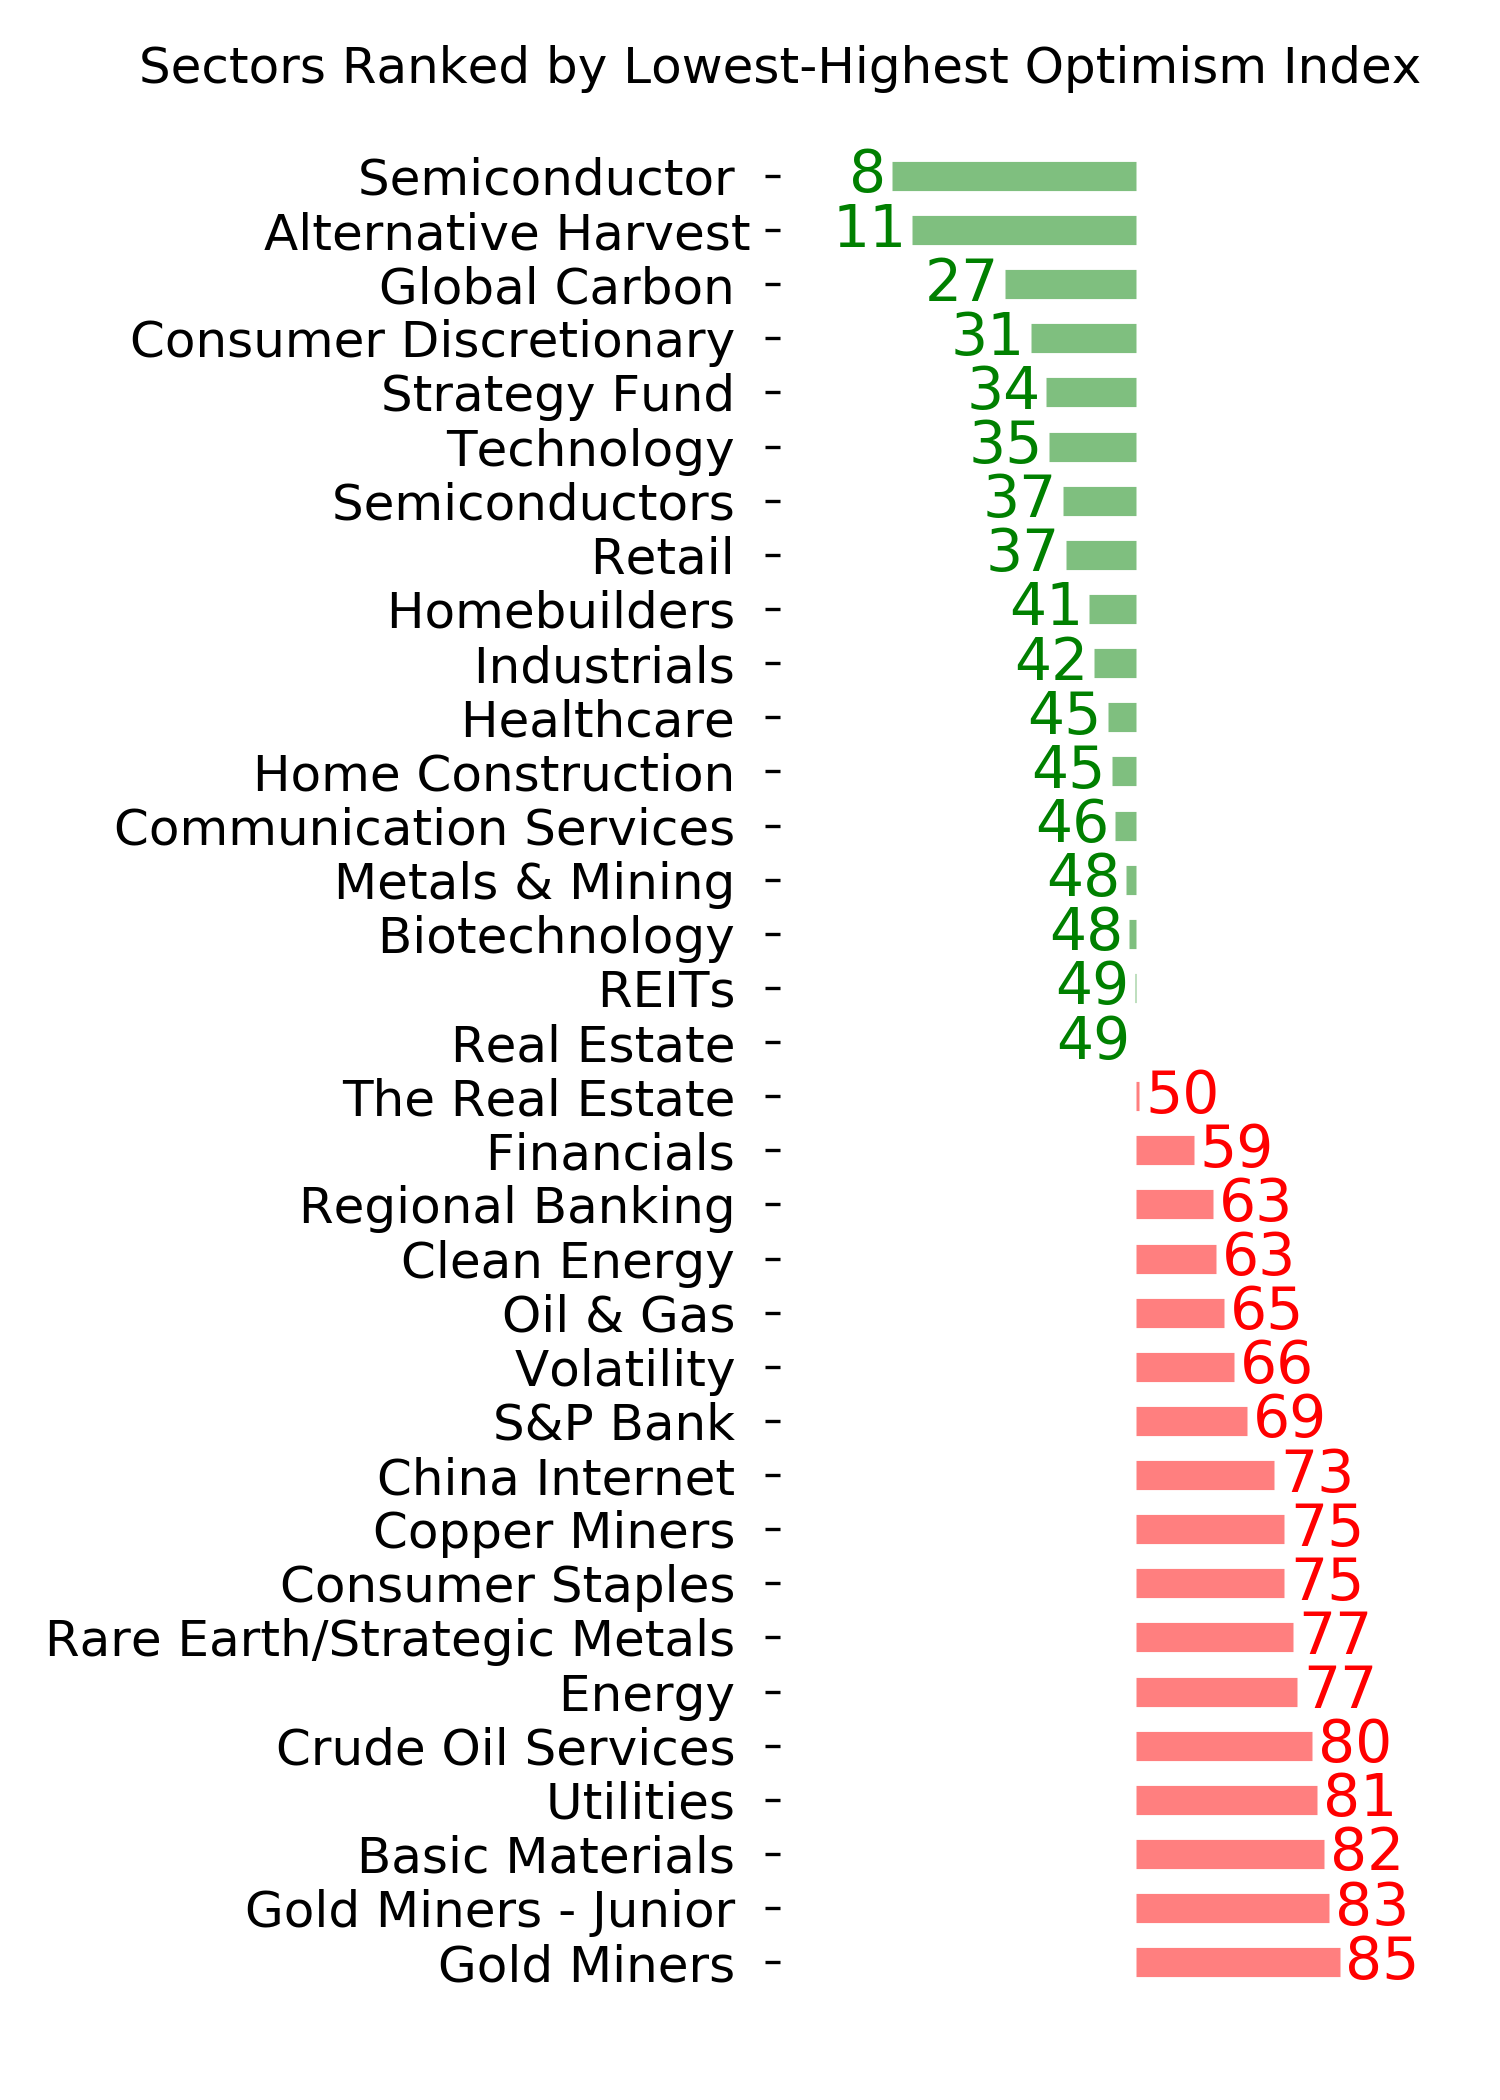
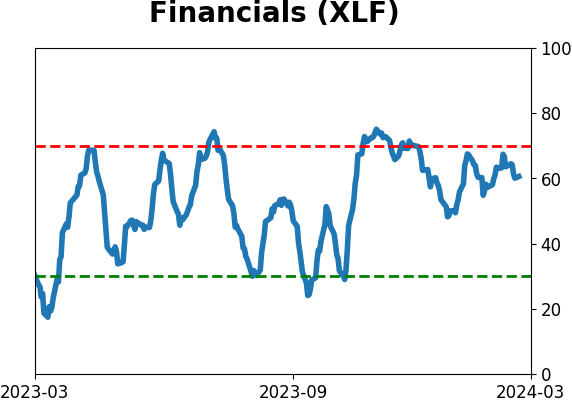
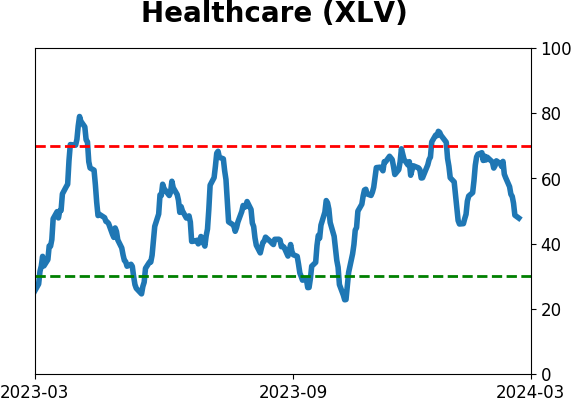
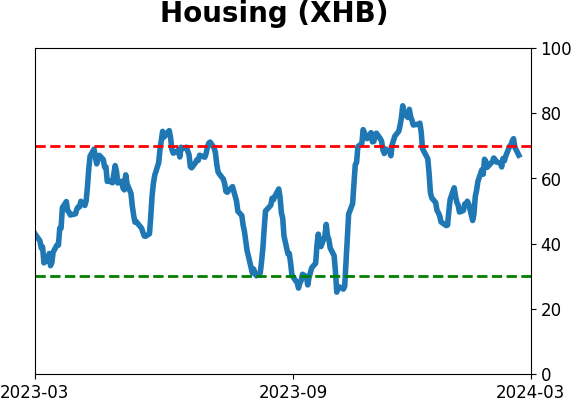
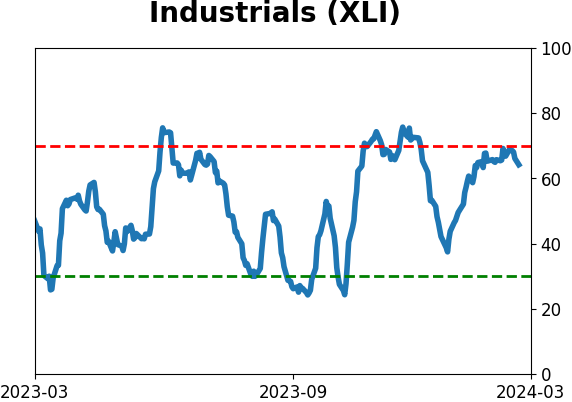
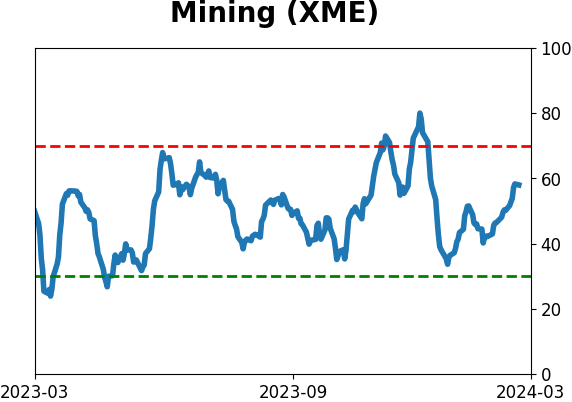
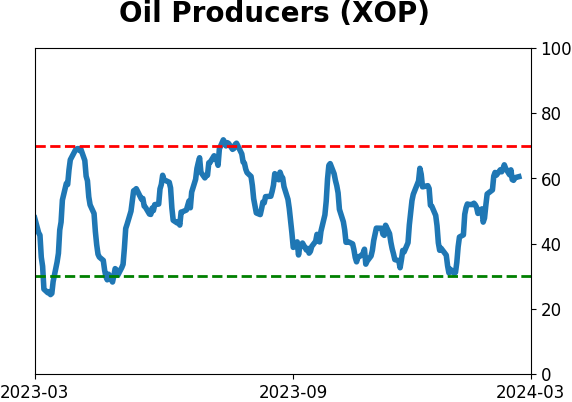
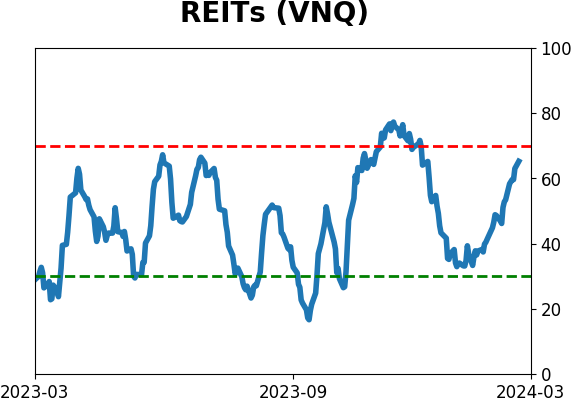
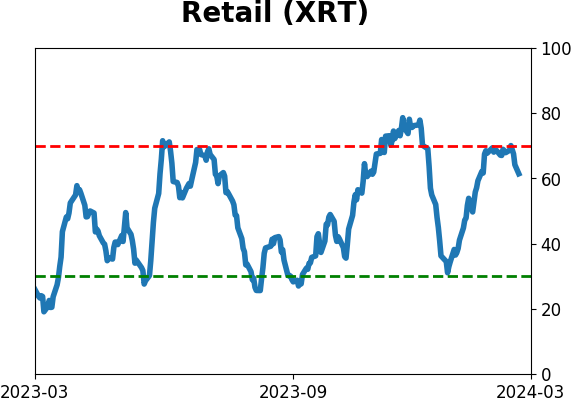
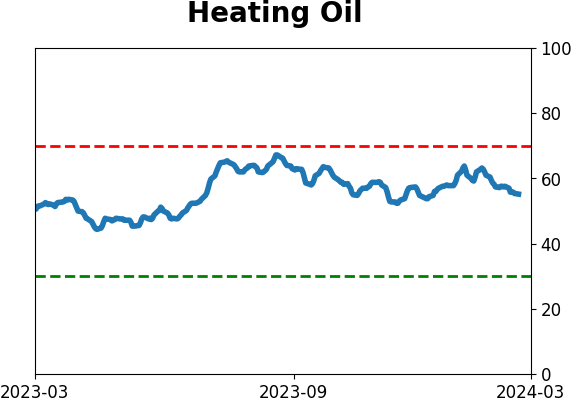
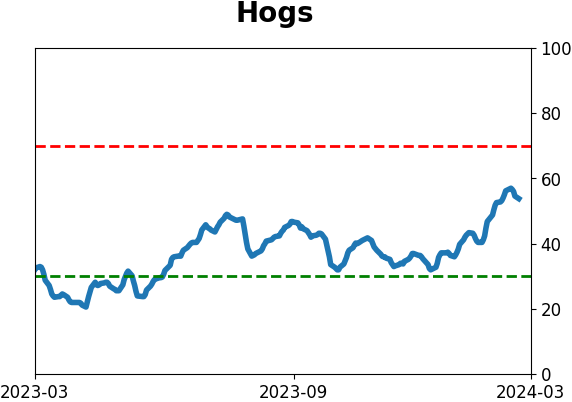
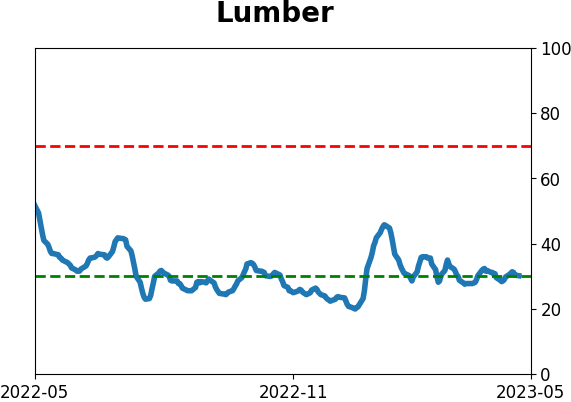
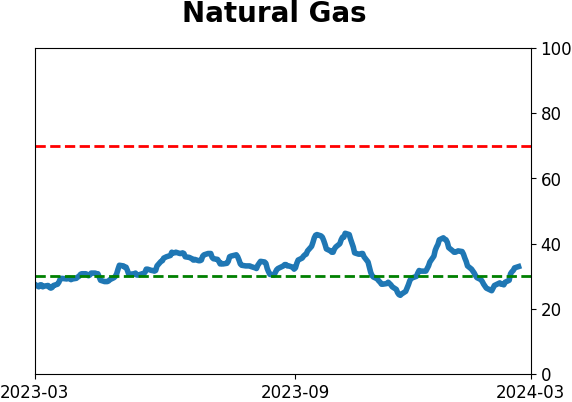
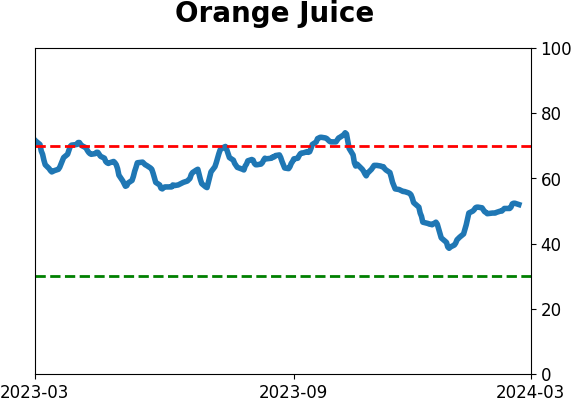
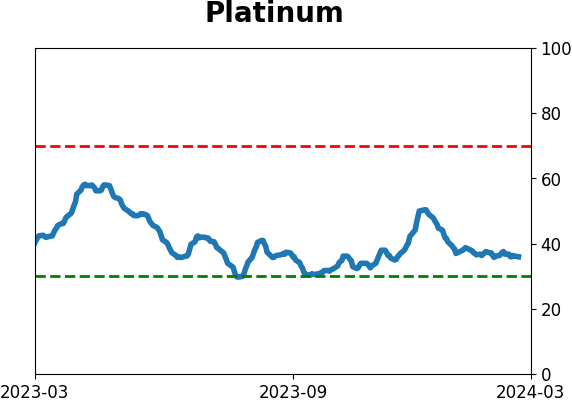
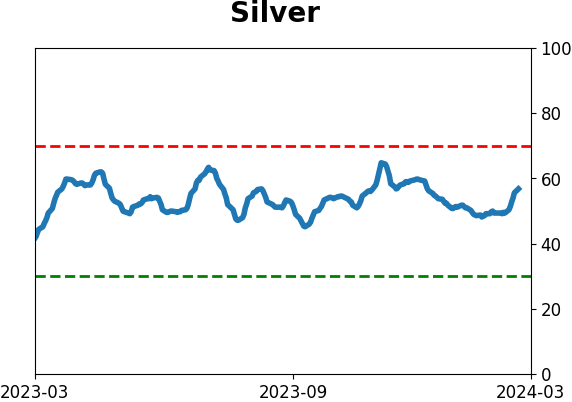
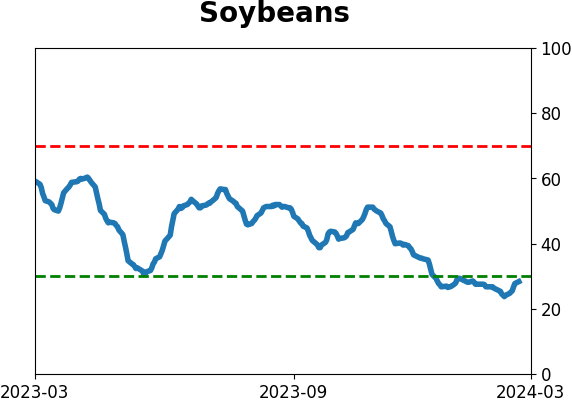
Optimism Index Thumbnails
|
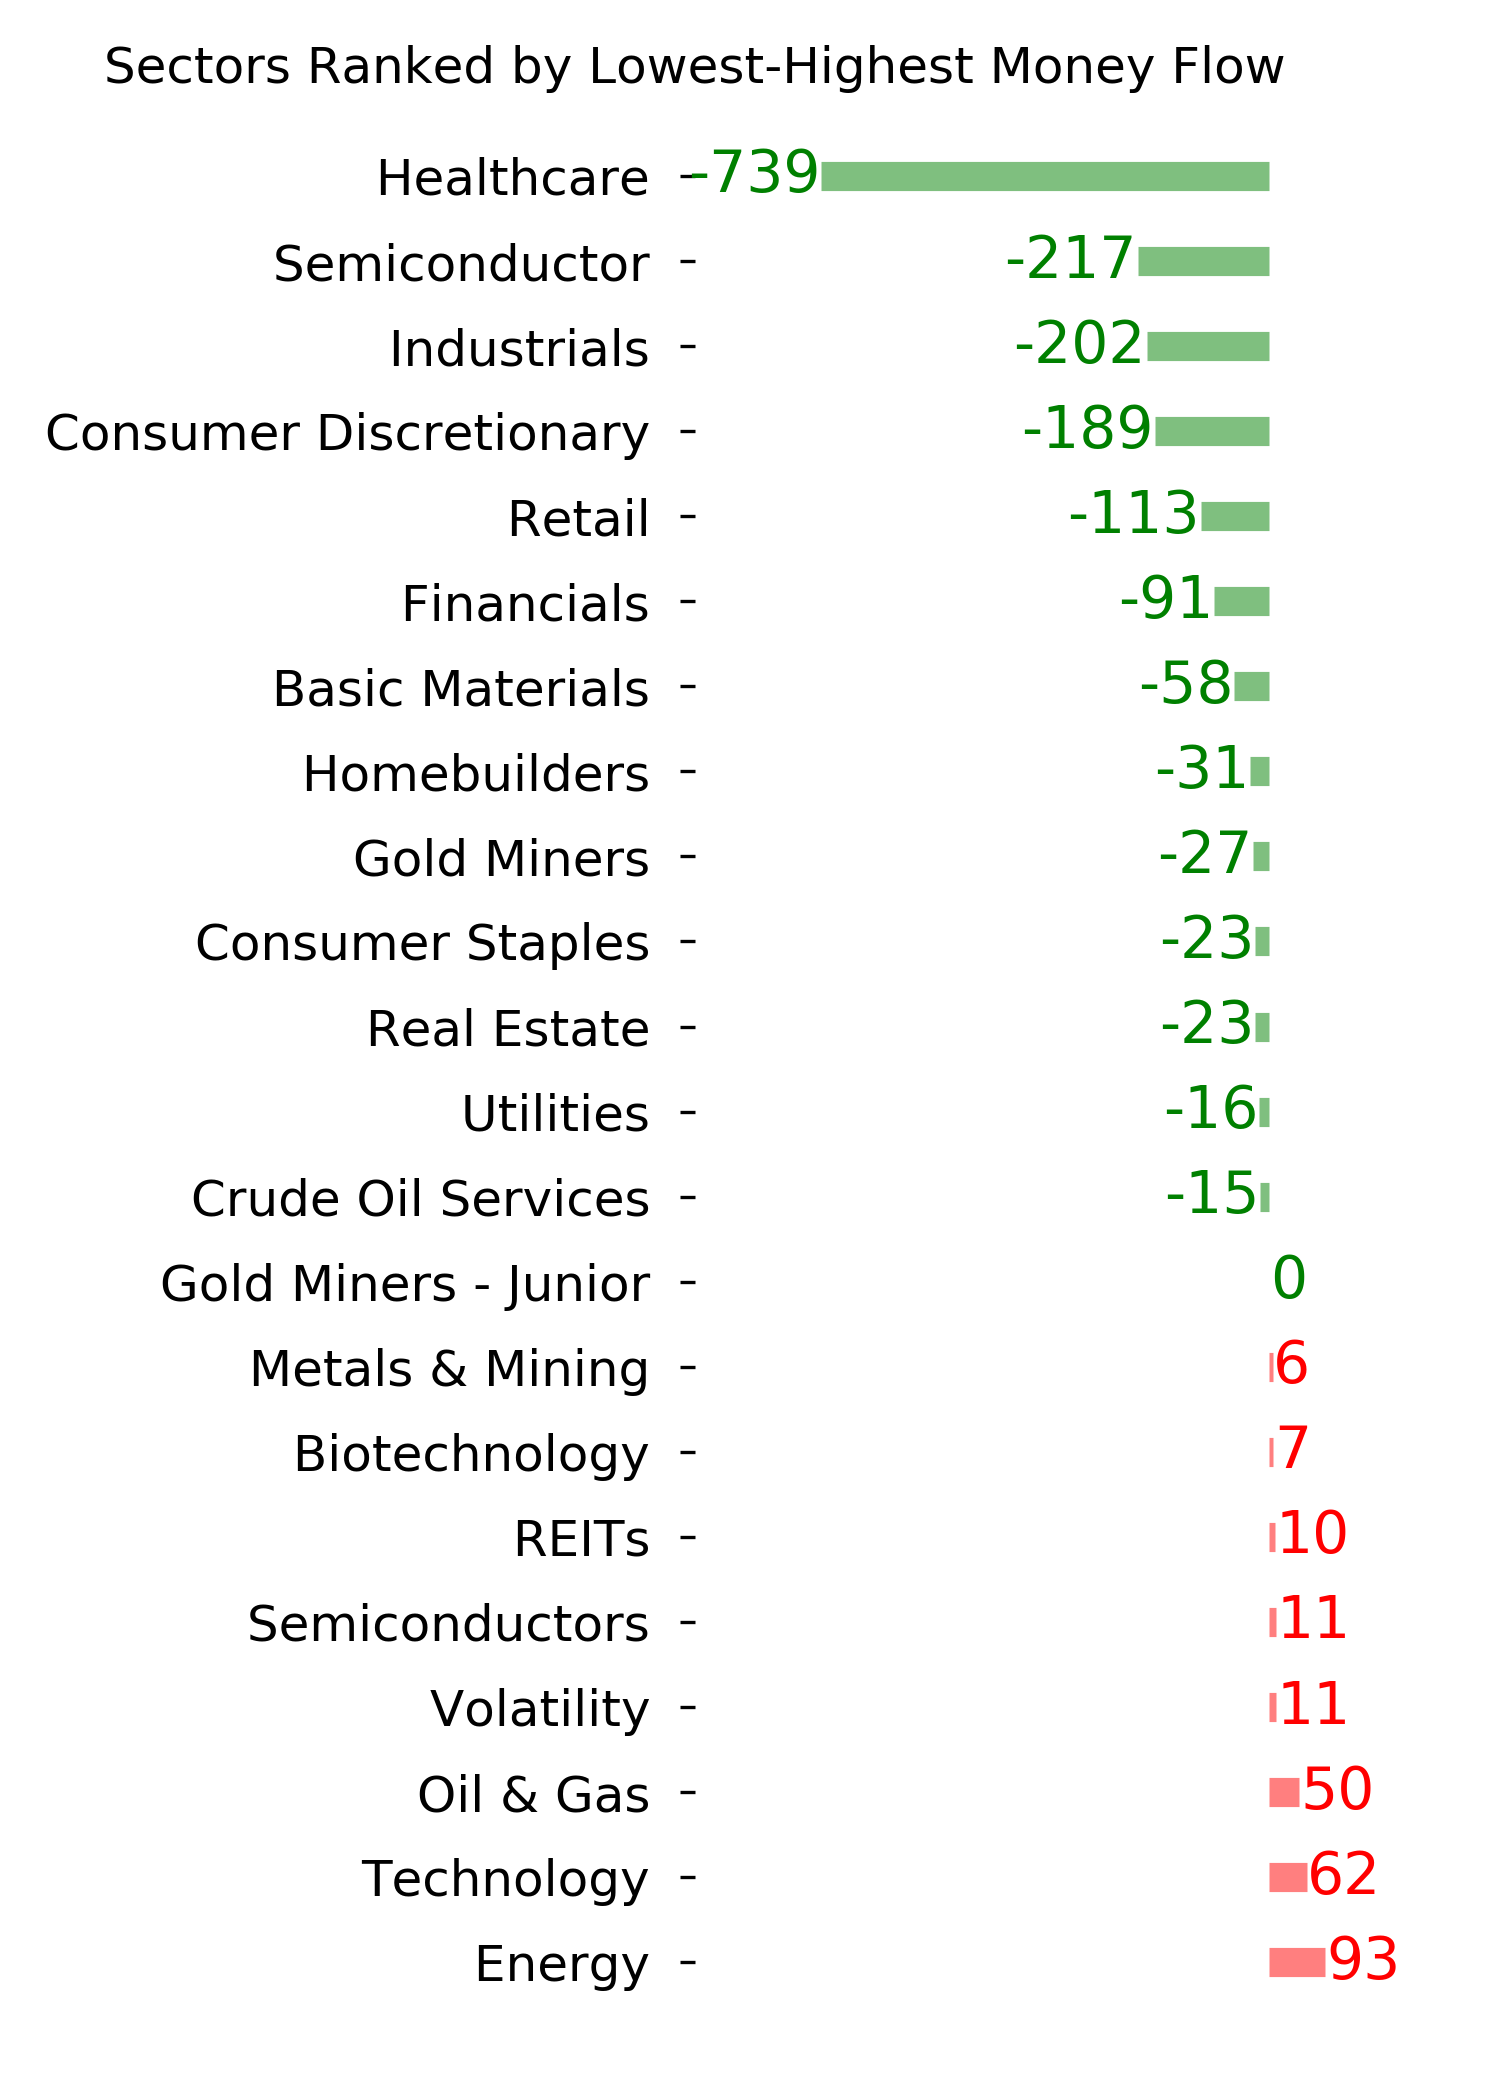
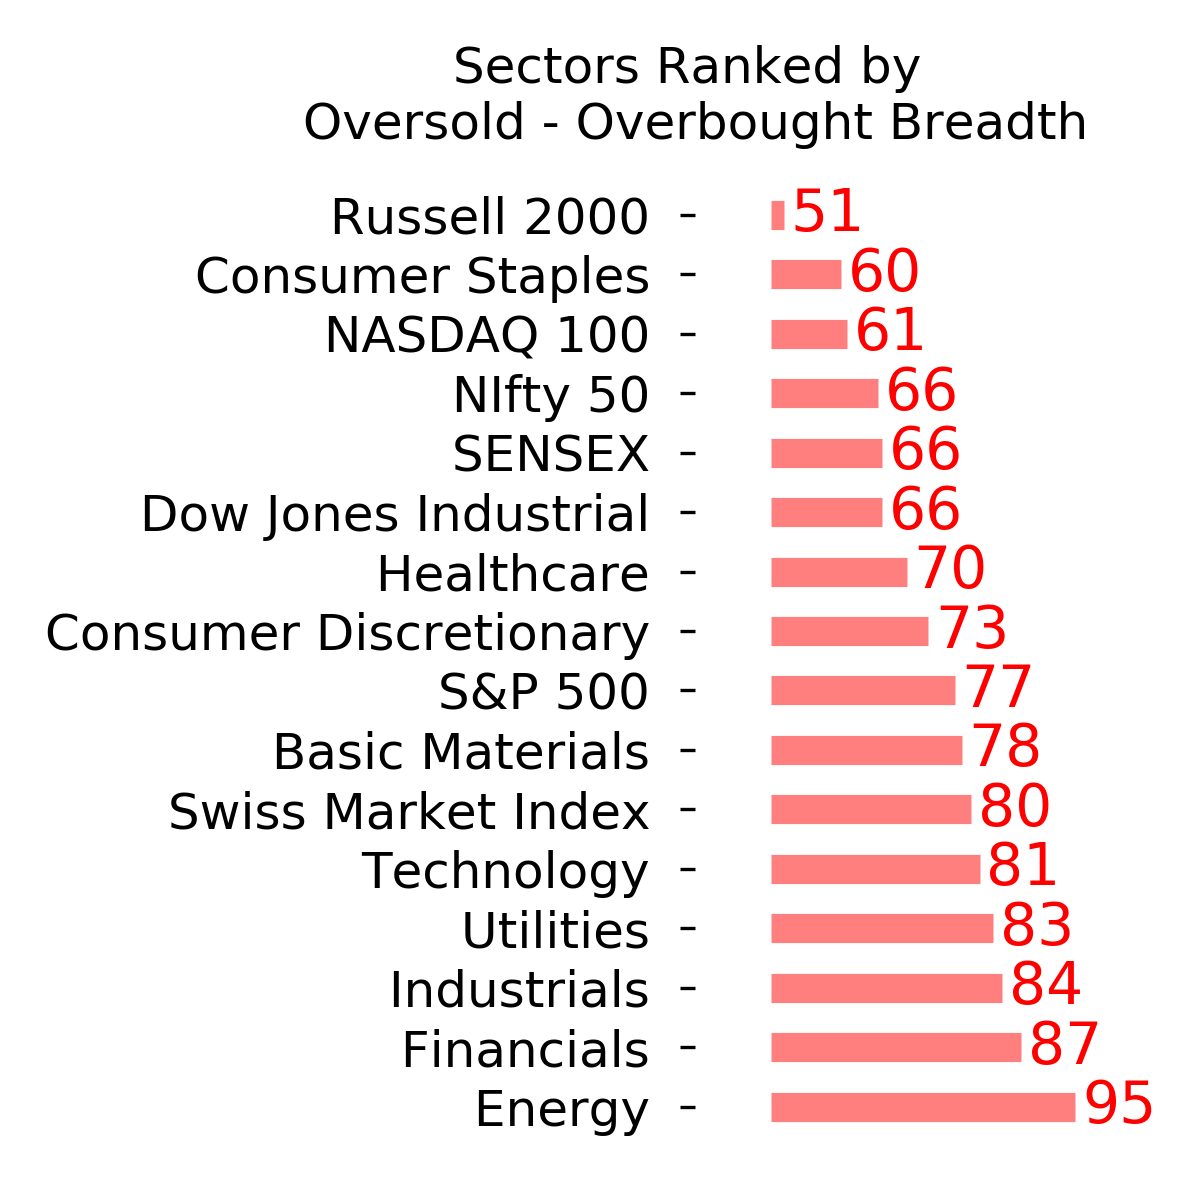
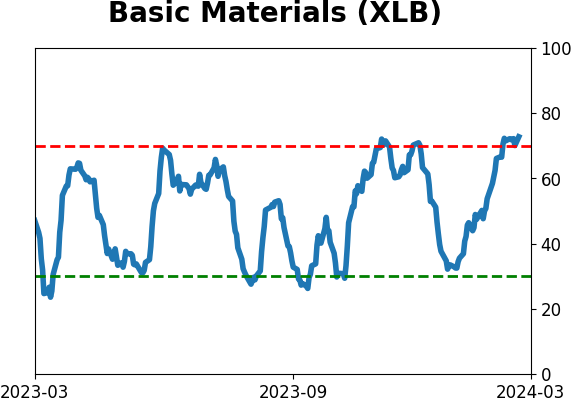
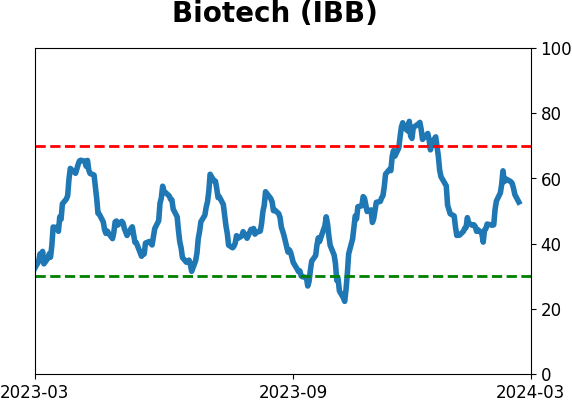
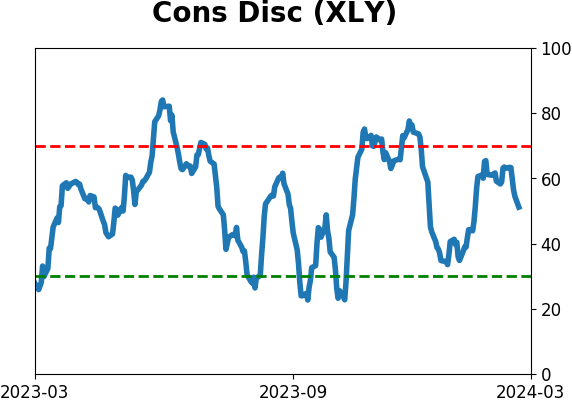
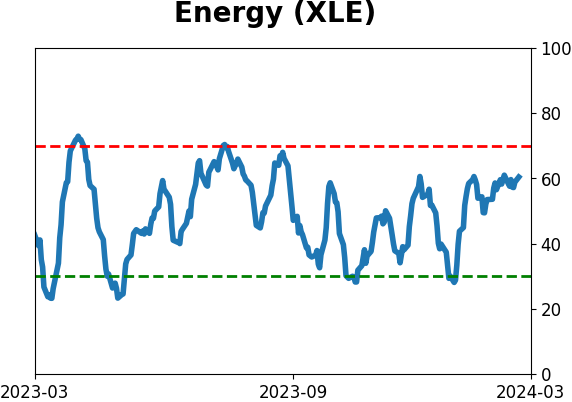
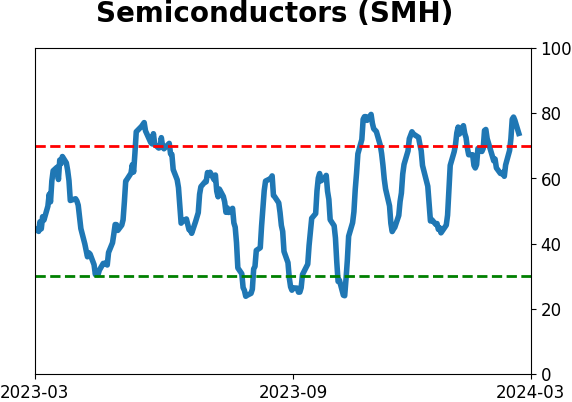
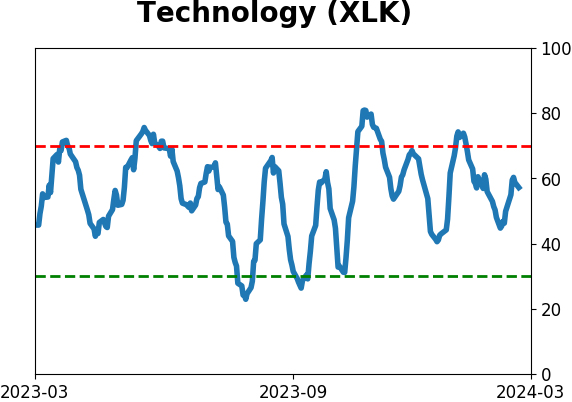
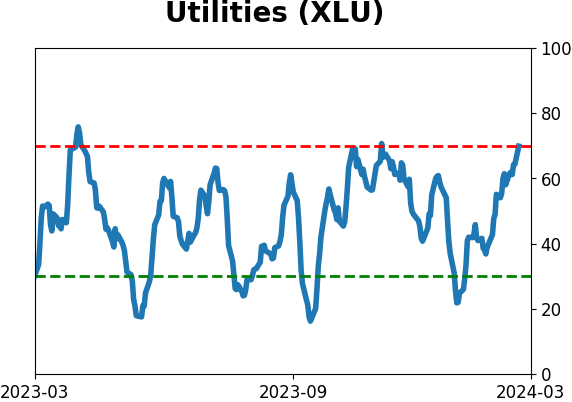
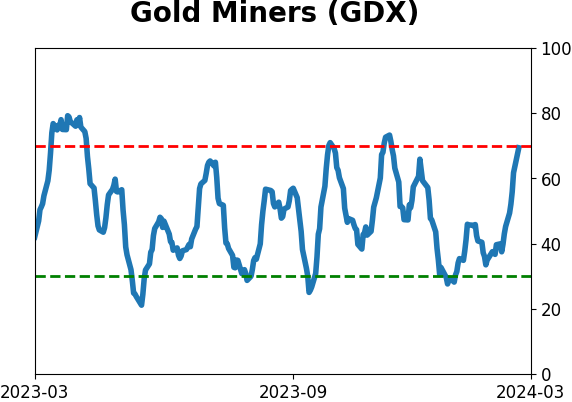
Sector ETF's - 10-Day Moving Average
|
|
|
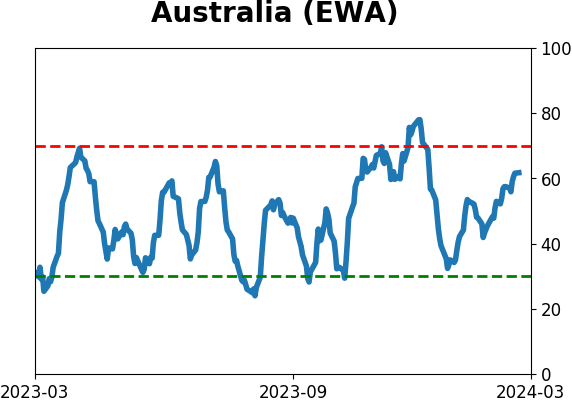
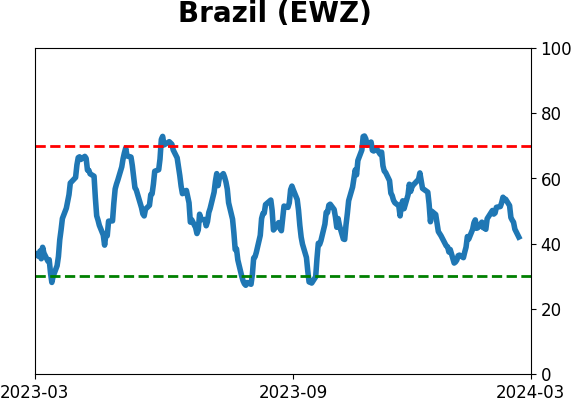
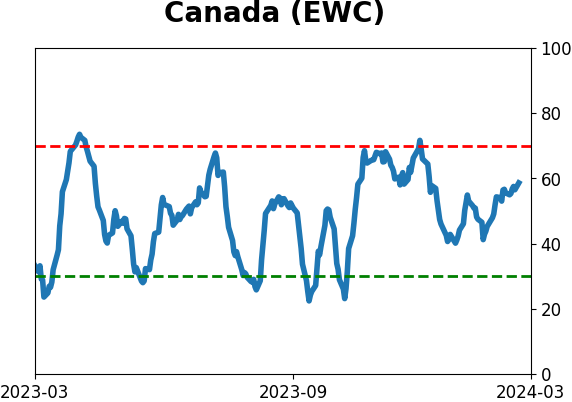
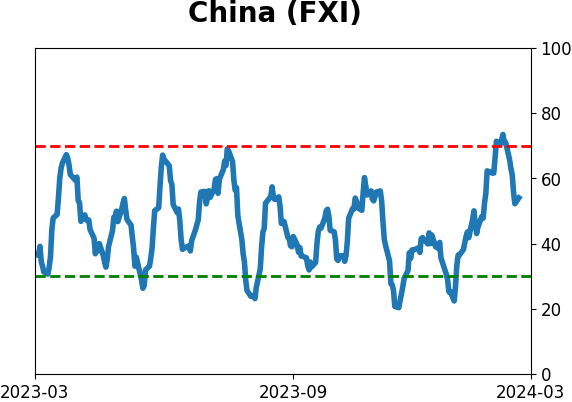
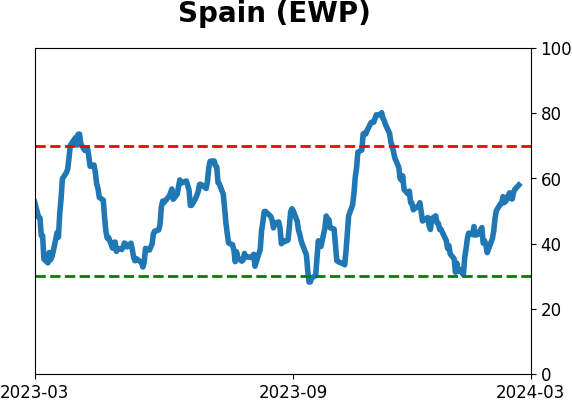
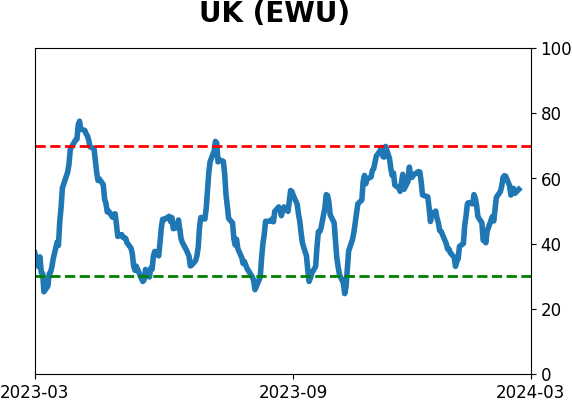
Country ETF's - 10-Day Moving Average
|
|
|
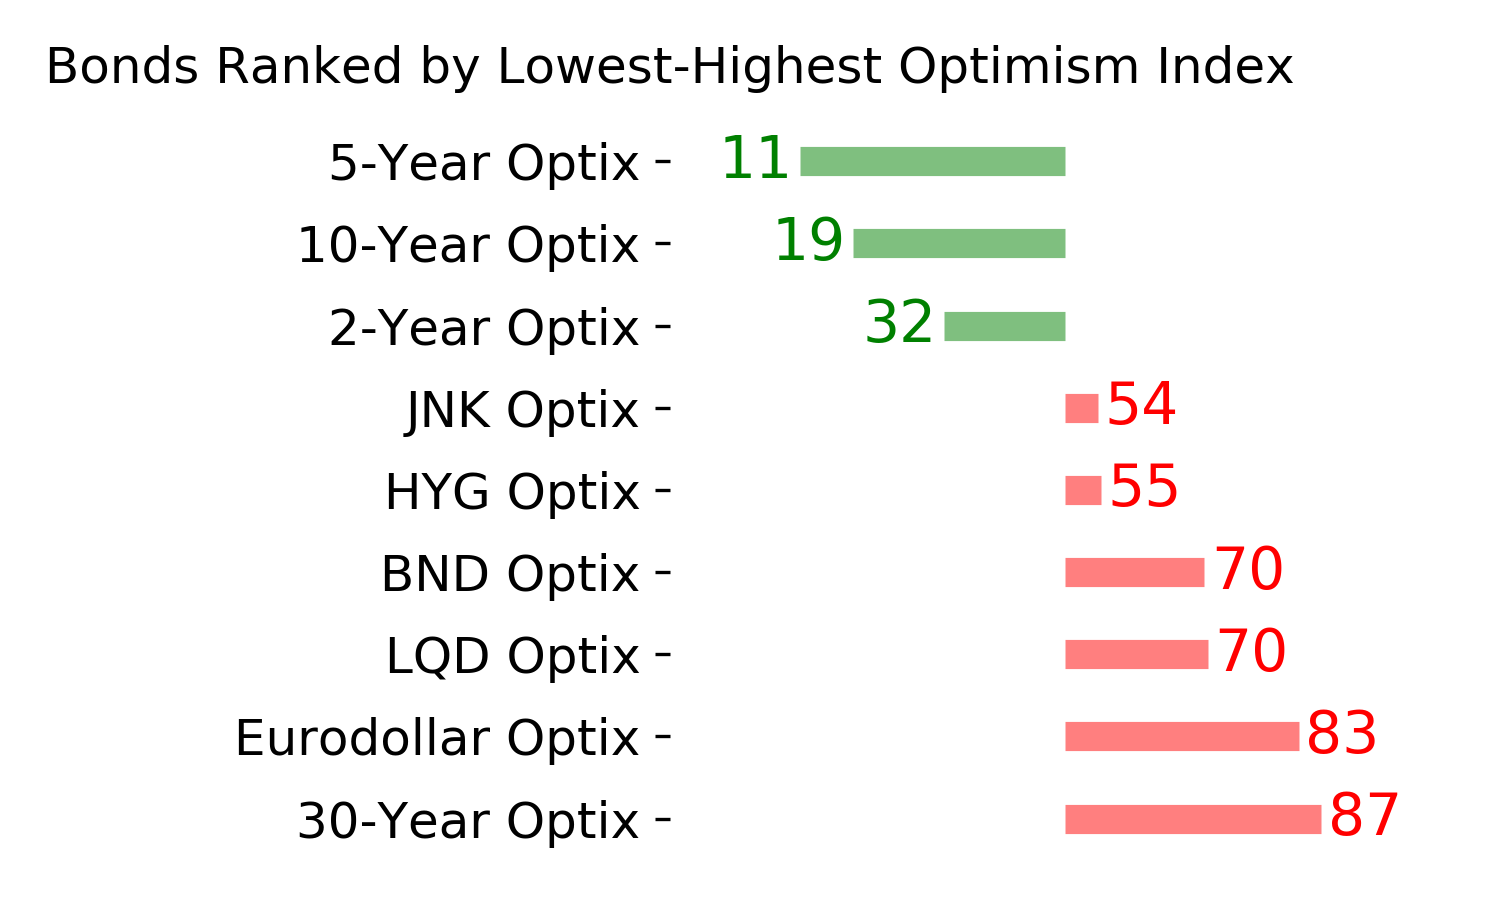
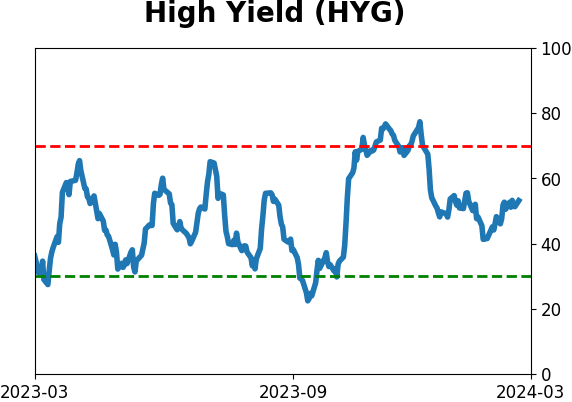
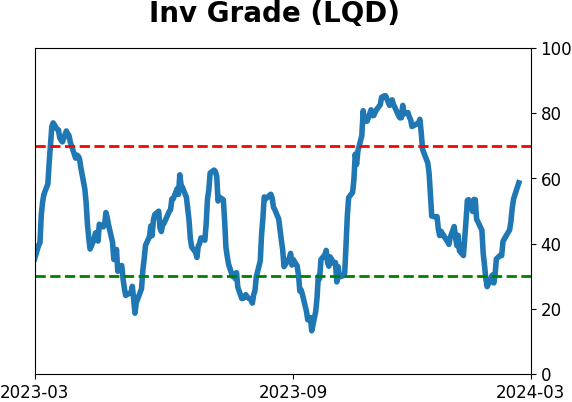
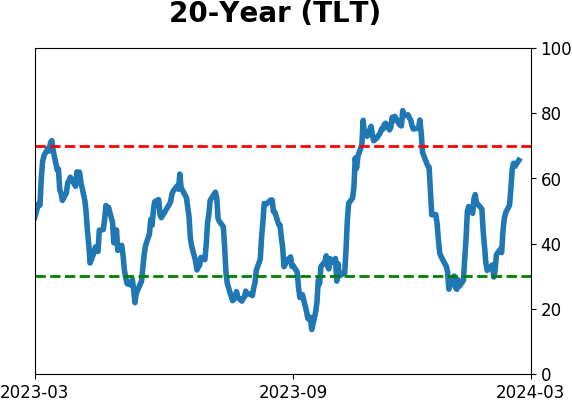
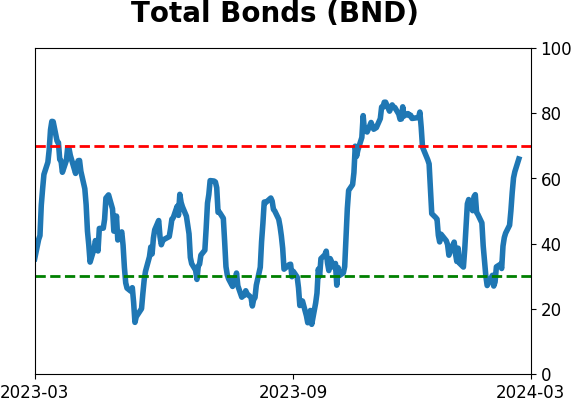
Bond ETF's - 10-Day Moving Average
|
|
|
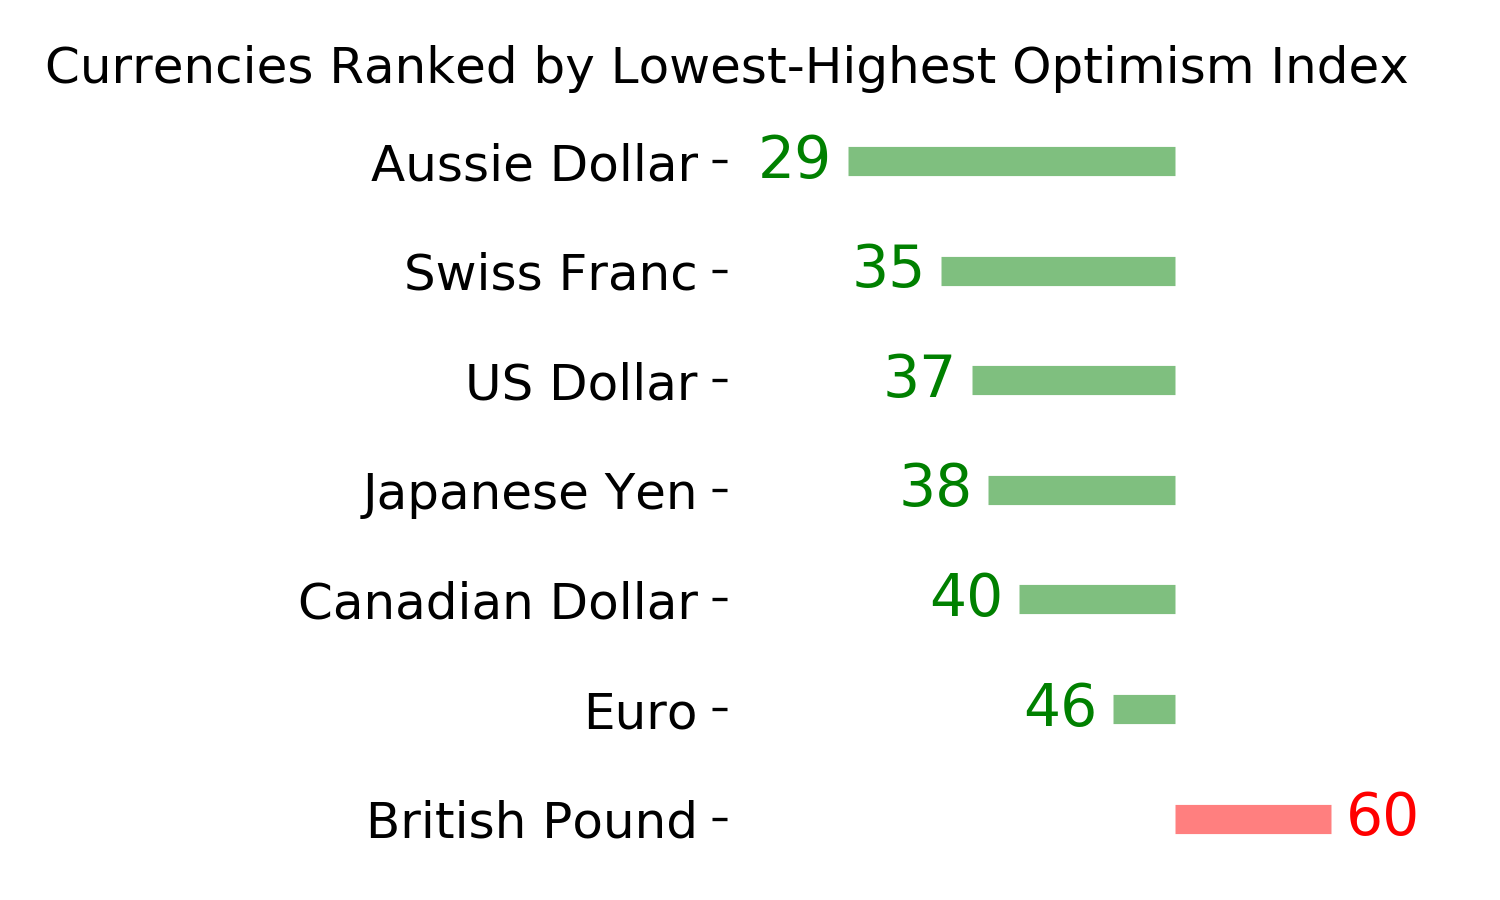
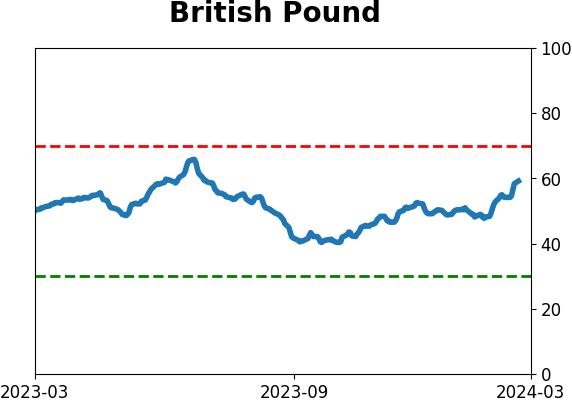
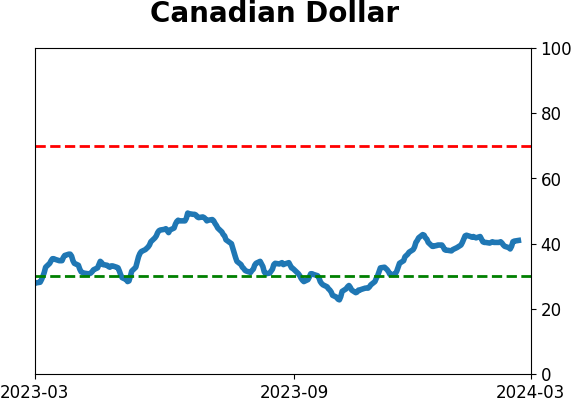
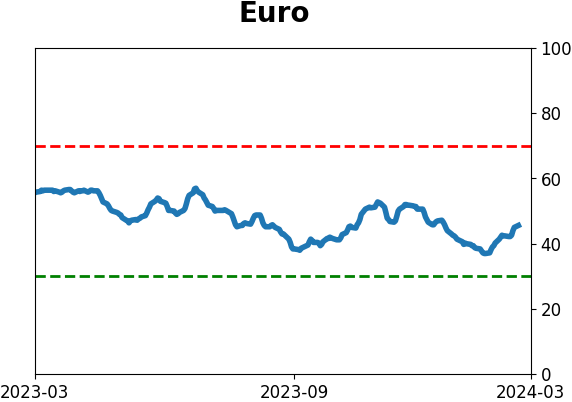
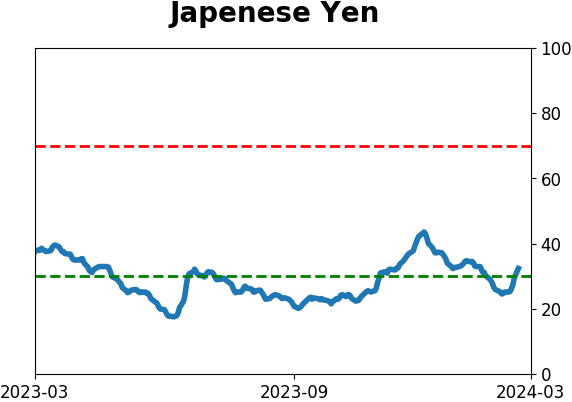
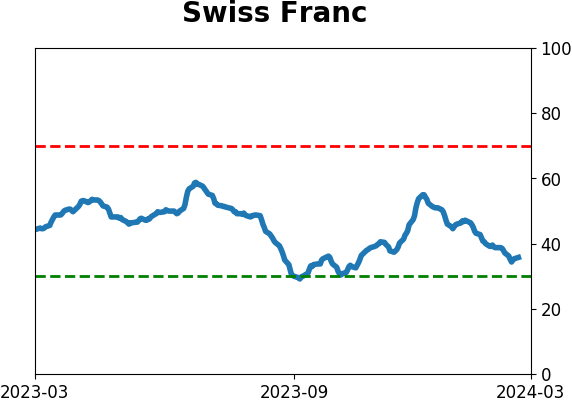
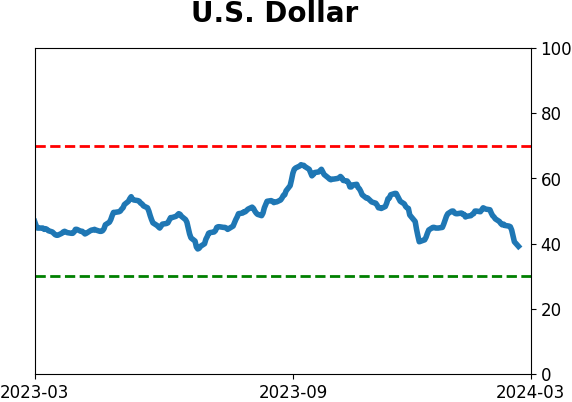
Currency ETF's - 5-Day Moving Average
|
|
|
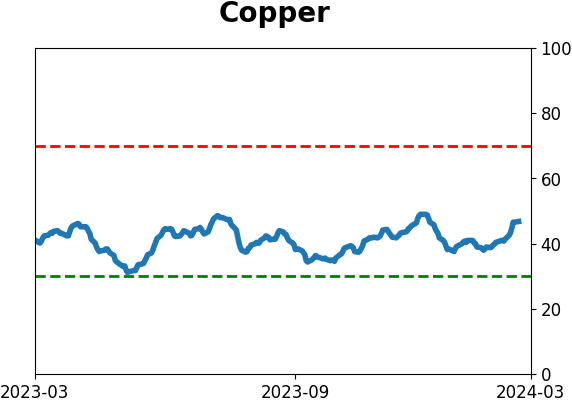
Commodity ETF's - 5-Day Moving Average
|
|