Headlines
|
|
Weekly Wrap for Mar 11 - Implied volatility spikes everywhere, sentiment declines, large (but not extreme) price swings:
This week, we continued to see major swings in various markets. Implied volatility in every major market is at or near the highest in a year, a rare confluence. While the price swings in stocks are large, they're not extreme like we typically see in a bear market. The swings are causing extremes in sentiment, though.
The latest Commitments of Traders report was released, covering positions through Tuesday: The 3-Year Min/Max Screen shows that "smart money" commercial hedgers added aggressively to long exposure in the Nikkei. At an average net long position of over 20,000 contracts over the past 20 weeks, their long exposure meets or exceeds the two prior extremes in mid-2008 and the summer of 2012. They also established a new multi-year long extreme in 5-year Treasuries. Hedgers used the market weakness to reduced short positions in the S&P 500 by about $15 billion but they continue to hold historically high short exposure. They sold gold and other metals, now holding nearly 90,000 contracts net short in precious metals, nearing the all-time record of a little over 100,000 contracts.
|
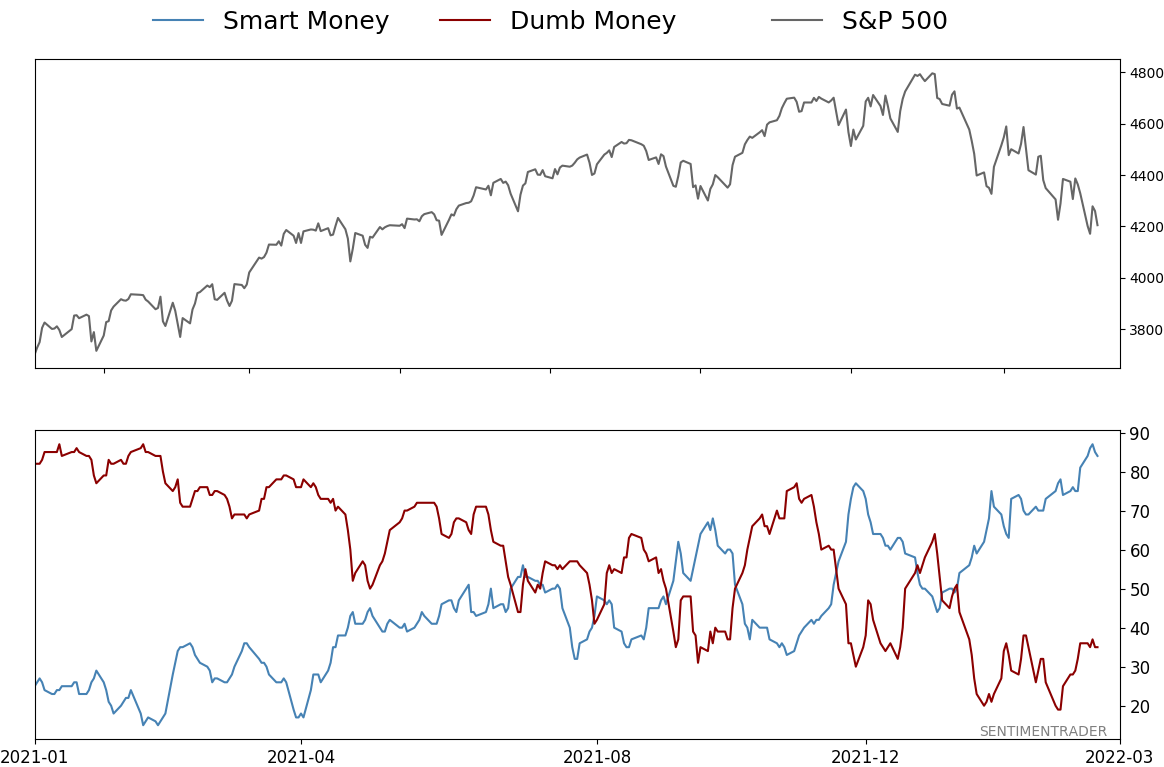
Smart / Dumb Money Confidence
|
Smart Money Confidence: 84%
Dumb Money Confidence: 35%
|
|
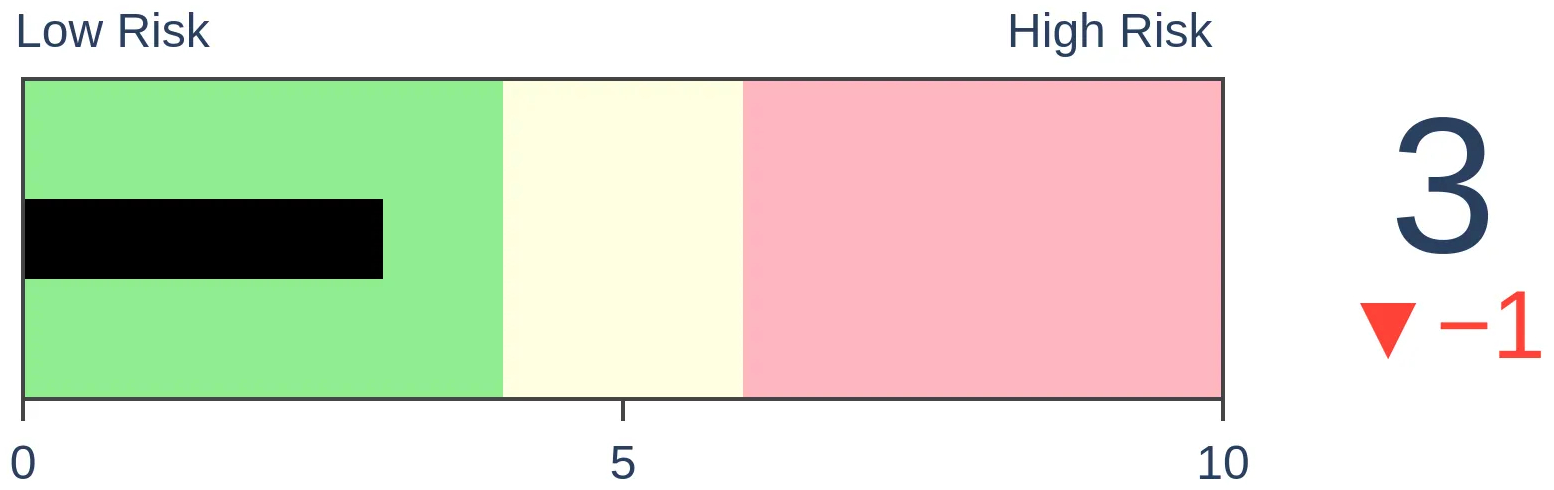
Risk Levels
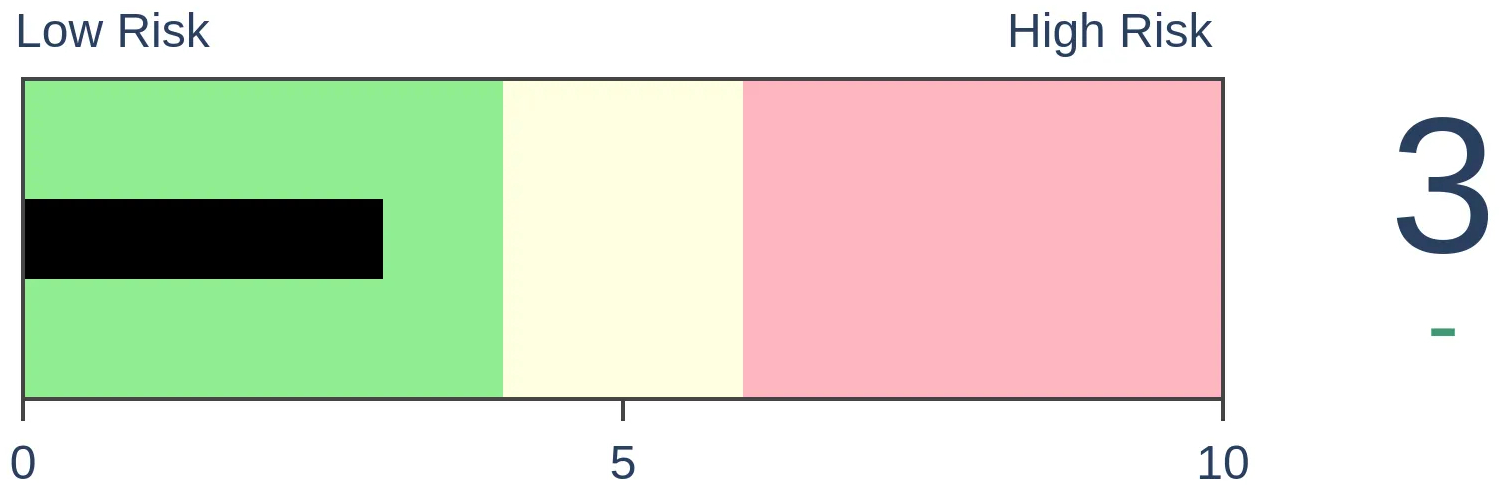
Stocks Short-Term
|
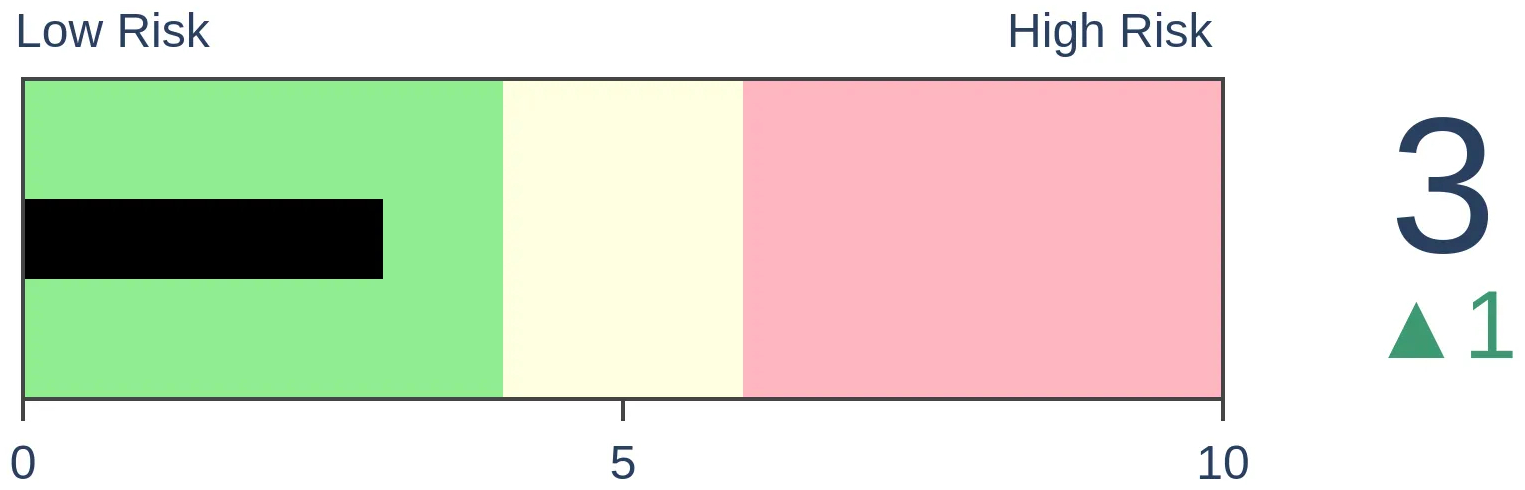
Stocks Medium-Term
|
|
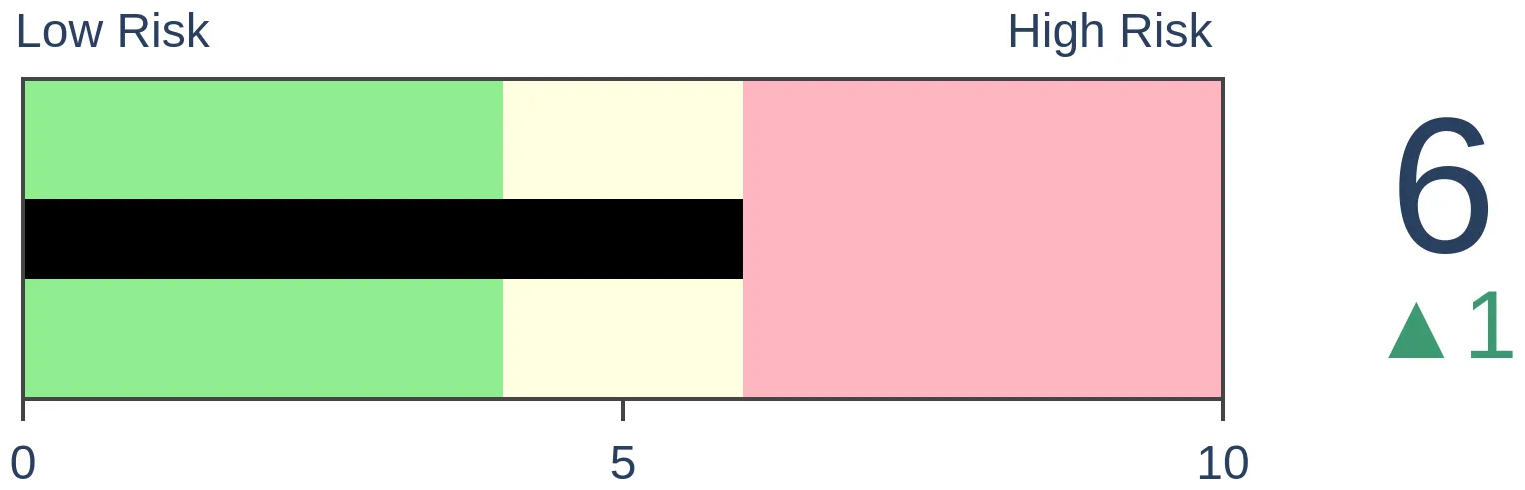
Bonds
|
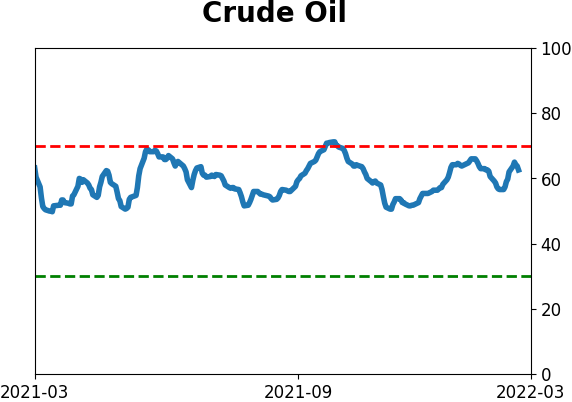
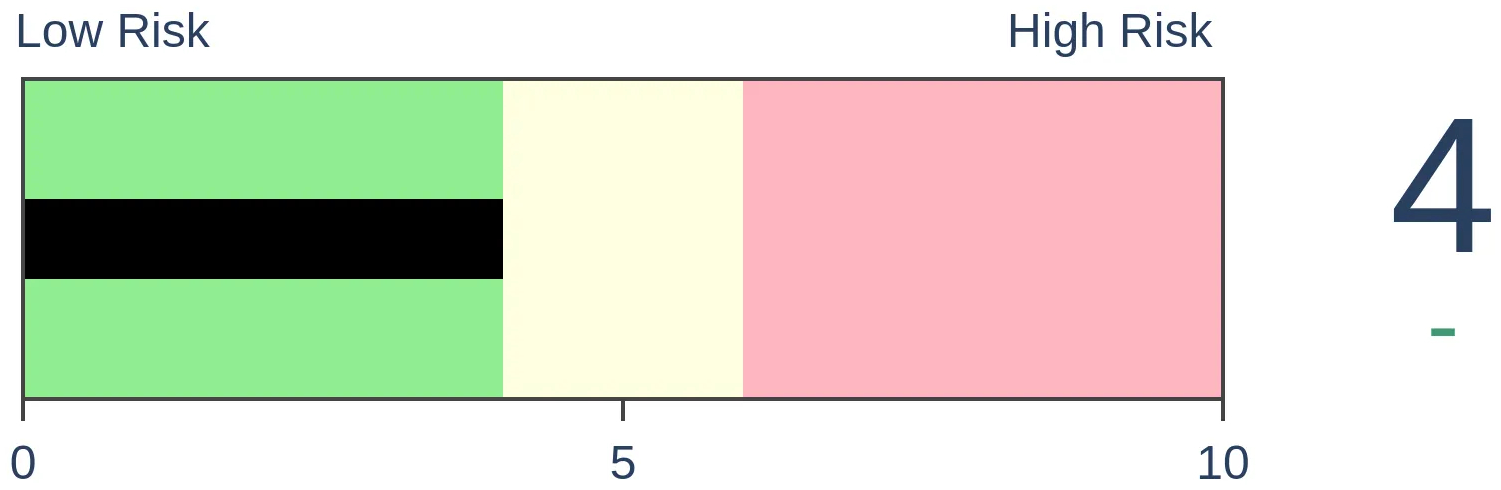
Crude Oil

|
|
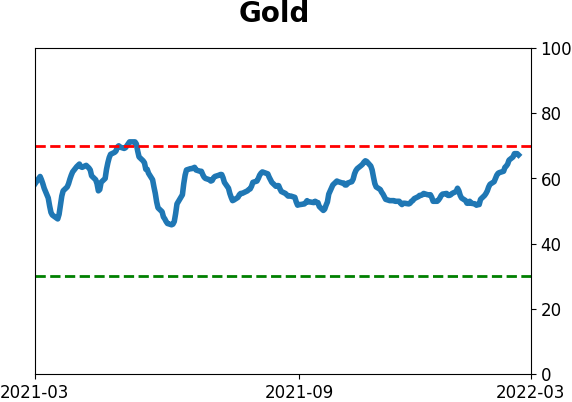
Gold
|
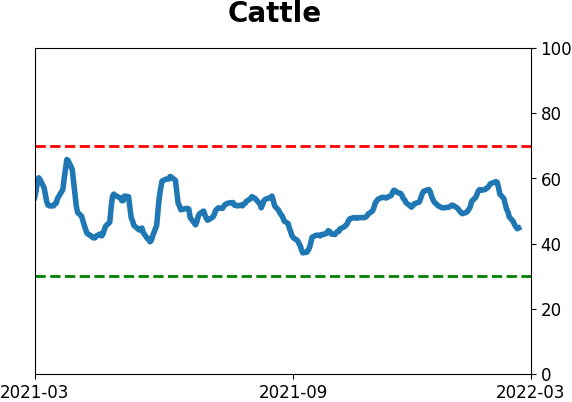
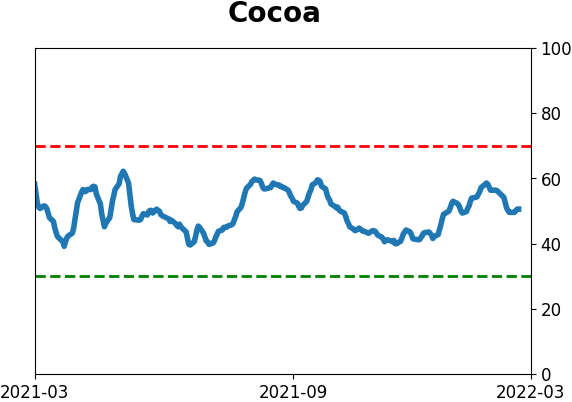
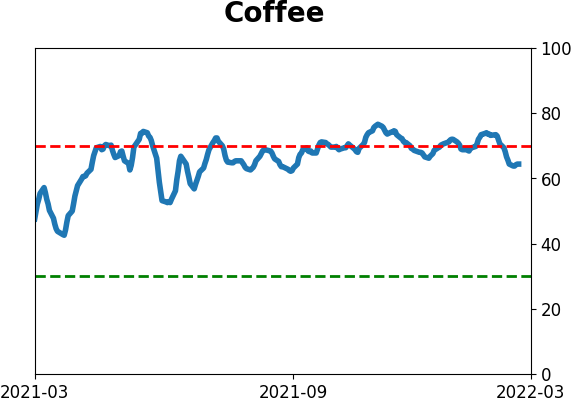
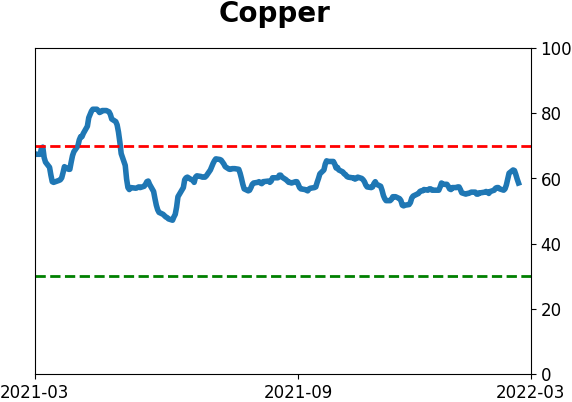
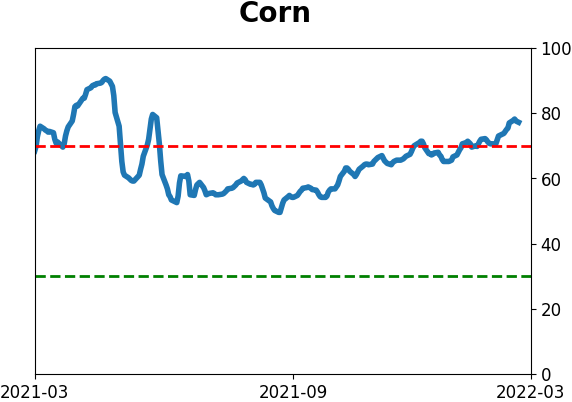
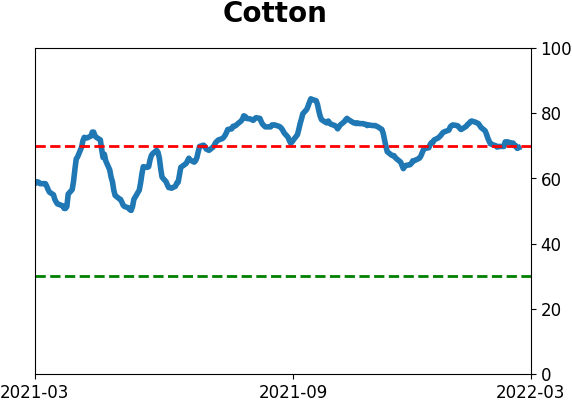
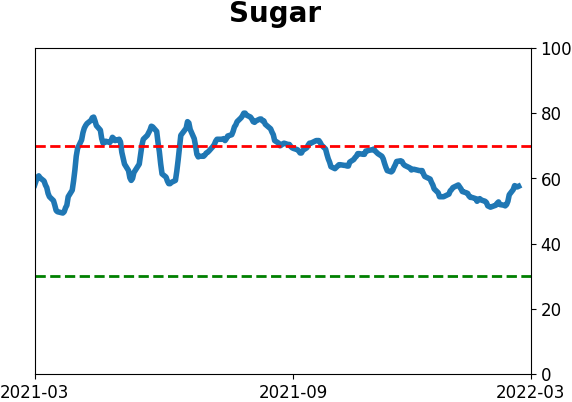
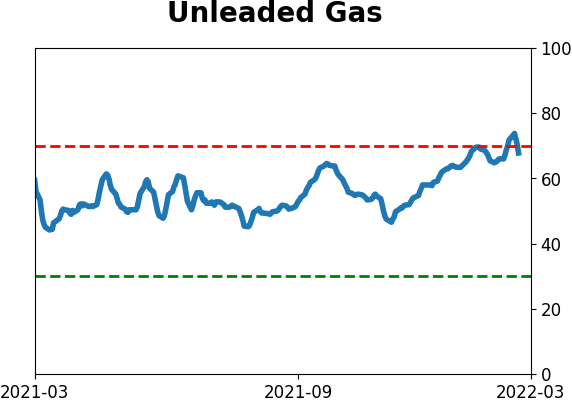
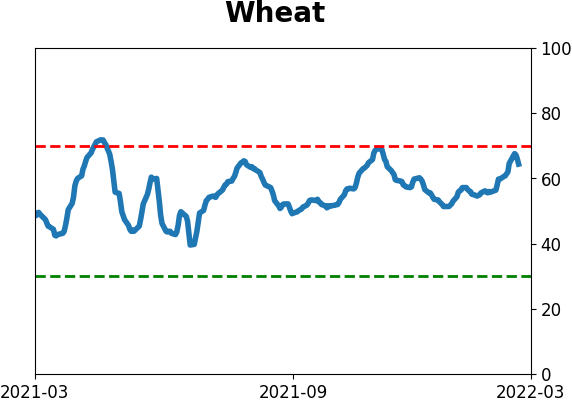
Agriculture
|
|
Research
By Jason Goepfert
BOTTOM LINE
This week, we continued to see major swings in various markets. Implied volatility in every major market is at or near the highest in a year, a rare confluence. While the price swings in stocks are large, they're not extreme like we typically see in a bear market. The swings are causing extremes in sentiment, though.
FORECAST / TIMEFRAME
None
|
Key points:
- Implied volatilities in virtually all markets is at or near their highest levels in a year
- Daily price swings in the S&P 500 are high, but not truly extreme, giving some support for bulls
- The high volatility is triggering an extreme in many sentiment measures
- It's no secret that stocks do better overnight than during the day, but it's even starker based on whether they gap up or down
- A couple of support signs for tech stocks
Implied volatility is spiking in pretty much everything
We saw last week that while investors are pessimistic (especially in stocks), they're not panicking. When true panic grips markets, it's usually reflected in credit, and it's just not happening to any great degree yet.
That's not to say there isn't volatility. There is, and it's everywhere.
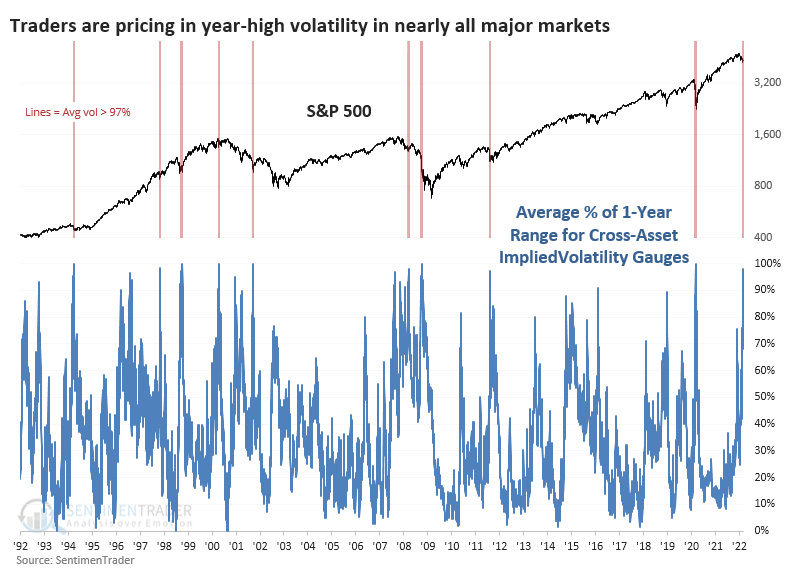
Options traders price in rising volatility in stocks almost exclusively when they're declining. That's when investors panic. But in other markets, from bonds to FX to commodities, implied volatility just as often spikes when prices are rising quickly as when they're falling. That's what's happening right now - for one of the few times in history, implied volatility in stocks, bonds, currencies, gold, and oil is spiking simultaneously.
The average volatility gauge across markets is in the top 2% of their yearly ranges. That's an incredible bout of cross-asset concern that we've rarely seen in the past 30 years.
For the S&P 500, these bouts of high anxiety across markets have preceded excellent medium-term returns. The only real exceptions, unfortunately, were the last two. While it preceded a significant relief rally early in 2008, when it triggered again in October of that year, the final melt-down phase of the Global Financial Crisis was in full force. The same happened during the pandemic crash.
However, during other crises, it proved to be a good buying trigger for stocks, at least for a multi-week to multi-month rebound (including the Russian devaluation in 1998).
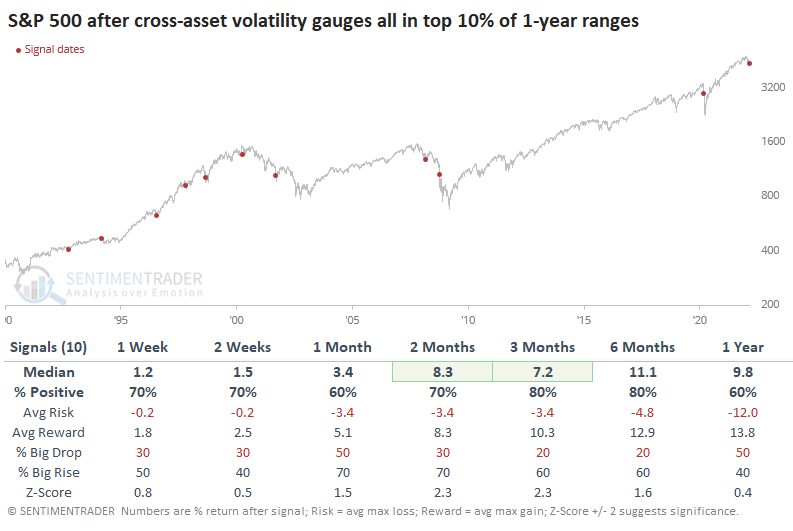
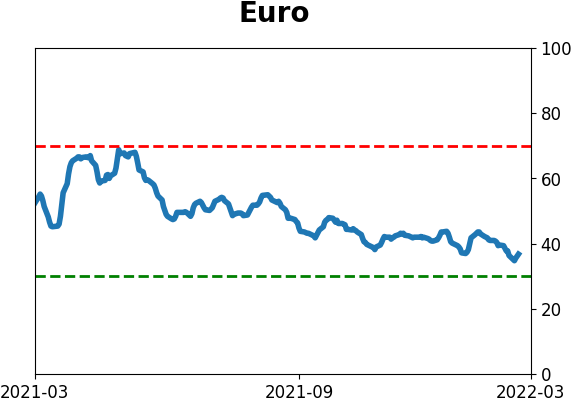
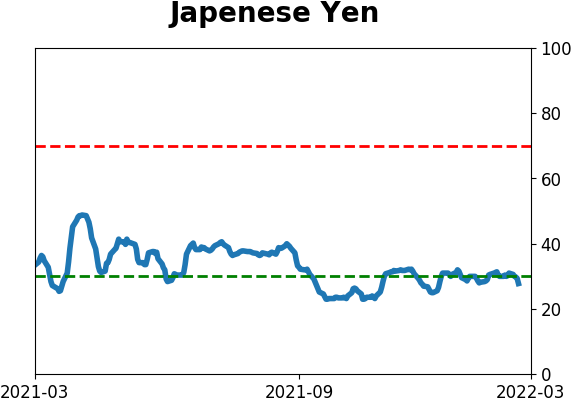
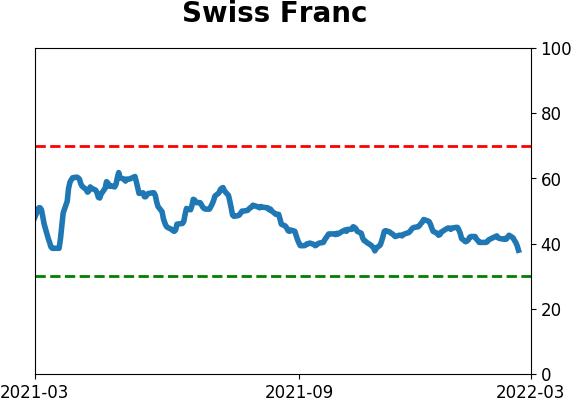
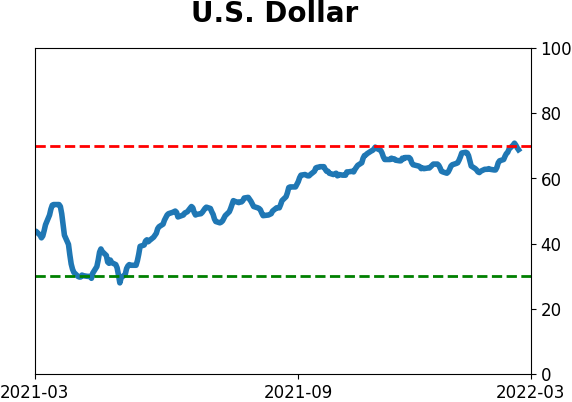
For bonds, it was more of a mixed picture. The futures on 10-year Treasuries showed inconsistent gains, though there was a slight positive correlation between short-term and long-term returns. The dollar tended to keep going in the months ahead, showing a positive return over the next 2 months after 8 of the 10 signals.
Gold is considered a good place to park "the world is going to hell" bets, and most of these crises saw the metal being bid up in the weeks prior. Unfortunately for gold bugs, it had a heck of a time holding onto those gains. Either 1 or 2 months later, gold sported a negative return every time. Crude oil also had trouble holding gains from these volatility spikes, especially in recent decades. This market, in particular, is subject to booms and busts based on supply/demand and geopolitical machinations and is the least subject to historical analysis because of it.
Price swings aren't that extreme and don't predict a bear market
One of the market tropes being bandied about now is that since stocks are swinging wildly from day to day, it necessarily means that the bull market is over. Only during bear markets do we see volatility like this.
It certainly has been volatile. Over the past 2 months, the S&P 500 has had a closing gain or loss of more than 1% on 21 sessions, exactly half the sessions. Most of the heavy clusters of 1% swings certainly seemed to be during bear markets.
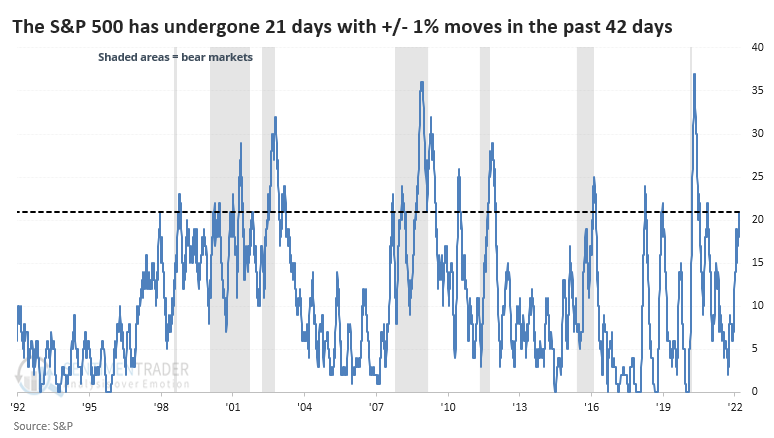
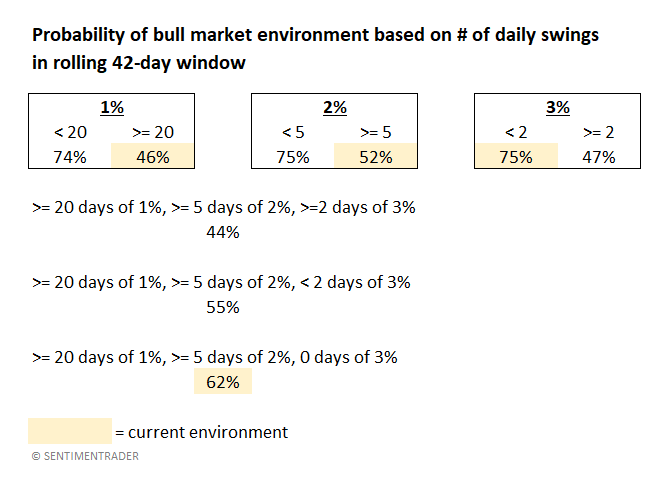
Going back to 1928, there were 3,038 days when the rolling count of 1% days met or exceeded 20, and 1,397 of those days were during bull markets. So, if we were witnessing a big cluster of 1% daily swings, there was still a 46% chance we were in a bull market environment.
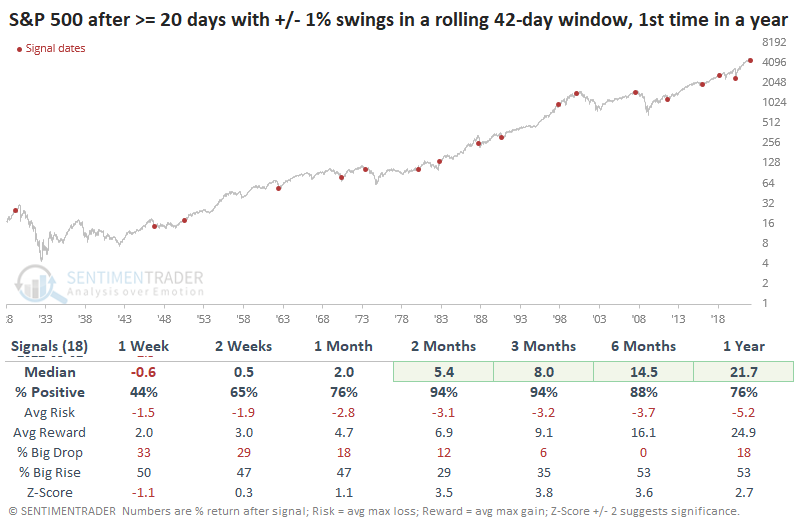
If stocks enter a period of high volatility, with more than 20 days of 1% swings during a 2-month span, then it didn't necessarily mean a bear market was imminent. In fact, it never did. Stocks eventually fell into a bear market after the signals in 1973, 2000, and 2007, but not before rebounding first.
There has also been a rise in even more significant swings, with 6 days of daily changes larger than 2%. Still, it's far from the extreme volatility investors suffered during recent bear markets. Curiously, there have been no daily swings of 3% or more in the S&P since January. This is a relatively rare stretch of high - but not truly extreme - price swings.
Since 1928, there have been 154 days when the S&P at least 1% on 20 or more days, 2% on 5 or more days, but underwent no swings of 3% or more. Out of those days, 95 occurred during bull markets. So, there was a 62% probability that we were in a bull market environment if we saw price action like we're seeing now.
This seems like an important distinction. If these 42-day stretches included at least 2 days with a daily swing of 3% or more, then the chance that we were in a bull market environment dropped to 44%.
High volatility is triggering extremes in sentiment
When our Smart Money / Dumb Money Confidence reaches a positive extreme, it typically portends good things for stocks. There is no one best way to designate the spread as extreme, but there are several thresholds that have proven useful. Jay showed that another one of the more useful measures of an extreme in sentiment using this indicator just triggered a new signal.
The chart below displays each time the 20-day average for the Smart Money / Dumb Money Confidence Spread crossed above 0.45 for the first time in 21 days along with future returns in SPY.
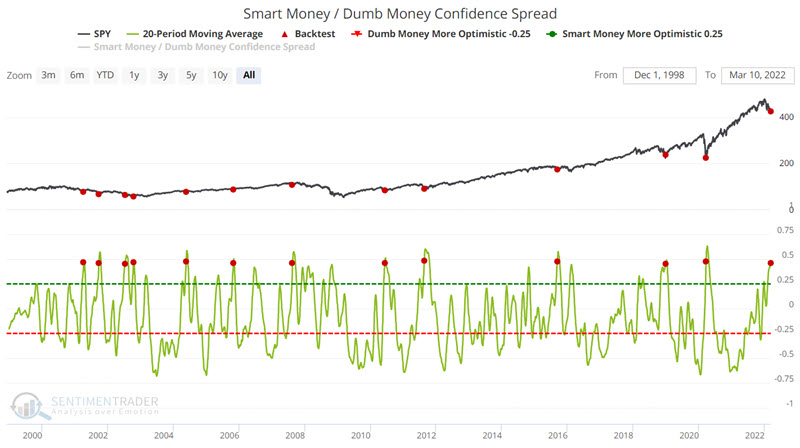
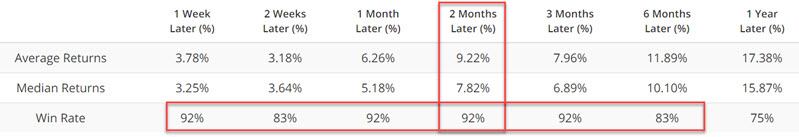
Note the consistently high Win Rates across all time frames. Of particular note is the performance during the two months after a signal (92% Win Rate, Average gain over 9.2%, and worst loss of -1.26%).
Look to the open for clues to the close
We've noted many times over the years how stocks tend to do better overnight than during regular trading hours. Jay looked at this again but included whether stocks gapped up or down at the open, and further by the day of the week.
For our testing, we will use daily open/high/low/close data for SPY (SPDR S&P 500 ETF Trust) from 1/29/1993 through 3/7/2022. Note that no allowances are made for slippage or commissions. We are strictly analyzing price changes.
The first chart below shows the growth of $1 in SPY held only overnight (black line) versus the growth of $1 in SPY held intraday, i.e., open to close (blue line) for ALL trading days.
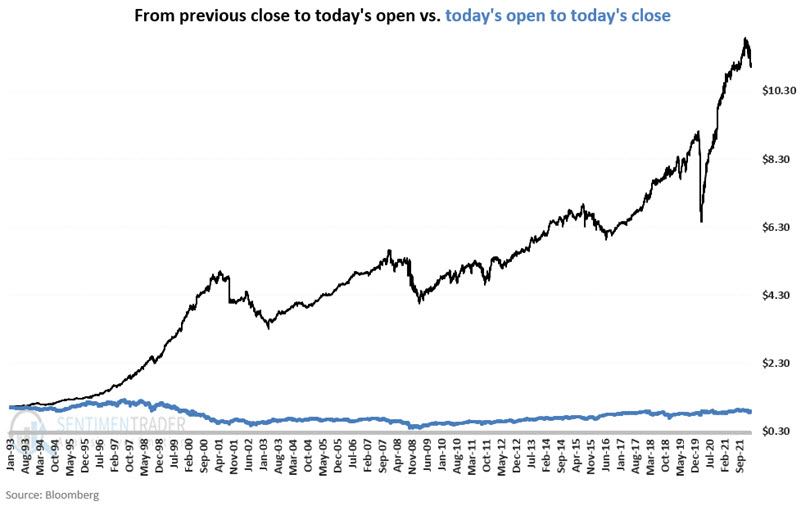
Overnight sessions returned +1,000.9% while the day sessions returned -13.3%. The table below shows returns by day, including whether the day gapped up or down at the open.
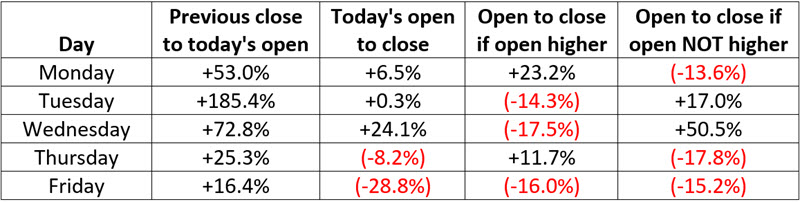
Some general observations:
- Holding overnight accounted for all gains
- Holding intraday showed a small net loss
- Tuesday and Wednesday are "turnaround" days (i.e., higher opens lead to lower closes and vice versa)
- Monday and Thursday are "continuation" days (i.e., higher opens lead to higher closes and vice versa)
- Friday is the worst day to hold intraday, but the best day to buy at the close
A couple of positive signs for tech stocks
Jay looked at a couple of positive factors for tech stocks.
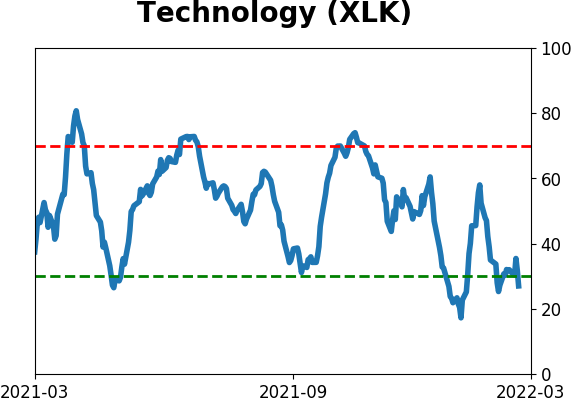
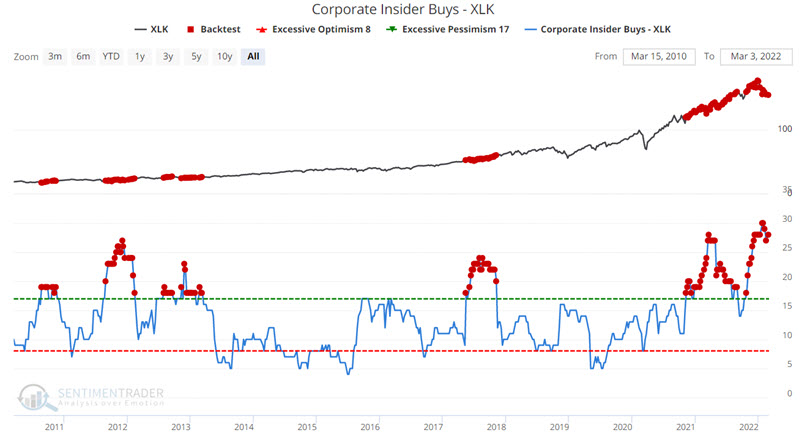
Insider buying in the technology sector keeps popping up on the radar. Ticker XLK (the upper line in the chart below) tracks an index of technology stocks. The lower line in the chart below represents open market purchases by corporate insiders for companies XLK.
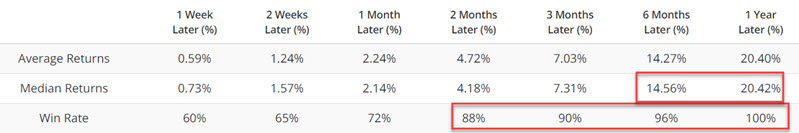
The chart below highlights each week when this indicator showed a reading of 17 or higher.
The chart below displays the annual seasonal trend for XLK. Note that we have entered a favorable seasonal period.
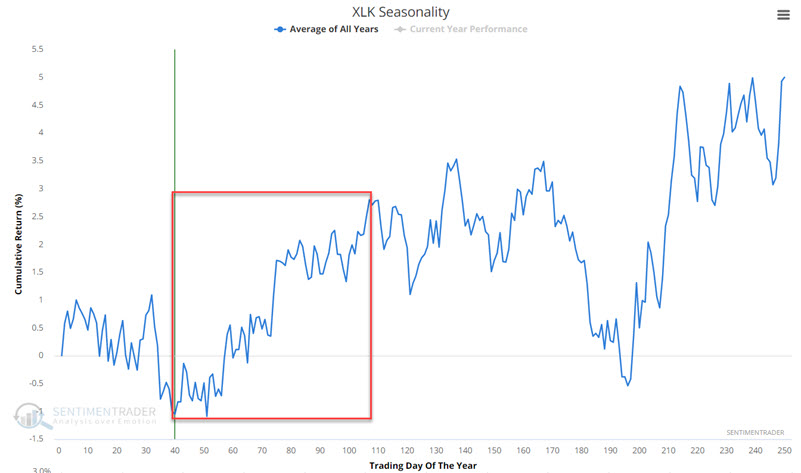
Over the past 79 years, this period was up 53 times and down 26 times. For 2022, this period extends from the close on 3/1/2022 through the close on 6/6/2022. So far this latest period is off to an abysmal start, which is curious given the solid signs given by corporate insiders.
About the Weekly Wrap...
The goal of the Weekly Wrap is to summarize our recent research. Some of it includes premium content (underlined links), but we're highlighting the key focus of the research for all. Sometimes there is a lot to digest, with this summary meant to highlight the highest conviction ideas we discussed. Tags will show any symbols and time frames related to the research.
Active Studies
| Time Frame | Bullish | Bearish | | Short-Term | 4 | 0 | | Medium-Term | 21 | 2 | | Long-Term | 15 | 5 |
|
Indicators at Extremes
Portfolio
| Position | Description | Weight % | Added / Reduced | Date | | Stocks | RSP | 21.4 | Added 10.2% | 2022-01-28 | | Bonds | 32.7% BND, 7.1% SCHP | 40.1 | Added 8.3% | 2021-10-26 | | Commodities | GCC | 2.4 | Reduced 2.1%
| 2020-09-04 | | Precious Metals | GDX | 4.6 | Reduced 4.2% | 2021-05-19 | | Special Situations | 7.6% KWEB, 4.9% XBI, 3.7% XLE, 1.8% PSCE | 18.0 | Added 4.6% | 2022-02-24 | | Cash | | 13.2 | | |
|
Updates (Changes made today are underlined)
With a typical time frame of several months in this account, I normally don't make changes so quickly. I've added back part of the stock exposure I took off earlier in January due to the washed-out conditions and extreme pessimism we're seeing across a wide array of metrics. The biggest issue is that the environment is unhealthy and we could be in the throes of a protracted bear market. Even so, the readings we've seen recently have a good record at preceding relief rallies, so we'll have to see how that pans out. Bond sentiment is trying to recover from a recent bout of pessimism, and gold stocks are doing their thing which is not much at all. They've been flat for six months. Chinese tech stocks were doing exactly what they're supposed to do, then did *not* by plunging to new lows. This is troubling on a shorter-term time frame, but this was never meant for a trade, rather a multi-year investment. Recent behavior is troubling and I will not be adding any exposure as long as that's the case. RETURN YTD: -1.9% 2021: +8.7%, 2020: +8.1%, 2019: +12.6%, 2018: +0.6%, 2017: +3.8%, 2016: +17.1%, 2015: +9.2%, 2014: +14.5%, 2013: +2.2%, 2012: +10.8%, 2011: +16.5%, 2010: +15.3%, 2009: +23.9%, 2008: +16.2%, 2007: +7.8%
|
|
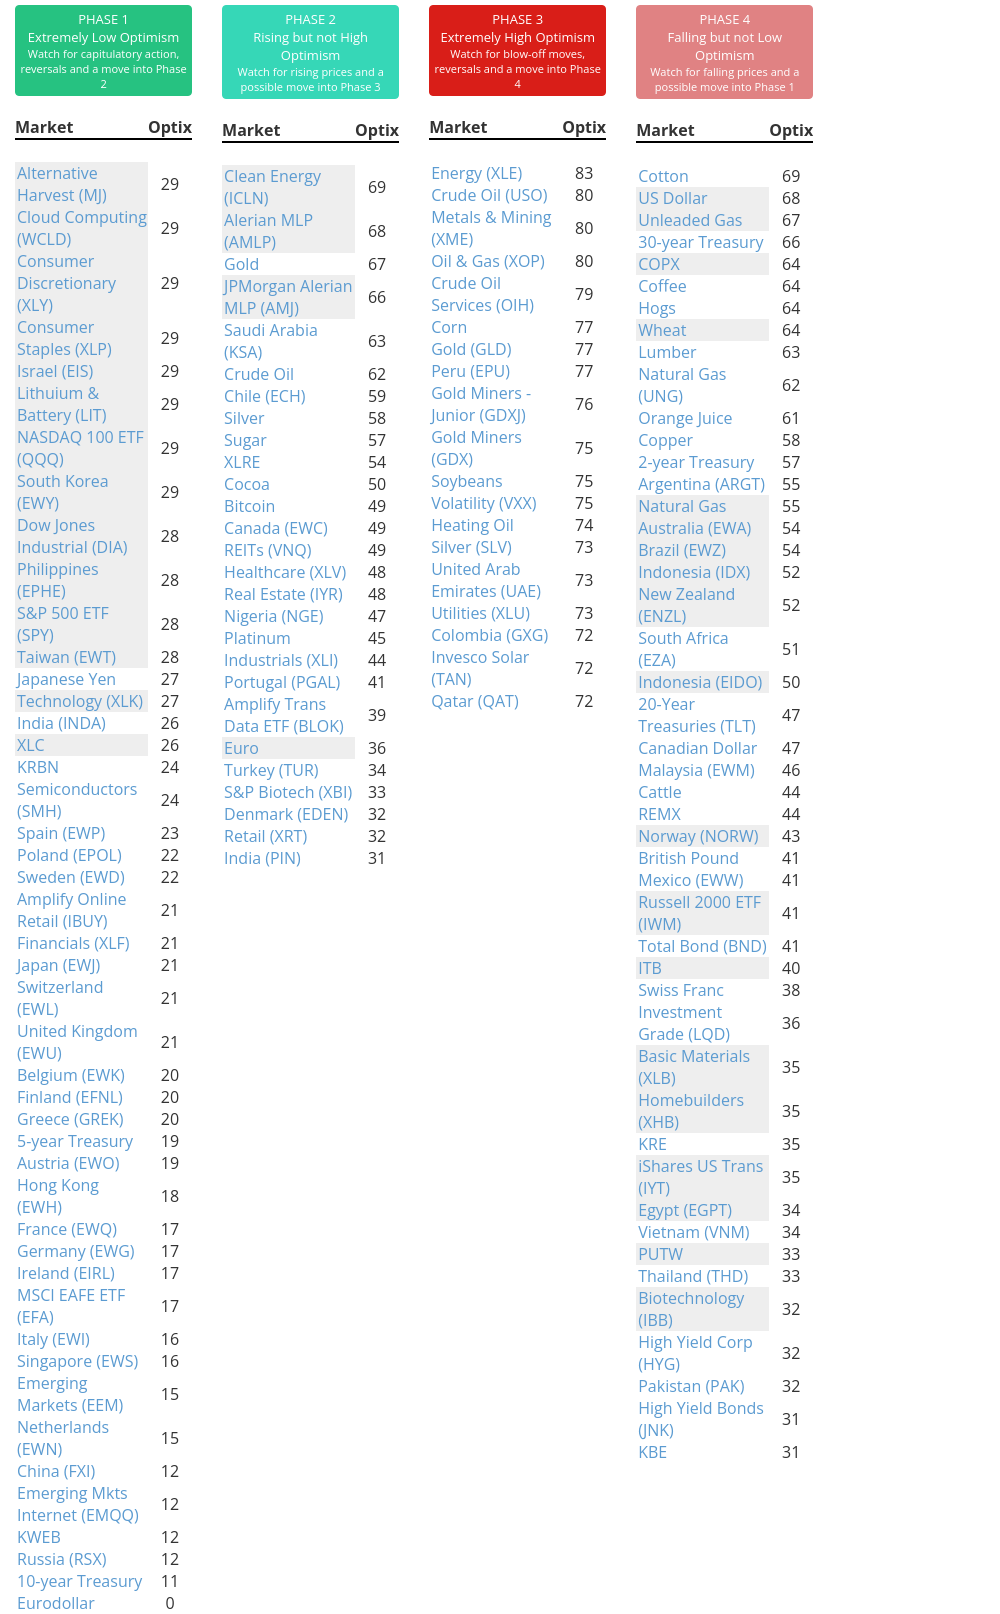
Phase Table
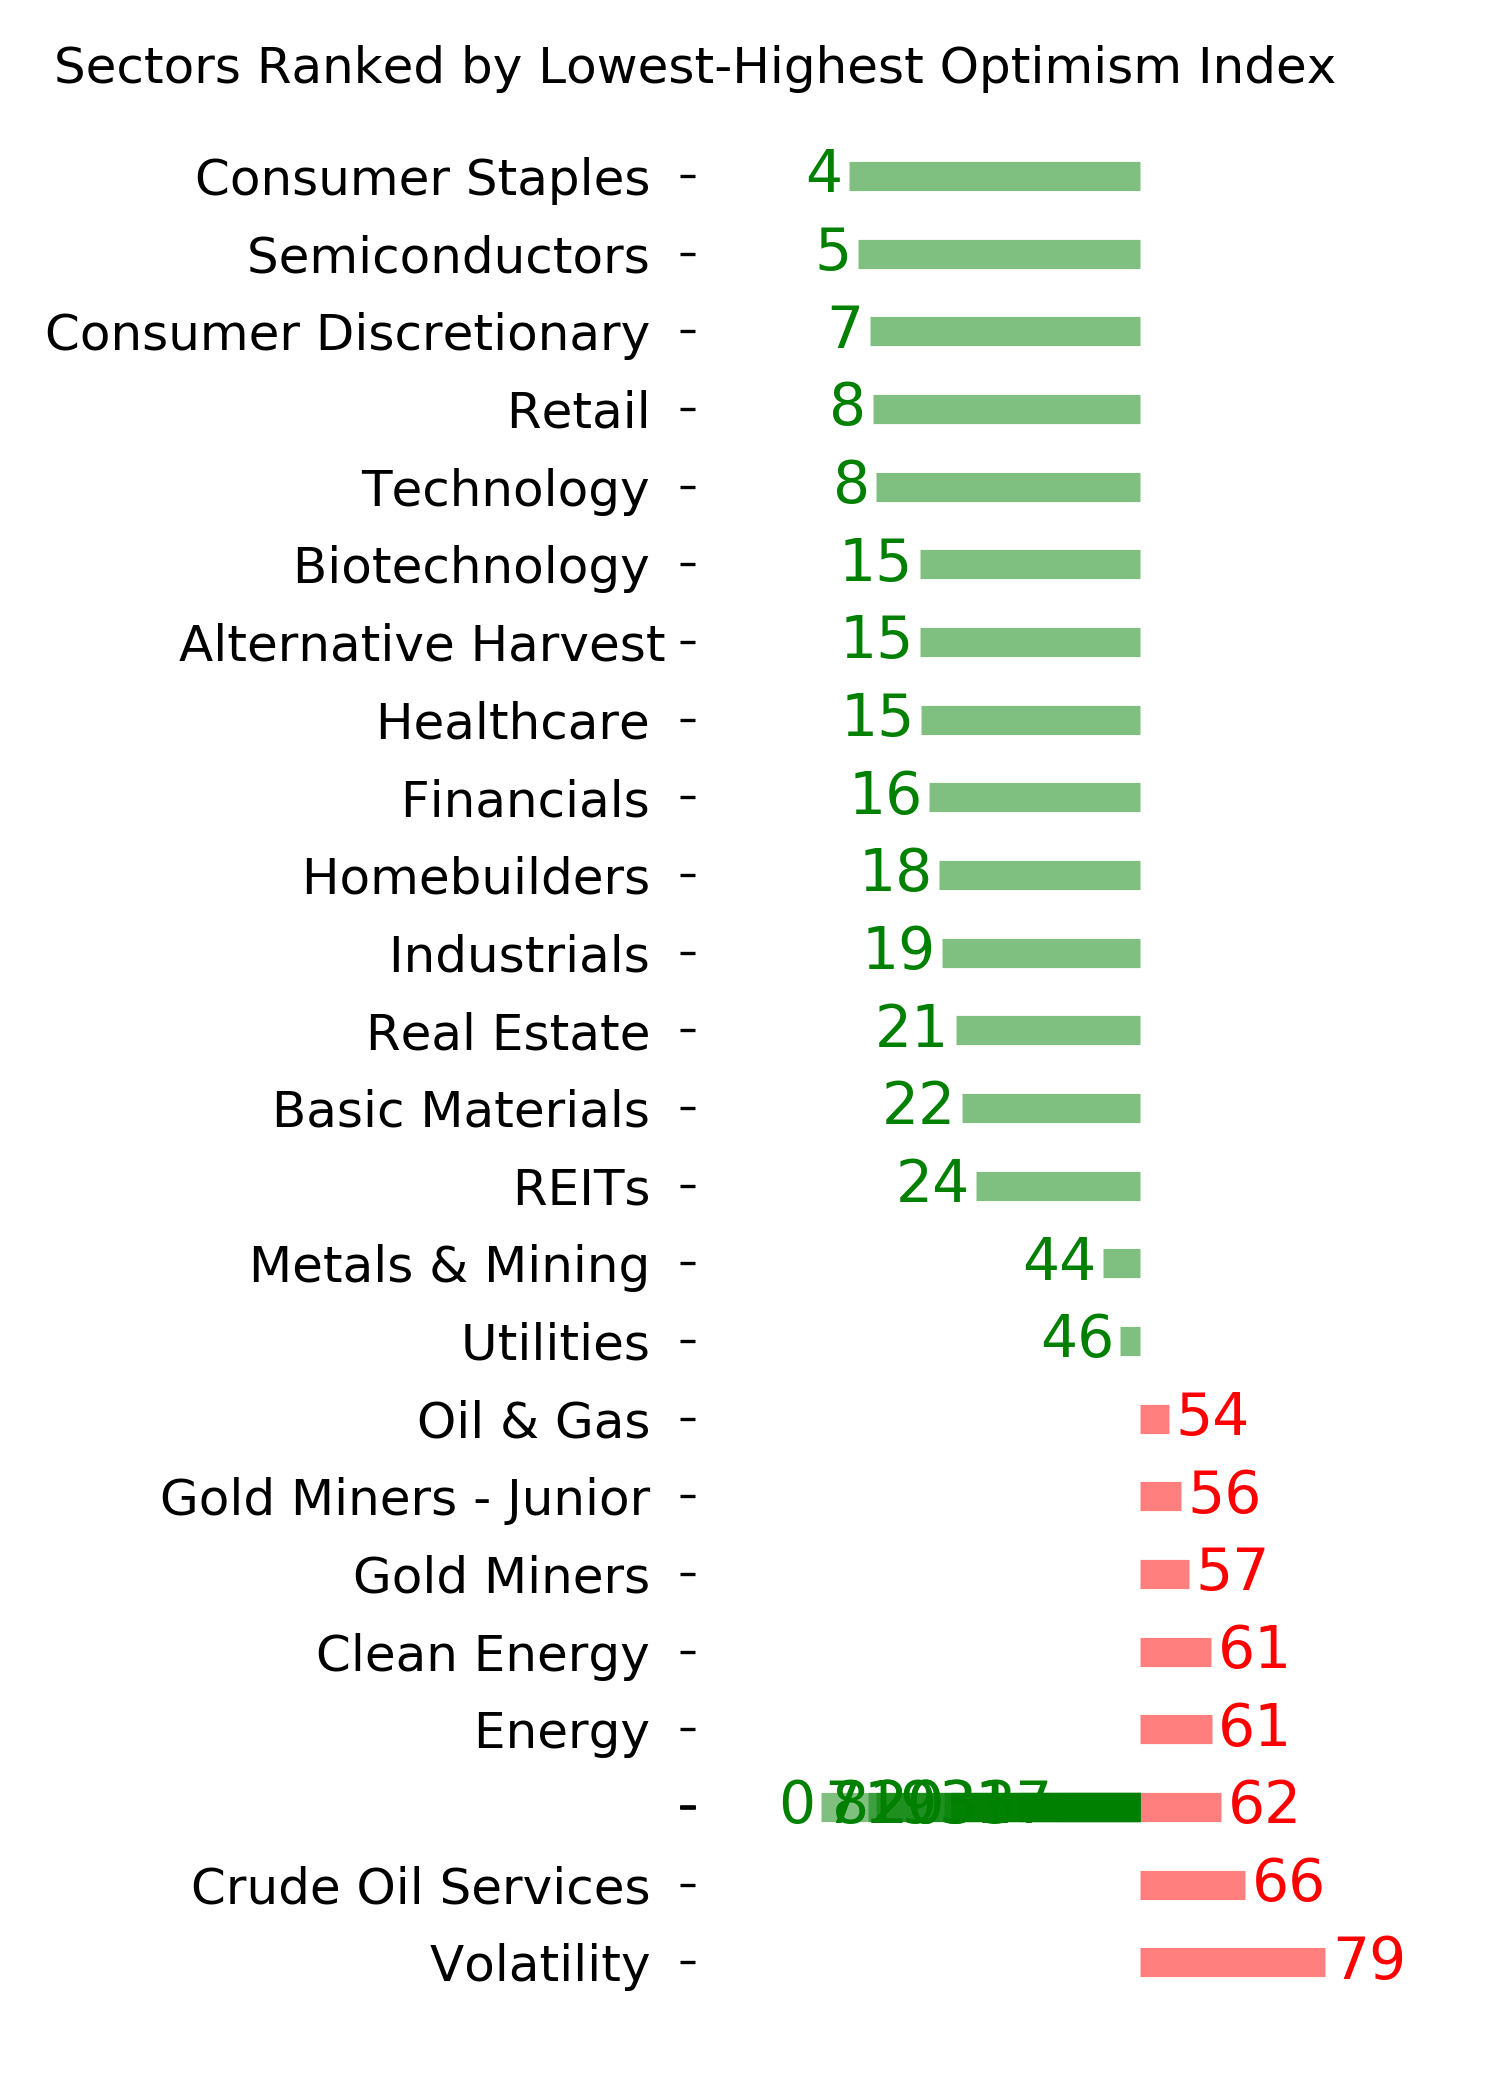
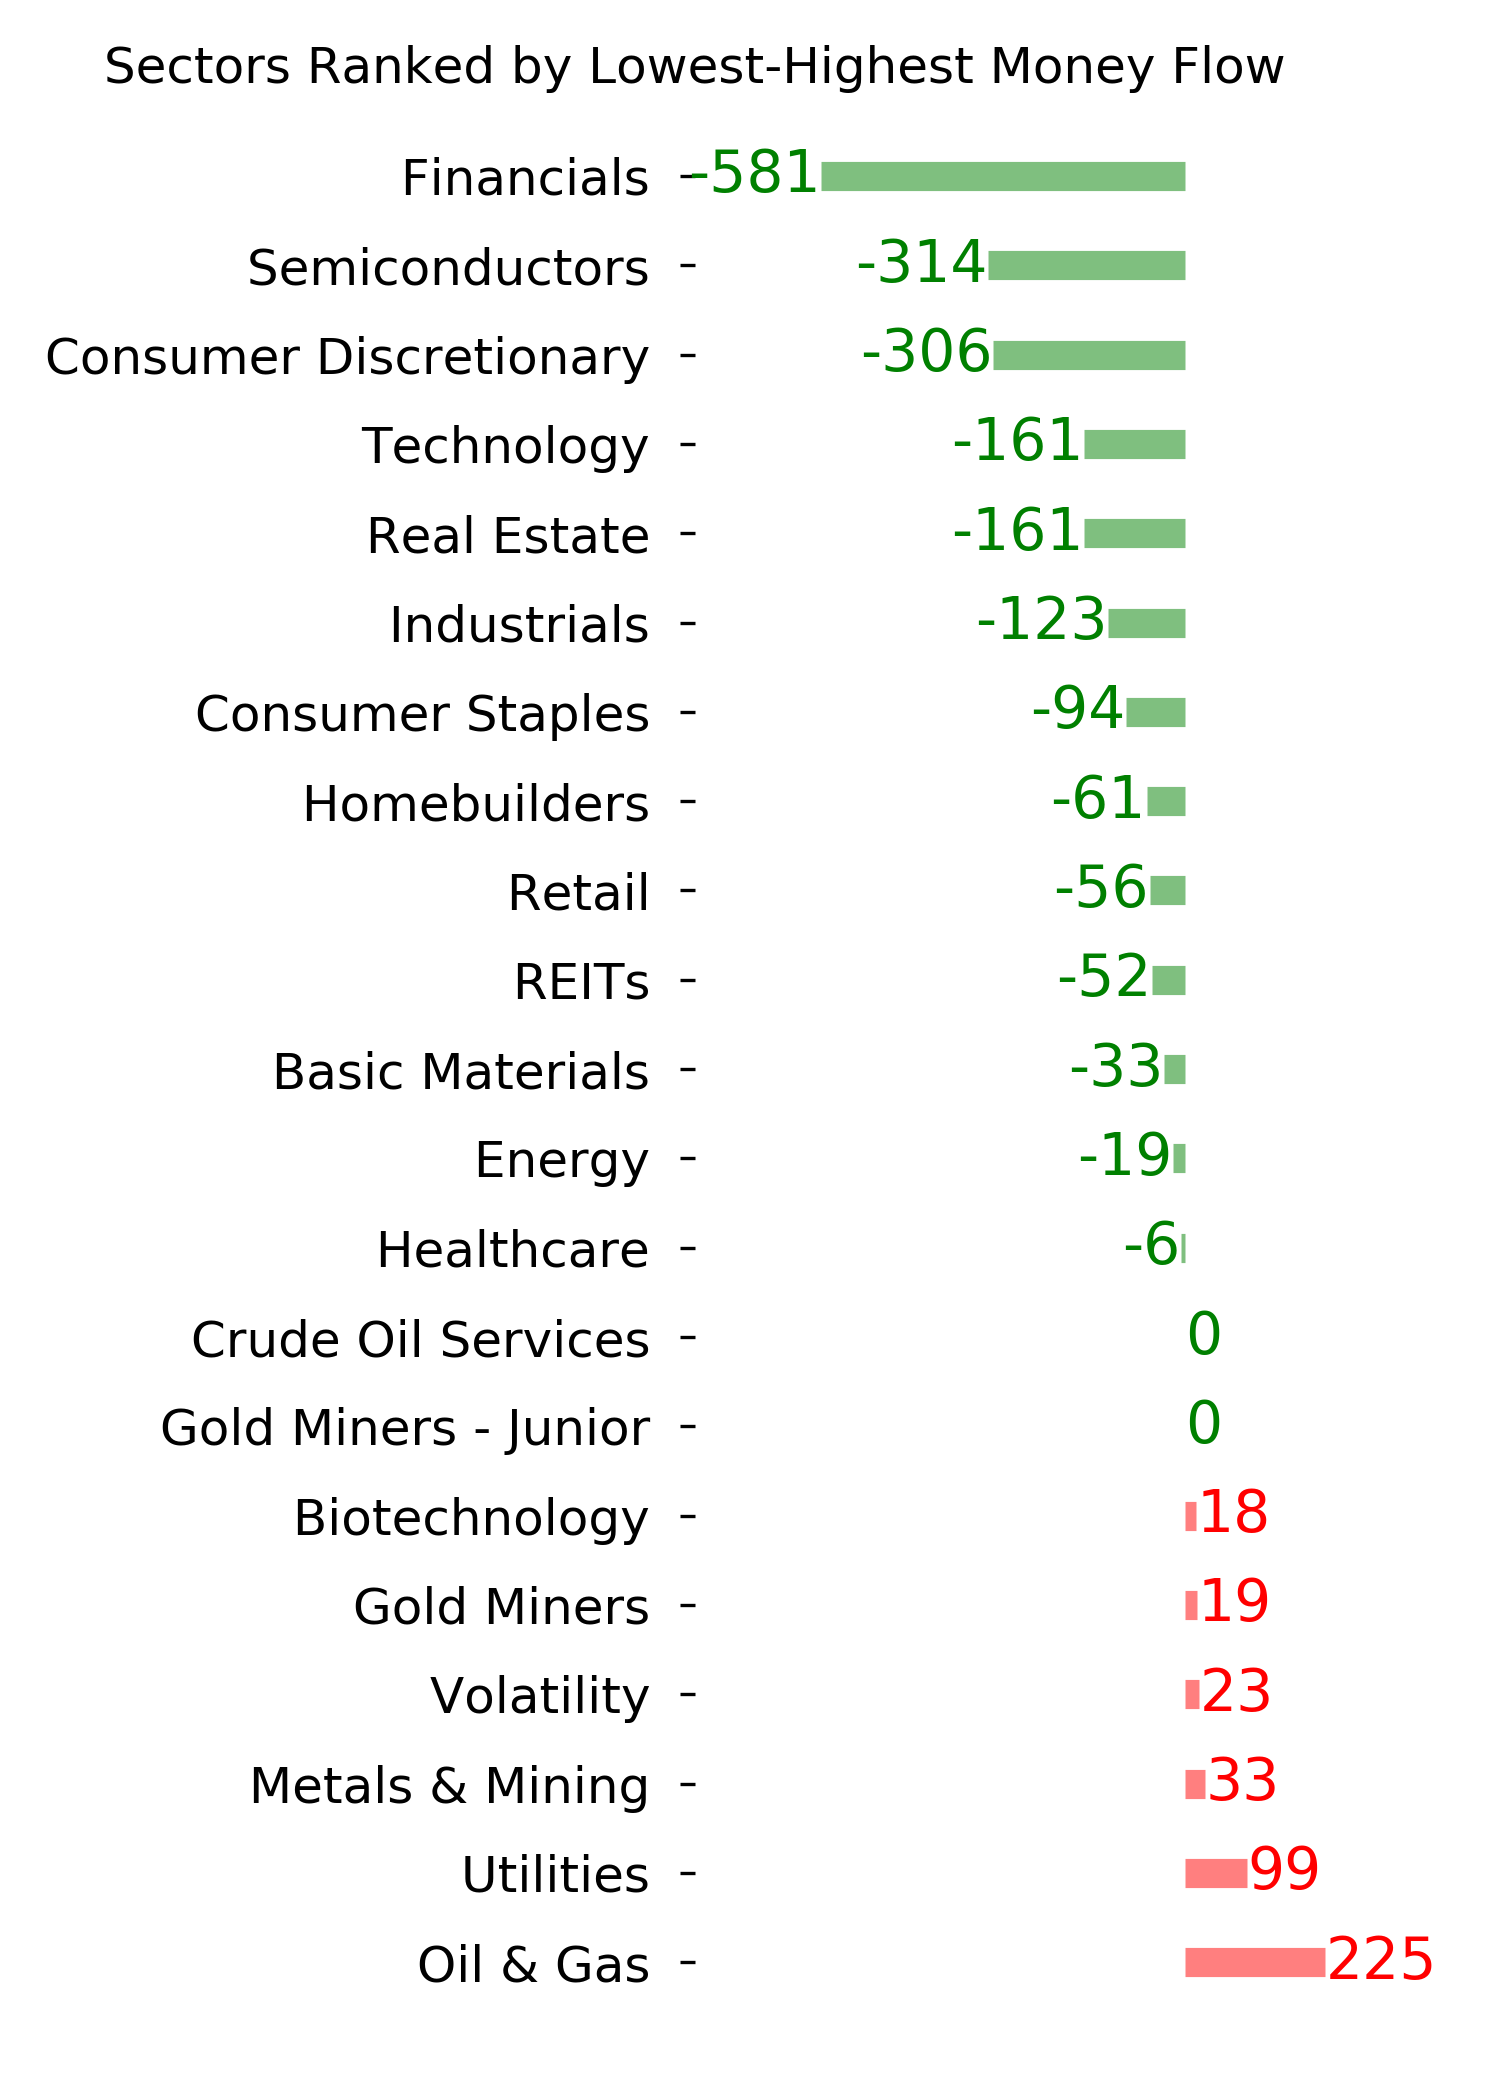
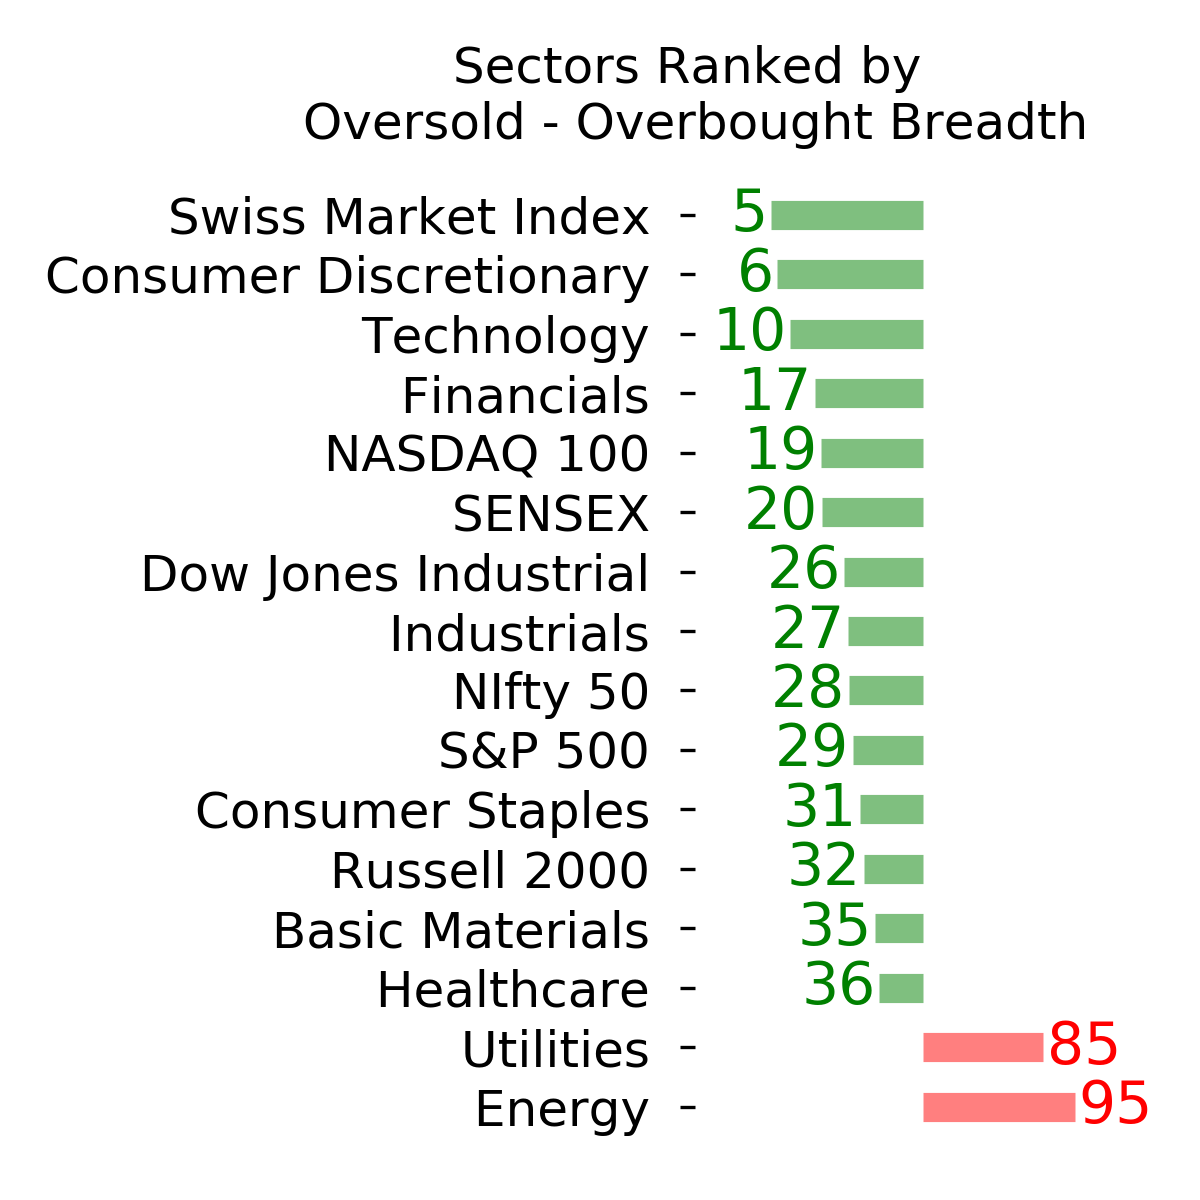
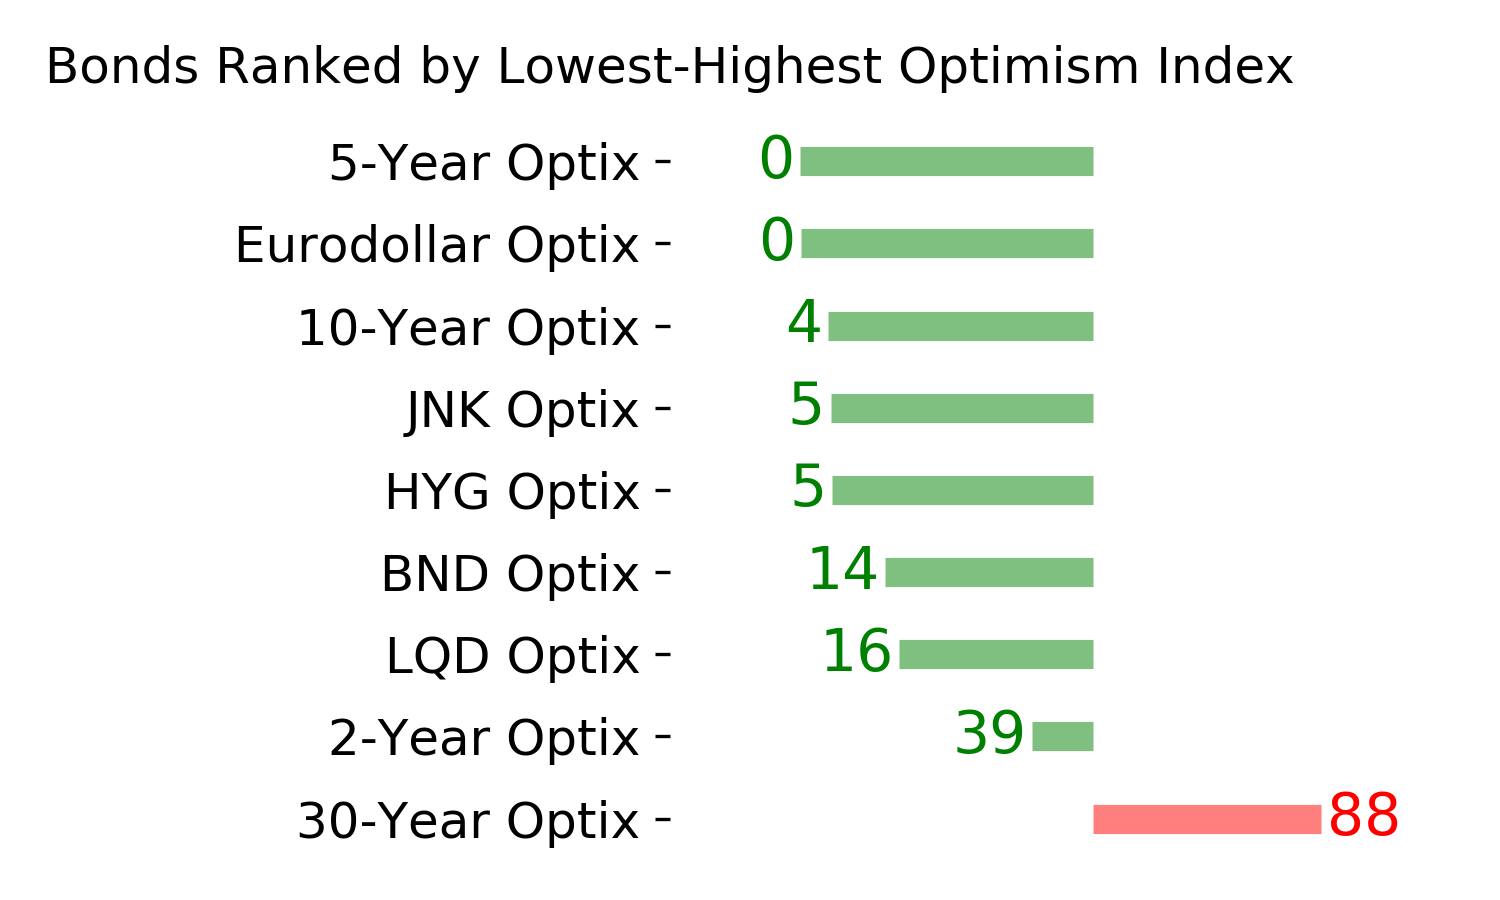
Ranks
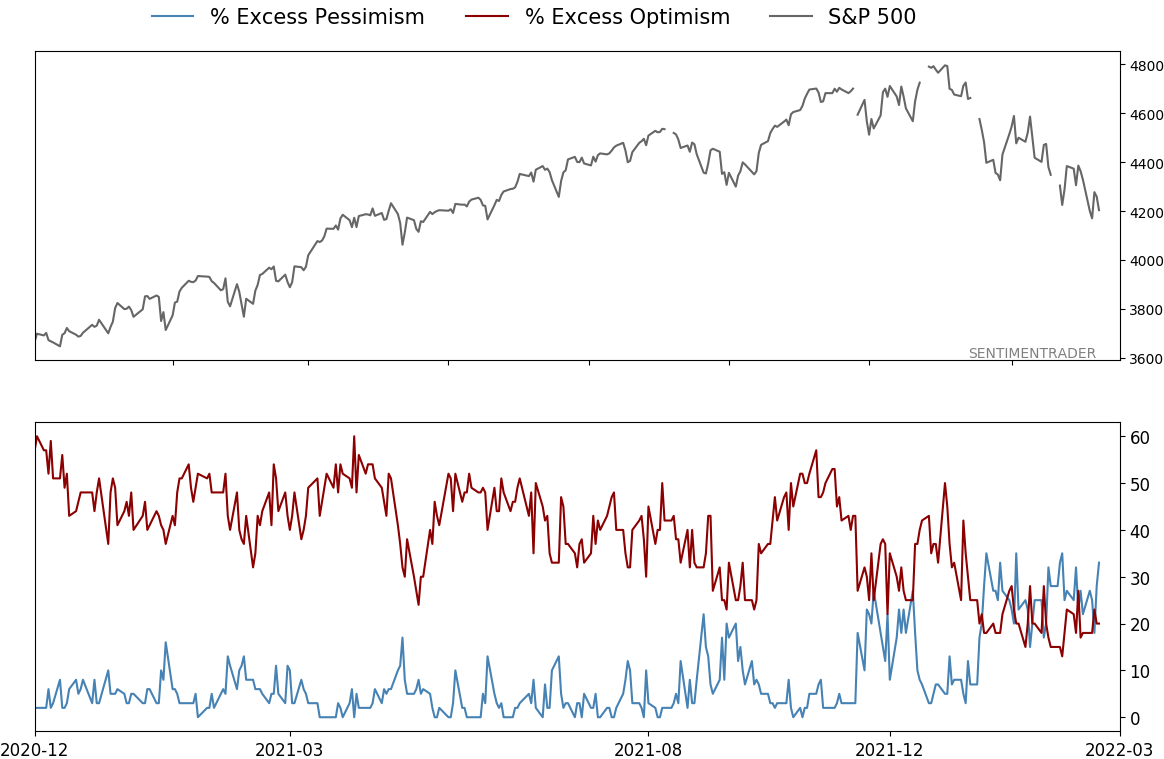
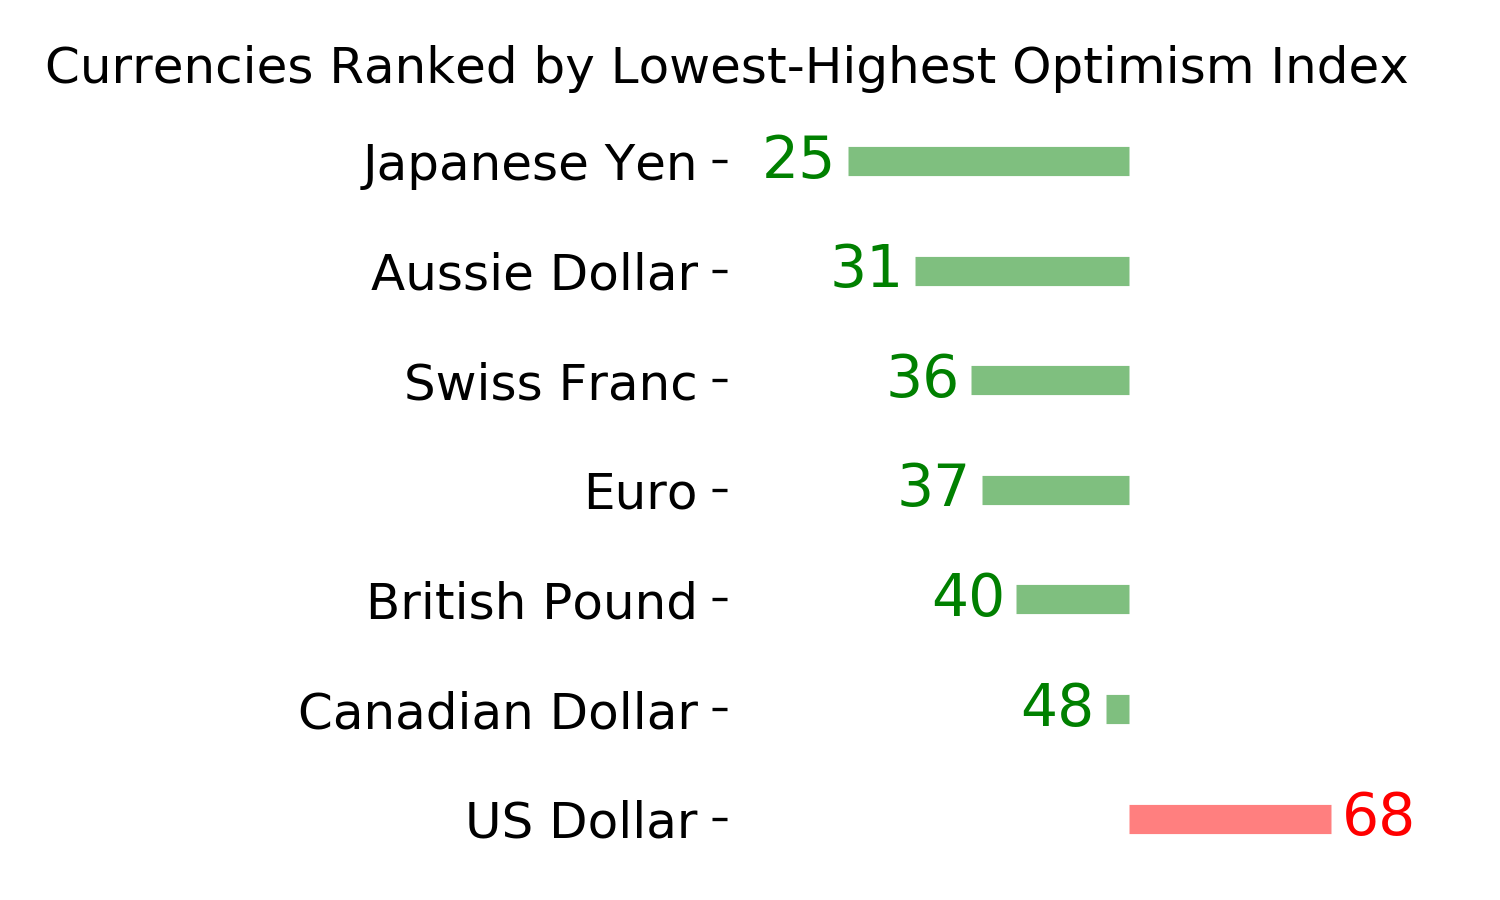
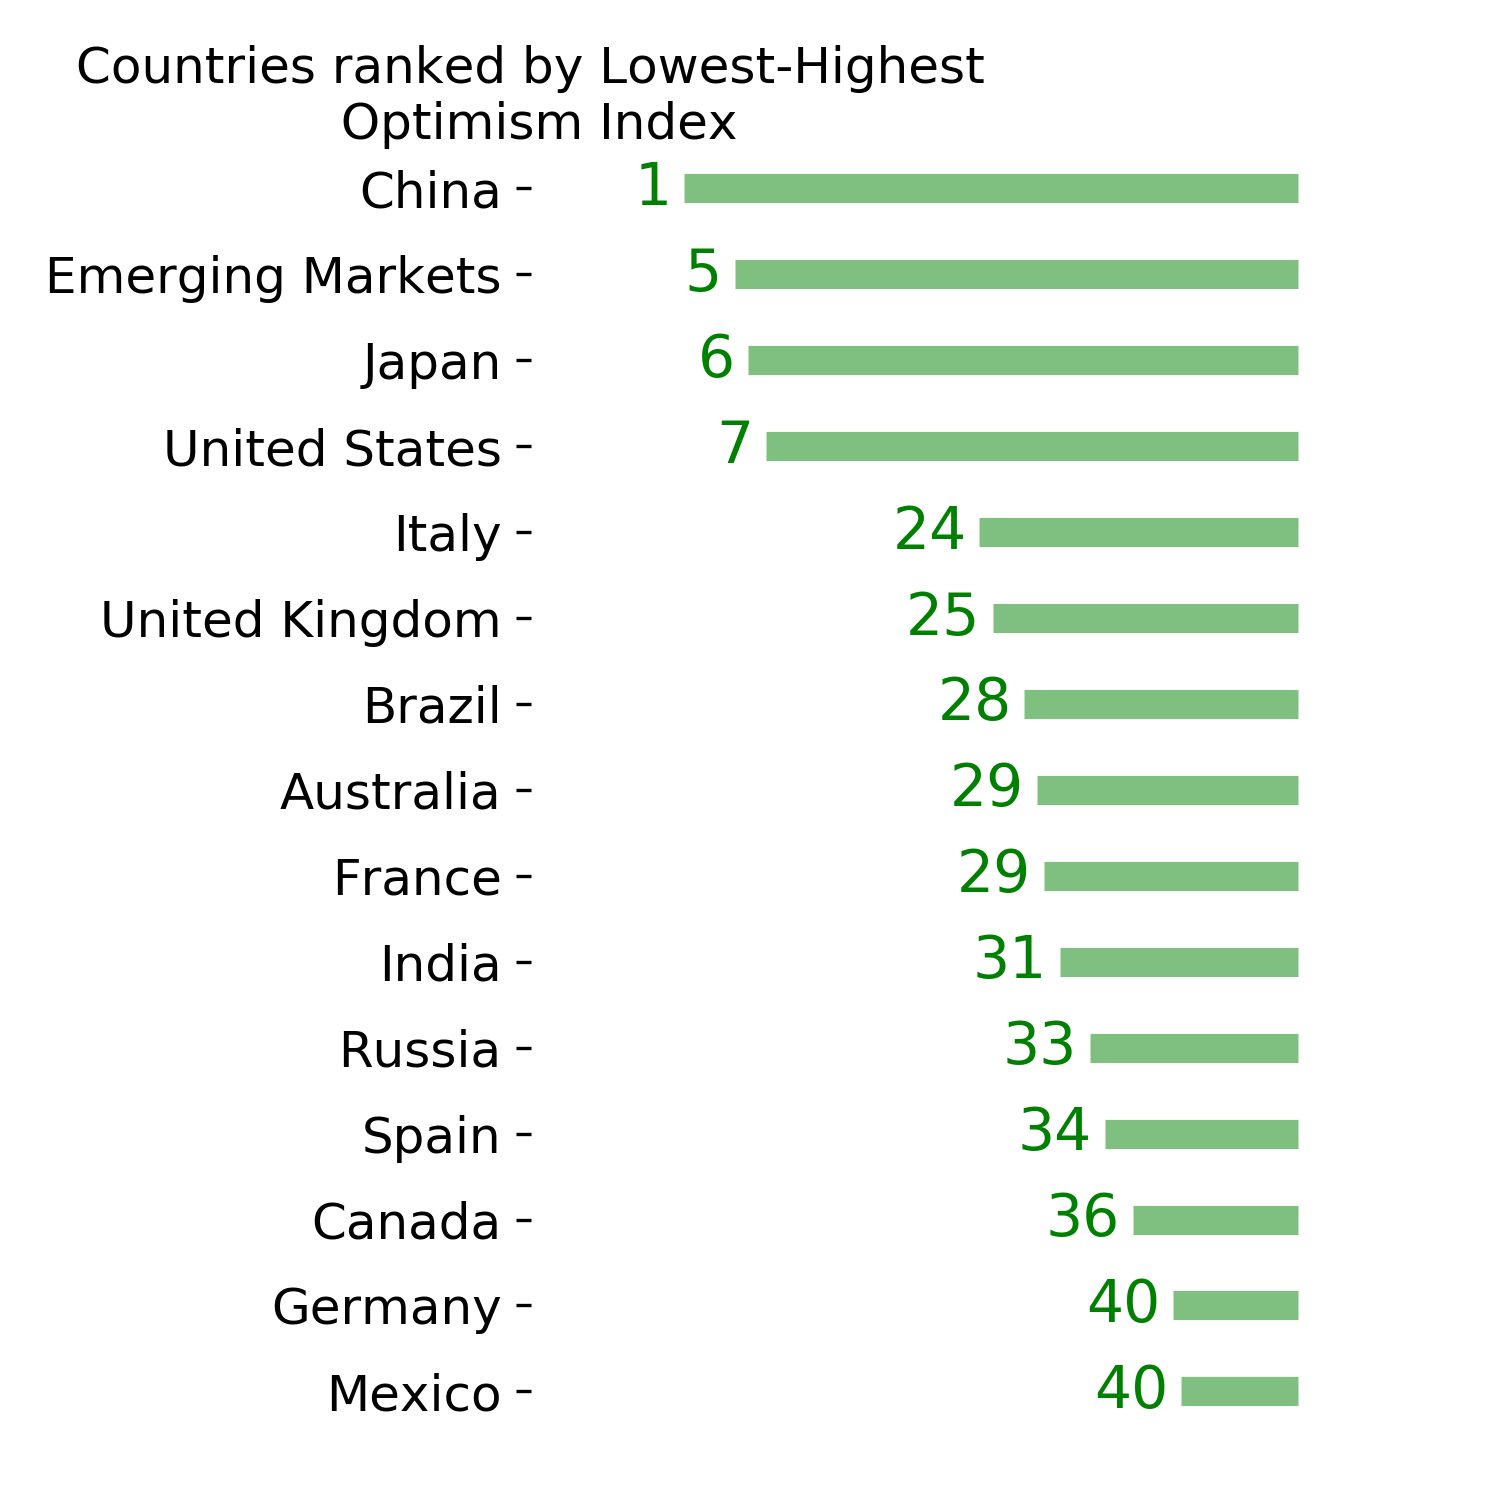
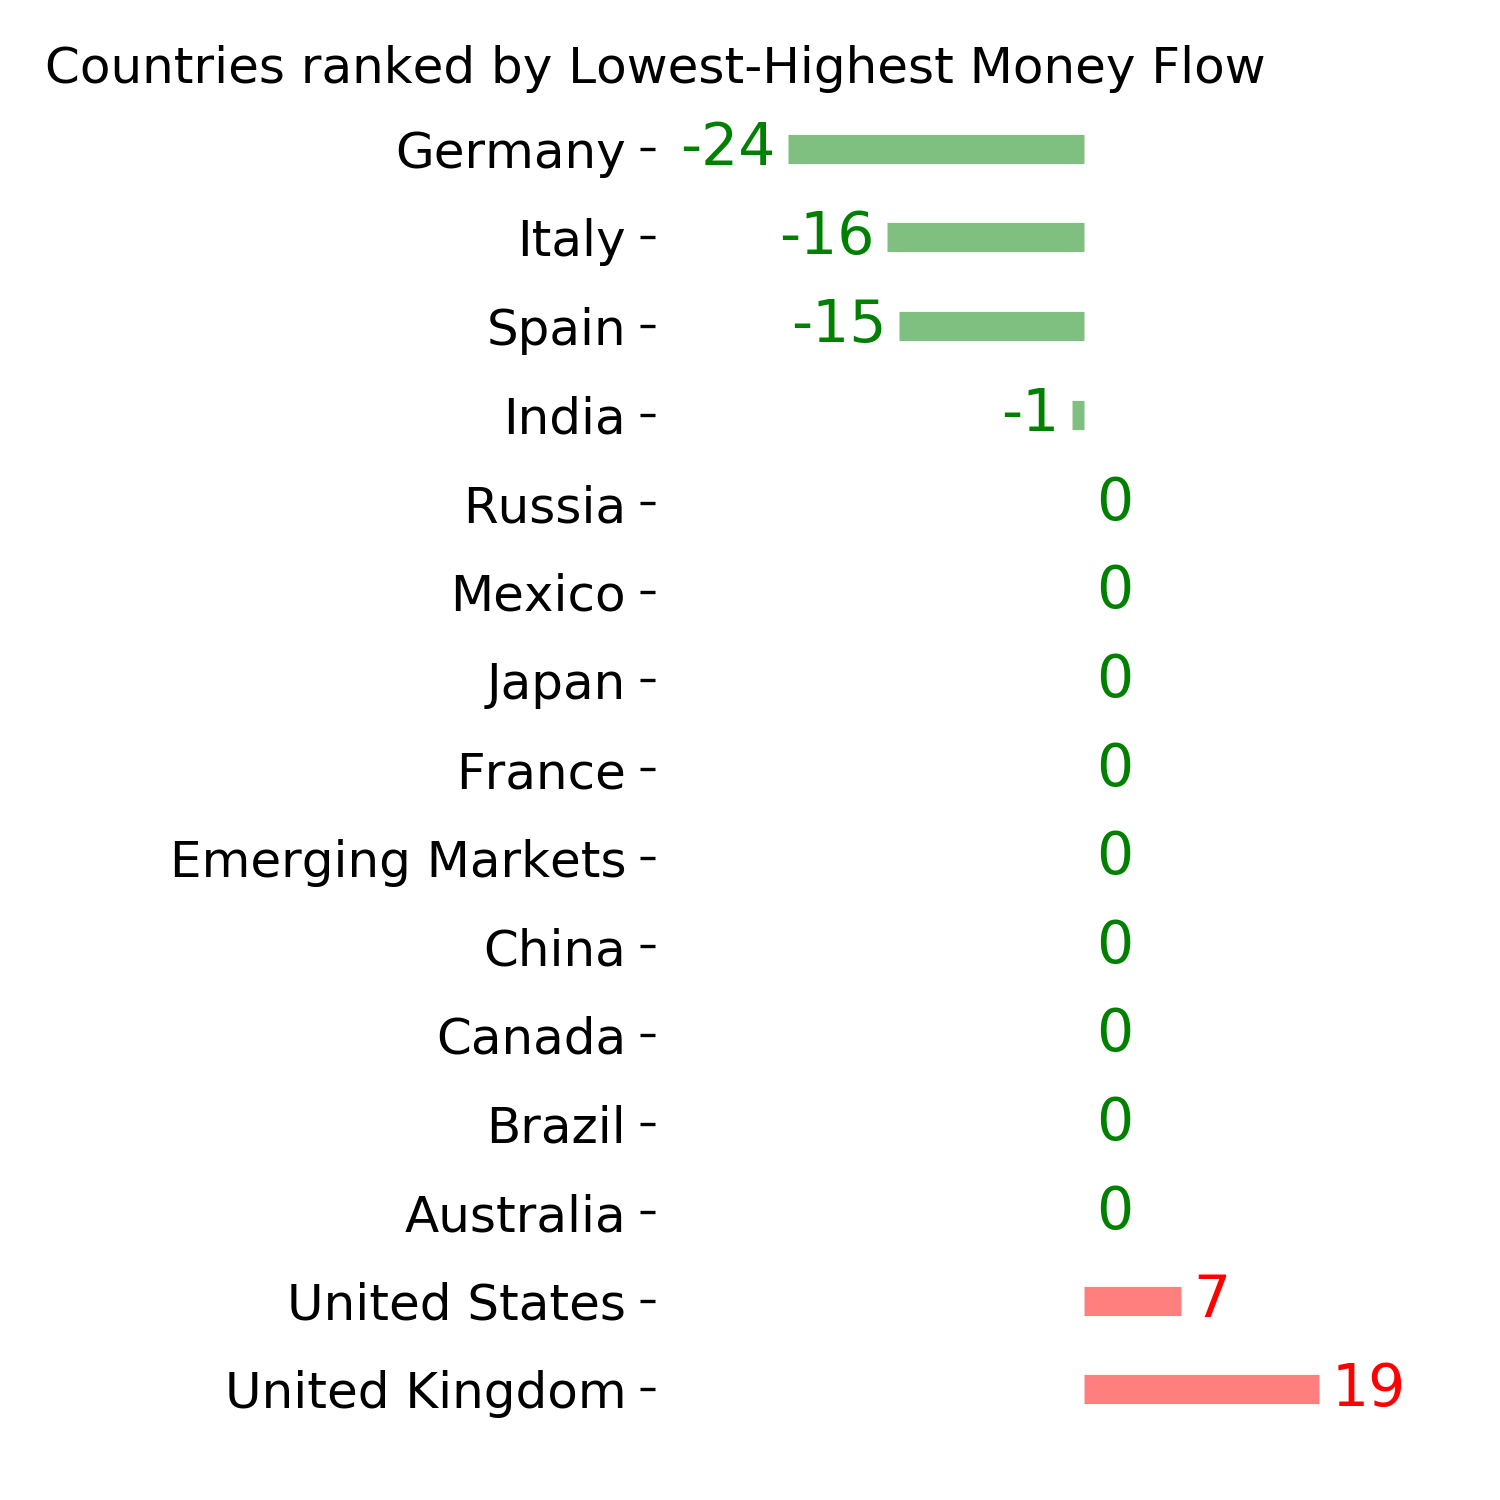
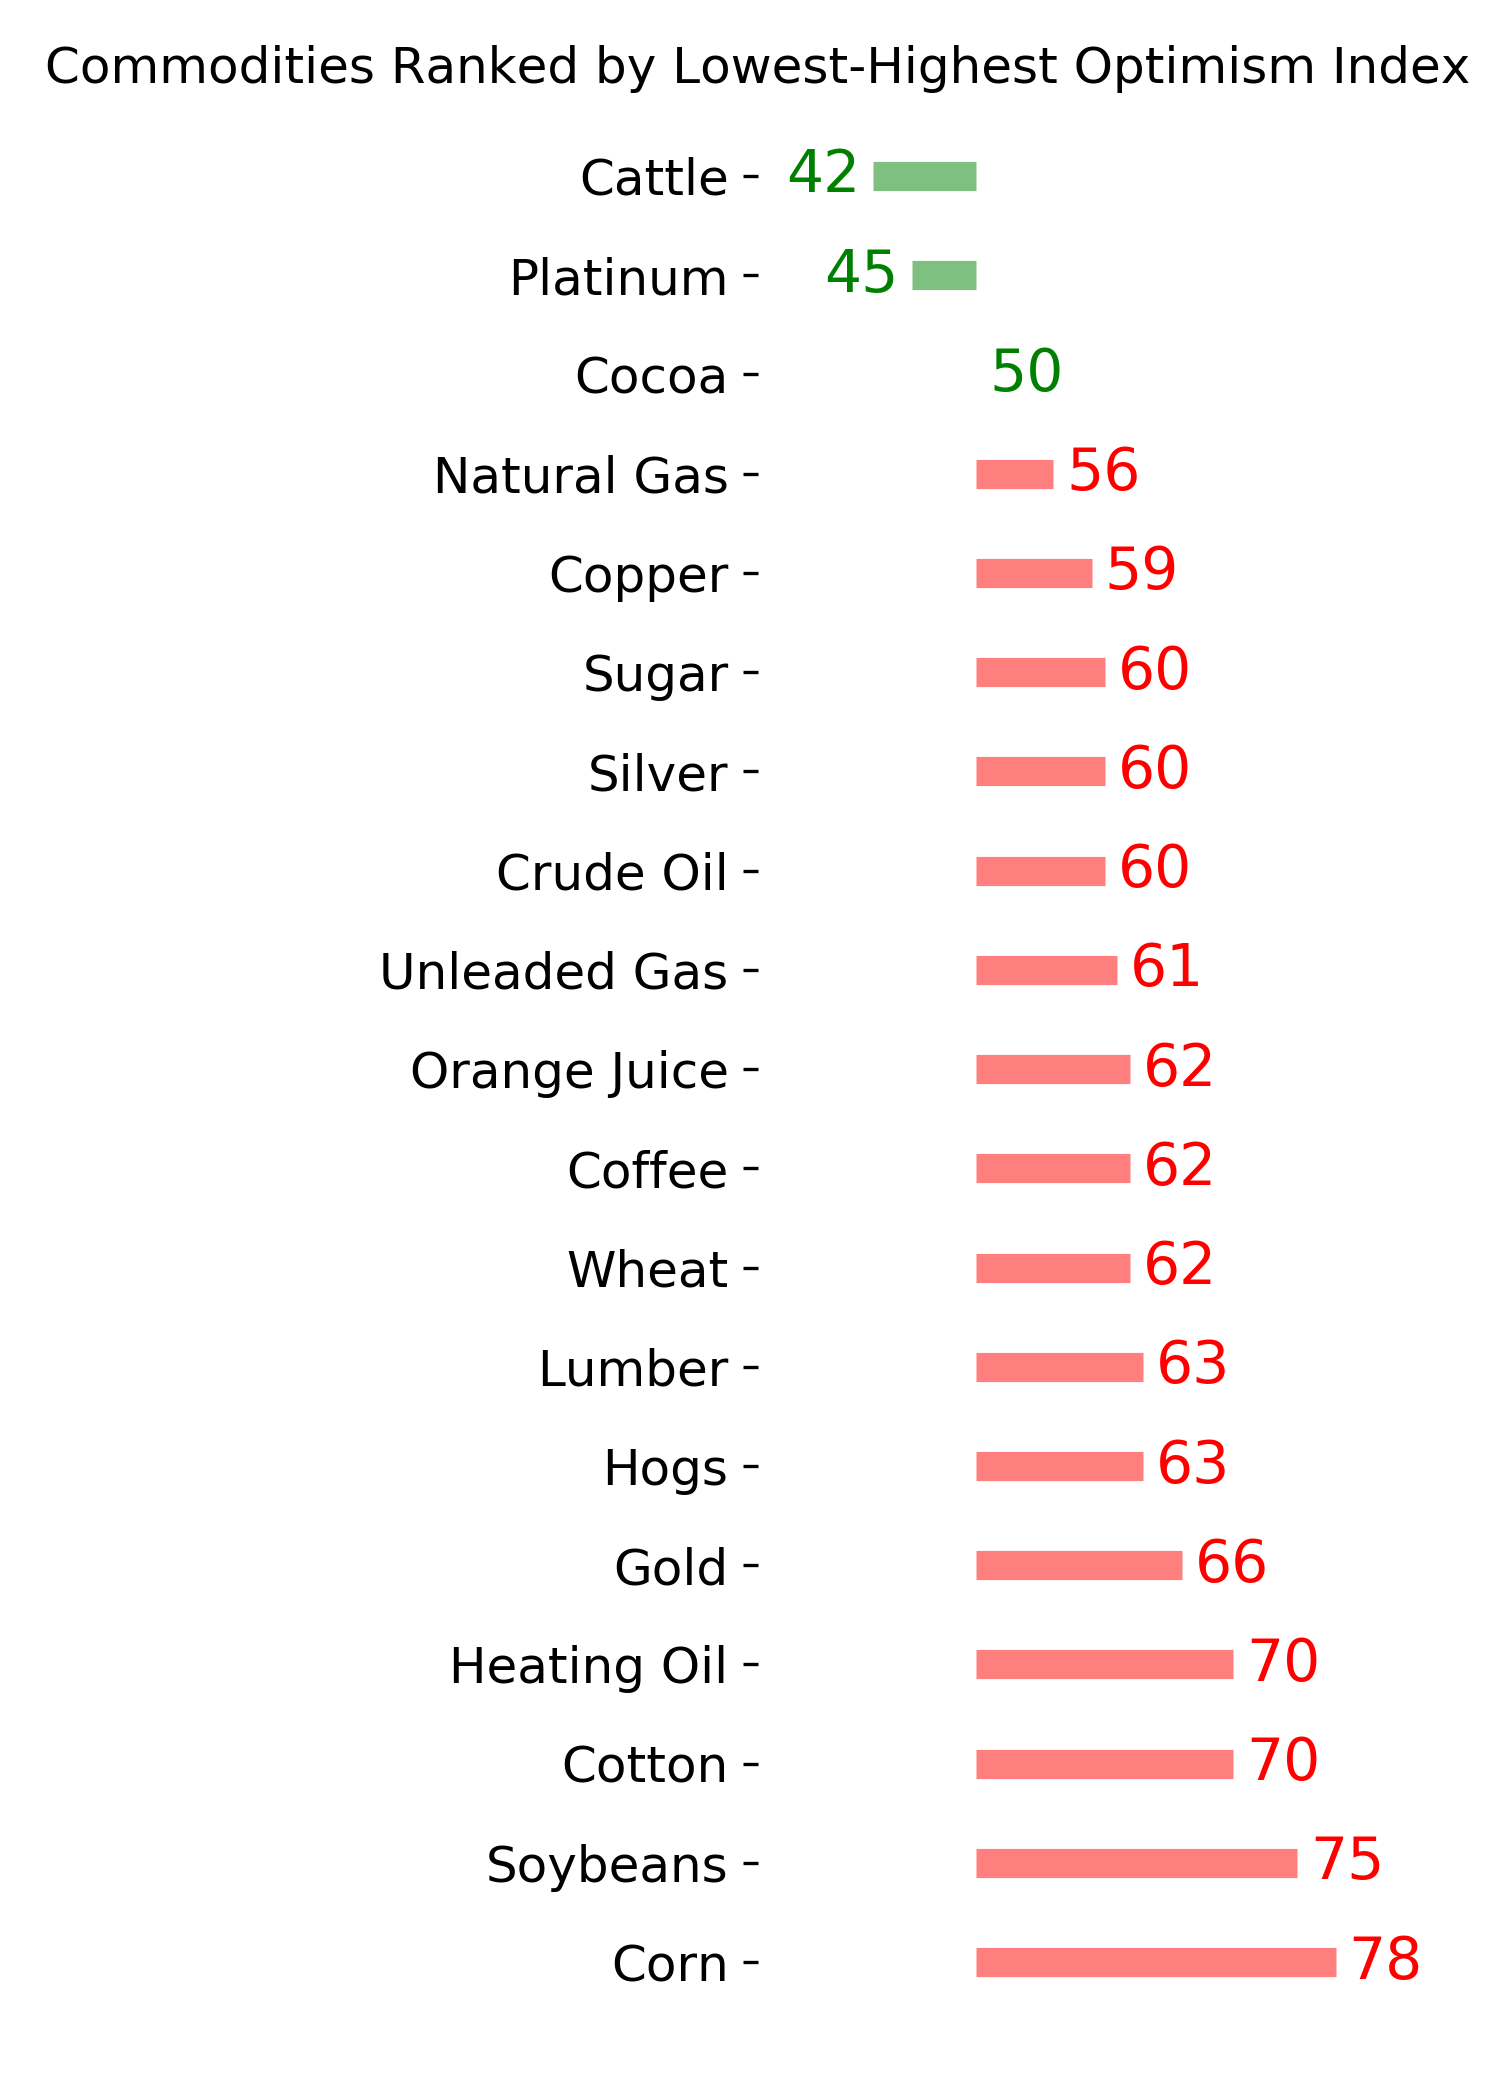
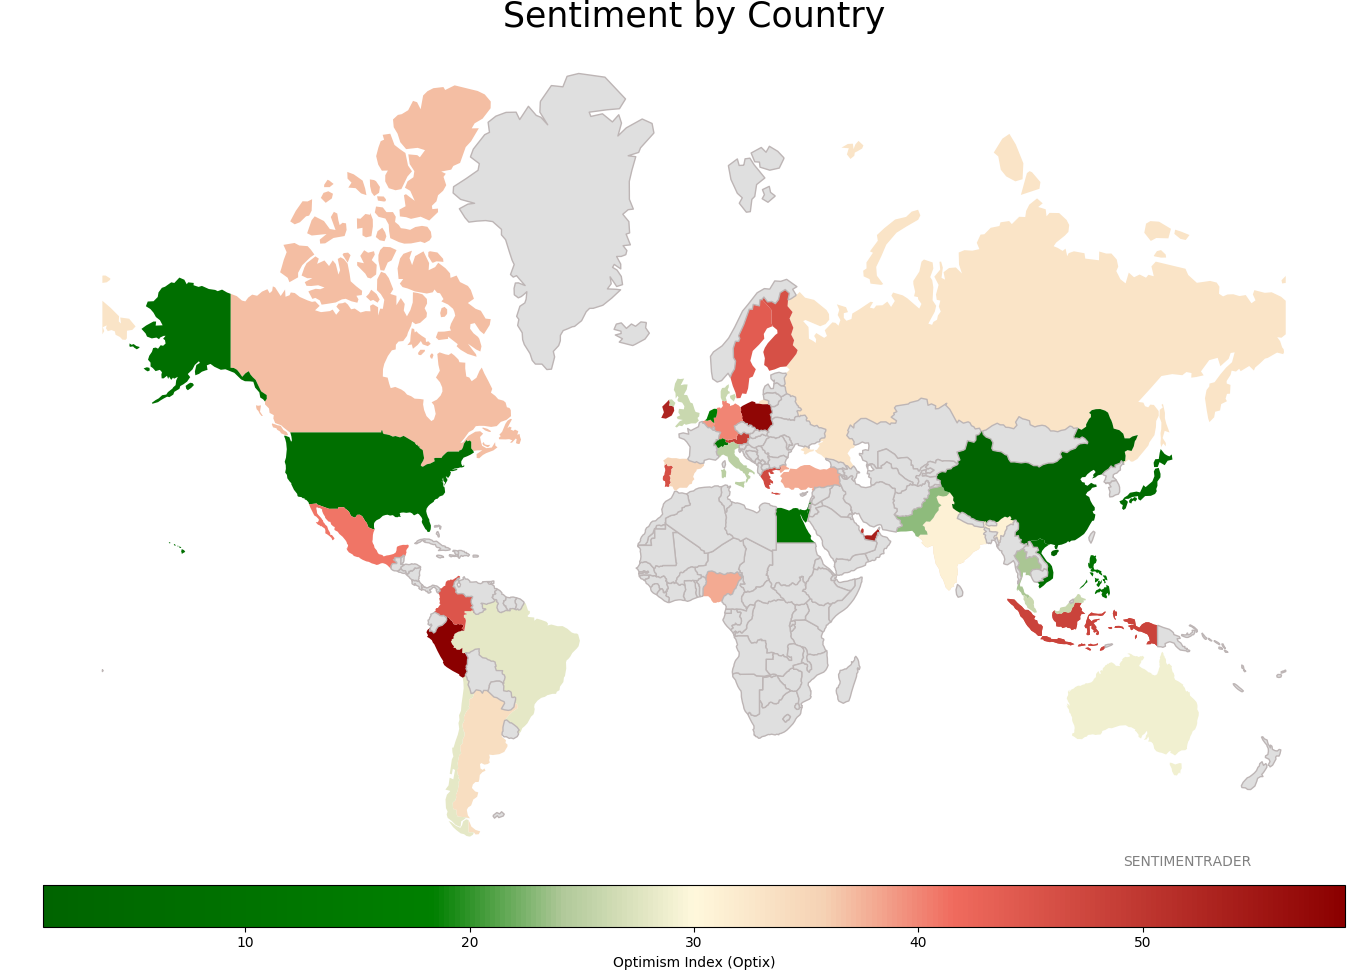
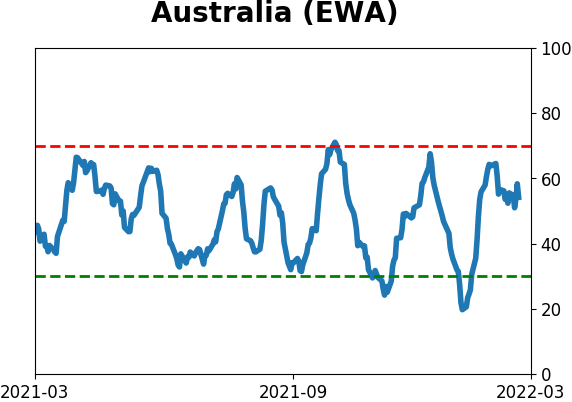
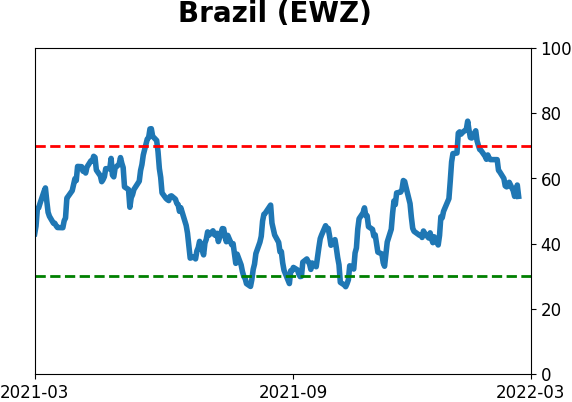
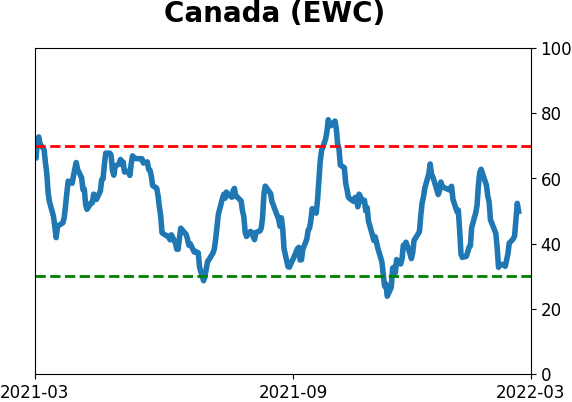
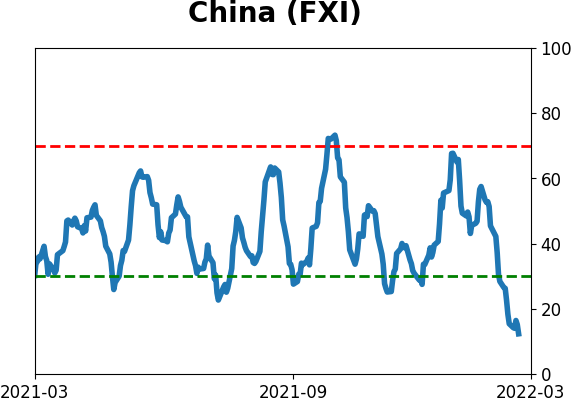
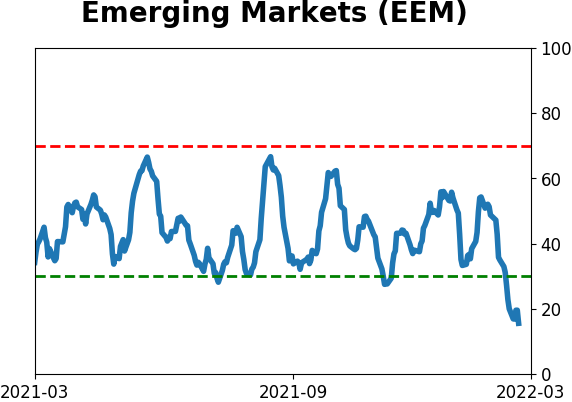
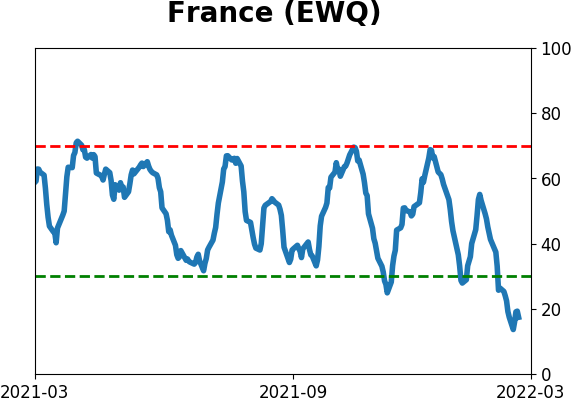
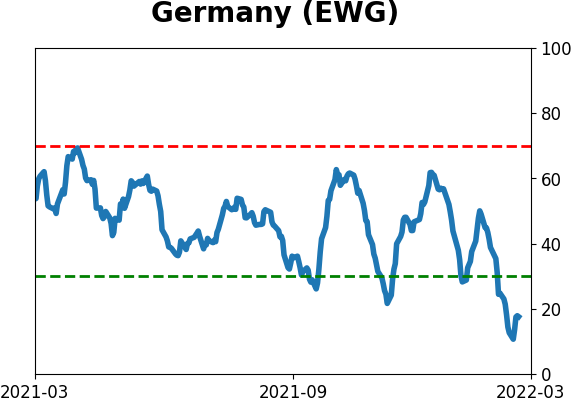
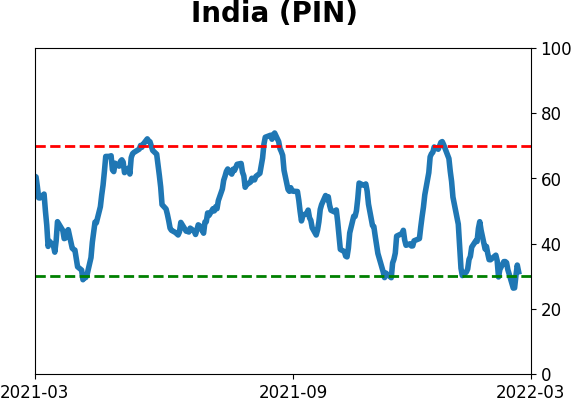
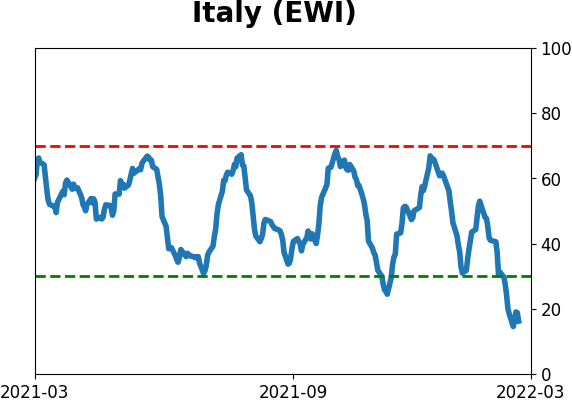
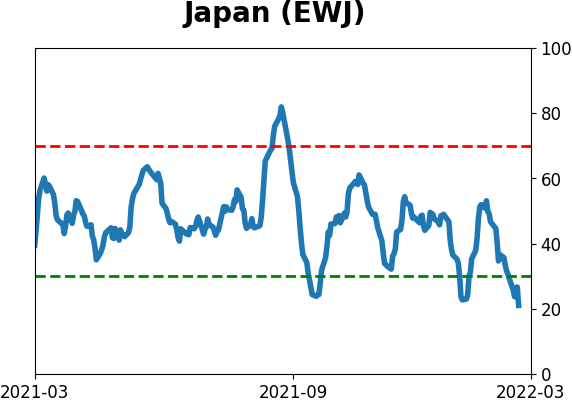
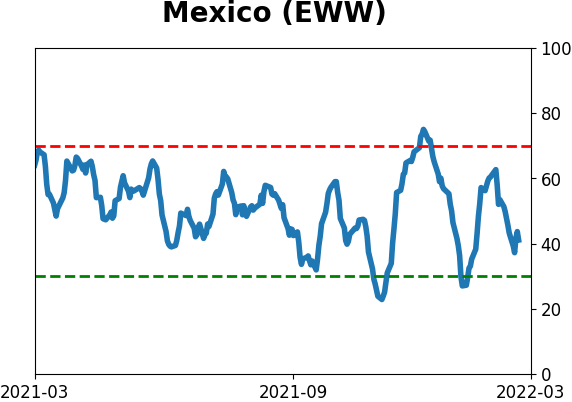
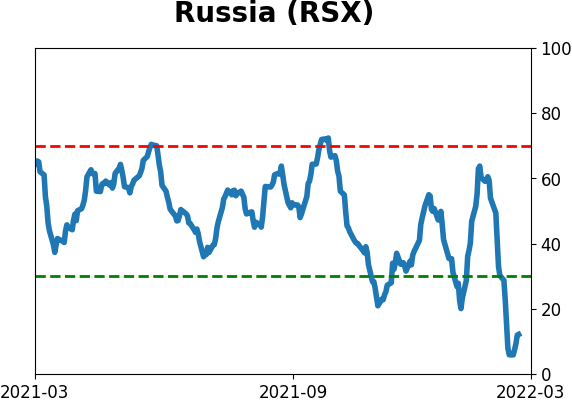
Sentiment Around The World
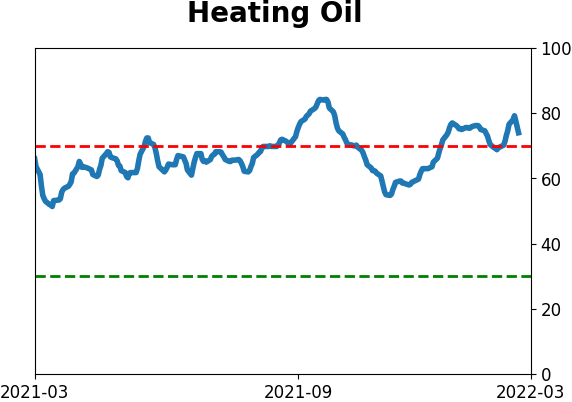
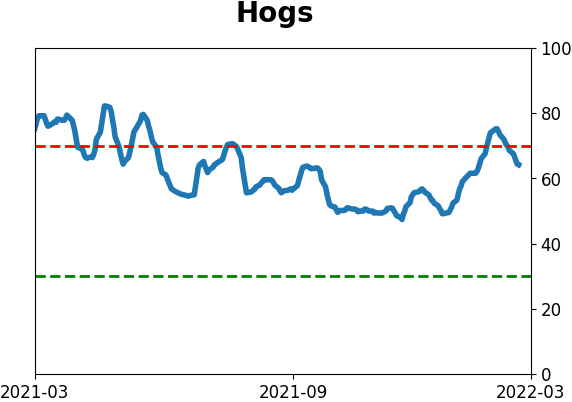
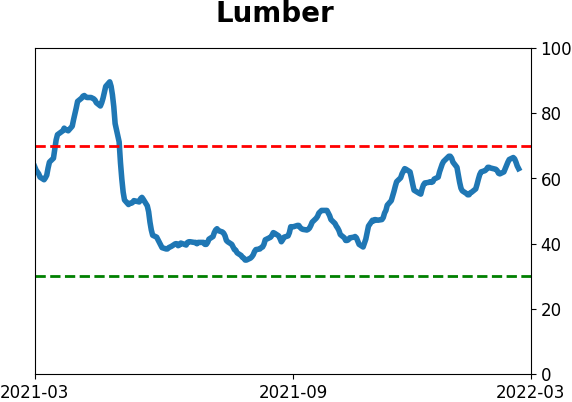
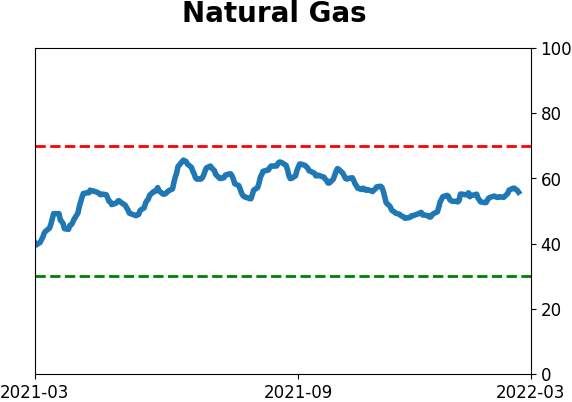
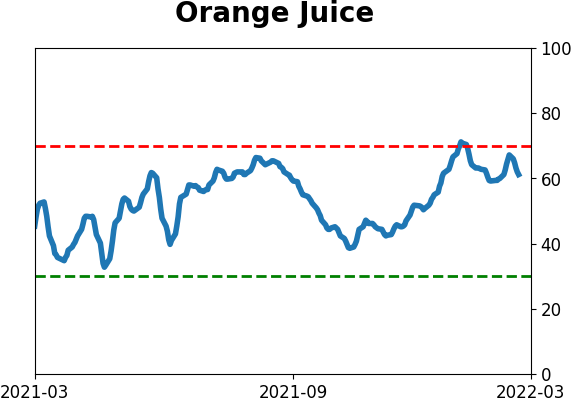
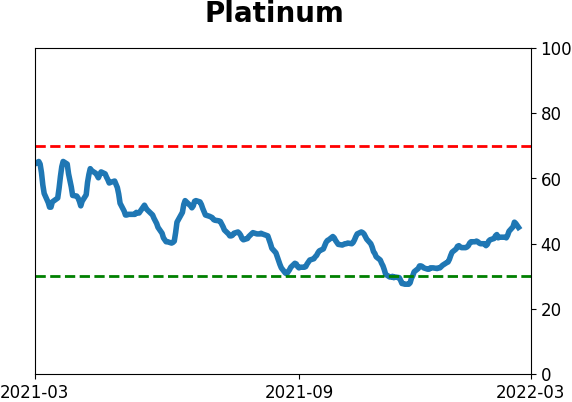
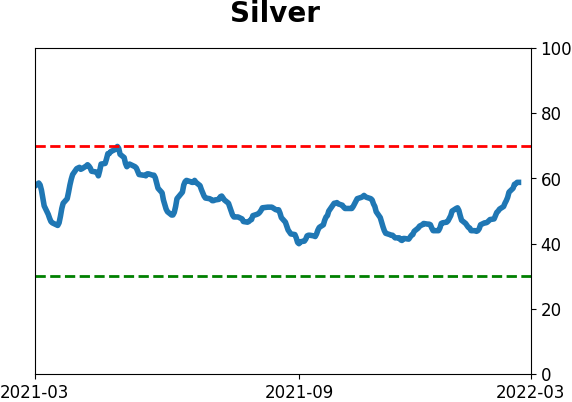
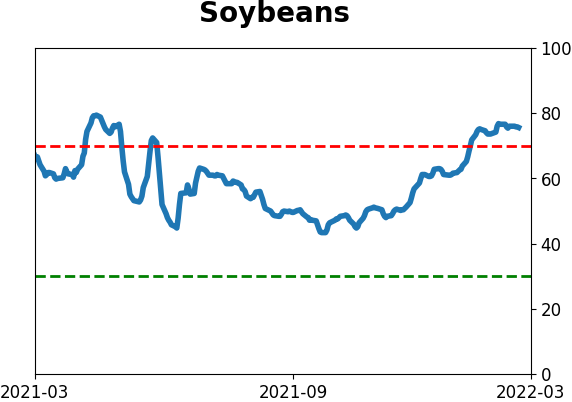
Optimism Index Thumbnails
|
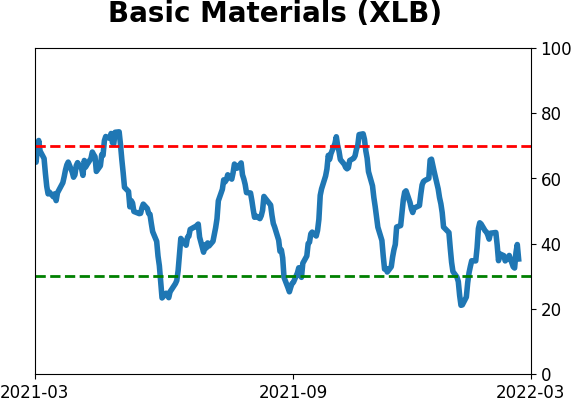
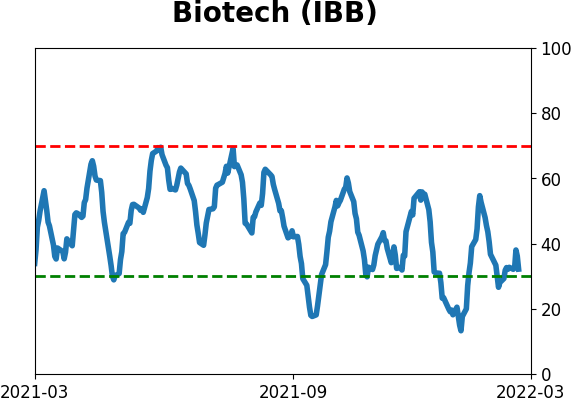
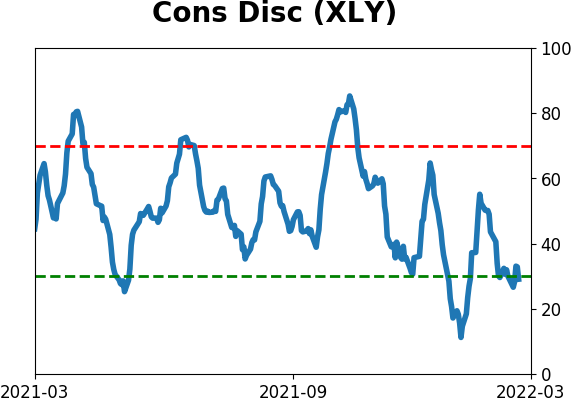
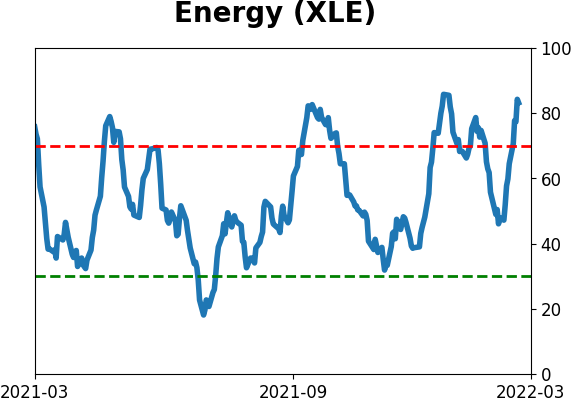
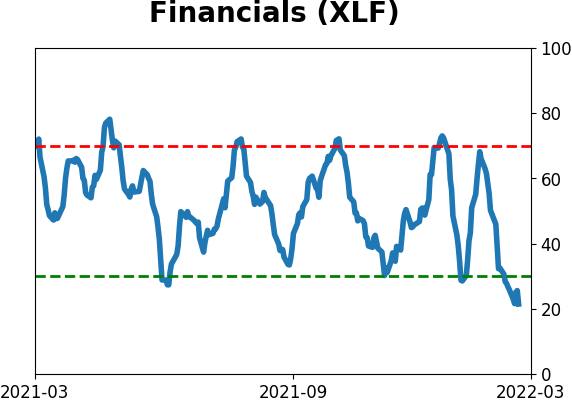
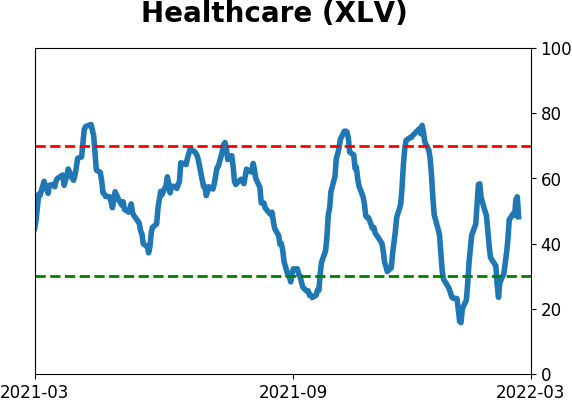
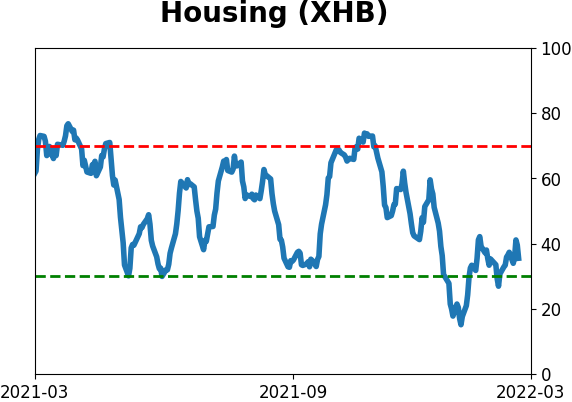
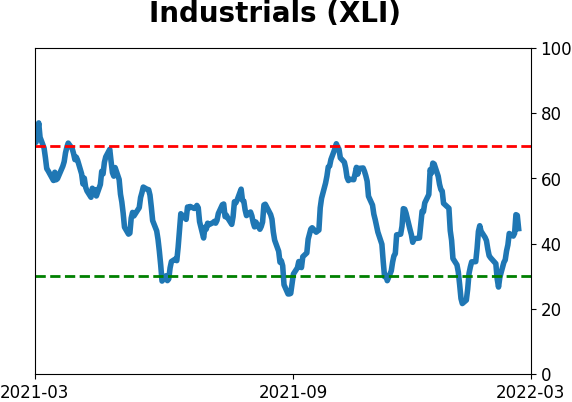
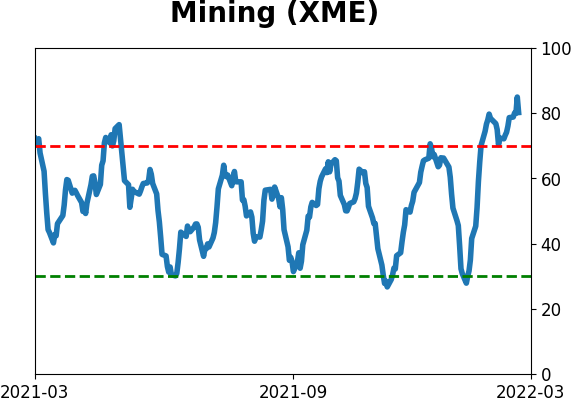
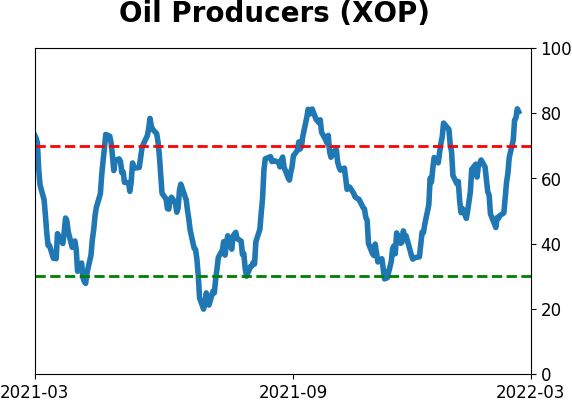
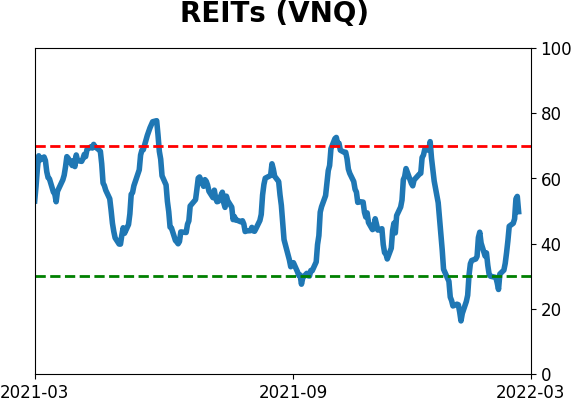
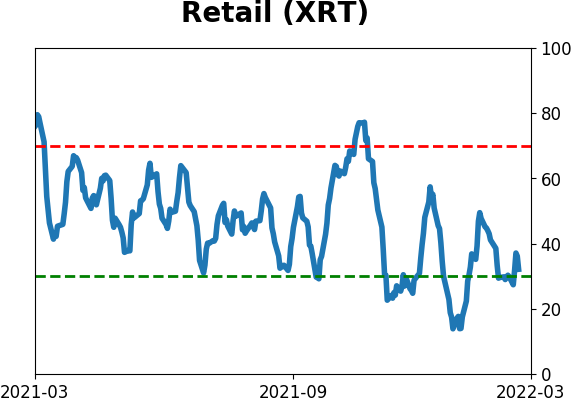
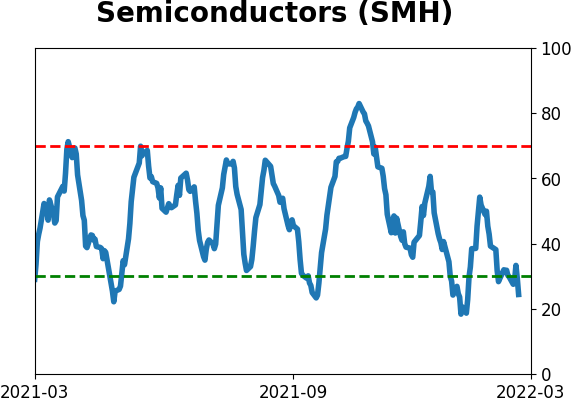
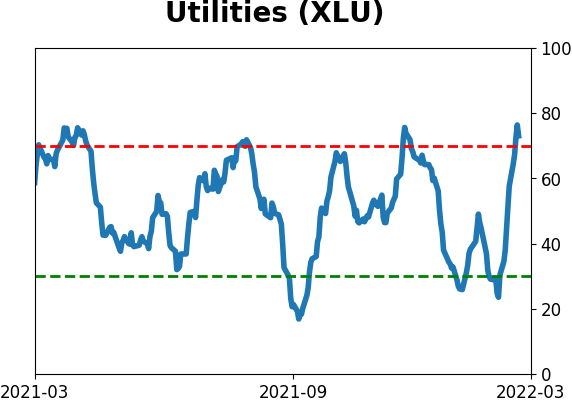
Sector ETF's - 10-Day Moving Average
|
|
|
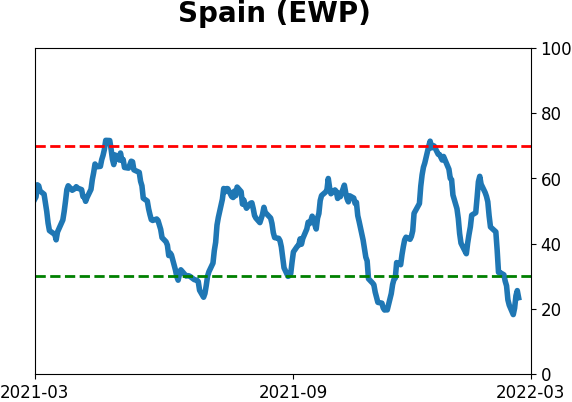
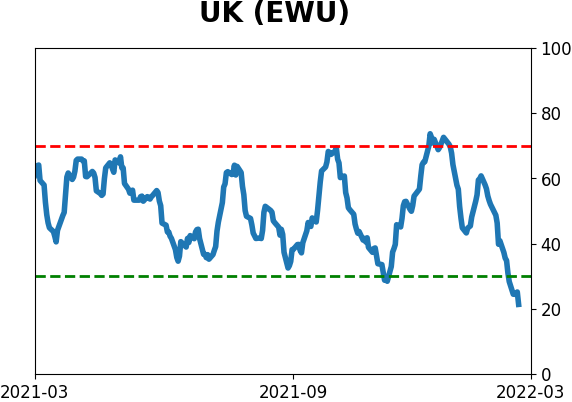
Country ETF's - 10-Day Moving Average
|
|
|
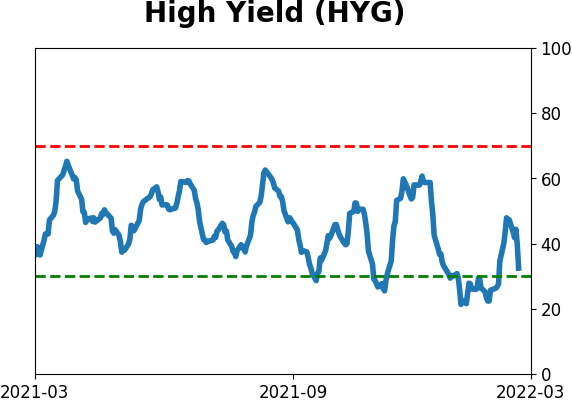
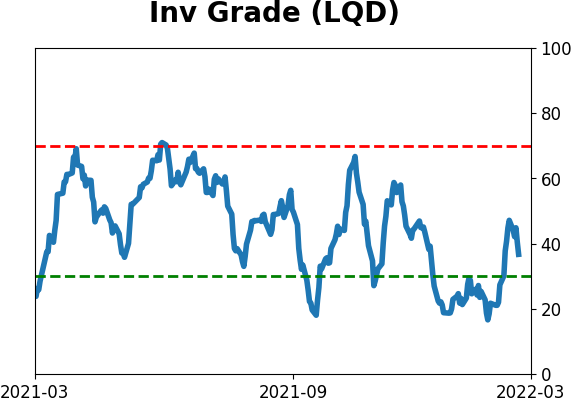
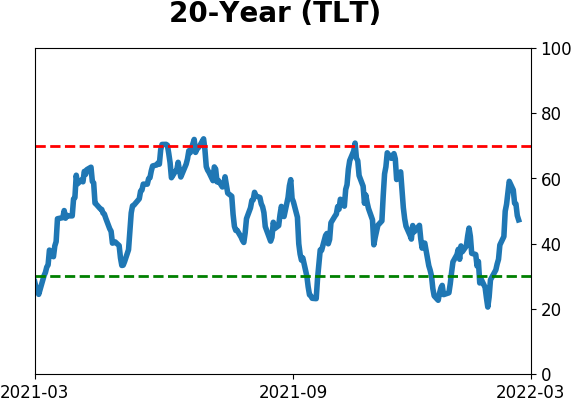
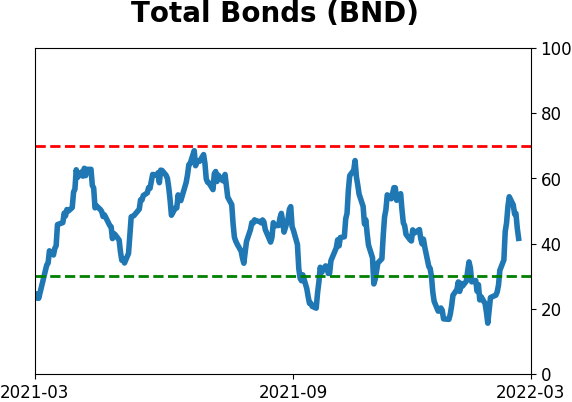
Bond ETF's - 10-Day Moving Average
|
|
|
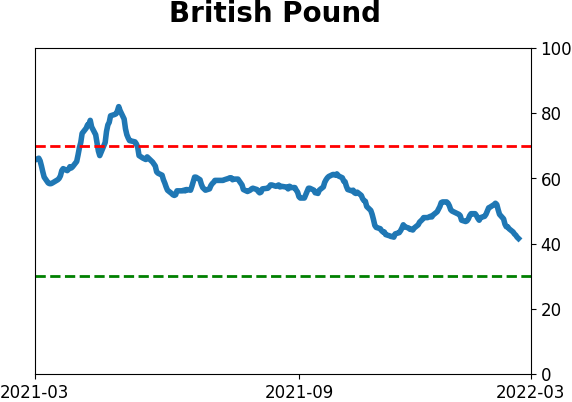
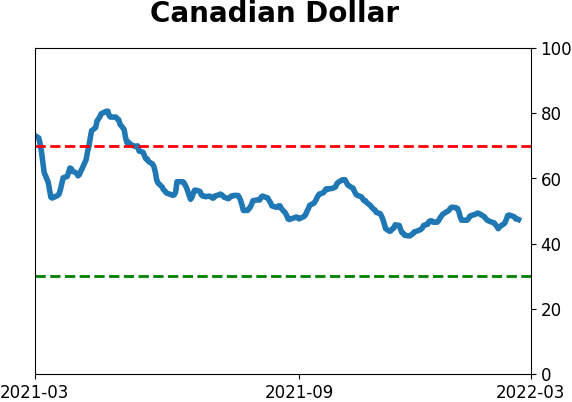
Currency ETF's - 5-Day Moving Average
|
|
|
Commodity ETF's - 5-Day Moving Average
|
|