Headlines
|
|
Penny stocks see another surge:
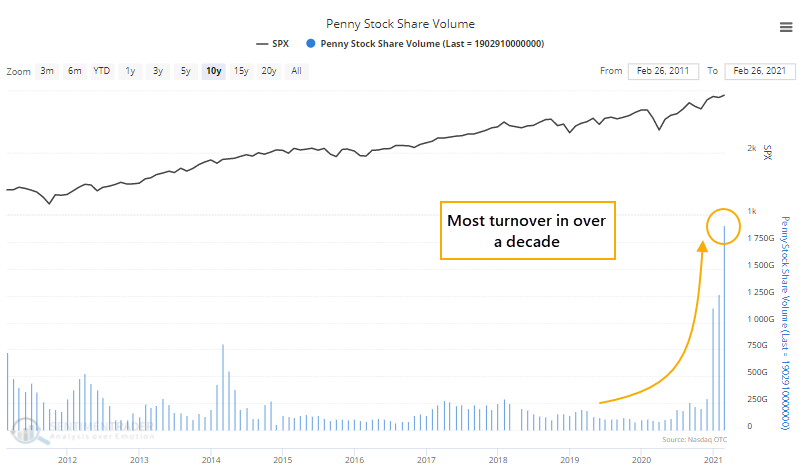
Through February, traders continued to pour into the most speculative corners of the market, including over-the-counter, or penny, stocks. Volume there is the highest in over a decade.
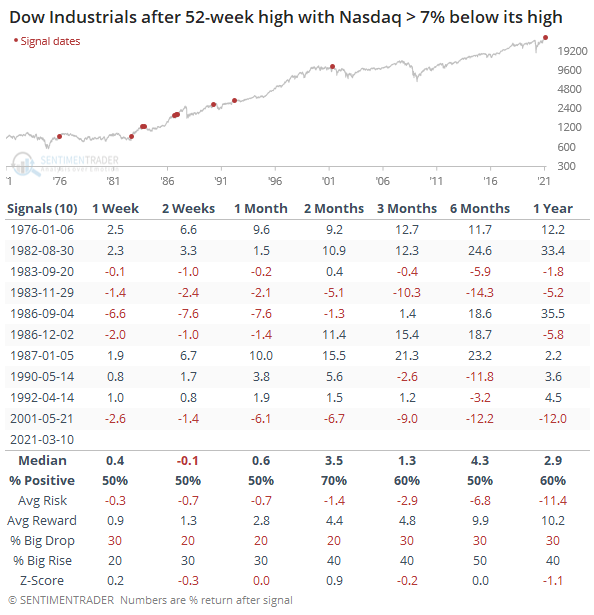
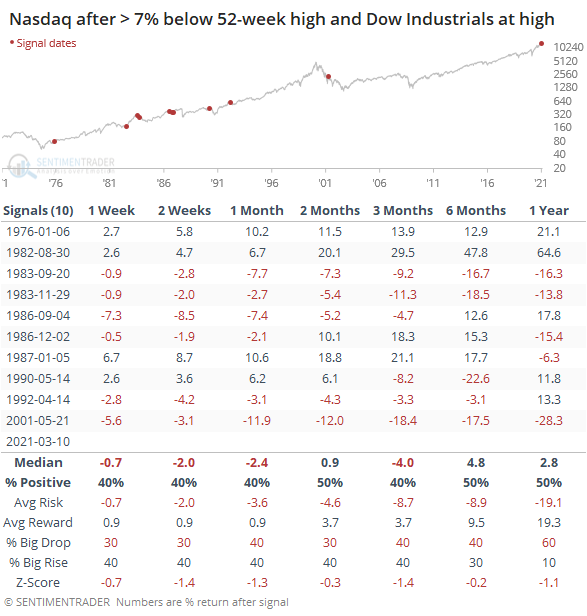
Tale of two indexes: The split market conditions we've touched on several times isn't just because of SPACs. On Wednesday, the Dow Industrials closed at a new high while the Nasdaq Composite was still more than 7% below its own high. This hasn't happened in over 20 years. Other instances were modestly negative over the shorter-term for both indexes (esp the Nasdaq).
Bottom Line:
See the Outlook & Allocations page for more details on these summaries STOCKS: Weak sell
The extreme speculation registered in January and February is starting to get wrung out. Internal dynamics have mostly held up, so a return to neutral sentiment conditions would improve the forward risk/reward profile substantially. We're still a ways off from that. BONDS: Weak buy
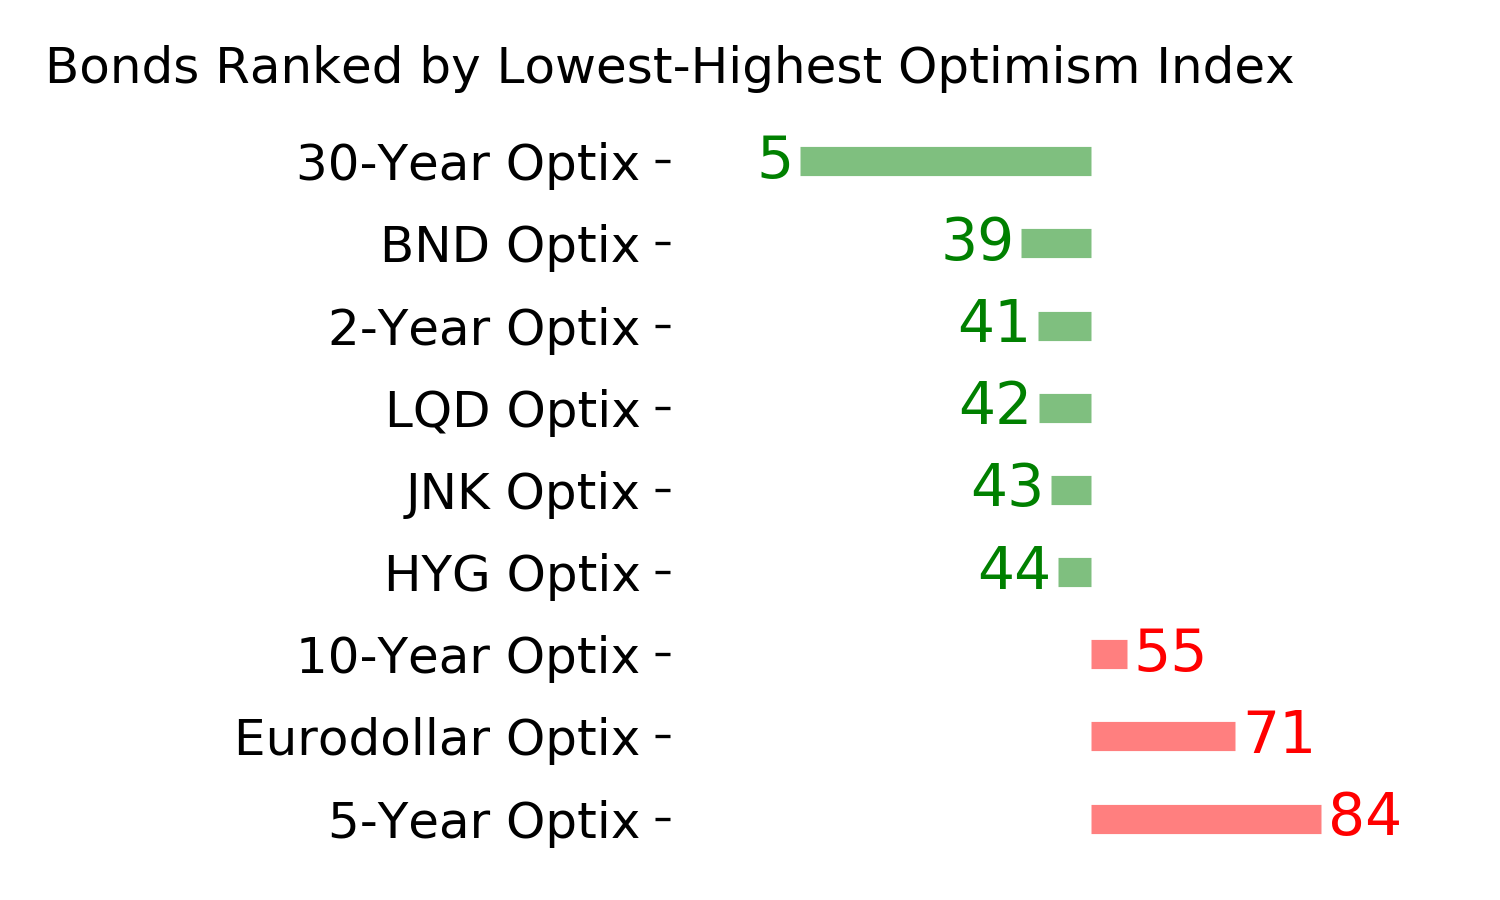
Various parts of the market have been hit in recent weeks, with mild oversold conditions. The Bond Optimism Index is now about as low as it gets during healthy bond market environments. Fixed income isn't responding well, so that needs to be monitored in case it's transitioning to a longer-term negative market environment. GOLD: Weak buy
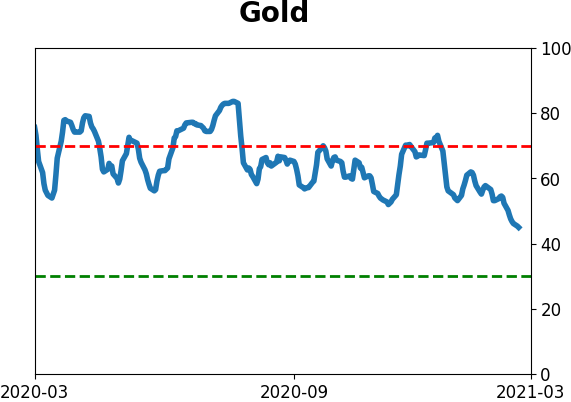
A dollar trying to rebound from a severe short position has weighed on gold and miners. The types of signals they've given in recent weeks, within the context of their recent surge, have usually resulted in higher prices over a medium- to long-term time frame. Like bonds, gold and miners aren't responding very well, and this needs to be monitored.
|
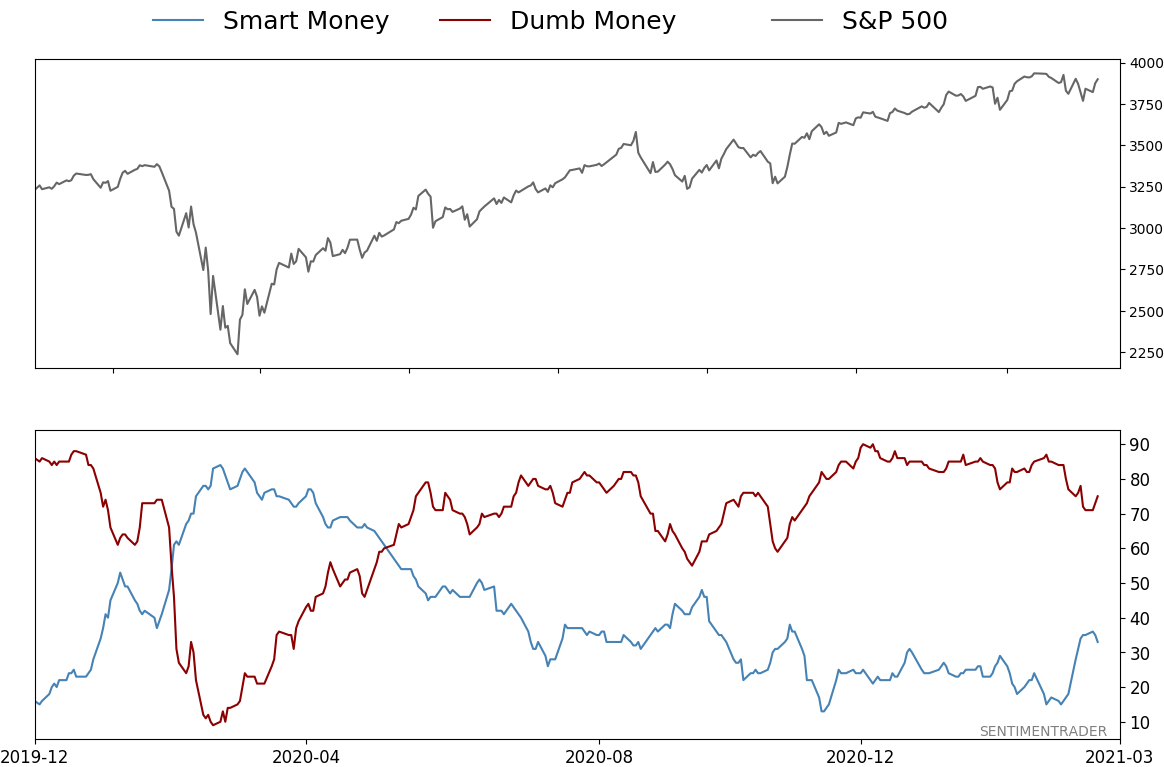
Smart / Dumb Money Confidence
|
Smart Money Confidence: 33%
Dumb Money Confidence: 75%
|
|
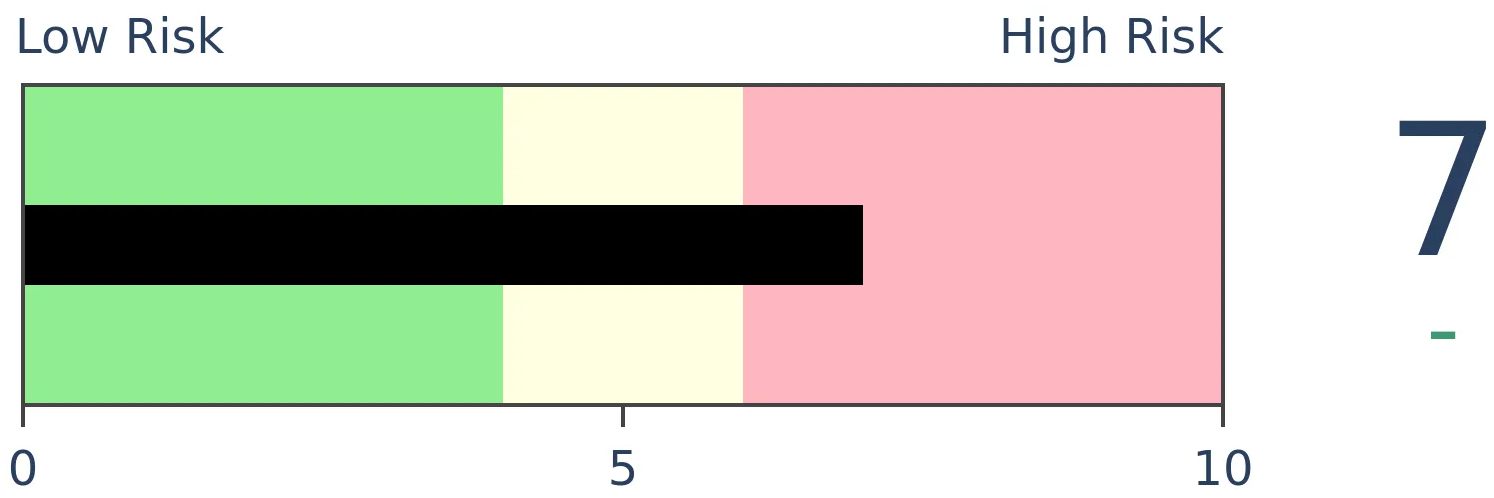
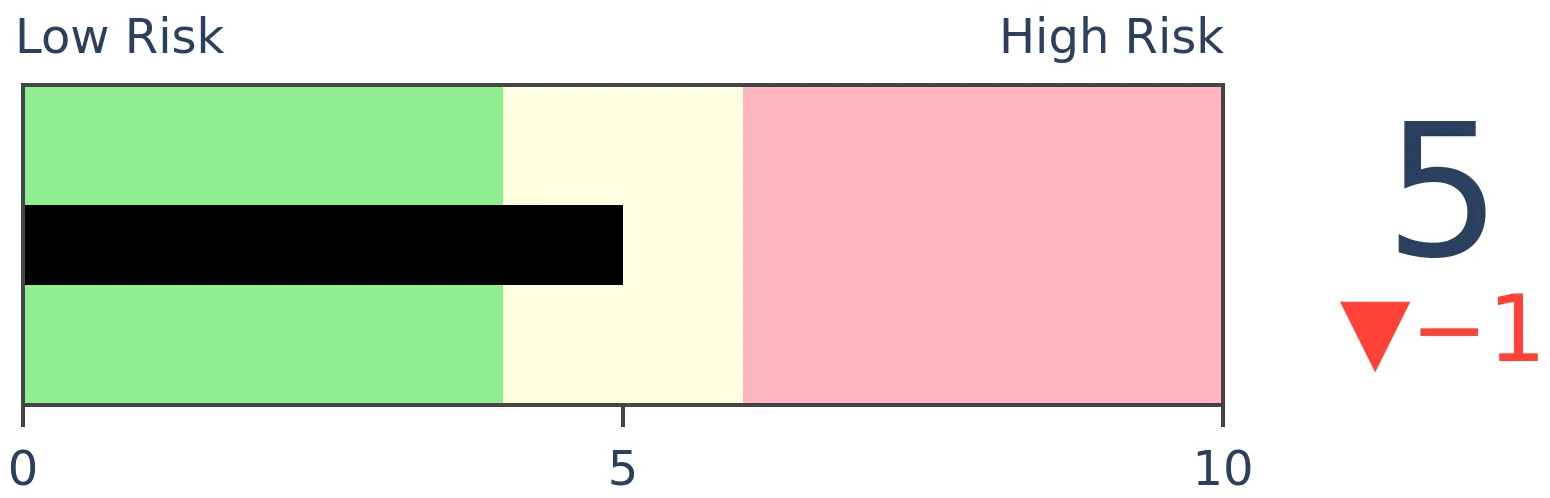
Risk Levels
Stocks Short-Term
|
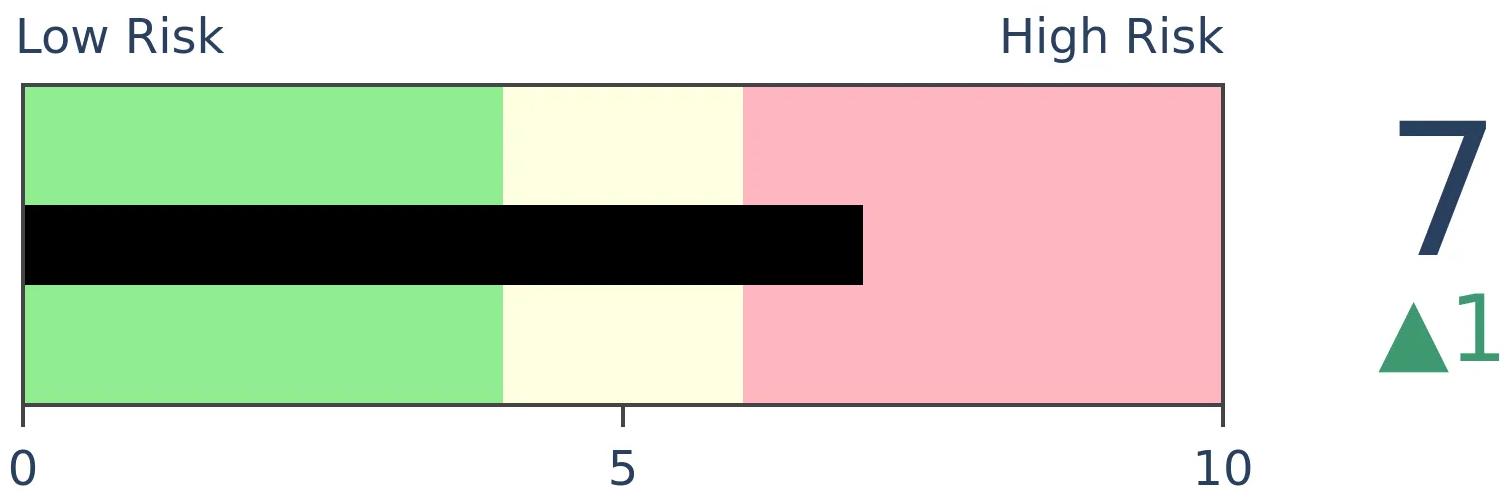
Stocks Medium-Term
|
|
Bonds

|
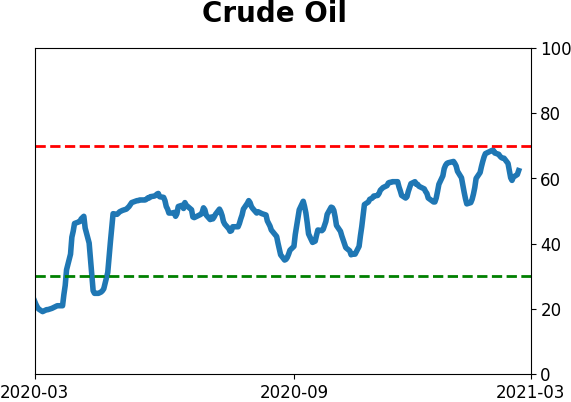
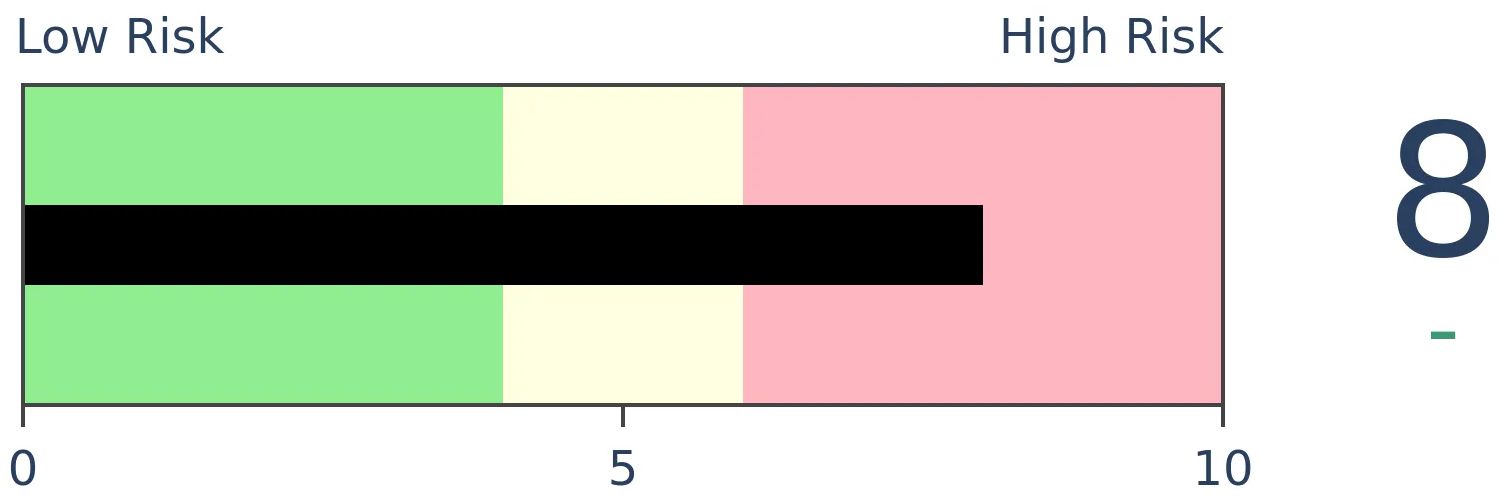
Crude Oil
|
|
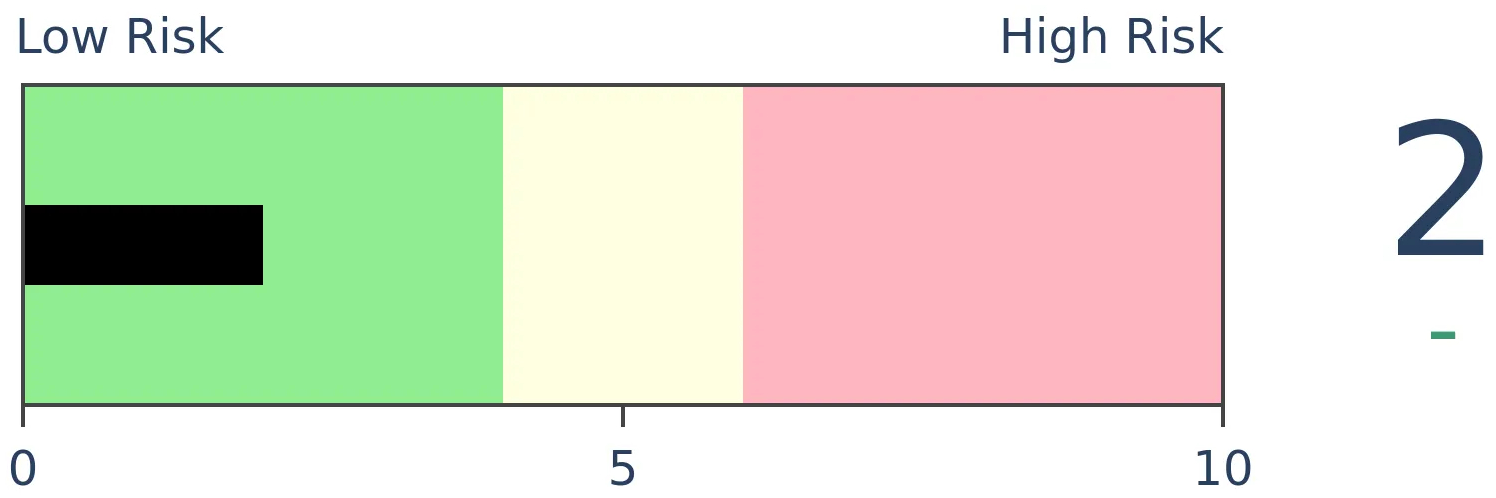
Gold
|
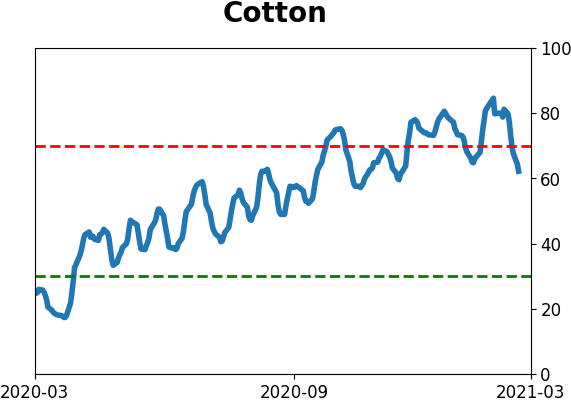
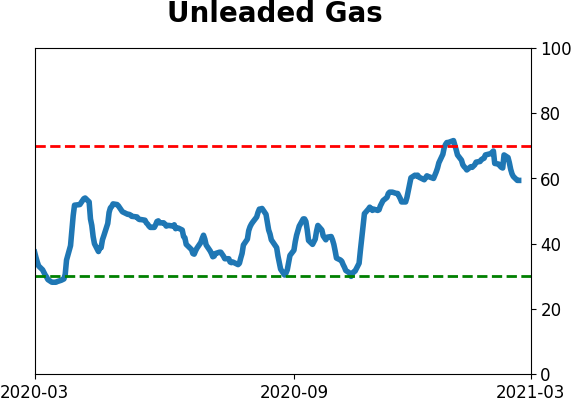
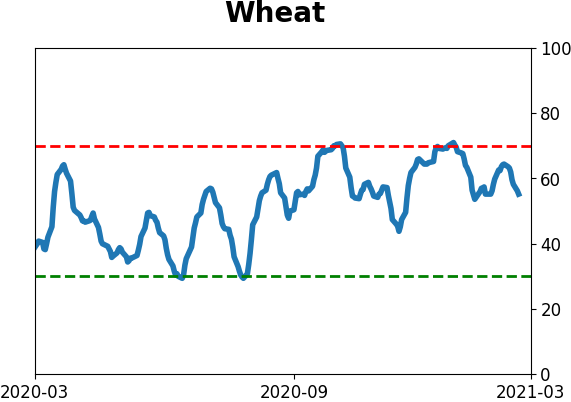
Agriculture
|
|
Research
BOTTOM LINE
Through February, traders continued to pour into the most speculative corners of the market, including over-the-counter, or penny, stocks. Volume there is the highest in over a decade.
FORECAST / TIMEFRAME
SPY -- Down, Long-Term
|
Over the past couple of months, we've been raising the alarm on several pockets of speculative activity, which had reached or exceeded all prior records.
Bullish options trading, IPO and add-on volume, and penny stock trading were among the most egregious examples. With the latter, it's only getting more extreme.
The latest figures are out, covering activity through the end of February, and it shows an increasing willingness to trade the riskiest securities available to individual investors.
The number of shares traded has jumped to nearly 2 trillion shares (yes, trillion).
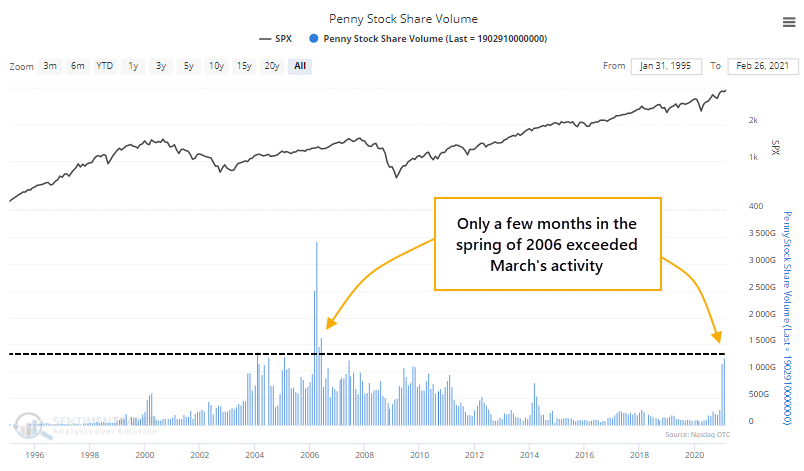
Zooming out further, we can see that only a few months in early 2006 exceeded this pace of activity.
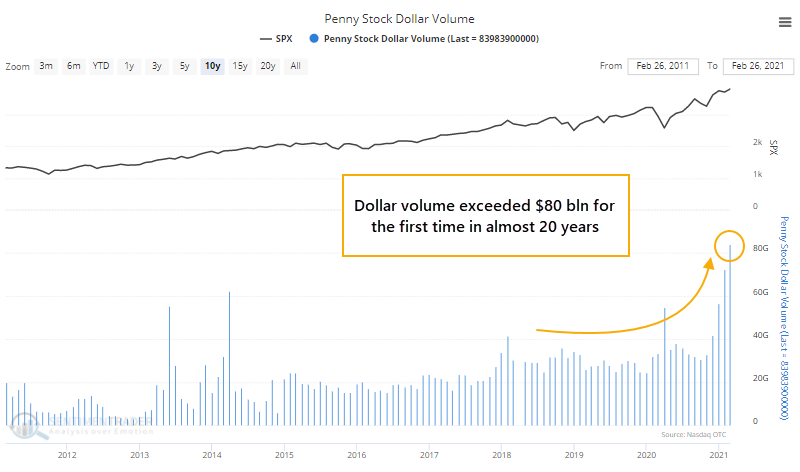
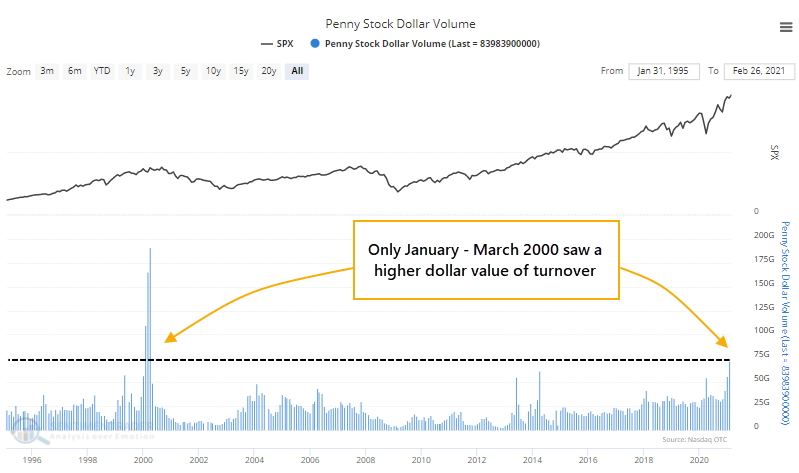
The dollar volume traded rose to nearly $84 billion, again the highest in the past decade.
Going back nearly 30 years, February's activity was only exceeded by January - March of 2000.
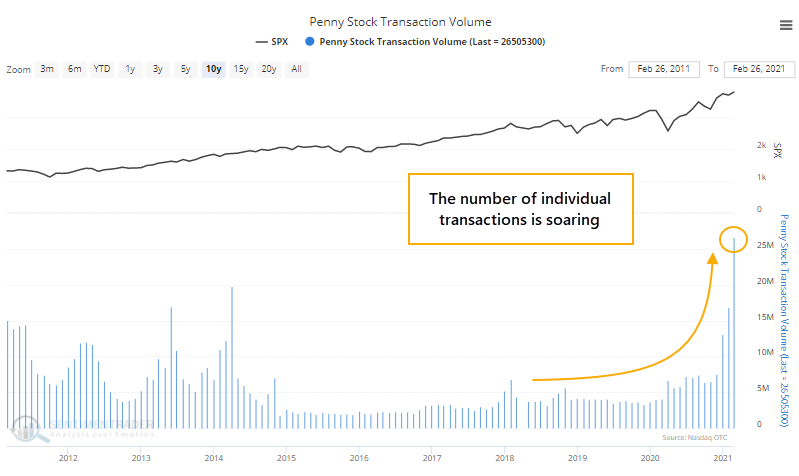
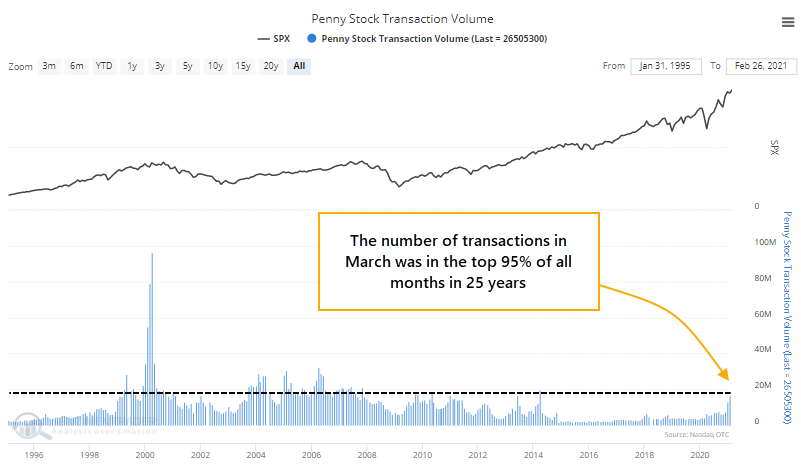
It wasn't just a handful of large trades accounting for this volume, either. The number of transactions exceeded 26 million, again the most in a decade.
There have been several periods where there were more transactions, so not quite as extreme as the other two measures.
Like the "split" market conditions we've looked at a few different ways recently, part of this activity is influenced by a small corner of the market. Trading in a single stock, Healthier Choices Management Corp, accounted for a big part of February's over-the-counter activity. But as with other indicators, we've never had success trying to outguess whether the indicators matter or not. For a time, these figures were skewed by trading in Fannie and Freddie shares. We didn't arbitrarily adjust for that then, and won't now.
Taken altogether, while there might be some minor caveats, we'd consider this surge in turnover in the most speculative corner of the market to be a long-term negative.
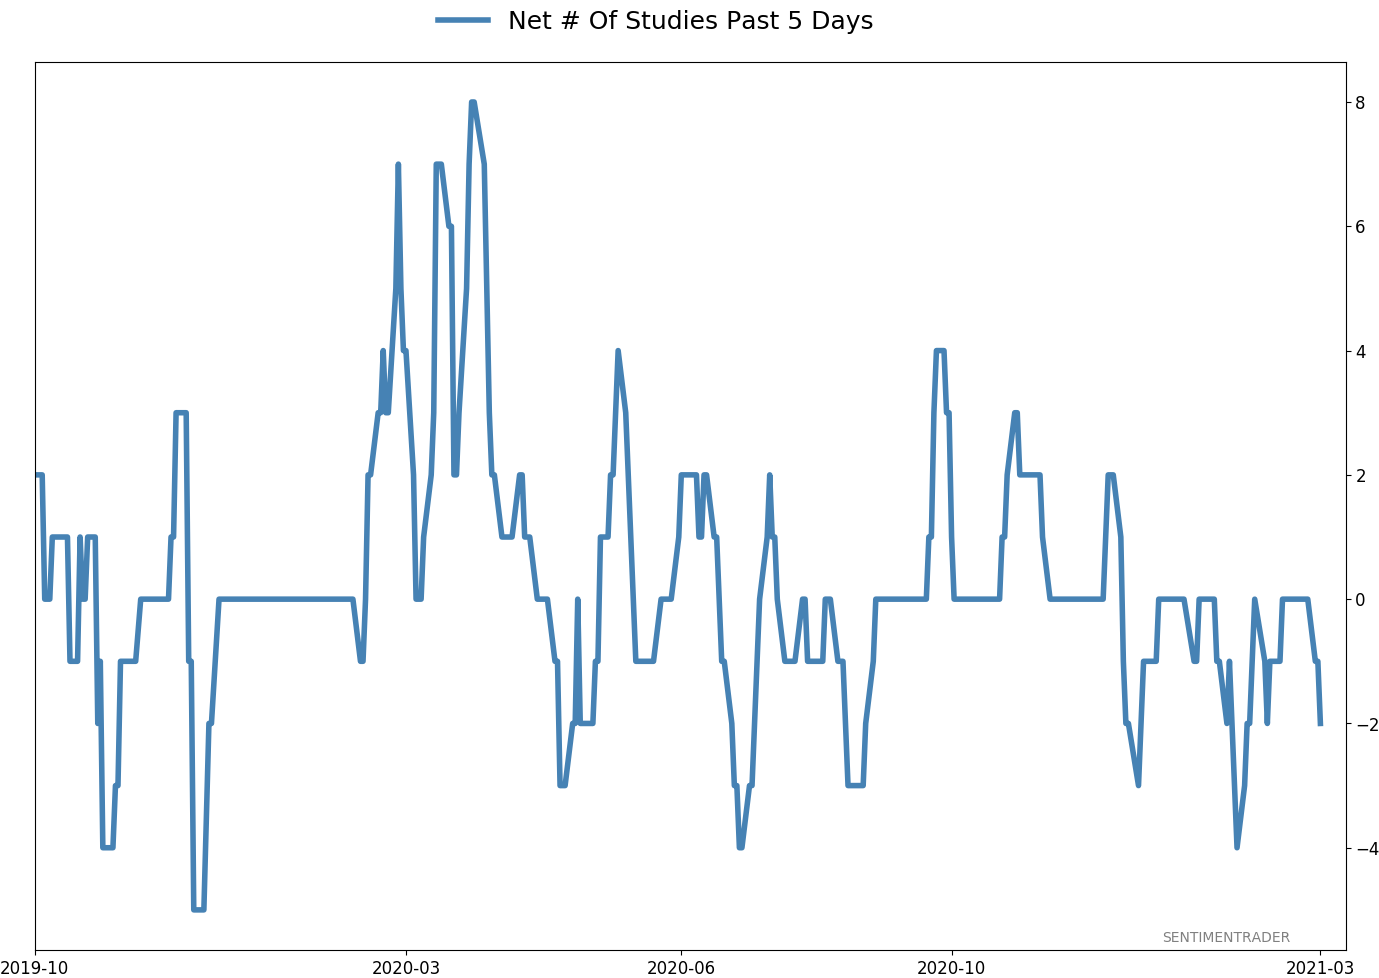
Active Studies
| Time Frame | Bullish | Bearish | | Short-Term | 0 | 0 | | Medium-Term | 2 | 9 | | Long-Term | 16 | 4 |
|
Indicators at Extremes
Portfolio
| Position | Description | Weight % | Added / Reduced | Date | | Stocks | RSP | 4.9 | Reduced 4% | 2021-02-09 | | Bonds | 30.0% BND, 8.8% SCHP | 38.8 | Added 15.1% | 2021-02-18 | | Commodities | GCC | 2.3 | Reduced 2.1%
| 2020-09-04 | | Precious Metals | GDX | 9.0 | Added 0.1% | 2021-02-18 | | Special Situations | 7.3% XLE, 4.8% PSCE | 12.1 | Reduced 5.6% | 2021-02-18 | | Cash | | 32.8 | | |
|
Updates (Changes made today are underlined)
With a market that has seen the kinds of broad participation and big breath thrusts like we did in the fall, it's hard to become too negative. Those kinds of conditions have consistently preceded higher returns over the next 6-12 months. It's the interim that's more of an issue. Even conditions like that haven't prevented some shorter-term pullbacks. And when we combine an environment where speculation is rampant and recent days have seen an increase in cracks under the surface of the indexes, it's enough to become more defensive over a short- to medium-term time frame. We still don't have much confirmation from the price action in the indexes, so those who are more conservative would likely wait before increasing cash levels. I've decreased risk exposure a bit more, mainly in terms of energy stocks and the ANGL fund, while adding more to the broader bond market. RETURN YTD: 7.2% 2020: 8.1%, 2019: 12.6%, 2018: 0.6%, 2017: 3.8%, 2016: 17.1%, 2015: 9.2%, 2014: 14.5%, 2013: 2.2%, 2012: 10.8%, 2011: 16.5%, 2010: 15.3%, 2009: 23.9%, 2008: 16.2%, 2007: 7.8%
|
|
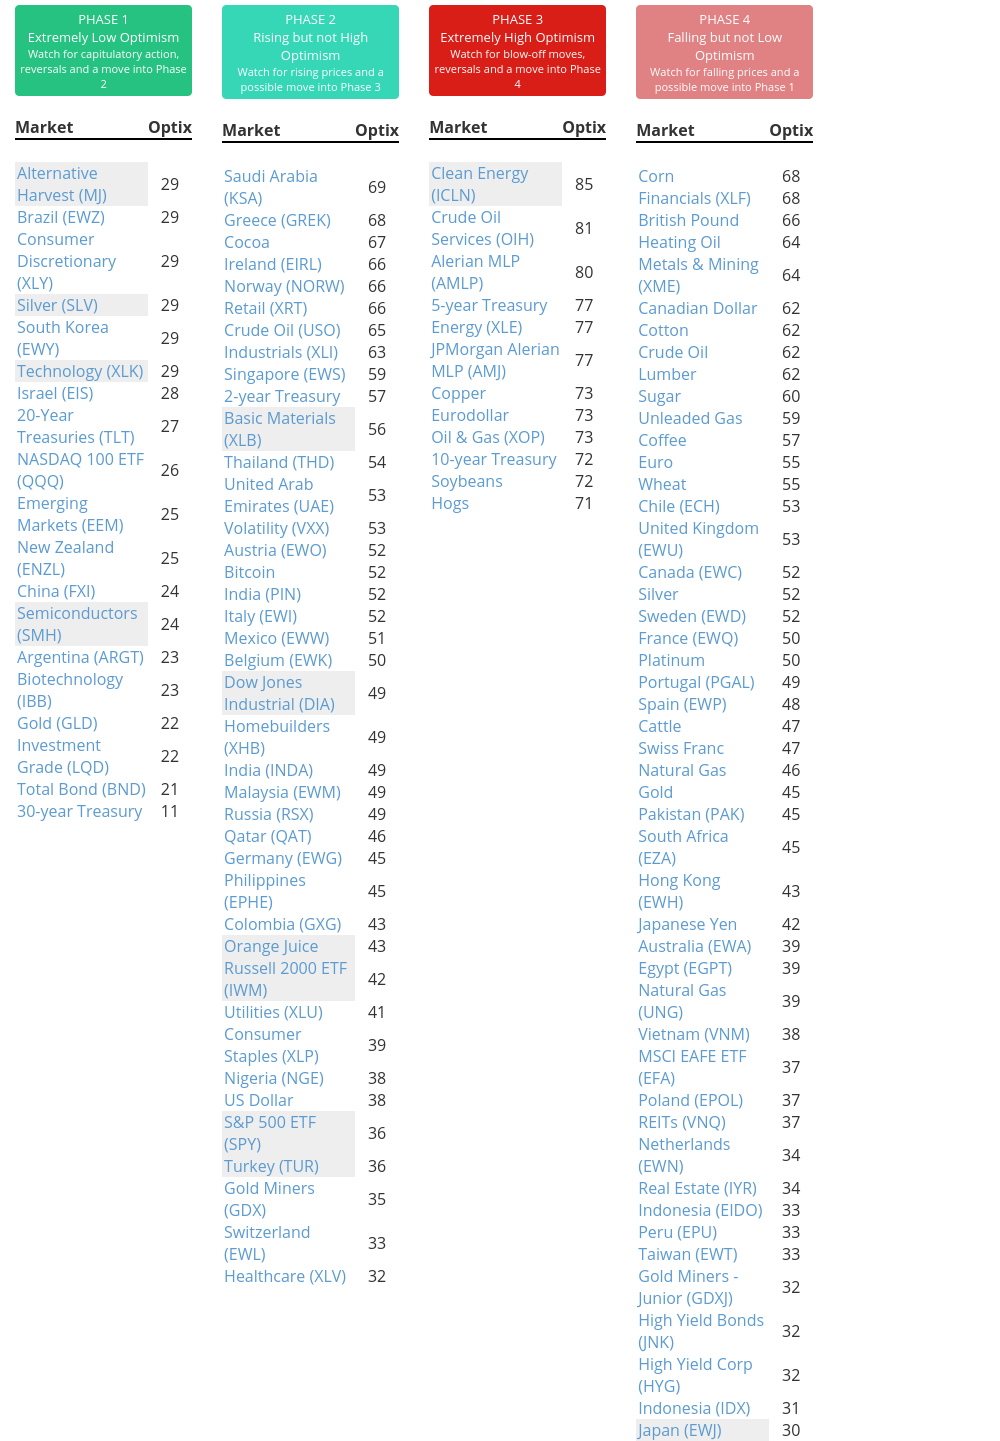
Phase Table
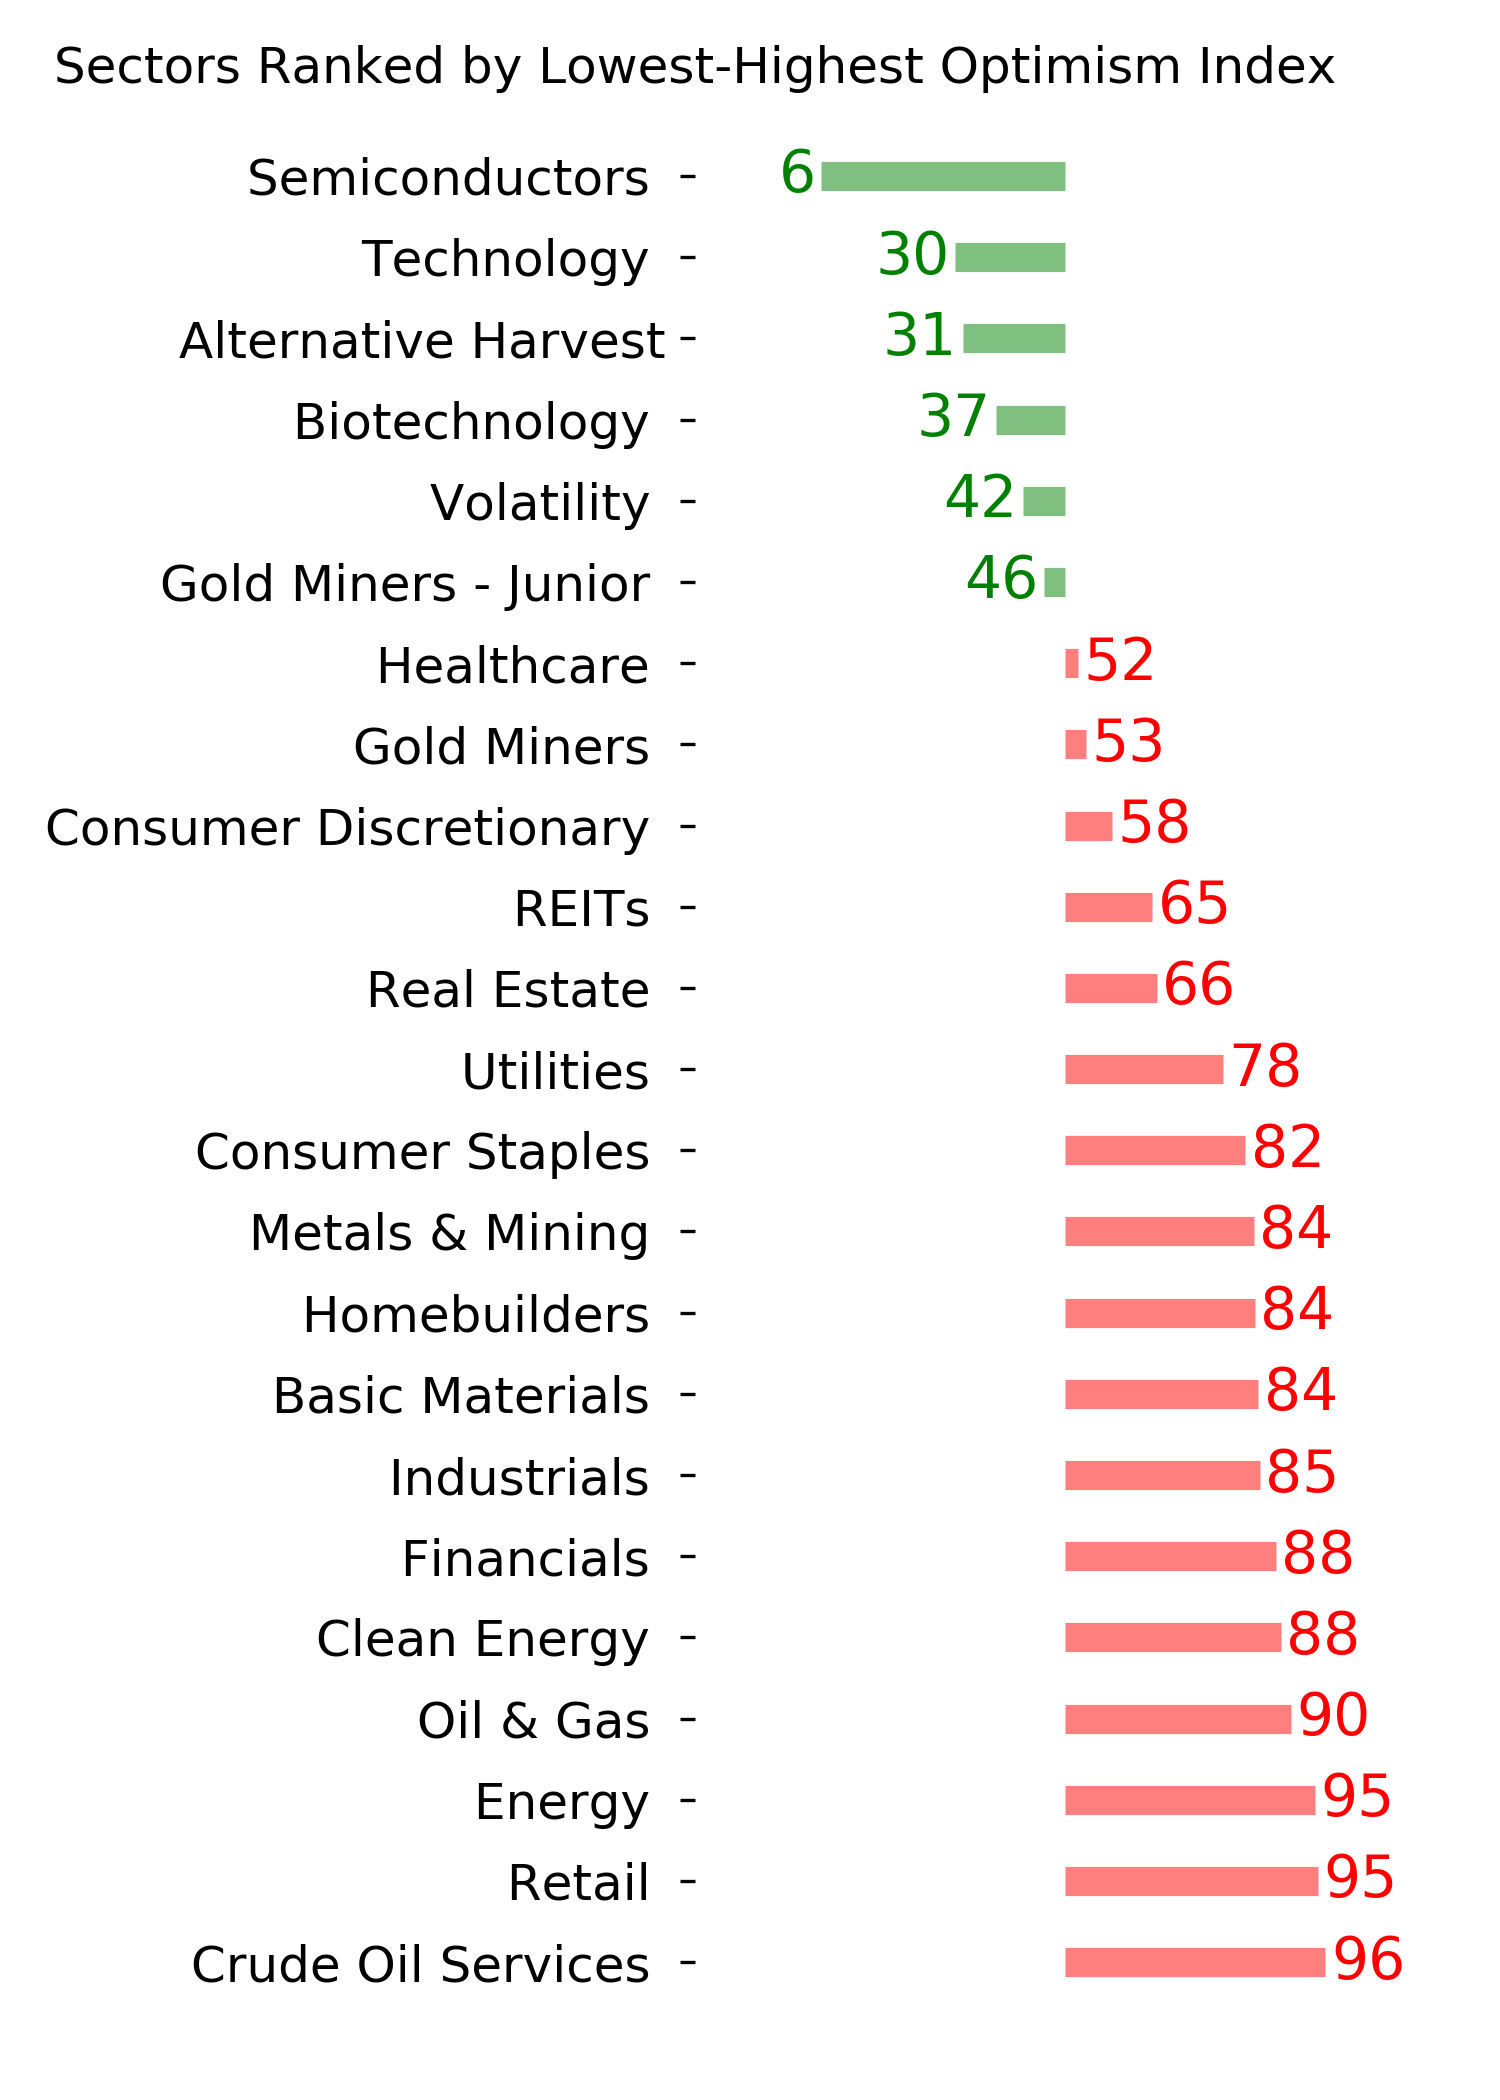
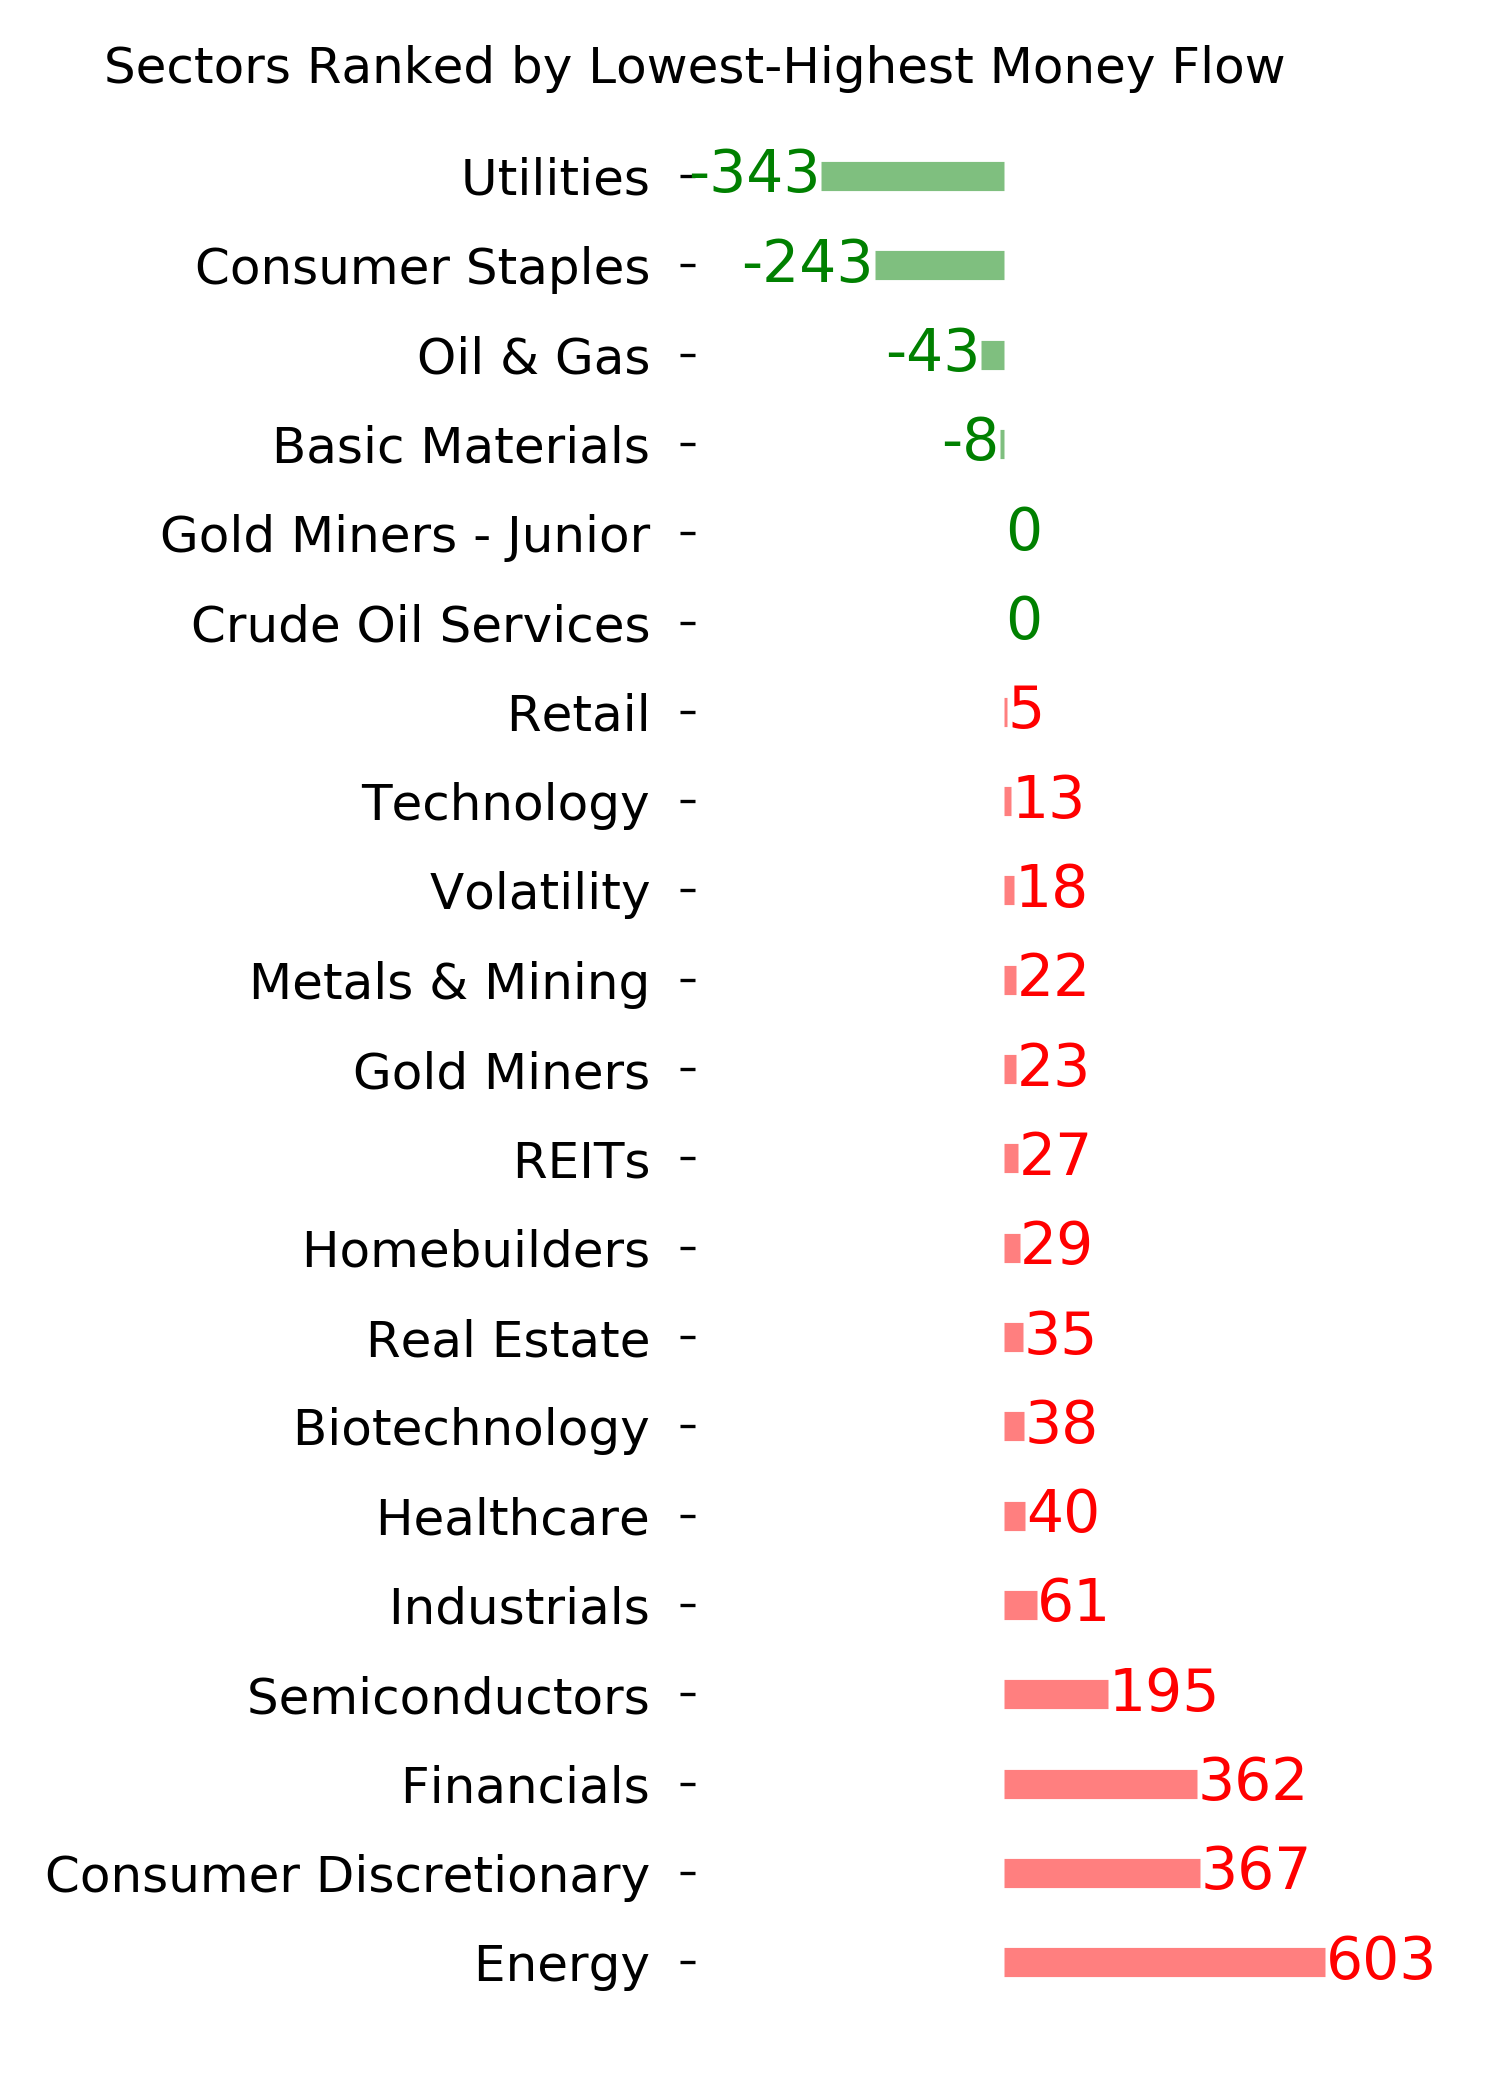
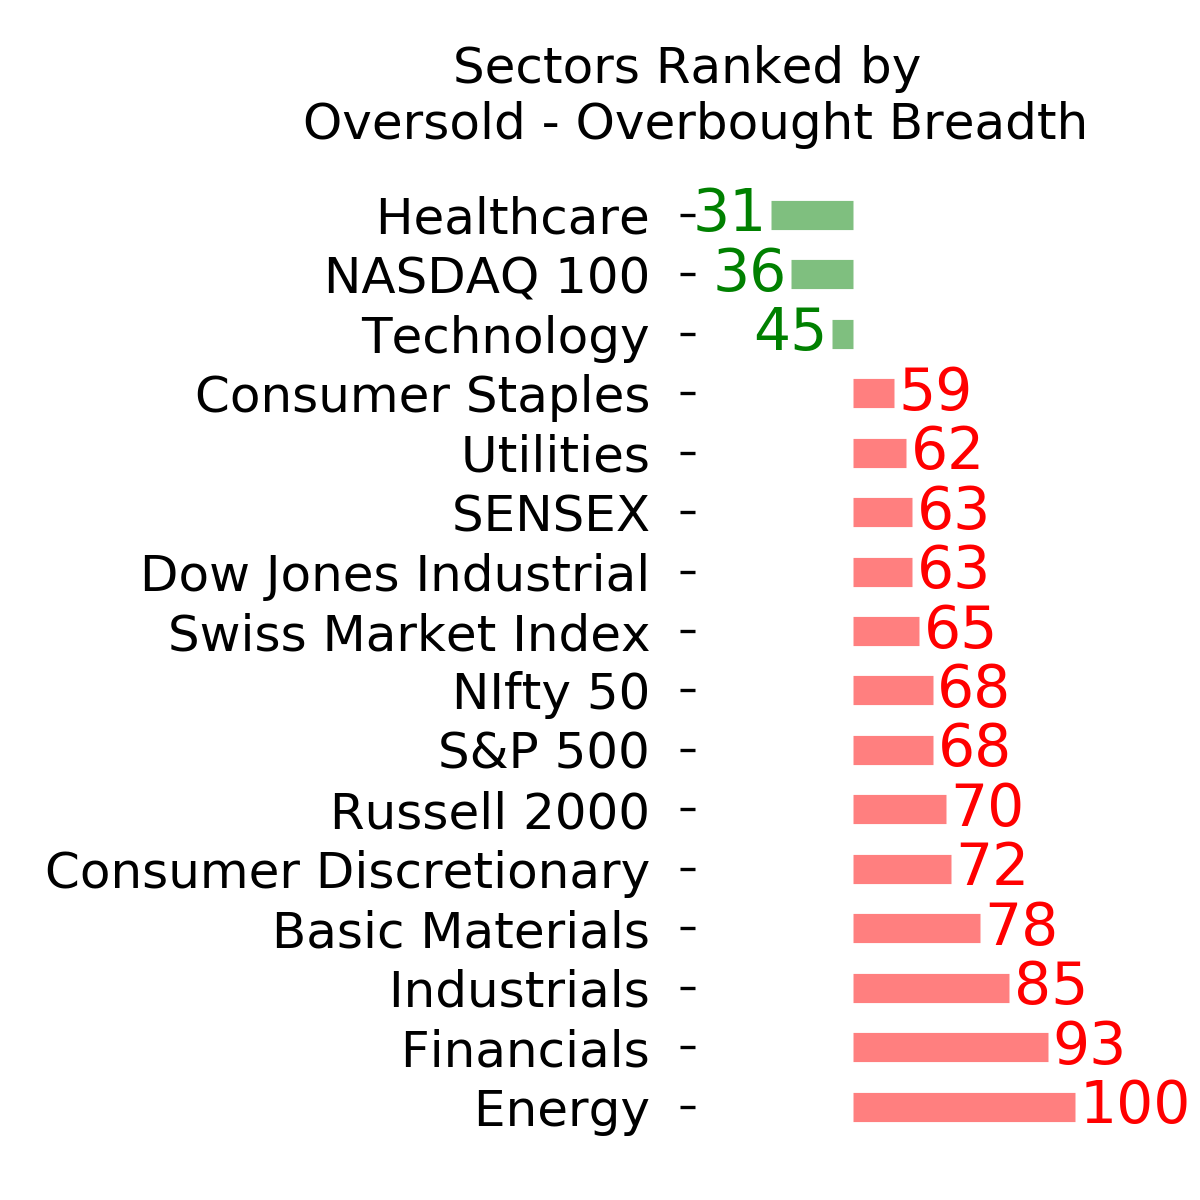
Ranks
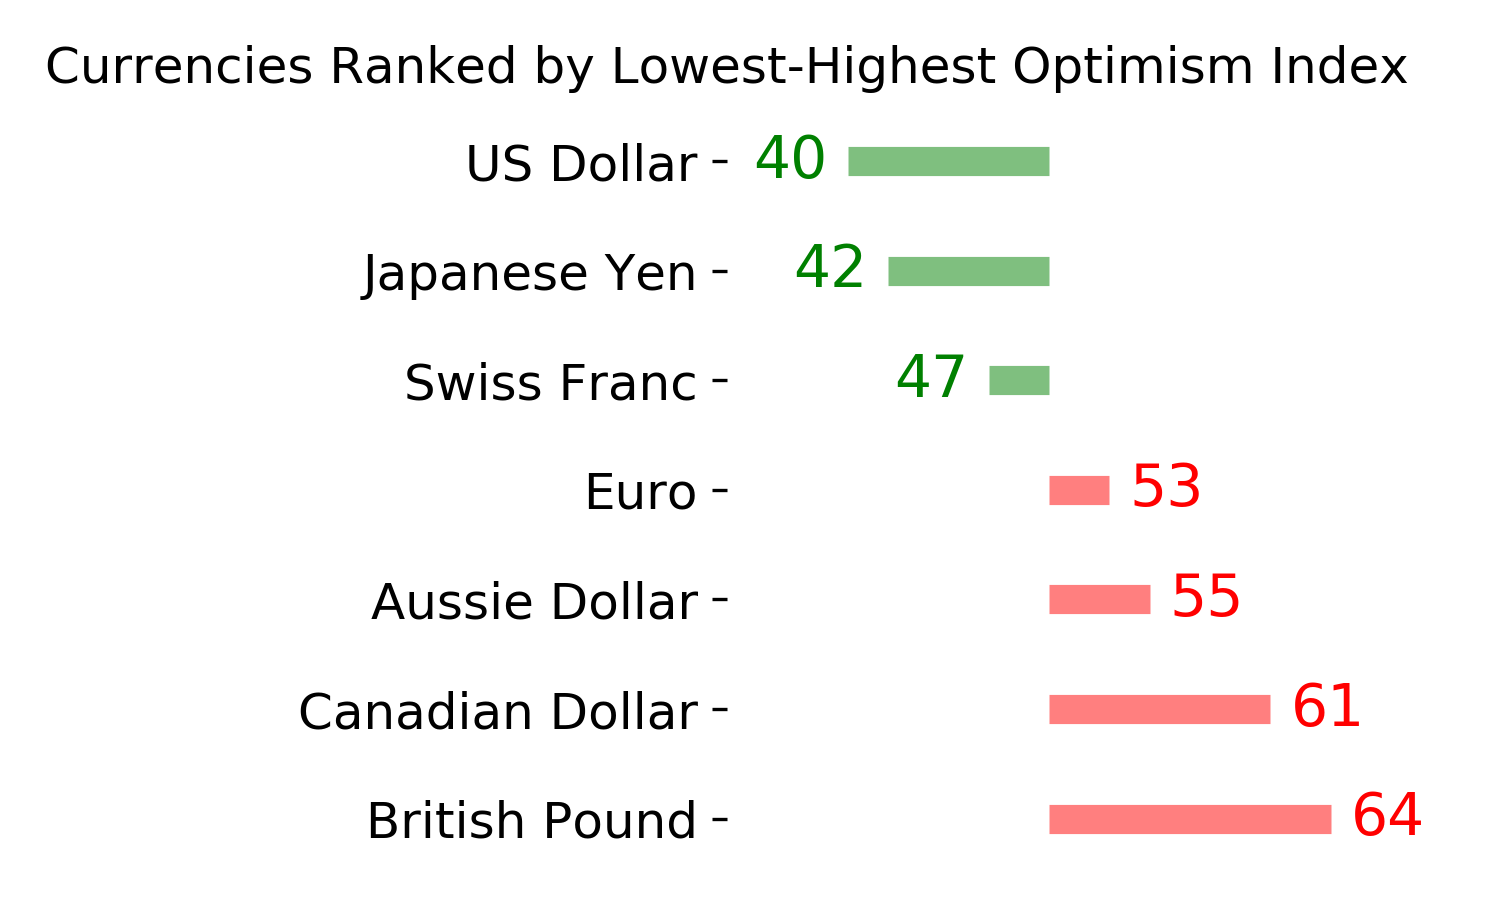
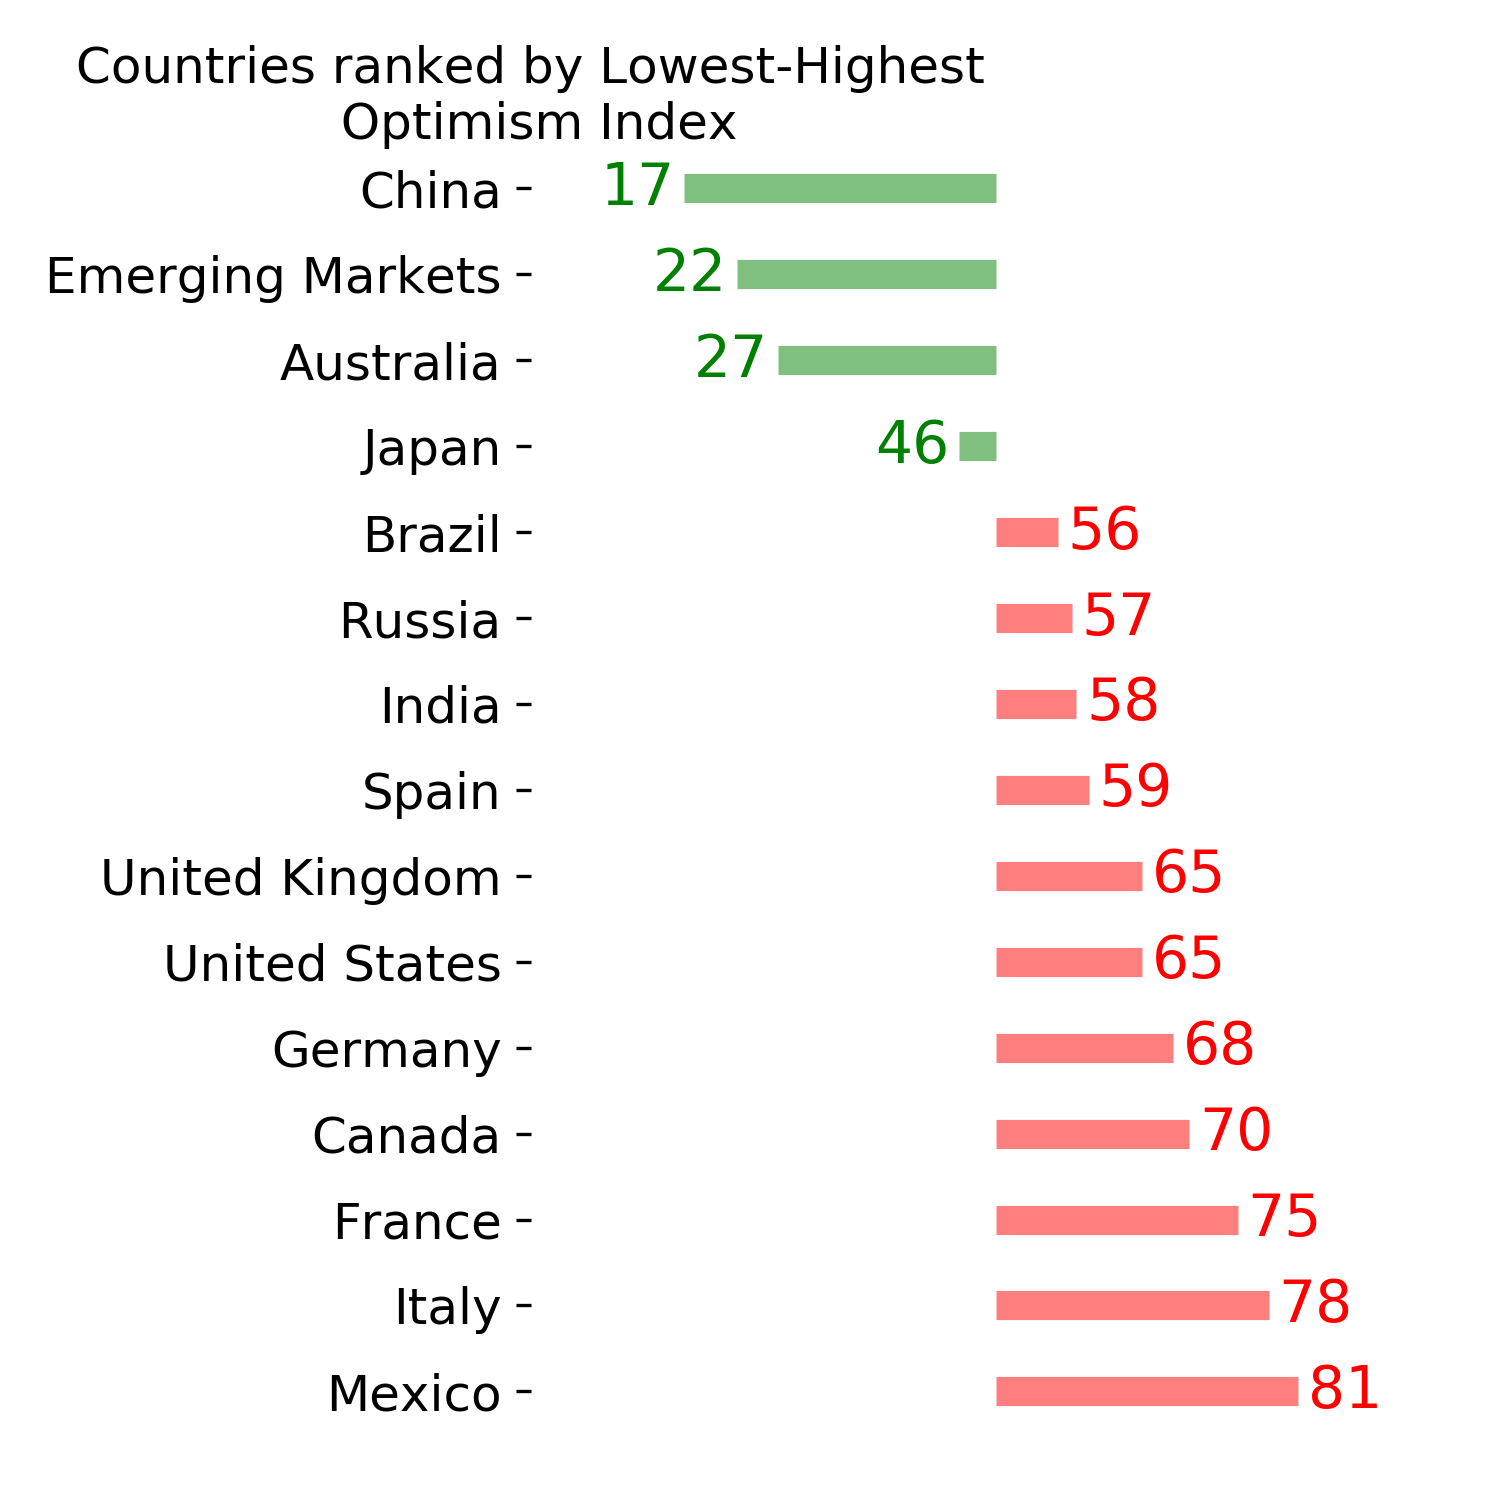
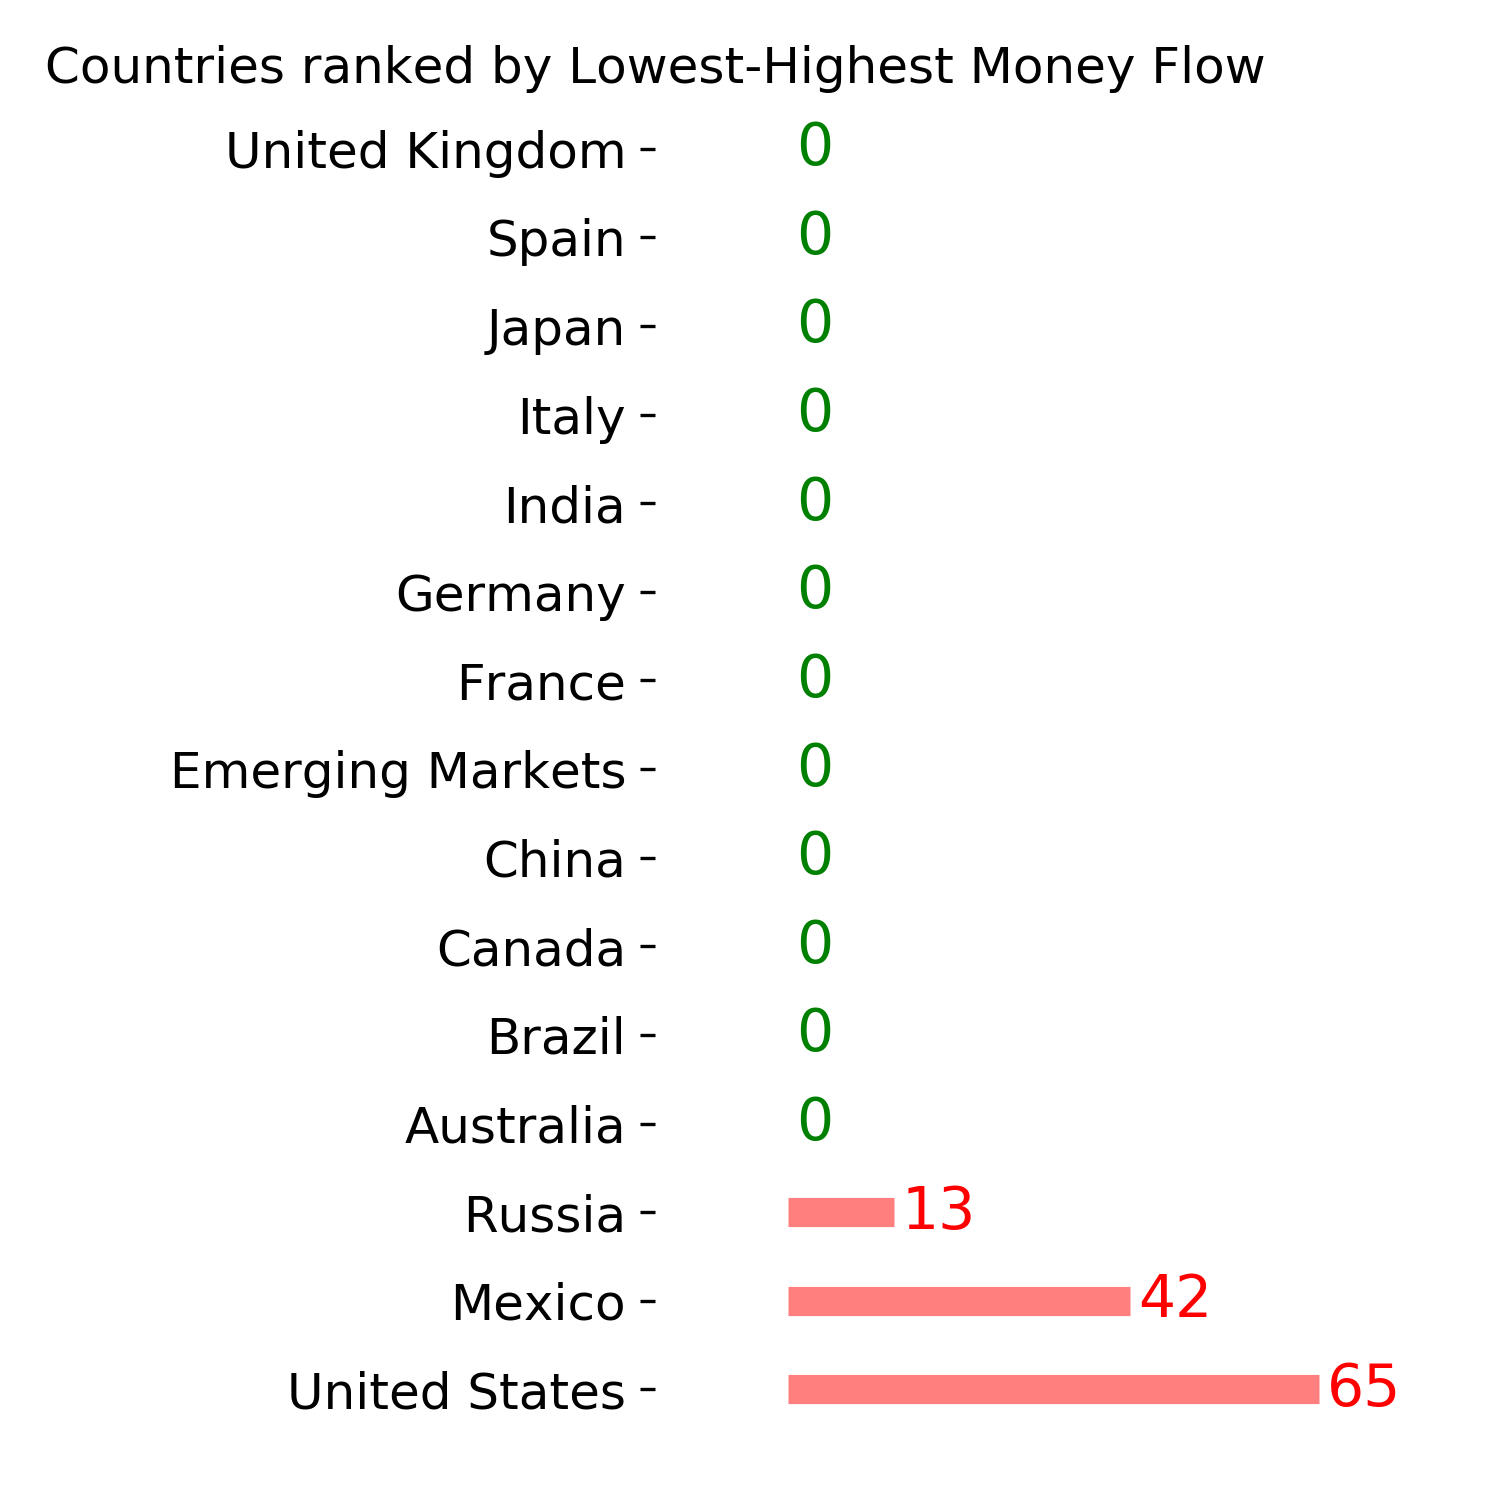
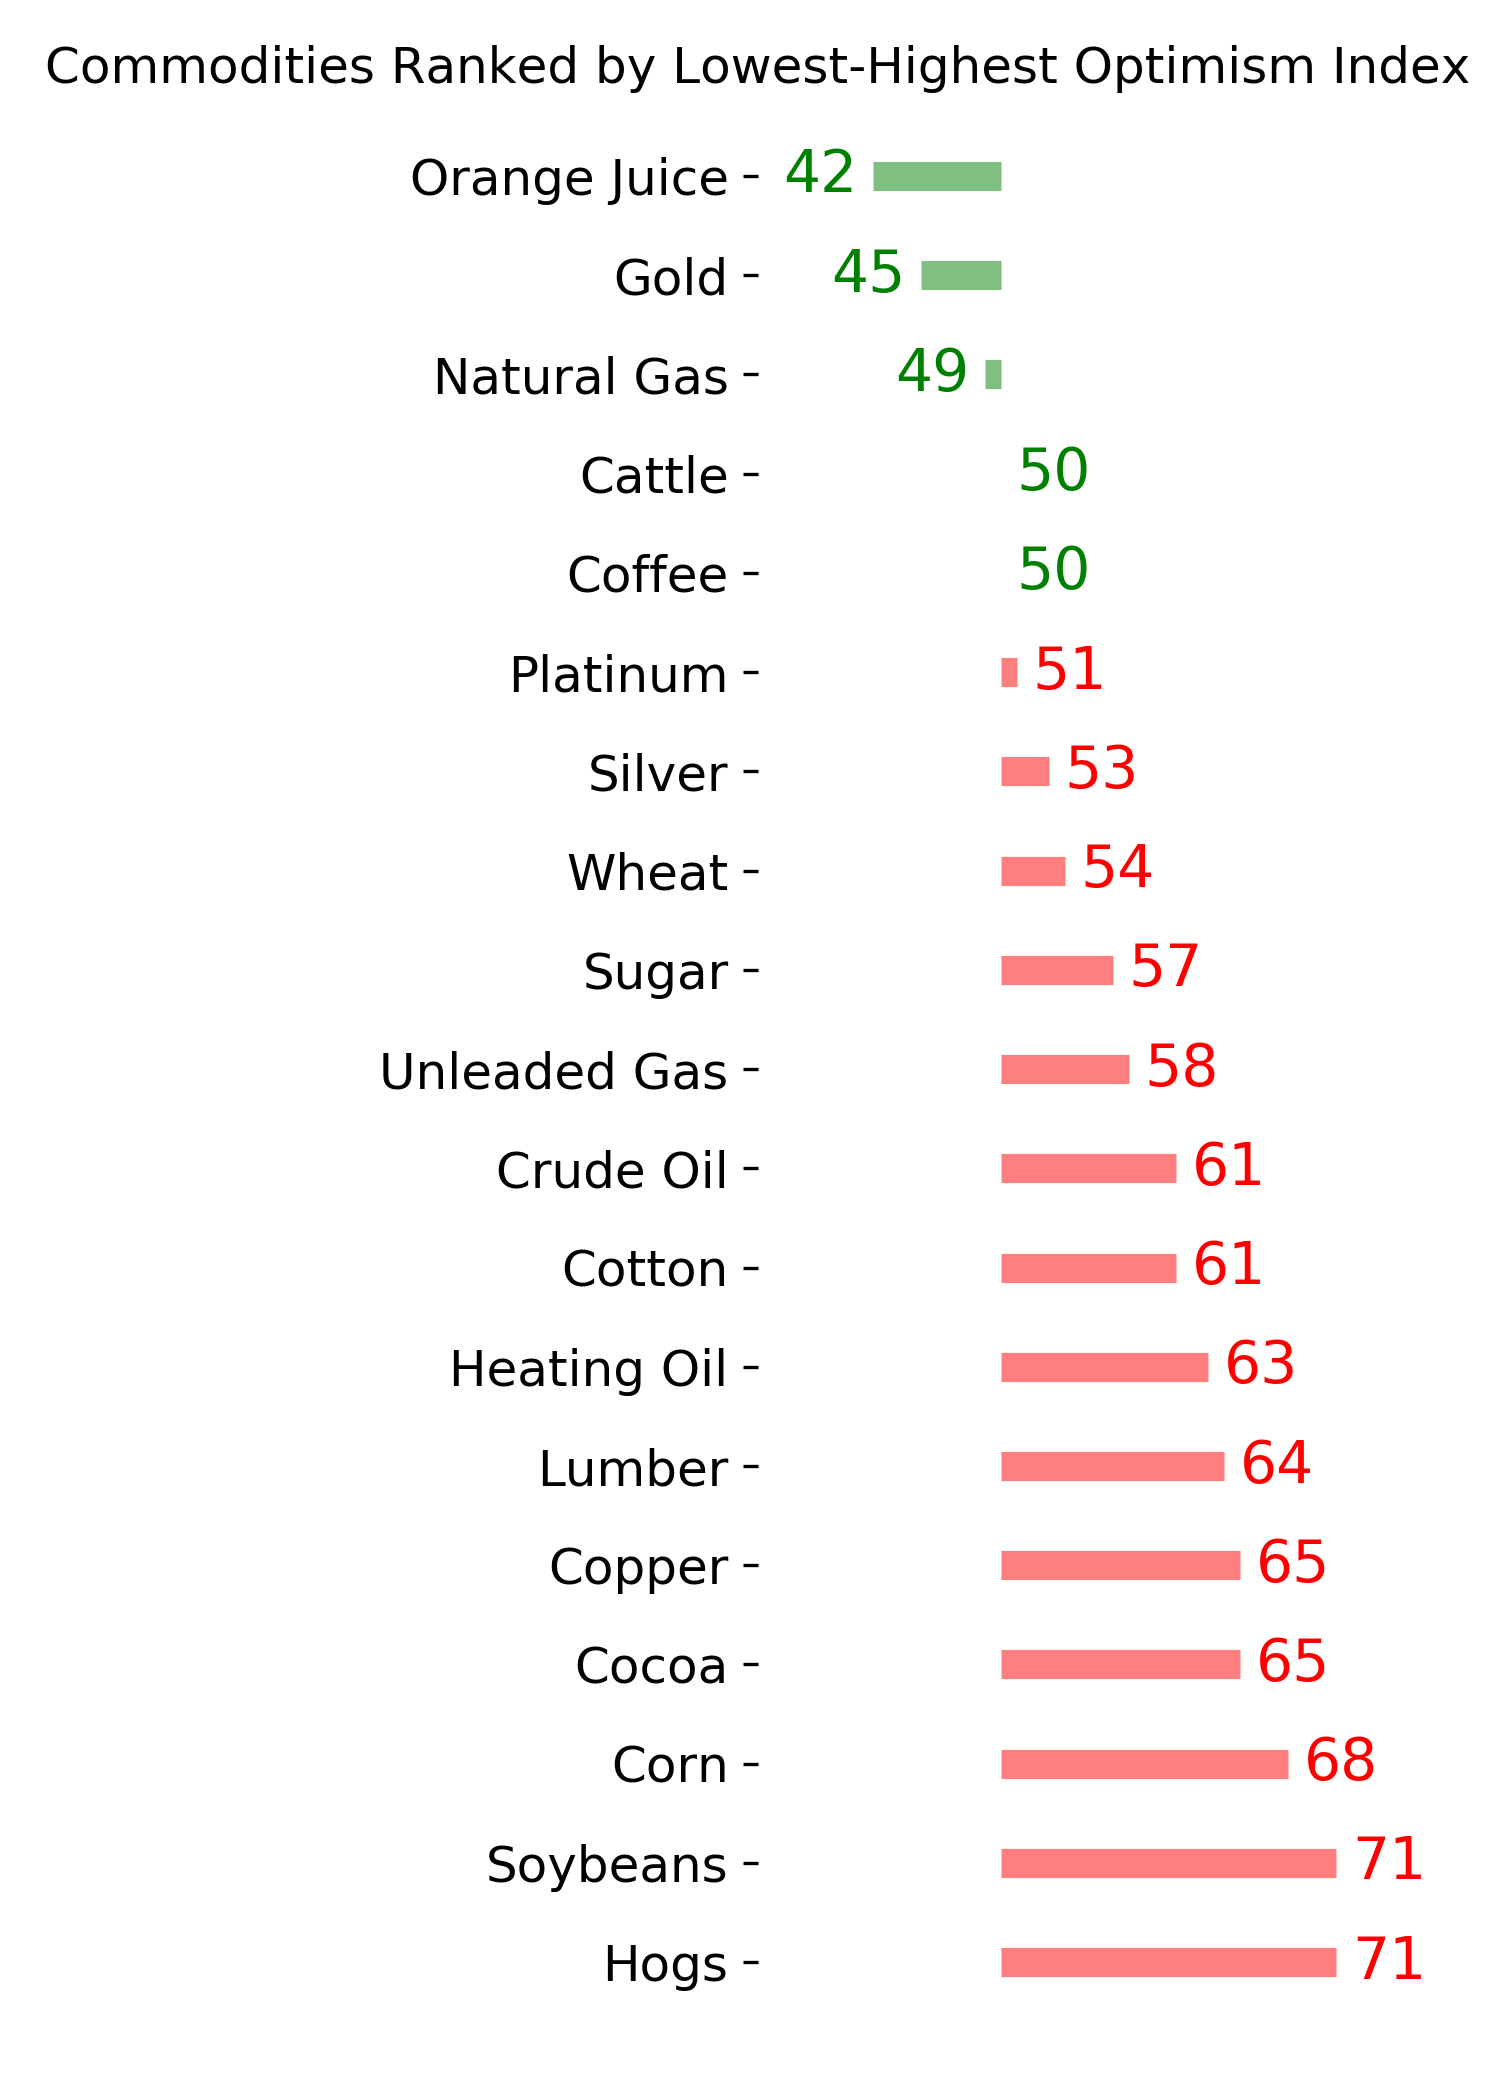
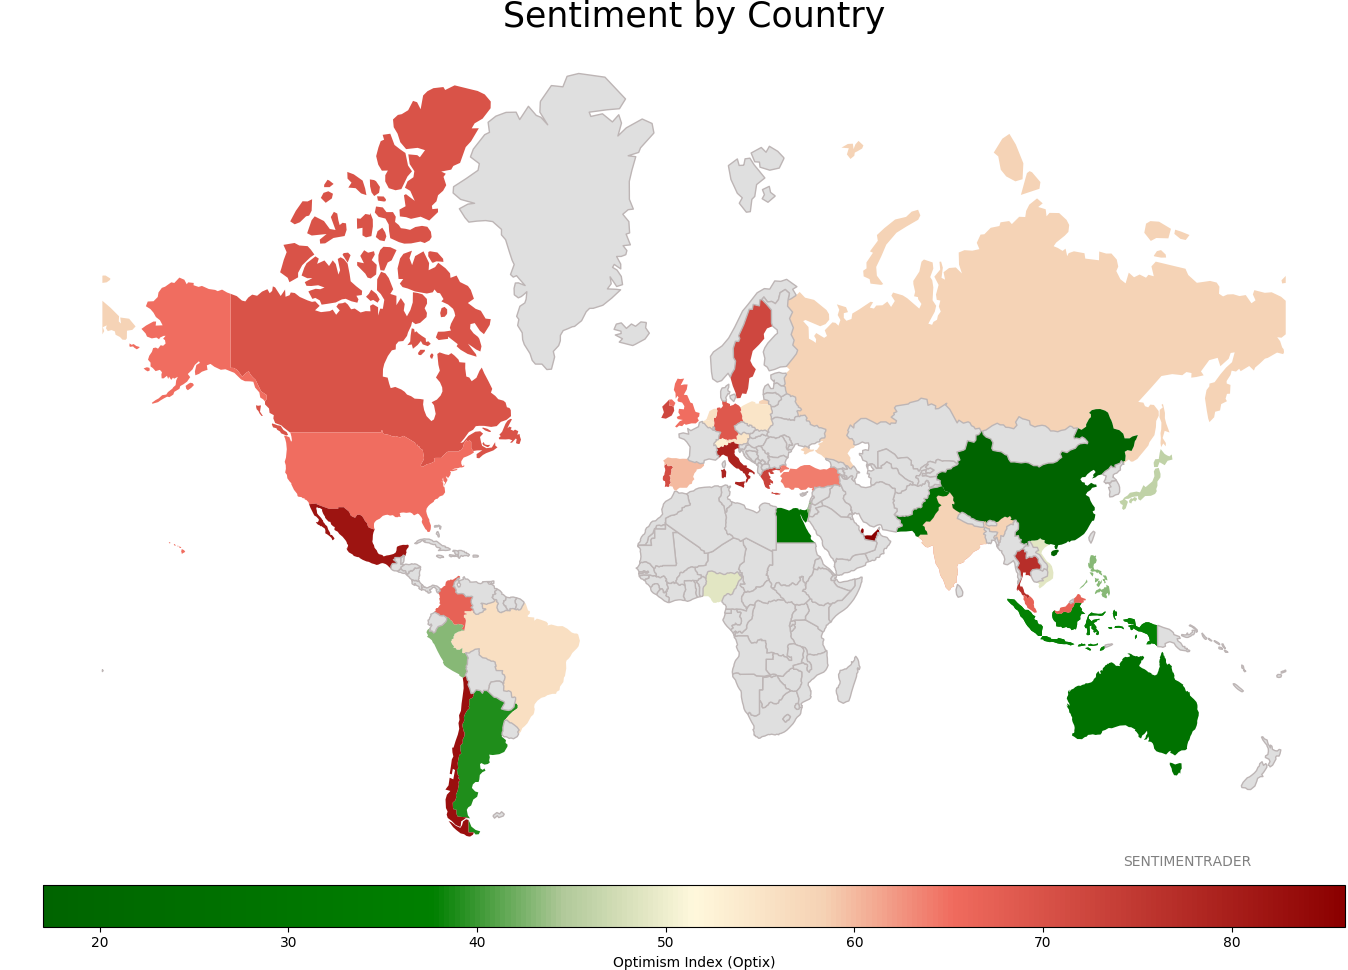
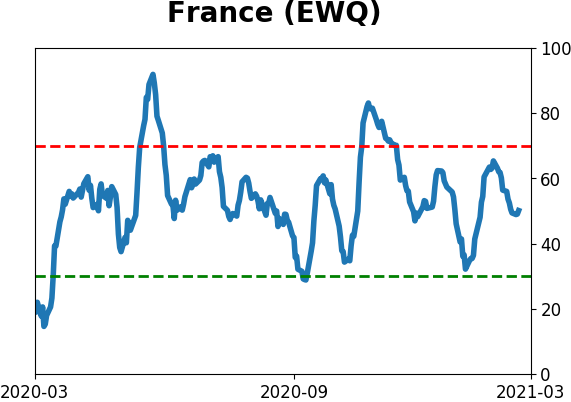
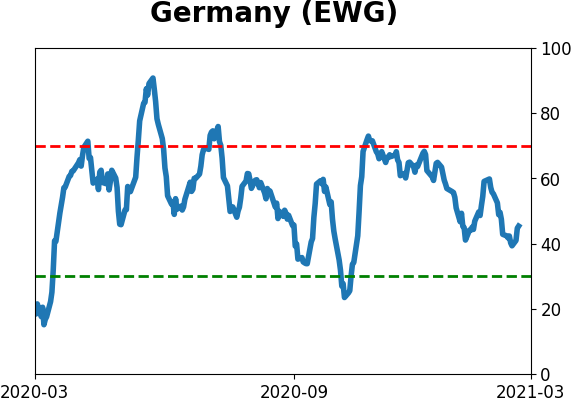
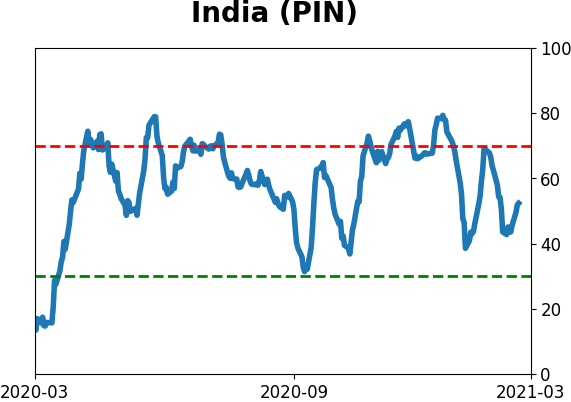
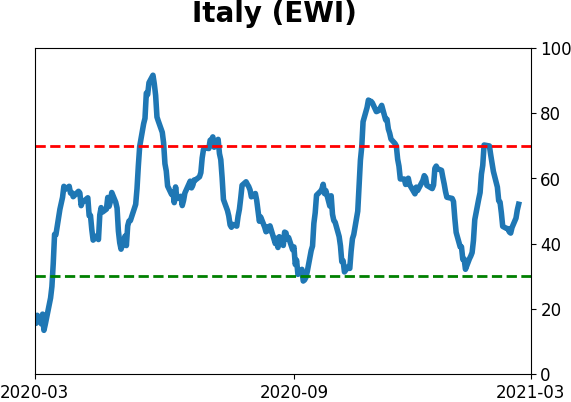
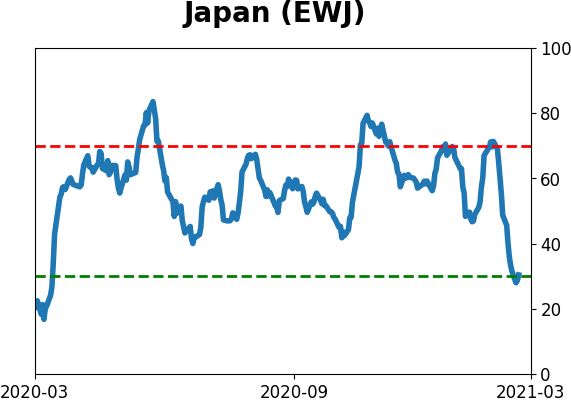
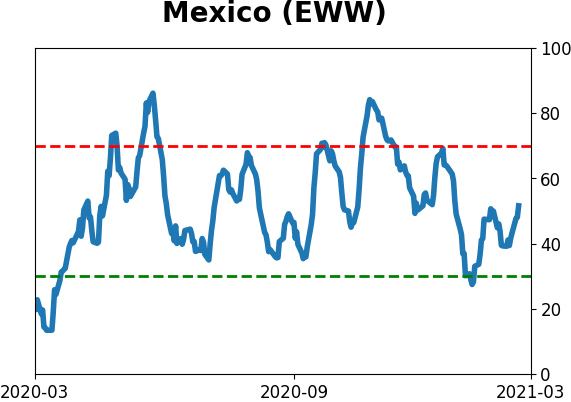
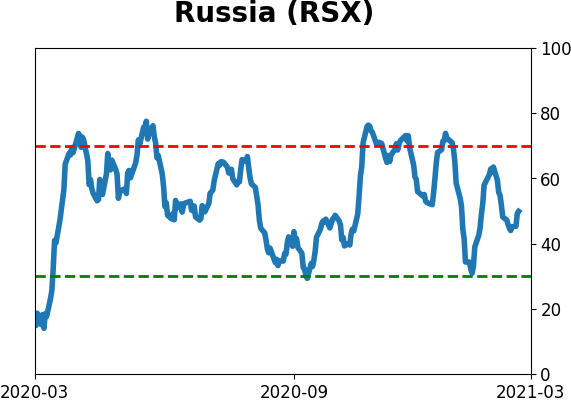
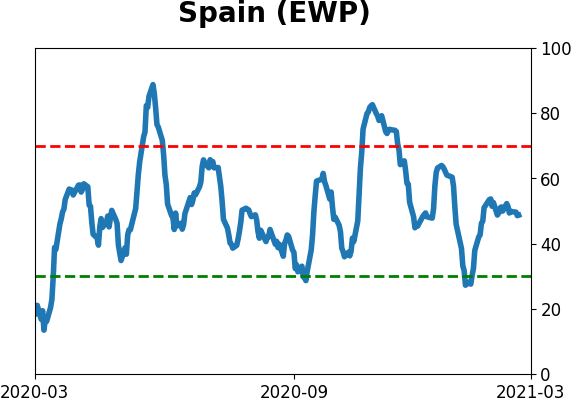
Sentiment Around The World
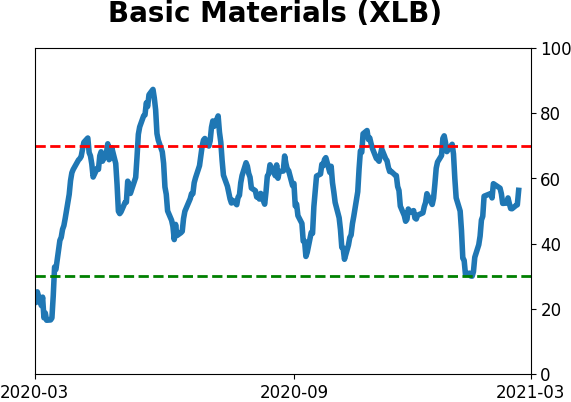
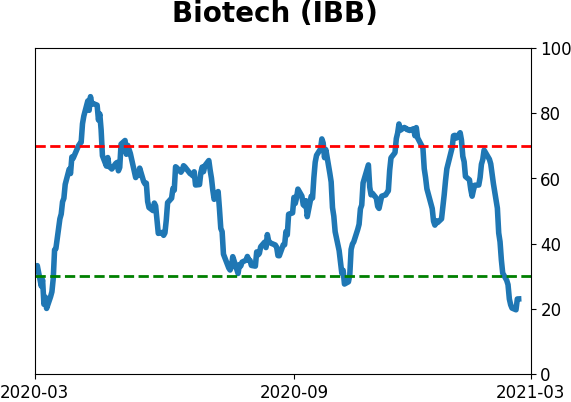
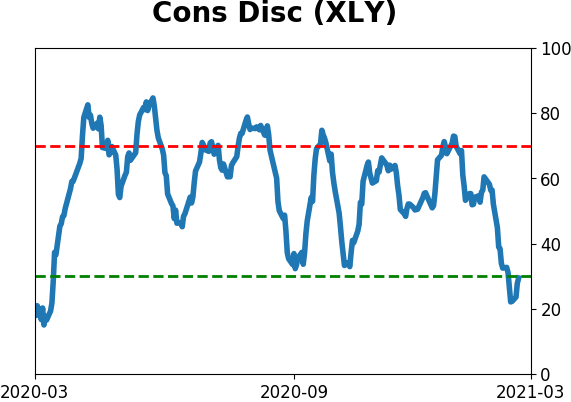
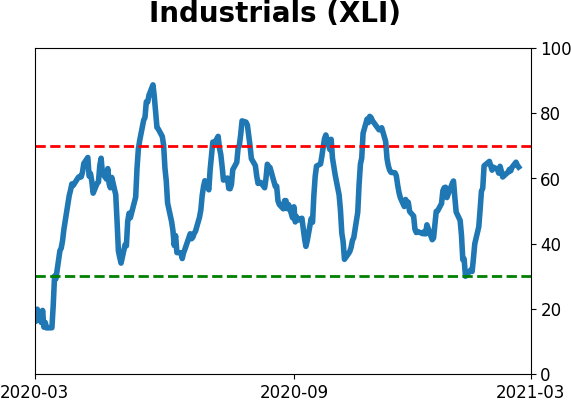
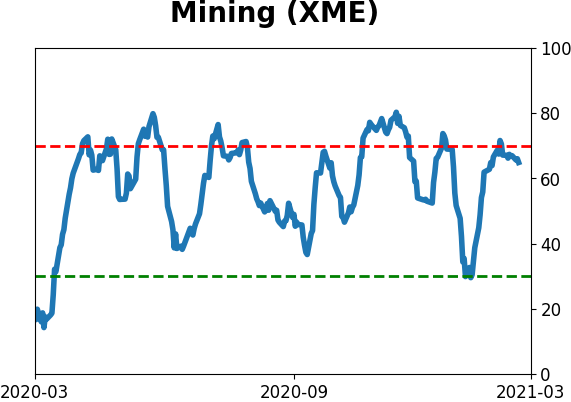
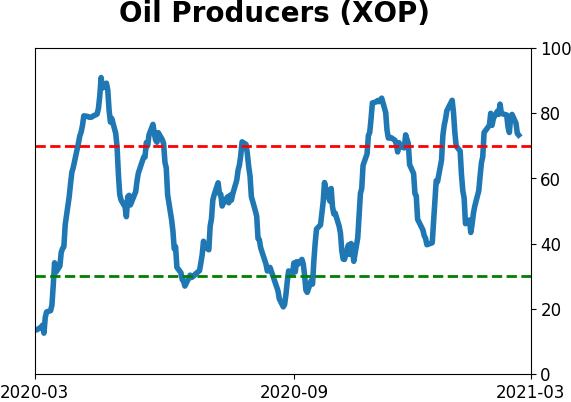
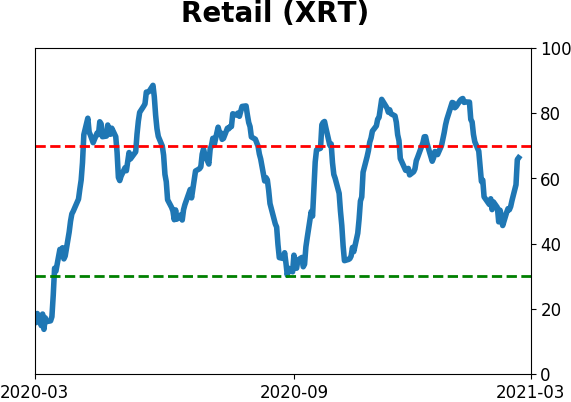
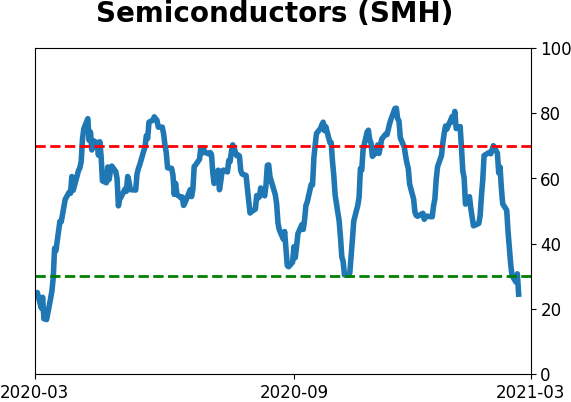
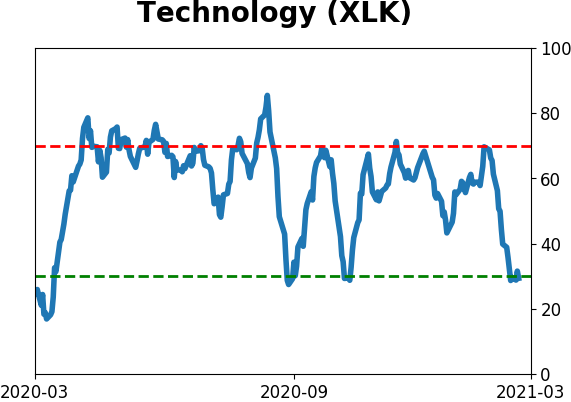
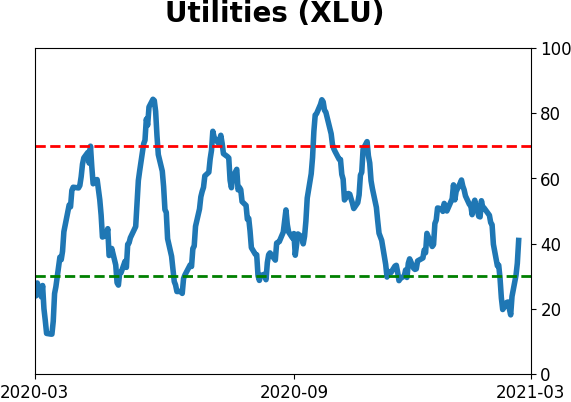
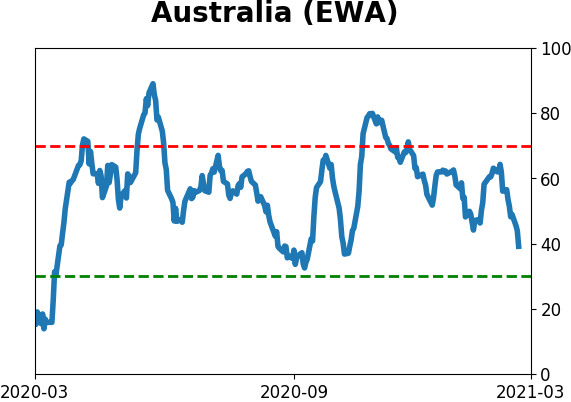
Optimism Index Thumbnails
|
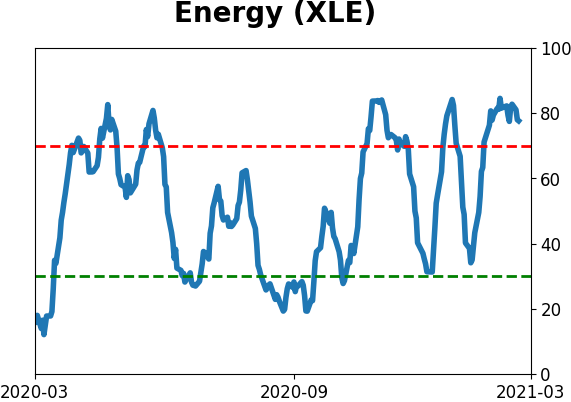
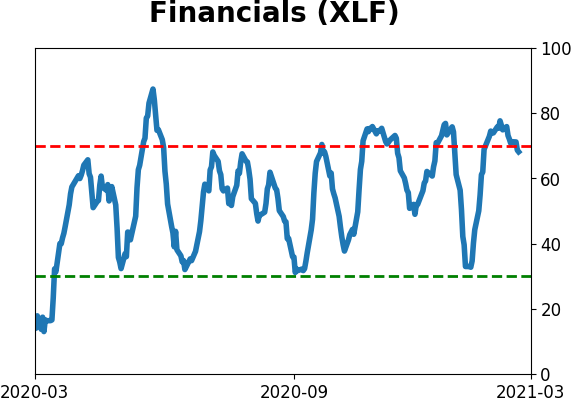
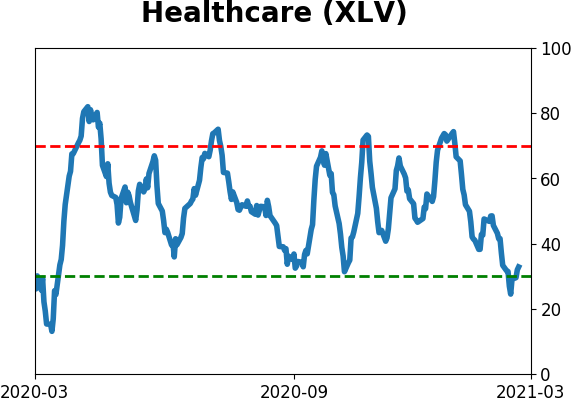
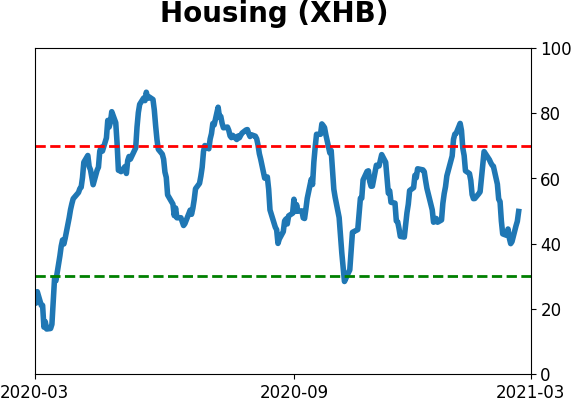
Sector ETF's - 10-Day Moving Average
|
|
|
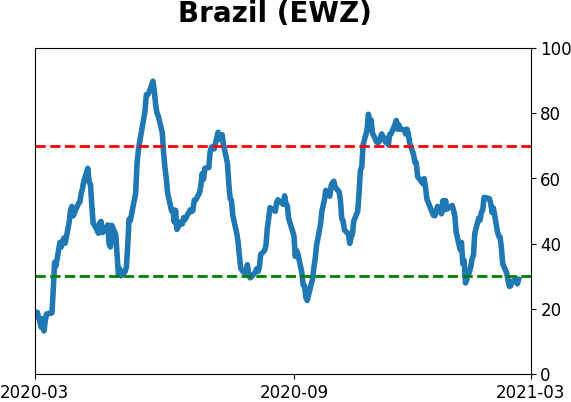
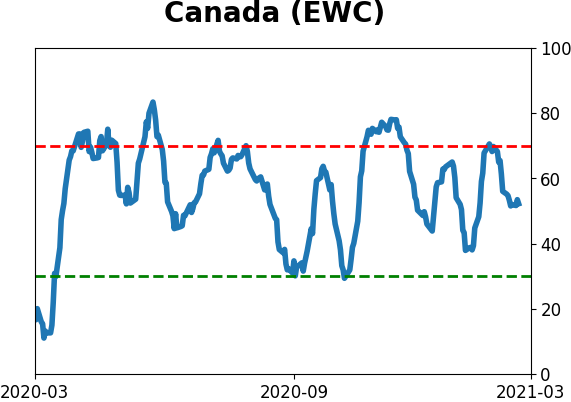
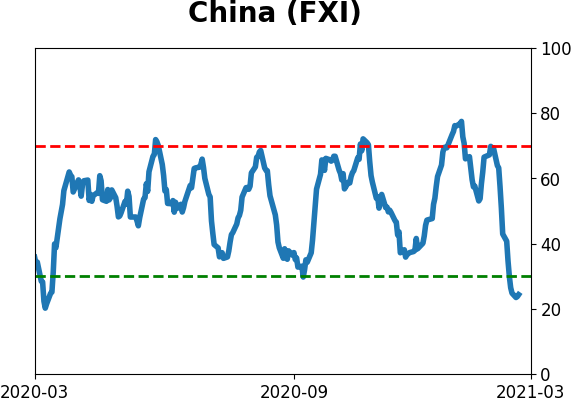
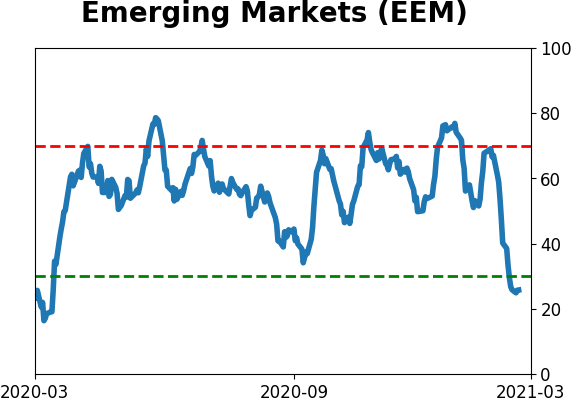
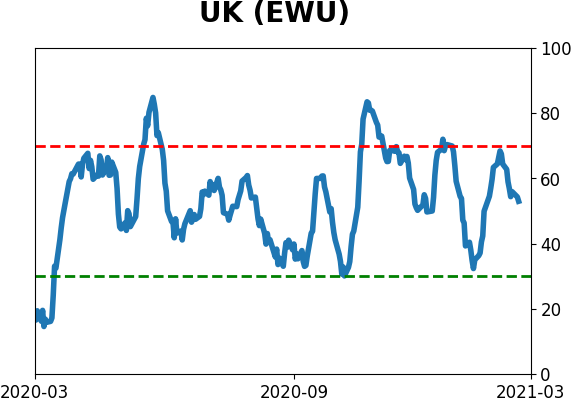
Country ETF's - 10-Day Moving Average
|
|
|
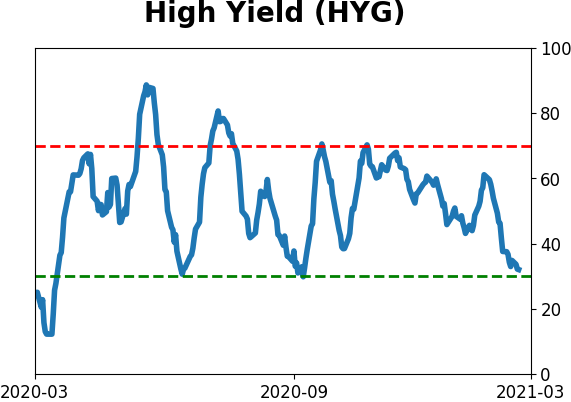
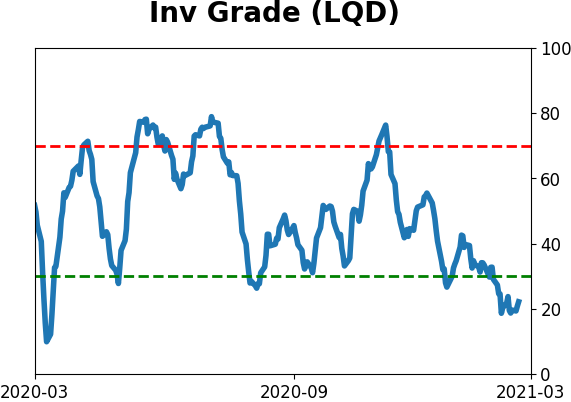
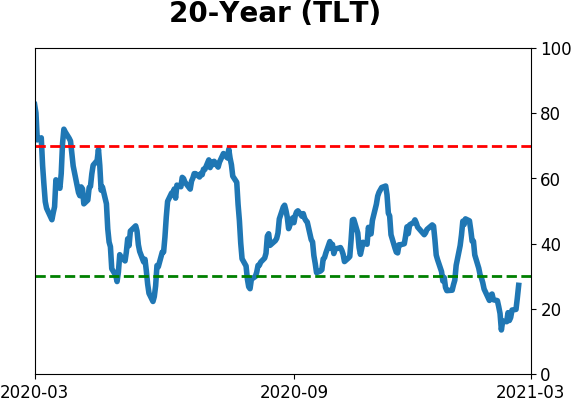
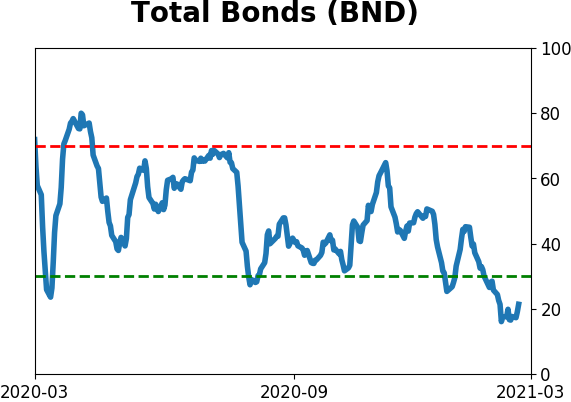
Bond ETF's - 10-Day Moving Average
|
|
|
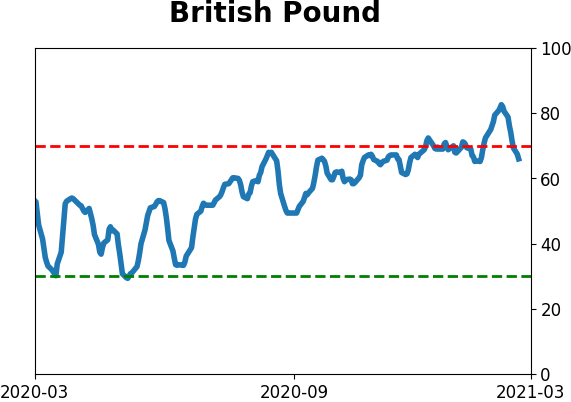
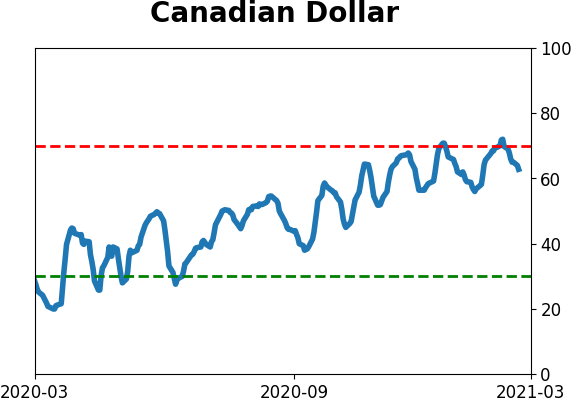
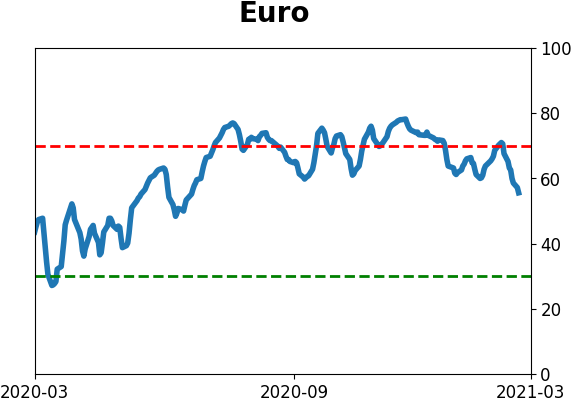
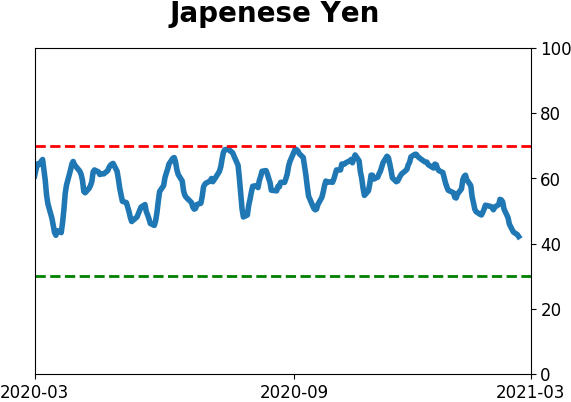
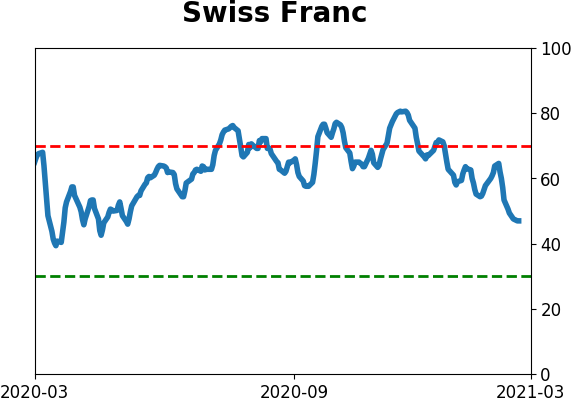
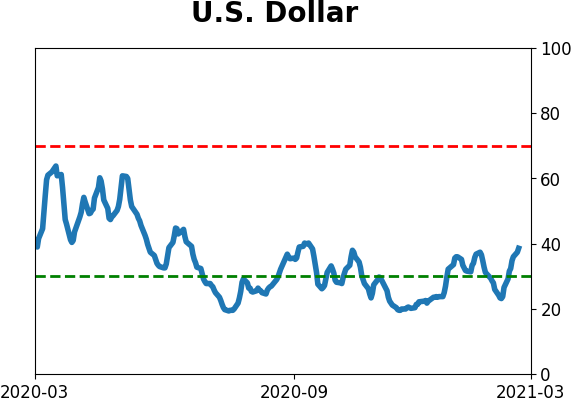
Currency ETF's - 5-Day Moving Average
|
|
|
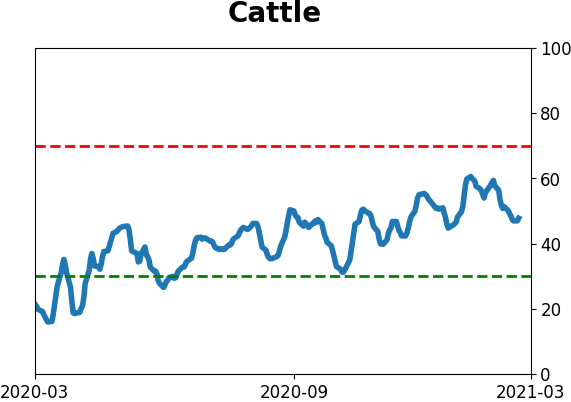
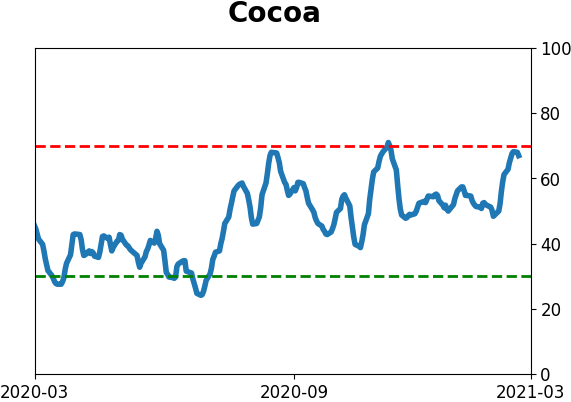
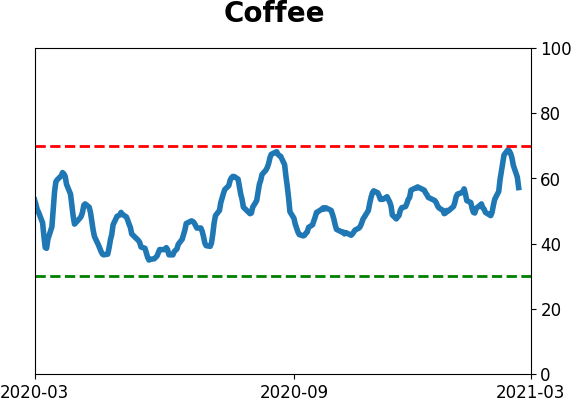
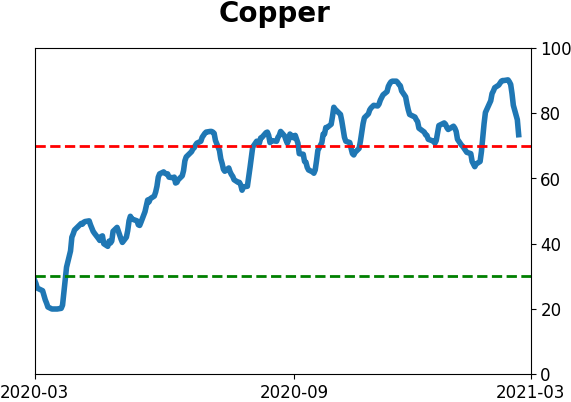
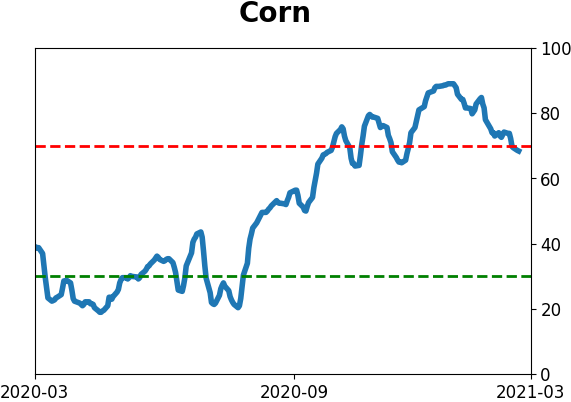
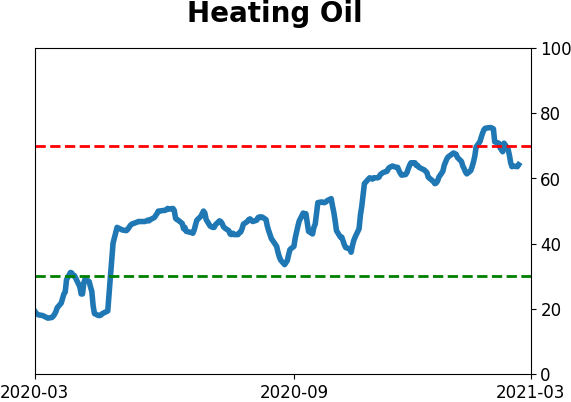
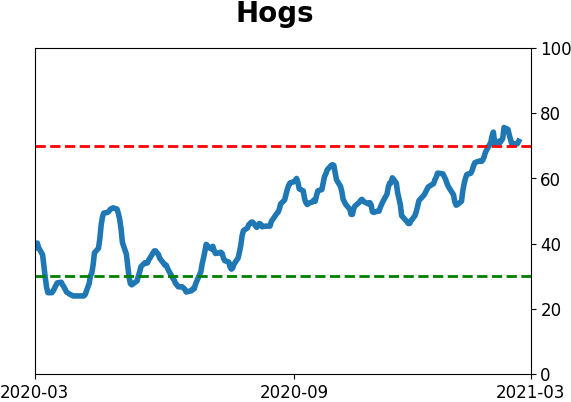
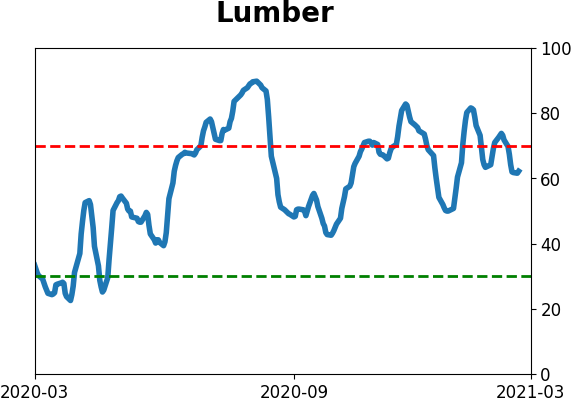
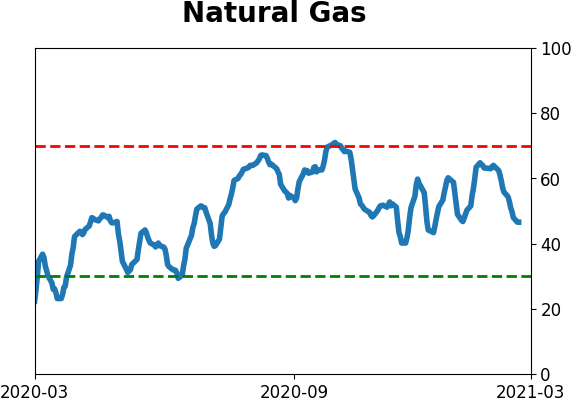
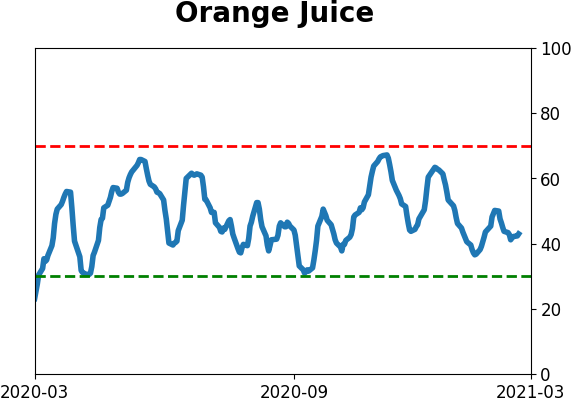
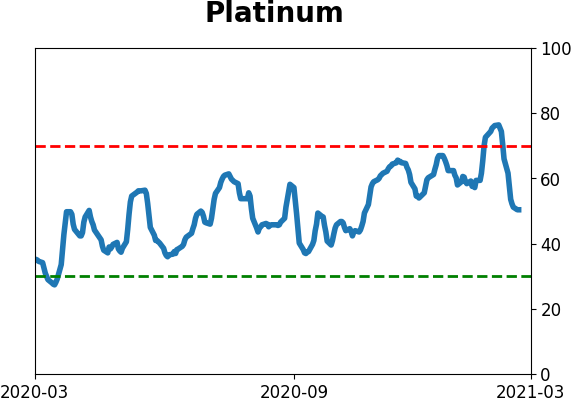
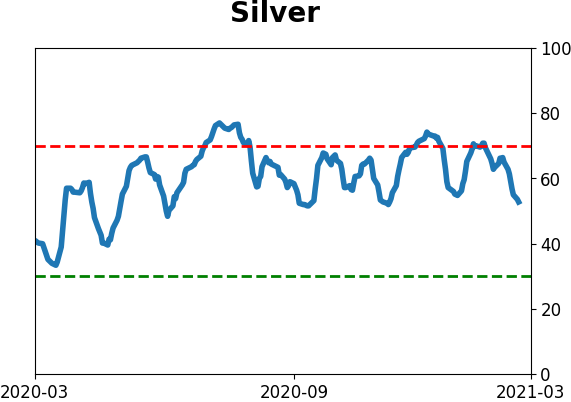
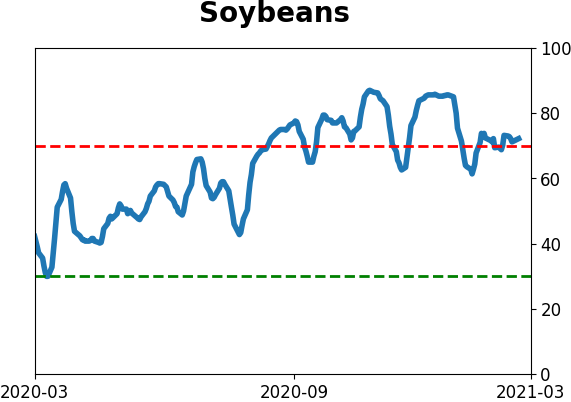
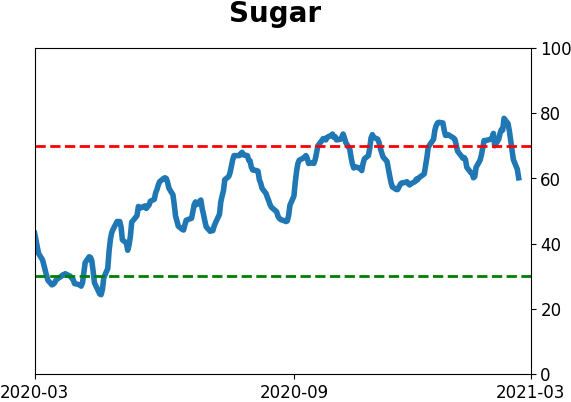
Commodity ETF's - 5-Day Moving Average
|
|