Headlines
|
|
A direct play in natural gas:
Several recent articles highlighted a potential opportunity in natural gas and one example of using options on a specific stock to exploit the opportunity. This article looks at one example of a way to play the price of natural gas more directly.
|
Smart / Dumb Money Confidence
|
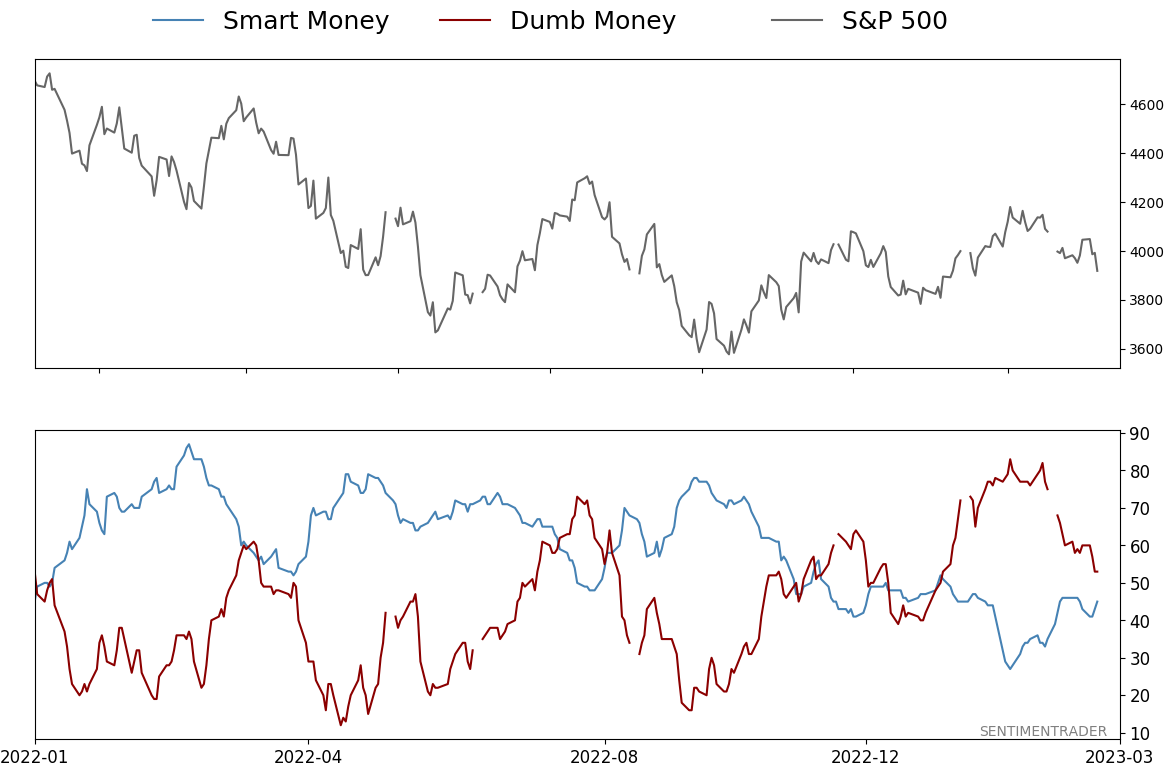
Smart Money Confidence: 45%
Dumb Money Confidence: 53%
|
|
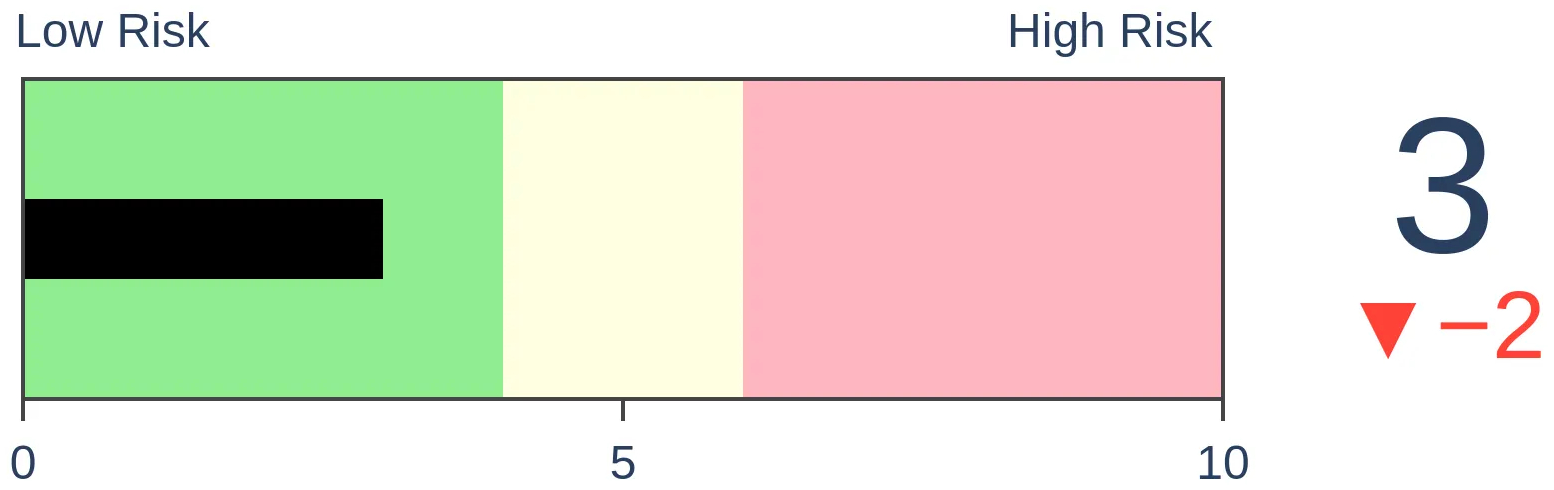
Risk Levels
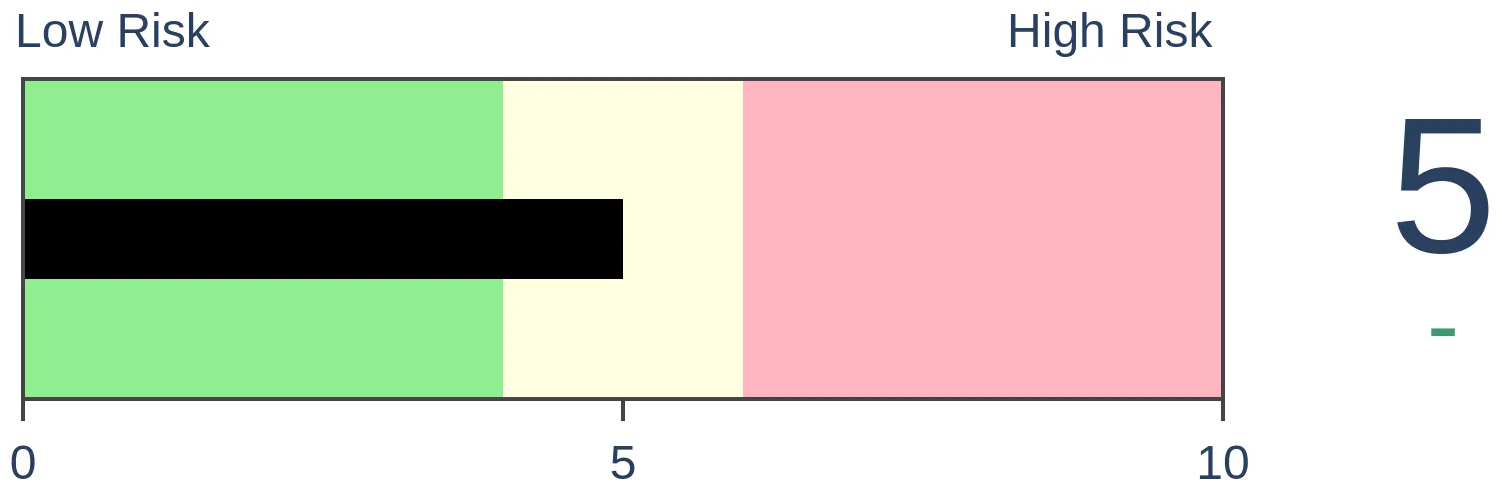
Stocks Short-Term
|
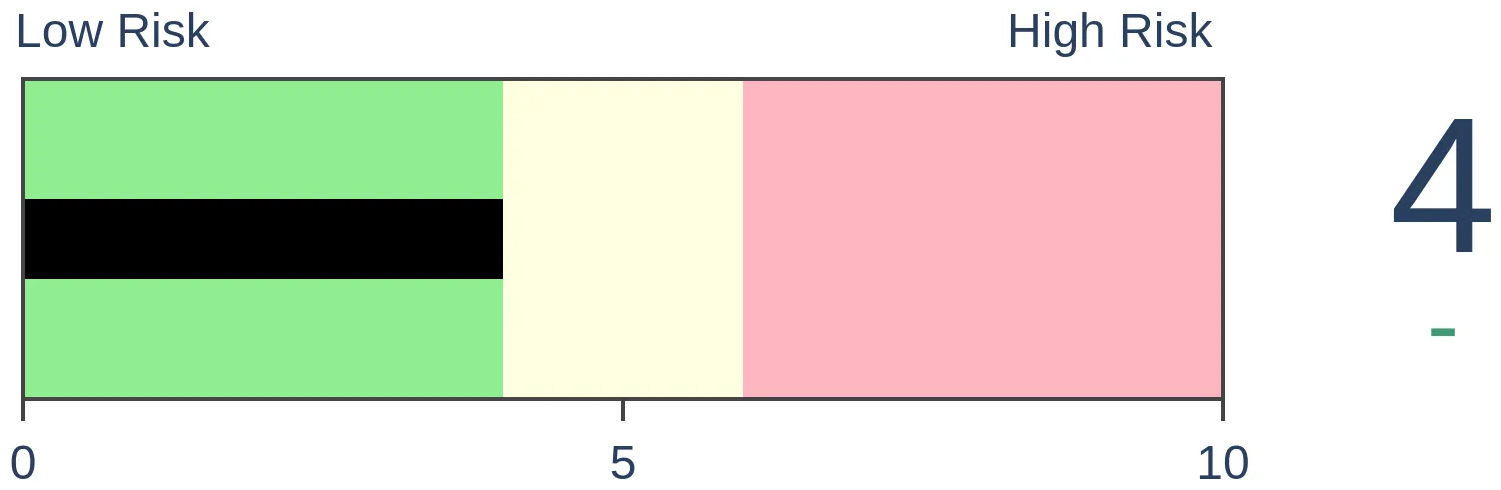
Stocks Medium-Term
|
|
Bonds
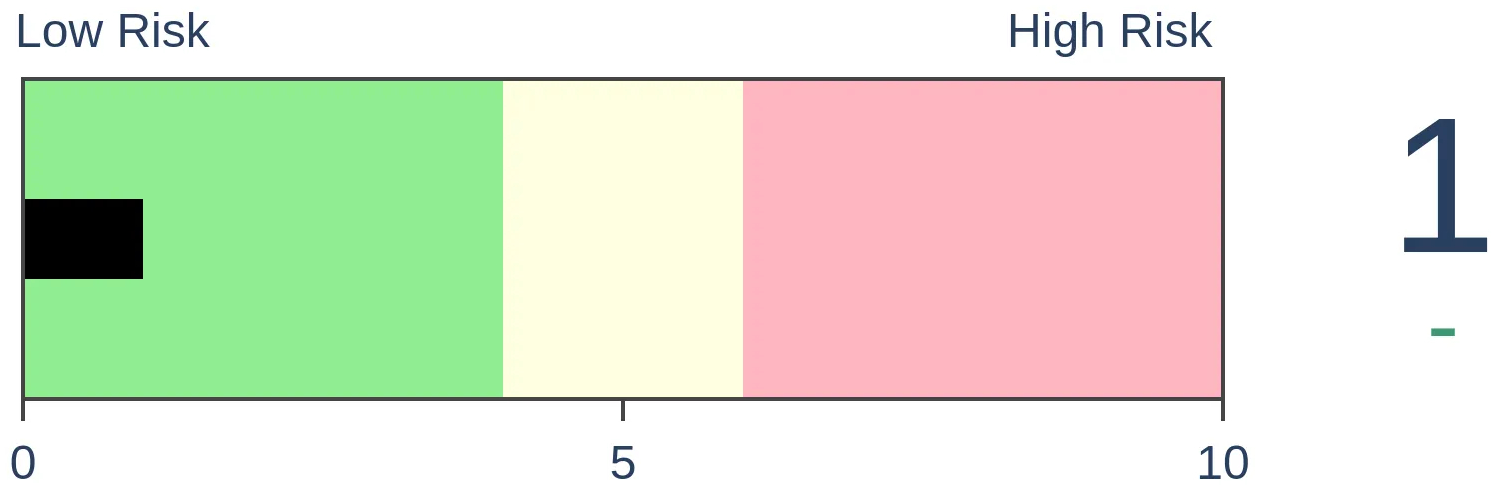
|
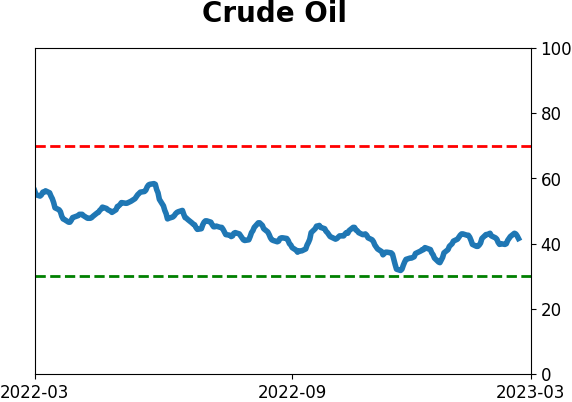
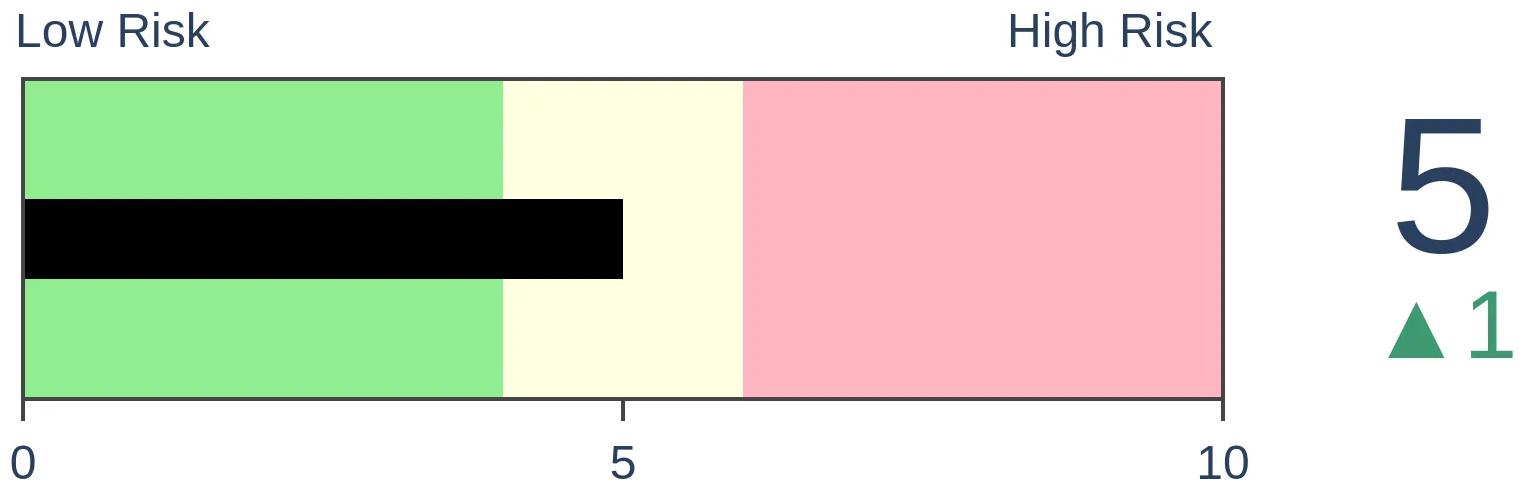
Crude Oil
|
|
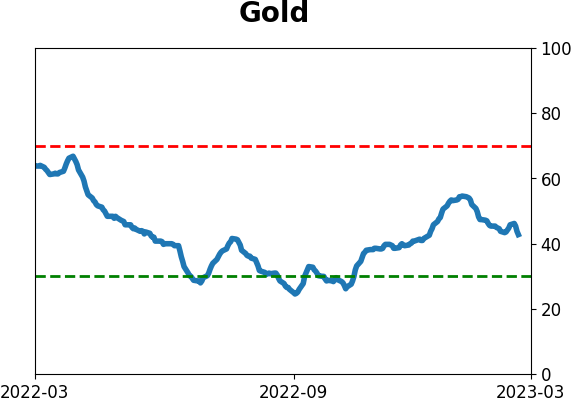
Gold
|
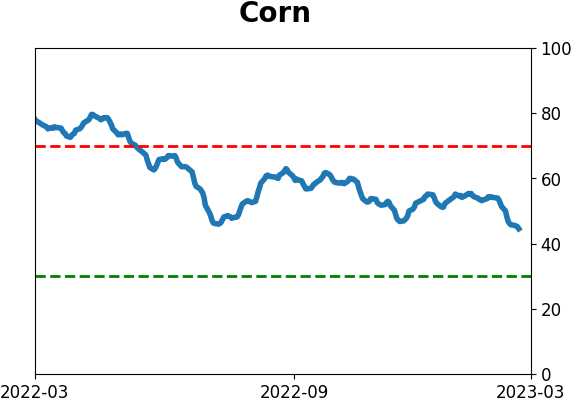
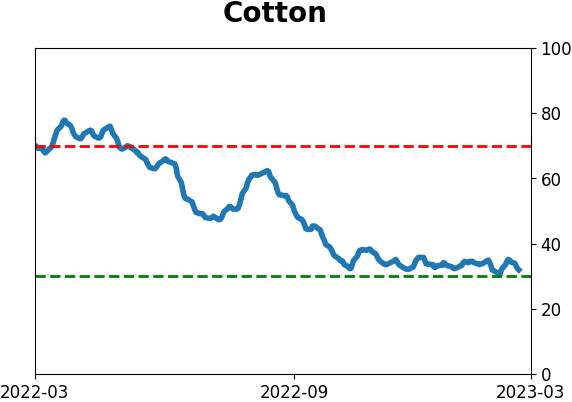
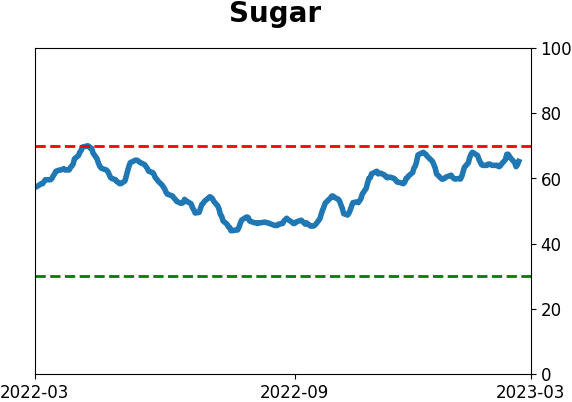
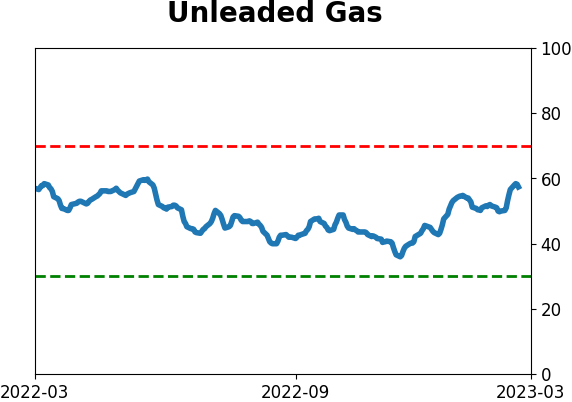
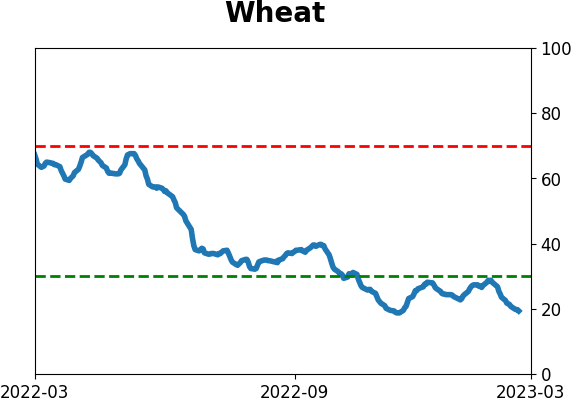
Agriculture

|
|
Research
By Jay Kaeppel
BOTTOM LINE
Several recent articles highlighted a potential opportunity in natural gas and one example of using options on a specific stock to exploit the opportunity. This article looks at one example of a way to play the price of natural gas more directly.
FORECAST / TIMEFRAME
None
|
Key points
- Dean and I both highlighted potentially favorable signs for natural gas (see here and here)
- In another recent article, I highlighted an example trade using options on ticker SWM as a proxy for natural gas
- In this piece, we highlight an example trade on and ETF intended to track natural gas directly
Focusing directly on natural gas
In this article, I noted that the United States Natural Gas Fund, LP (ticker UNG) has significant options trading volume. However, it also tends to have wide option bid/ask spreads. So the original article highlighted a trade on Swan Energy (ticker UNG), whose price movements are highly correlated with - and serves as a reasonable proxy for - natural gas.
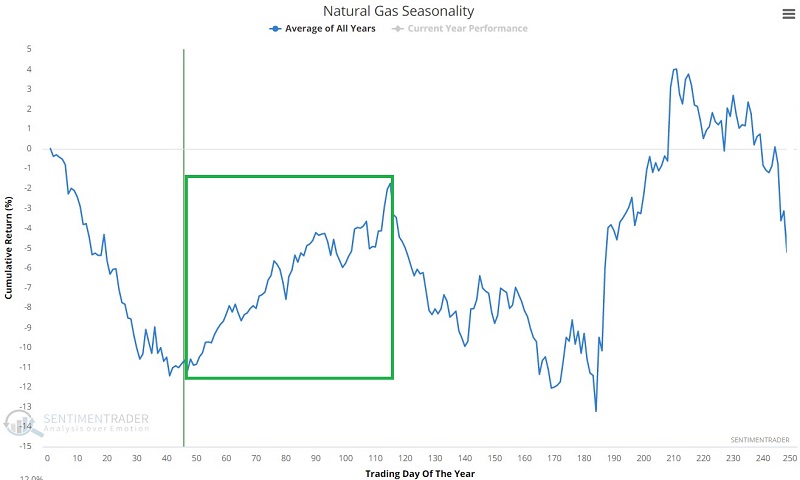
The chart below displays the annual seasonal trend for natural gas futures. With natural gas now moving into the heart of one of the most favorable times of the year, we will focus on an example trade using options on ticker UNG, while using care to minimize the potentially harmful effect of wide bid/ask spreads.
UNG options remain expensive
Please see the original article for a discussion of options implied volatility (IV). The bottom line, for now, is that UNG options remain somewhat "expensive" - i.e., IV is relatively high, which tells us that overall the options have a lot of time premium built into them. The primary concern for a bullish trader is this: If you buy a call option and IV subsequently drops significantly, the option can lose a substantial amount of time premium, even if UNG moves somewhat higher.
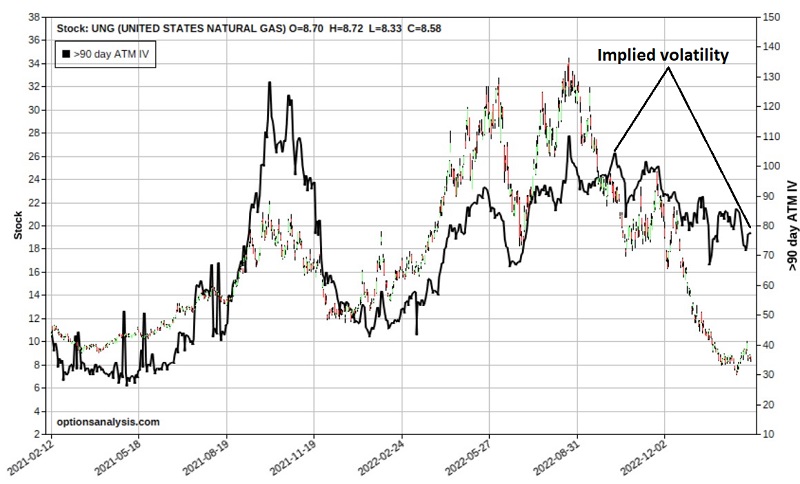
The chart below (this and the other charts that follow are courtesy of Optionsanalysis.com) displays UNG price action and the history of implied volatility (black line). IV is presently somewhere in the middle of the historical range and could move either way. Since we are looking for a long premium bullish trade we need to be concerned about minizing the negative effects if IV declines after a trade is entered.
A bullish strategy for a high IV situation
The favorable seasonal period extends into early June. So we will look at June 2023 UNG options. The strategy we will consider is referred to as a "bull call spread" and involves the following:
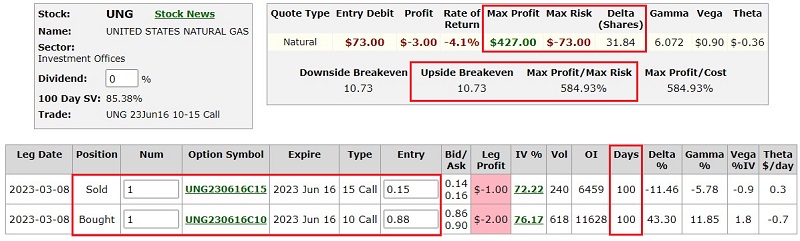
- Buy the UNG June 2023 10-strike price call @ $0.88
- Sell the UNG June 2023 15-strike price call @ $0.15
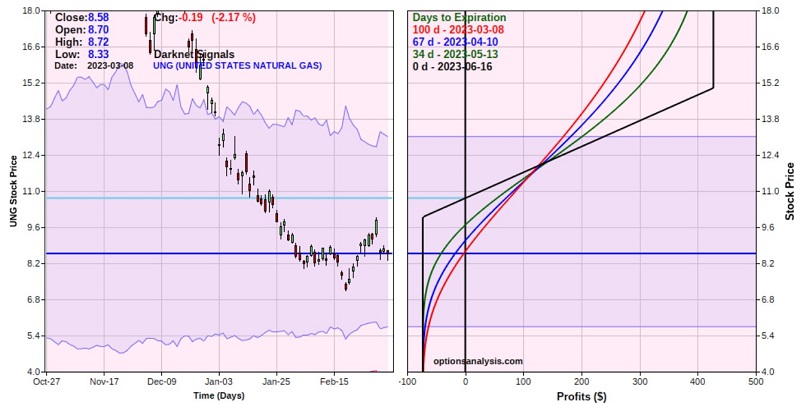
The screenshot below displays the particulars for this trade, and the chart below shows the risk curves (i.e., the expected $P/L at a given price for UNG as of four different dates leading up to options expiration).
The red line in the right-hand side of the chart below displays the expected P/L as of 2023-03-08 at each price for UNG between $3 and $18 a share. The black line in the right-hand side of the chart below displays the expected P/L as of June options expiration (2023-06-16) at each price for UNG between $3 and $18 a share. Note how the lines shift over time. This is due primarily to "time decay", i.e., the fact that every option will lose all of its time premium by expiration.
A closer look at the risk curves below reveals that:
- below roughly $12 a share for UNG, time decay works against us (the lines shift lower as time goes by)
- above roughly $12 a share for UNG, time decay works for us (the lines shift higher as time goes by)
Things to note:
- The options have 100 days left until expiration, so there is plenty of time for UNG to (hopefully) work its way higher
- The cost to enter the trade - and the maximum risk - $73 for a 1-lot (this is based on the assumption that we use a limit order at the midpoint of the bid/ask spread and that we can get filled at that price)
- A 1-lot has a delta of 31.84, meaning this position is roughly equivalent to holding 32 shares of UNG (however, actually, to buy 32 shares of UNG would cost $275 instead of $73 to enter the option trade)
- The break-even price on this trade at June expiration is $10.73 a share for UNG (so UNG MUST rally at some point to generate a profit)
- The maximum profit potential is +$473 if UNG is above $15 a share at the June expiration
We chose the bull call strategy partly because it allows us to sell a relatively expensive call option (the 15-strike price call) to help us pay for the long call (the 10-strike price call). Note also that we chose options with relatively small bid/ask spreads and then placed a limit order to buy and sell at the midpoint of each. By doing so specifically, the fact that UNG bid/ask spreads in general are relatively wide is moot.
Thoughts on position management
The example trade highlighted above qualifies as a purely "speculative" position (i.e., risk of loss is high). If UNG fails to rally in the months ahdead this position is guaranteed to lose money. That is why position sizing in crucially important. Ideally a trader would mulitply their trading capital by no more than 1% to 3% (so a $25 account might risk $250 to $750 maximum). The result can be divided by the cost of a 1-lot ($73 in this example) to arrive at a reasonable lot-size. So if a trader with a $25K trading account was willing to risk roughly 2% of their total trading capital, then $500/$73 = 6.84, so the trader might consider trading a 6 or 7-lot and thus risk roughly 2% of the their total trading capital.
If UNG does, in fact, rally strongly, a trader must have some plan for taking a profit. The ultimate hope is that UNG will rally to the strike price of $15. If the ETF rallies to that price, the option position will show an approximate open profit of $236 to $427, depending on how soon that price is hit.
As a less ambitious target, if the trade shows an open profit in excess of the cost of entry ($73 for a 1-lot), a trader might consider adjusting the trade at that point to try to lock in a profit.
On the downside, a trader must decide if they are willing to risk the entire $73 per 1-lot or if they might cut their loss if UNG takes out the recent low at $7.14.
What the research tells us…
In a nutshell, trading can be boiled down to two steps: a) spot opportunity and b) exploit the opportunity. The highly favorable seasonal tendency for natural gas, combined with the rare and powerful bullish signal that Dean highlighted here, qualifies as a potential opportunity. That said, there is absolutely no guarantee that natural gas will cooperate, so the example trade above should be considered speculative in nature. As a result, a low dollar-cost option trade is highlighted as a simple way to exploit the potential opportunity (if UNG does behave as hoped) while minimizing risk and offering leveraged profit potential.
Indicators at Extremes
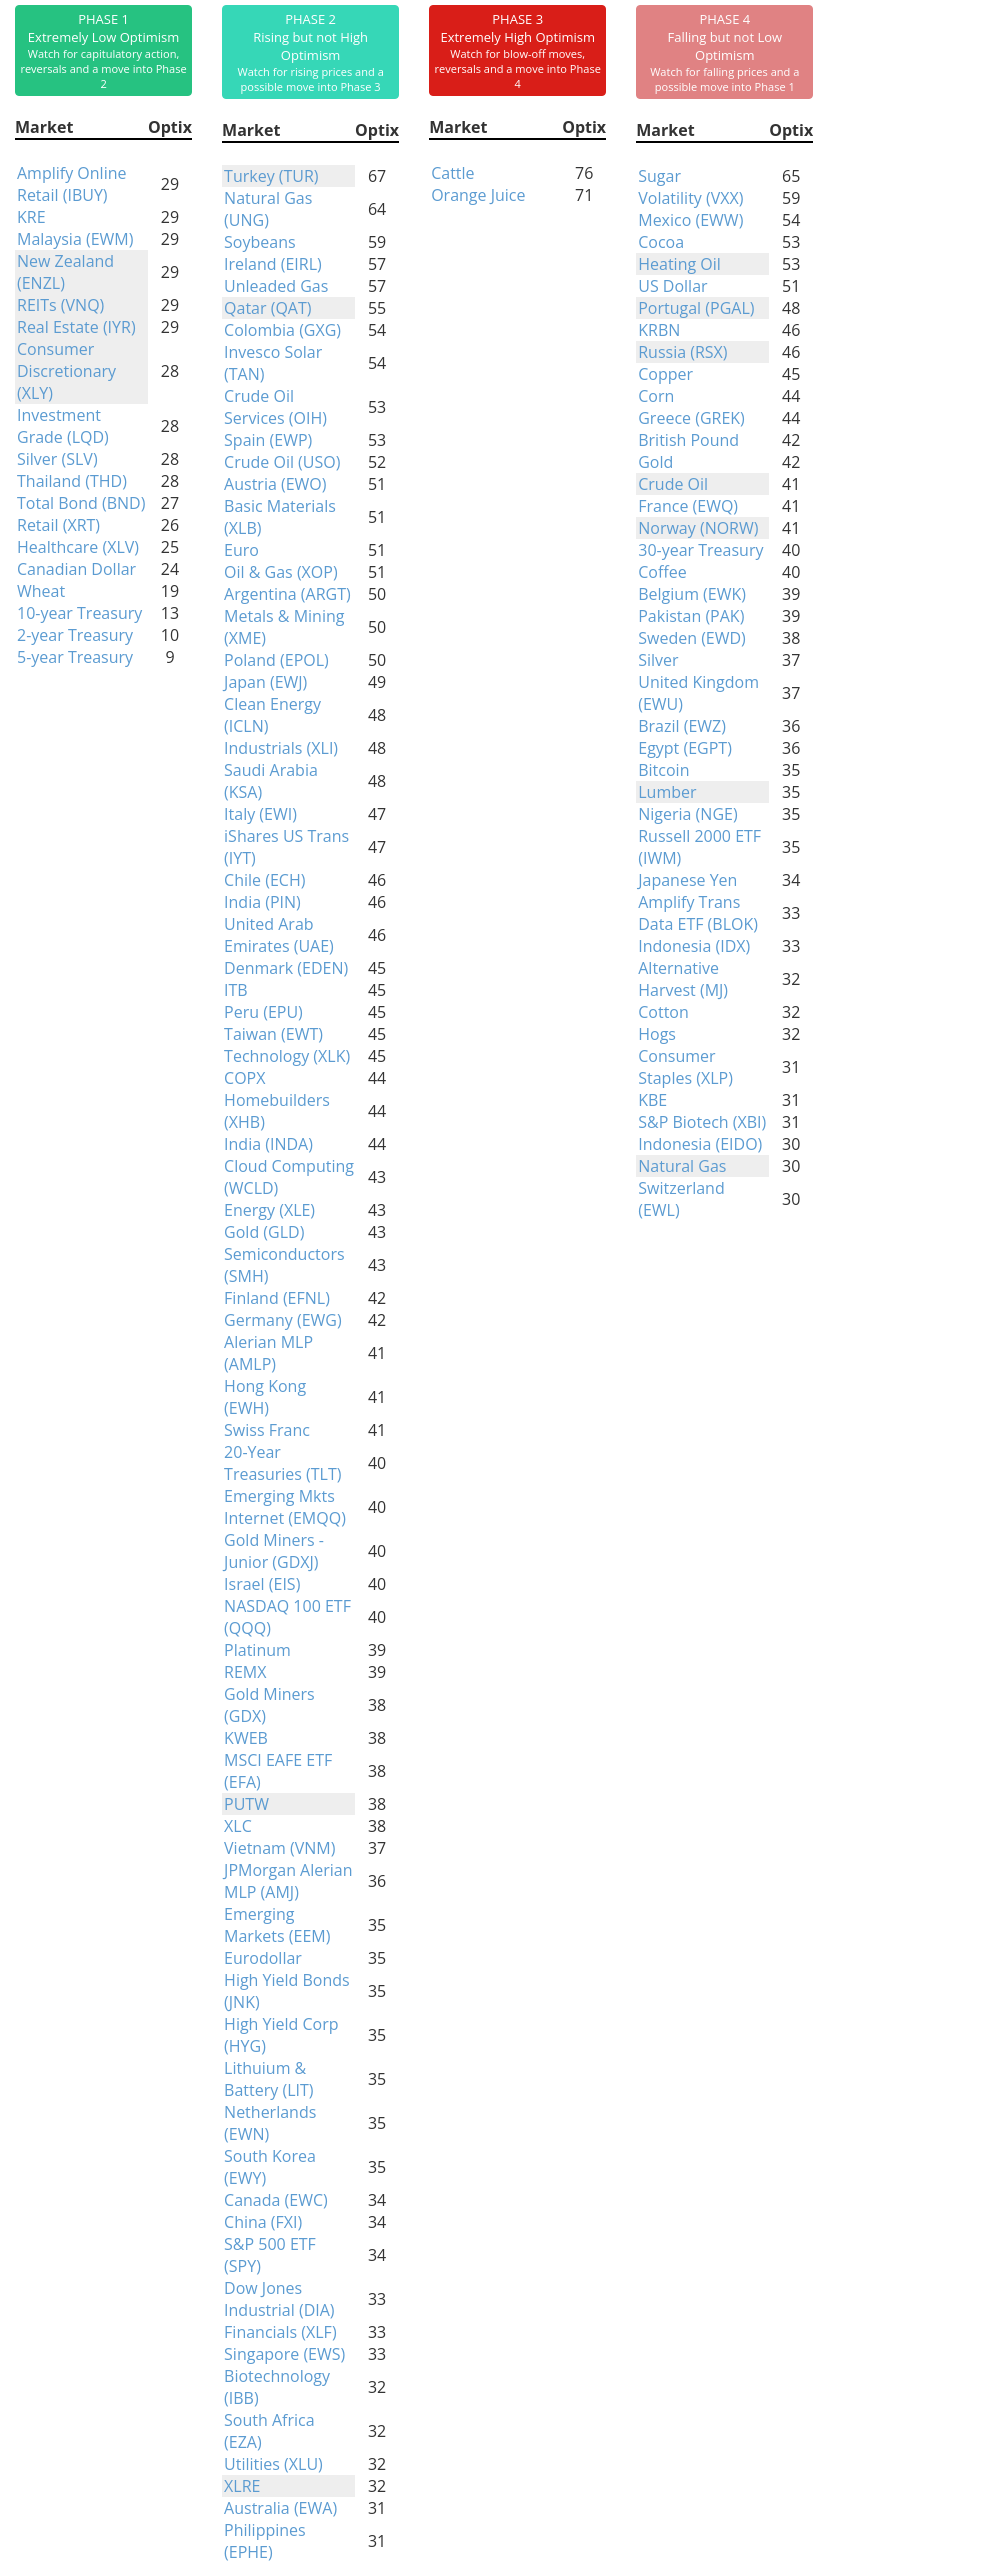
Phase Table
Ranks
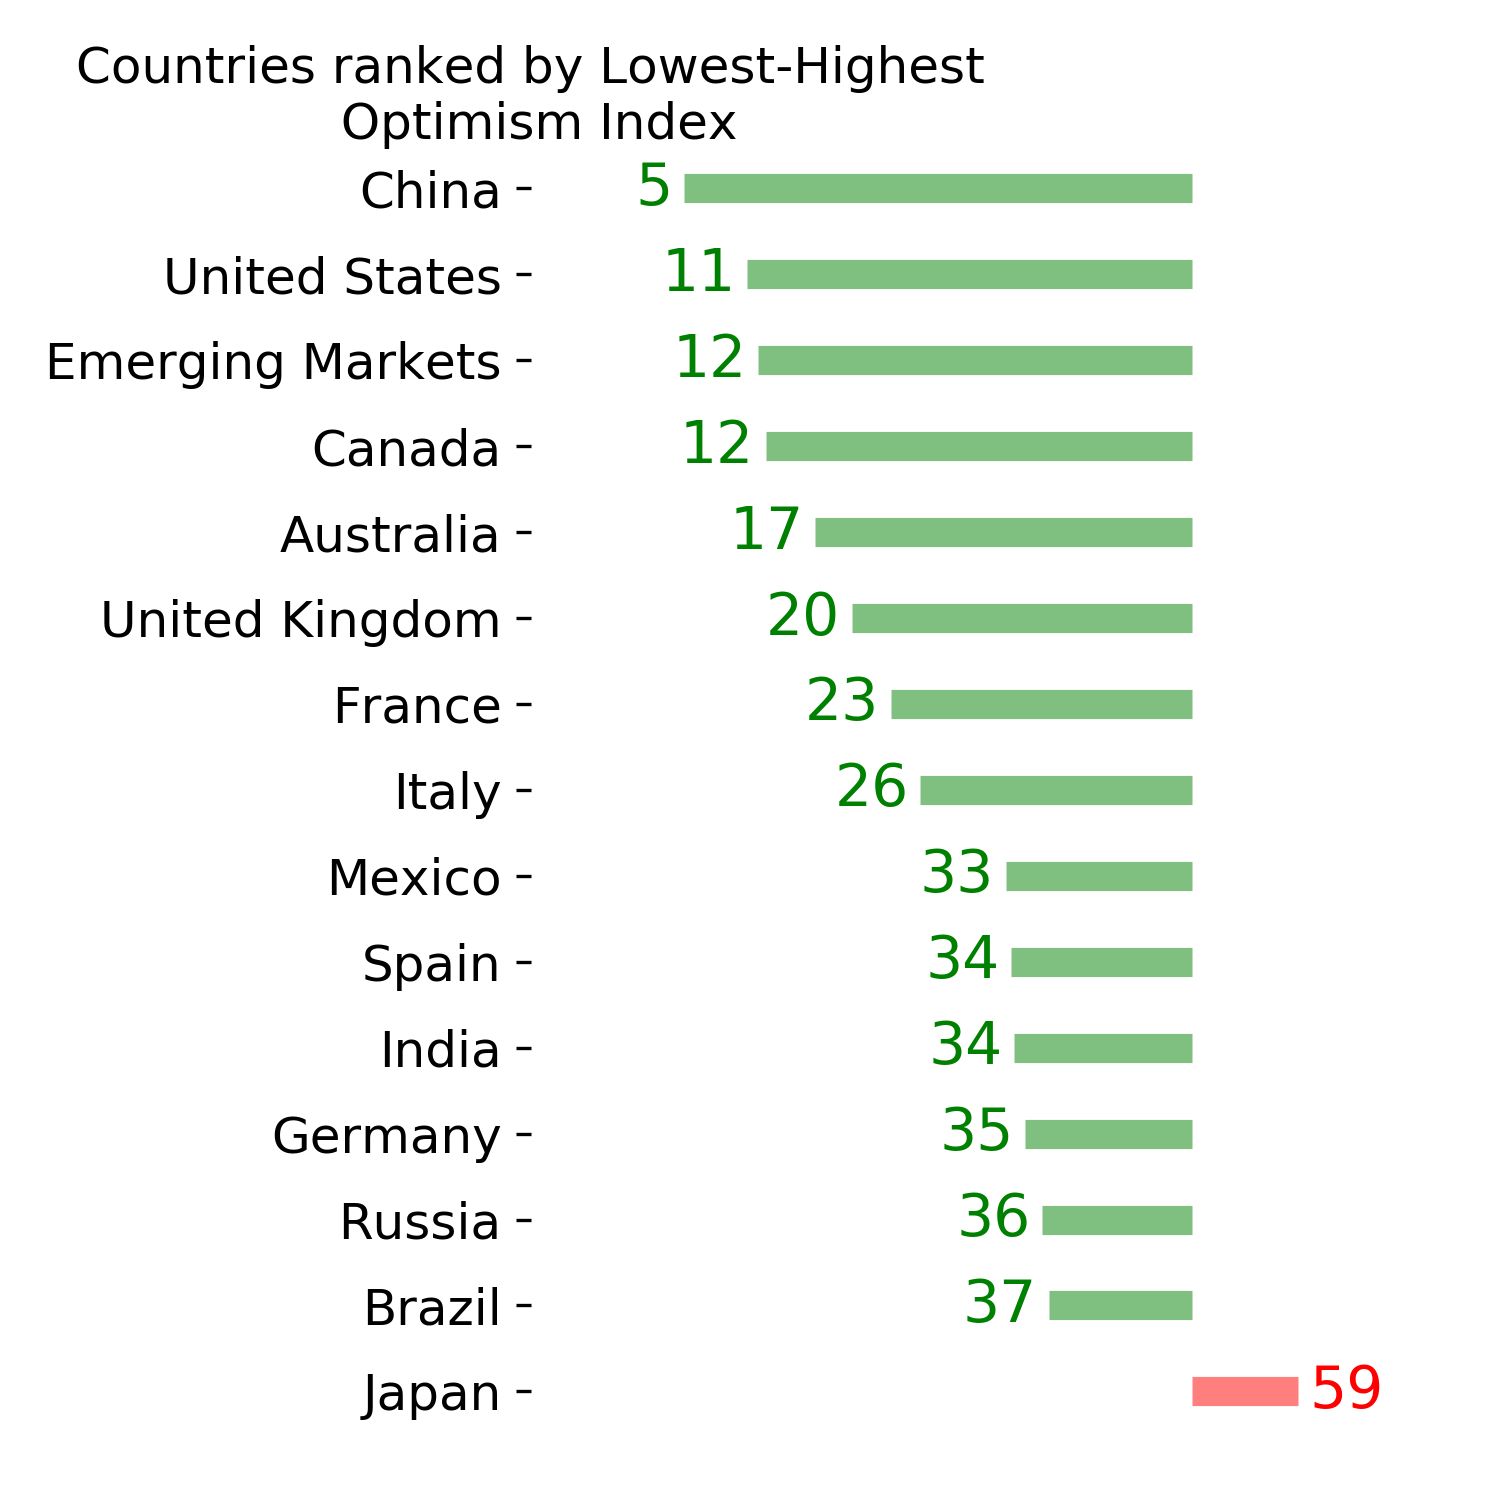
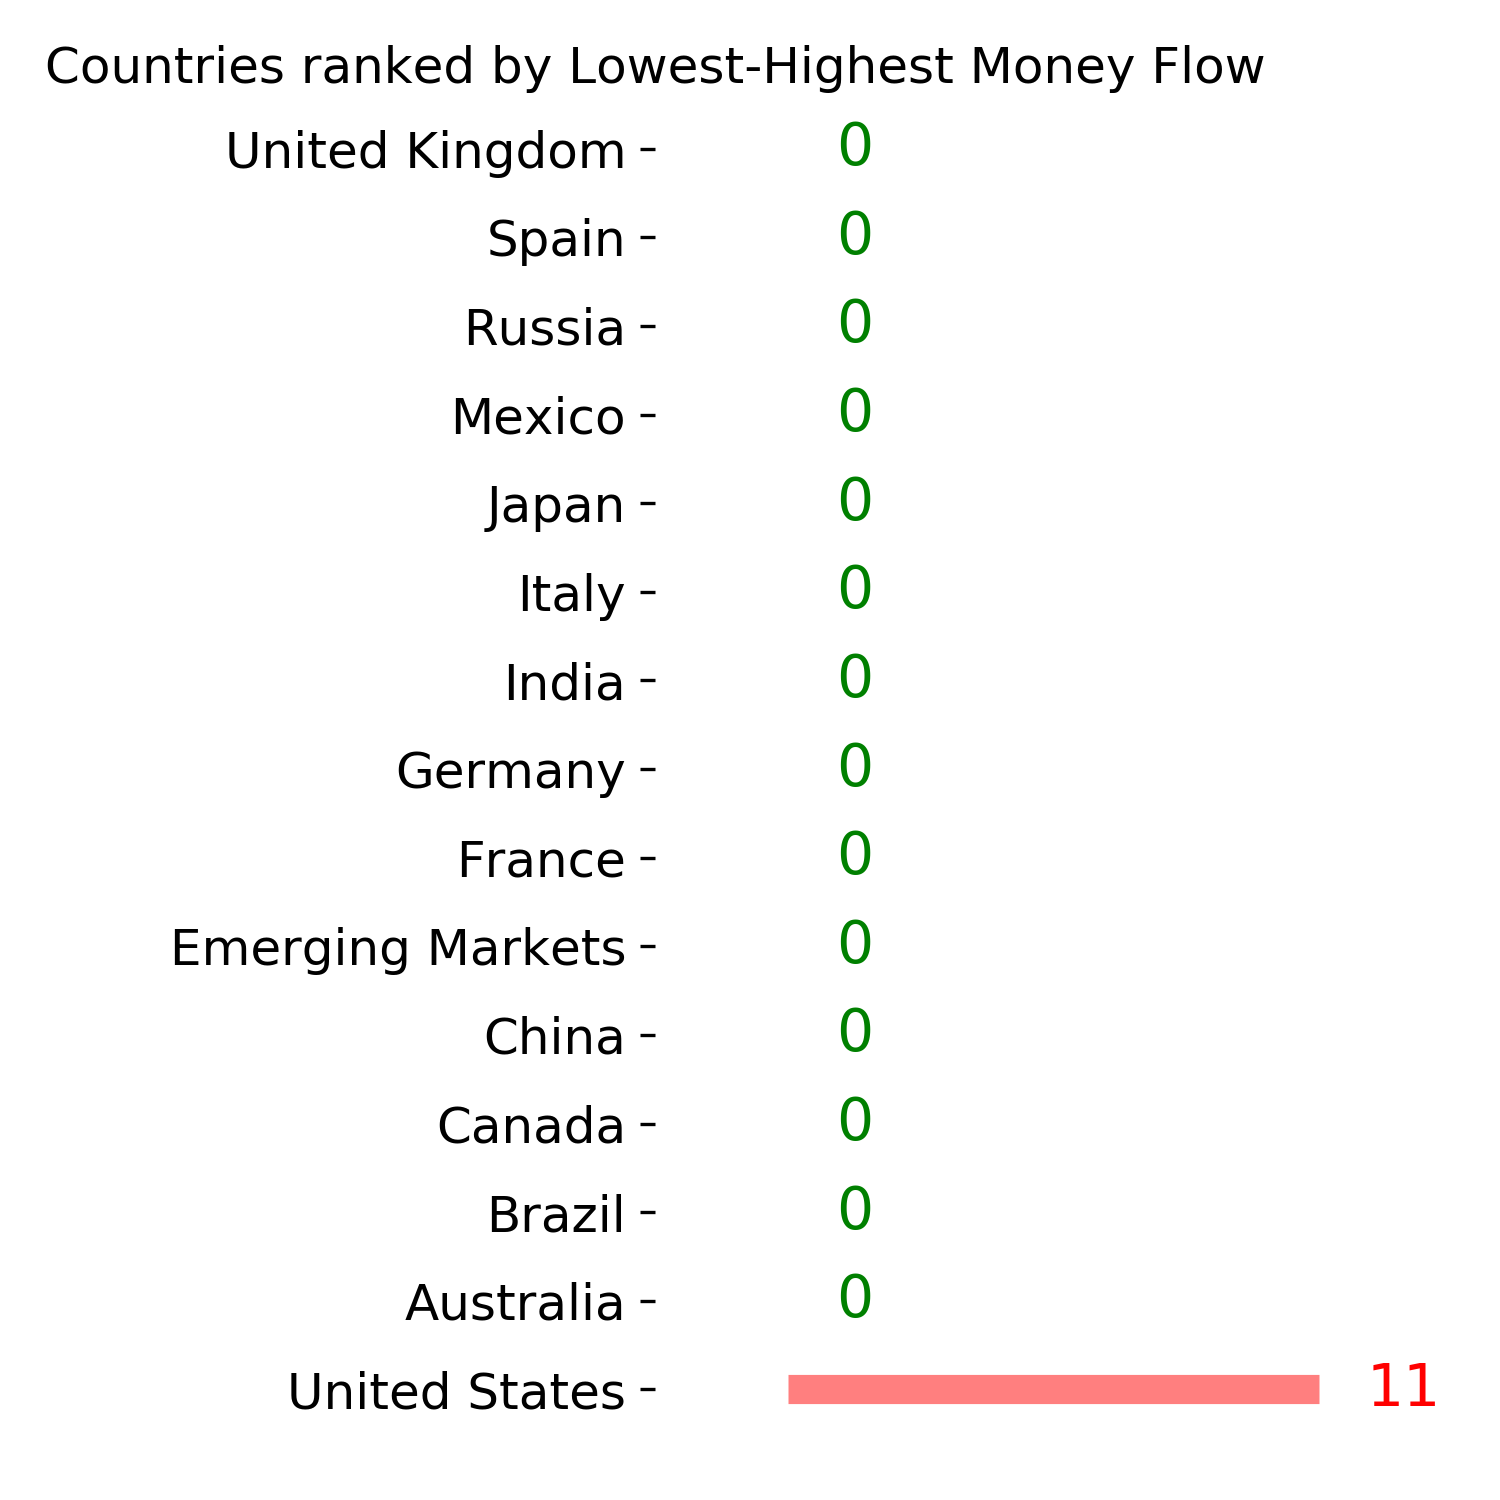
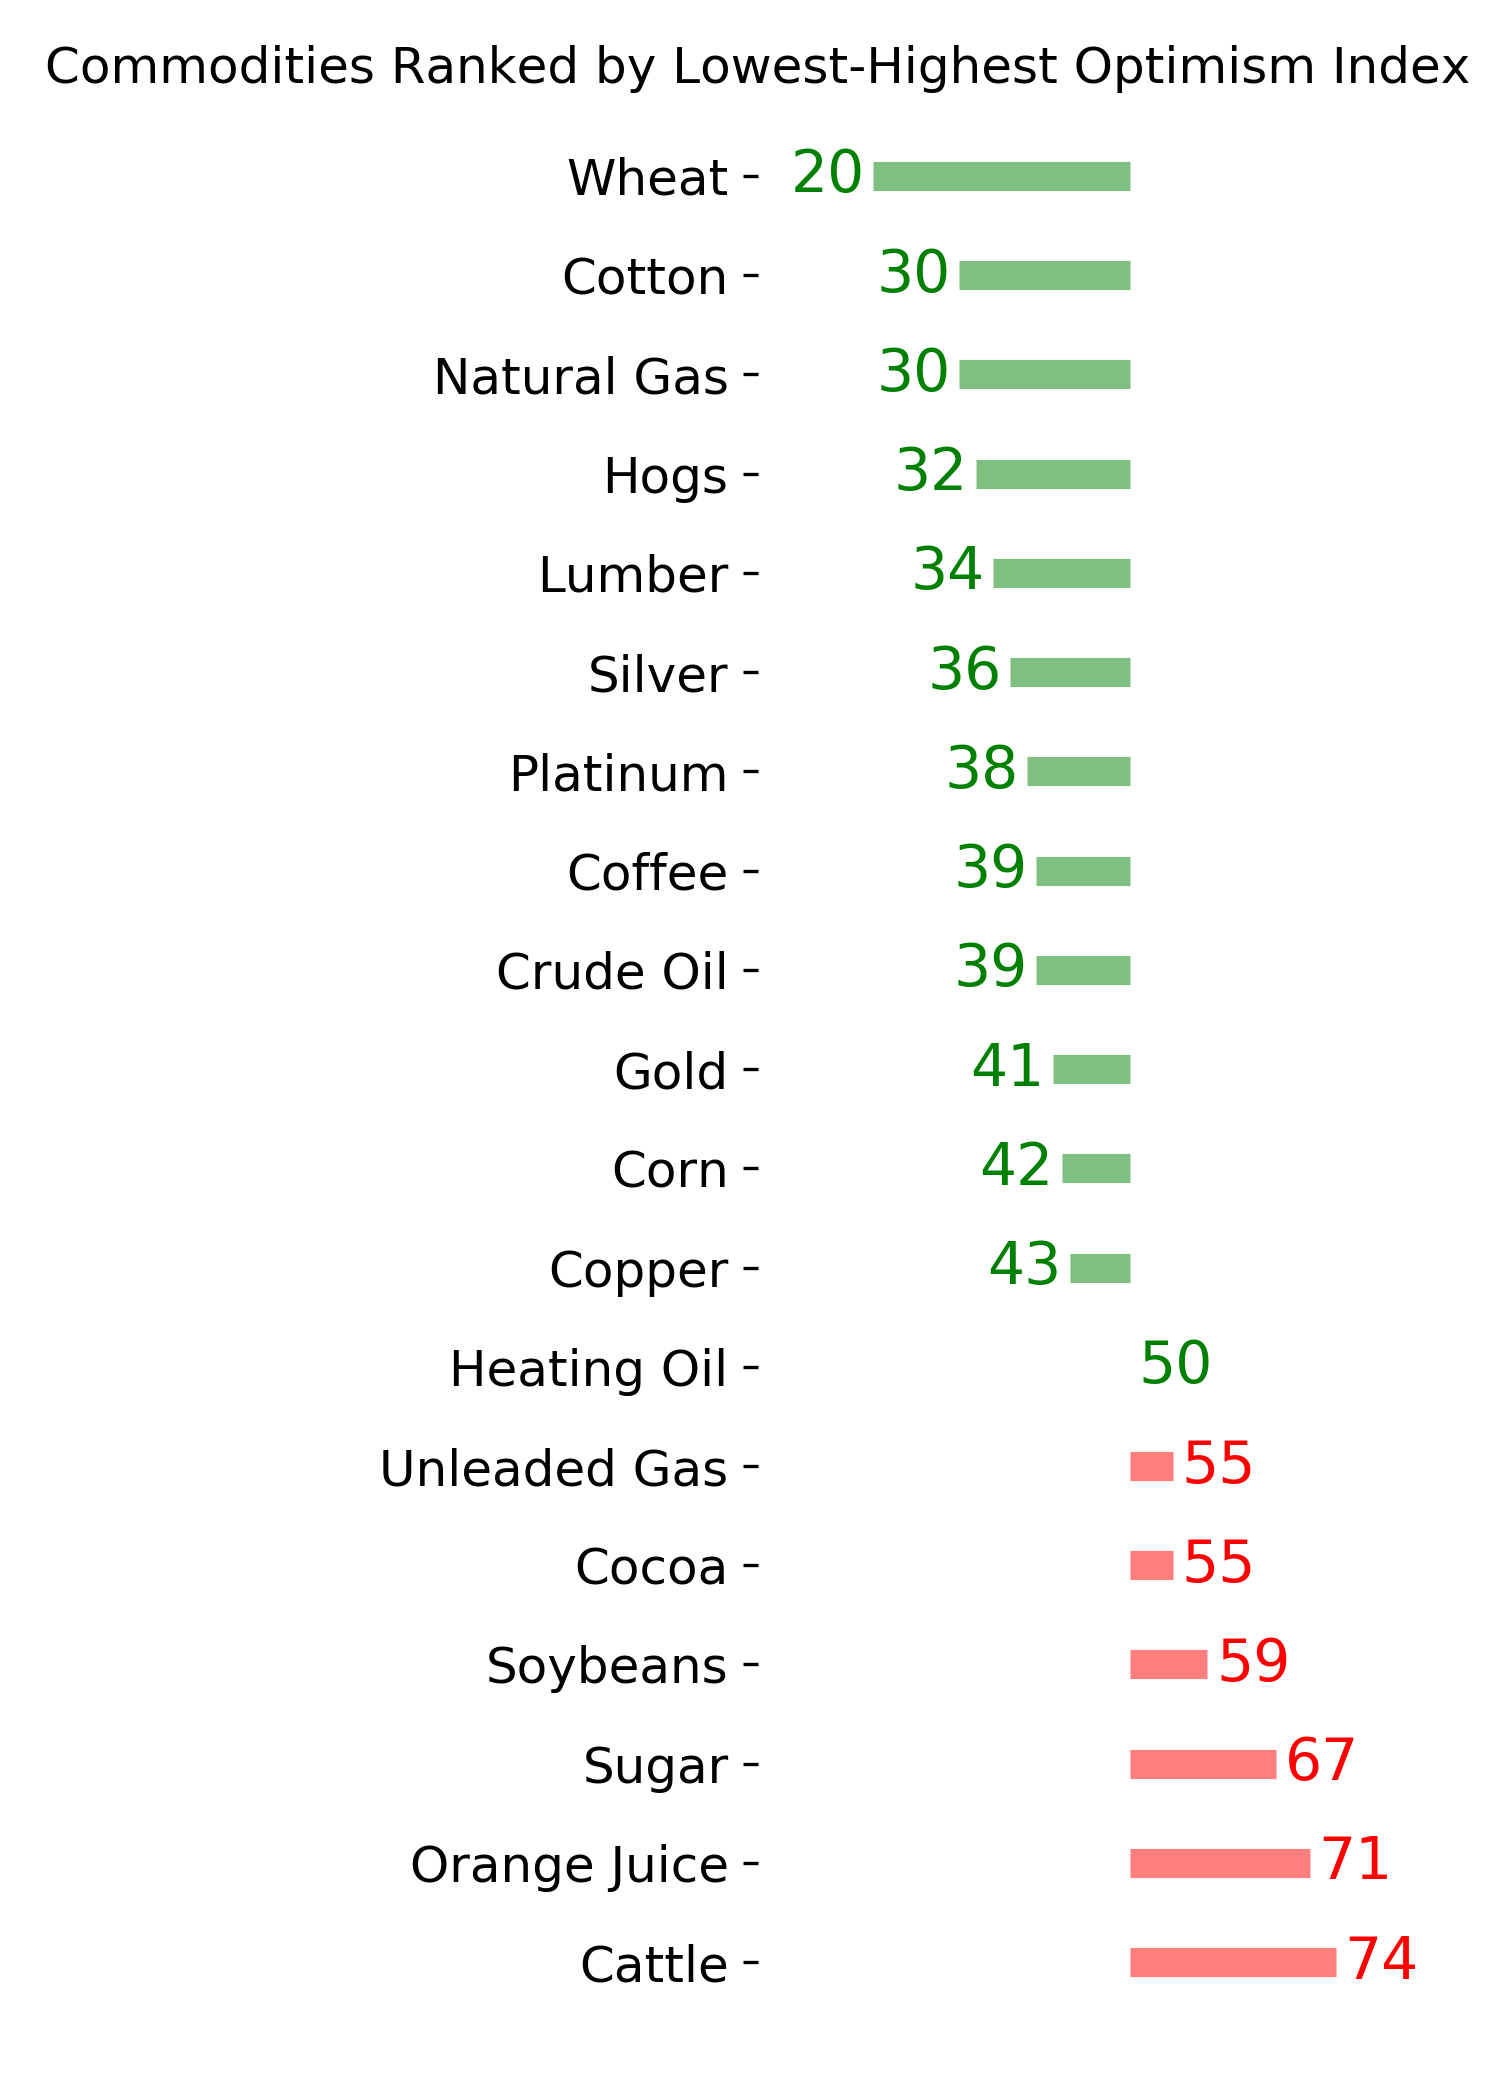
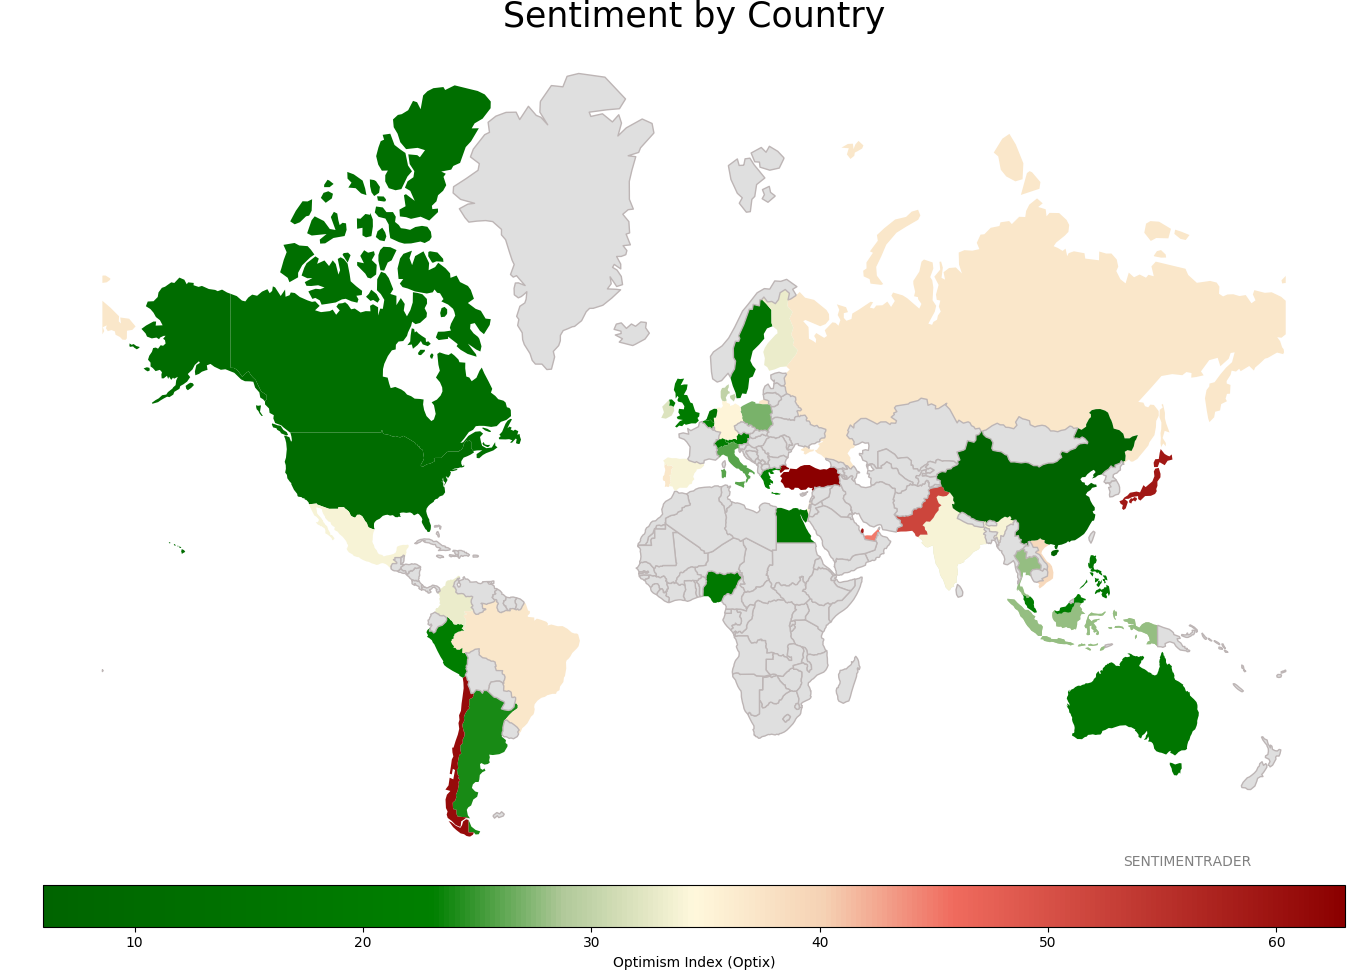
Sentiment Around The World
Optimism Index Thumbnails
|
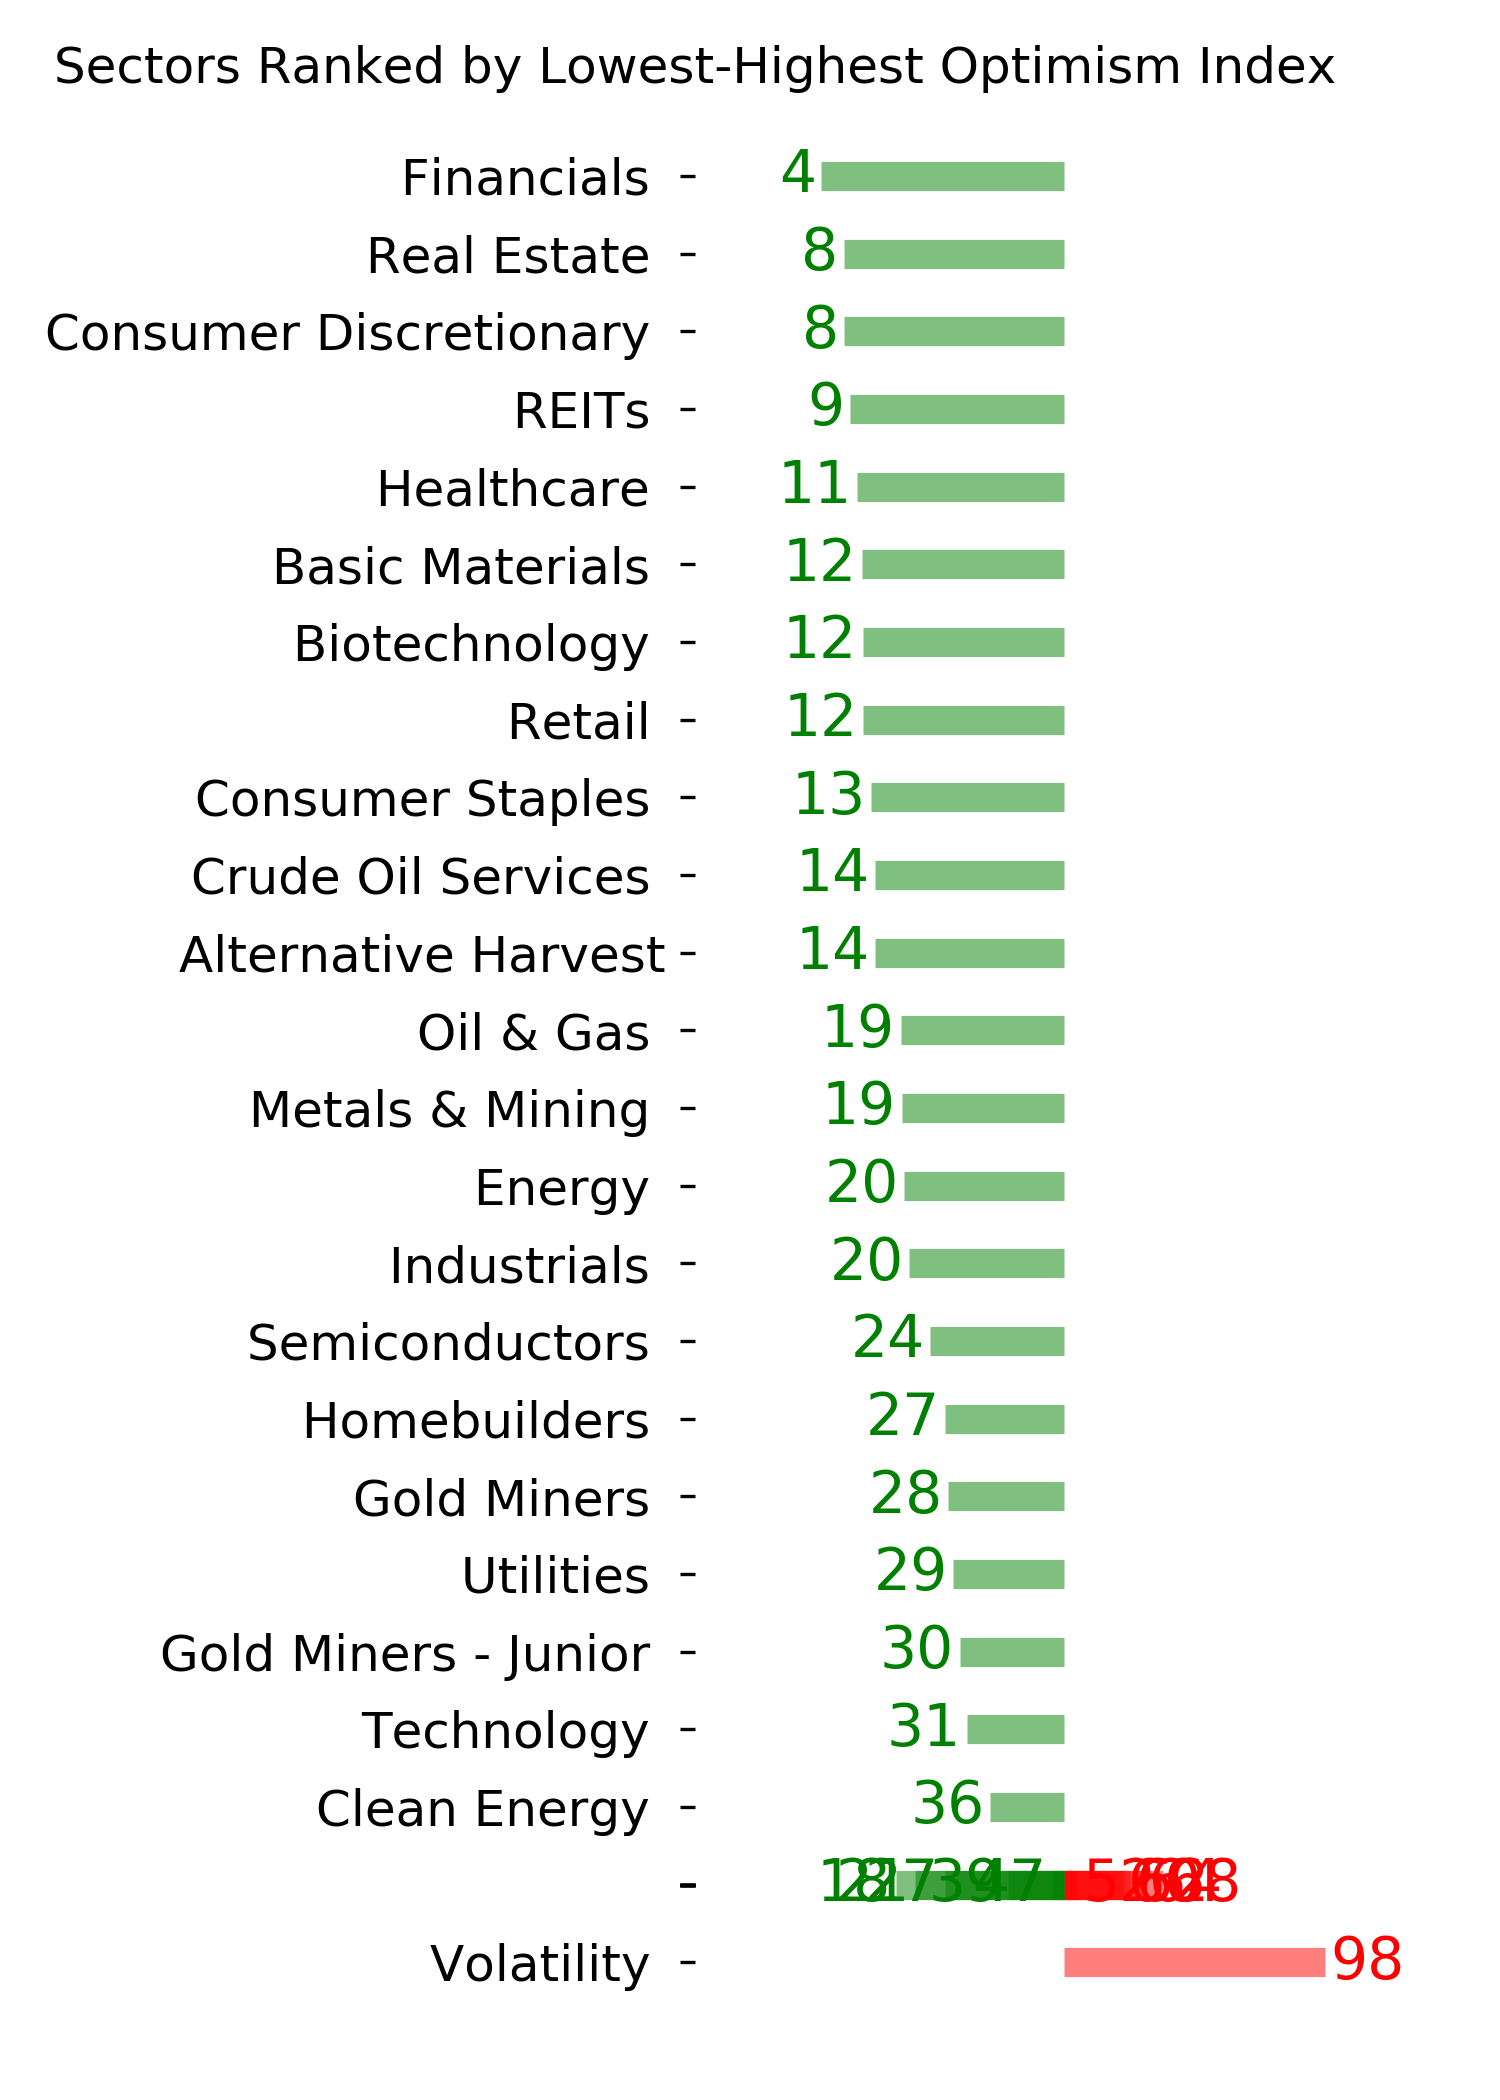
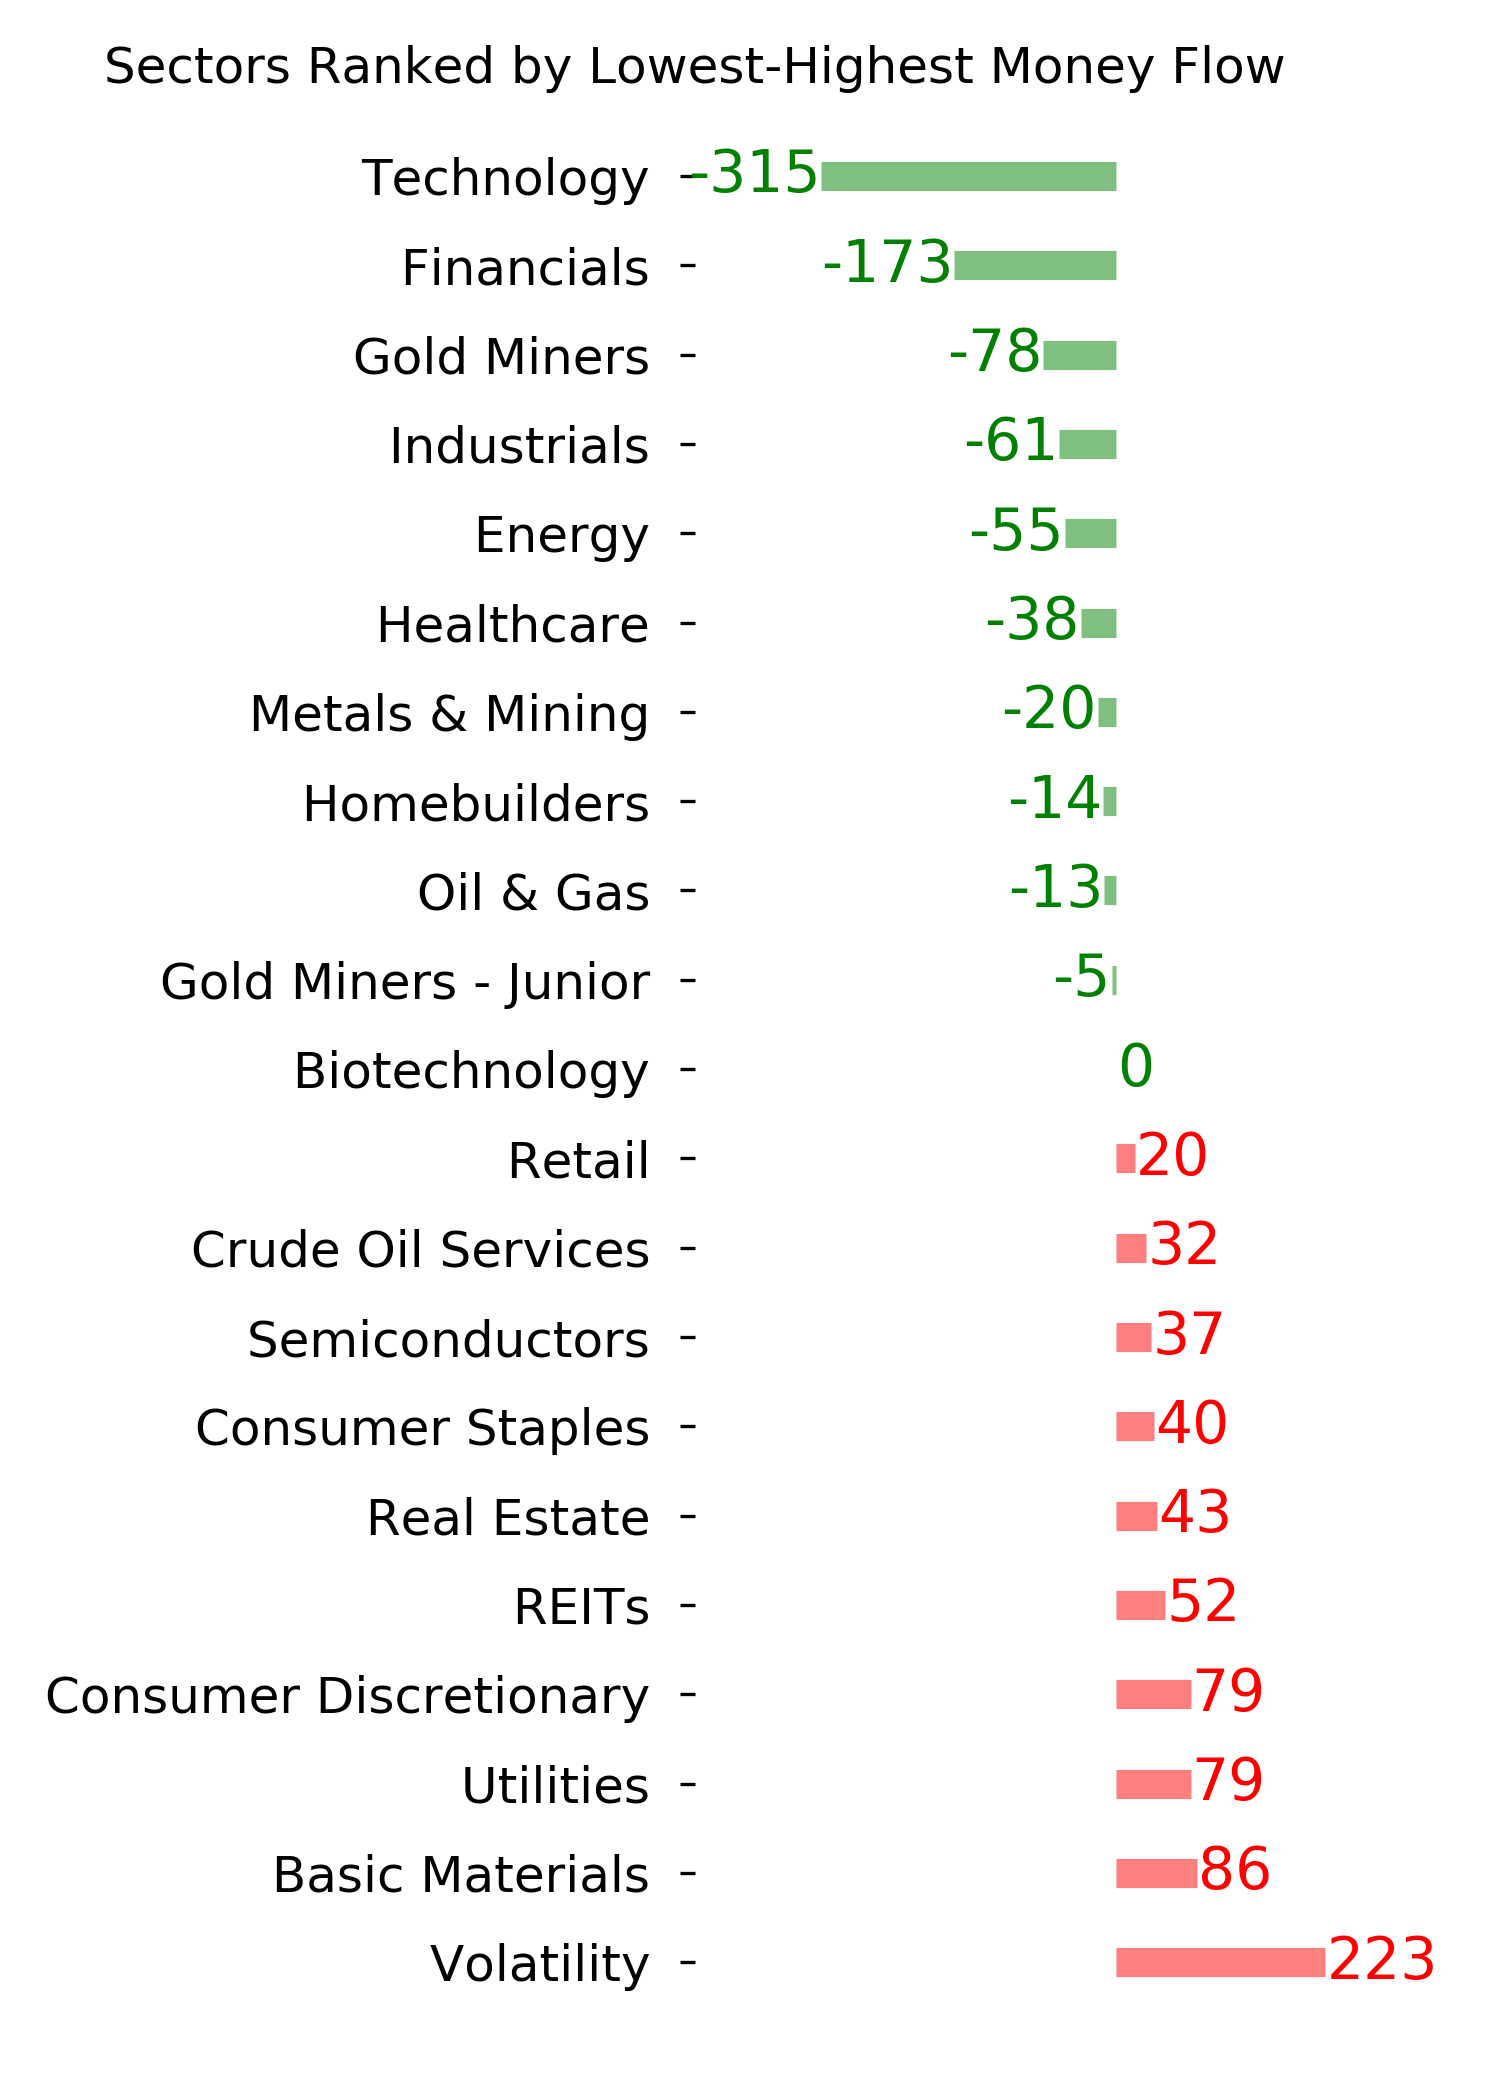
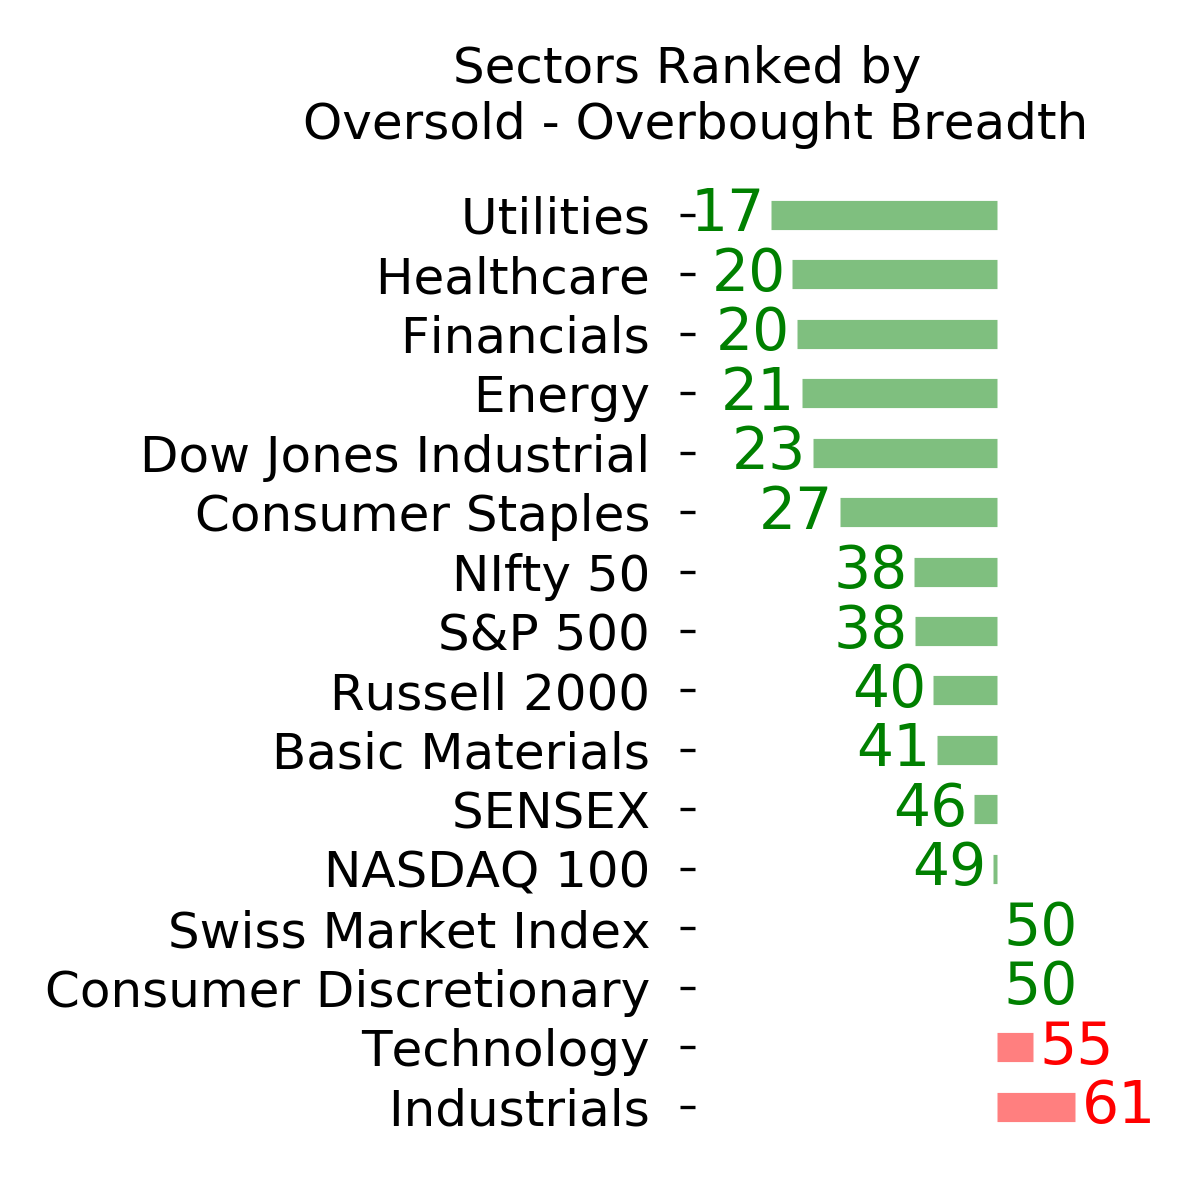
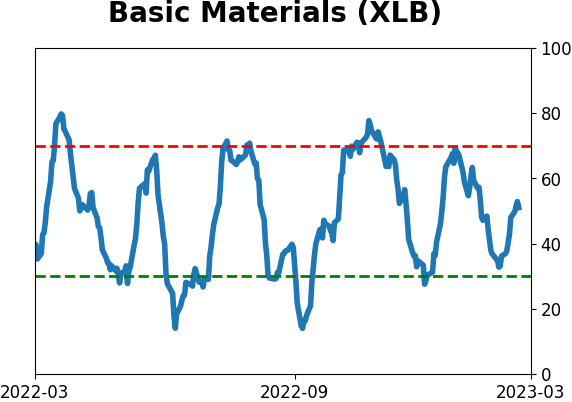
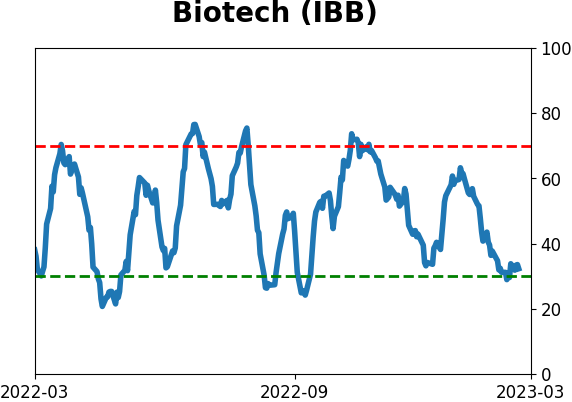
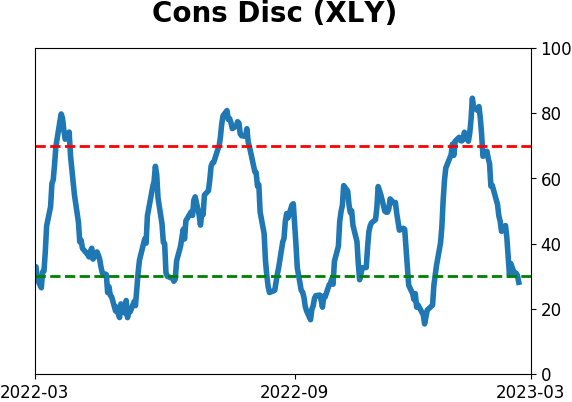
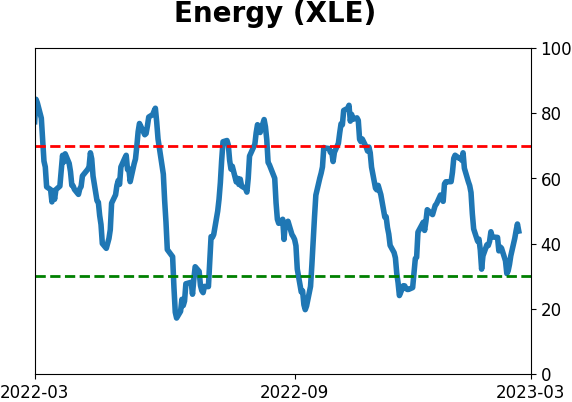
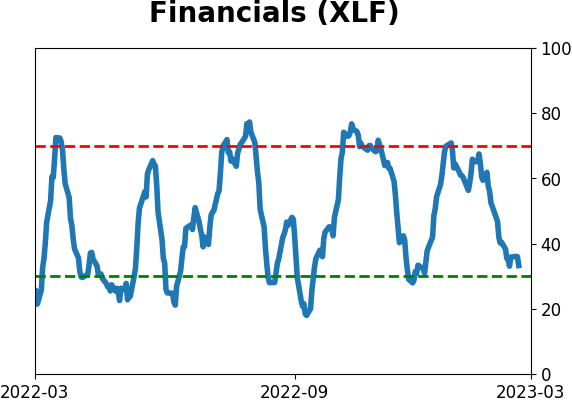
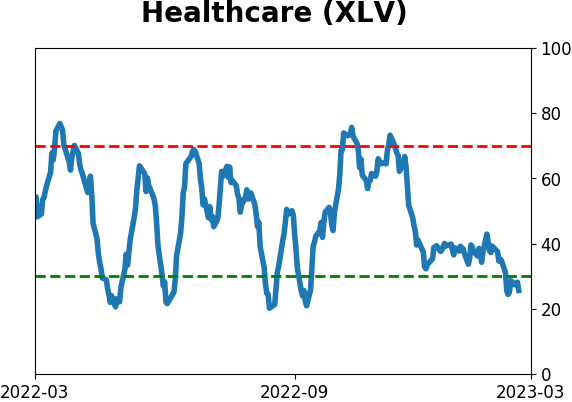
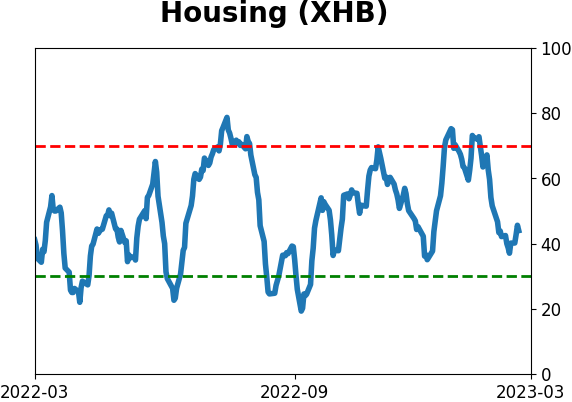
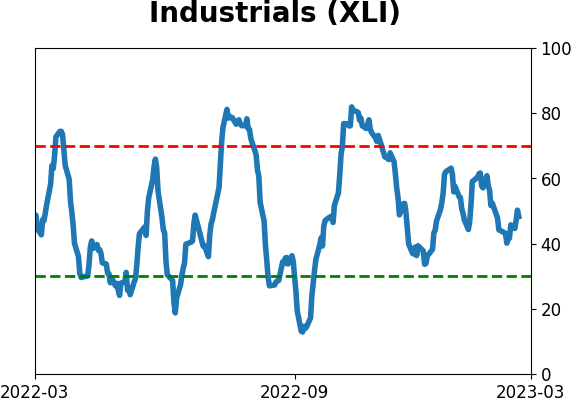
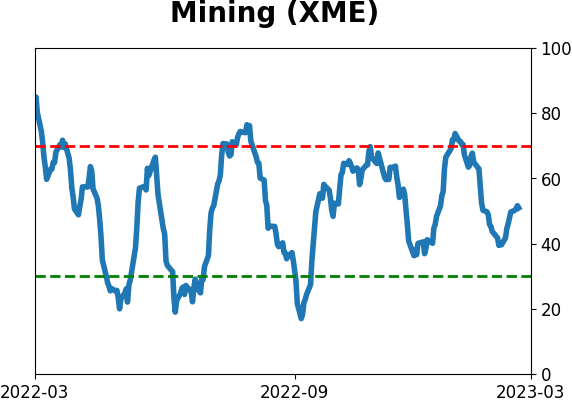
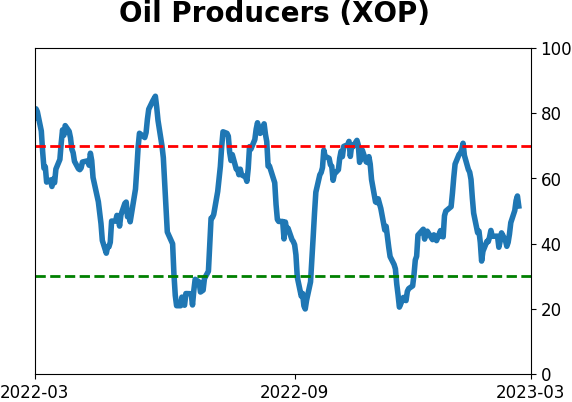
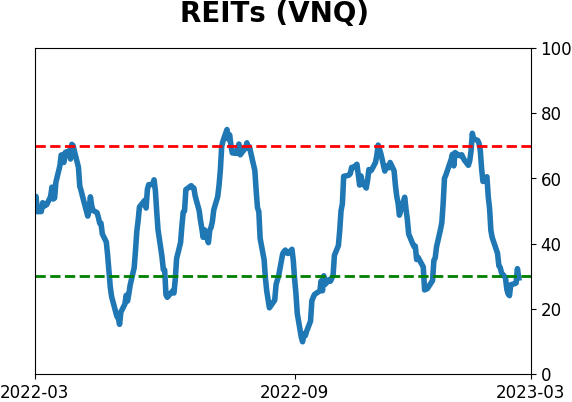
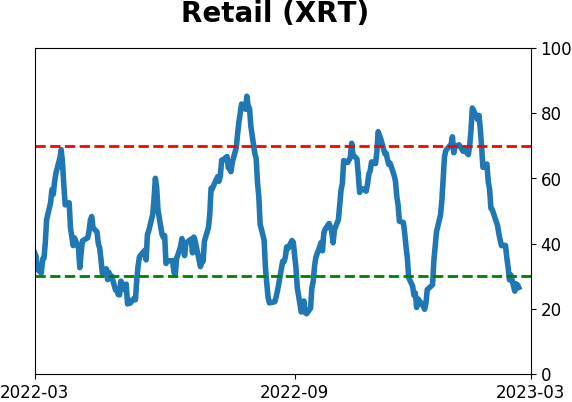
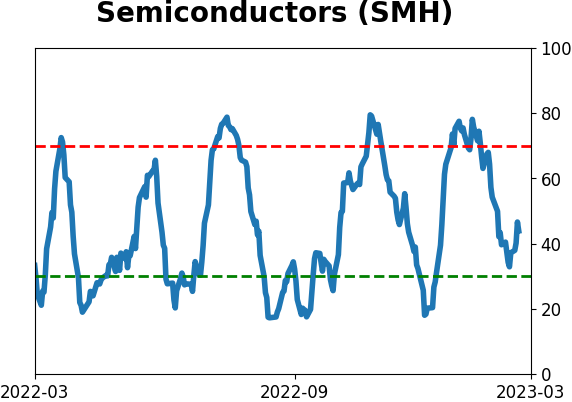
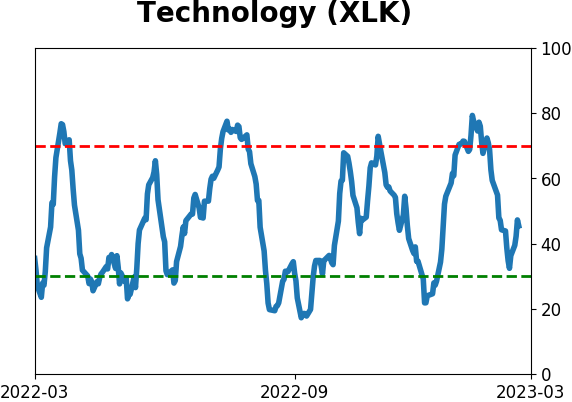
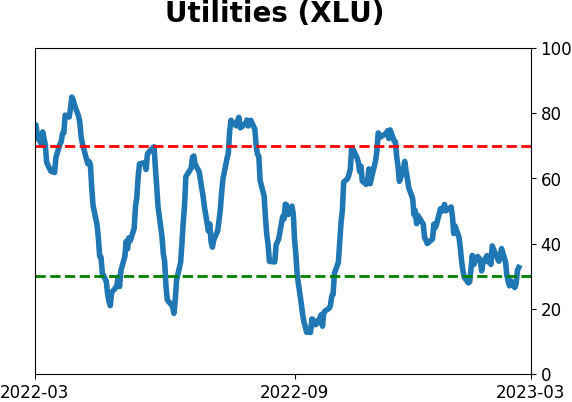
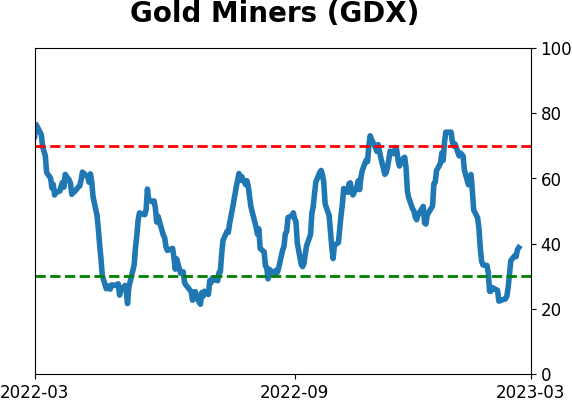
Sector ETF's - 10-Day Moving Average
|
|
|
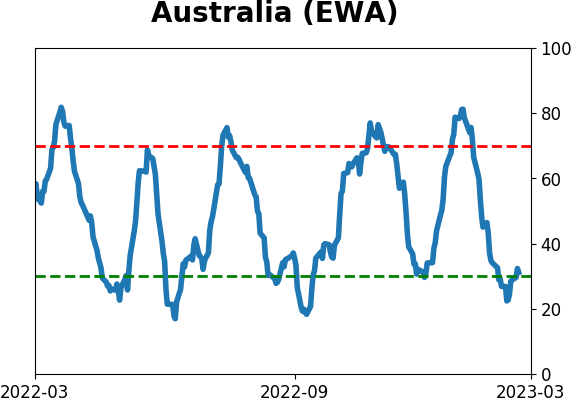
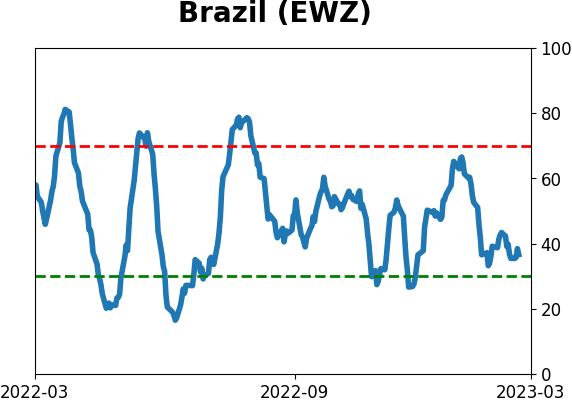
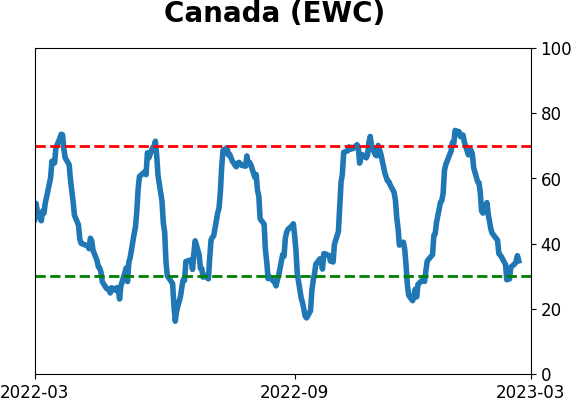
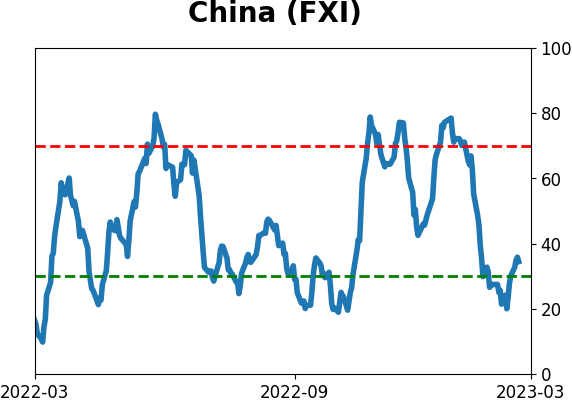
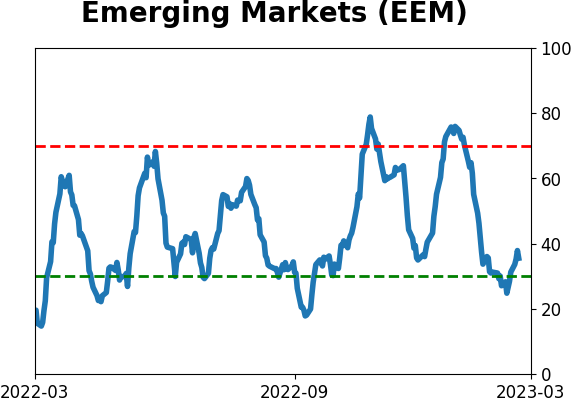
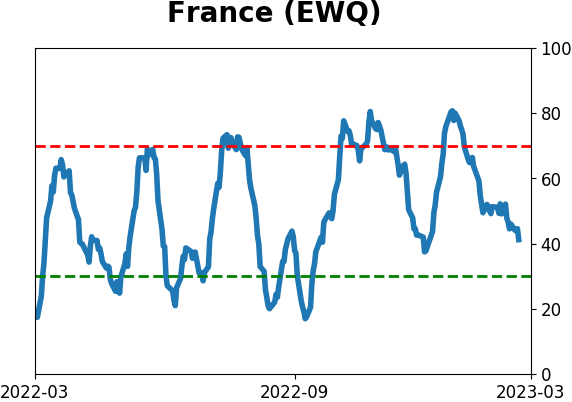
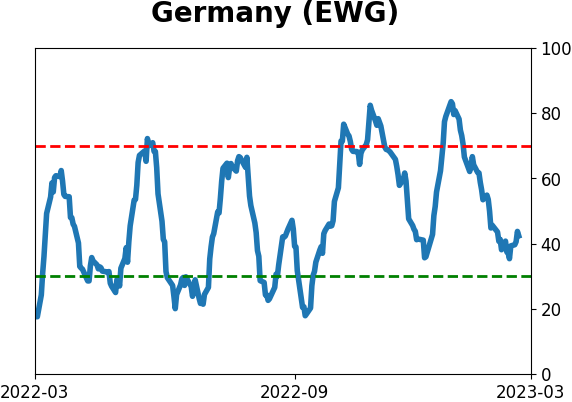
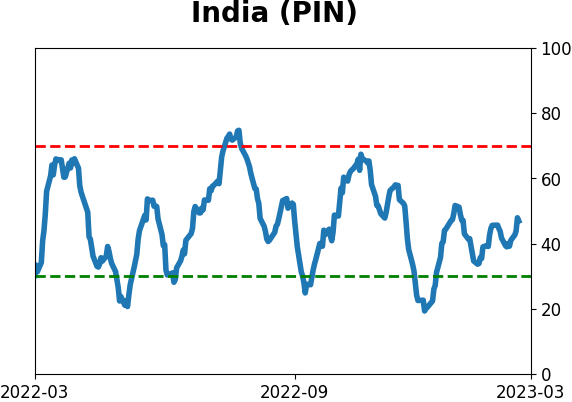
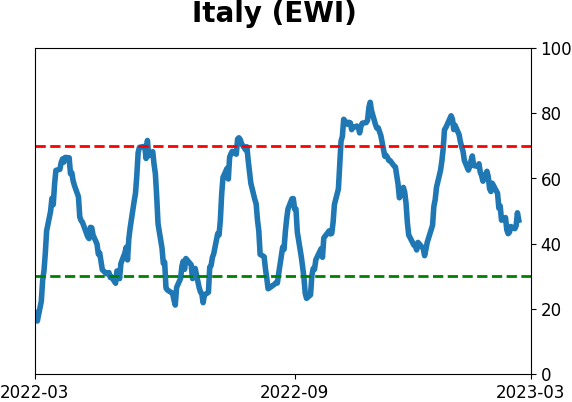
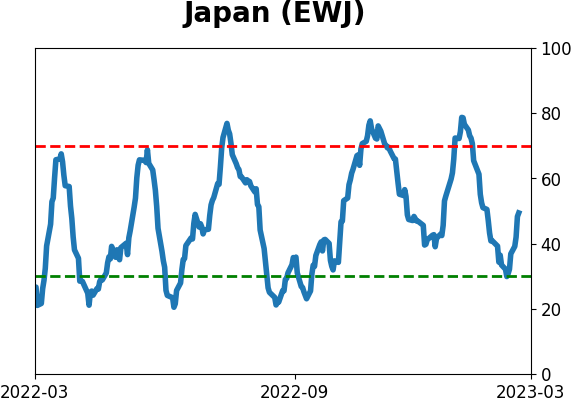
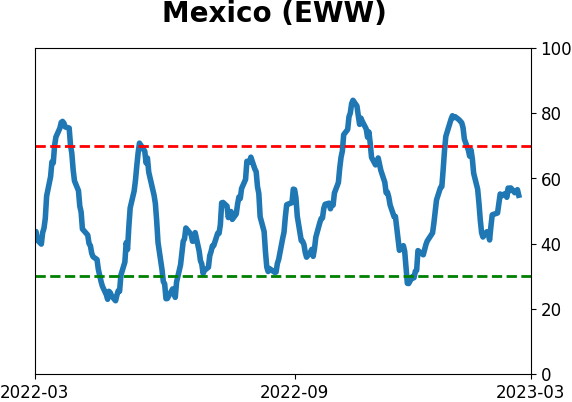
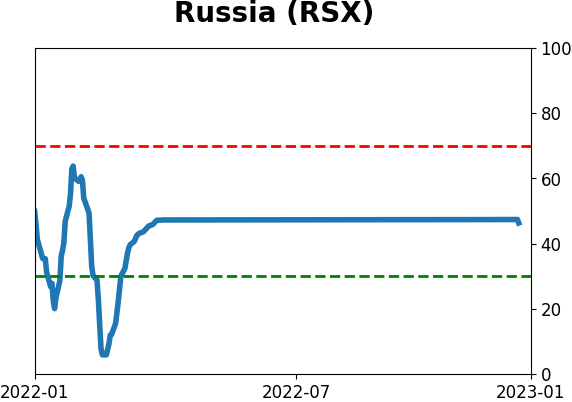
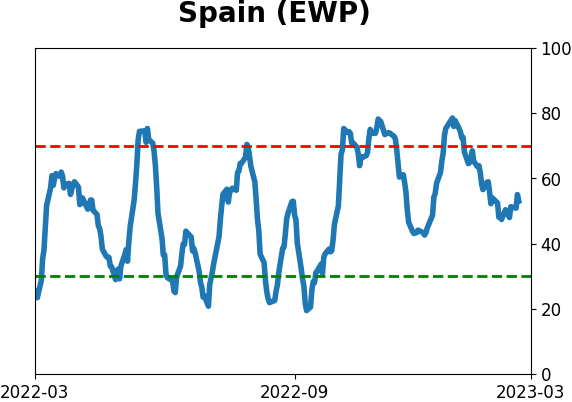
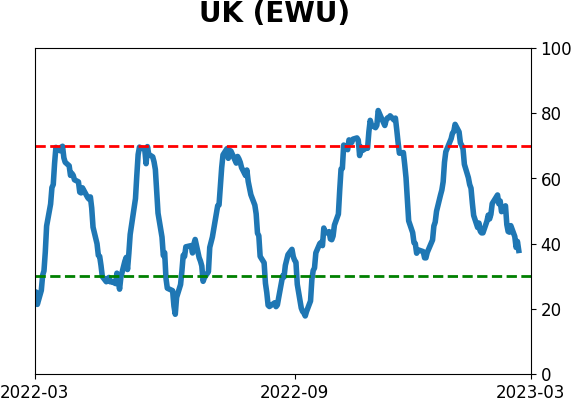
Country ETF's - 10-Day Moving Average
|
|
|
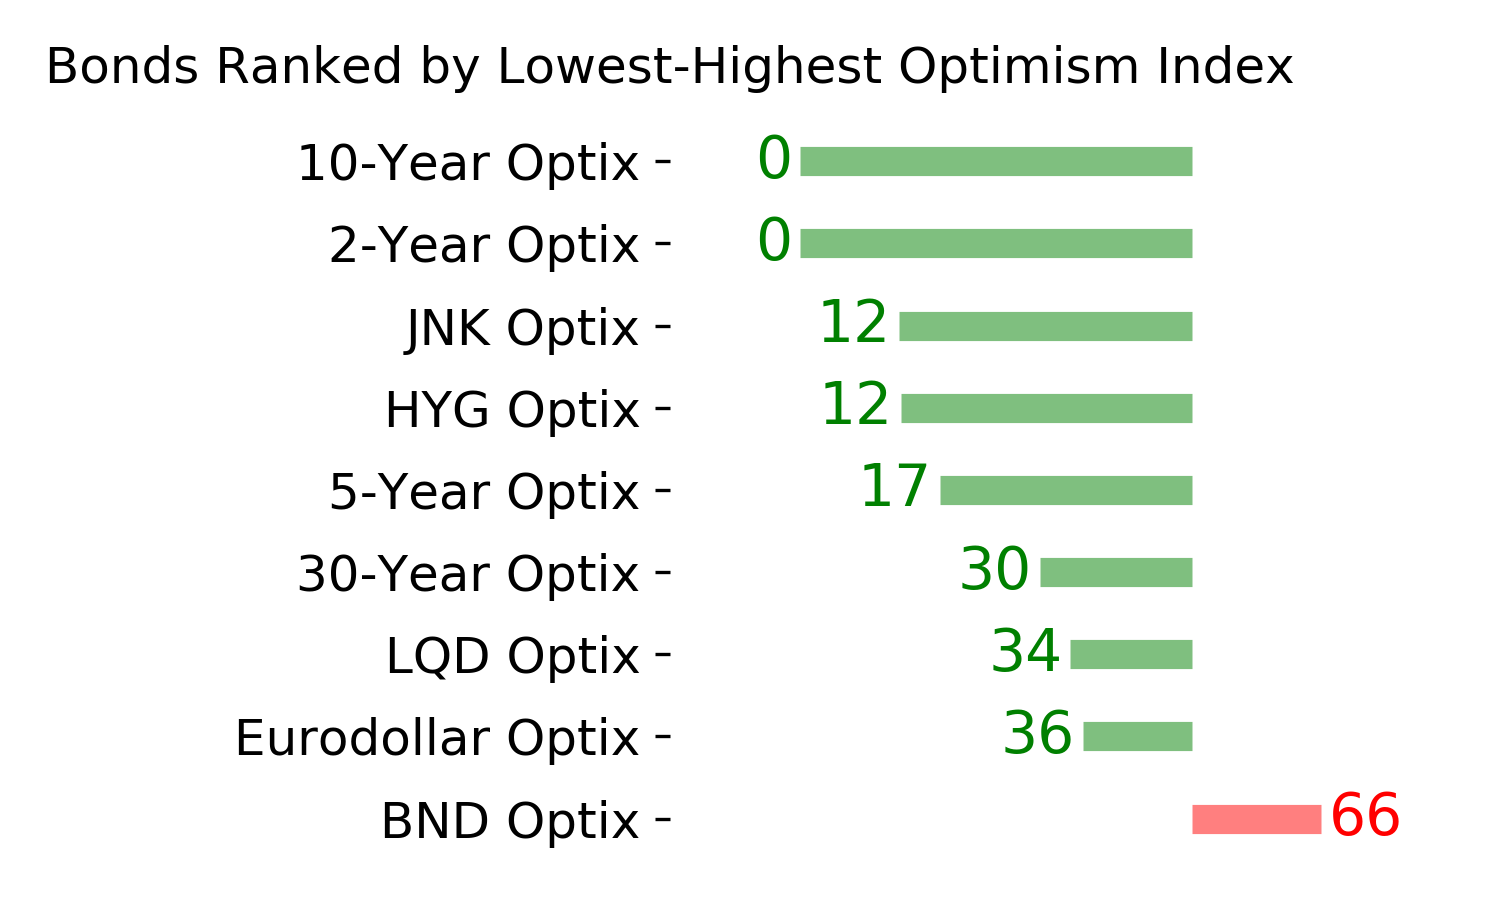
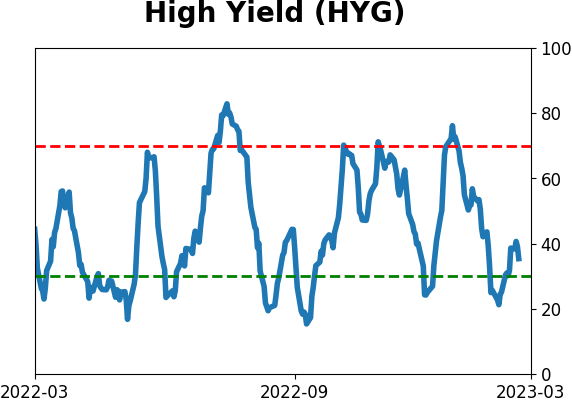
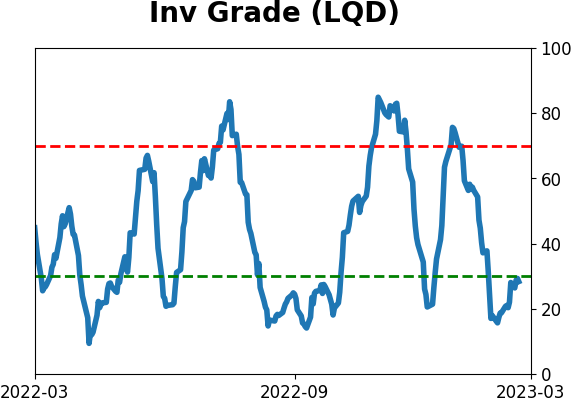
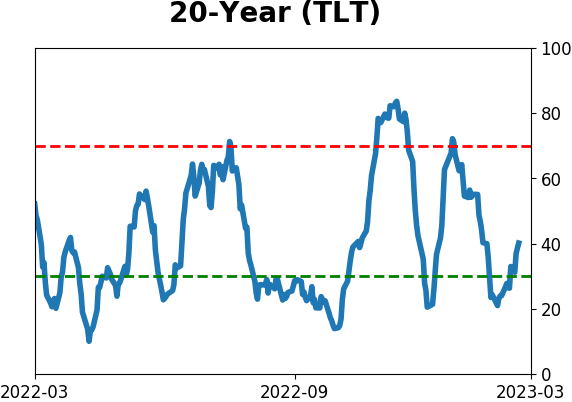
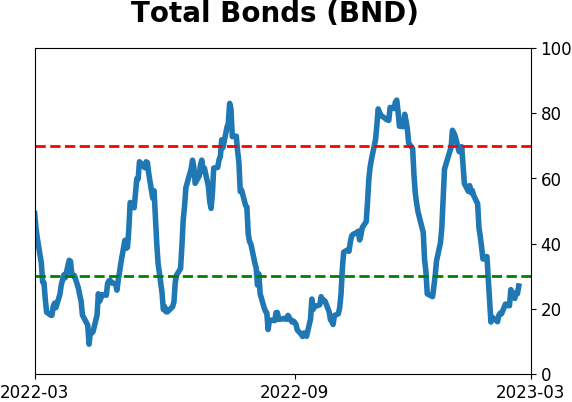
Bond ETF's - 10-Day Moving Average
|
|
|
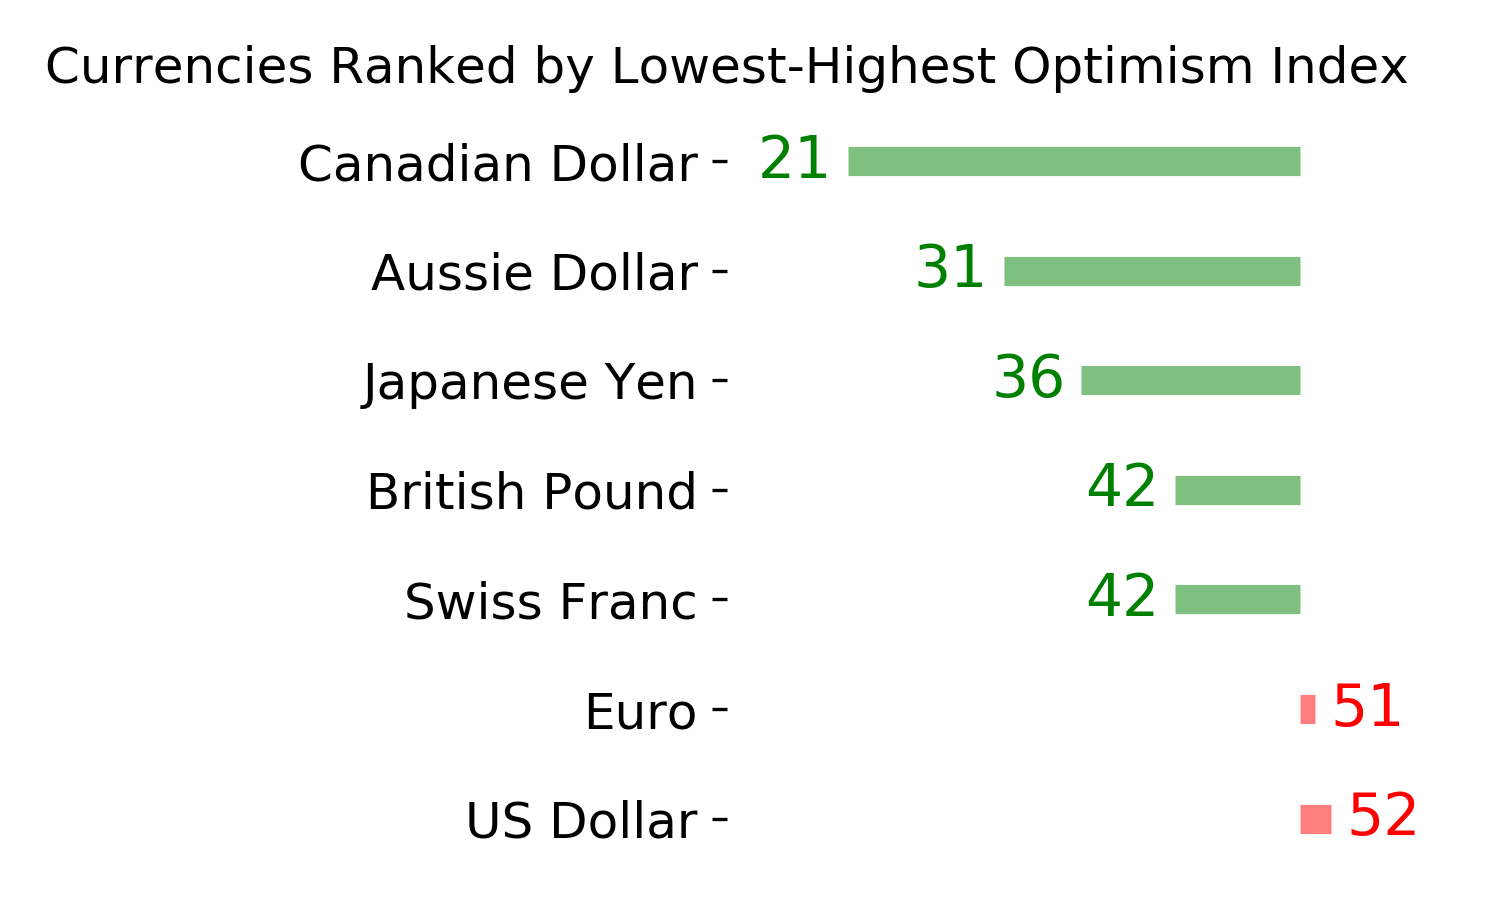
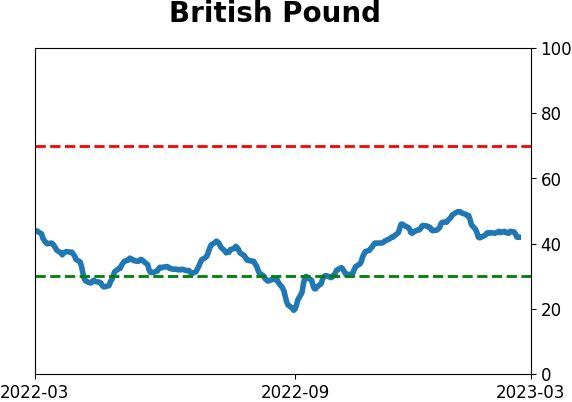
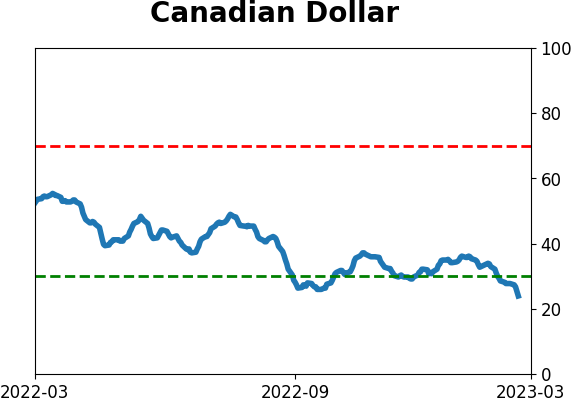
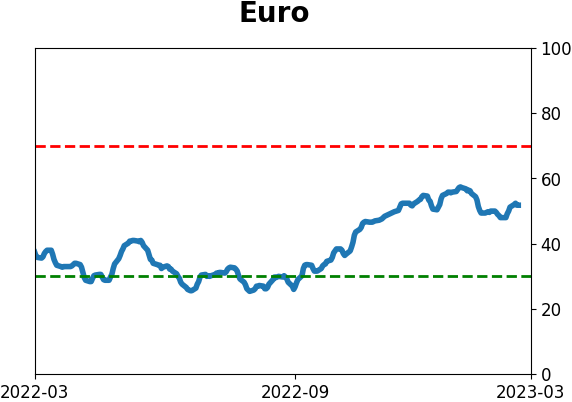
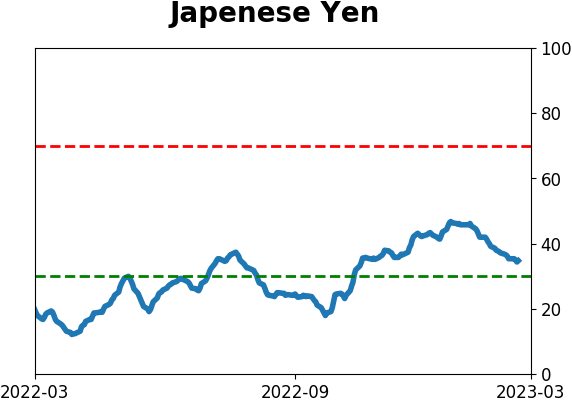
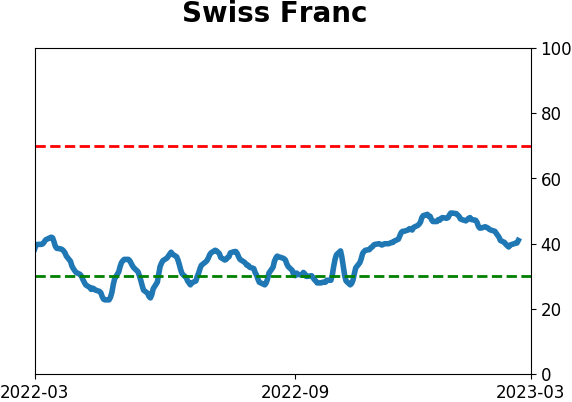
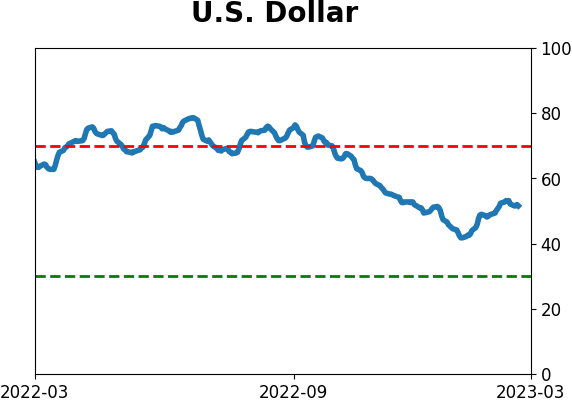
Currency ETF's - 5-Day Moving Average
|
|
|
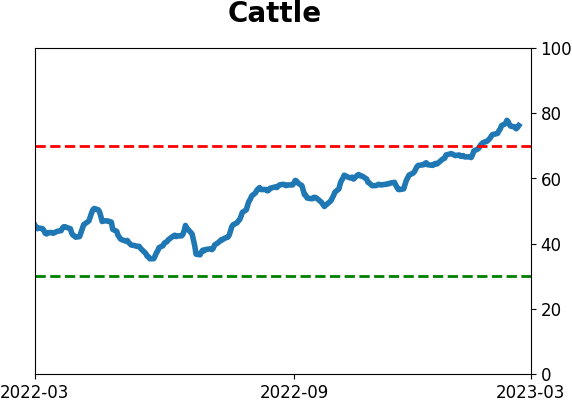
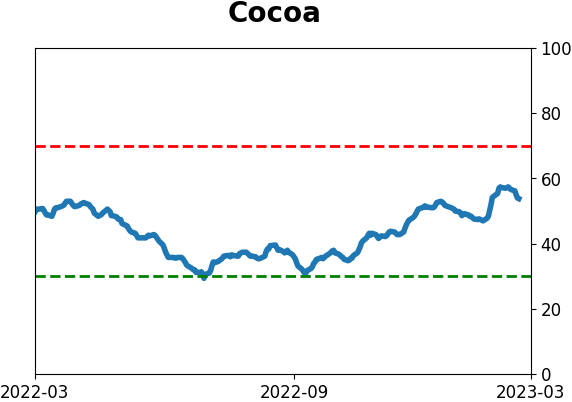
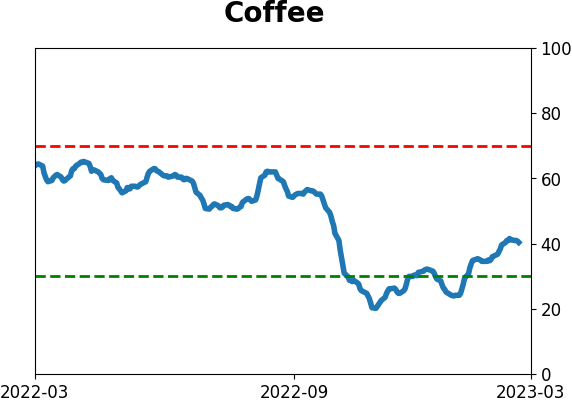
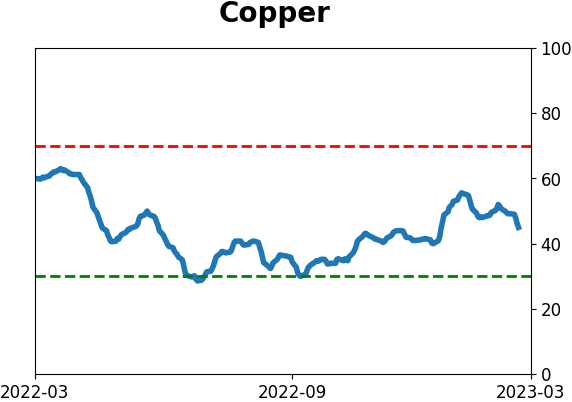
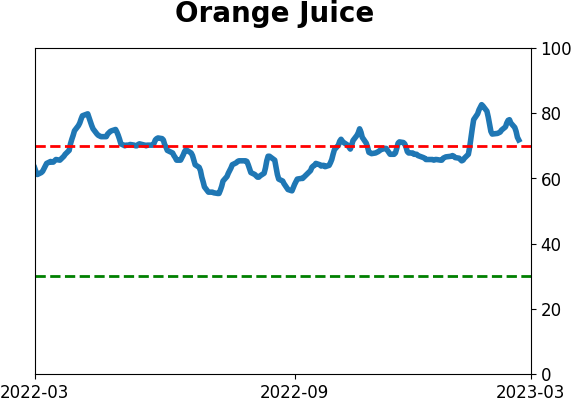
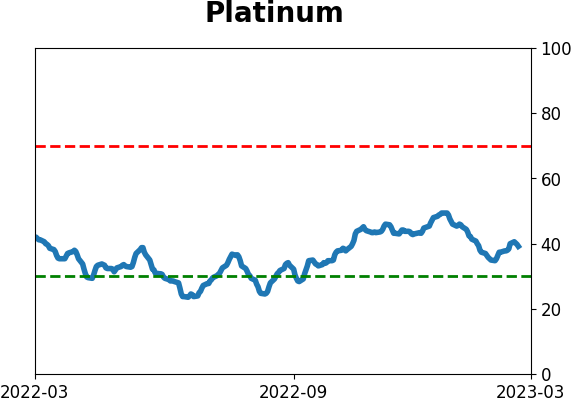
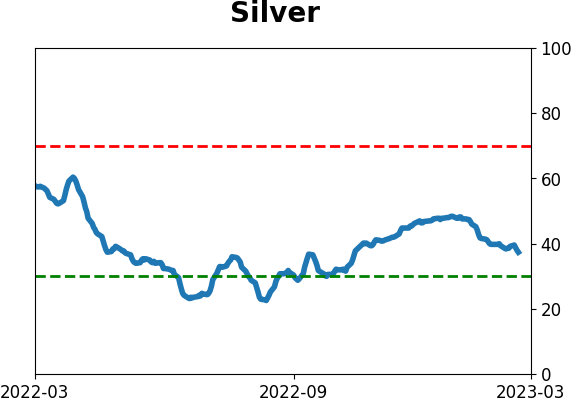
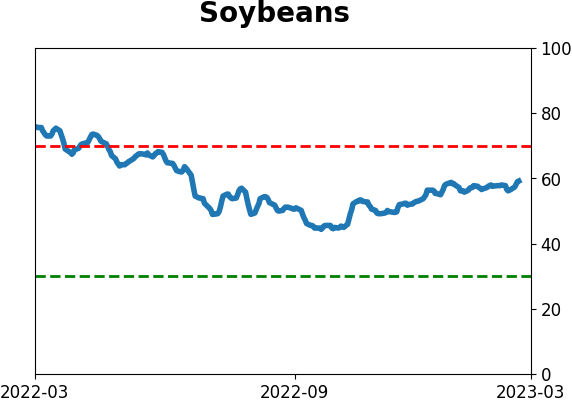
Commodity ETF's - 5-Day Moving Average
|
|