Headlines
|
|
Analyzing SPY day-by-day:
Does it matter to the stock market what day of the week it is? Or whether the stock market gaps open lower or higher? Do you make more money when the market is open - or closed? We crunched the numbers and report them here.
|
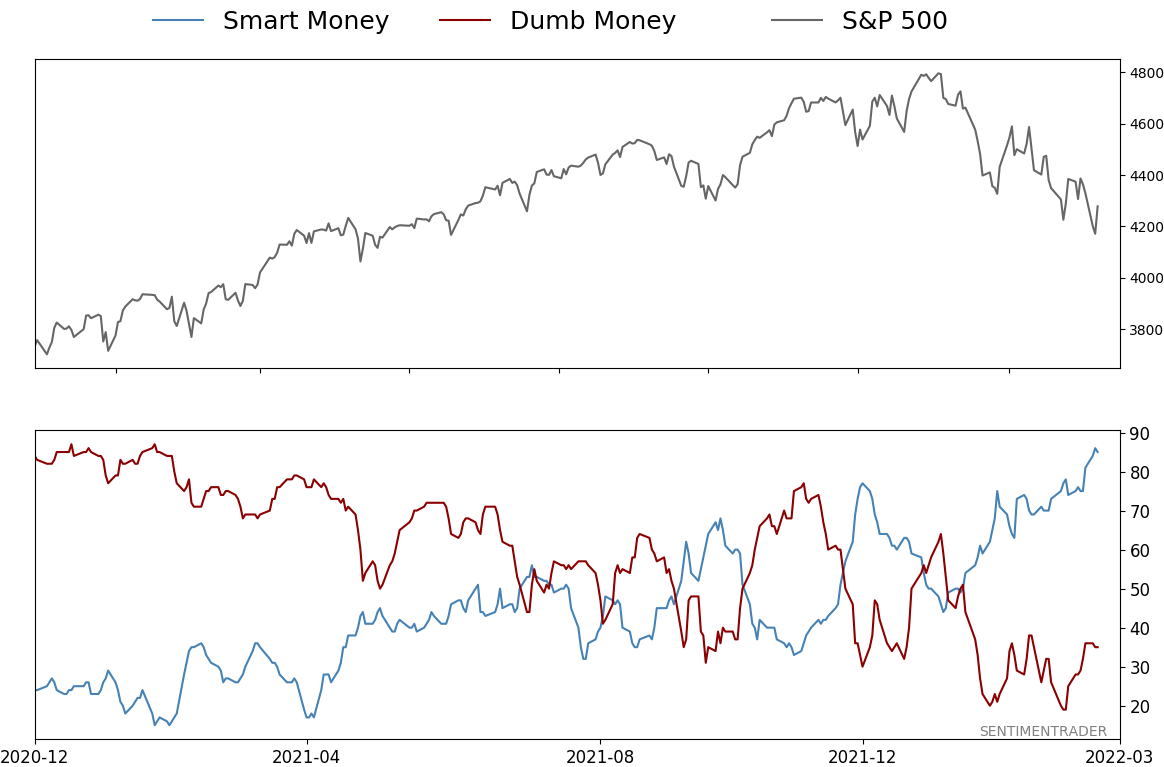
Smart / Dumb Money Confidence
|
Smart Money Confidence: 85%
Dumb Money Confidence: 35%
|
|
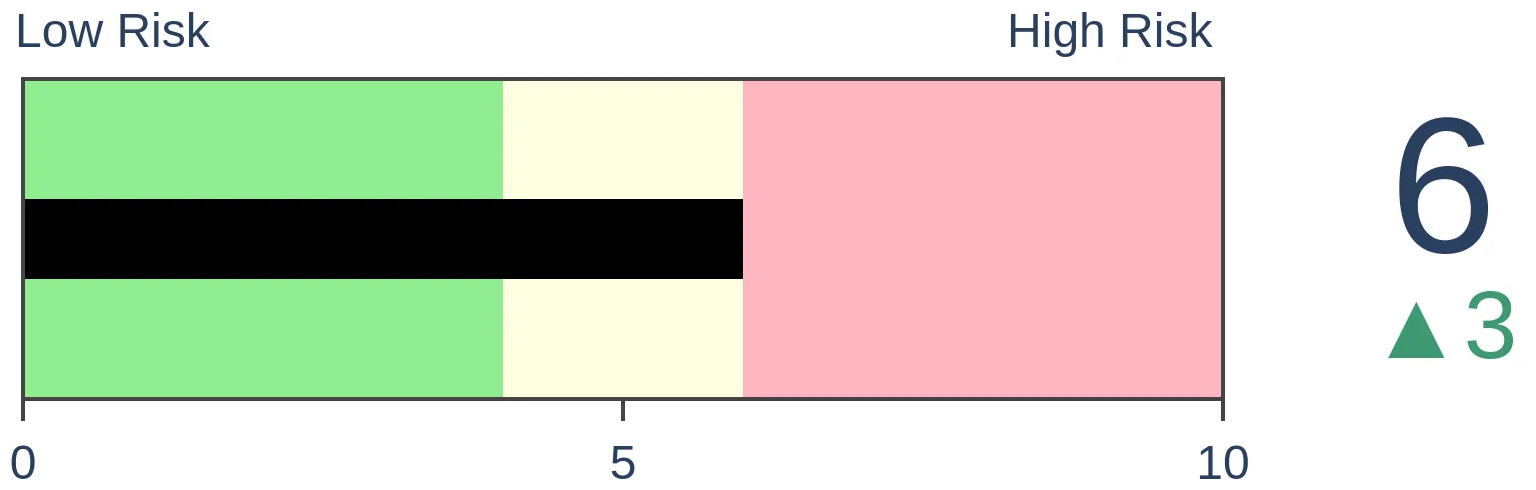
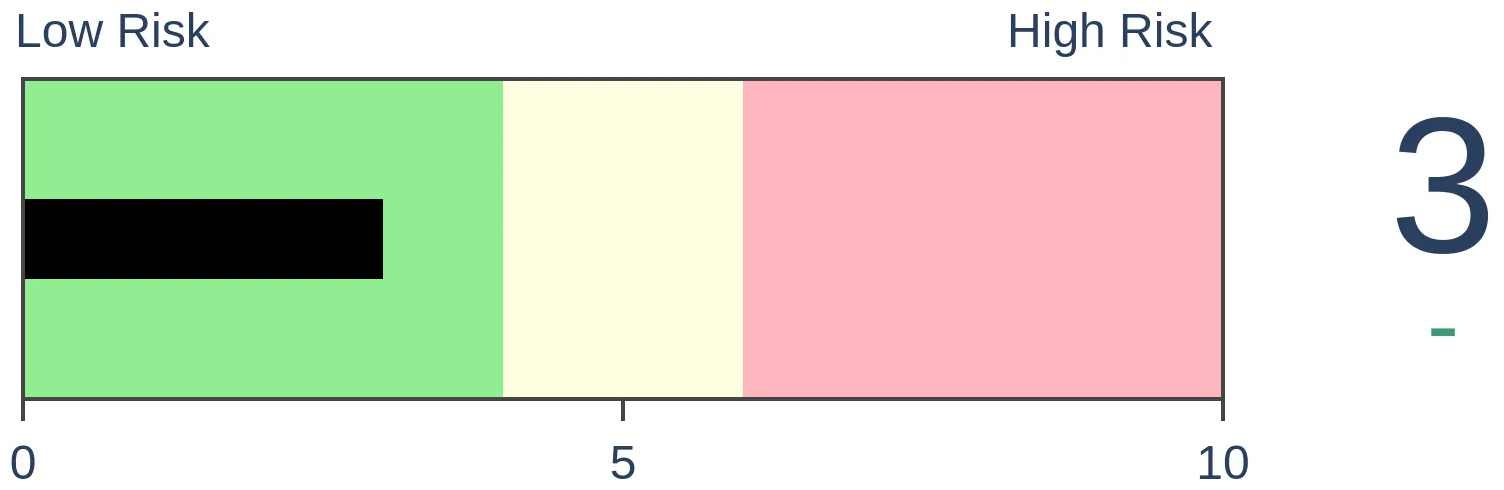
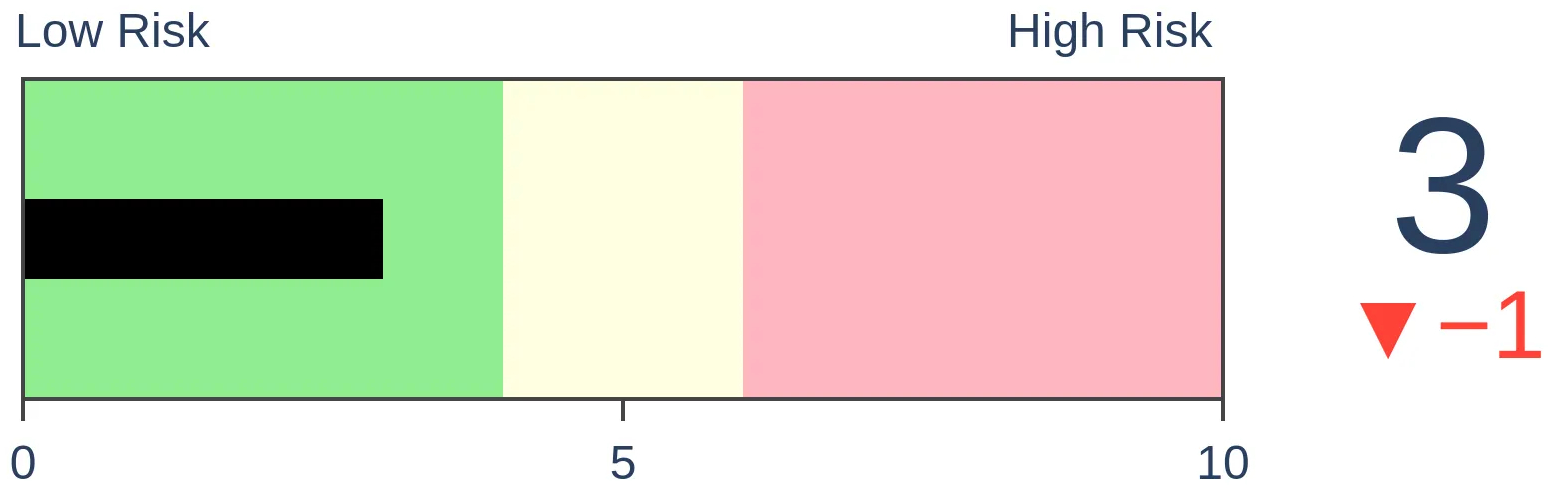
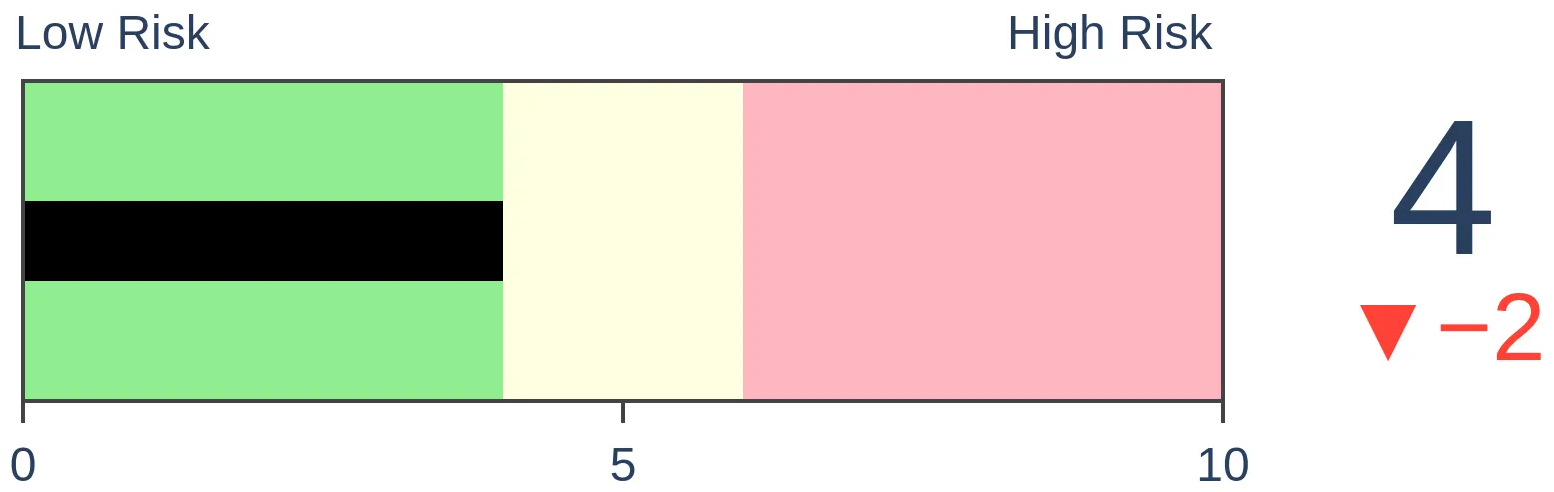
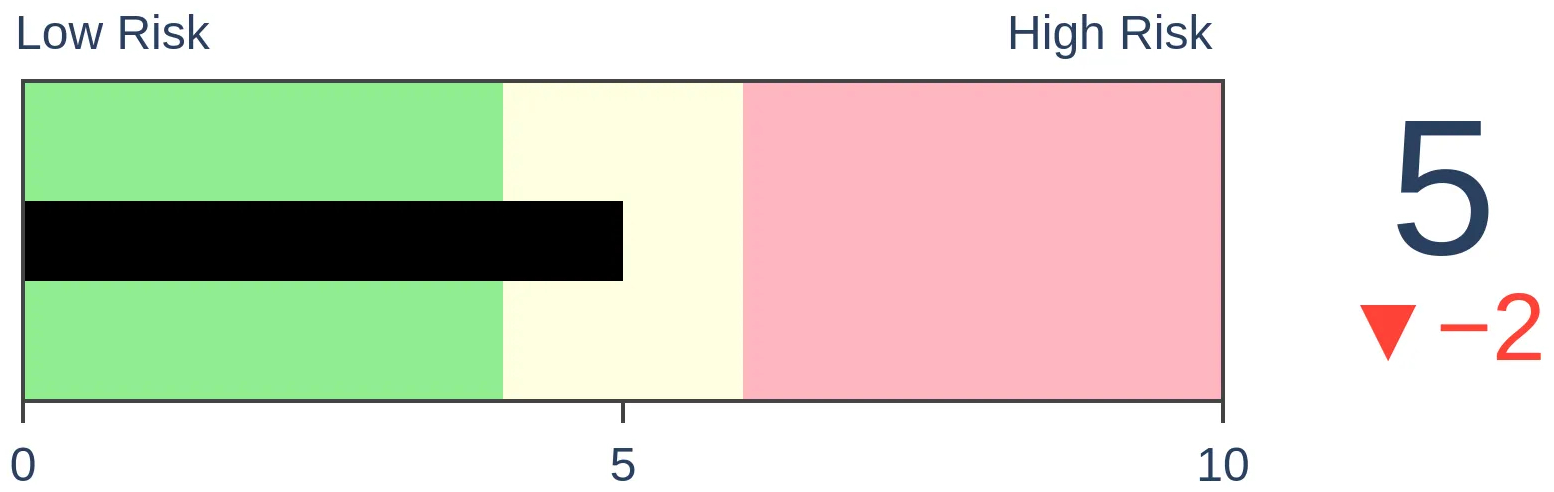
Risk Levels
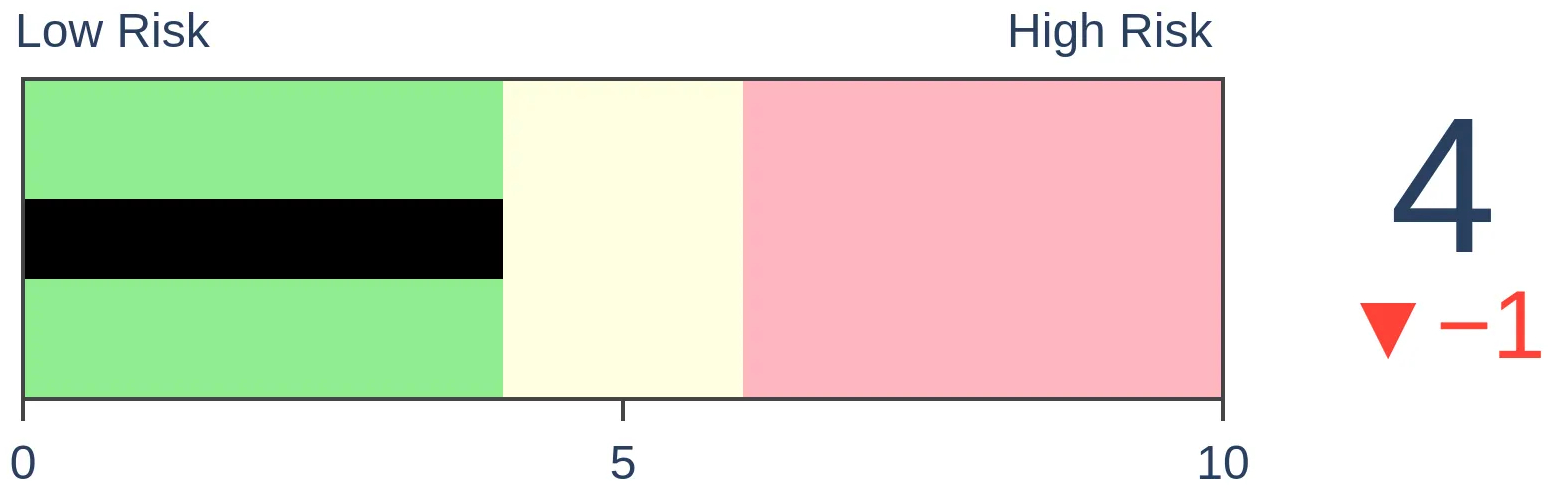
Stocks Short-Term
|
Stocks Medium-Term
|
|
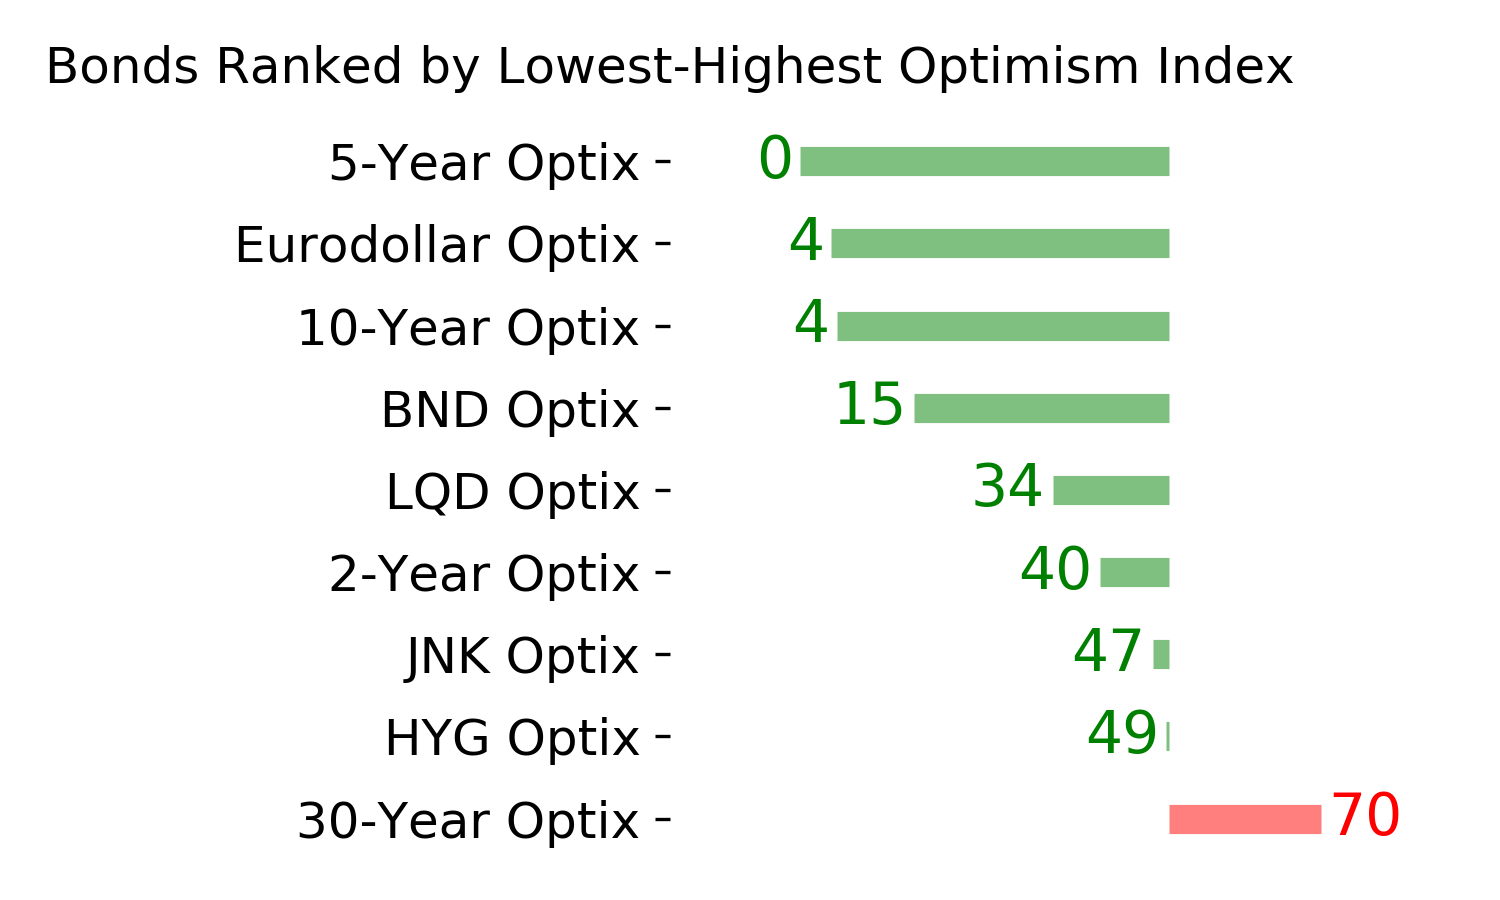
Bonds
|
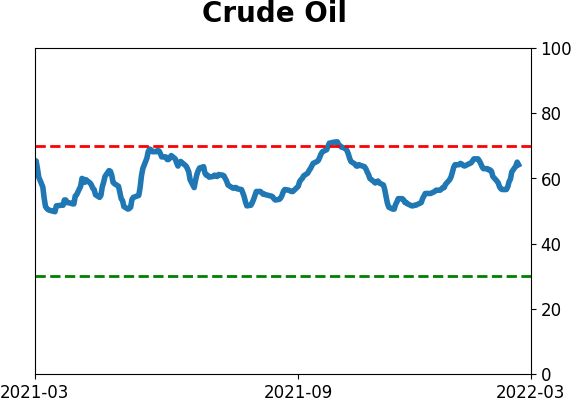
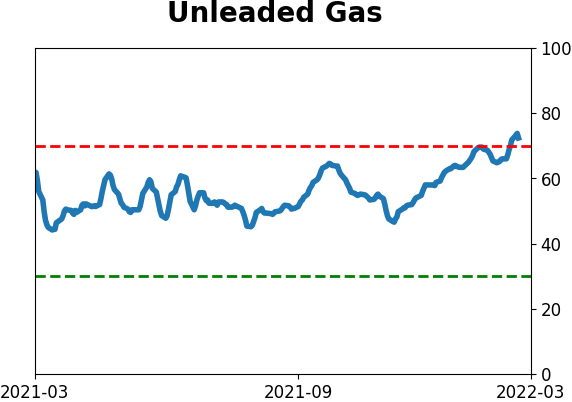
Crude Oil
|
|
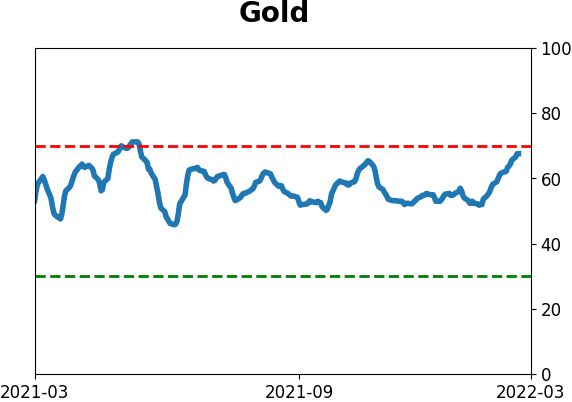
Gold
|
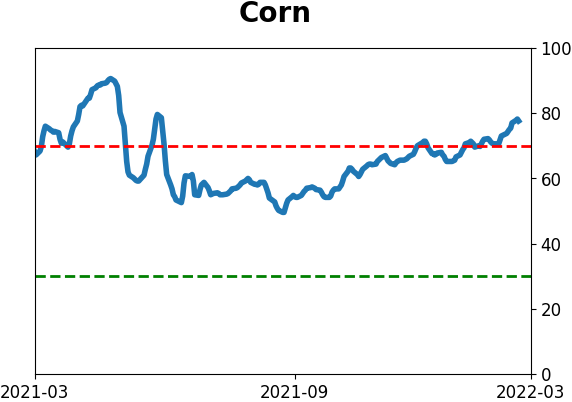
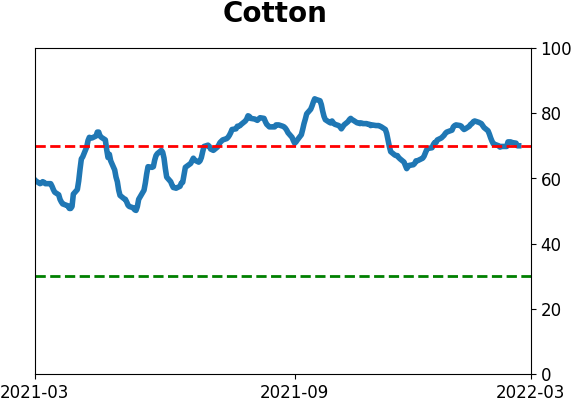
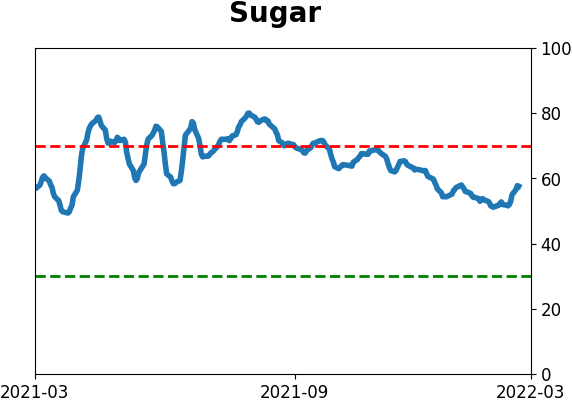
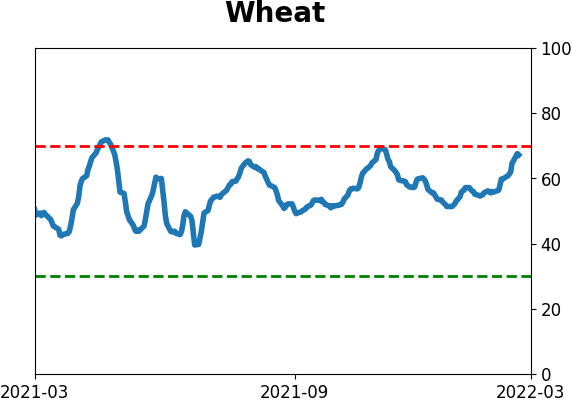
Agriculture
|
|
Research
By Jay Kaeppel
BOTTOM LINE
Does it matter to the stock market what day of the week it is? Or whether the stock market gaps open lower or higher? Do you make more money when the market is open - or closed? We crunched the numbers and report them here.
FORECAST / TIMEFRAME
None
|
Key Points
- Does the day of the week matter in the stock market?
- Is performance different intraday than it is overnight?
- Do opening gaps matter?
- In this piece, we take a closer look at the answers to these questions
Testing SPY
For our testing, we will use daily open/high/low/close data for SPY (SPDR S&P 500 ETF Trust) from 1/29/1993 through 3/7/2022. Note that no allowances are made for slippage or commissions. We are strictly analyzing price changes.
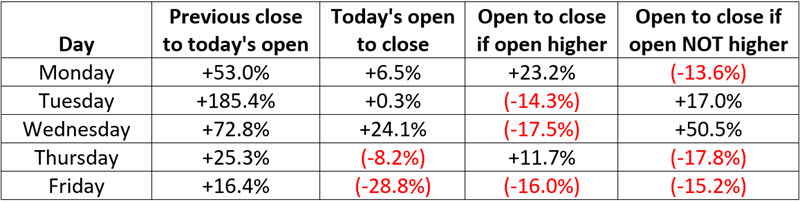
For each day of the week, we will examine:
- Performance from the previous close to today's open (i.e., overnight price change)
- Performance from today's open to today's close (i.e., intraday price change)
- Performance from today's open to today's close IF today's open is higher than the previous close
- Performance from today's open to today's close IF today's open is lower than or equal to the previous close
The data will be presented as is, with no intended inferences about what may be helpful and what may not.
Previous close to today's open versus today's open to close
The first chart below shows the growth of $1 in SPY held only overnight (black line) versus the growth of $1 in SPY held intraday, i.e., open to close (blue line) for ALL trading days. The 2nd chart shows the same data on a logarithmic scale.
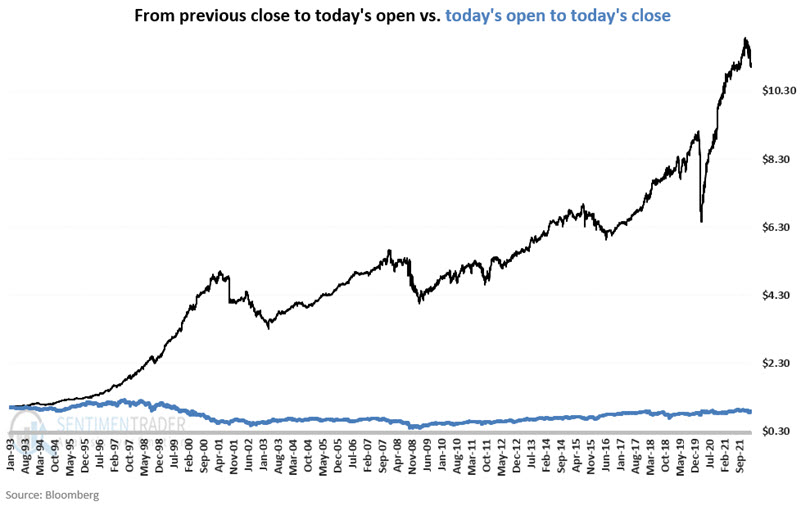
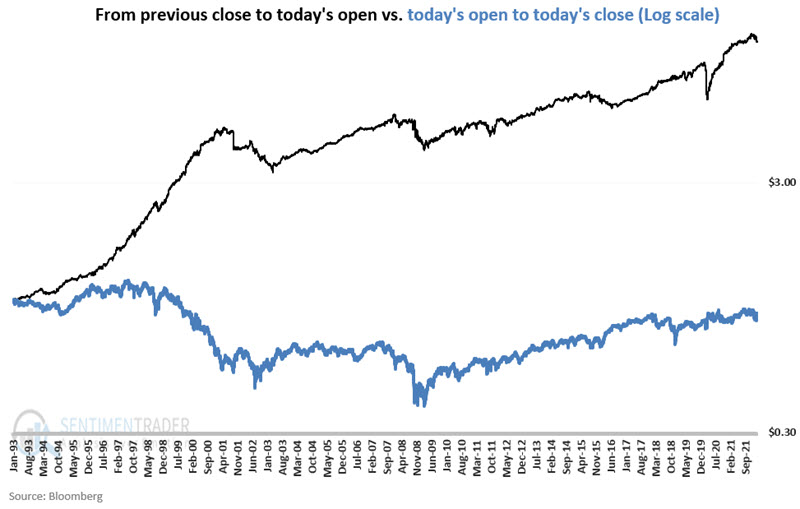
Results
- Overnight % +(-) = +1,000.9%
- Intraday % +(-) = (-13.3%)
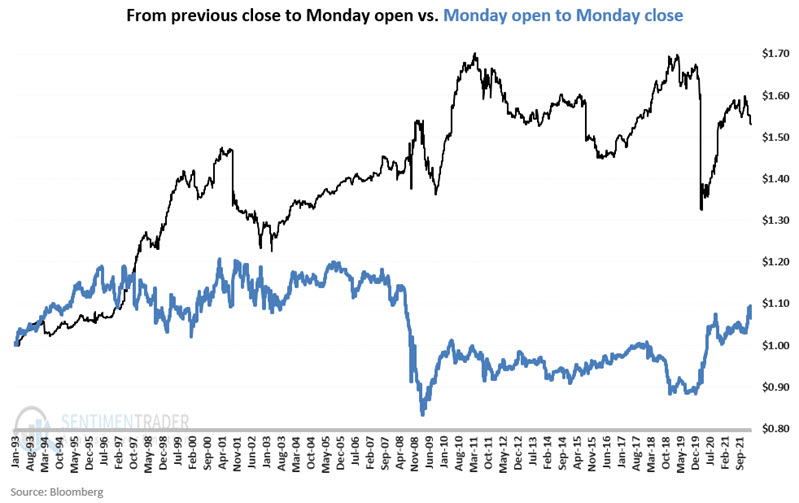
Monday
The first chart below shows the growth of $1 in SPY held only overnight (black line) into Mondays open versus the growth of $1 in SPY held intraday, i.e., open to close only on Monday (blue line).
The next chart shows the growth of $1 in SPY held intraday if SPY opened higher versus the growth of $1 in SPY held intraday if SPY opened lower or unchanged.
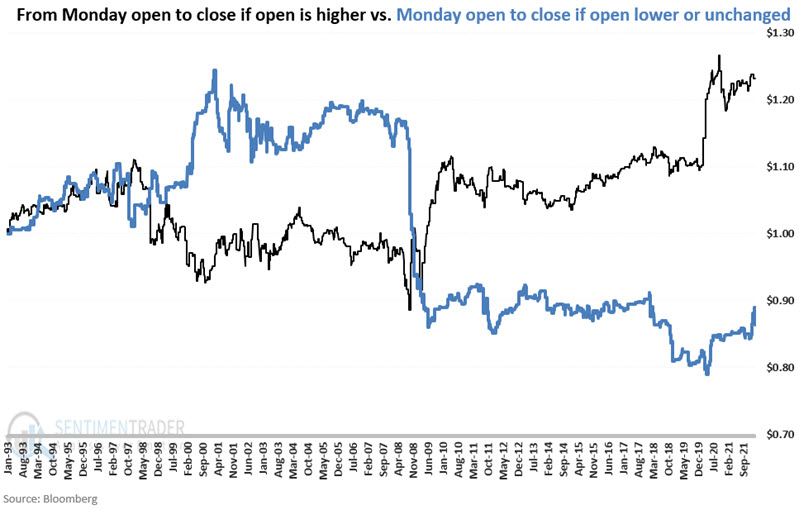
Results
- Overnight % +(-) = +53.0%
- Net Intraday % +(-) = +6.5%
- Intraday % +(-) if higher open = +23.2%
- Intraday % +(-) if lower open = (-13.6%)
Tuesday
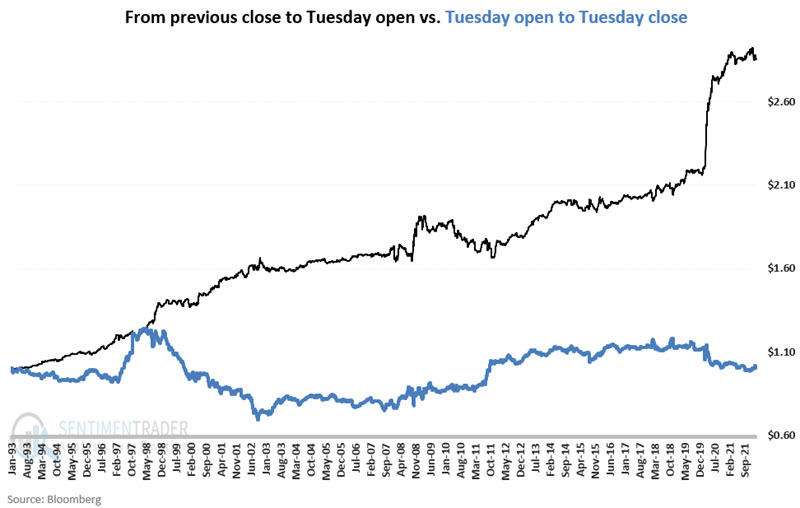
The first chart below shows the growth of $1 in SPY held only overnight (black line) into Tuesday's open versus the growth of $1 in SPY held intraday, i.e., open to close only on Tuesday (blue line).
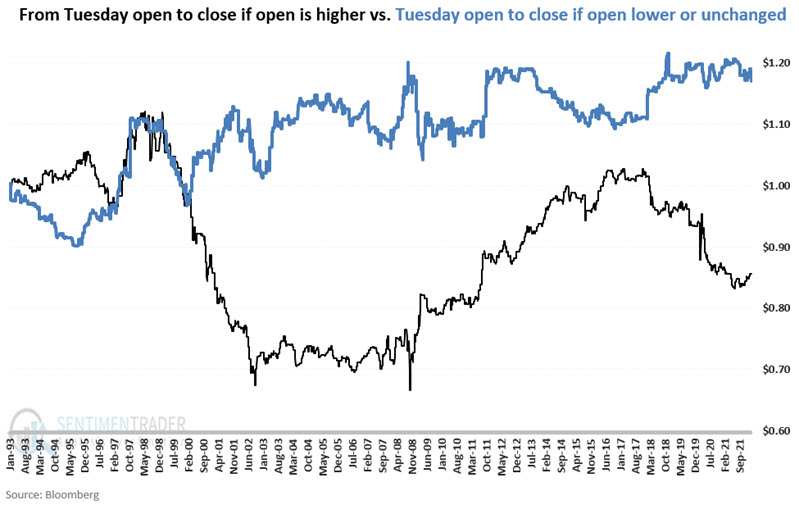
The next chart shows the growth of $1 in SPY held intraday if SPY opened higher versus the growth of $1 in SPY held intraday if SPY opened lower or unchanged.
Results
- Overnight % +(-) = +185.4%
- Net Intraday % +(-) = +0.3%
- Intraday % +(-) if higher open = (-14.3%)
- Intraday % +(-) if lower open = +17.0%
Wednesday
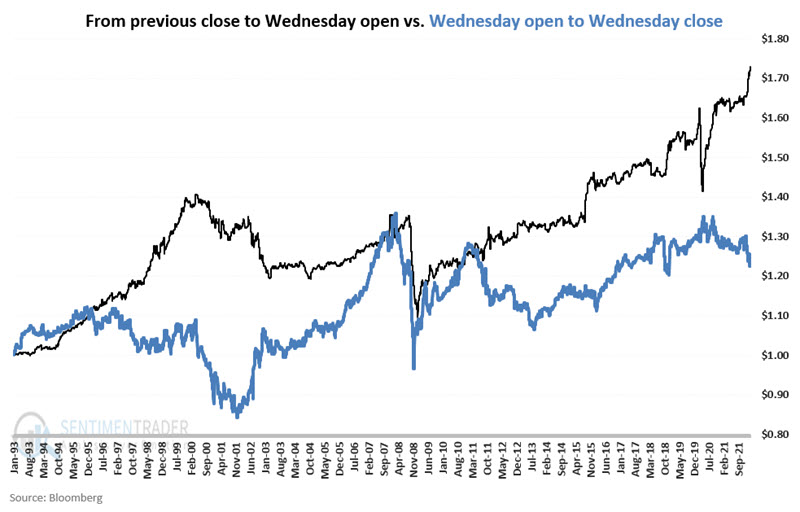
The first chart below shows the growth of $1 in SPY held only overnight (black line) into Wednesday's open versus the growth of $1 in SPY held intraday, i.e., open to close only on Wednesday (blue line).
The next chart shows the growth of $1 in SPY held intraday if SPY opened higher versus the growth of $1 in SPY held intraday if SPY opened lower or unchanged.
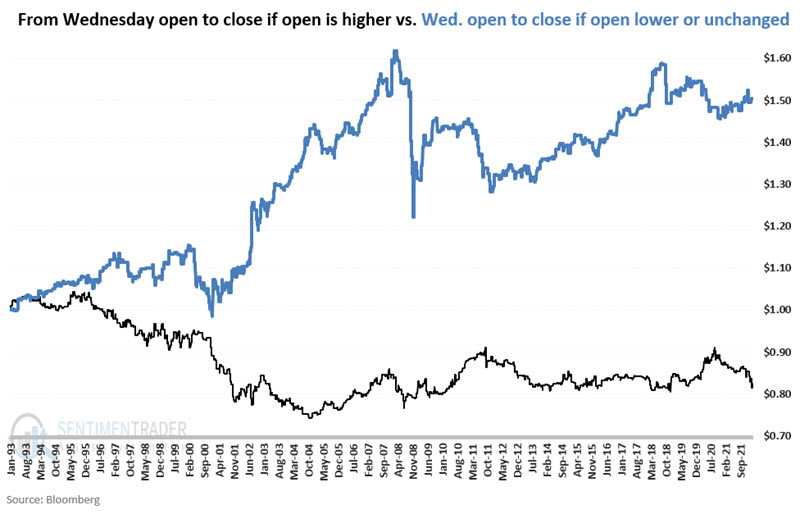
Results
- Overnight % +(-) = +72.8%
- Net Intraday % +(-) = +24.1%
- Intraday % +(-) if higher open = (-17.5%)
- Intraday % +(-) if lower open = +50.0%
Thursday
The first chart below shows the growth of $1 in SPY held only overnight (black line) into Thursday's open versus the growth of $1 in SPY held intraday, i.e., open to close only on Thursday (blue line).
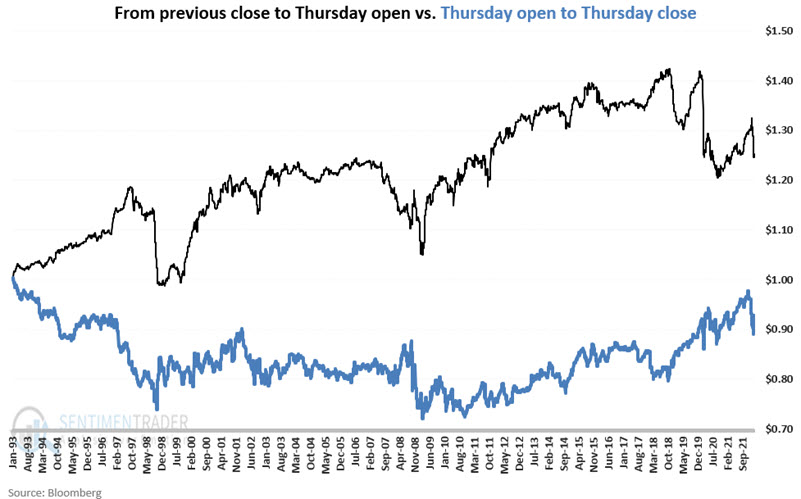
The next chart shows the growth of $1 in SPY held intraday if SPY opened higher versus the growth of $1 in SPY held intraday if SPY opened lower or unchanged.
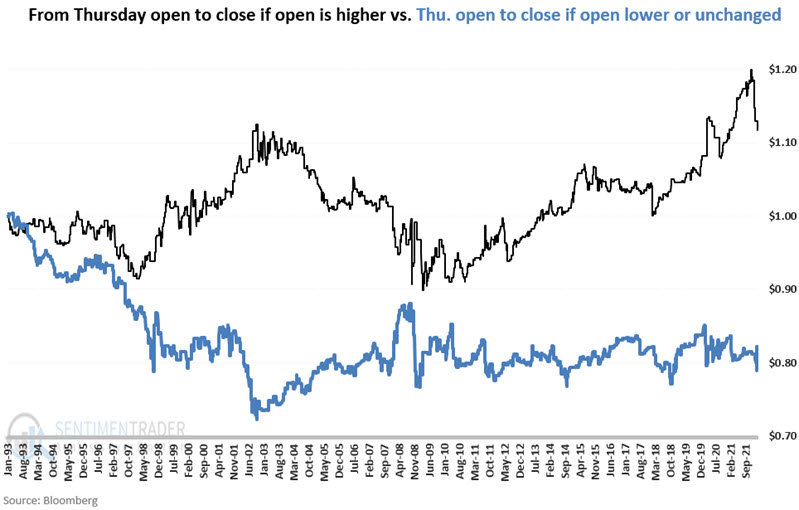
Results
- Overnight % +(-) = +25.3%
- Net Intraday % +(-) = (-8.2%)
- Intraday % +(-) if higher open = +11.7%
- Intraday % +(-) if lower open = (-17.8%)
Friday
The first chart below shows the growth of $1 in SPY held only overnight (black line) into Thursday's open versus the growth of $1 in SPY held intraday, i.e., open to close only on Thursday (blue line).
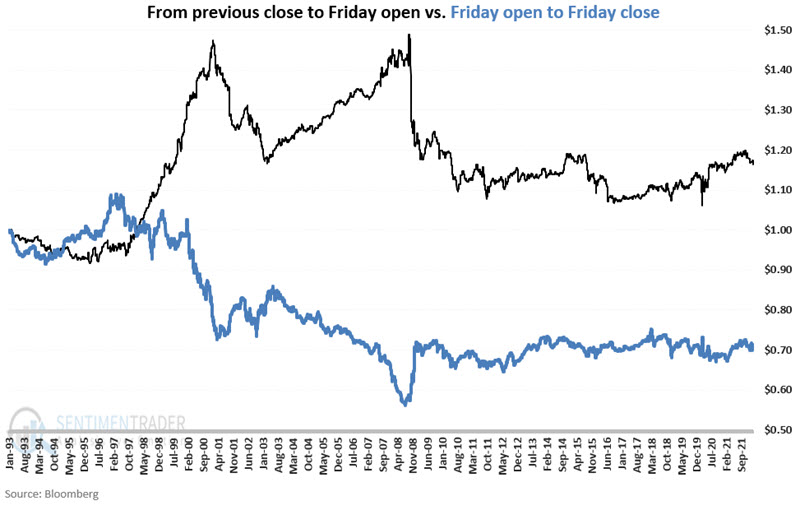
The next chart shows the growth of $1 in SPY held intraday if SPY opened higher versus the growth of $1 in SPY held intraday if SPY opened lower or unchanged.
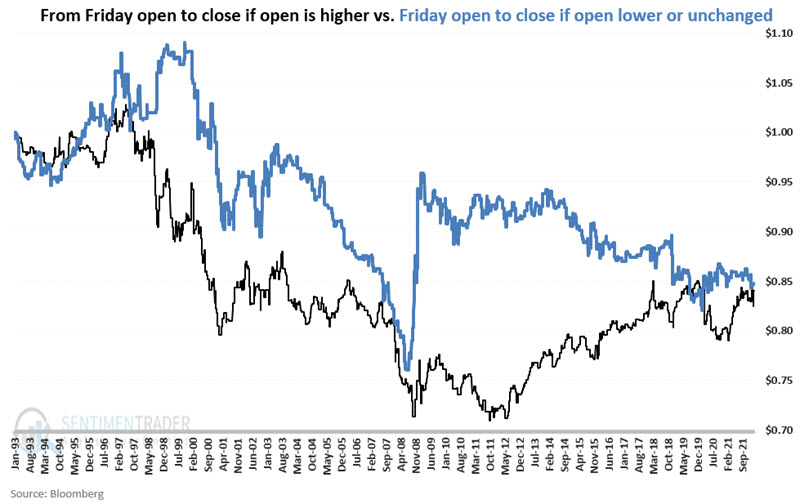
Results
- Overnight % +(-) = +16.4%
- Net Intraday % +(-) = (-28.8%)
- Intraday % +(-) if higher open = (-16.0%)
- Intraday % +(-) if lower open = (-15.2%)
Summary of Results
What the research tells us…
Some general observations:
- Holding overnight accounted for all gains
- Holding intraday showed a small net loss
- Tuesday and Wednesday are "turnaround" days (i.e., higher opens lead to lower closes and vice versa)
- Monday and Thursday are "continuation" days (i.e., higher opens lead to higher closes and vice versa)
- Friday is the worst day to hold intraday, but the best day to buy at the close
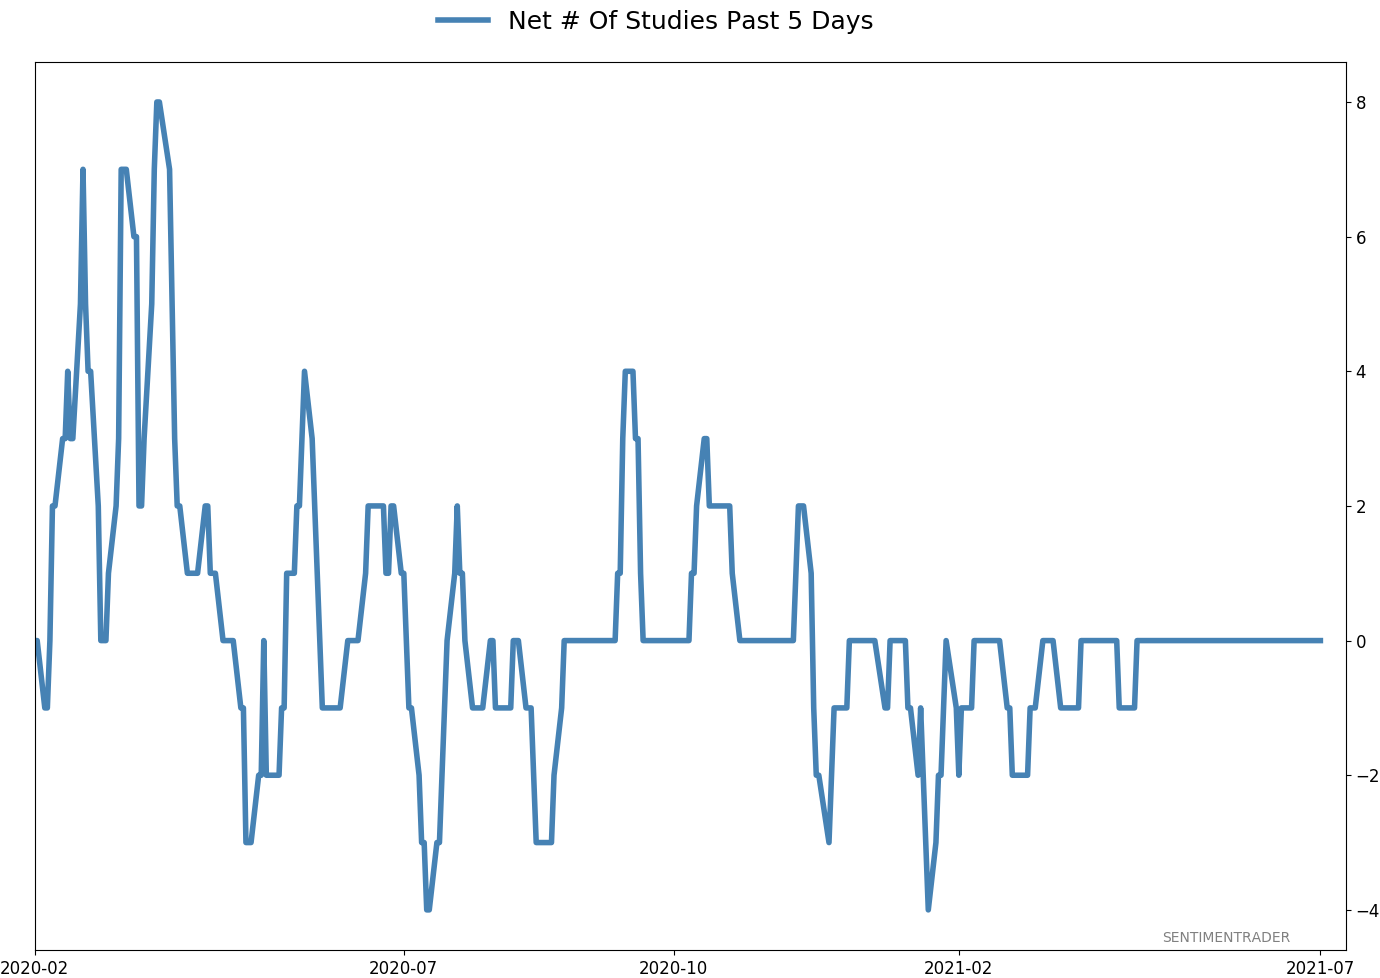
Active Studies
| Time Frame | Bullish | Bearish | | Short-Term | 4 | 0 | | Medium-Term | 21 | 2 | | Long-Term | 15 | 5 |
|
Indicators at Extremes
Portfolio
| Position | Description | Weight % | Added / Reduced | Date | | Stocks | RSP | 21.4 | Added 10.2% | 2022-01-28 | | Bonds | 32.7% BND, 7.1% SCHP | 40.1 | Added 8.3% | 2021-10-26 | | Commodities | GCC | 2.4 | Reduced 2.1%
| 2020-09-04 | | Precious Metals | GDX | 4.6 | Reduced 4.2% | 2021-05-19 | | Special Situations | 7.6% KWEB, 4.9% XBI, 3.7% XLE, 1.8% PSCE | 18.0 | Added 4.6% | 2022-02-24 | | Cash | | 13.2 | | |
|
Updates (Changes made today are underlined)
With a typical time frame of several months in this account, I normally don't make changes so quickly. I've added back part of the stock exposure I took off earlier in January due to the washed-out conditions and extreme pessimism we're seeing across a wide array of metrics. The biggest issue is that the environment is unhealthy and we could be in the throes of a protracted bear market. Even so, the readings we've seen recently have a good record at preceding relief rallies, so we'll have to see how that pans out. Bond sentiment is trying to recover from a recent bout of pessimism, and gold stocks are doing their thing which is not much at all. They've been flat for six months. Chinese tech stocks were doing exactly what they're supposed to do, then did *not* by plunging to new lows. This is troubling on a shorter-term time frame, but this was never meant for a trade, rather a multi-year investment. Recent behavior is troubling and I will not be adding any exposure as long as that's the case. RETURN YTD: -0.1% 2021: +8.7%, 2020: +8.1%, 2019: +12.6%, 2018: +0.6%, 2017: +3.8%, 2016: +17.1%, 2015: +9.2%, 2014: +14.5%, 2013: +2.2%, 2012: +10.8%, 2011: +16.5%, 2010: +15.3%, 2009: +23.9%, 2008: +16.2%, 2007: +7.8%
|
|
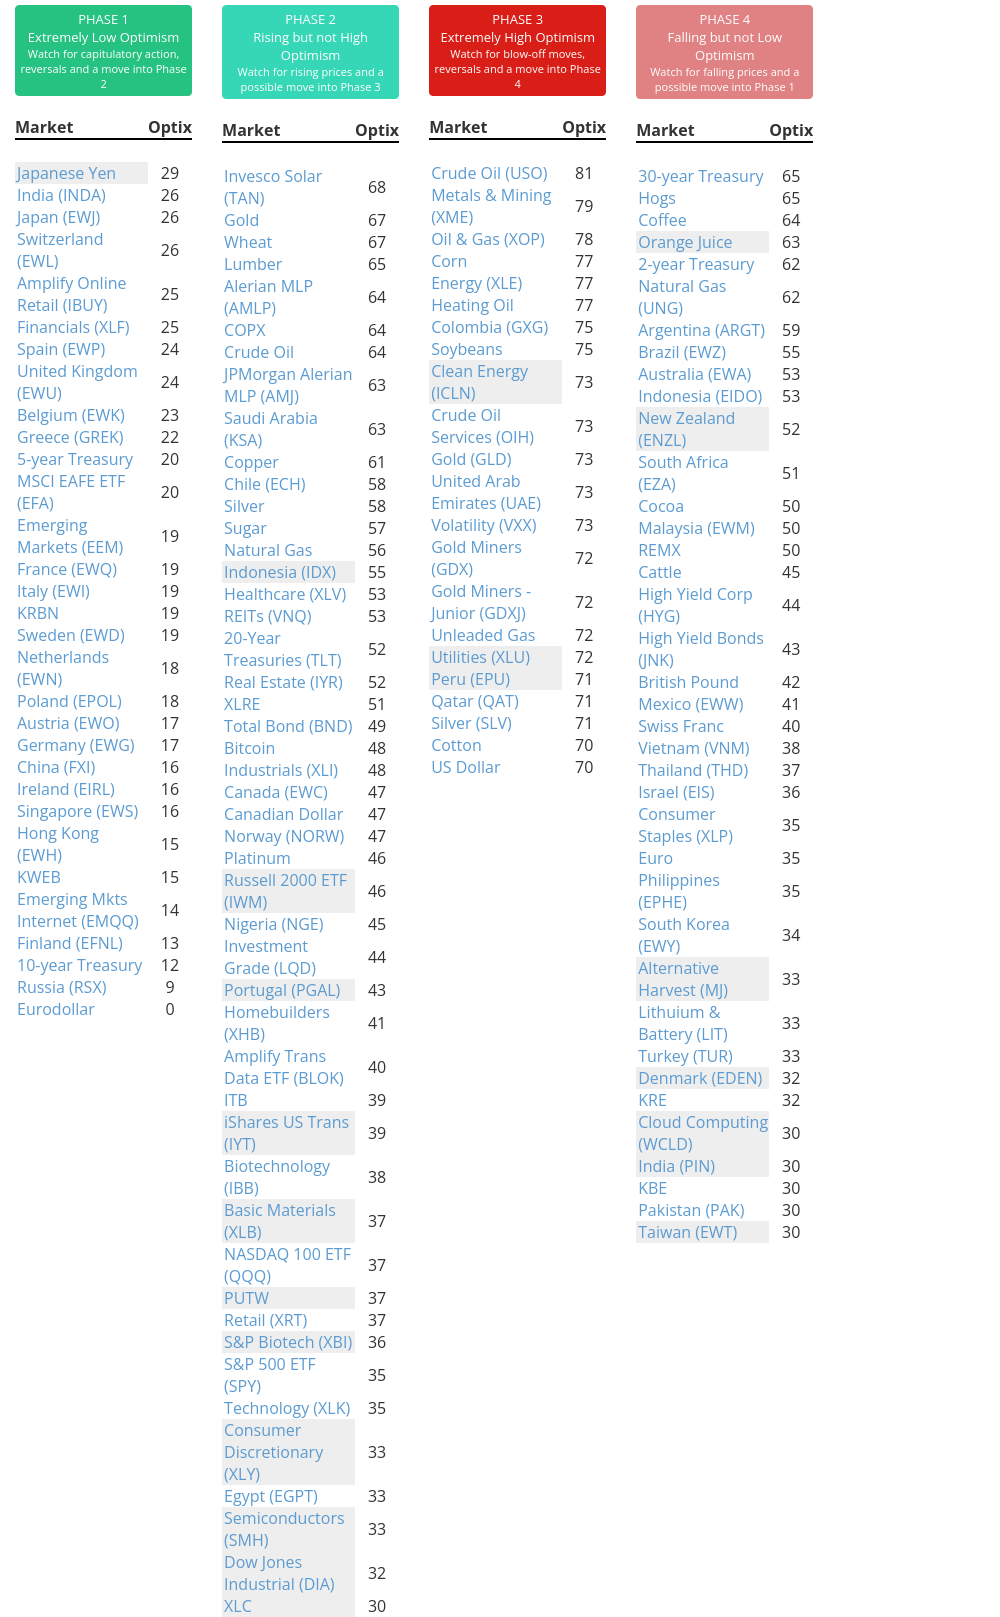
Phase Table
Ranks
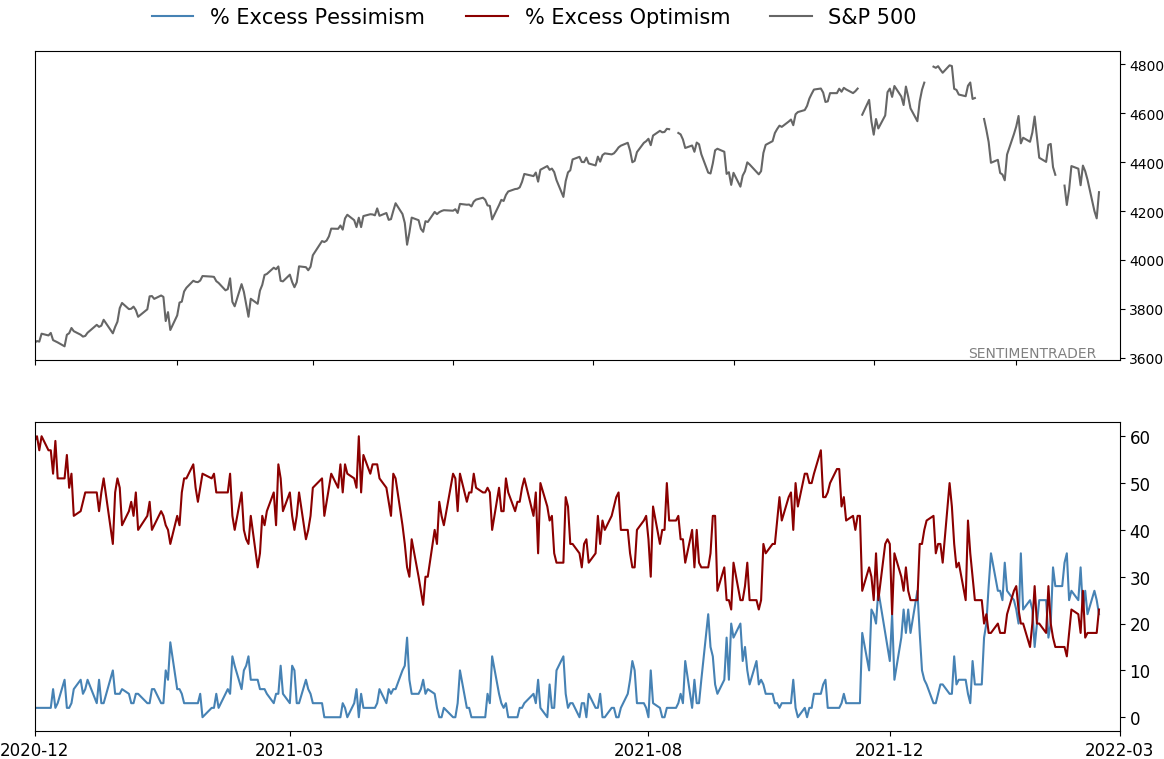
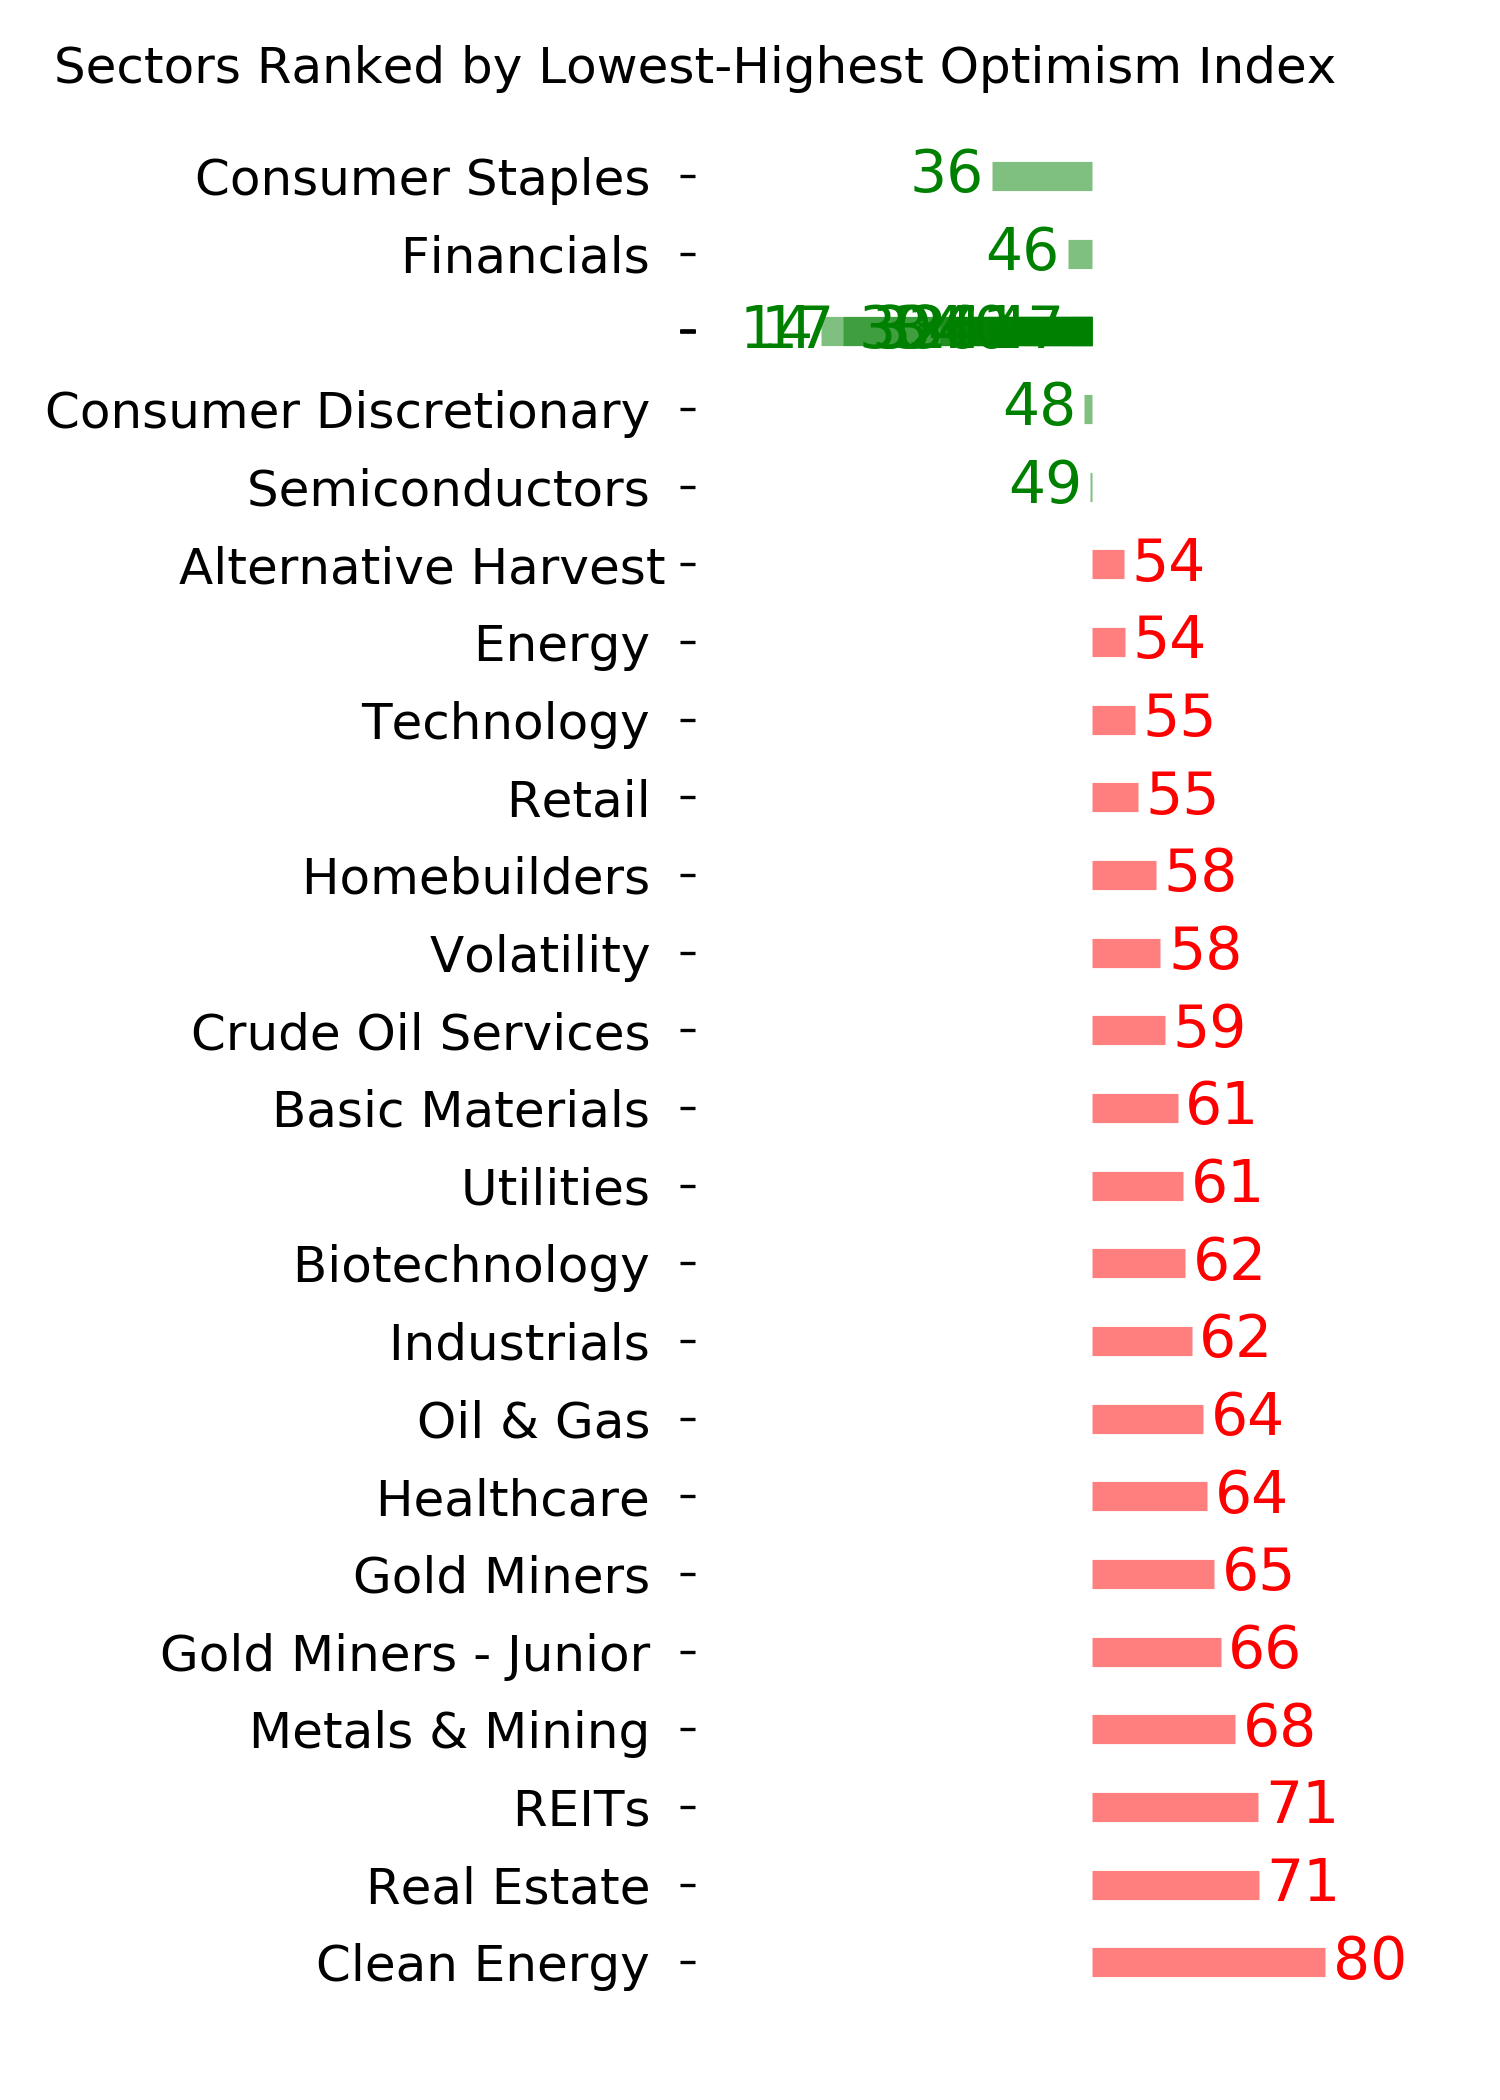
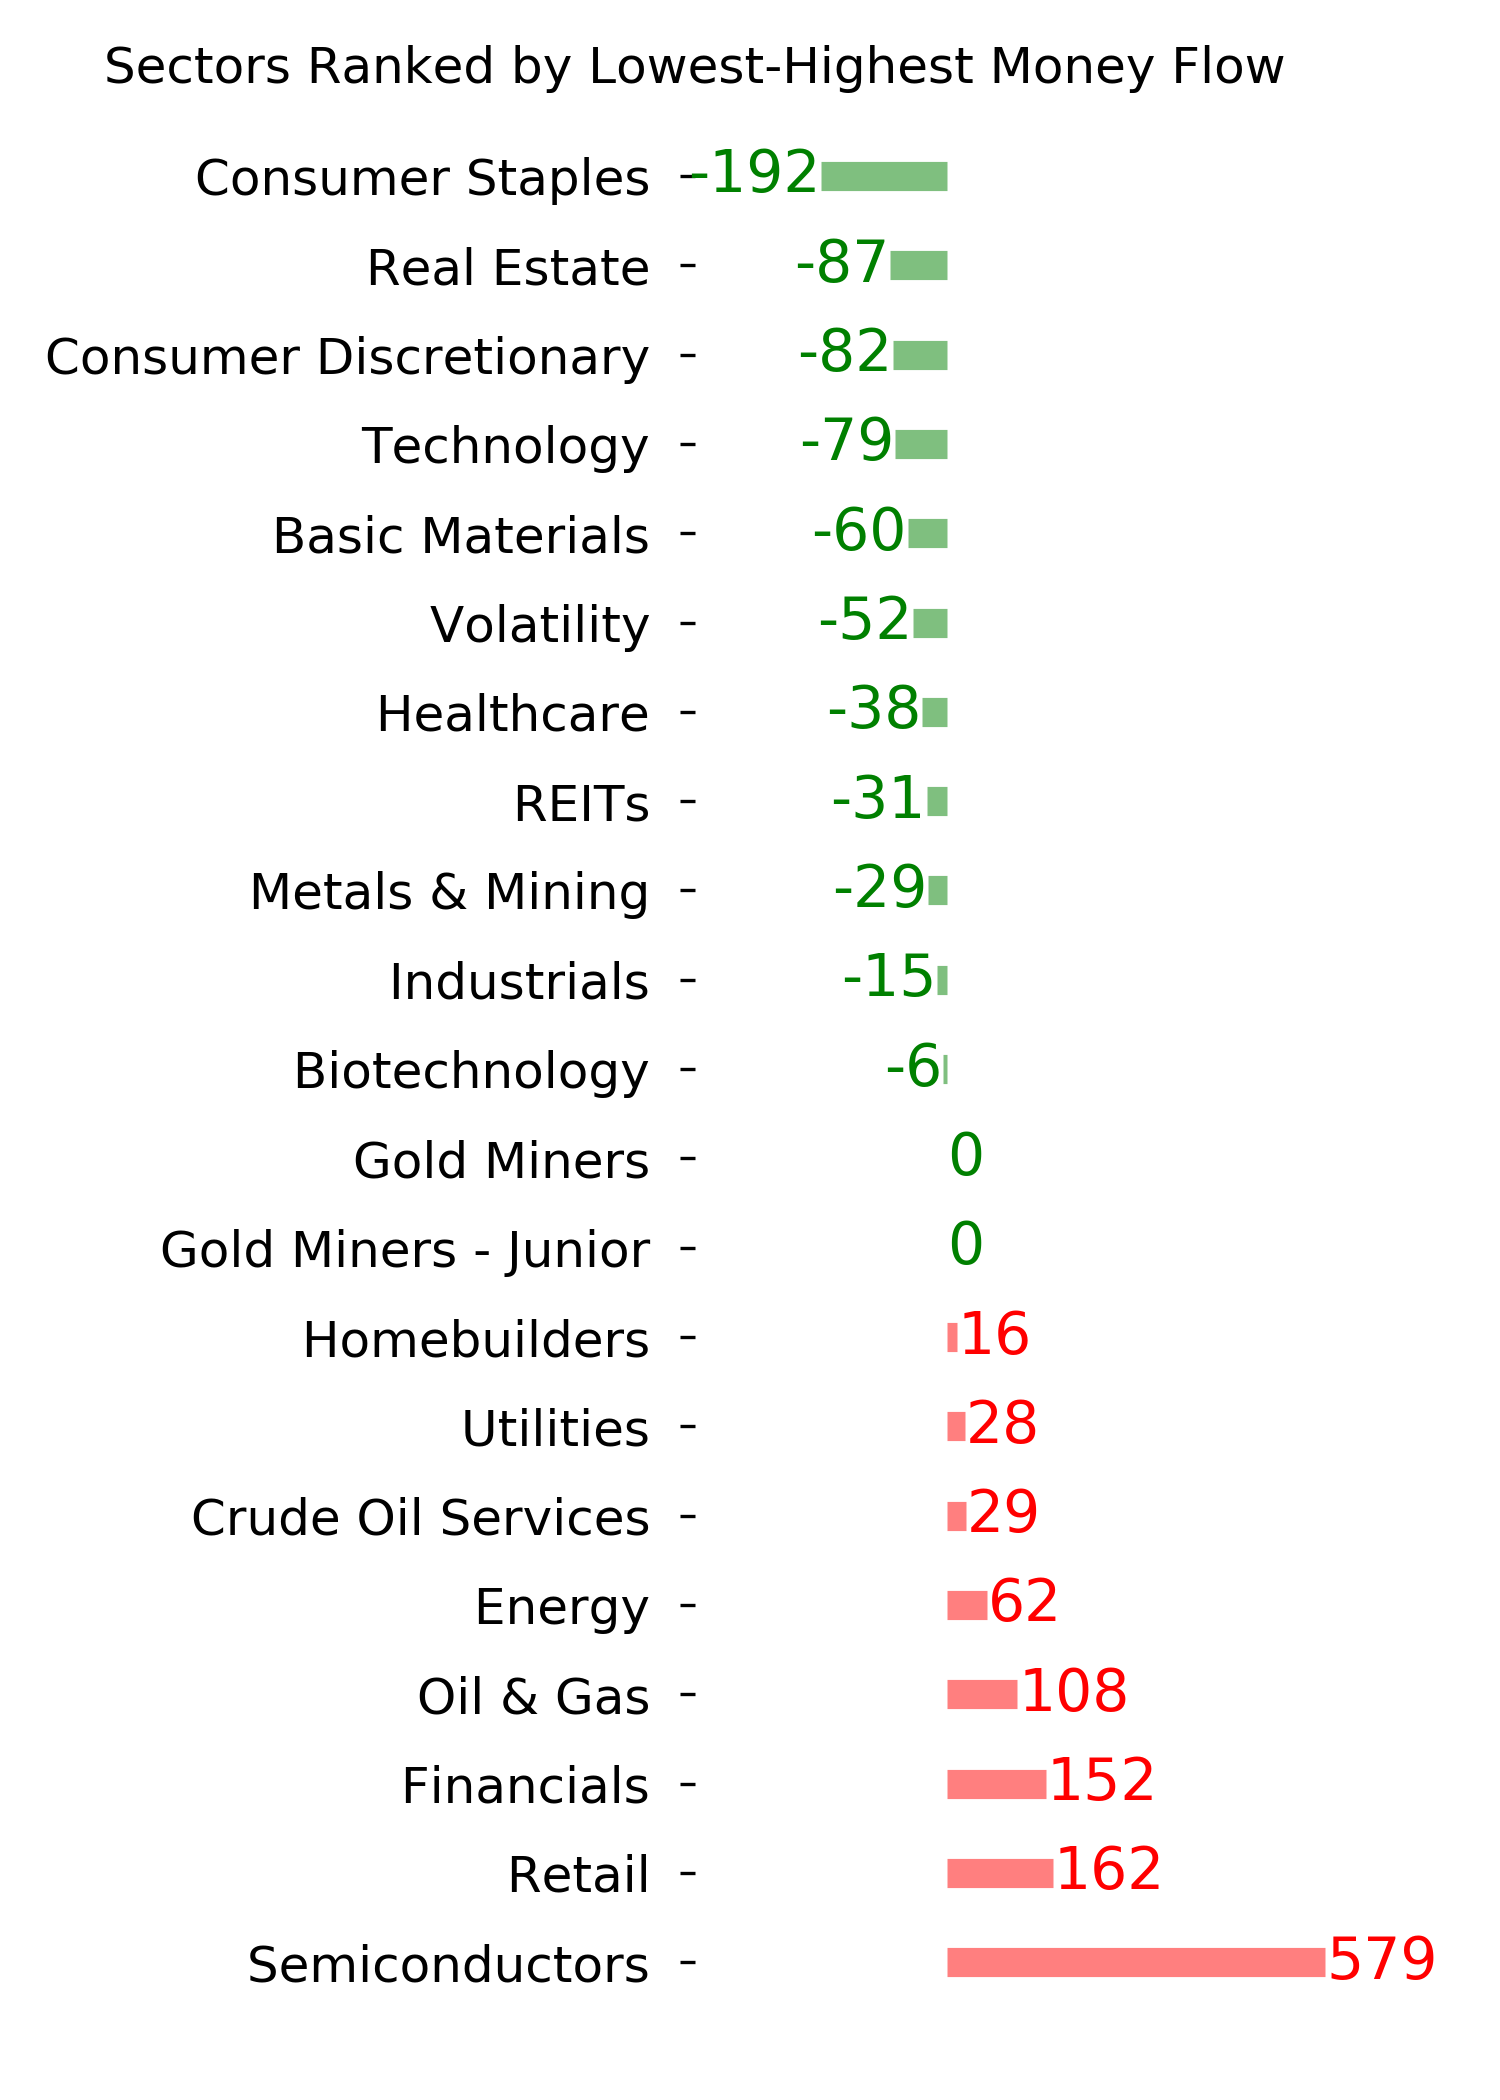
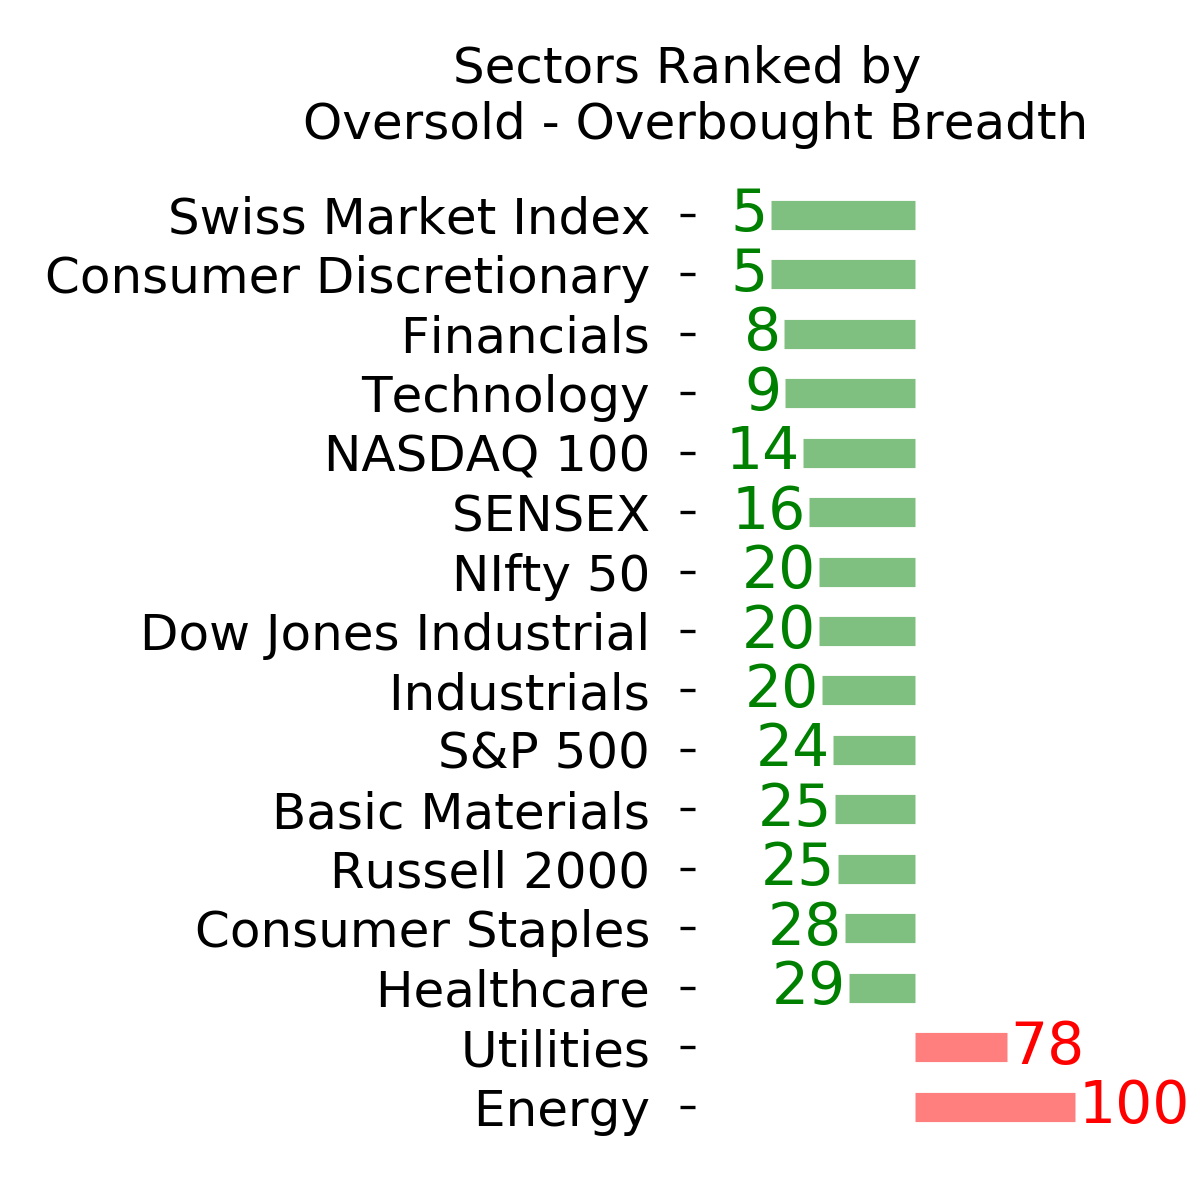
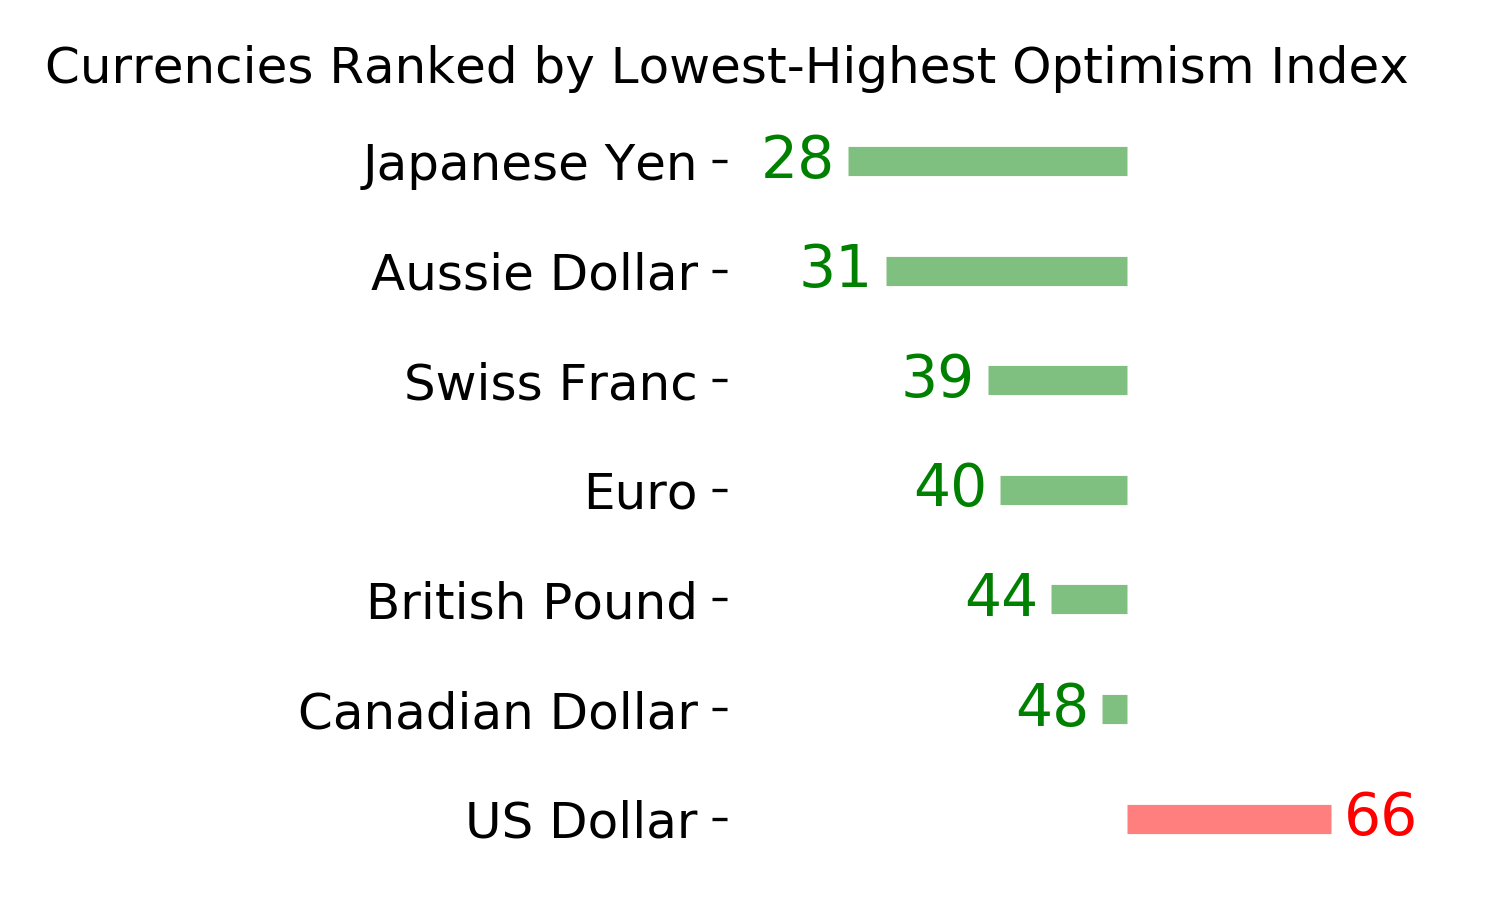
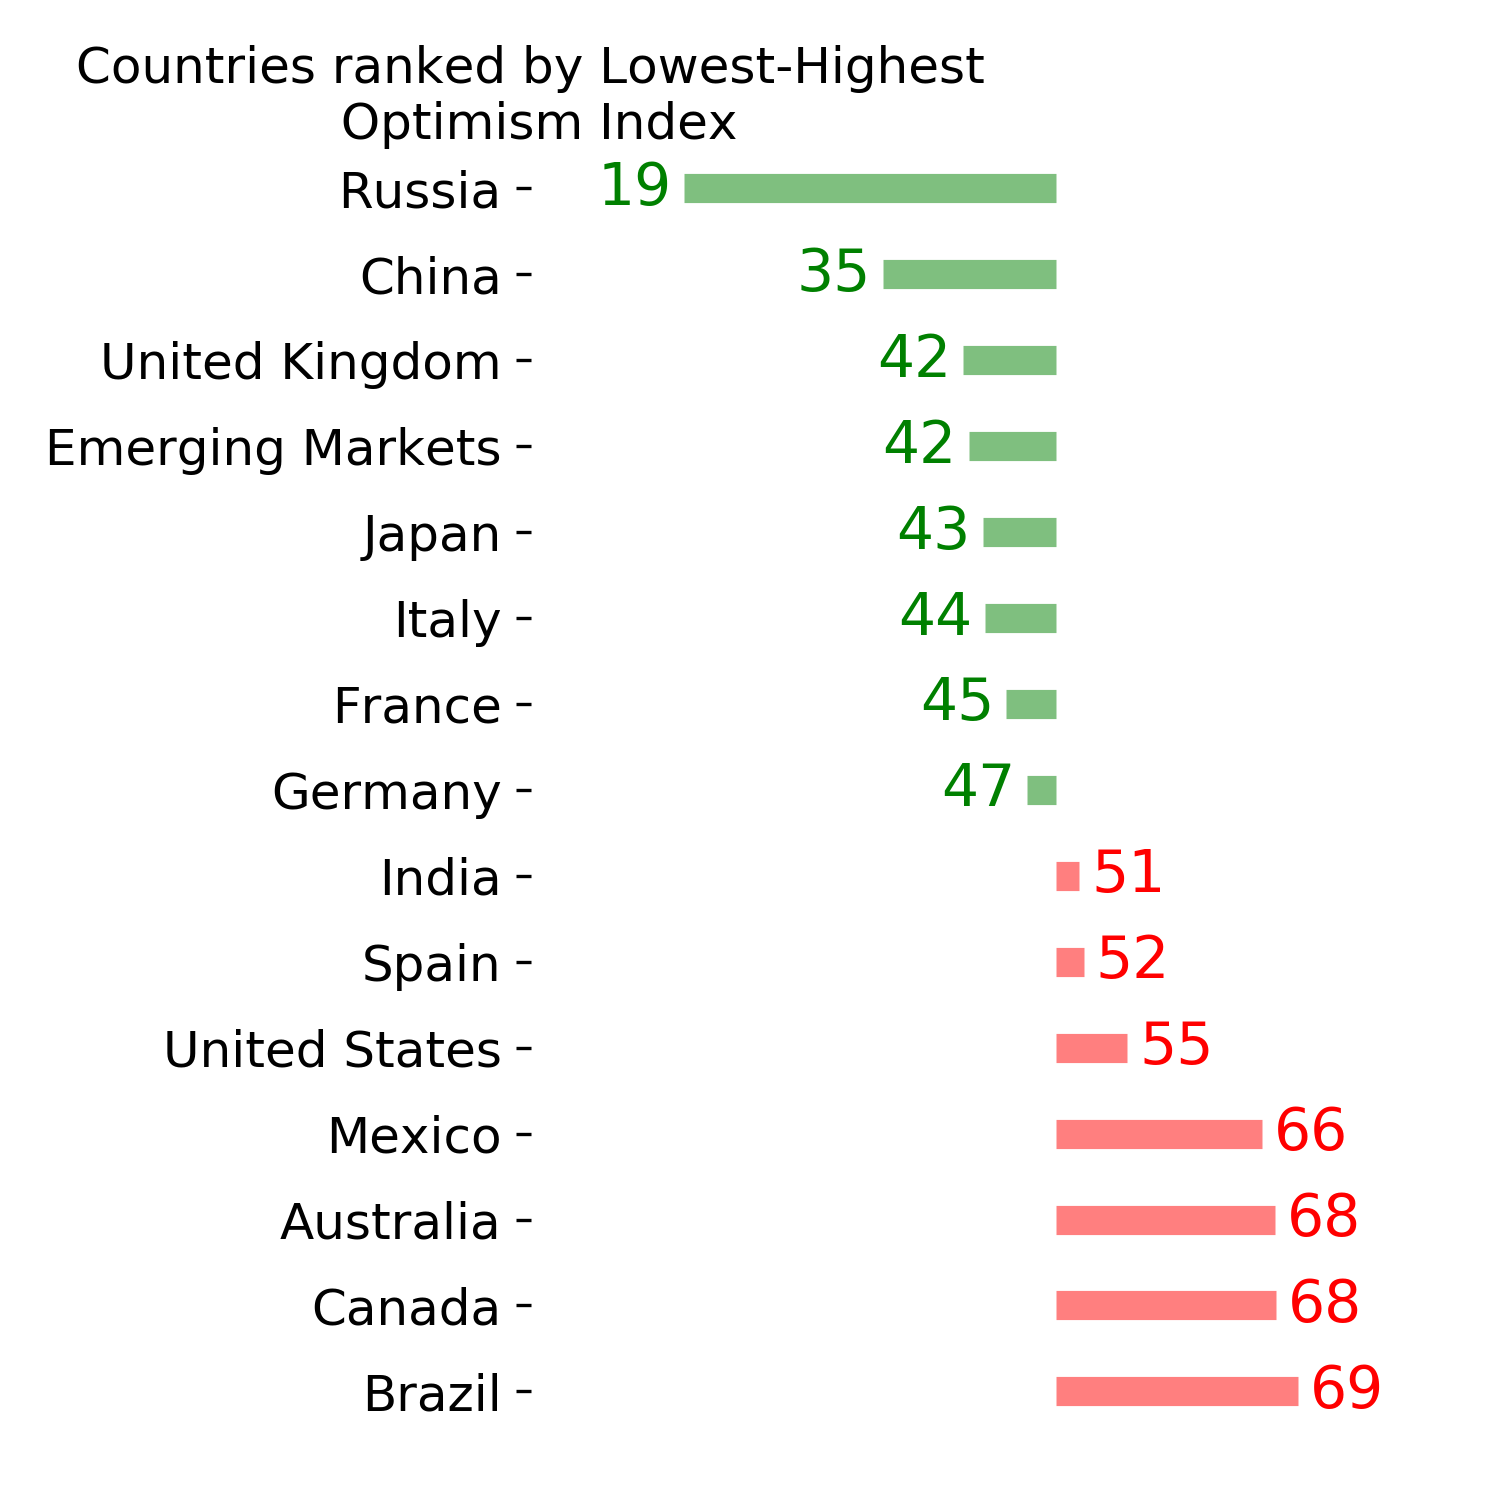
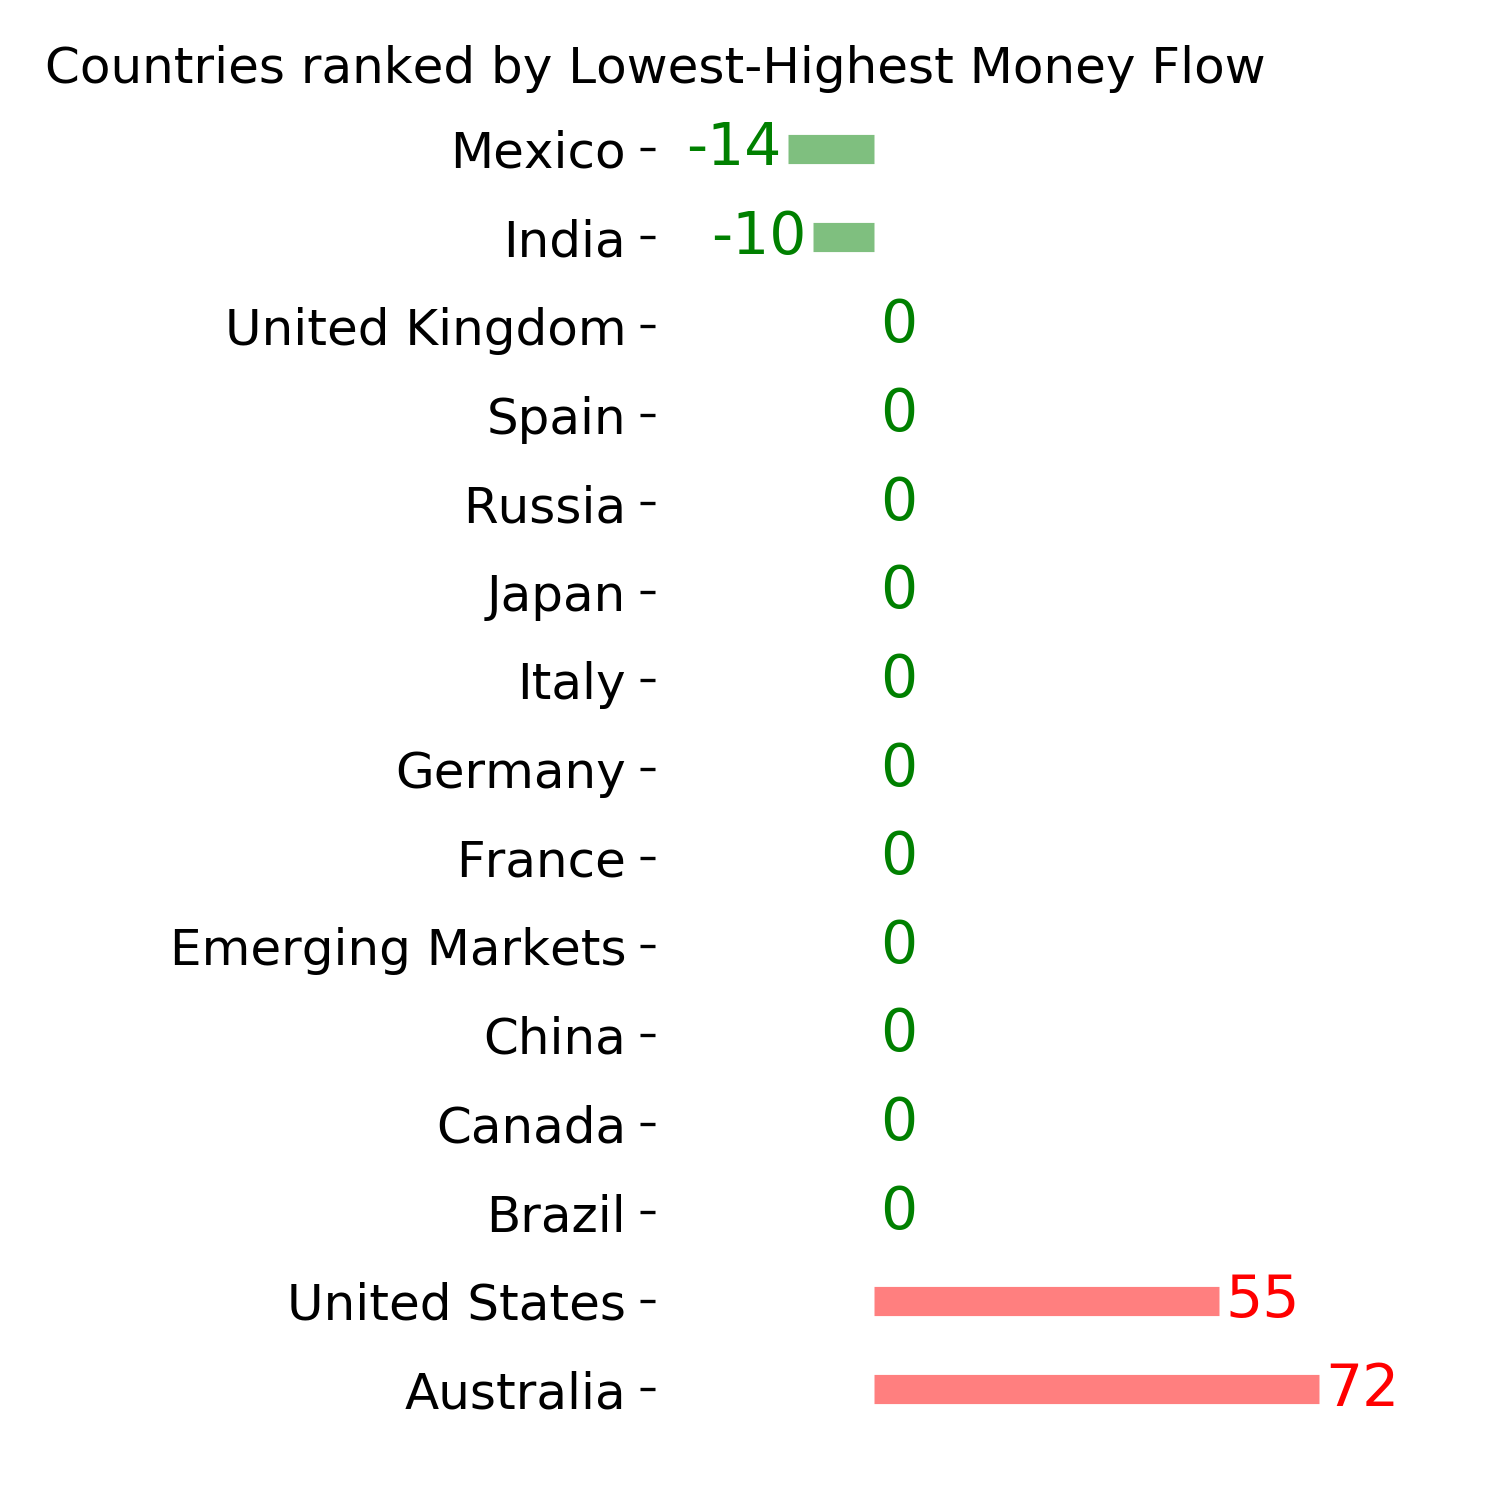
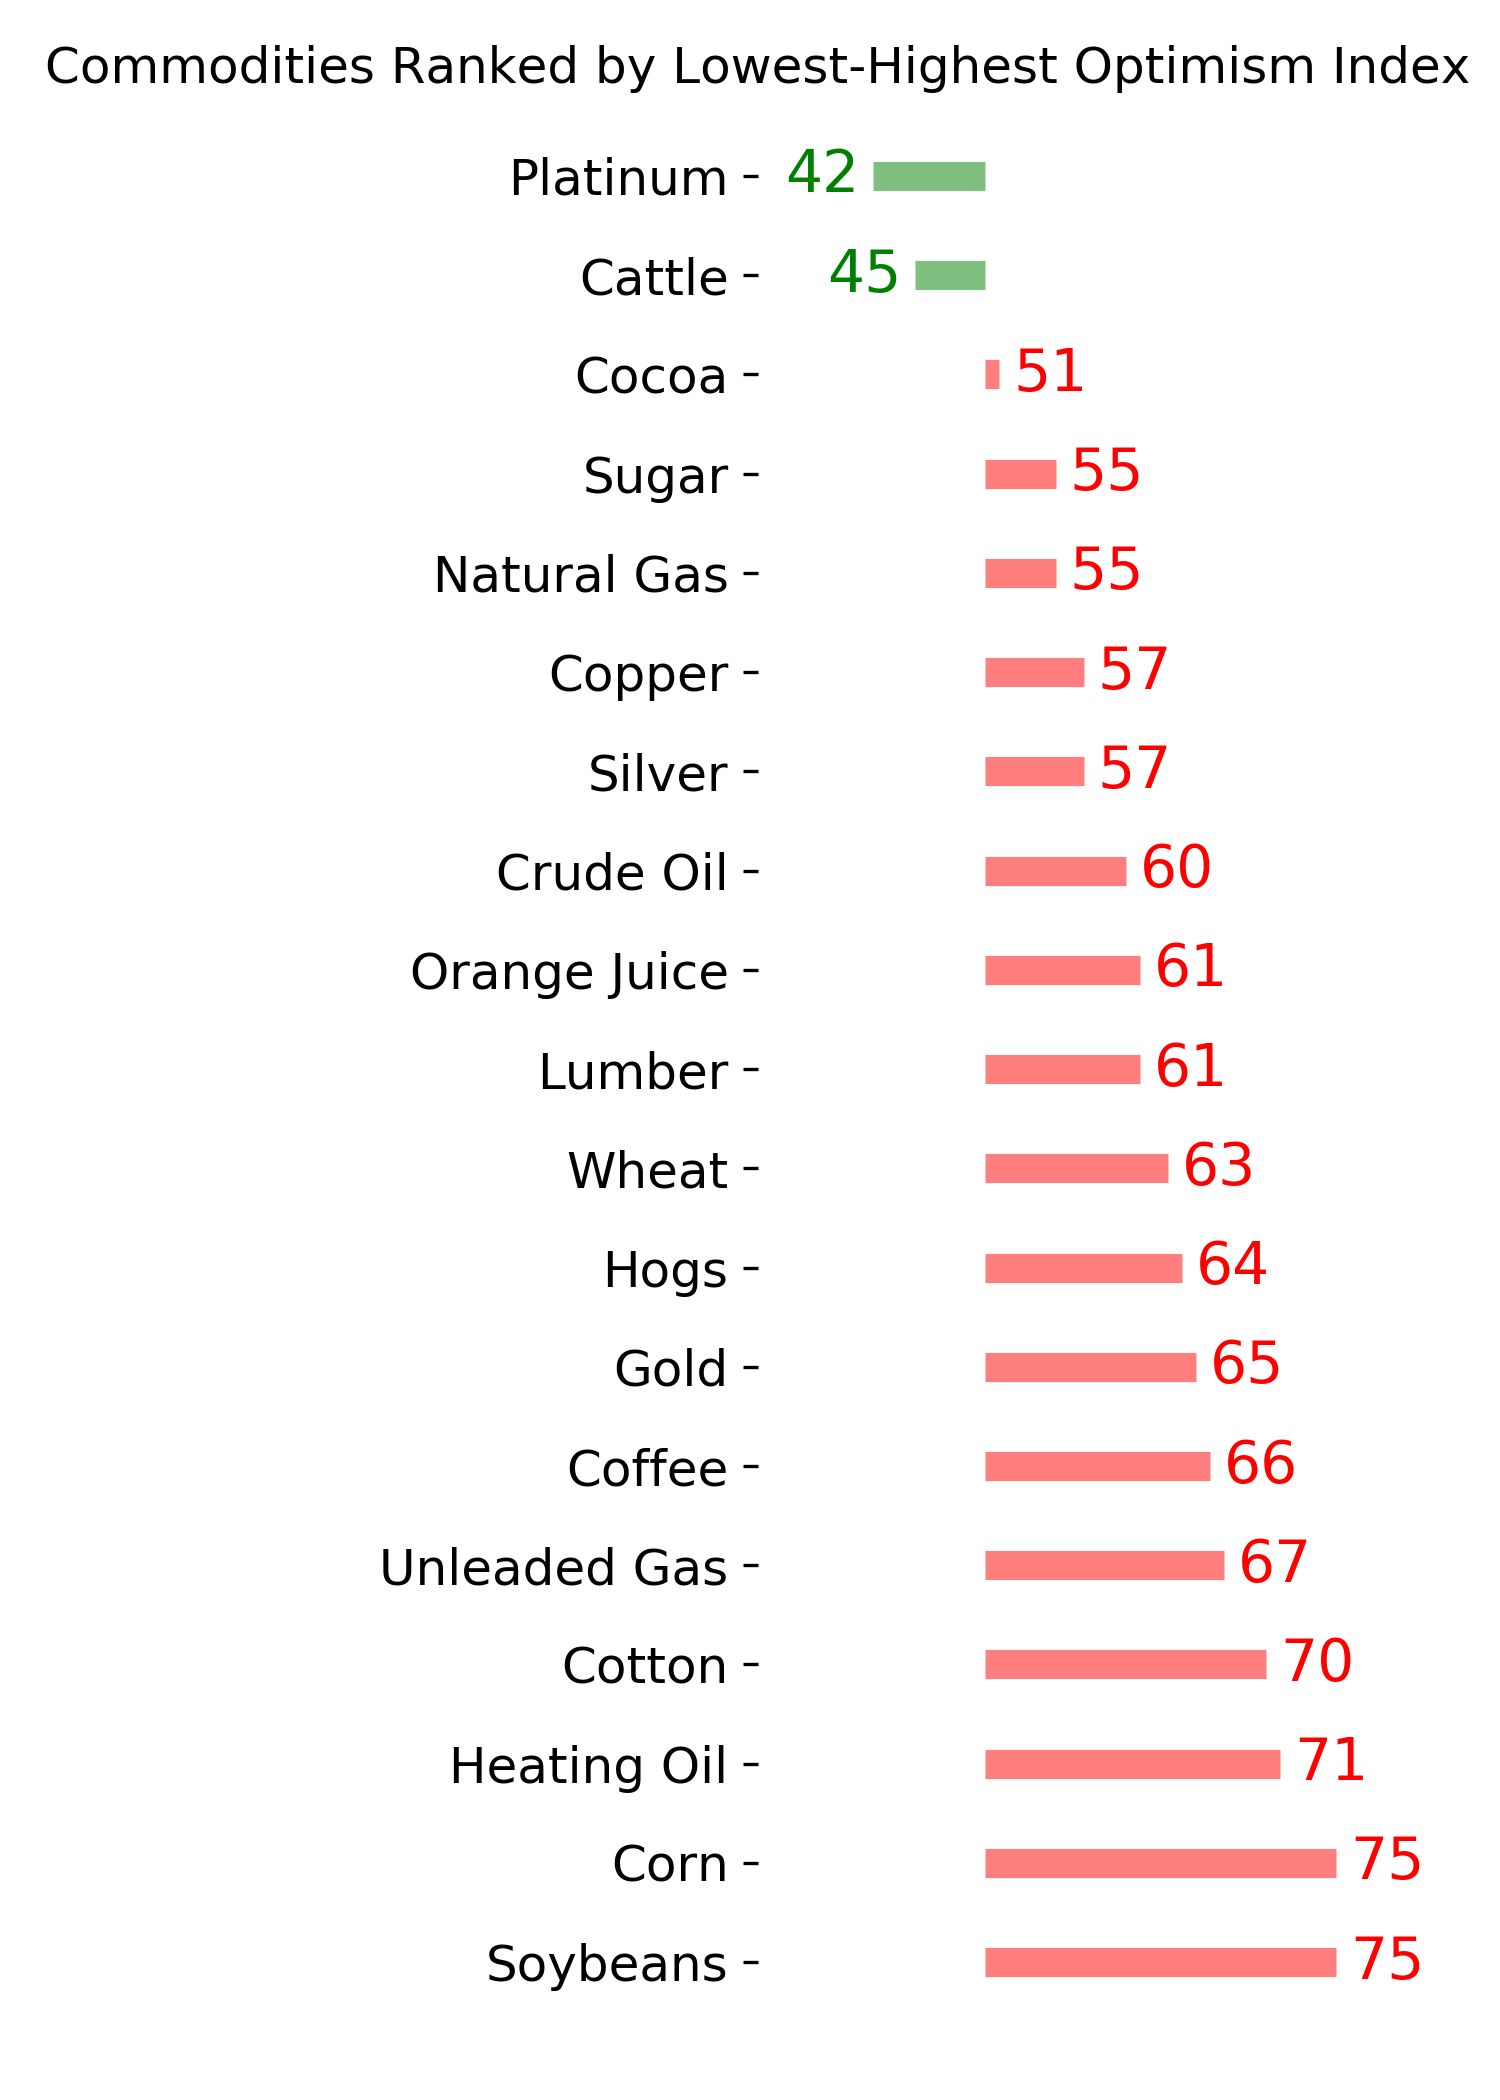
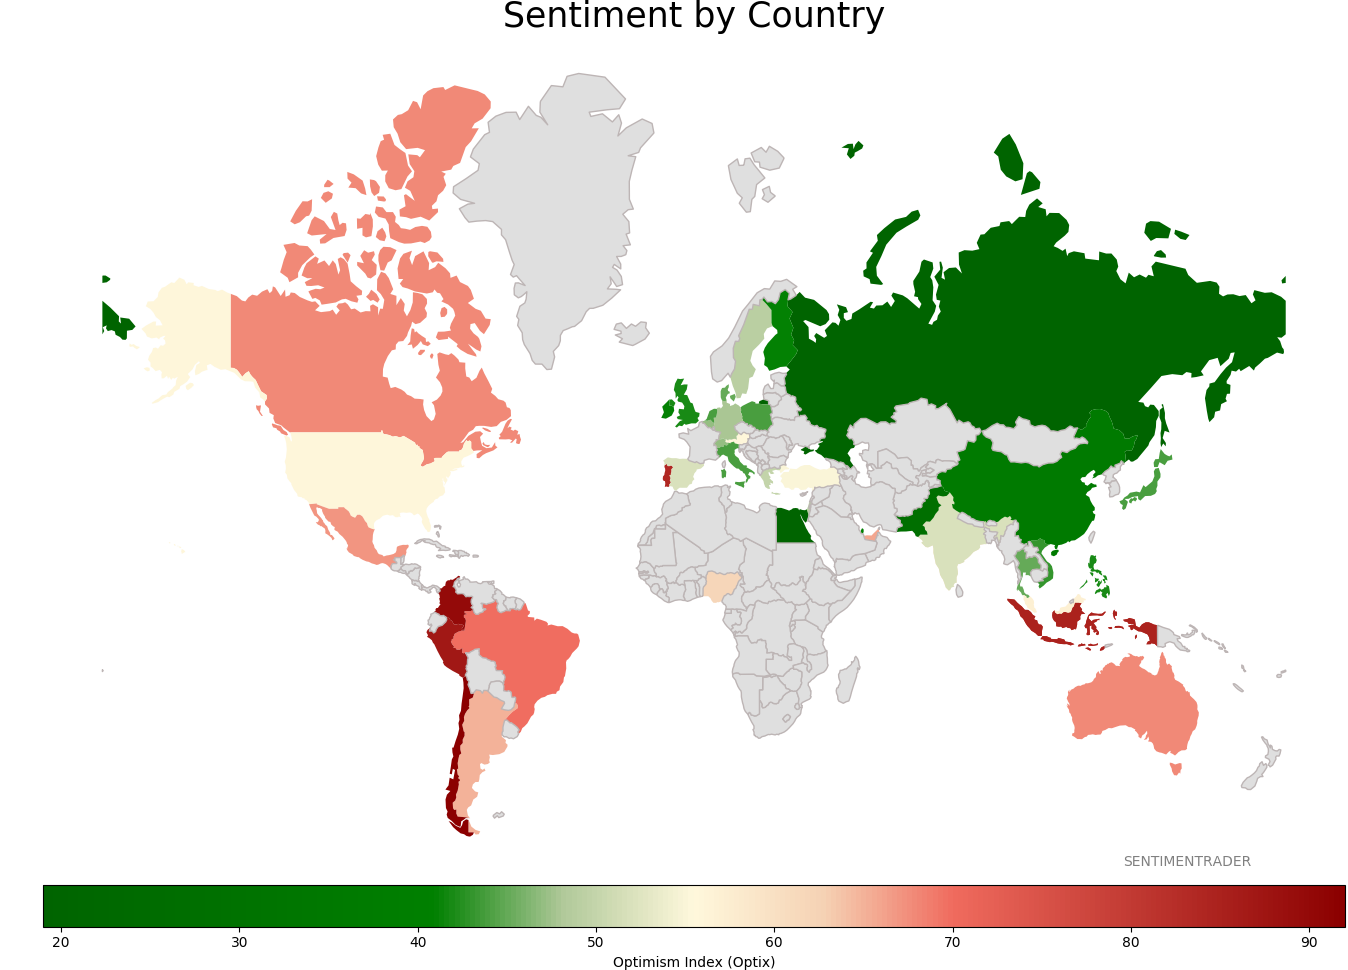
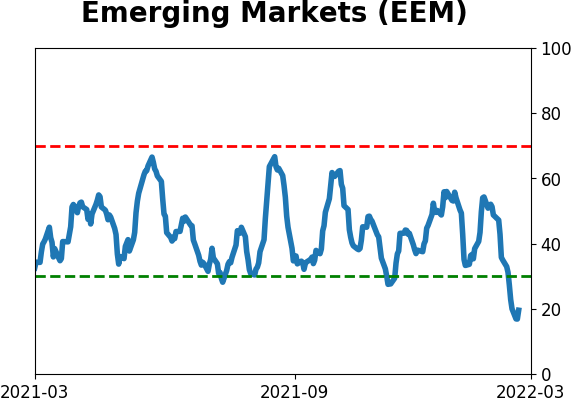
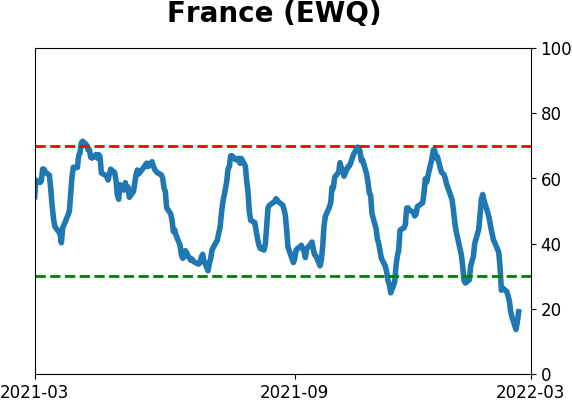
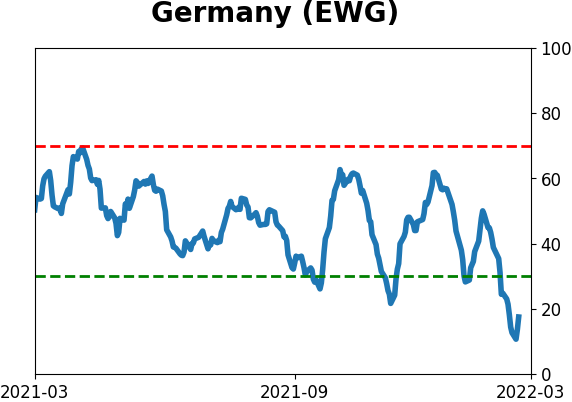
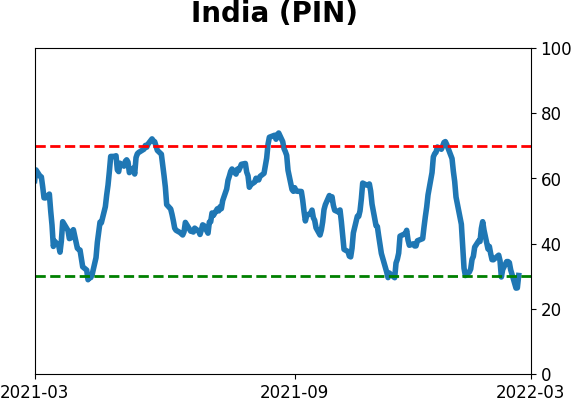
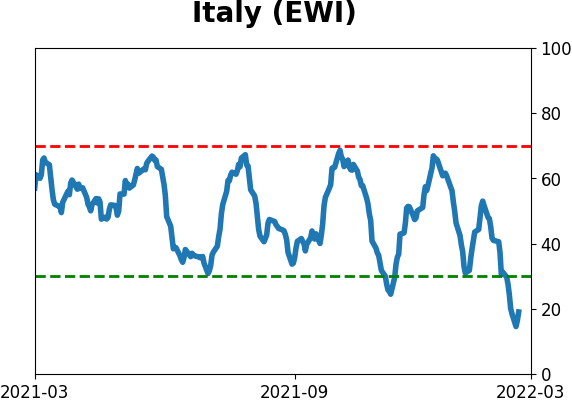
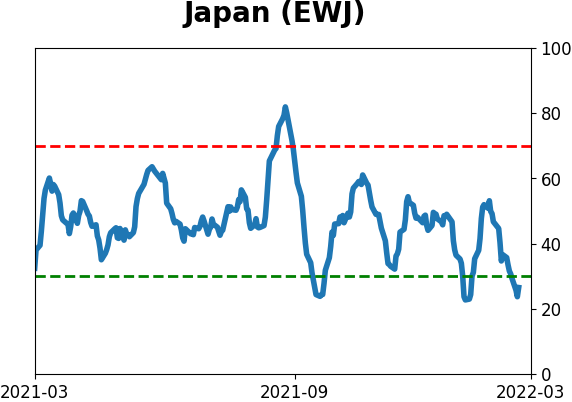
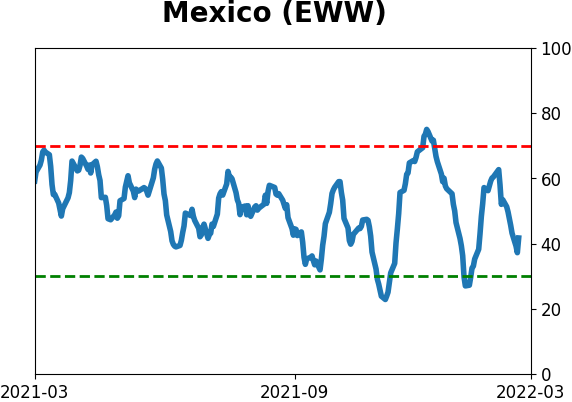
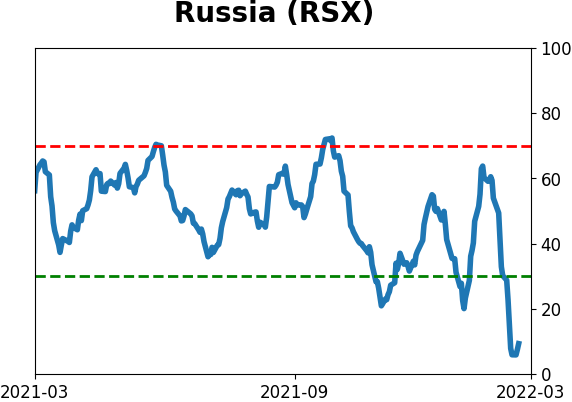
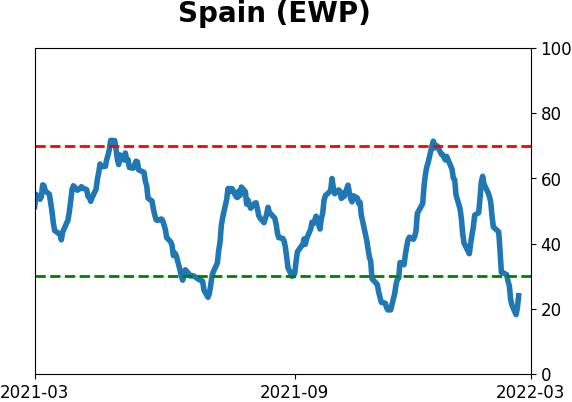
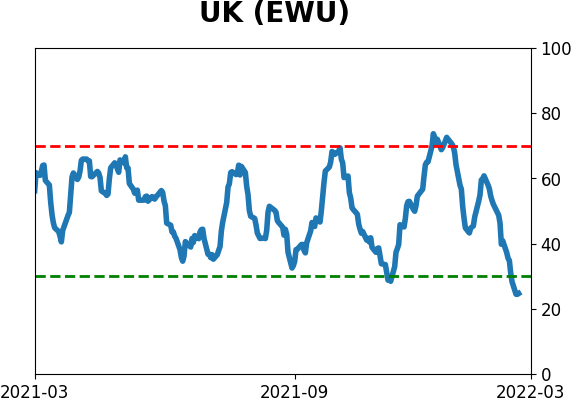
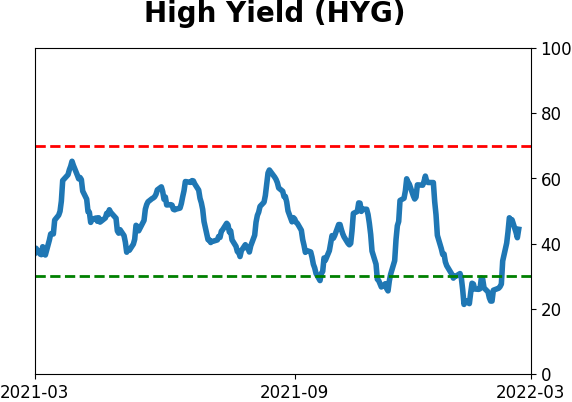
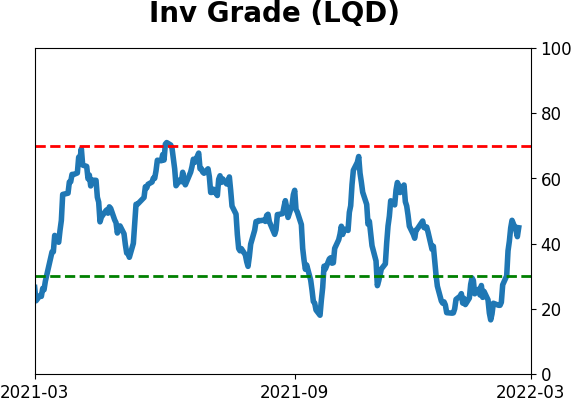
Sentiment Around The World
Optimism Index Thumbnails
|
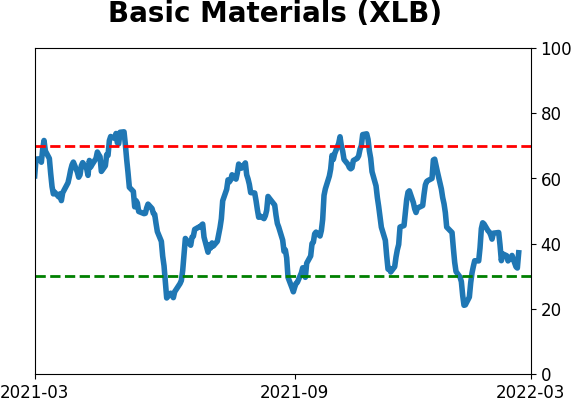
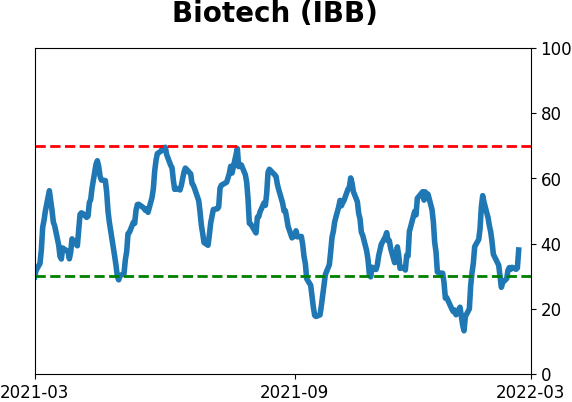
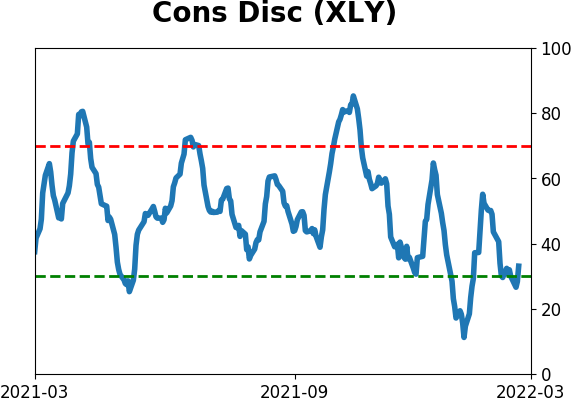
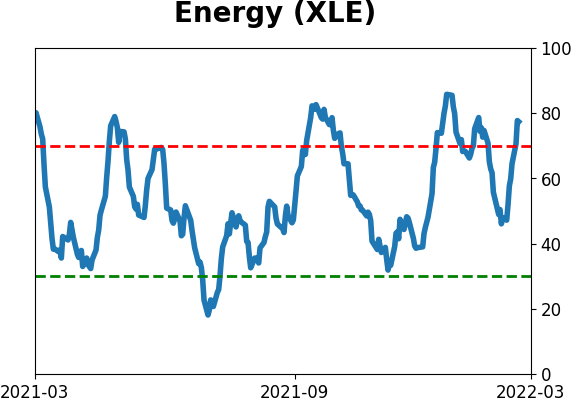
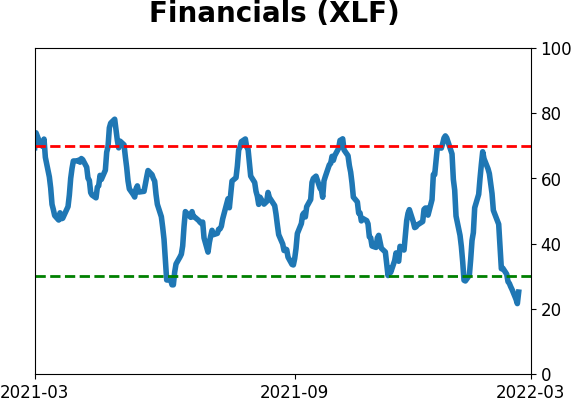
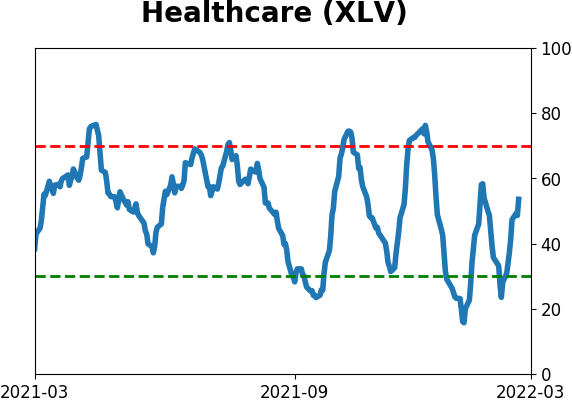
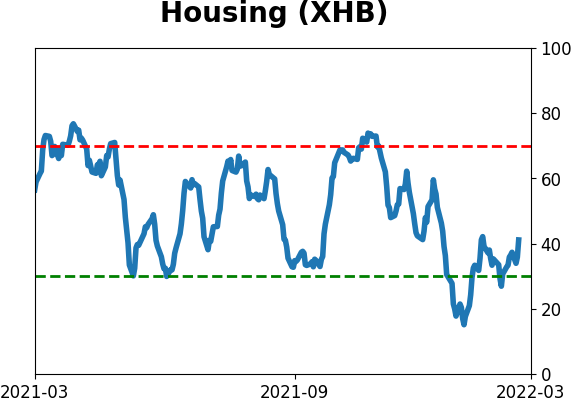
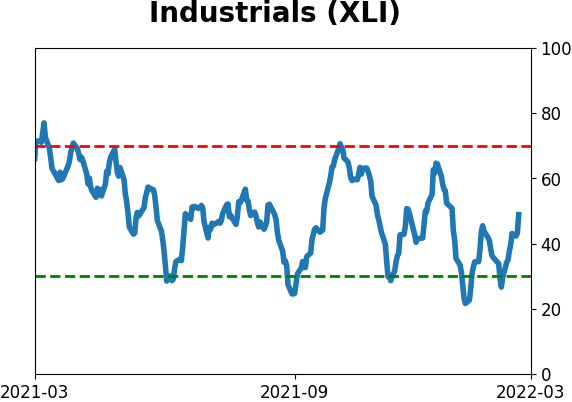
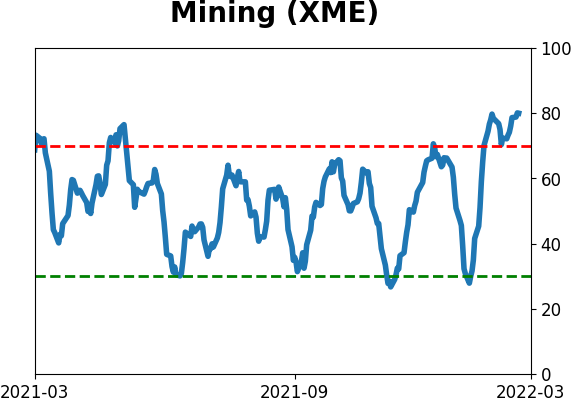
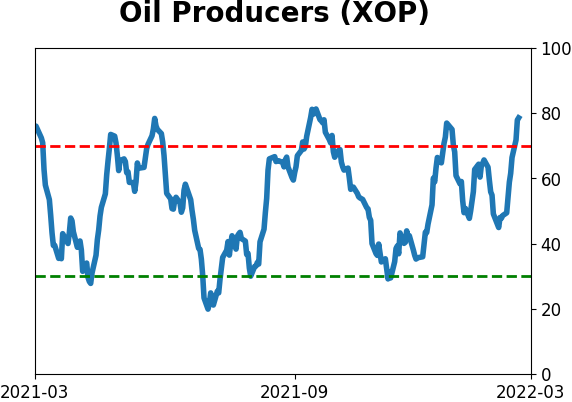
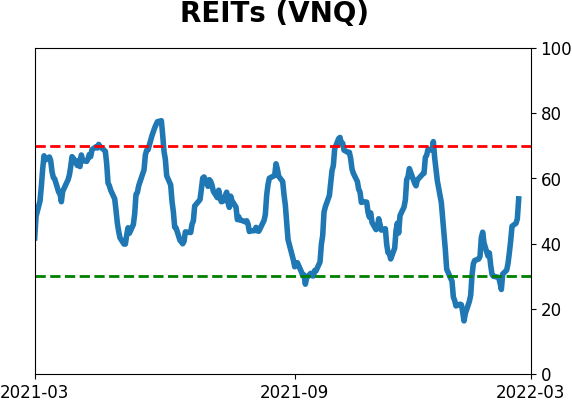
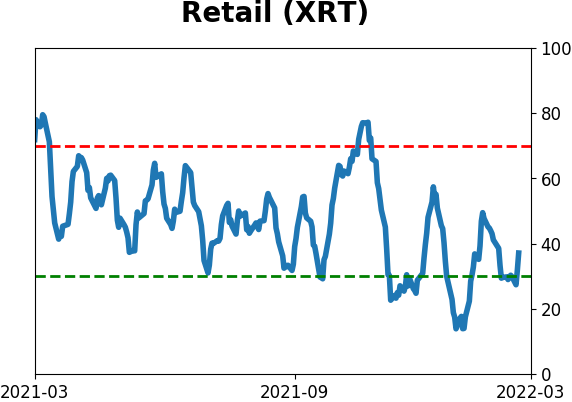
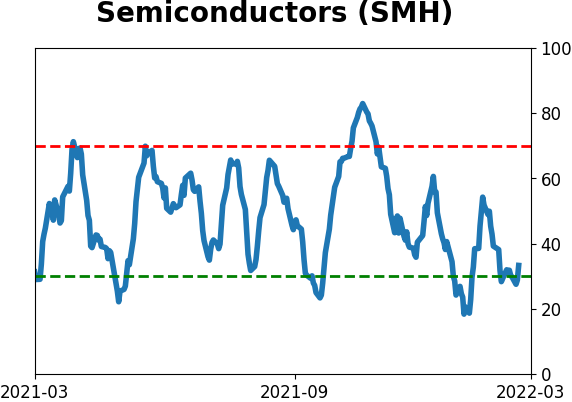
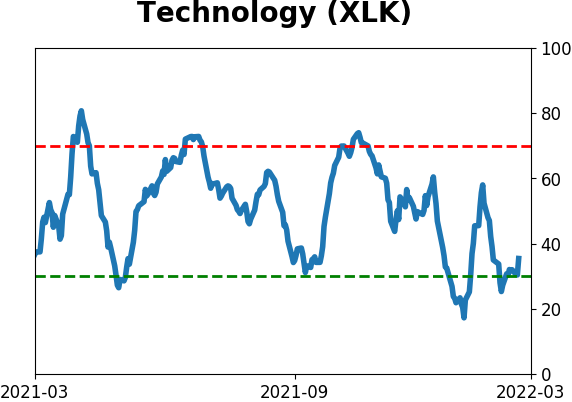
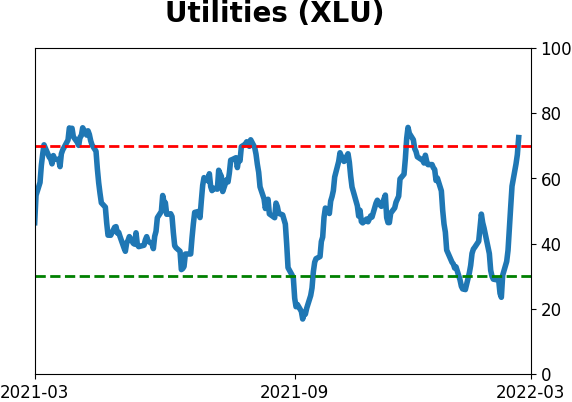
Sector ETF's - 10-Day Moving Average
|
|
|
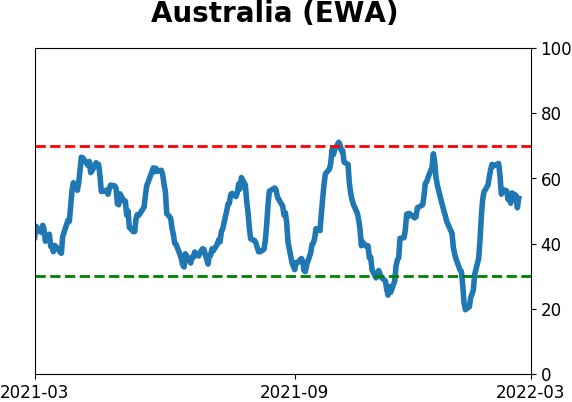
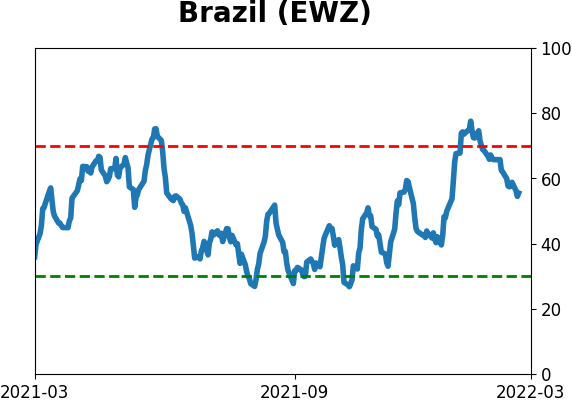
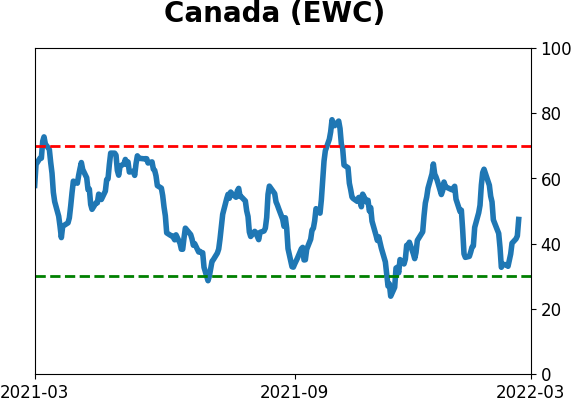
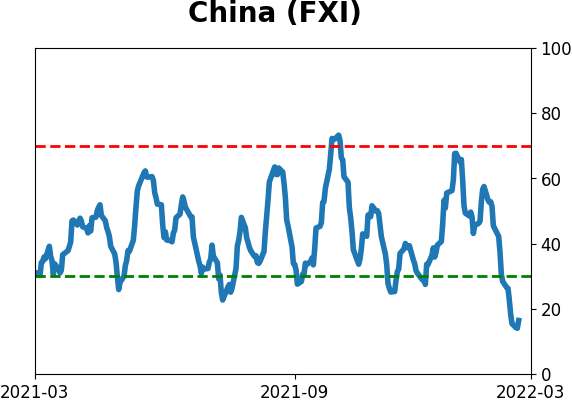
Country ETF's - 10-Day Moving Average
|
|
|
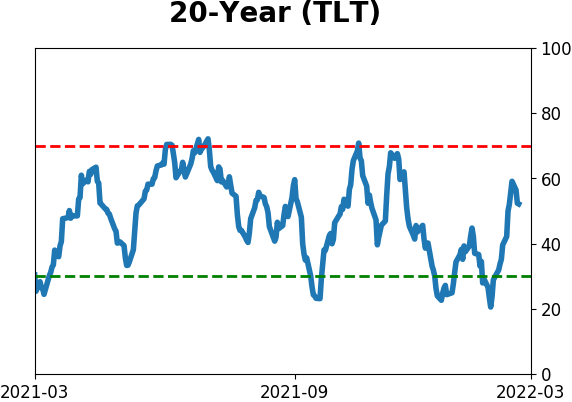
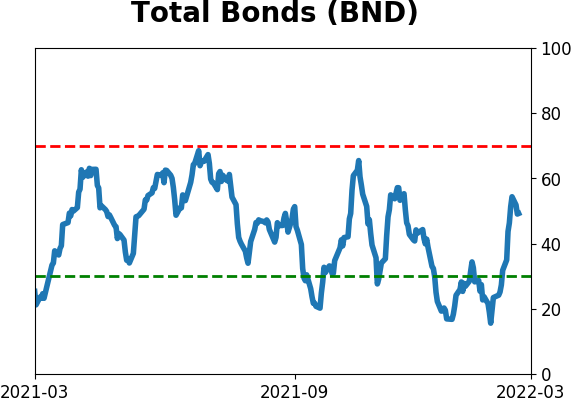
Bond ETF's - 10-Day Moving Average
|
|
|
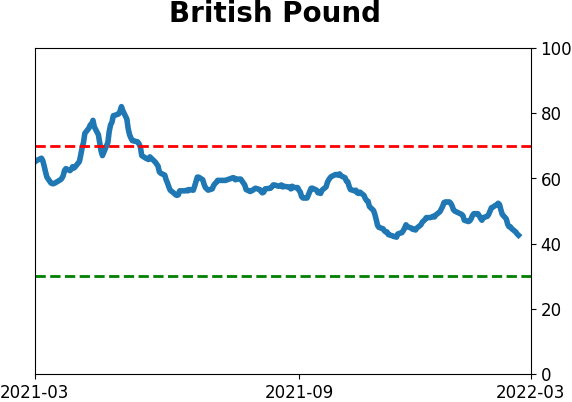
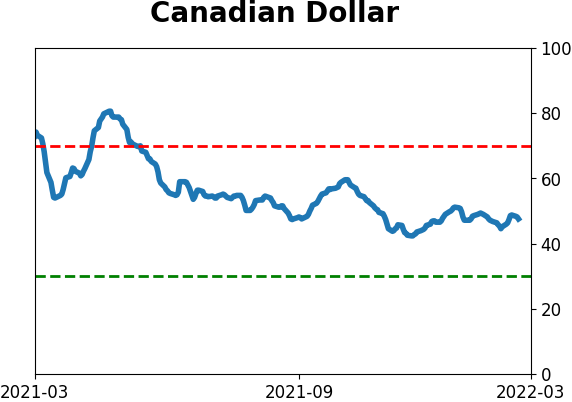
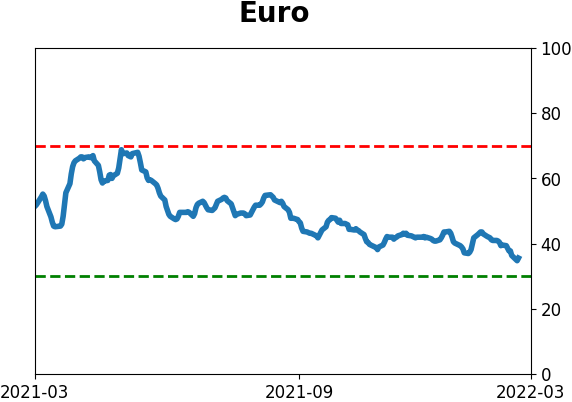
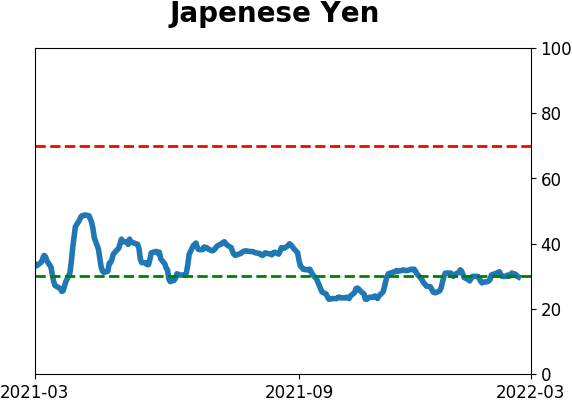
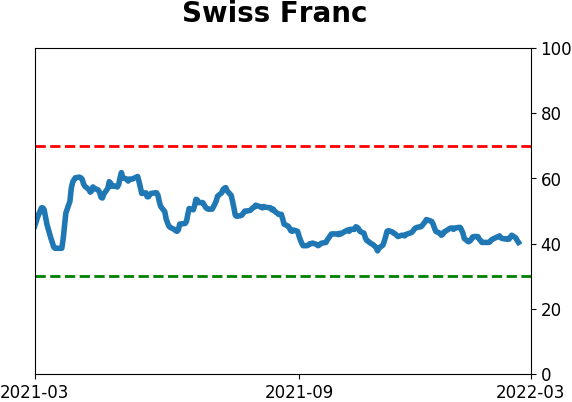
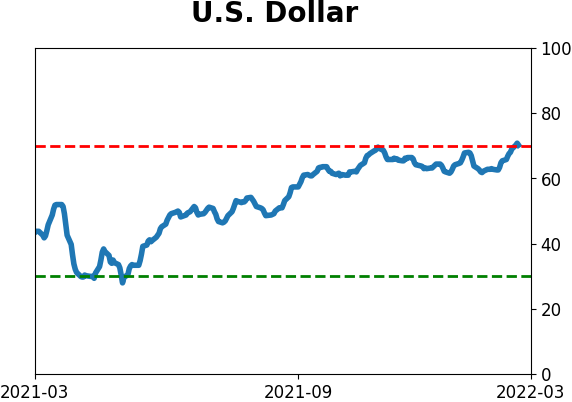
Currency ETF's - 5-Day Moving Average
|
|
|
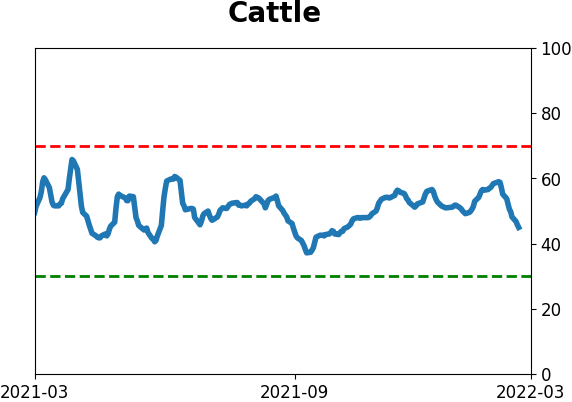
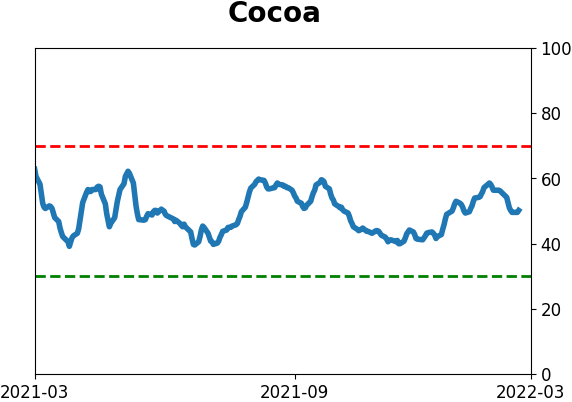
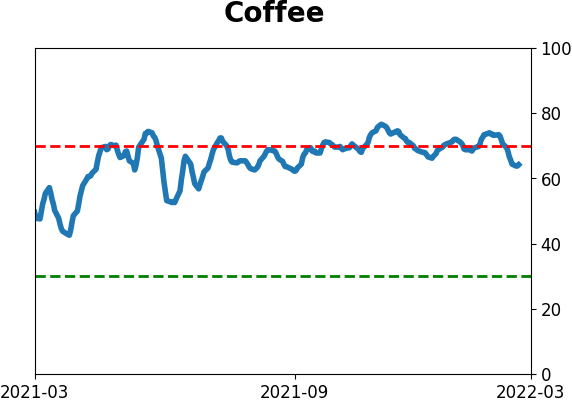
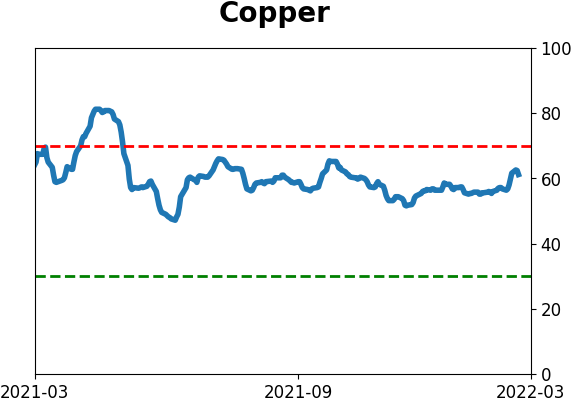
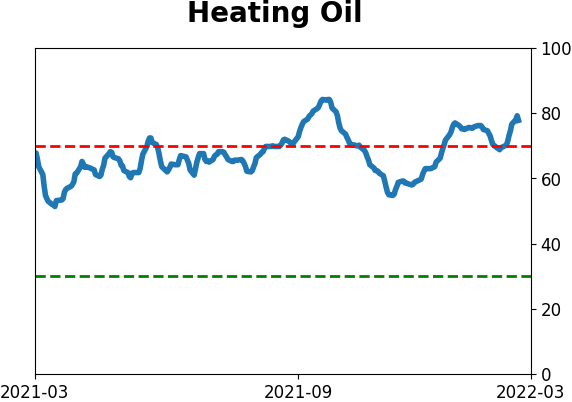
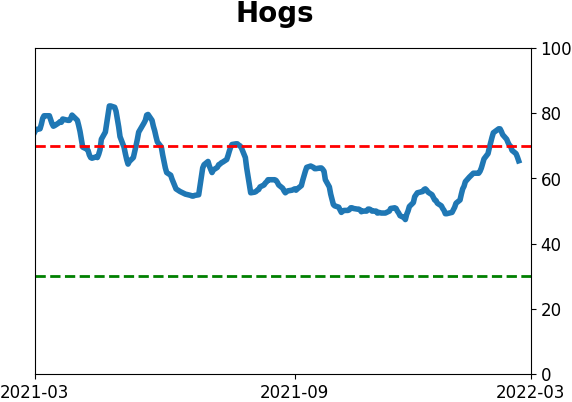
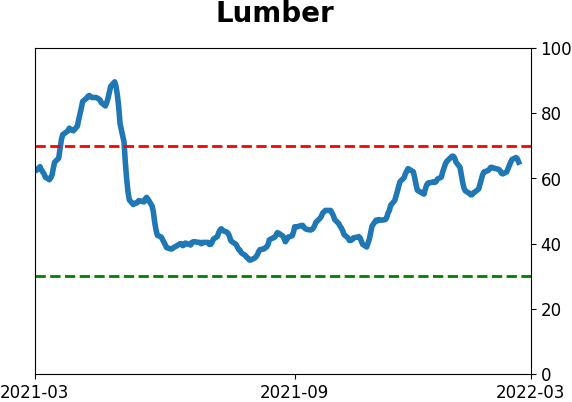
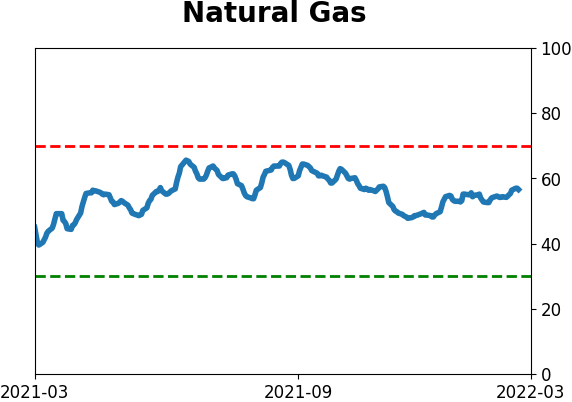
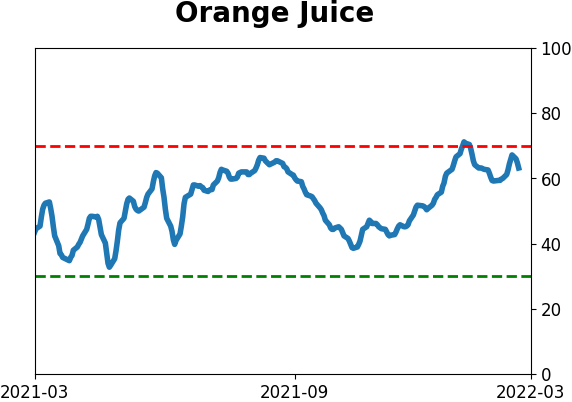
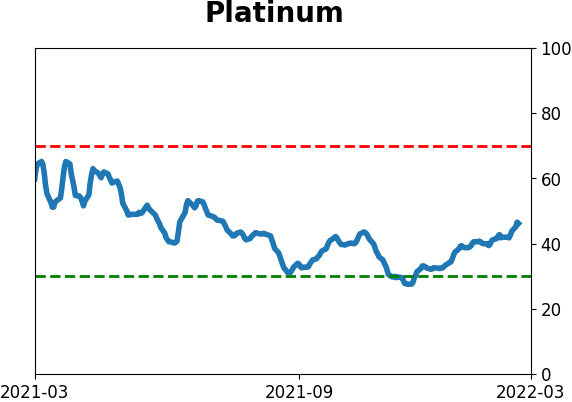
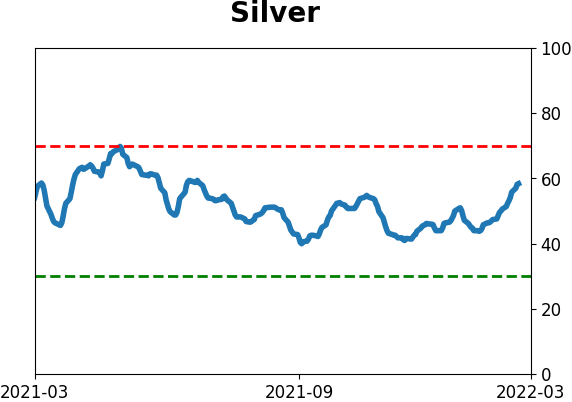
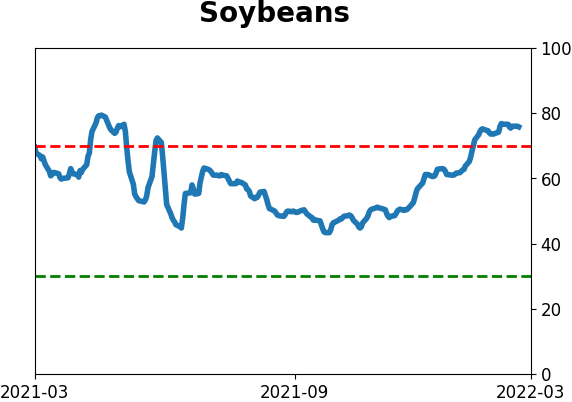
Commodity ETF's - 5-Day Moving Average
|
|