Headlines
|
|
Silver is coiling:
Silver has been trading in a narrowing range over the past several years. A significant trend is likely when it finally breaks out of this range. But getting direction right is challenging. In this piece, we examine a strategy that does not require you to predict direction.
|
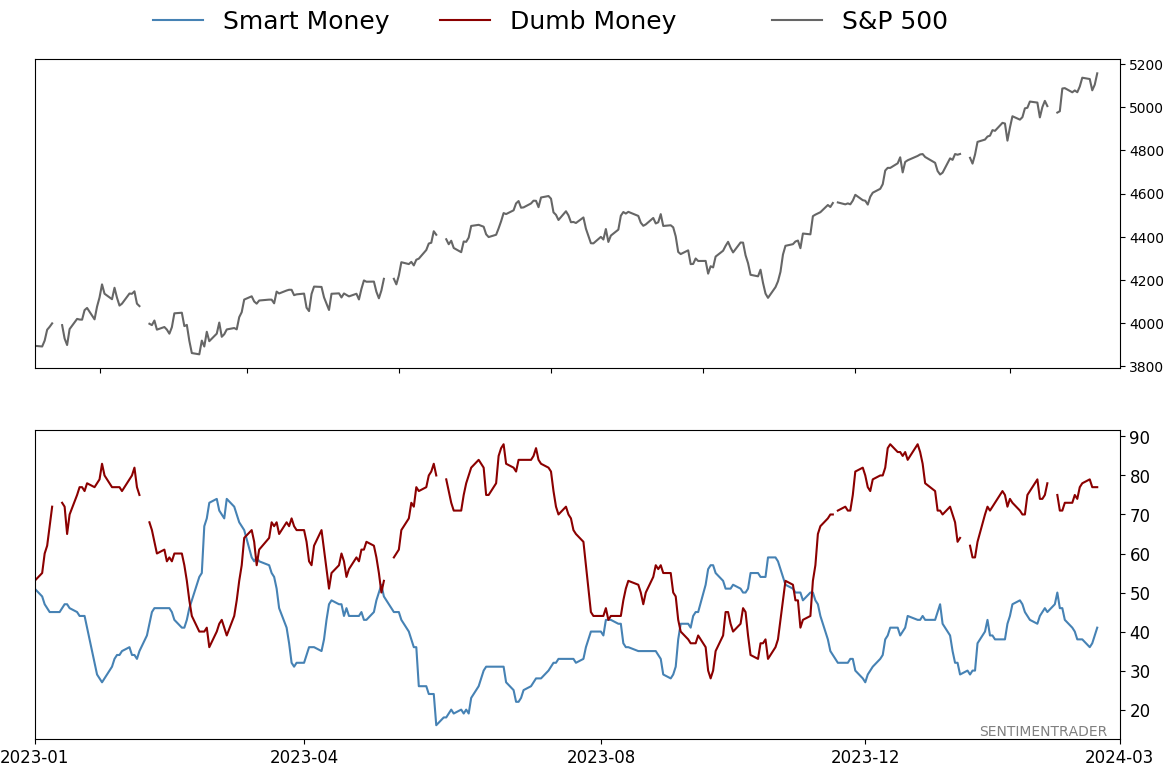
Smart / Dumb Money Confidence
|
Smart Money Confidence: 41%
Dumb Money Confidence: 77%
|
|
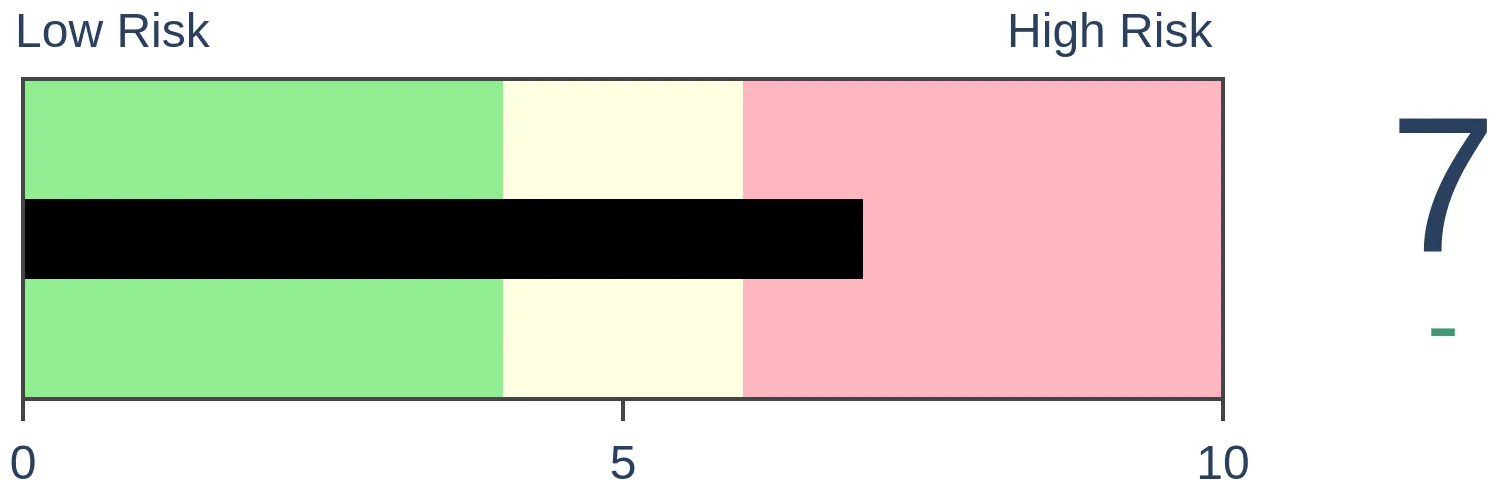
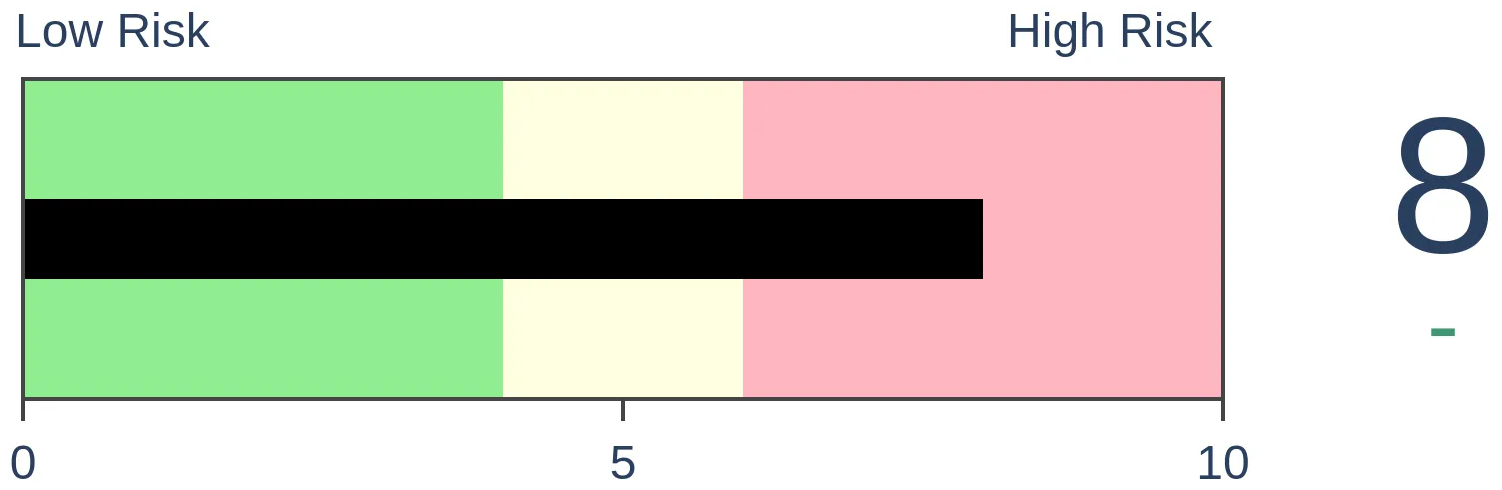
Risk Levels
Stocks Short-Term
|
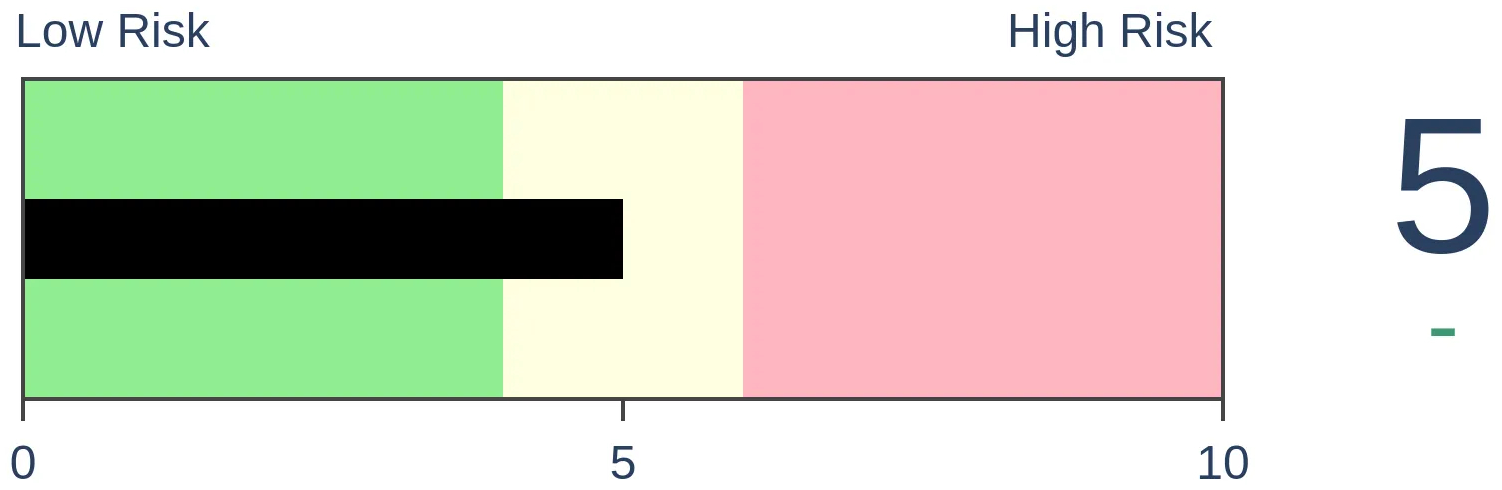
Stocks Medium-Term
|
|
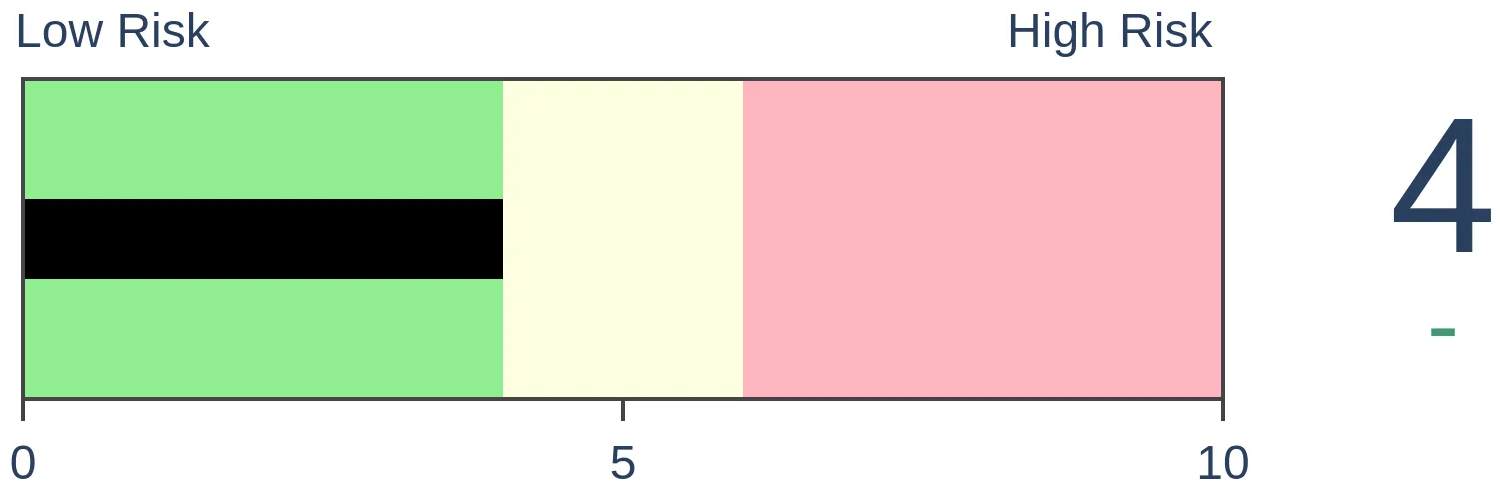
Bonds
|
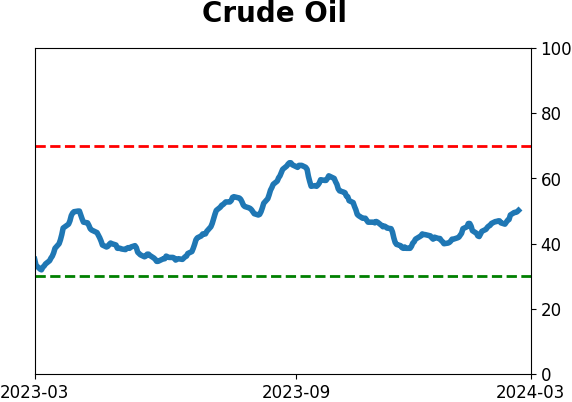
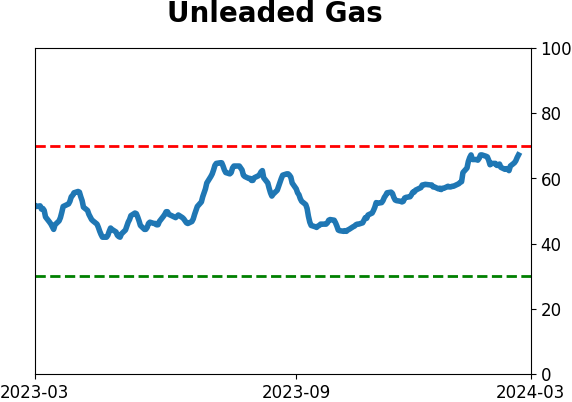
Crude Oil
|
|
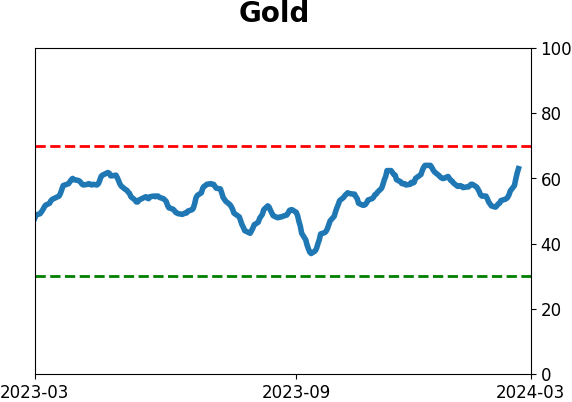
Gold

|
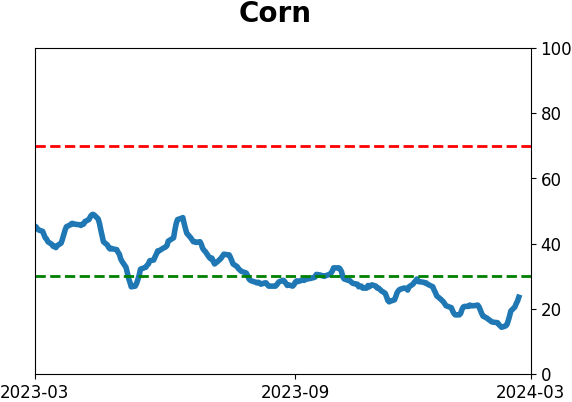
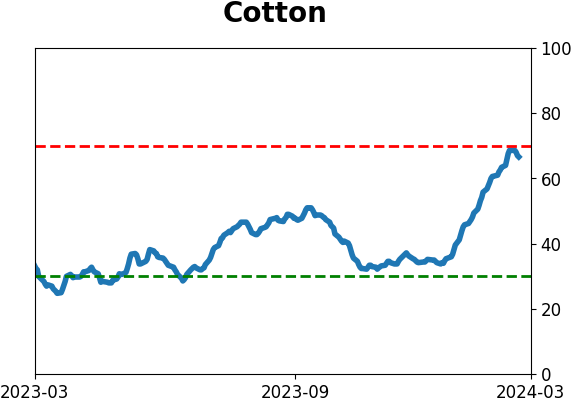
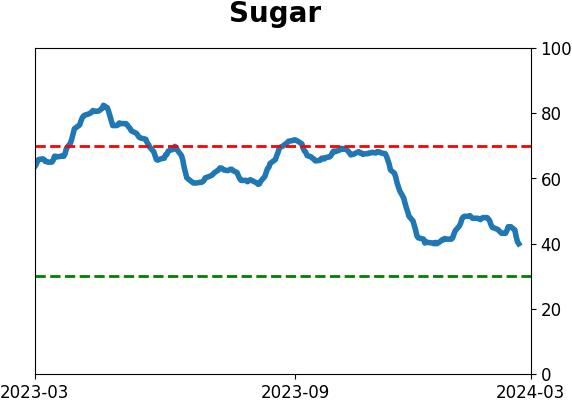
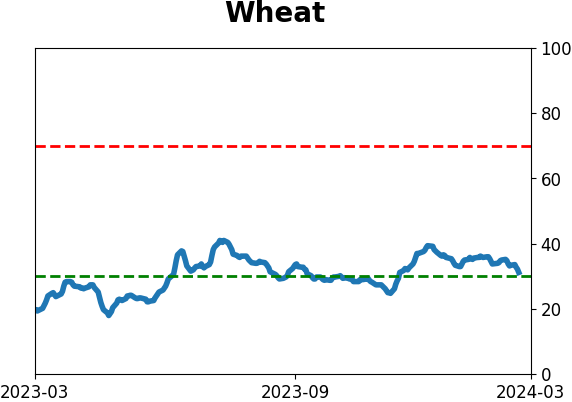
Agriculture

|
|
Research
By Jay Kaeppel
BOTTOM LINE
Silver has been trading in a narrowing range over the past several years. A significant trend is likely when it finally breaks out of this range. But getting direction right is challenging. In this piece, we examine a strategy that does not require you to predict direction.
FORECAST / TIMEFRAME
None
|
Key Points
- Silver is "coiling" on a price chart into an ever-narrower range
- Classic technical analysis suggests that whichever way it ultimately breaks out, it may move hard
- An options straddle is one way to position for a move in either direction
Silver is coiling
The chart below displays a weekly iShares Silver Trust ETF (SLV) bar chart. As you can see, it has been trading in an ever-narrowing range, particularly over the last four years.
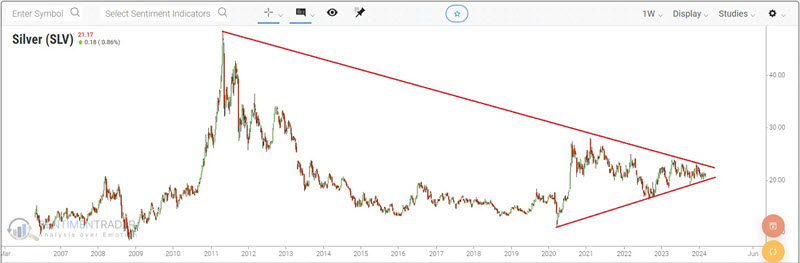
Classic technical analysis suggests that the ultimate price move will be substantial once an asset breaks out of a "coiling" price range. That's the good news. The bad news is that classical technical analysis does not indicate in advance when that breakout will occur or in which direction that ultimate move will be.
Also - to make things interesting - "fake outs" (i.e., a breakout in one direction, followed by a quick reversal decisively in the opposite direction) are not uncommon. As a result, coil patterns can be very frustrating for many individuals to trade. They place their bet in one direction, and the market goes their way briefly, then reverses sharply, leaving them in the dust - and with a loss. A majority of people do not possess the "I must reverse my position quickly" gene (unfortunately, many DO possess the "I can't believe how quickly that reversed - the market hates me" gene).
An options straddle is one way around this problem. Like any strategy, there are pros and cons. Let's look at this strategy applied to the current situation in the silver market.
Position and options straddle
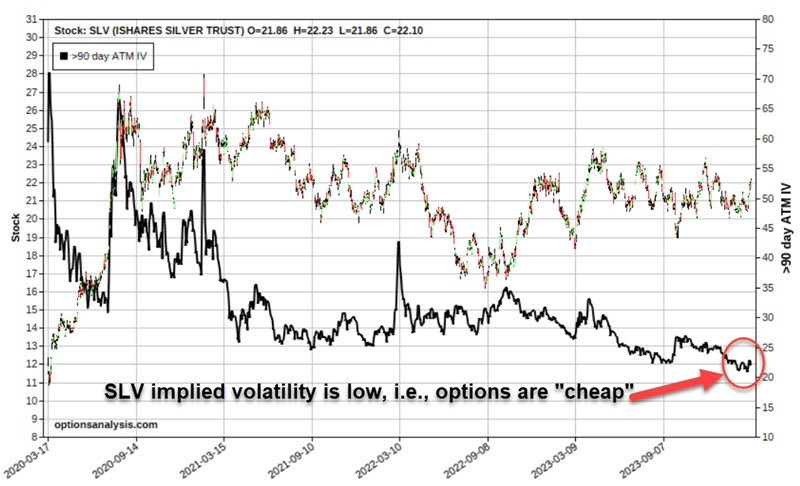
Technically, a "straddle" involves buying a call option and a put option at the same strike price and expiration month. Because you are paying two option premiums instead of one, a straddle is typically best used when options are "cheap," i.e., when they have a relatively low amount of time premium built into their price. We can gauge this by looking at "implied volatility." IV tells us whether the amount of time premium in the options for a given security is at the high end ("expensive options") or low end ("cheap options") of the historical range or somewhere in between.
The chart below (all figures below are courtesy of www.Optionsanalysis.com) displays a price chart for SLV with the average implied volatility for 90+-day options on SLV. As you can see, IV is very close to the low end of the historical range. This suggests that SLV options are "cheap" and that a straddle is an appropriate strategy to consider.
For silver, an example straddle might be:
- Buying 1 SLV Jun21 2024 22 strike price call @ $1.31
- Buying 1 SLV Jun21 2024 22 strike price put @ $0.89
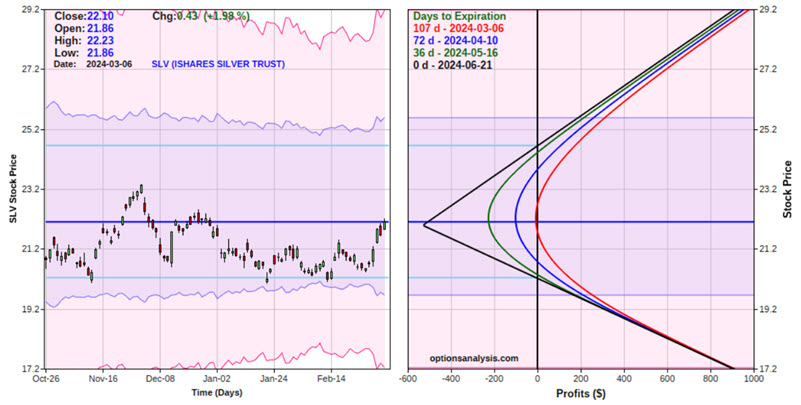
The figure below displays the particulars, and the chart below displays the risk curves (i.e., the expected $ return as of a given price for SLV shares and a given date).
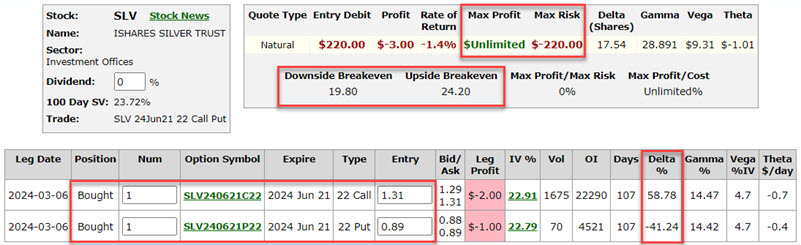
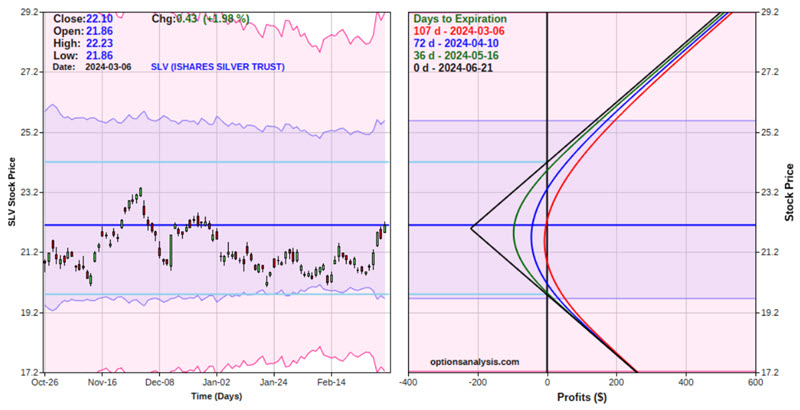
The implication is pretty straightforward:
- If SLV breaks out and runs in either direction (before the June 21st option expiration), unlimited profits can accrue
- If SLV remains between the breakeven prices of $19.80 and $24.20, the trade will lose money
Making the position "Delta Neutral"
The "Delta" for any option or option position is roughly the stock equivalent position. A long call position has a positive delta, and a long-put position has a negative delta. In the 1-lot position above, the call option has a delta of 58.78, and the put has a delta of -41.24. Therefore, the combined straddle has a net delta of 17.54, i.e., a slight bias to the upside.
Some option traders will attempt to craft a position as close to a net delta of 0 for a straddle as possible. Using the same options, we could get closer to delta neutral by:
- Buying 2 SLV Jun21 2024 22 strike price call @ $1.31
- Buying 3 SLV Jun21 2024 22 strike price put @ $0.89
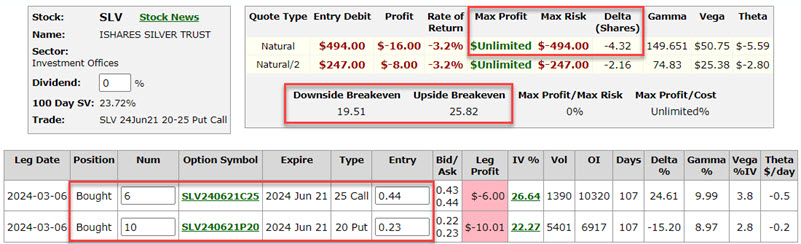
This creates a position with a net delta of -6.15. The particulars and risk curves for this position appear below.
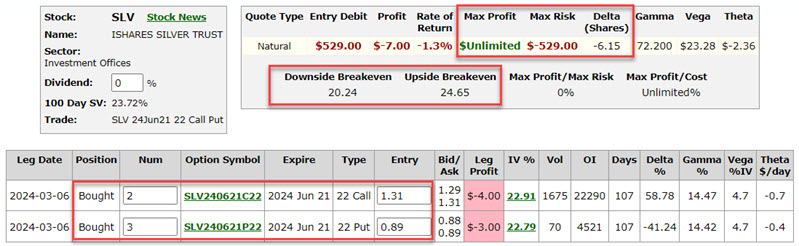
The cost to enter this 2x3 position is $529, and the breakeven prices are $20.24 and $24.65 (if held until expiration, SLV must be outside of this range for the straddle to show a profit).
For a trader who wants to bet on silver breaking out of a narrow range sometime in the next three-plus months, this is one way to do it. Remember that this position will likely lose money if there is no breakout during that limited time window.
Betting on a massive move with an options strangle
An options strangle involves buying a call option and a put option at different strike prices but the same expiration month. For silver, an example might be:
- Buying 6 SLV Jun21 2024 25 strike price calls @ $0.44
- Buying 10 SLV Jun21 2024 20 strike price put @ $0.23
The particulars and risk curves for this position appear below. Note that this position has a net delta of -4.32.
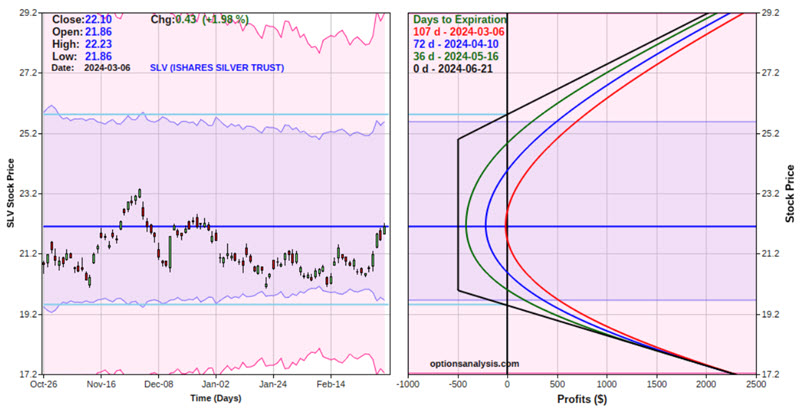
The cost to enter this 6x10 position is $494, and the breakeven prices are $19.51 and $25.82 (i.e., this position requires SLV to make a substantial price move to profit).
This is a more speculative position than the straddle example above. The tradeoff is higher profit potential. To illustrate this, the chart below displays the risk curves for the straddle and strangle examples together as of the option's expiration date in June 2024.
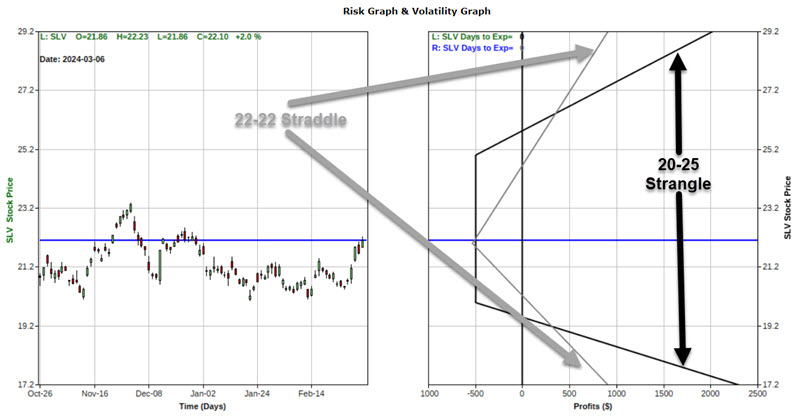
The tradeoffs:
The straddle would only experience a maximum loss of -$529 if SLV closed exactly at $22 a share on options expiration day; The strangle would experience a maximum loss of -$494 if SLV closed on expiration day at any price between $20 and $25 a share. In other words, the danger of experiencing the maximum loss is significantly higher with the strangle.
That said, the profit potential for the strangle position is significantly greater than that of the straddle position. For example, if SLV were to rally to $27.20 by expiration:
- The 20-25 strangle would show a profit of roughly $2,026
- The 22-22 strangle would show a profit of approximately $911
Conversely, if SLV were to plunge to $17.20 by expiration:
- The 20-25 strangle would show a profit of roughly $2,266
- The 22-22 strangle would show a profit of approximately $875
So, the bottom line is that a trader must decide how to balance the risk of loss versus the potential to maximize profit.
What the research tells us...
Straddles and strangles must be considered as strictly "speculative" positions. They are a bet that a given security will move by at least a certain amount within a given period. Whether a trader chooses to trade a straddle or a strangle (and whether or not to make the position as close to delta-neutral as possible) is up to each individual.
Indicators at Extremes
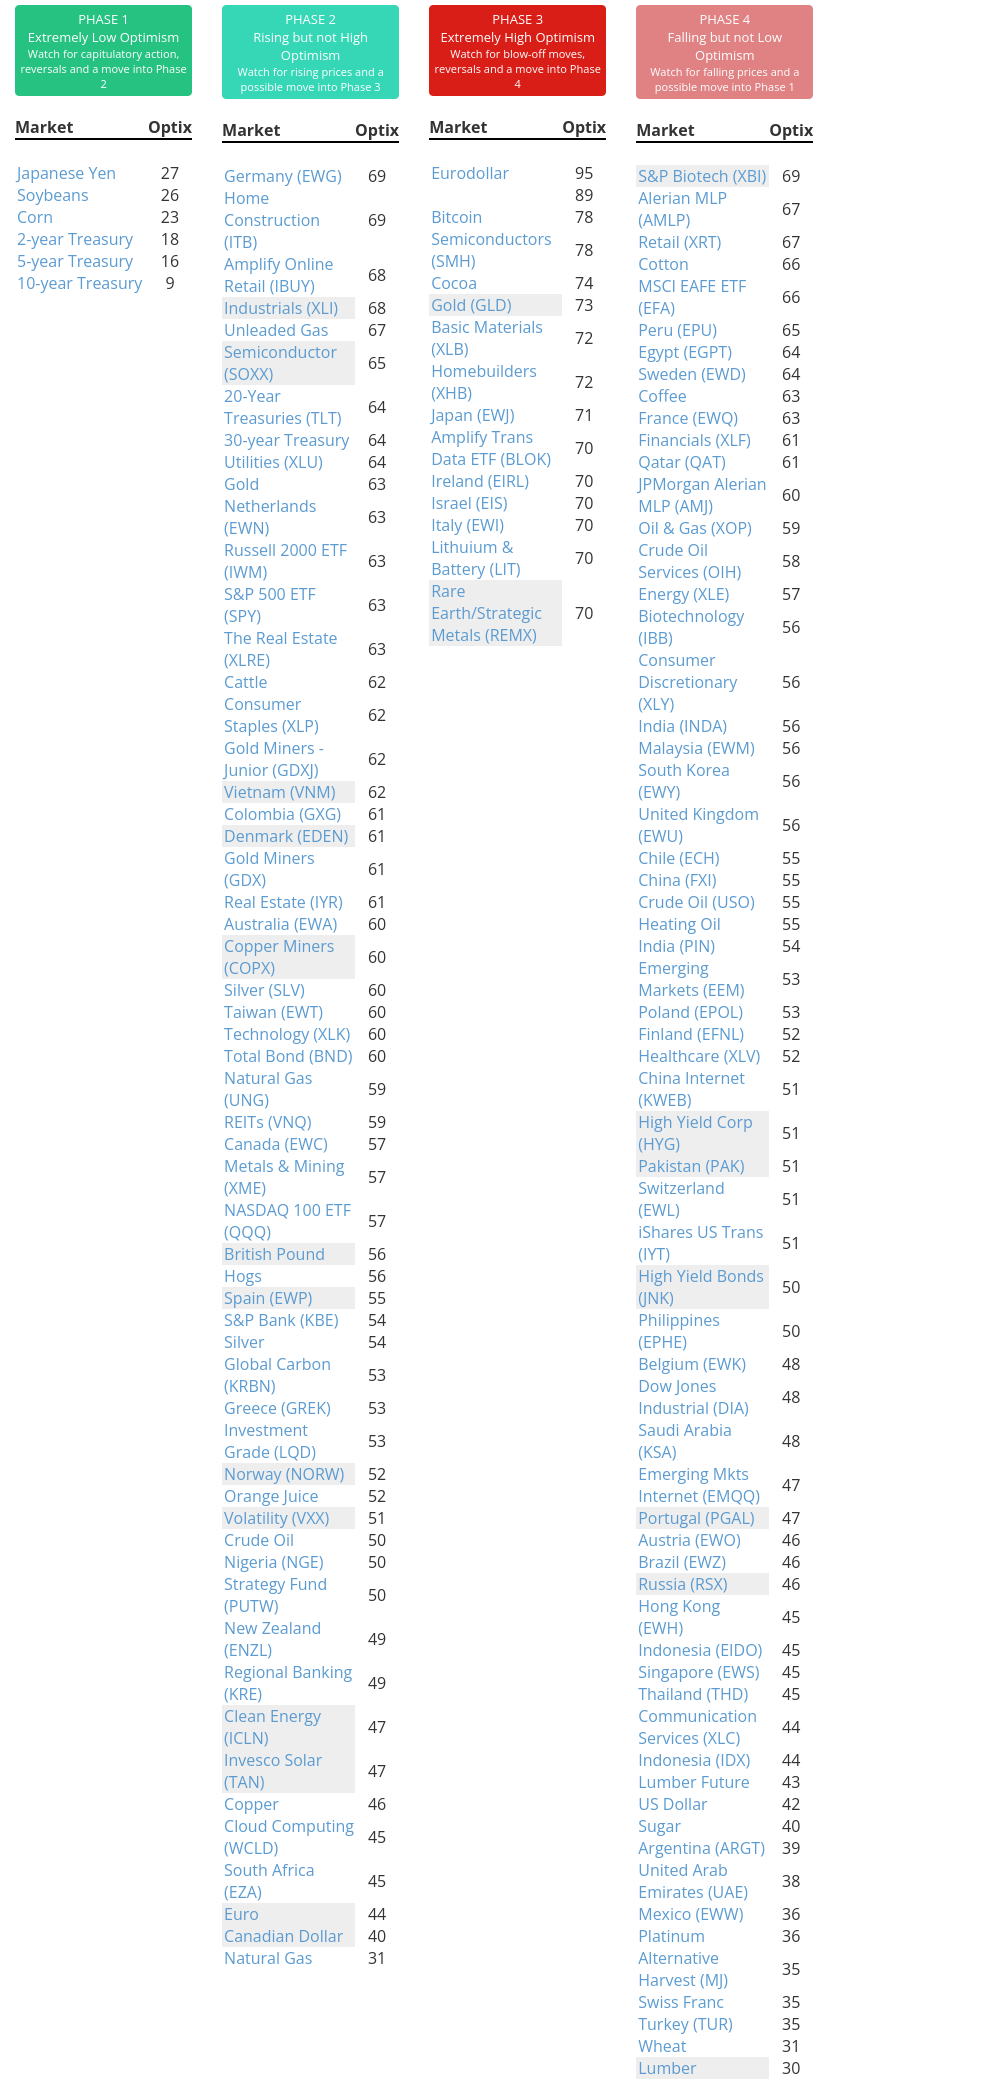
Phase Table
Ranks
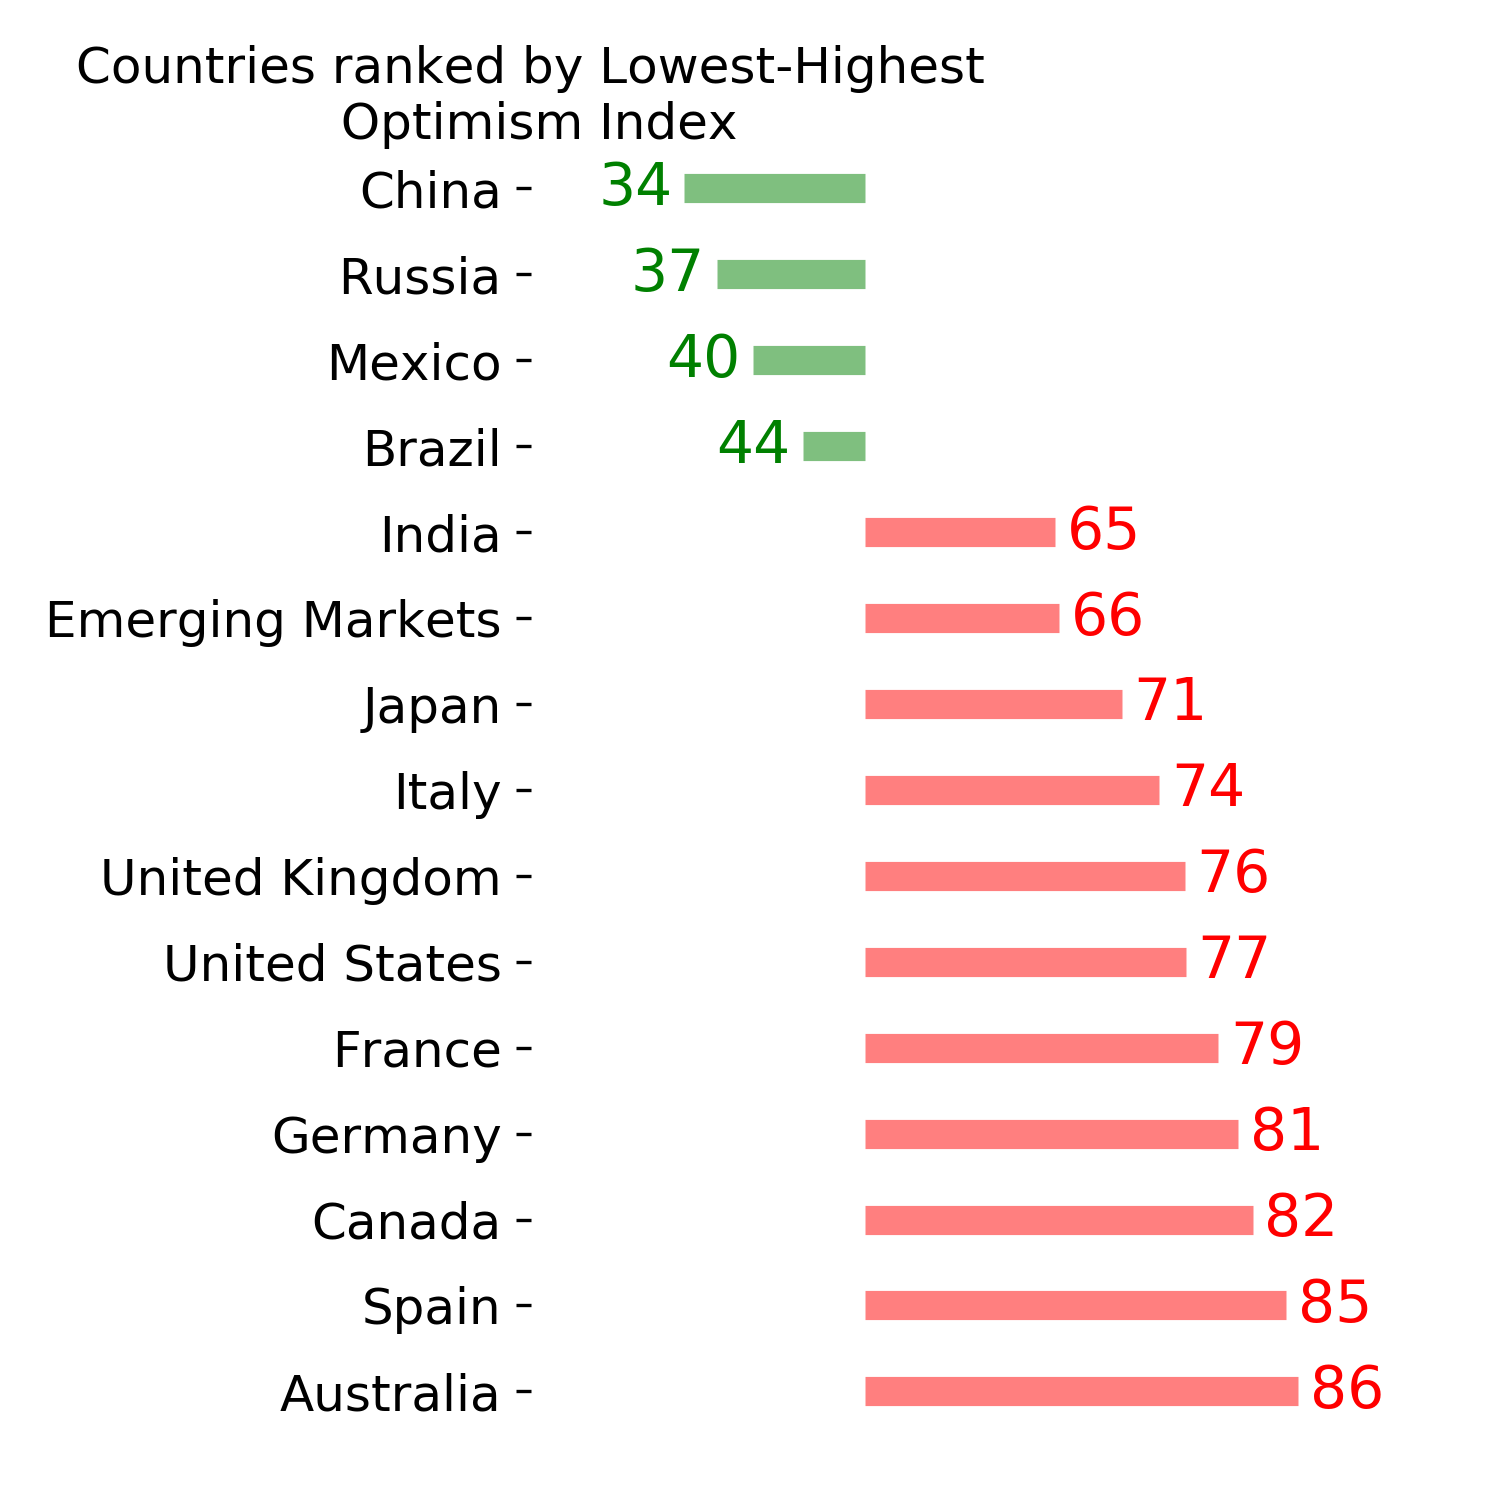
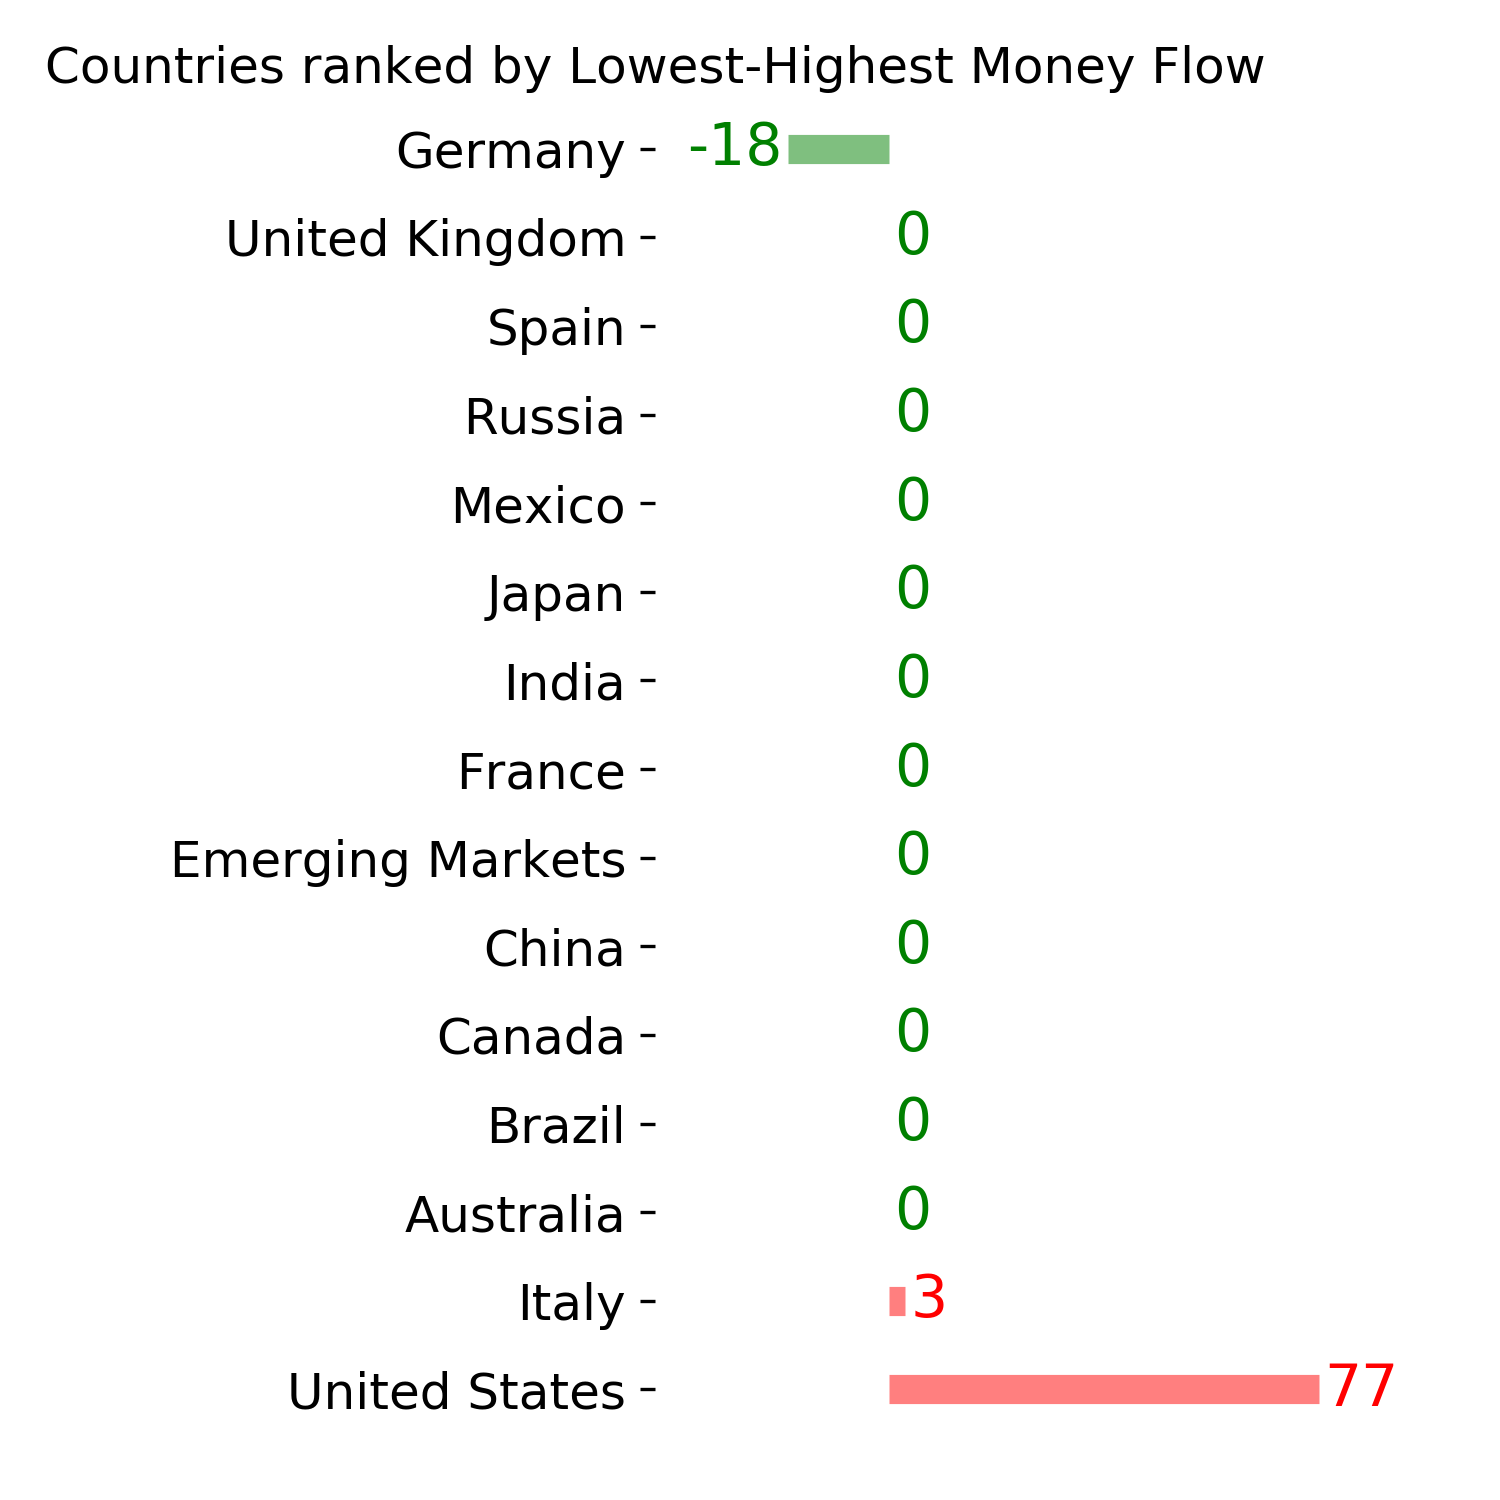
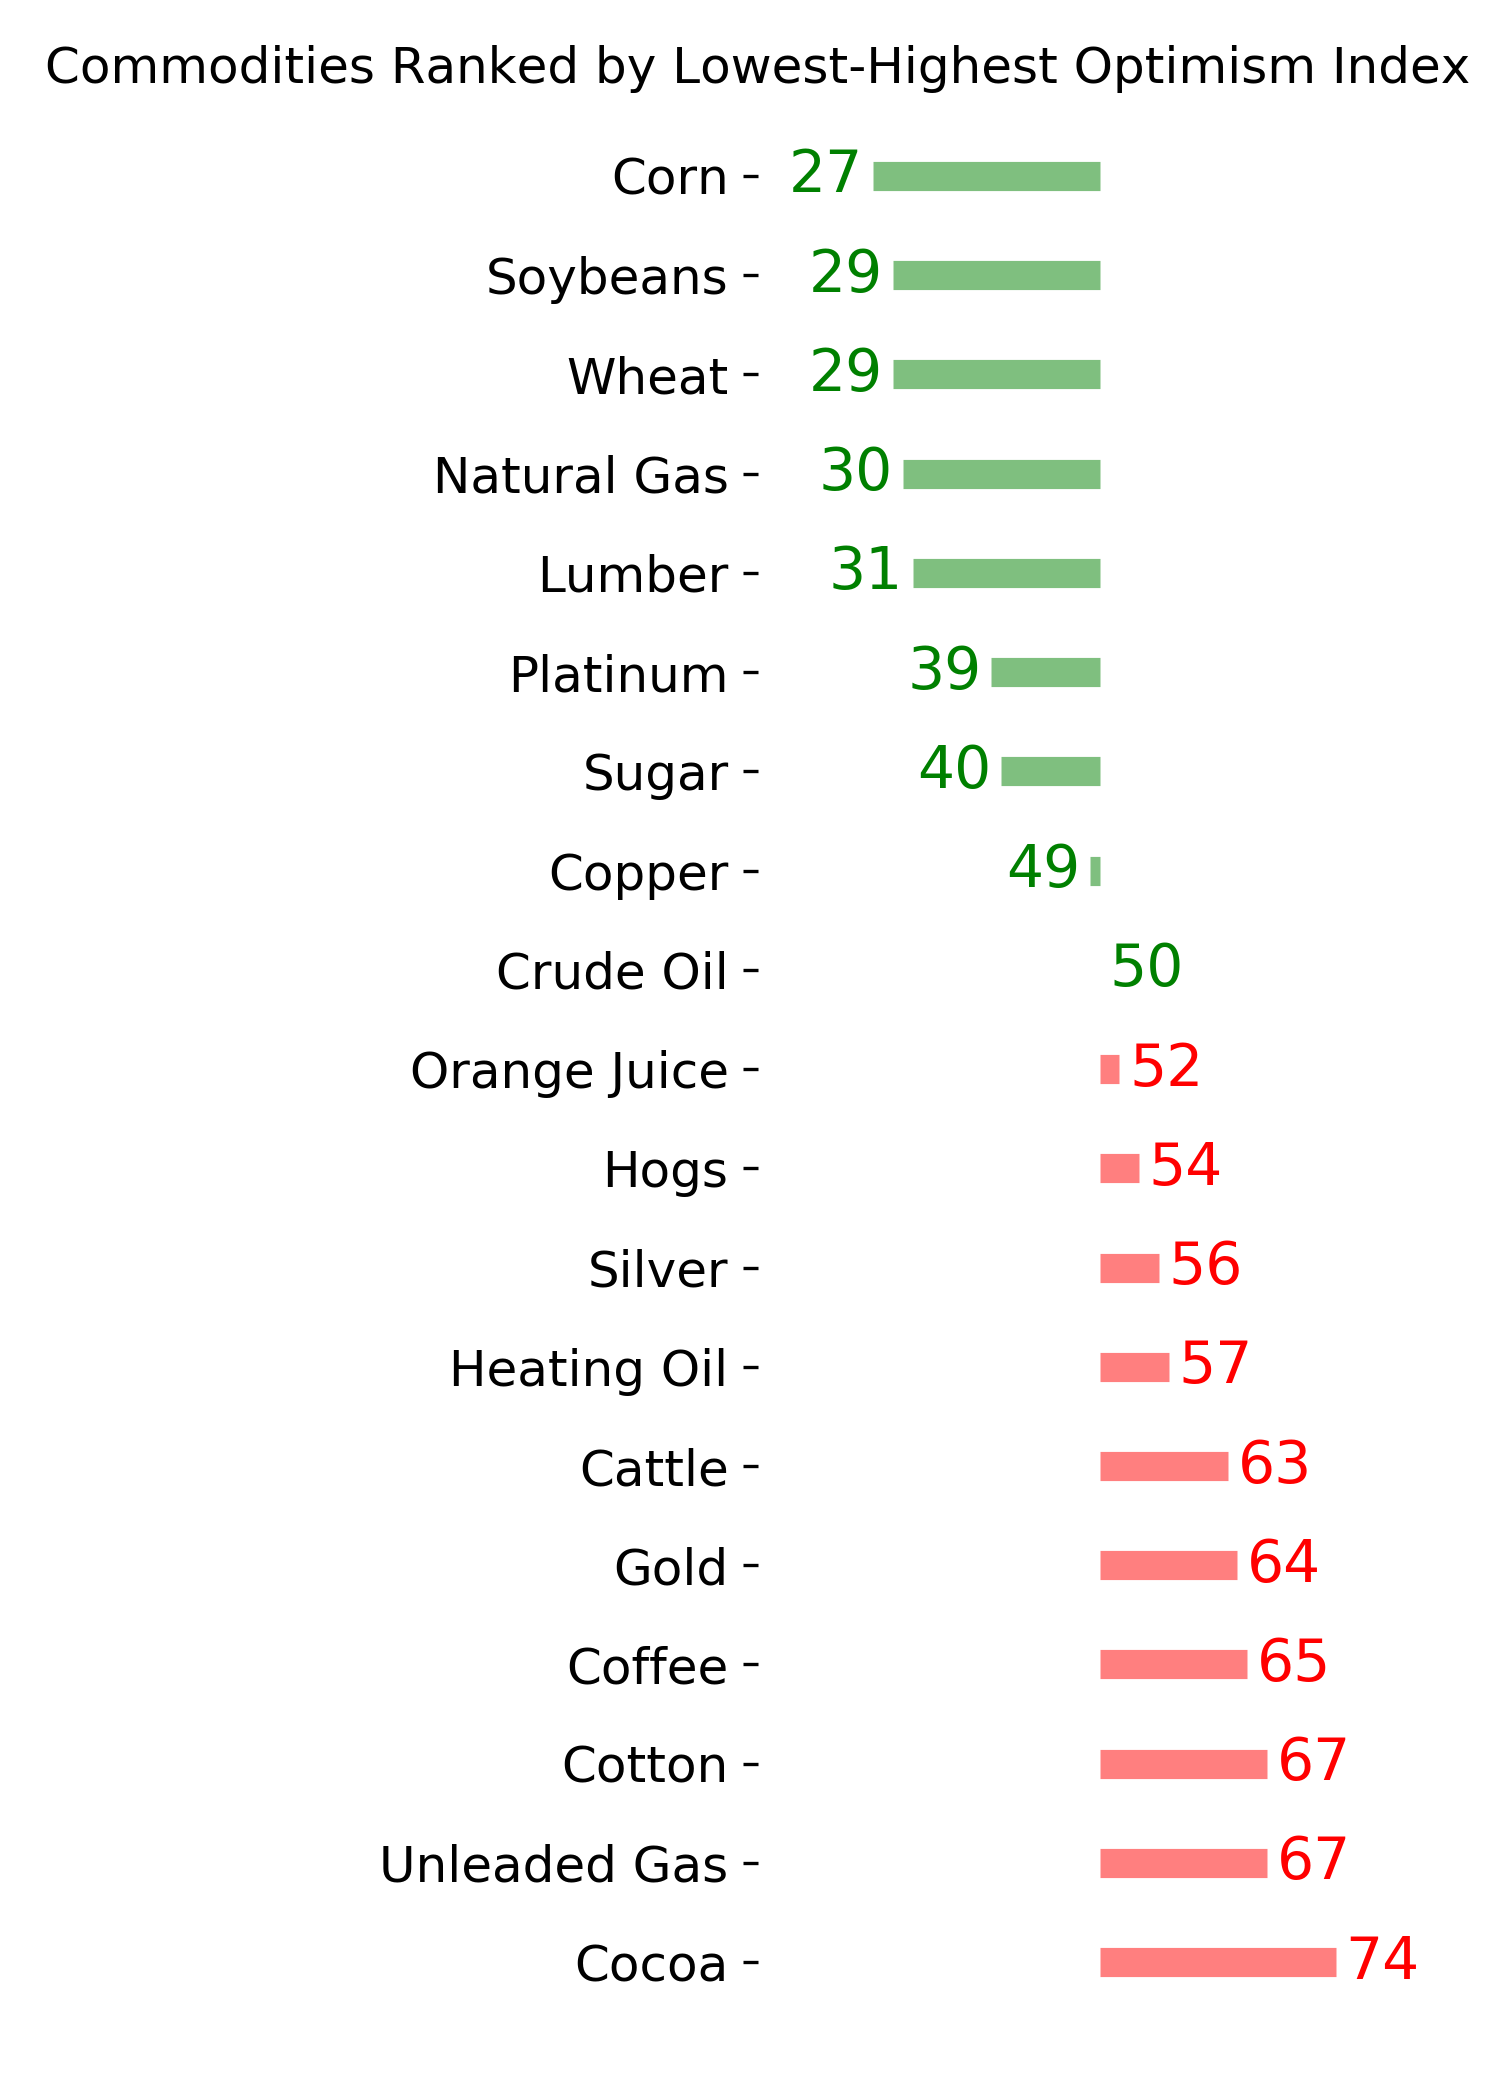
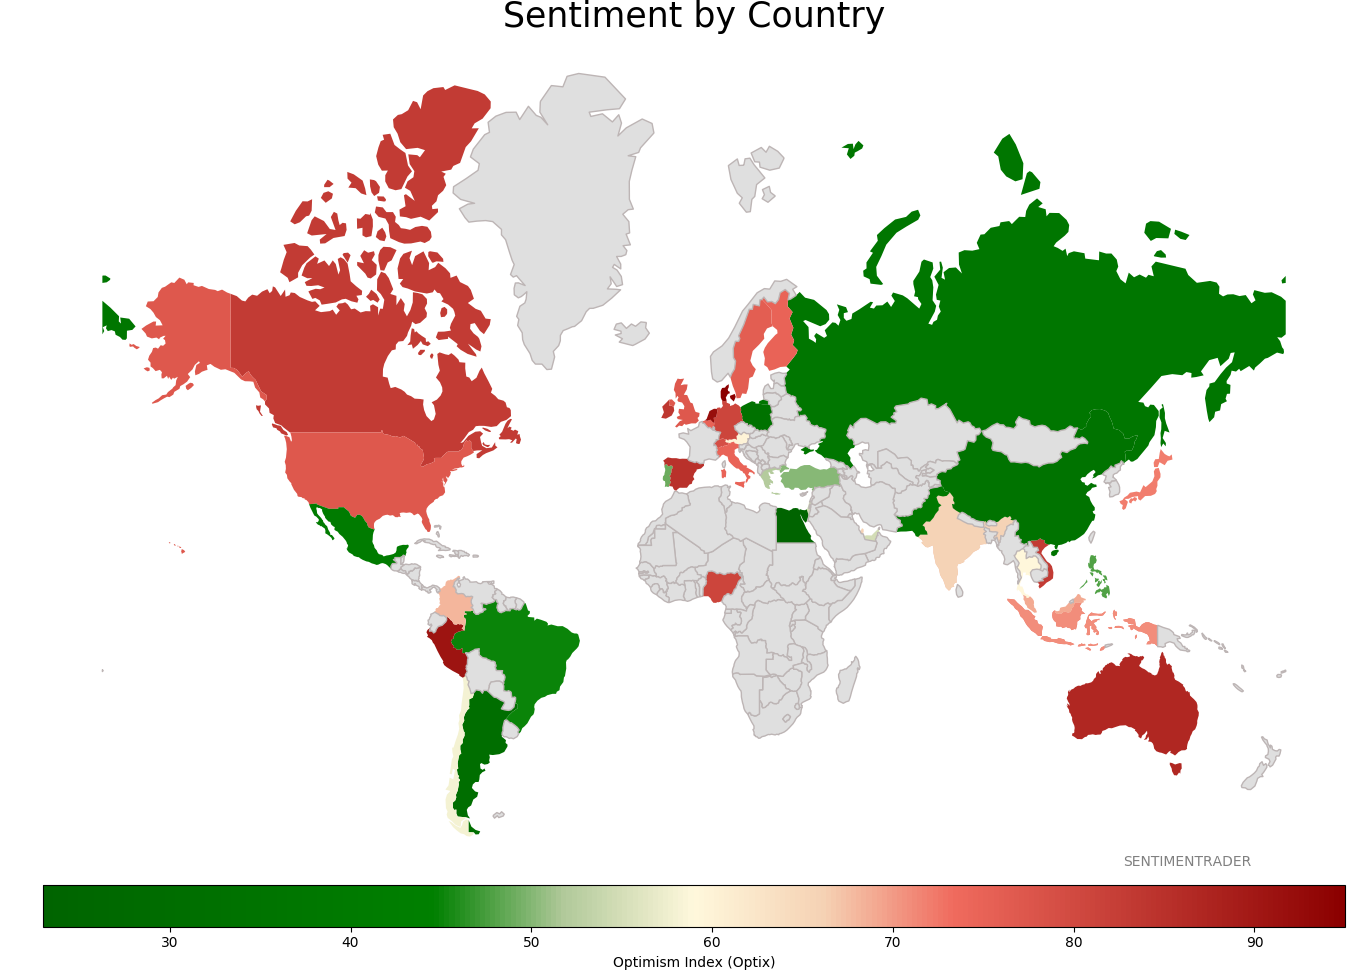
Sentiment Around The World
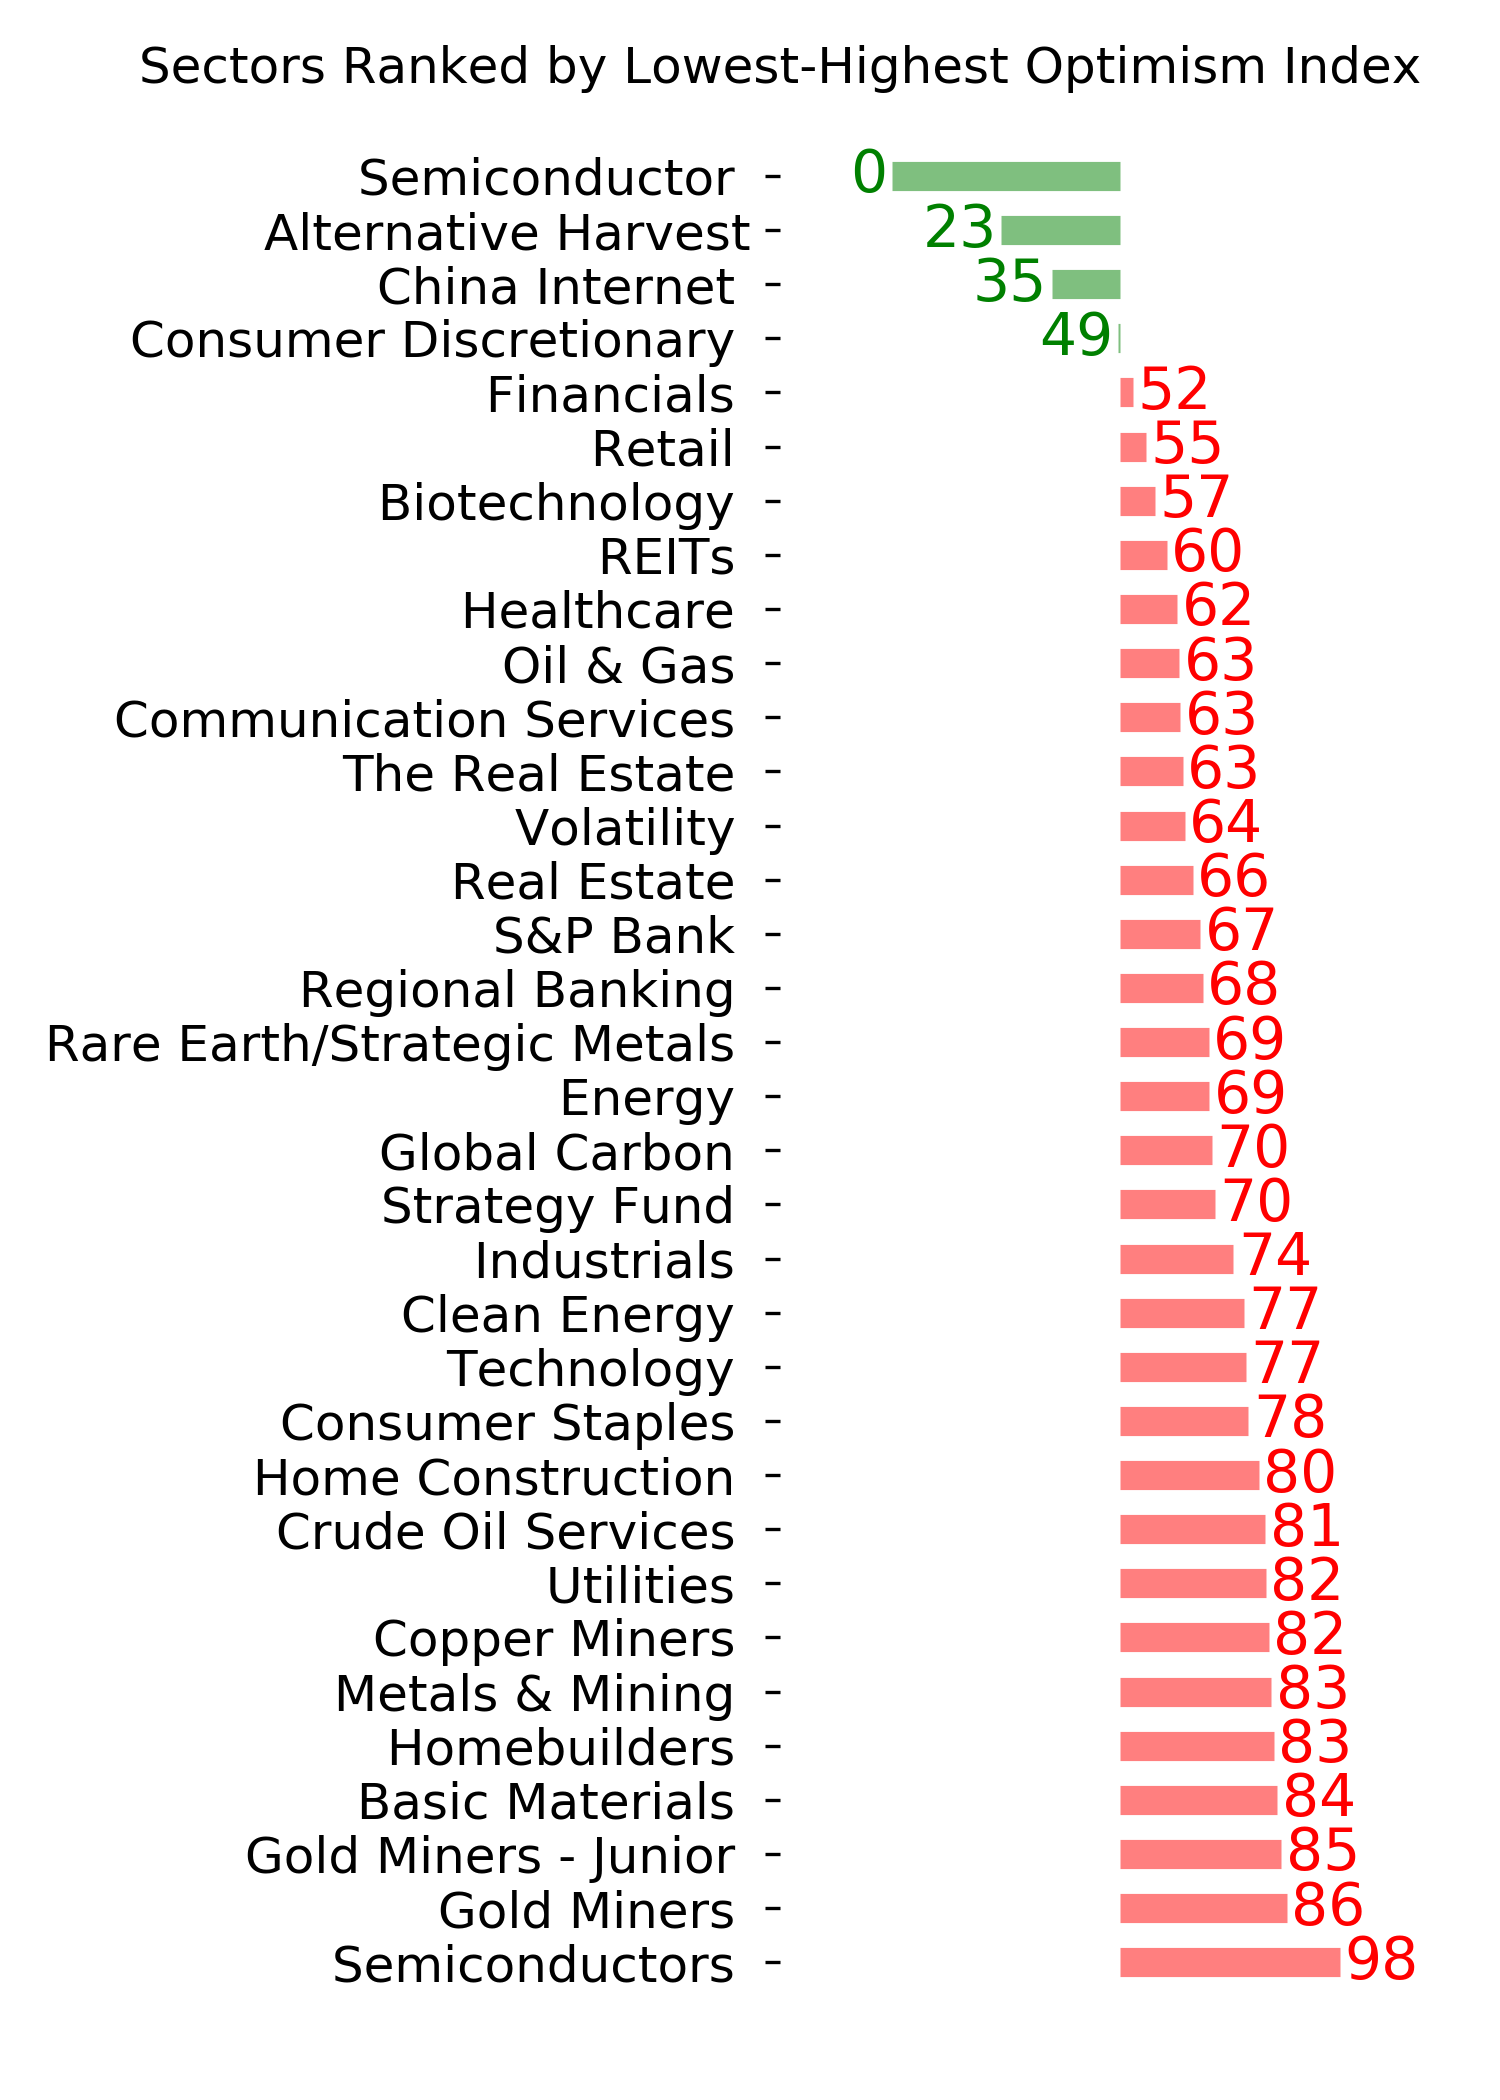
Optimism Index Thumbnails
|
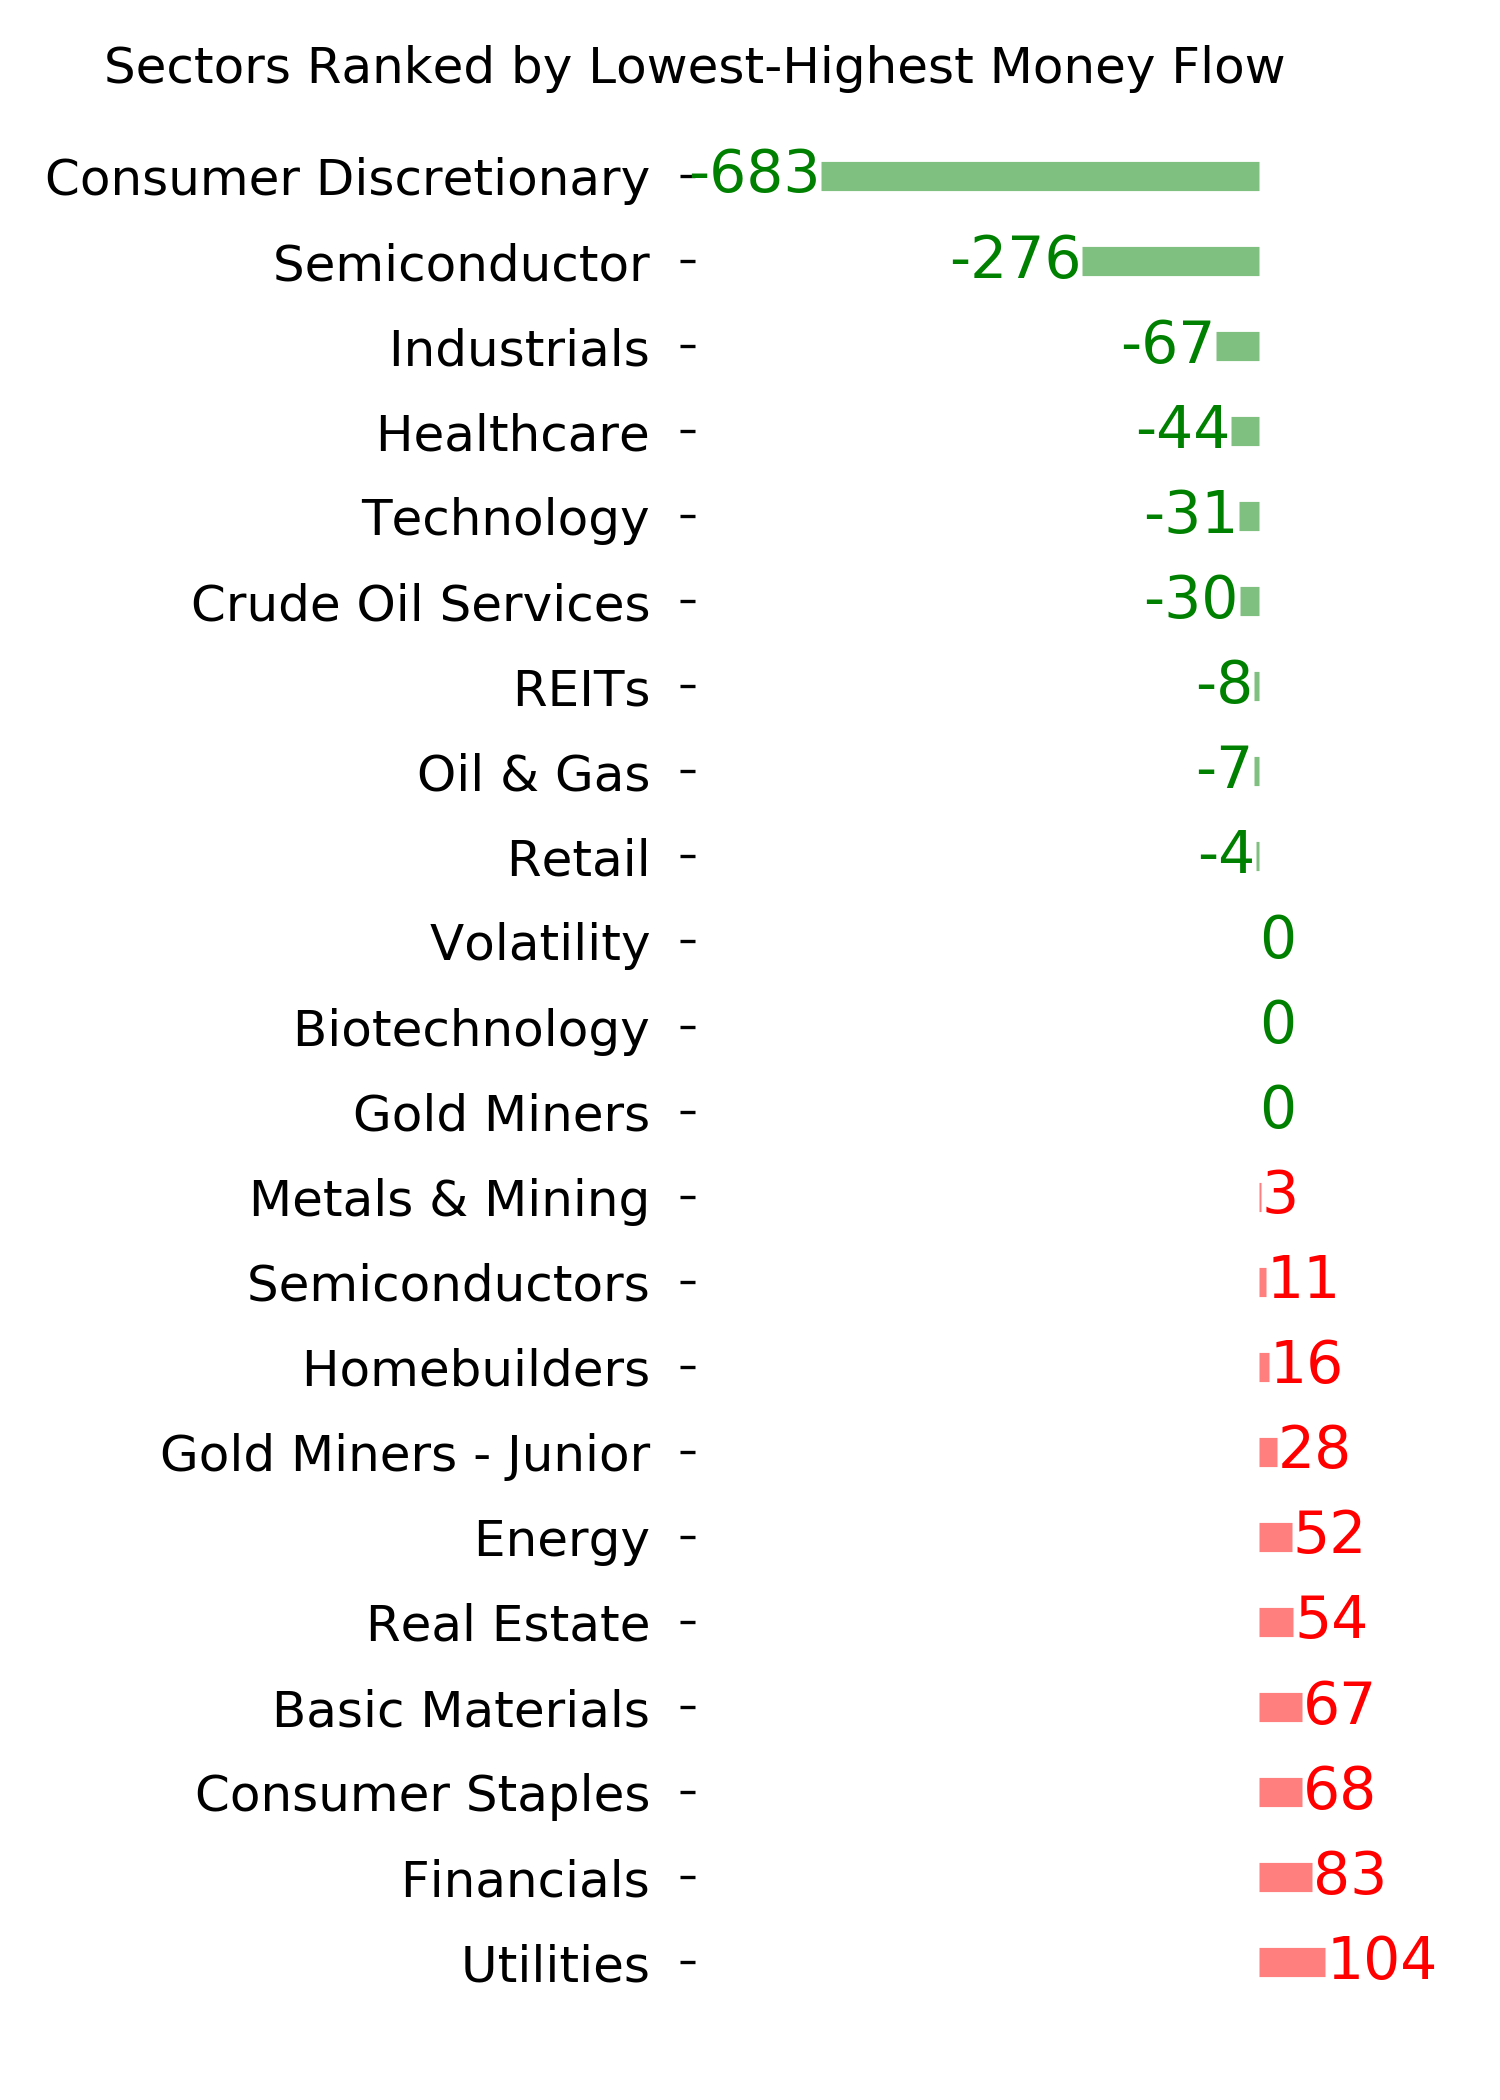
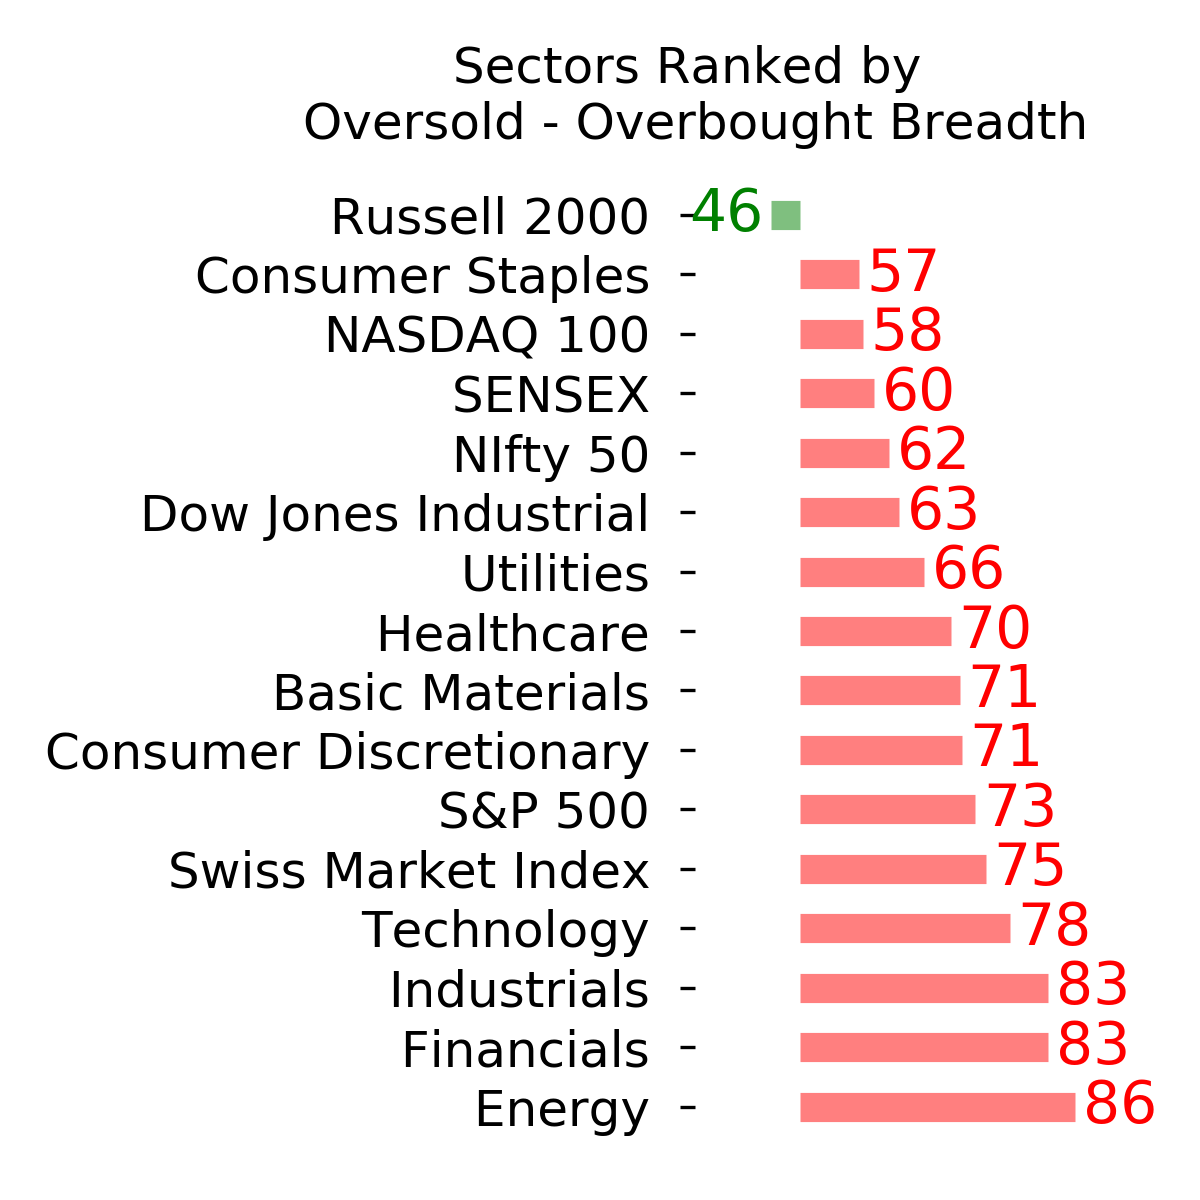
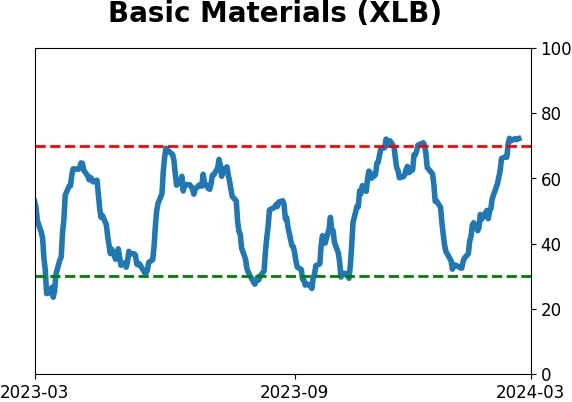
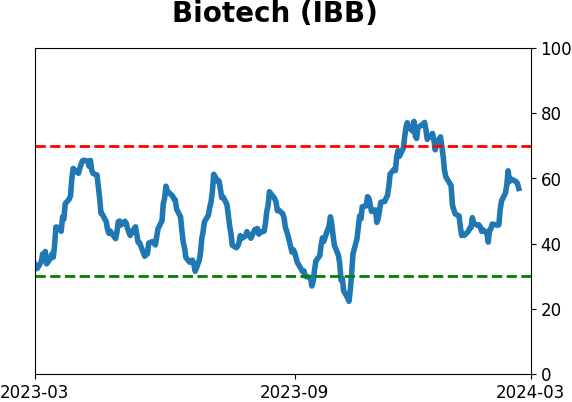
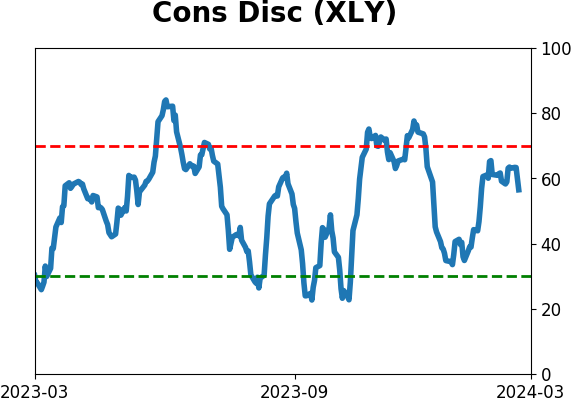
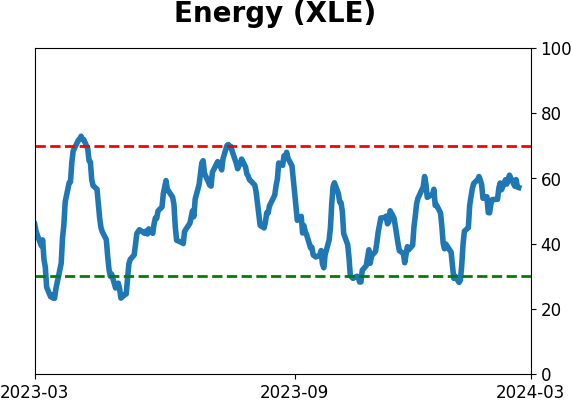
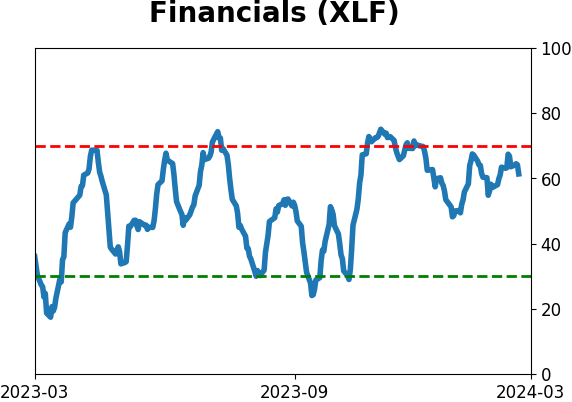
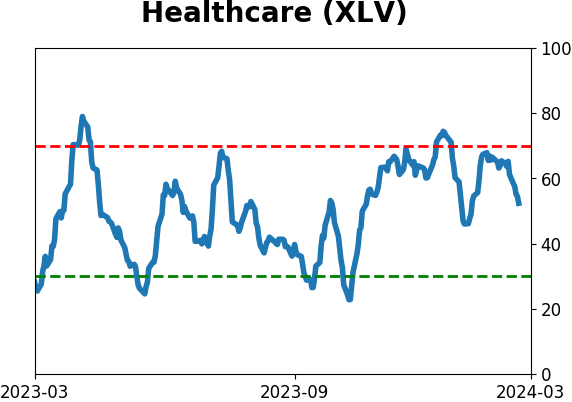
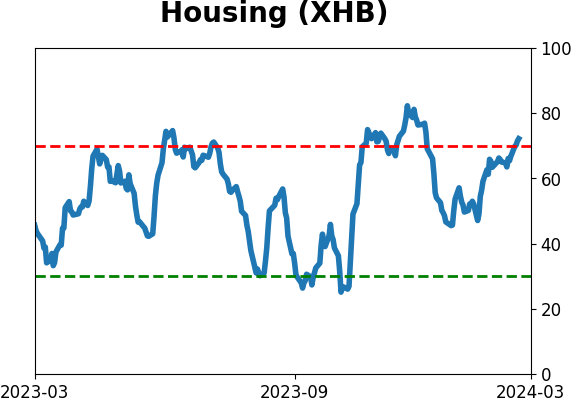
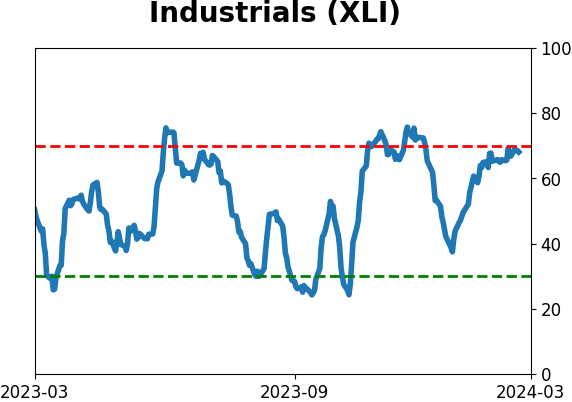
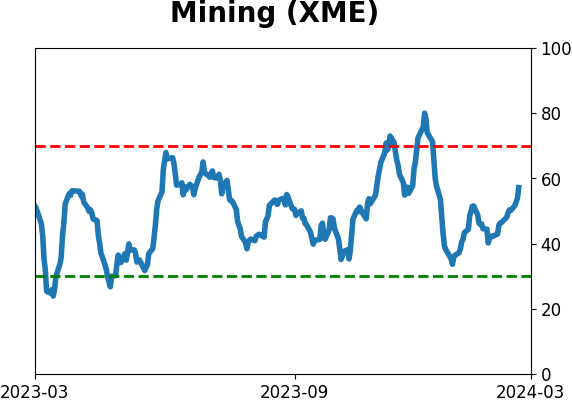
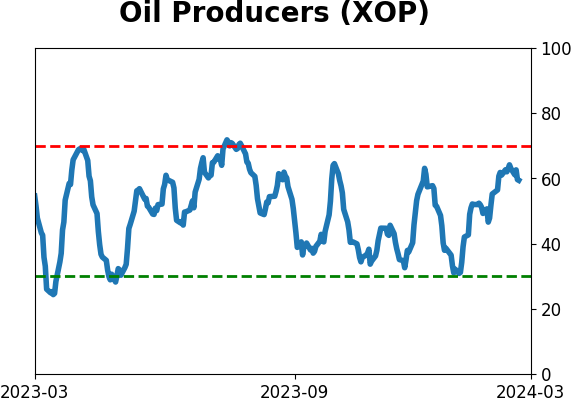
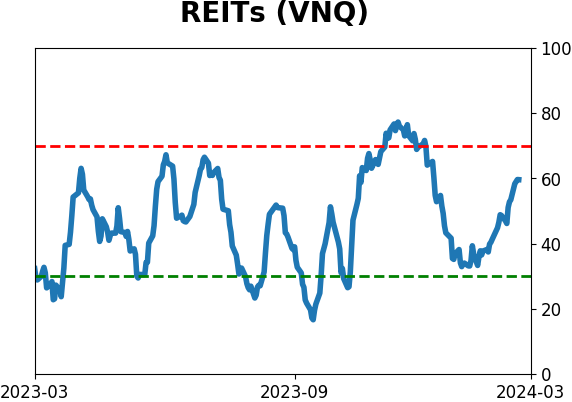
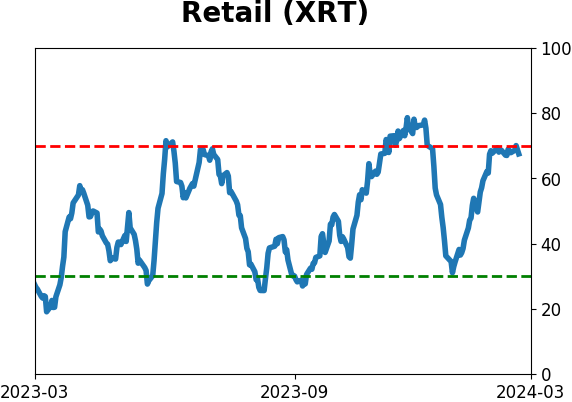
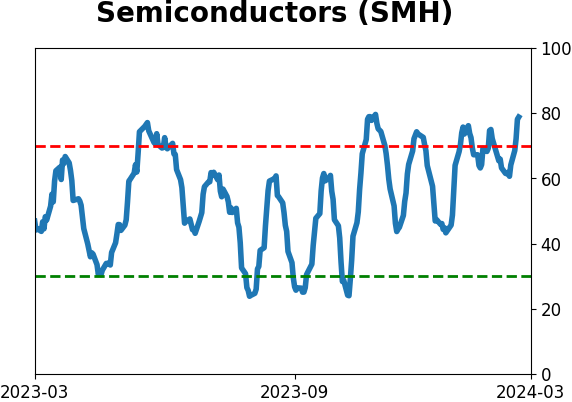
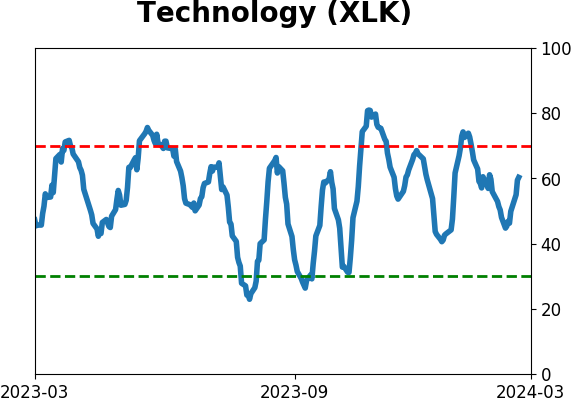
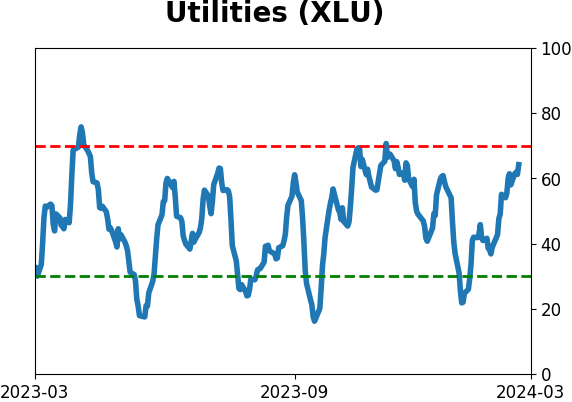
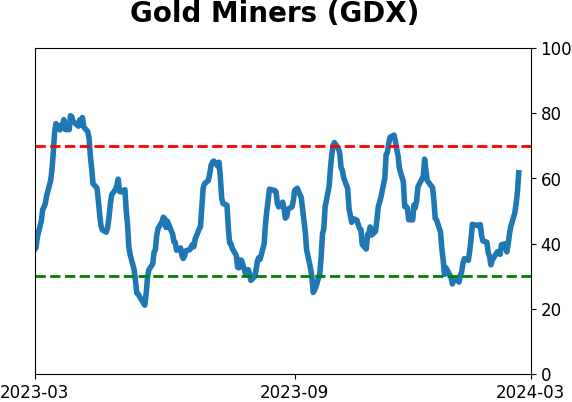
Sector ETF's - 10-Day Moving Average
|
|
|
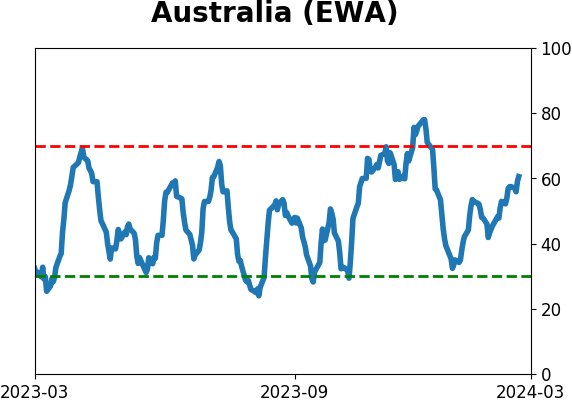
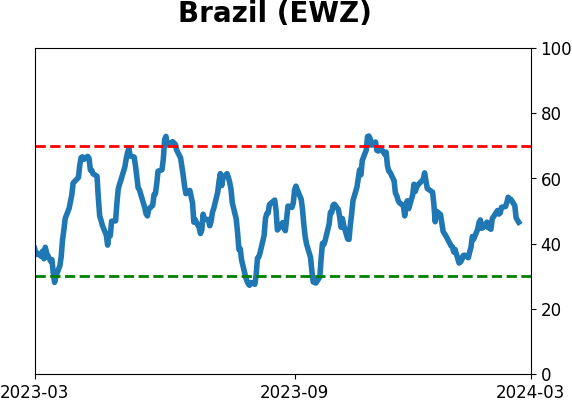
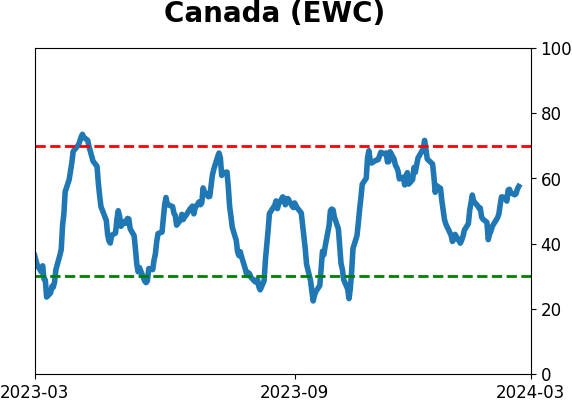
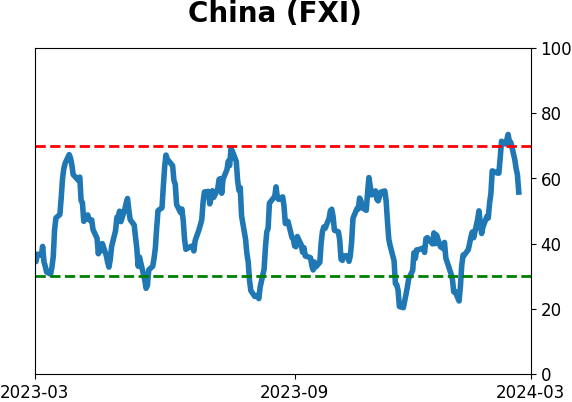
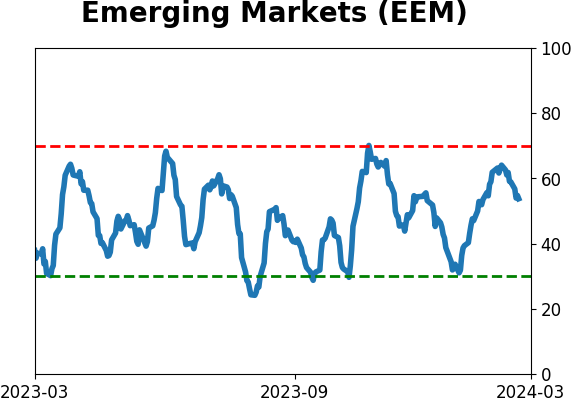
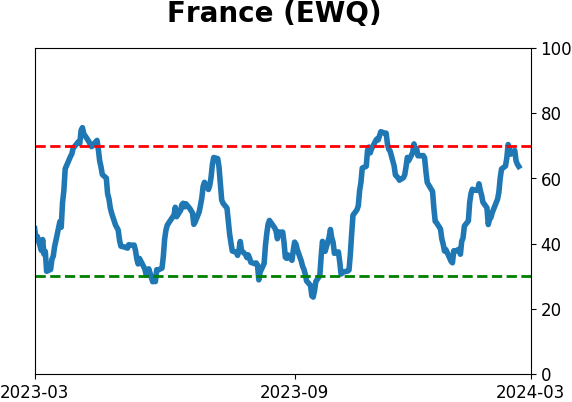
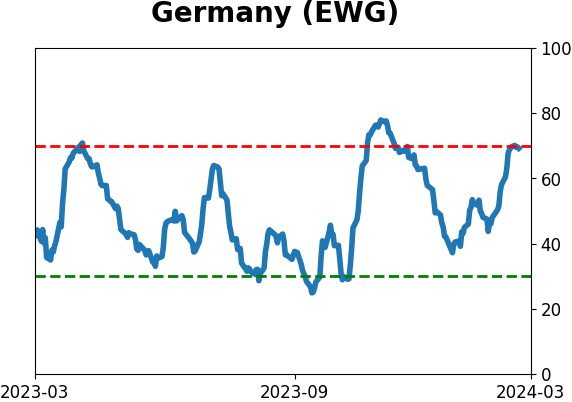
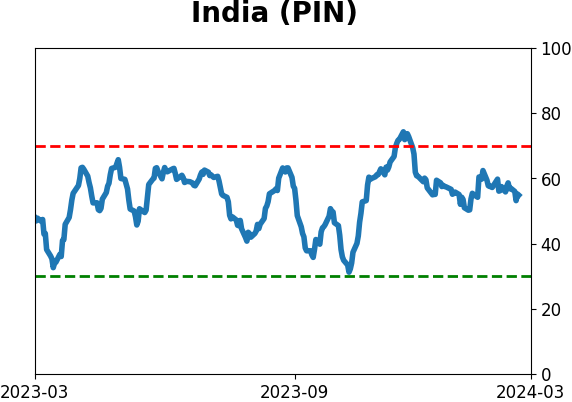
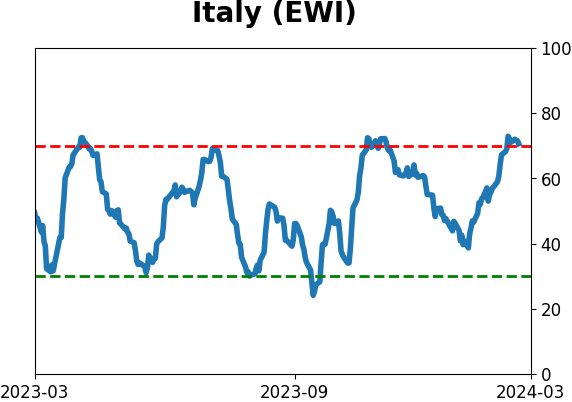
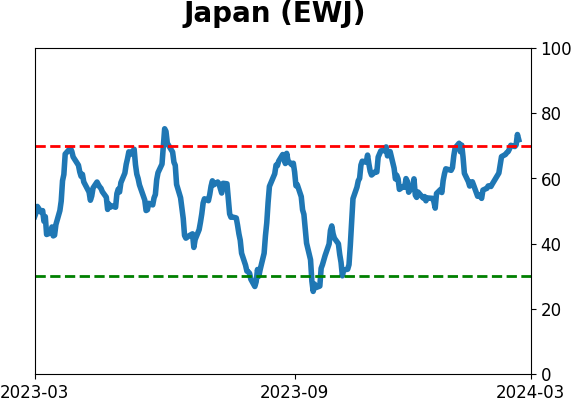
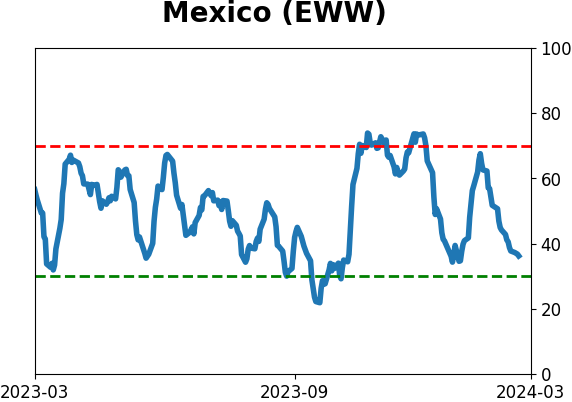
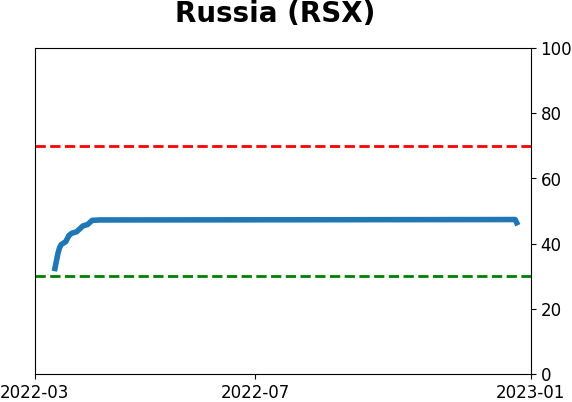
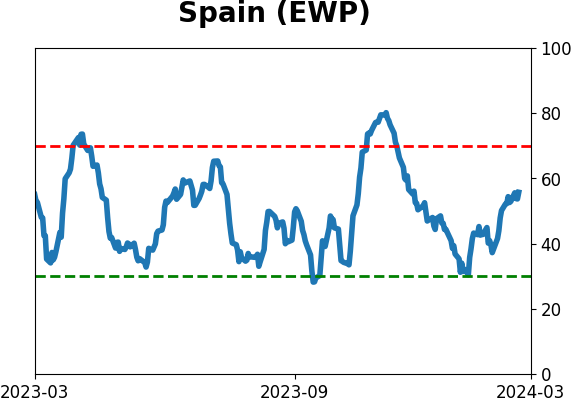
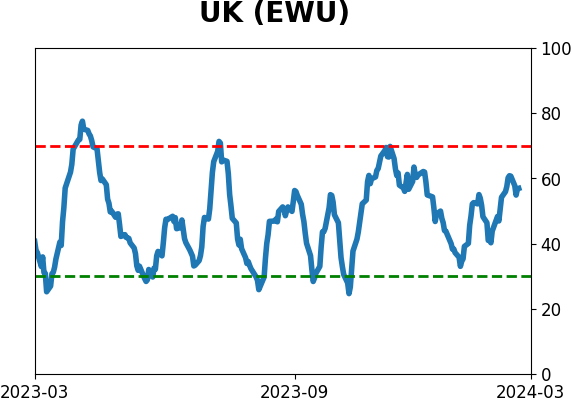
Country ETF's - 10-Day Moving Average
|
|
|
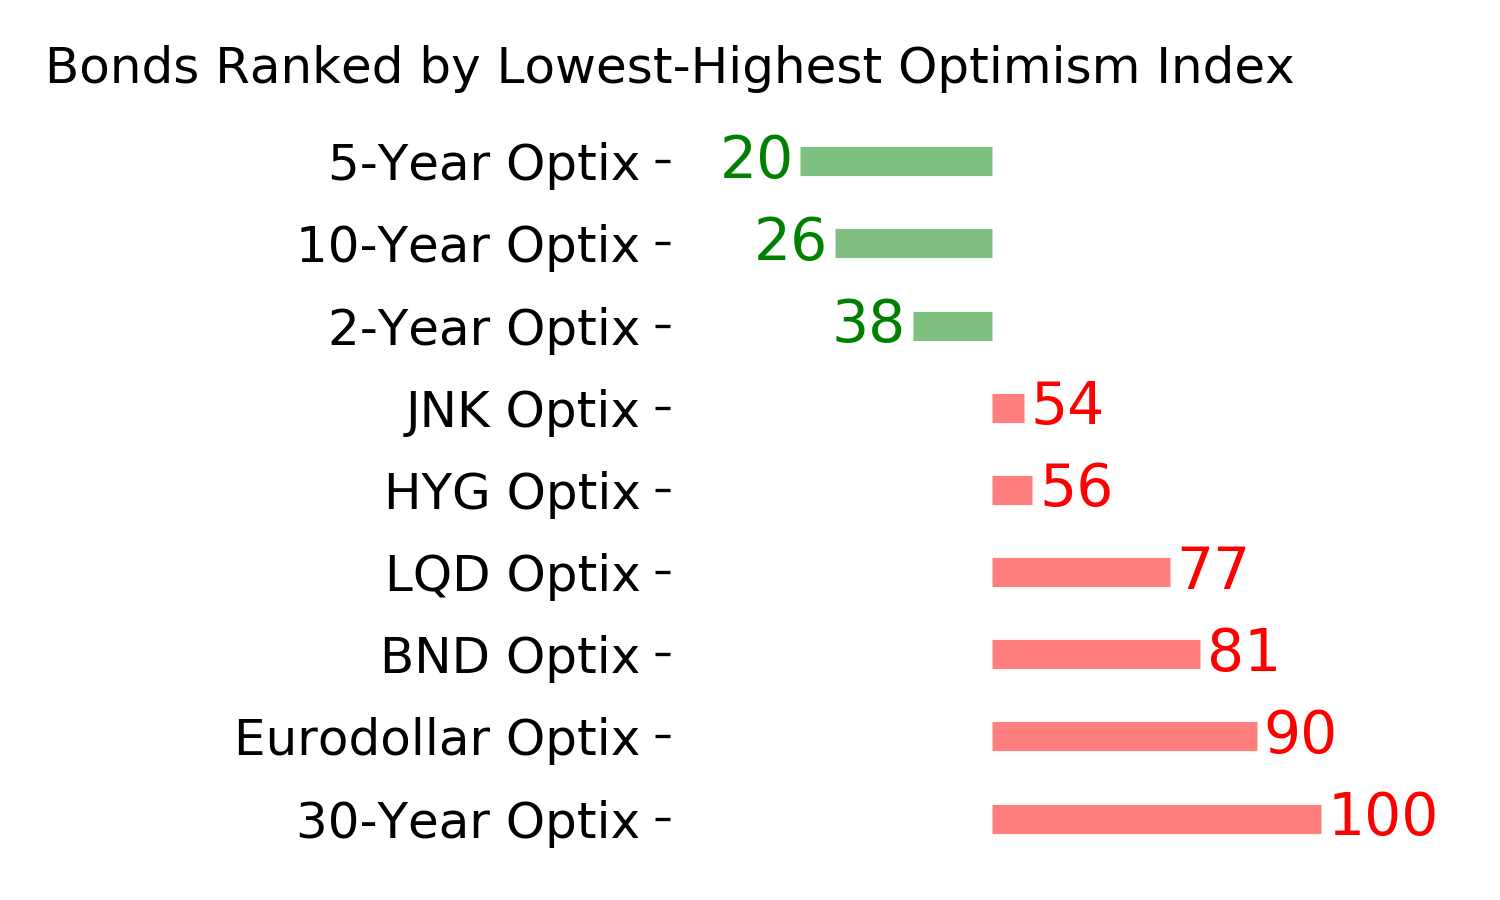
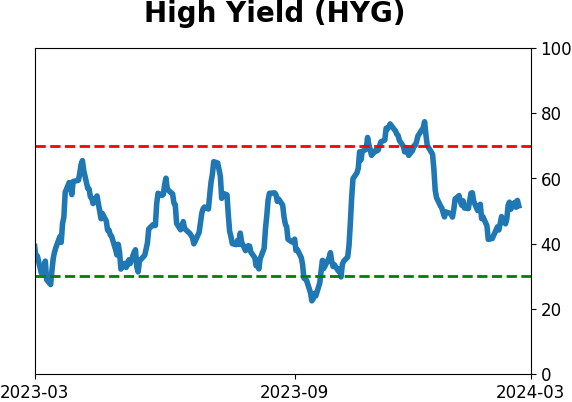
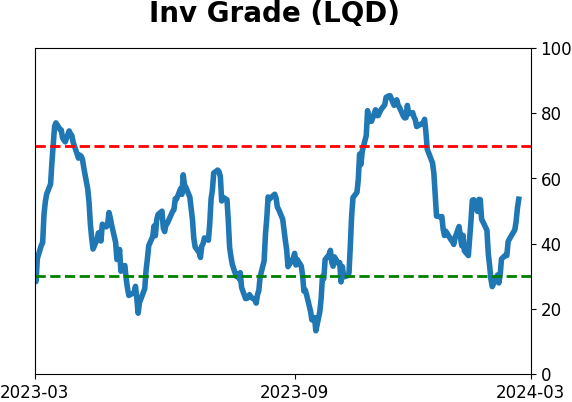
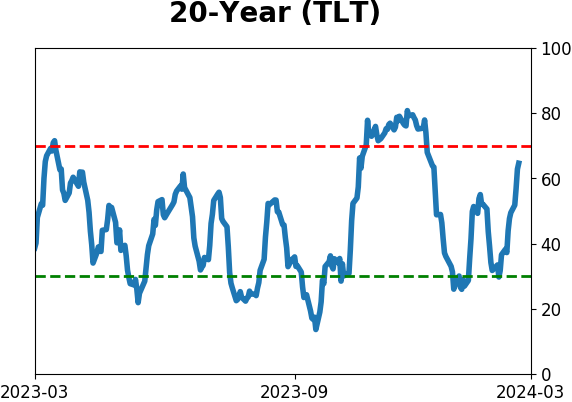
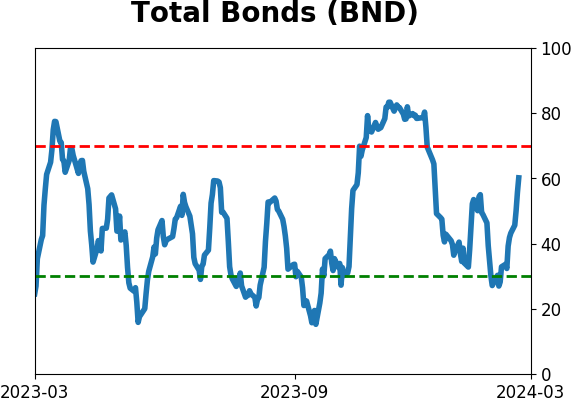
Bond ETF's - 10-Day Moving Average
|
|
|
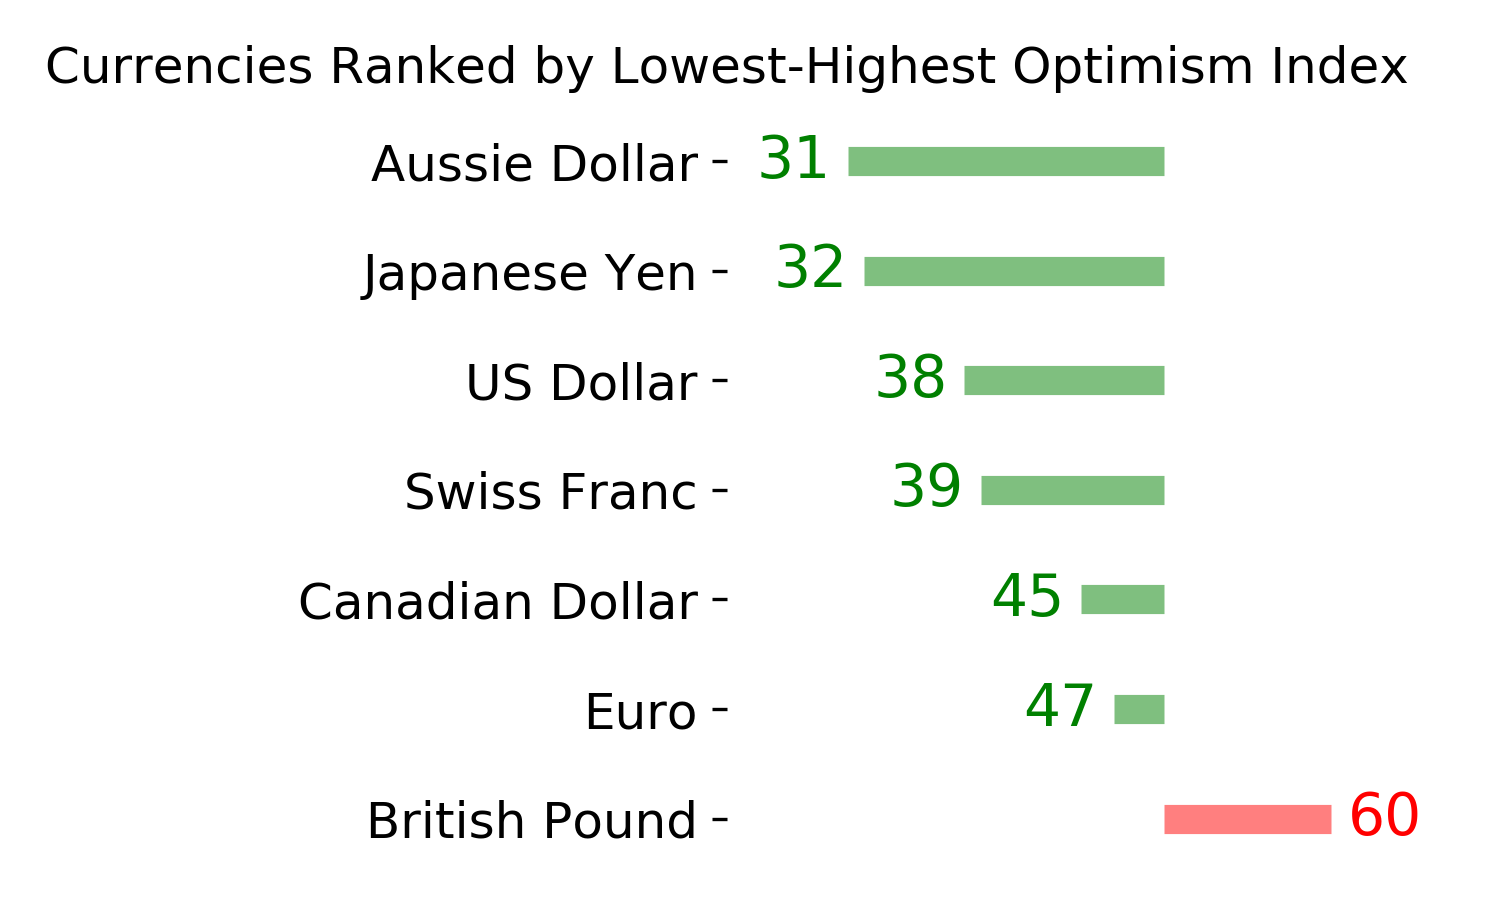
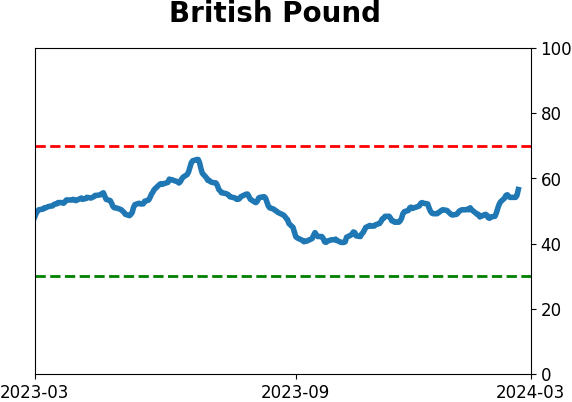
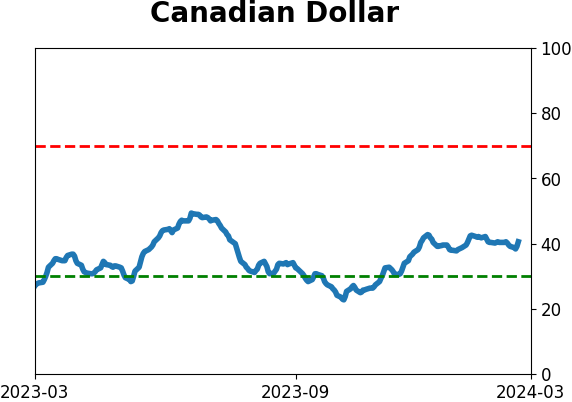
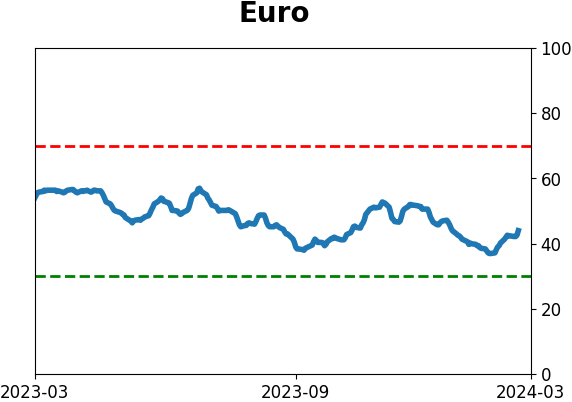
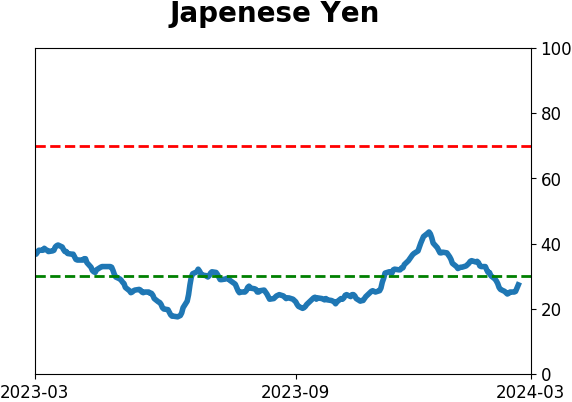
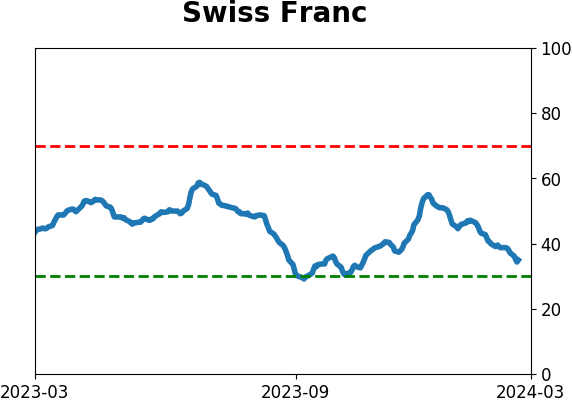
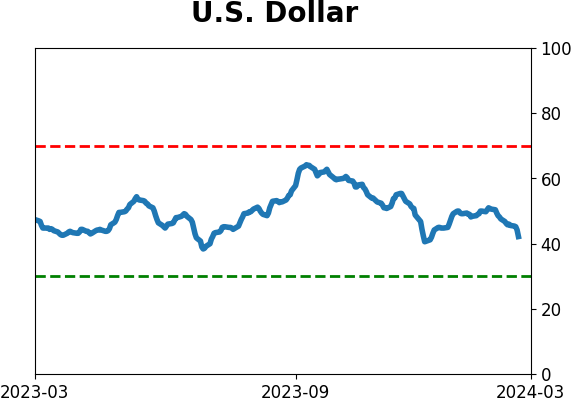
Currency ETF's - 5-Day Moving Average
|
|
|
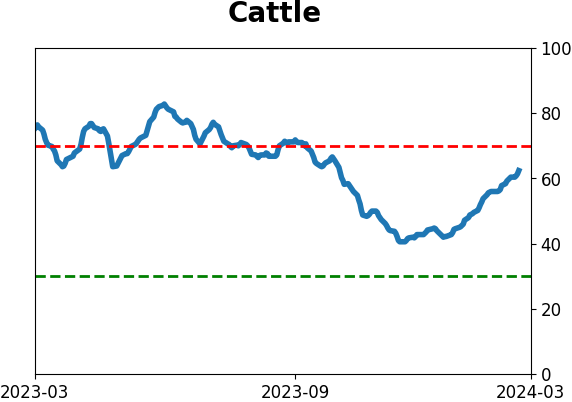
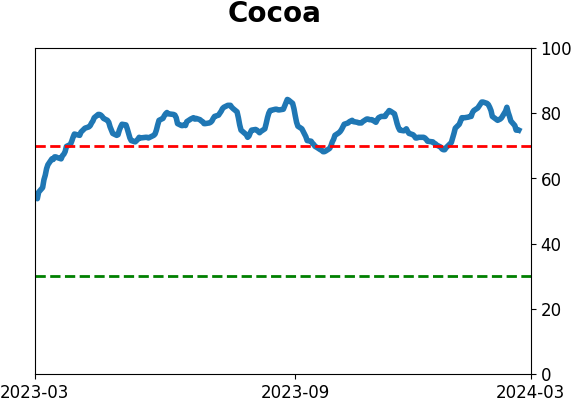
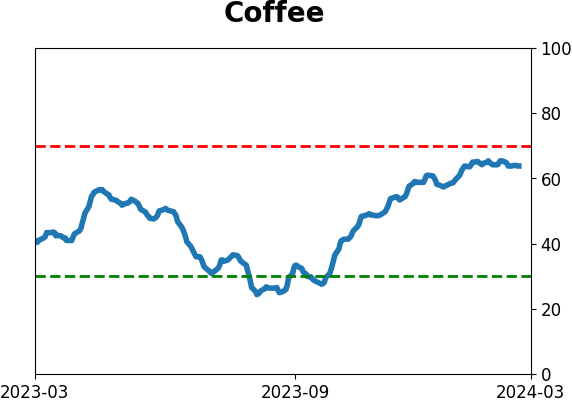
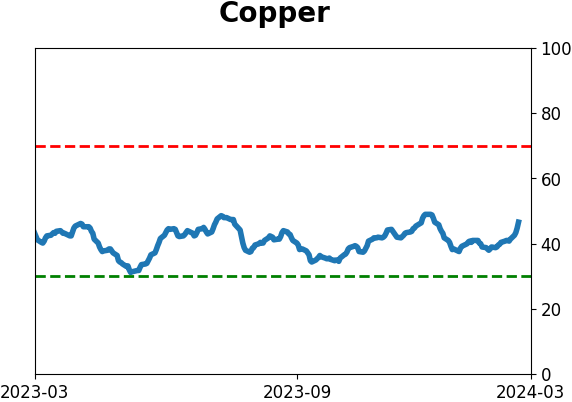
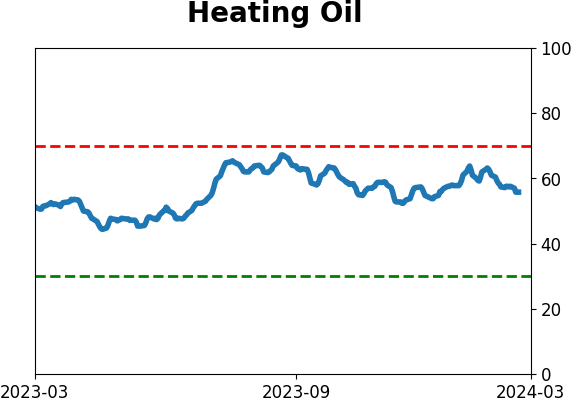
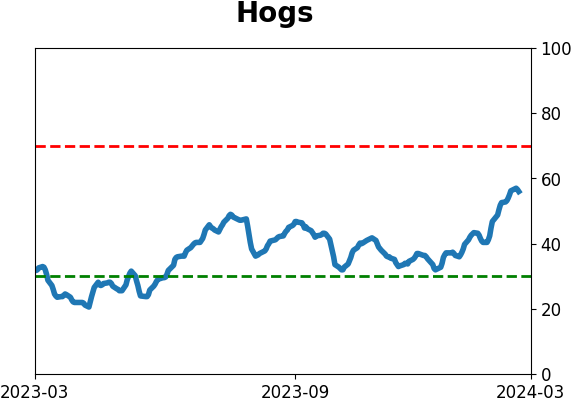
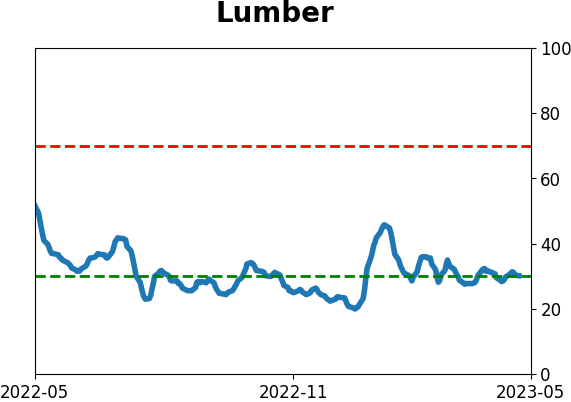
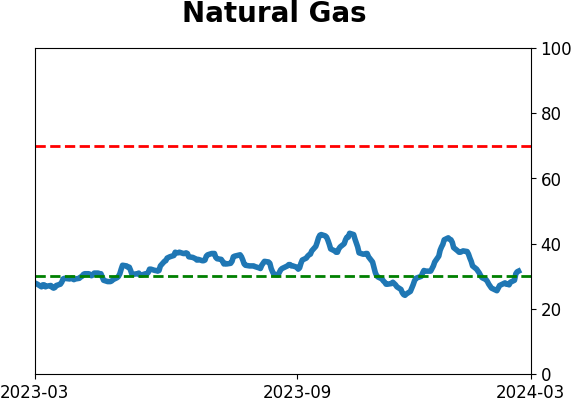
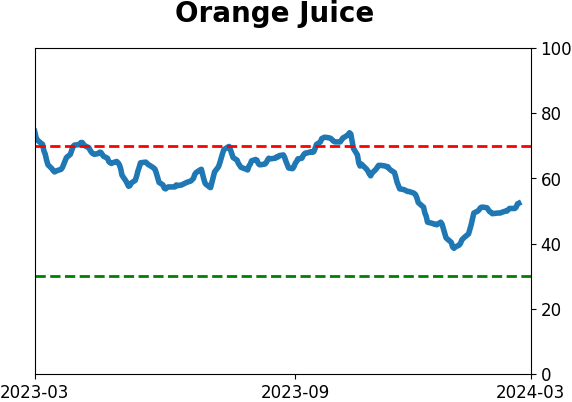
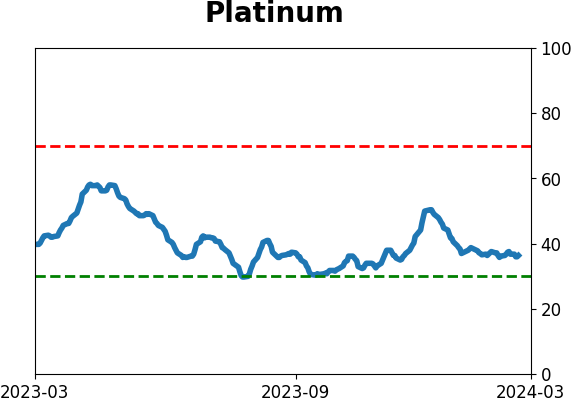
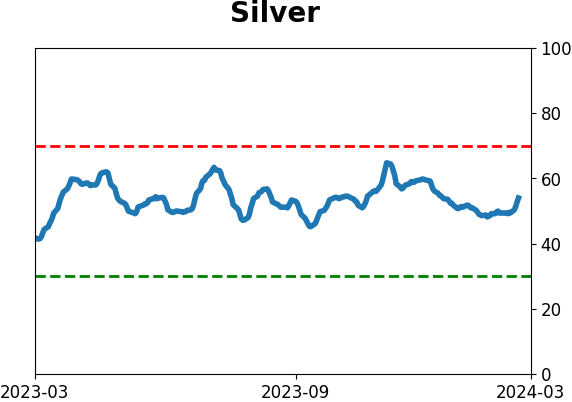
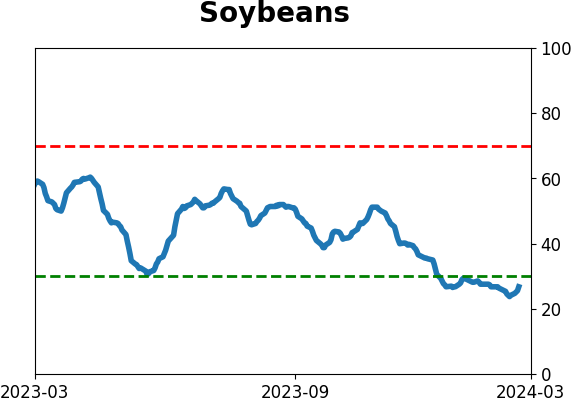
Commodity ETF's - 5-Day Moving Average
|
|